Article

Numerical Study on the Dynamics and Thermal Effects of Bubble Stable Cavitation in Focused Ultrasound Fields

1
Key Laboratory of Acoustics Research, College of Metrology and Measurement Engineering, China Jiliang University, Hangzhou 310018, China
2
College of Energy Environment and Safety Engineering, China Jiliang University, Hangzhou 310018, China
3
Key Laboratory of Fluid Power and Mechatronic Systems, Department of Mechanics, Zhejiang University, Hangzhou 310027, China
*
Author to whom correspondence should be addressed.
Processes 2025, 13(4), 951; https://doi.org/10.3390/pr13040951
Submission received: 27 February 2025 / Revised: 17 March 2025 / Accepted: 19 March 2025 / Published: 23 March 2025
(This article belongs to the Section Chemical Processes and Systems)

Abstract

:
In order to investigate the bubble dynamics and thermal effects of stable cavitation under different acoustic fields, this study computes and analyzes a series of DNS (Direct Numerical Simulation) approaches with the VOF (Volume of Fluid) method. The analysis focuses on bubble clusters with a radius of 1.5 μm and a void ratio of 10 6 , commonly encountered in ultrasound therapy. Firstly, the results show that the thermal effects of bubble cavitation are non-linearly positively correlated with the ultrasound amplitude and the volume changes of the bubbles. Meanwhile, acoustic scattering caused by ultrasound passing through the bubbles leads to acoustic pressure focusing, intensifying cavitation. Secondly, the thermal effect is most evident at an acoustic frequency of 250 kHz. When the ultrasound input frequency is higher than 250 kHz, acoustic attenuation occurs, while at frequencies lower than 250 kHz, the efficiency of bubbles’ energy absorption reduces. Finally, when the acoustic pressure amplitude on the bubble surface is above 210 kPa, the thermal effect of cavitation is significantly enhanced. However, the temperature rise in the flow domain gradually slows with time and eventually reaches a fixed rate. To sum up, to optimize and control the thermal effects of ultrasound therapy, the ultrasound frequency and amplitude must be carefully selected based on the targeted bubble cluster.

1. Introduction

Ultrasound cavitation refers to the process in which microscopic bubbles form, grow, and collapse in the ultrasound field [1]. When the liquid is subjected to an ultrasound field, the molecules within the liquid are pulled apart, forming cavities or bubbles [2]. These bubbles expand under negative pressure and then oscillate in response to the pressure fluctuation. The phenomenon of these bubbles’ expansion, contraction, oscillation, and eventual collapse is termed transient cavitation. In contrast, under relatively lower ultrasound amplitude, bubbles oscillate stably without collapse; this phenomenon is known as stable cavitation [3]. Unlike transient cavitation, bubbles that undergo stable cavitation demonstrate better stability, duration, and controllability.
Ultrasound cavitation has a broad range of applications in the medical field, including the use of micro-bubbles as carriers for targeted drug delivery [4] and gene transfection within living cells [5], the induction of apoptosis in targeted cells [6], and the application of tumor-targeted therapies through HIFU (high-intensity focused ultrasound) [7]. In the early understanding of HIFU ablation, the tissue damage is primarily caused by the thermal effect, which is induced by acoustic energy absorption in tissue [8]. However, recent research has revealed more complex mechanisms. Wu et al. [9] discovered that ultrasound contrast agents contribute significantly to temperature increases. Chavrier et al. [10] demonstrated that micro-bubble existence significantly influences both the magnitude and location of temperature changes in the focal region. Additionally, Coussios et al. [11] found that broadband noise from transient cavitation can lead to a notable rise in temperature. Due to the surface tension and the scattering effect of bubbles, the existence of micro-bubbles can greatly increase the heating rate of tissues [12,13]. However, excessive micro-bubble accumulation can also result in excessive tissue damage [14]. Therefore, it is essential to ensure that the energy generated by cavitation is sufficient to achieve therapeutic goals while minimizing harm to surrounding tissues [15]. In this circumstance, a better understanding of the thermal effects caused by ultrasound cavitation is required.
The type and intensity of ultrasound cavitation are influenced by factors such as ultrasound parameters and fluid viscosity, which subsequently influence the thermal effects of cavitation. During transient cavitation, bubble collapse releases substantial internal energy, resulting in a sudden temperature rise. Spectral and isotope measurements have shown that bubble collapse in various liquids can produce temperatures of approximately 5000 K [16], with effective liquid temperatures reaching up to 1200 K [17,18]. In contrast, during stable cavitation, the stable oscillation of bubbles generates internal energy, leading to a periodical increase in the liquid temperature. Various factors modulate the extent of temperature rise during stable cavitation, and the stable cavitation state can persist for several seconds. Compared to transient cavitation, stable cavitation exhibits more pronounced periodicity and a relatively slower rate of temperature increase. Meanwhile, both forms of cavitation can occur under the influence of ultrasound. To minimize the risk of excessive tissue damage, the more controllable stable cavitation is preferred. Therefore, in fluids simulating the viscosity of human tissue membranes, we focus on an intensive study of stable cavitation.
The experimental method is one of the primary methodologies used to investigate ultrasound cavitation. Özsoy Ç et al. [19] developed a novel visualization monitoring method through experimental studies, which effectively tracked the occurrence of cavitation and temperature rise. Wu et al. [20] investigated the near-wall field of low-frequency ultrasound; it was discovered that the bubble’s surface tension is a key factor in enhancing the acoustic cavitation efficiency. Wang et al. [21] compared two types of ultrasound cavitation and investigated the influence of cavitation on the acoustic propagation path. Their experiments showed that transient cavitation leads to more intense and focused acoustic propagation, as well as a higher temperature rise.
In recent years, developments in CFD (computational fluid dynamics) have established numerical simulations as a crucial tool for studying cavitation. Max et al. [22] simulated laser-induced cavitation bubbles using the FVM (Finite Volume Method), discussing the relationship between spherical stability and mesh quality, and validated the feasibility of CFD cavitation simulations. Meanwhile, Osterman et al. [23] used the VOF (Volume of Fluid) method to calculate the effect of the distance between ultrasound bubbles and the moving solid boundary on the maximum temperature and pressure of the bubbles under ultrasonic influence. They found that as the distance between the bubble and the solid boundary increased, the maximum temperature rose while the maximum pressure decreased. Ma et al. [24] used the CLSVOF method to capture continuous geometrical media and studied the temporal evolution of bubble oscillations. They analyzed the impact of the sound wave propagation direction and attenuation coefficient on bubble behavior. Tian et al. [25] conducted numerical simulations to study the interaction of multi−cycle cavitation bubbles with nearby wall surfaces at different distances. By combining the VOF method with a compressible solver, they found that bubble behavior, shockwave propagation, and liquid jetting types are closely related to the distance between the bubbles and the wall. In the studies above, both the experiments and simulations primarily used water as the medium and focused mainly on transient cavitation. However, there is growing research potential in studying stable cavitation of bubbles under ultrasound.
This study used the FVM to perform numerical simulations of bubble clusters under ultrasound excitation. The research focused on investigating the bubble dynamics and the thermodynamic properties. Firstly, a compressible numerical simulation method was developed. Based on this method, the changes in the bubble volume and temperature rise rate under different ultrasound conditions were monitored. Finally, the data were analyzed to determine the propagation characteristics of ultrasound, the motion patterns of bubbles, and the thermodynamic laws.

2. Numerical Simulation Method and Bubble Model

In this study, the finite volume method was employed, and the VOF (Volume of Fluid) method was utilized to capture the fluid interface. Factors such as the compressibility, viscosity, surface tension, and thermodynamic effects were considered. The following fundamental assumptions are introduced for the simulation: The fluids are treated as compressible Newtonian fluids; the liquid and gas phases are immiscible; and energy exchange between the flow domain and the external environment is considered.

2.1. Governing Equation

In the presence of gravity, the N−S equation for a compressible multiphase system is expressed as follows:
ρ t + · ( ρ U ) = 0
ρ t + · ( ρ U ) = ρ U t + · ( ρ U U ) = p + · τ + F
ρ T t + · ( ρ U T ) Δ α e f f T = α 1 c v , 1 + α 2 c v , 2 p K t + ( ρ U K ) + · ( U p )
with ρ representing the fluid density, U the fluid velocity, p the fluid pressure, τ the shear stress, and F the surface tension force. α 1 and α 2 are the weighted volume fractions of the liquid phase and gas phase, with the sum of the two fractions equal to 1.
α e f f is the effective thermal diffusivity given by
α e f f = α 1 k 1 c v , 1 + α 2 k 2 c v , 2
where c v denotes the specific heat capacity at constant volume, and k denotes the thermal conductivity.
Since the cavitation is a multi−phase problem, the VOF method is employed. By tracking this phase fraction, the VOF method captures the fluid interface, and the VOF equation is expressed as follows:
ρ m = α 1 ρ 1 + α 2 ρ 2
μ m = α 1 μ 1 + α 2 μ 2
where ρ m is the density of the mixed fluid, and μ m is the viscosity of the mixed fluid. The physical properties of the mixture are calculated as a weighted average of the properties of the two phases.

2.2. Equation of State

For the compressible liquid and gas phases, their densities ρ 1 and ρ 2 depend on each phase’s pressure P and temperature T, respectively. The liquid density ρ 1 is determined using the Tait equation, which is computed as
ρ 1 = ρ 0 P + B A + B 1 m
and the liquid compressibility ψ 1 is given by
ψ 1 = ρ 0 m ( A + B ) p + B A + B 1 m 1
where p is the pressure of the liquid phase, ρ 0 is the initial density of the liquid phase, A and B are temperature−dependent parameters, and m is a fitting parameter derived from pressure and volume data within a specified temperature range, with A = 101,325 Pa, B = 0.331 GPa, and m = 7.1.
For the gas density ρ 2 , the Peng–Robinson equation of state is used
ρ 2 = 1 z R T P
where z is dependent on both pressure P and temperature T.

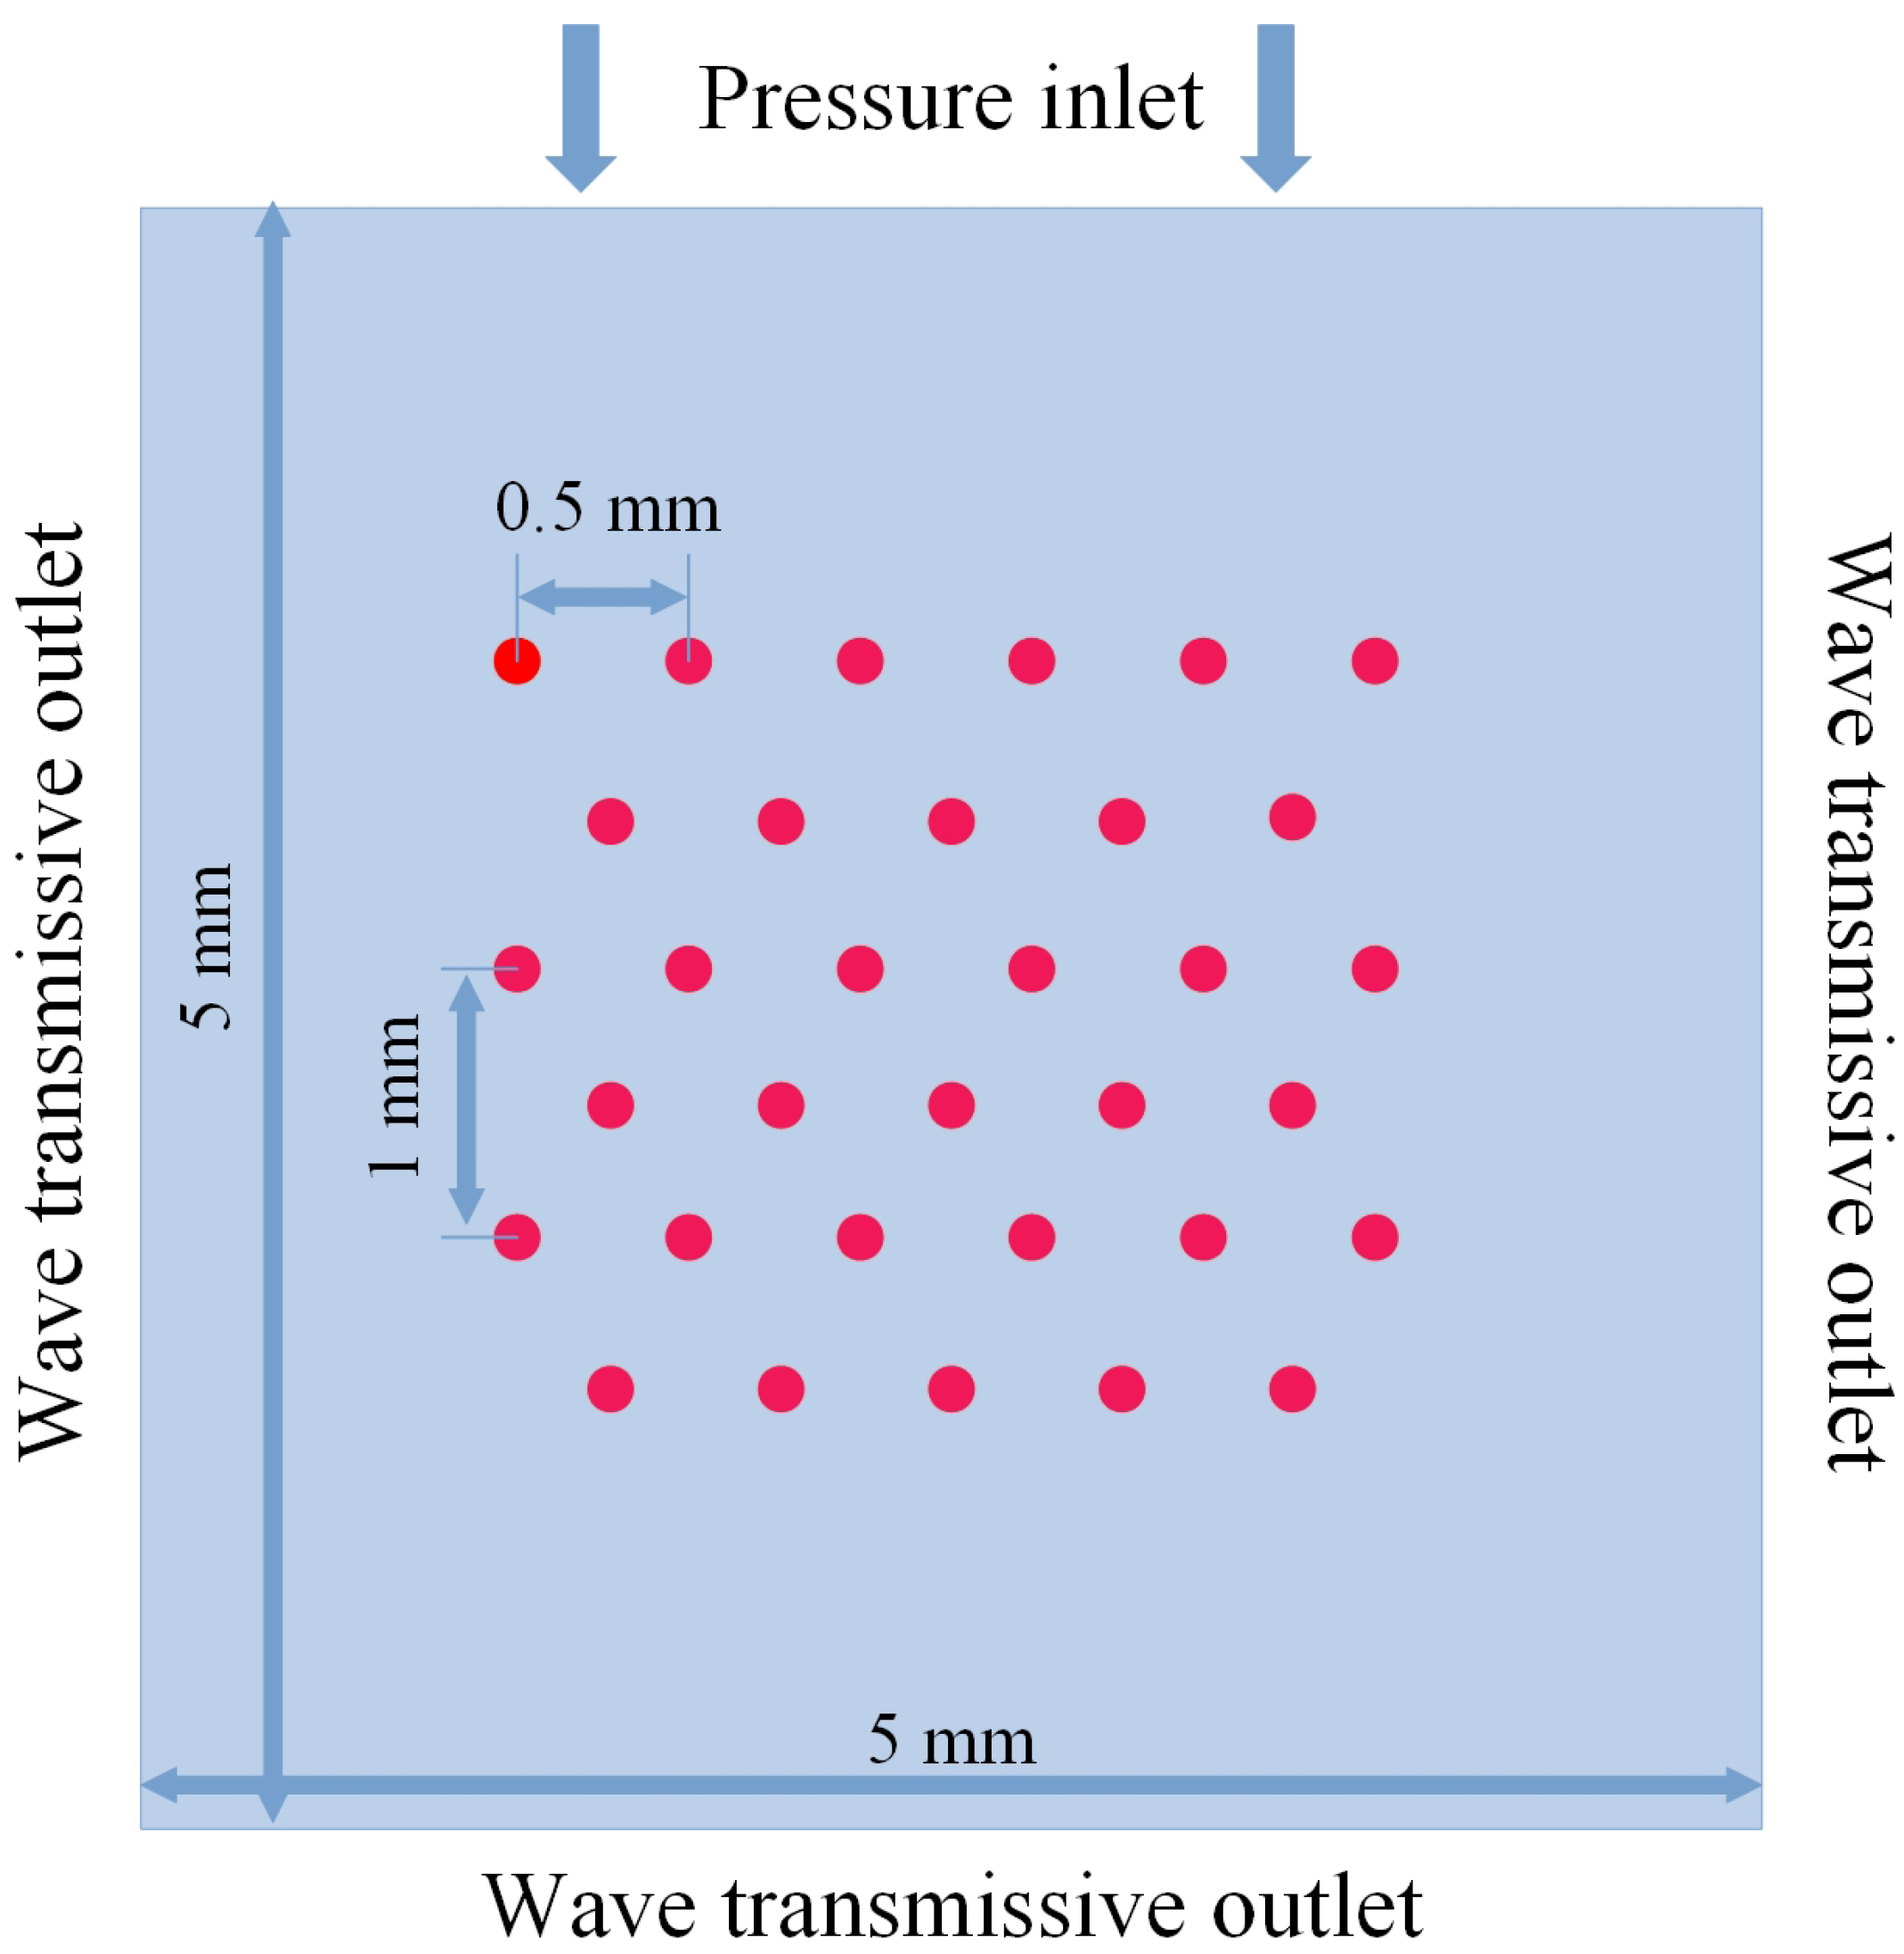
2.3. Simulation Setup

In this study, a three-dimensional single bubble model and a two-dimensional bubble cluster model were constructed, both employing orthogonal uniform grids. The domain size was set to be an order of magnitude larger than 5 wavelengths of the ultrasound. This configuration allows sound waves from multiple ultrasound cycles to propagate simultaneously within the domain, which is essential for accurately capturing the dynamics of the ultrasound field during the simulation. Additionally, considering computational efficiency and accuracy, a successive grid refinement strategy was applied to the square region surrounding the bubble. The refined grid around the bubble is depicted in Figure 1. It can be seen that the initial bubble radius is represented by approximately 20 grid cells, which meets the grid independence requirement, as shown in Figure 2. It can be observed that when the number of grid cells occupied by the bubble radius exceeds 18, the grid does not influence the simulation results.
The cell number of the mesh and the corresponding time step size are summarized in Table 1. For an ultrasound frequency of 100 kHz, the computational time step is set to 10,000 steps within a single ultrasound cycle. This ensures compliance with the CFL criterion and satisfies the requirements for sound wave transmission, as well as the step size requirements outlined in studies such as those by Max et al. [22].

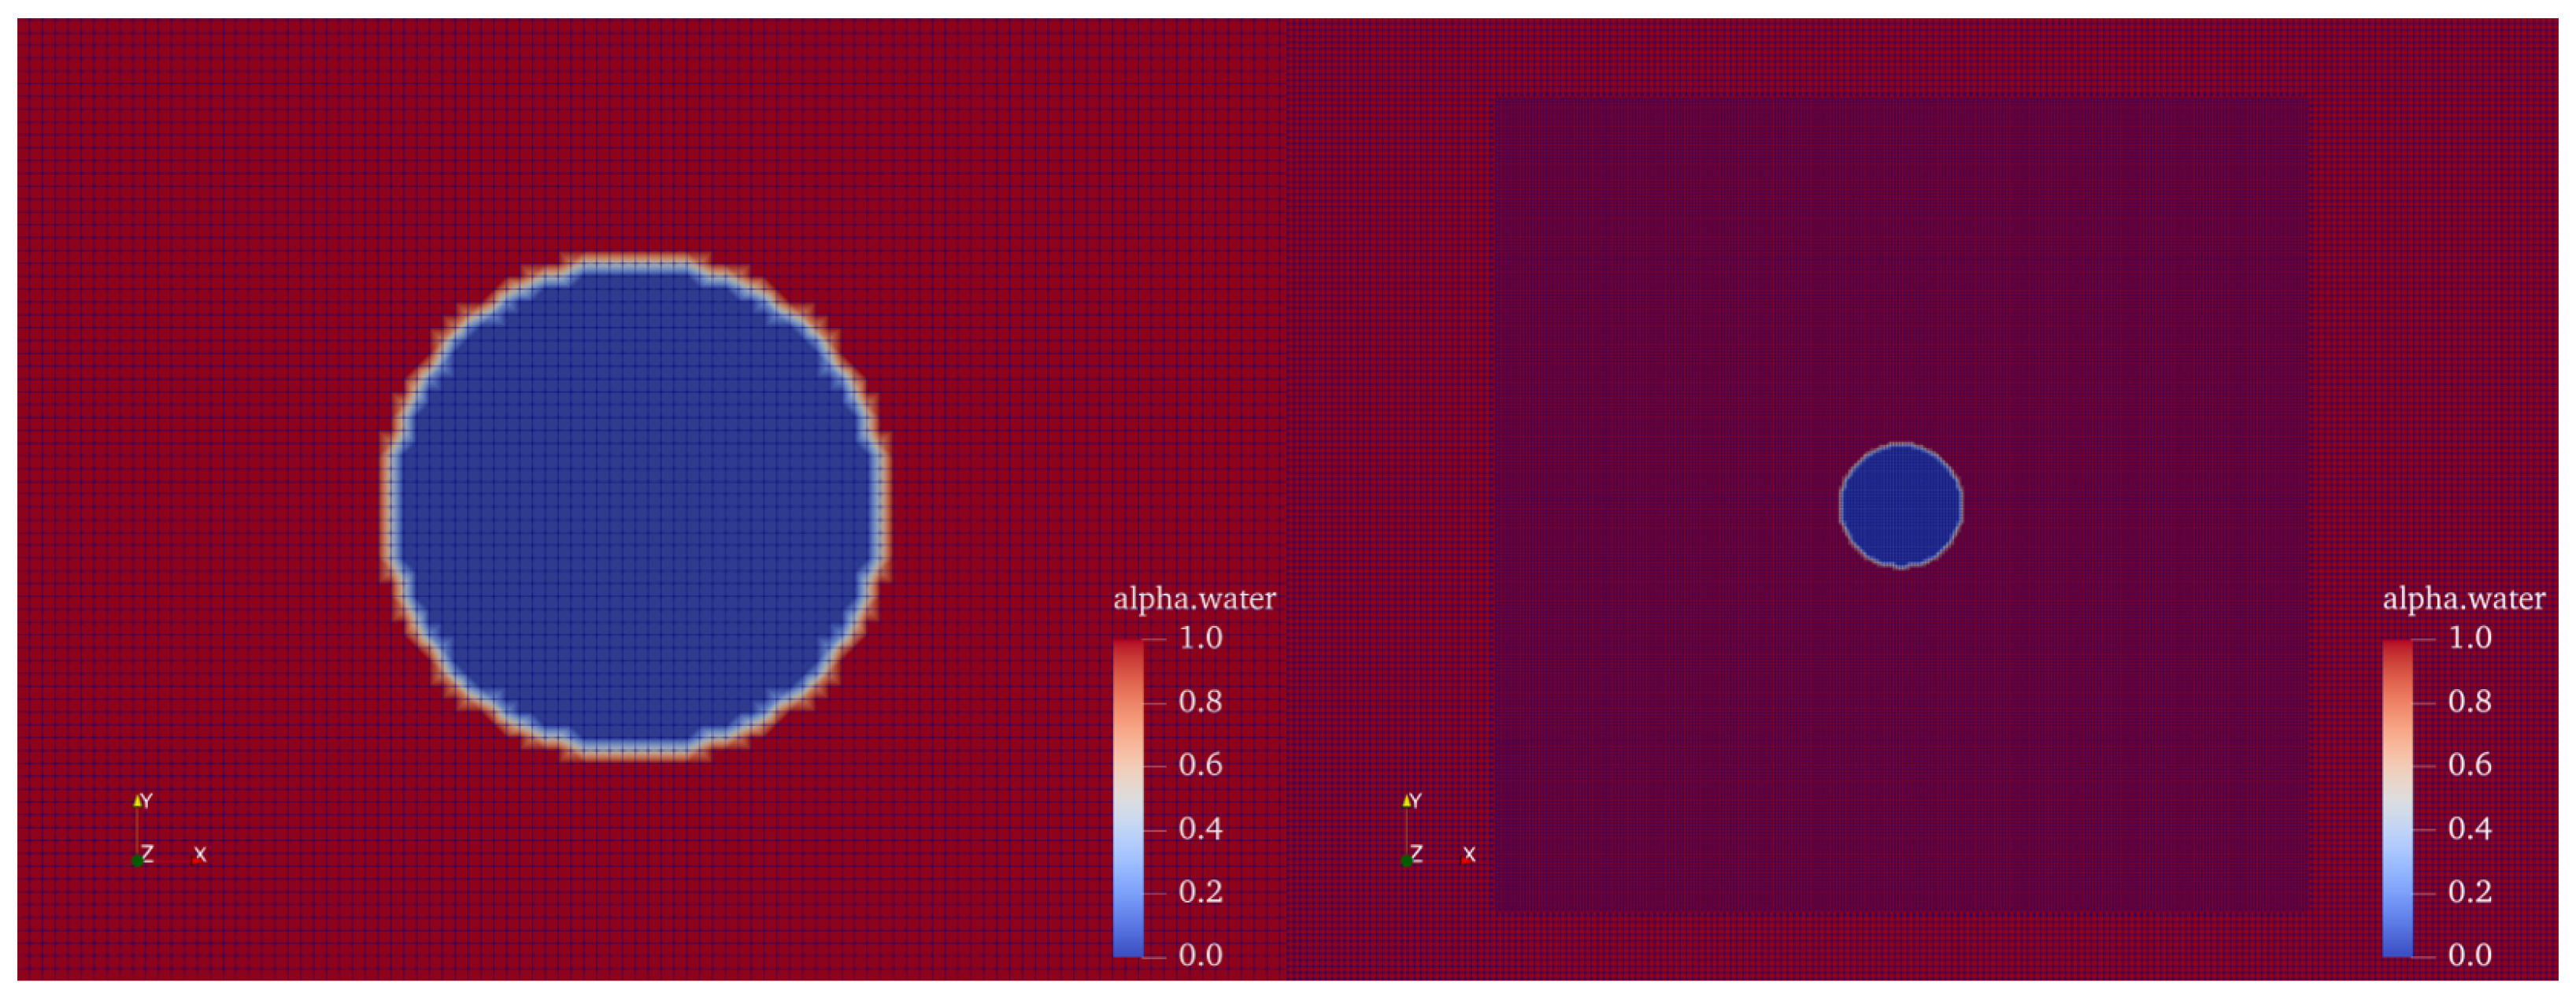
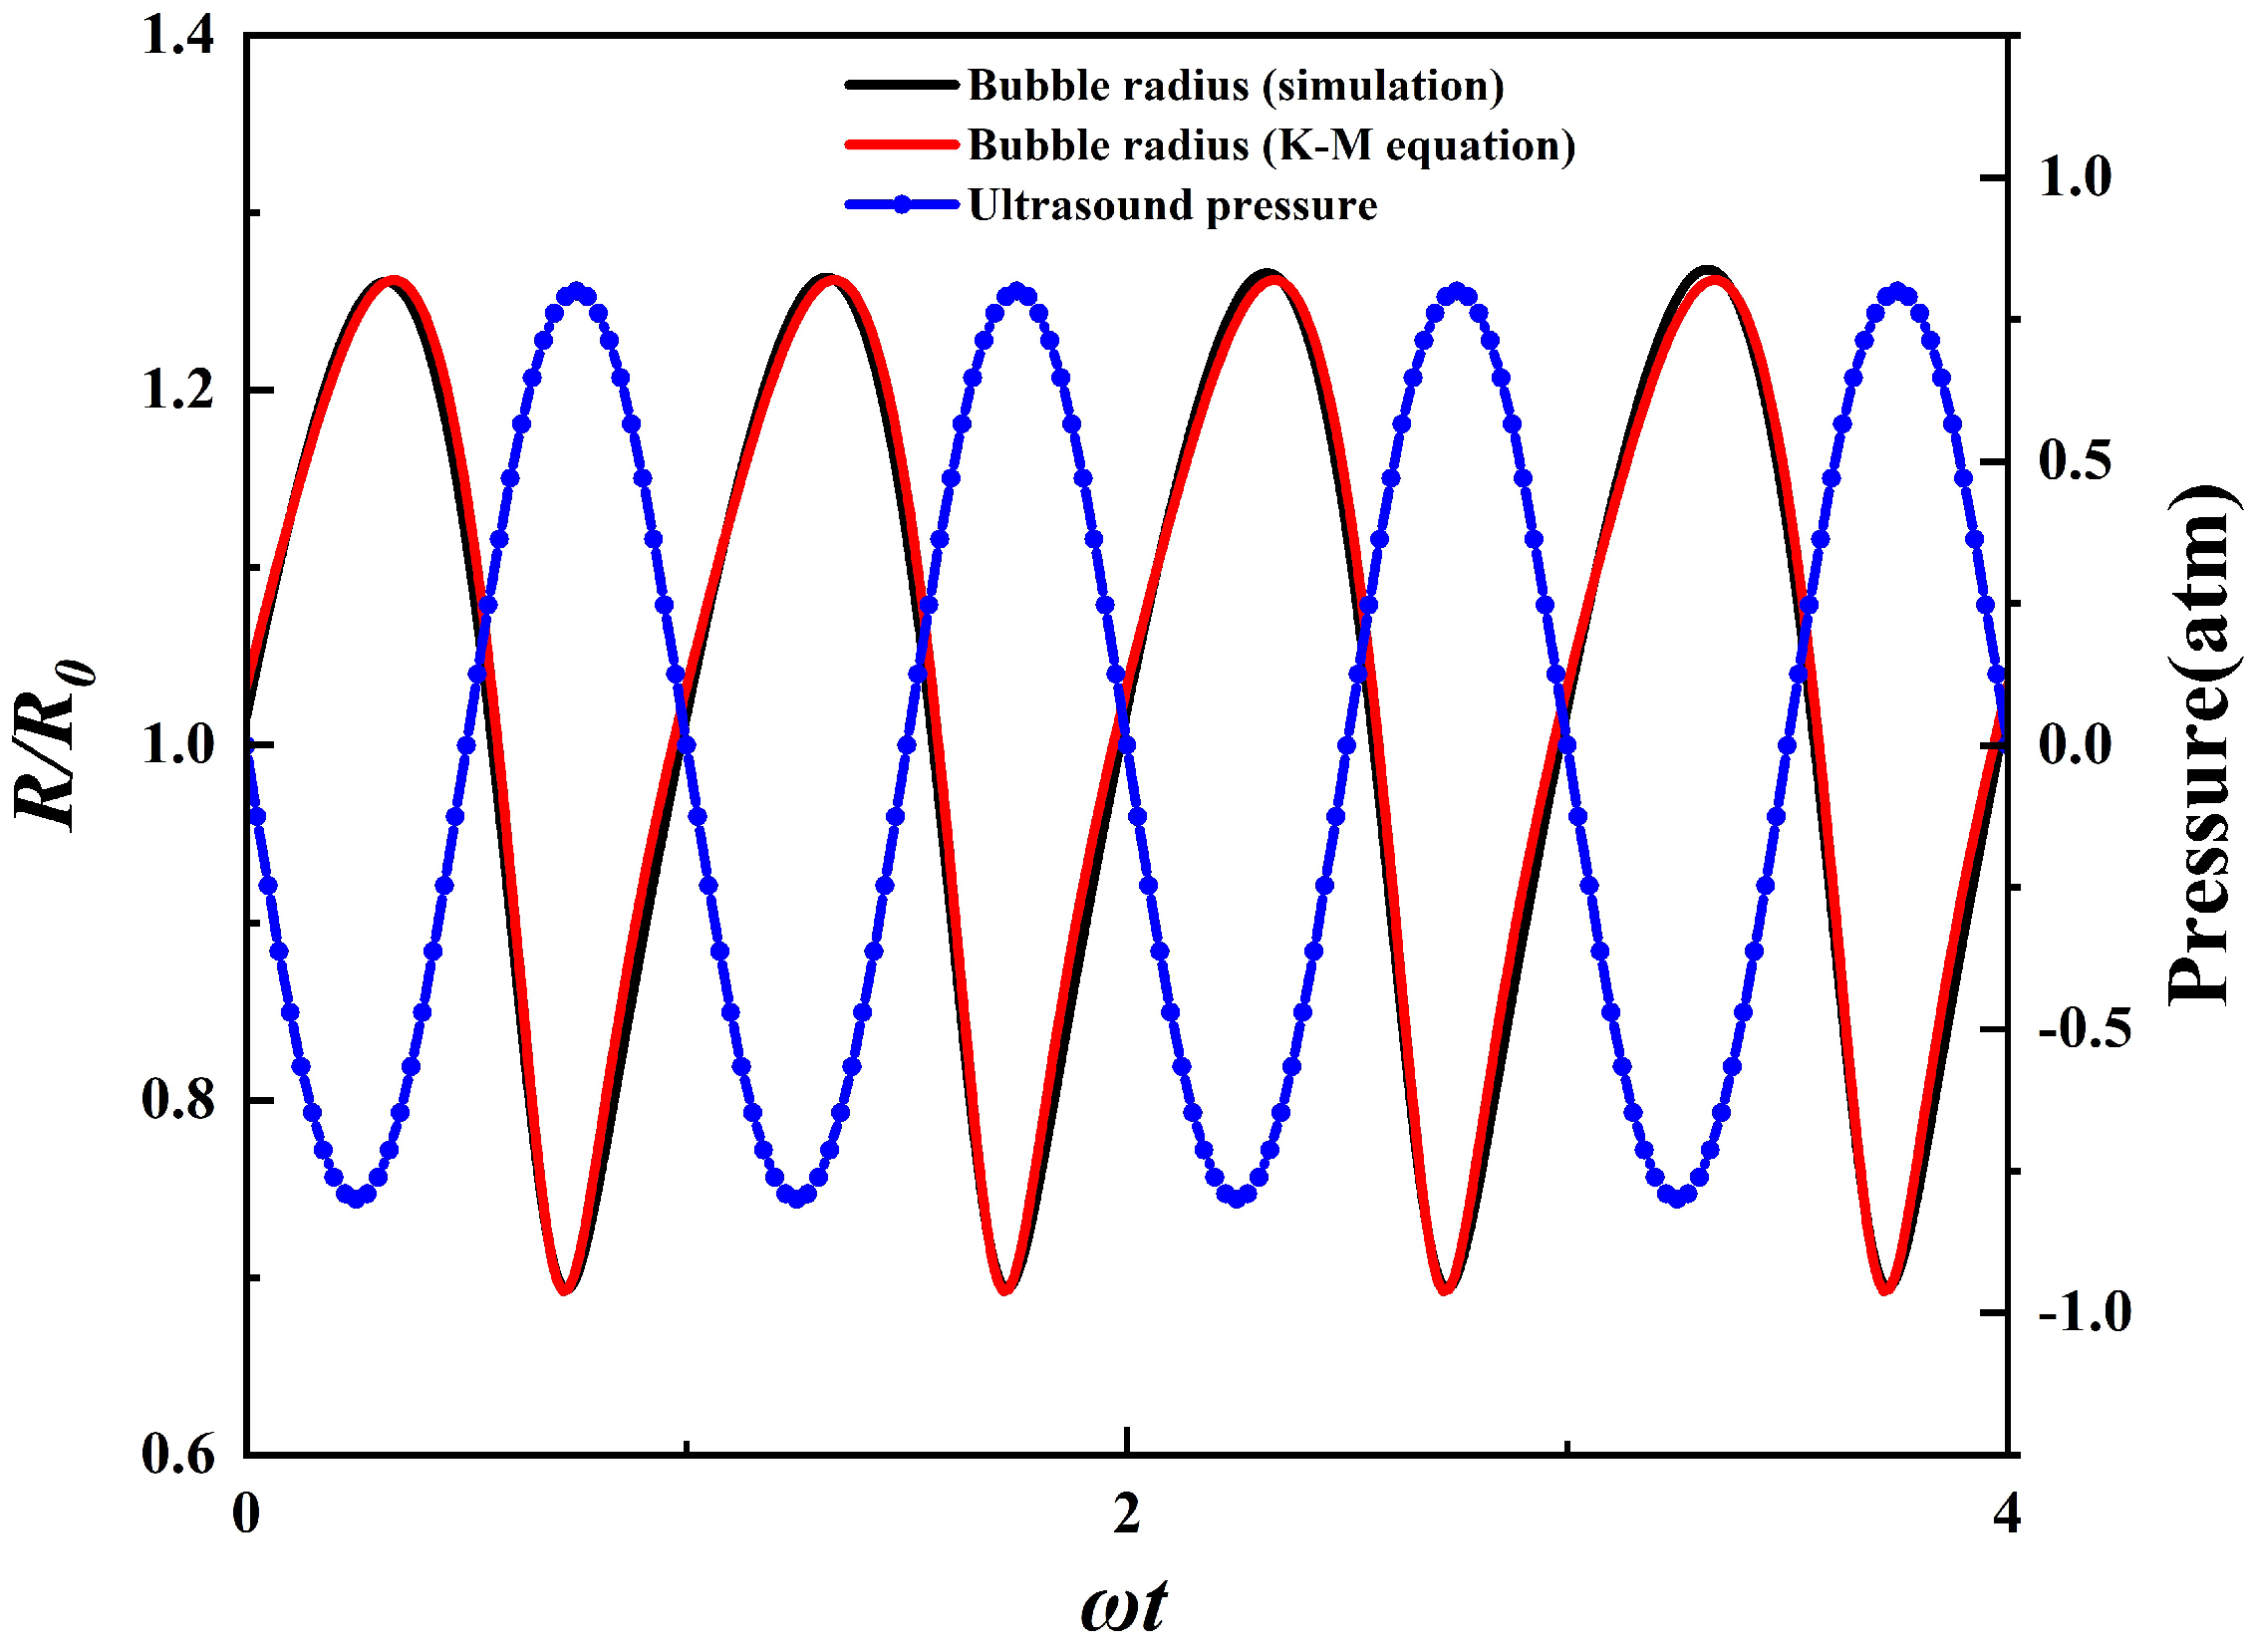
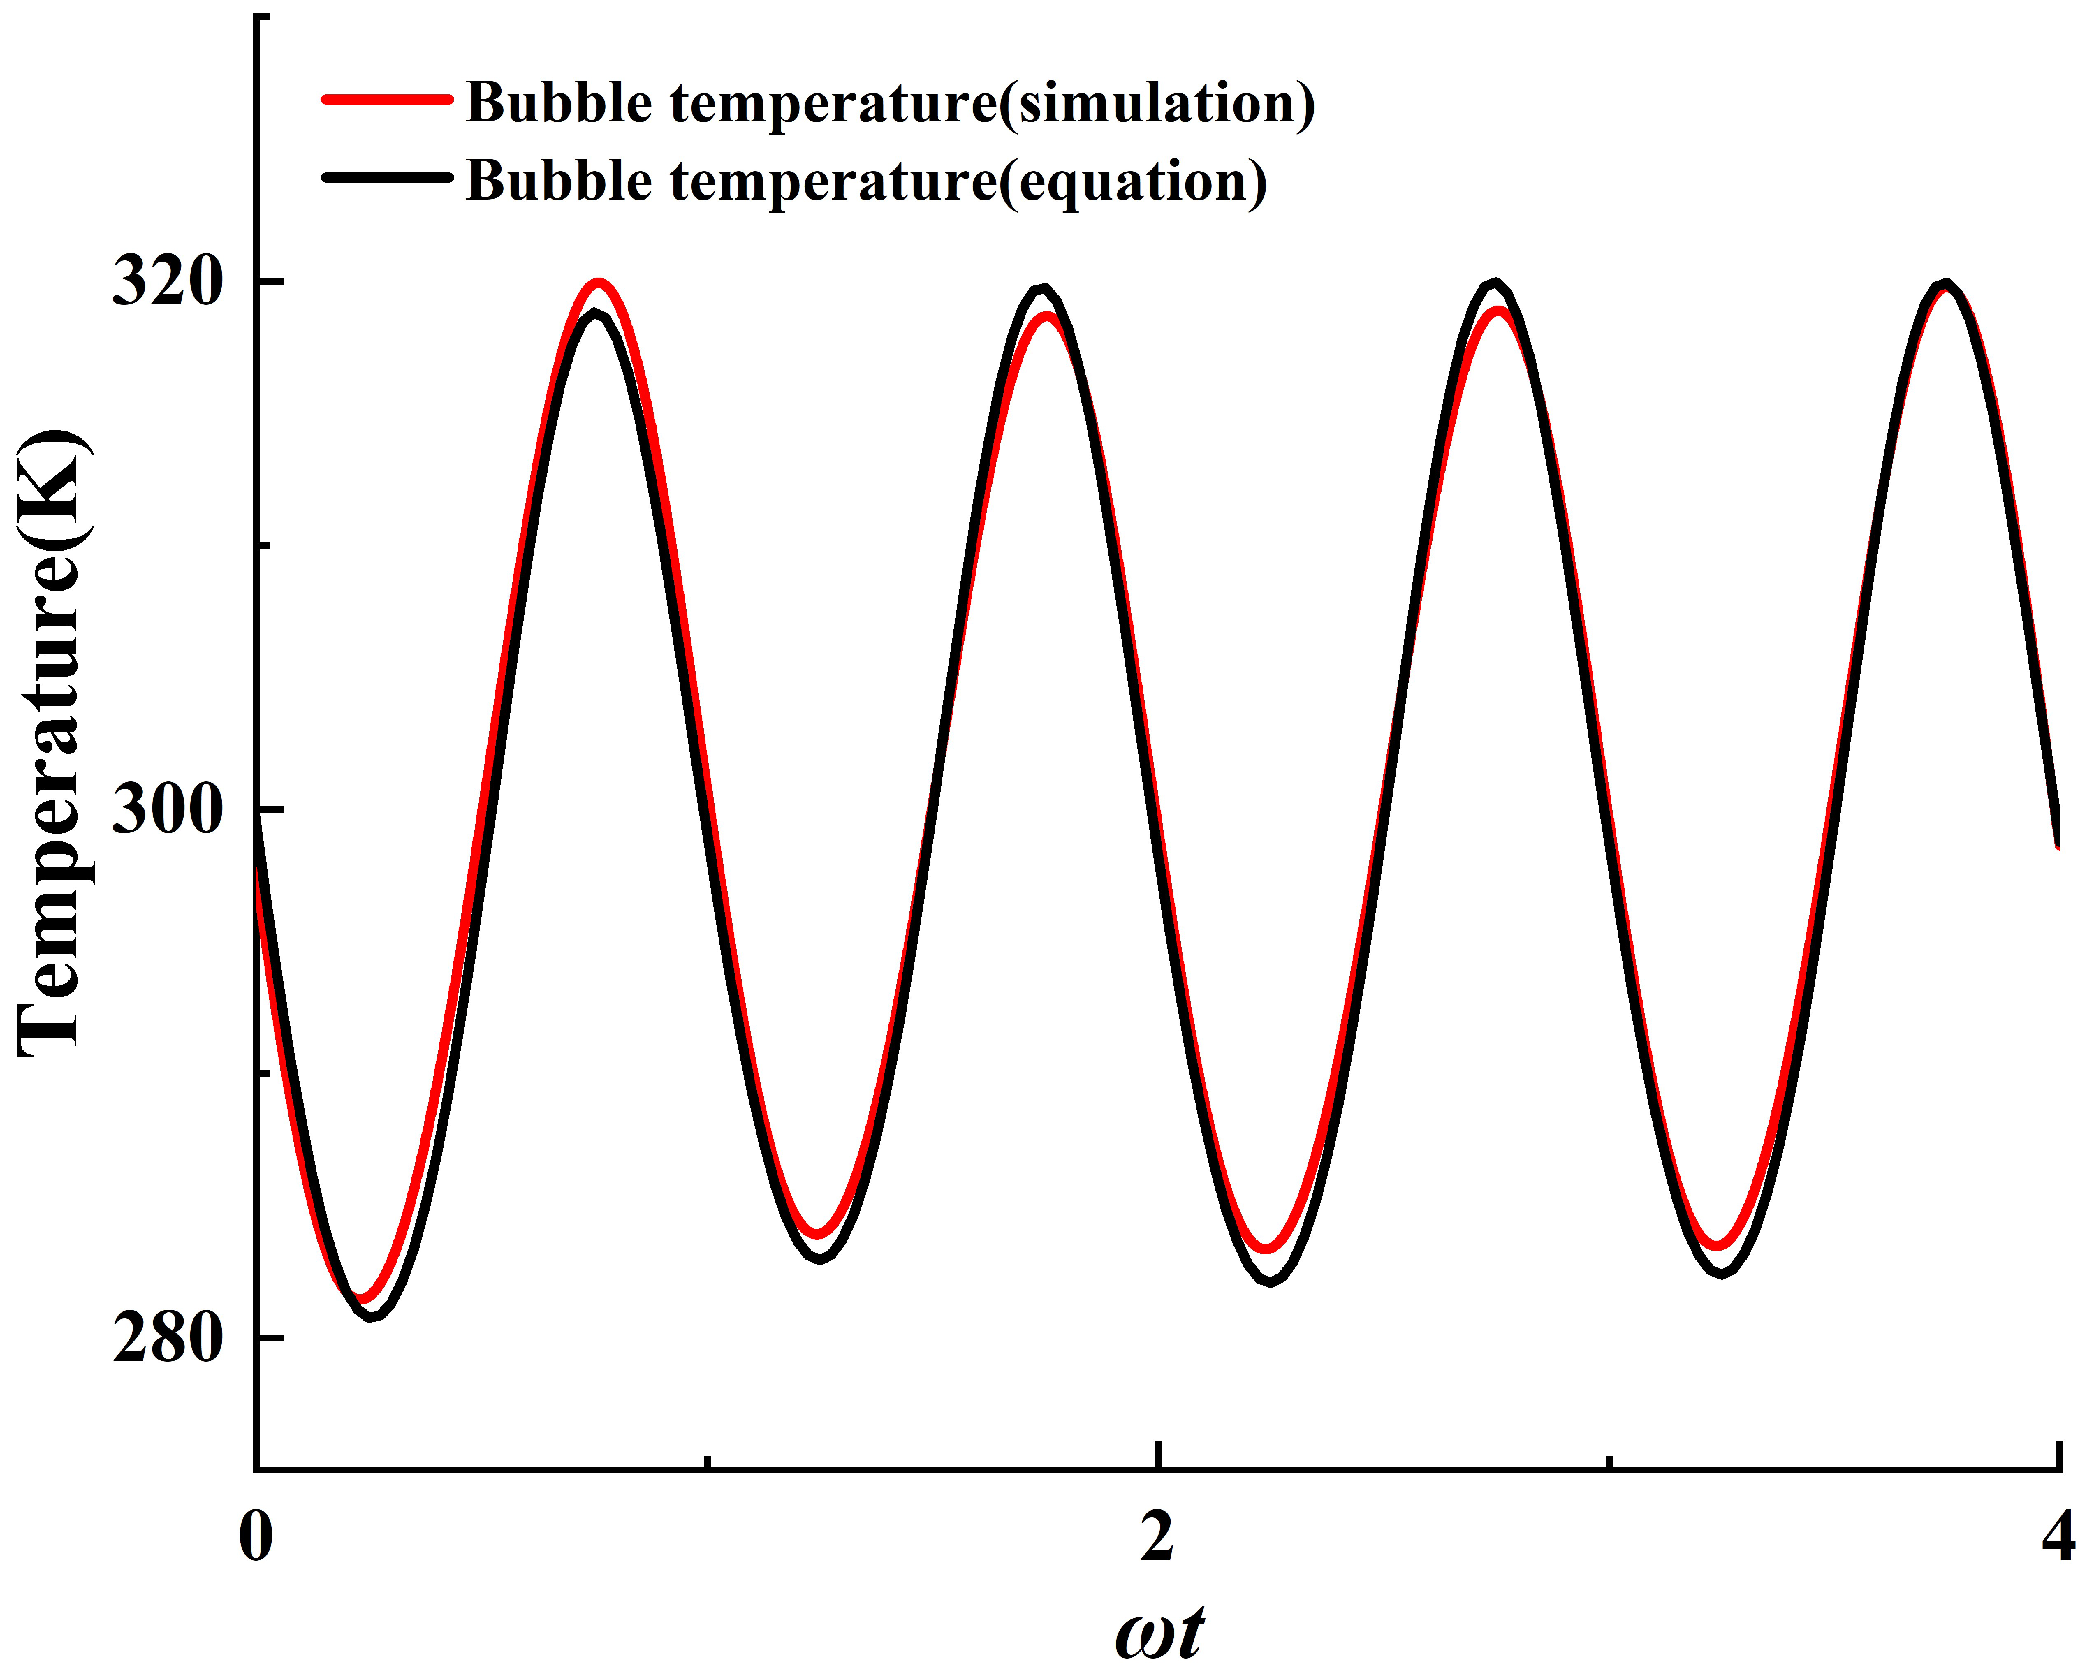
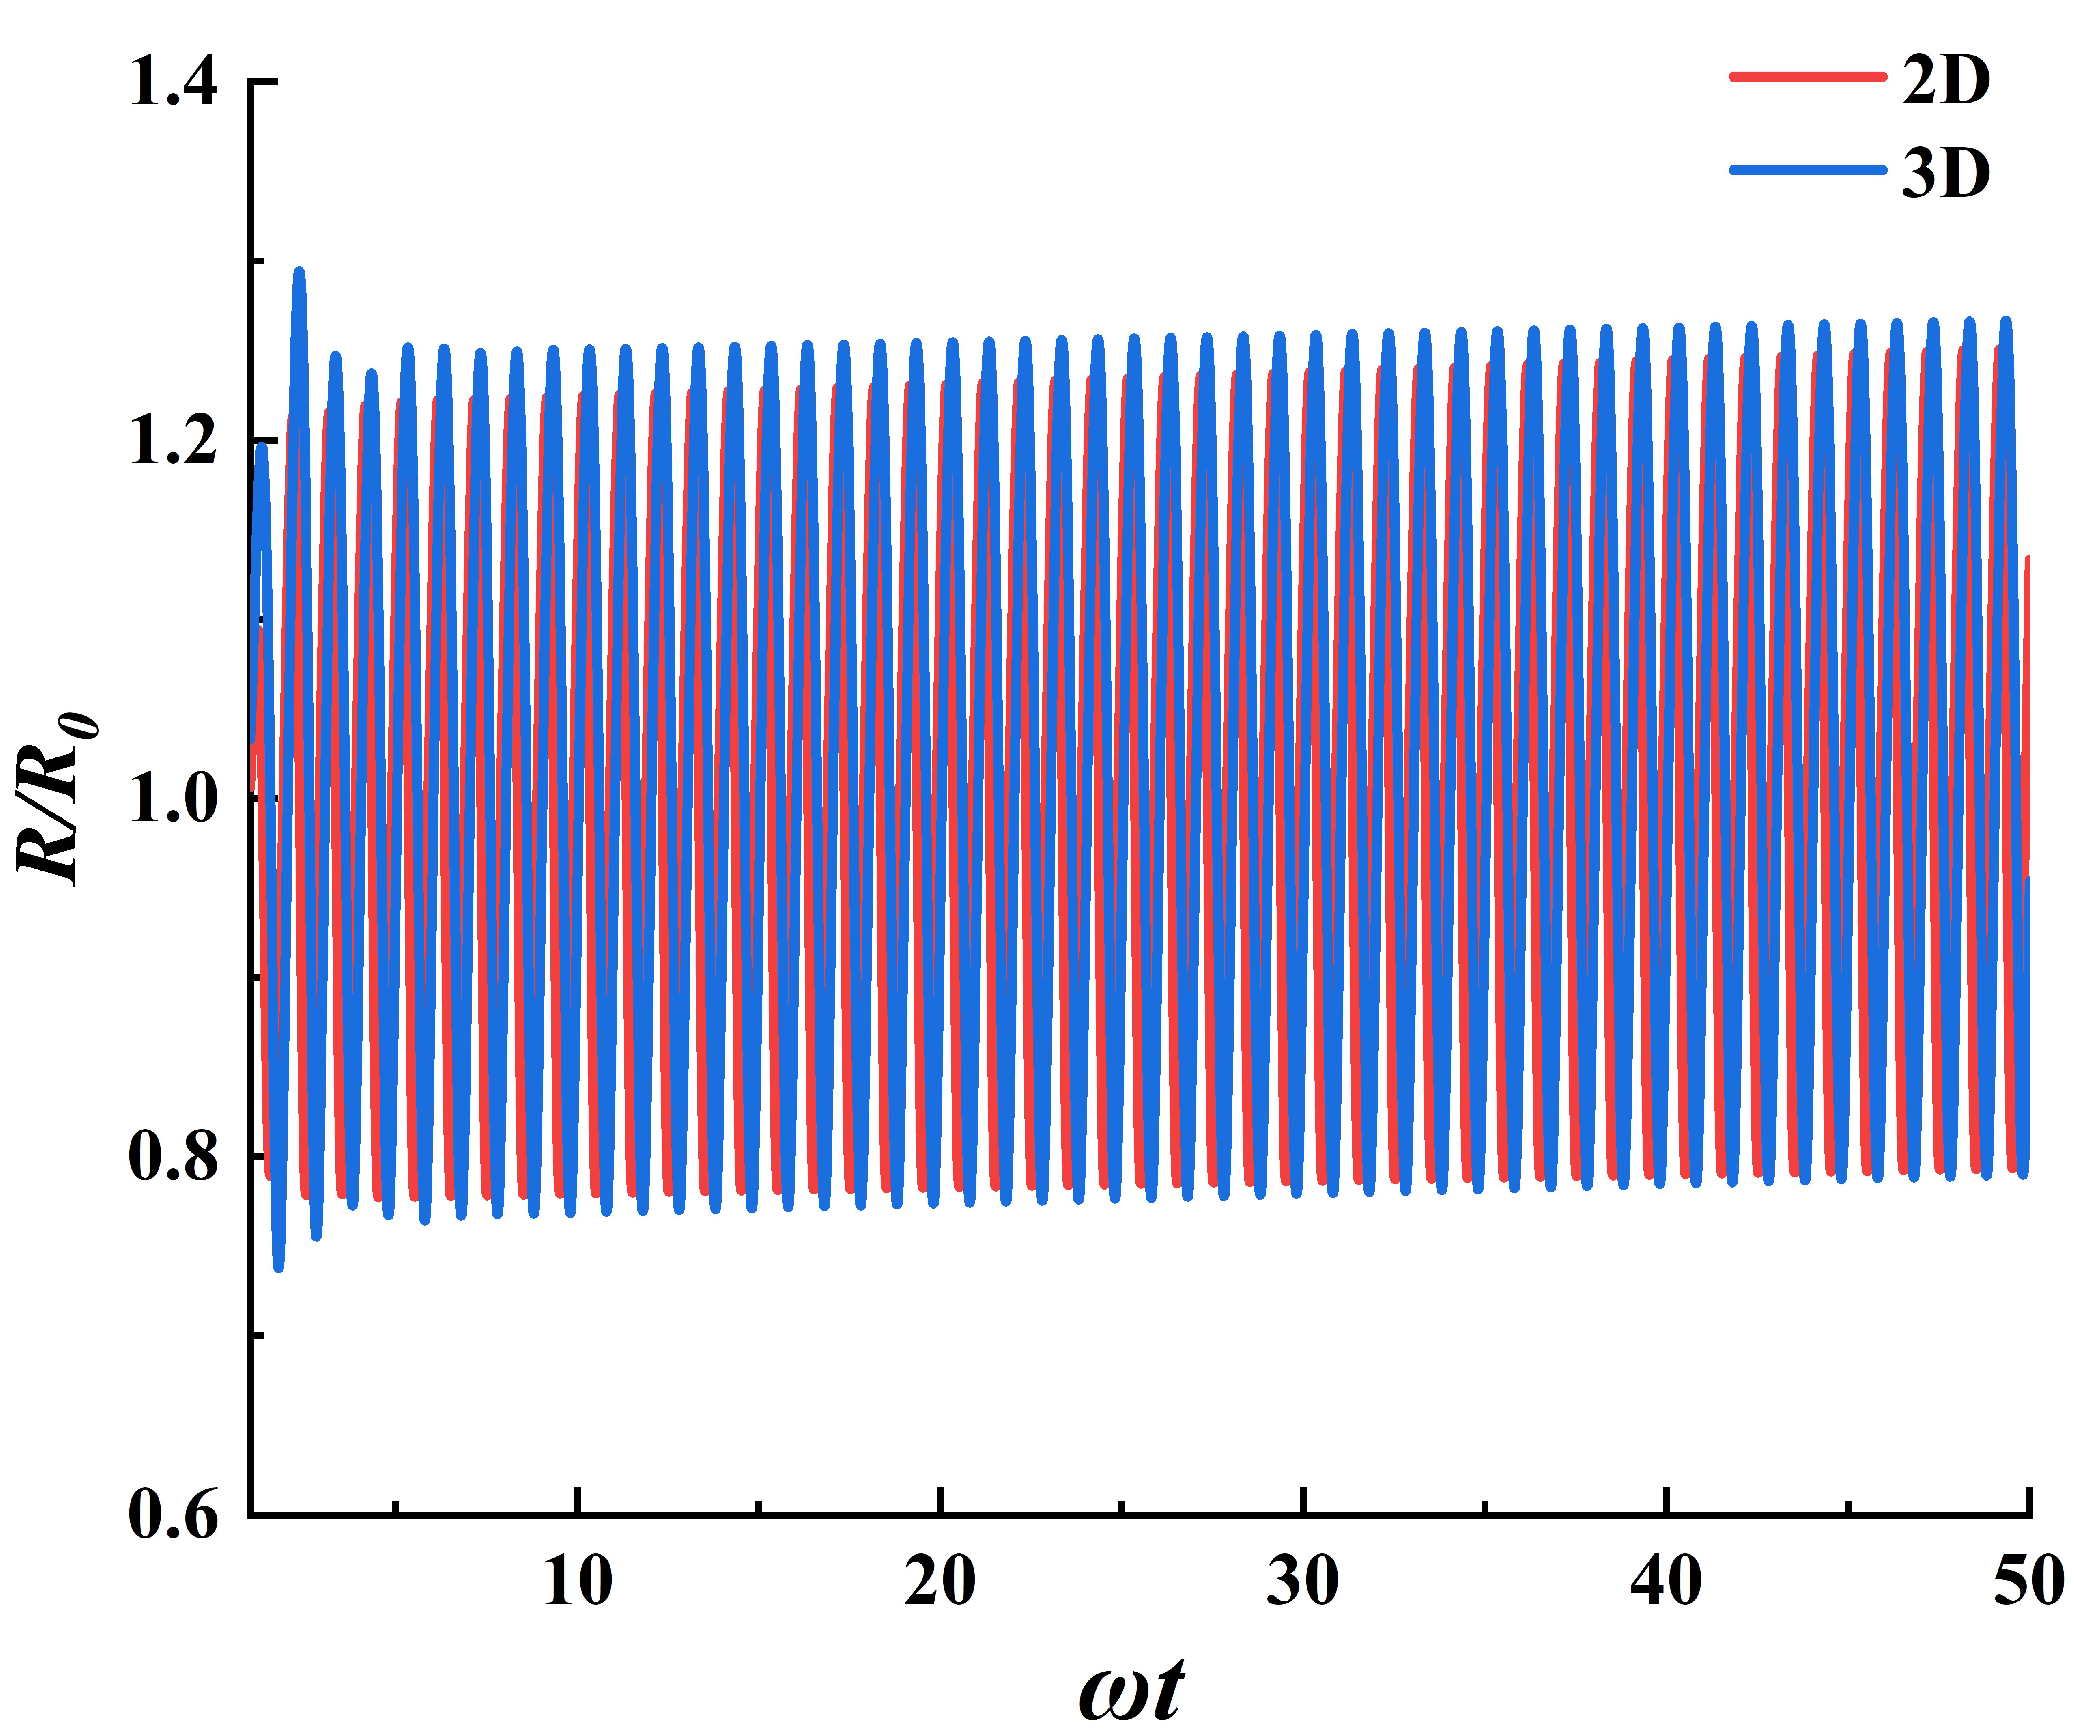
2.4. Model Validation

The R–P (Rayleigh–Plesset) and K–M (Keller–Miksis) equations [26] are the main equations used to describe bubble dynamics. Since this study primarily focuses on bubble oscillations in a periodic acoustic field, while considering factors such as acoustic radiation effects, fluid viscosity, surface tension, and fluid compressibility, the more suitable K–M equation is used for validation in this section.
To validate the model, we compared our results with the K–M equation [27]. The equation is presented as follows:
1 R ˙ c ρ R R ¨ + 3 2 R ˙ 2 ρ 1 R ˙ 3 c = 1 R ˙ c P 0 + 2 σ R 0 P v R 0 R 3 γ + P v u ( t ) 2 σ R 4 μ R ˙ R 3 c P 0 + 2 σ R 0 P v R 0 R 3 γ R ˙
where c is the speed of sound in the liquid, ρ is the liquid density, σ is the surface tension coefficient, γ is the specific heat ratio of the gas in the bubble, μ is the liquid viscosity, R is the bubble radius, R ˙ and R ¨ are the velocity and acceleration of the bubble wall, respectively, R 0 is the initial bubble radius, P 0 is the initial static pressure of the liquid, and P v is the vapor pressure inside the bubble.
Meanwhile, assuming the cavitation bubble contains an ideal gas with a uniform temperature distribution, and under the conditions of stable cavitation where the process is adiabatic, without considering mass transfer or phase change, the bubble temperature can be expressed as
T = T 0 R 0 R 3 ( γ 1 )
where T 0 represents the initial ambient temperature. The temperature predicted by this formula is closely aligned with the more accurate temperature obtained by Laura et al. [28] through fitting partial differential equations.
Equation (10) was numerically solved using the fourth- and fifth-order Runge–Kutta method, with the relevant model parameters provided in Table 2. This yields the time-dependent curve of the bubble radius.
To validate the model, the results from the K−M equation were compared with the simulation results, as shown in Figure 3. In the figure, the x−axis denotes the number of ultrasound cycles, while the y−axis represents the ratio of the instantaneous bubble radius R to the initial radius R 0 . The acoustic pressure applied to the bubble is derived from the pressure transmitted to the bubble boundary. Throughout four ultrasound cycles, both the simulation results and the numerical solutions exhibit consistent oscillatory behavior, with an amplitude deviation of less than 0.1%. This good agreement between the simulation results and the numerical solutions of the K−M equation confirms the model’s accuracy.
Meanwhile, to assess the accuracy of the simulation for thermal effects during cavitation, Figure 4 compares the maximum internal bubble temperature derived from the simulation and the solution of Equation (11). The x−axis denotes the number of ultrasound cycles, while the y−axis represents the maximum temperature inside the bubble. The comparison reveals that the temperature difference between the simulation and the theoretical solution remains within 1%, and both follow the same oscillatory pattern. This agreement validates the accuracy of the model’s thermal effects.
In addition, due to computational resource limitations, a two−dimensional model was chosen for the bubble cluster simulation in this study. To compare the differences between the two−dimensional and three−dimensional models, ultrasonic stable cavitation calculations were performed on the bubbles under identical conditions, and the results are shown in Figure 5. It can be observed that the two−dimensional model exhibits the same trend and oscillation period as the three−dimensional model. At the same time, the difference in bubble amplitude is approximately 2%. Therefore, this study selected a two−dimensional model for calculation and performed a qualitative analysis of the obtained data.

2.5. Numerical Setup

A two−dimensional simulation was developed to simulate the evolution of stable cavitation in a bubble cluster under ultrasound excitation, as illustrated in Figure 6. The flow domain is a square of 5mm side length, with the red circular regions representing cavitation bubbles, each with an initial radius of 1.5 μm. These bubbles are arranged in a staggered configuration with a 10 6 void ratio. Meanwhile, in order to make the description of the bubbles more accurate, the first bubble in the first row is named Bubble 1–1, the second bubble in the first row is named Bubble 1–2, and so on.
In the computational domain, the upper boundary is the pressure inlet, where the applied acoustic pressure is introduced. The rest of the boundaries are specified as non−reflective (wave−transmissive) boundaries. To simulate the periodic variation in the acoustic pressure input, the pressure is set as follows:
P ( t ) = P a sin ( 2 π ω ( t + φ ) )
In this equation, P a is the amplitude of the driving acoustic pressure, ω is the ultrasound frequency, and φ is the ultrasound phase. The calculation parameters for the simulation are set as shown in Table 3.

3. Results and Discussion

This section presents the results of the cases listed in Table 3. The dynamic behavior and the thermal effects of bubbles during stable cavitation are analyzed and discussed based on these results.

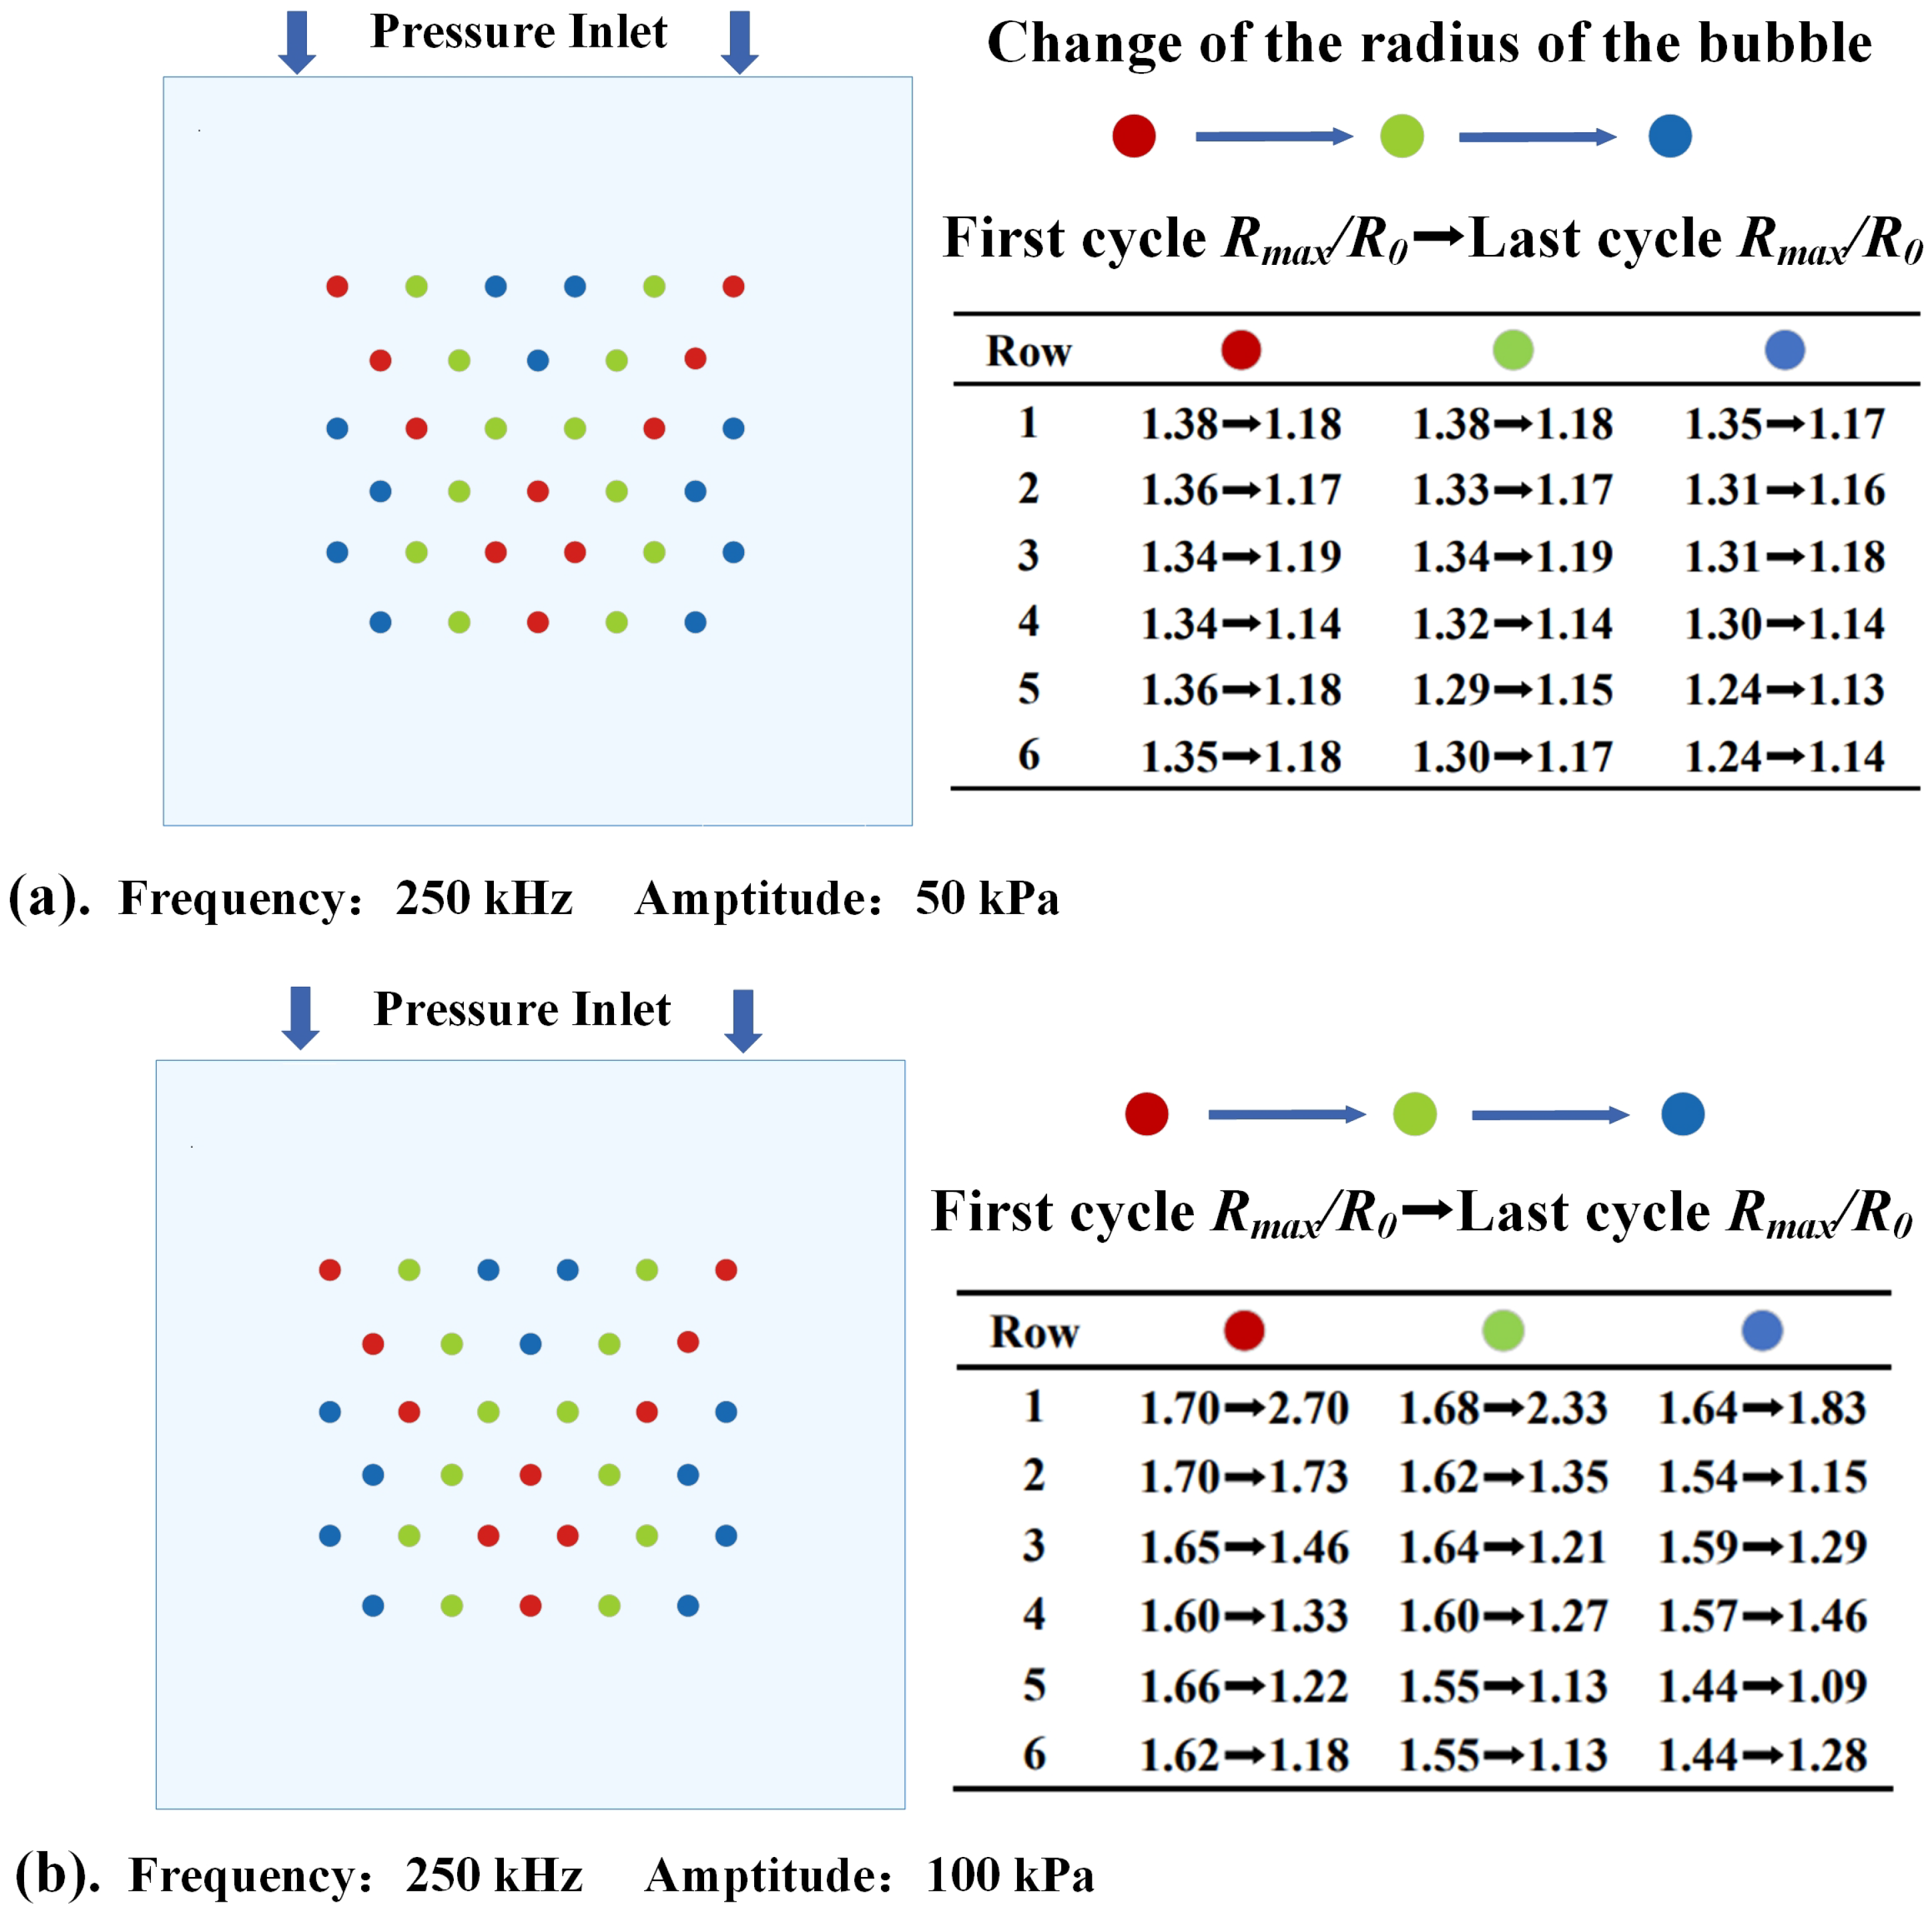
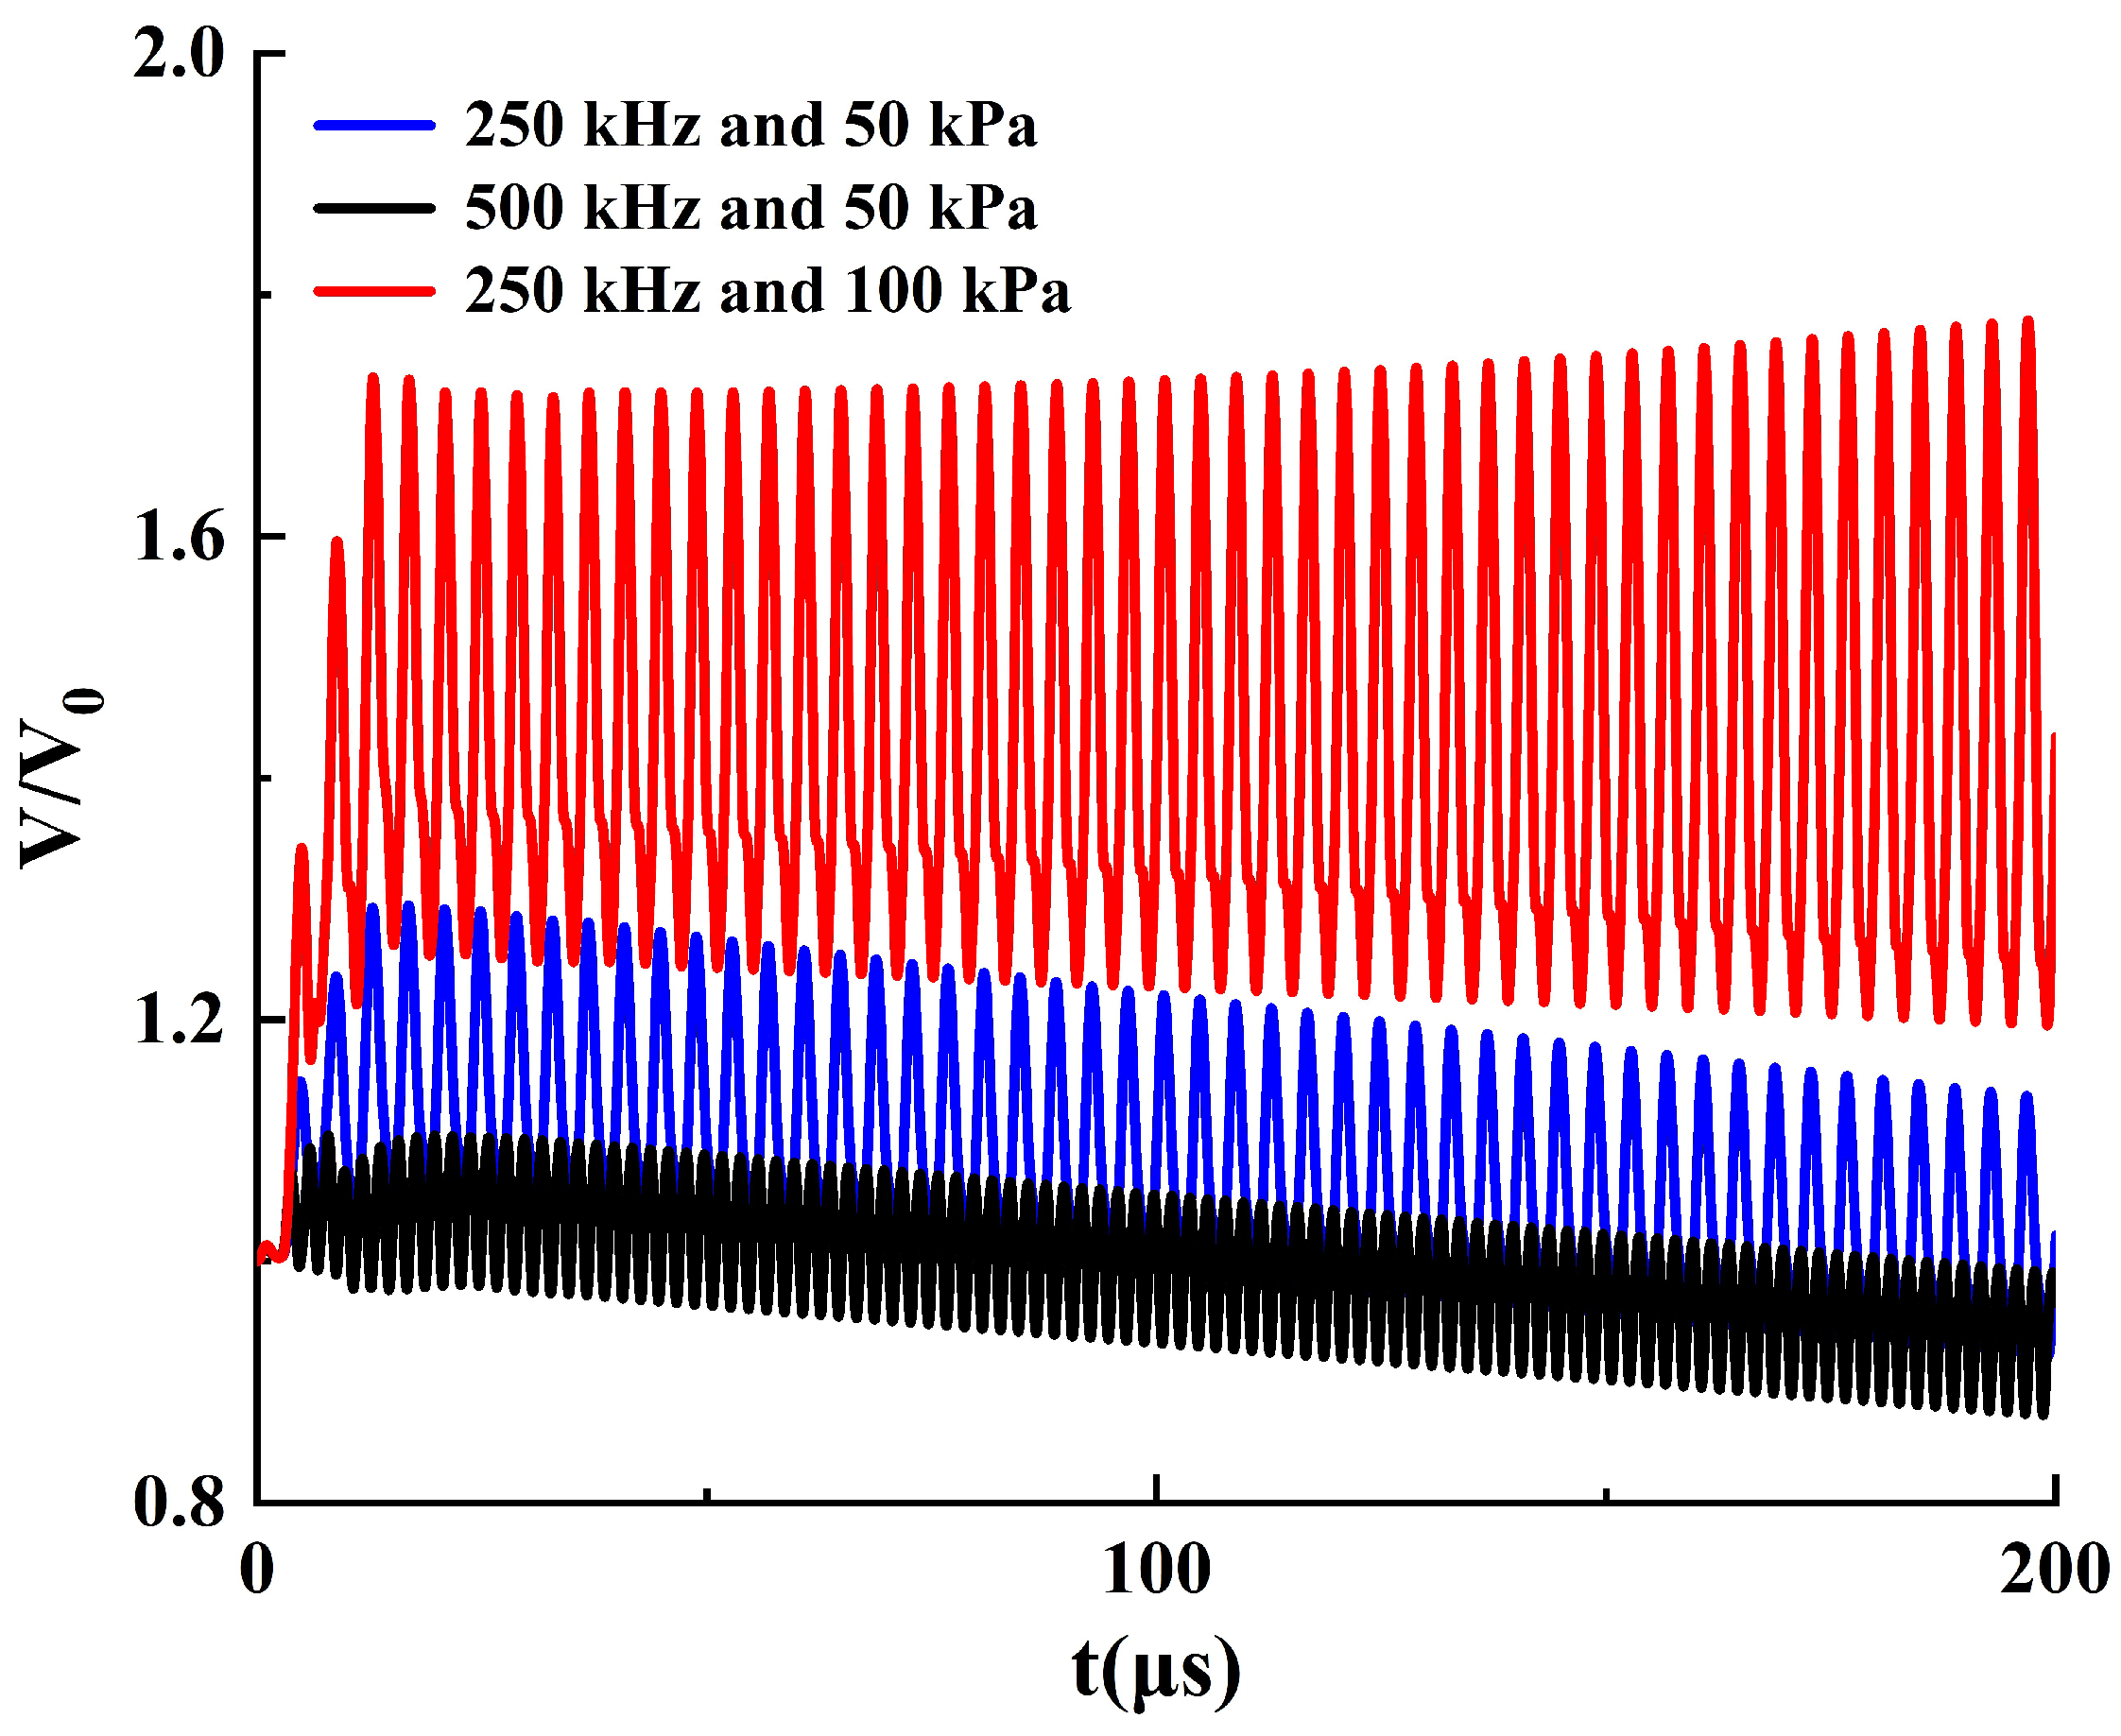
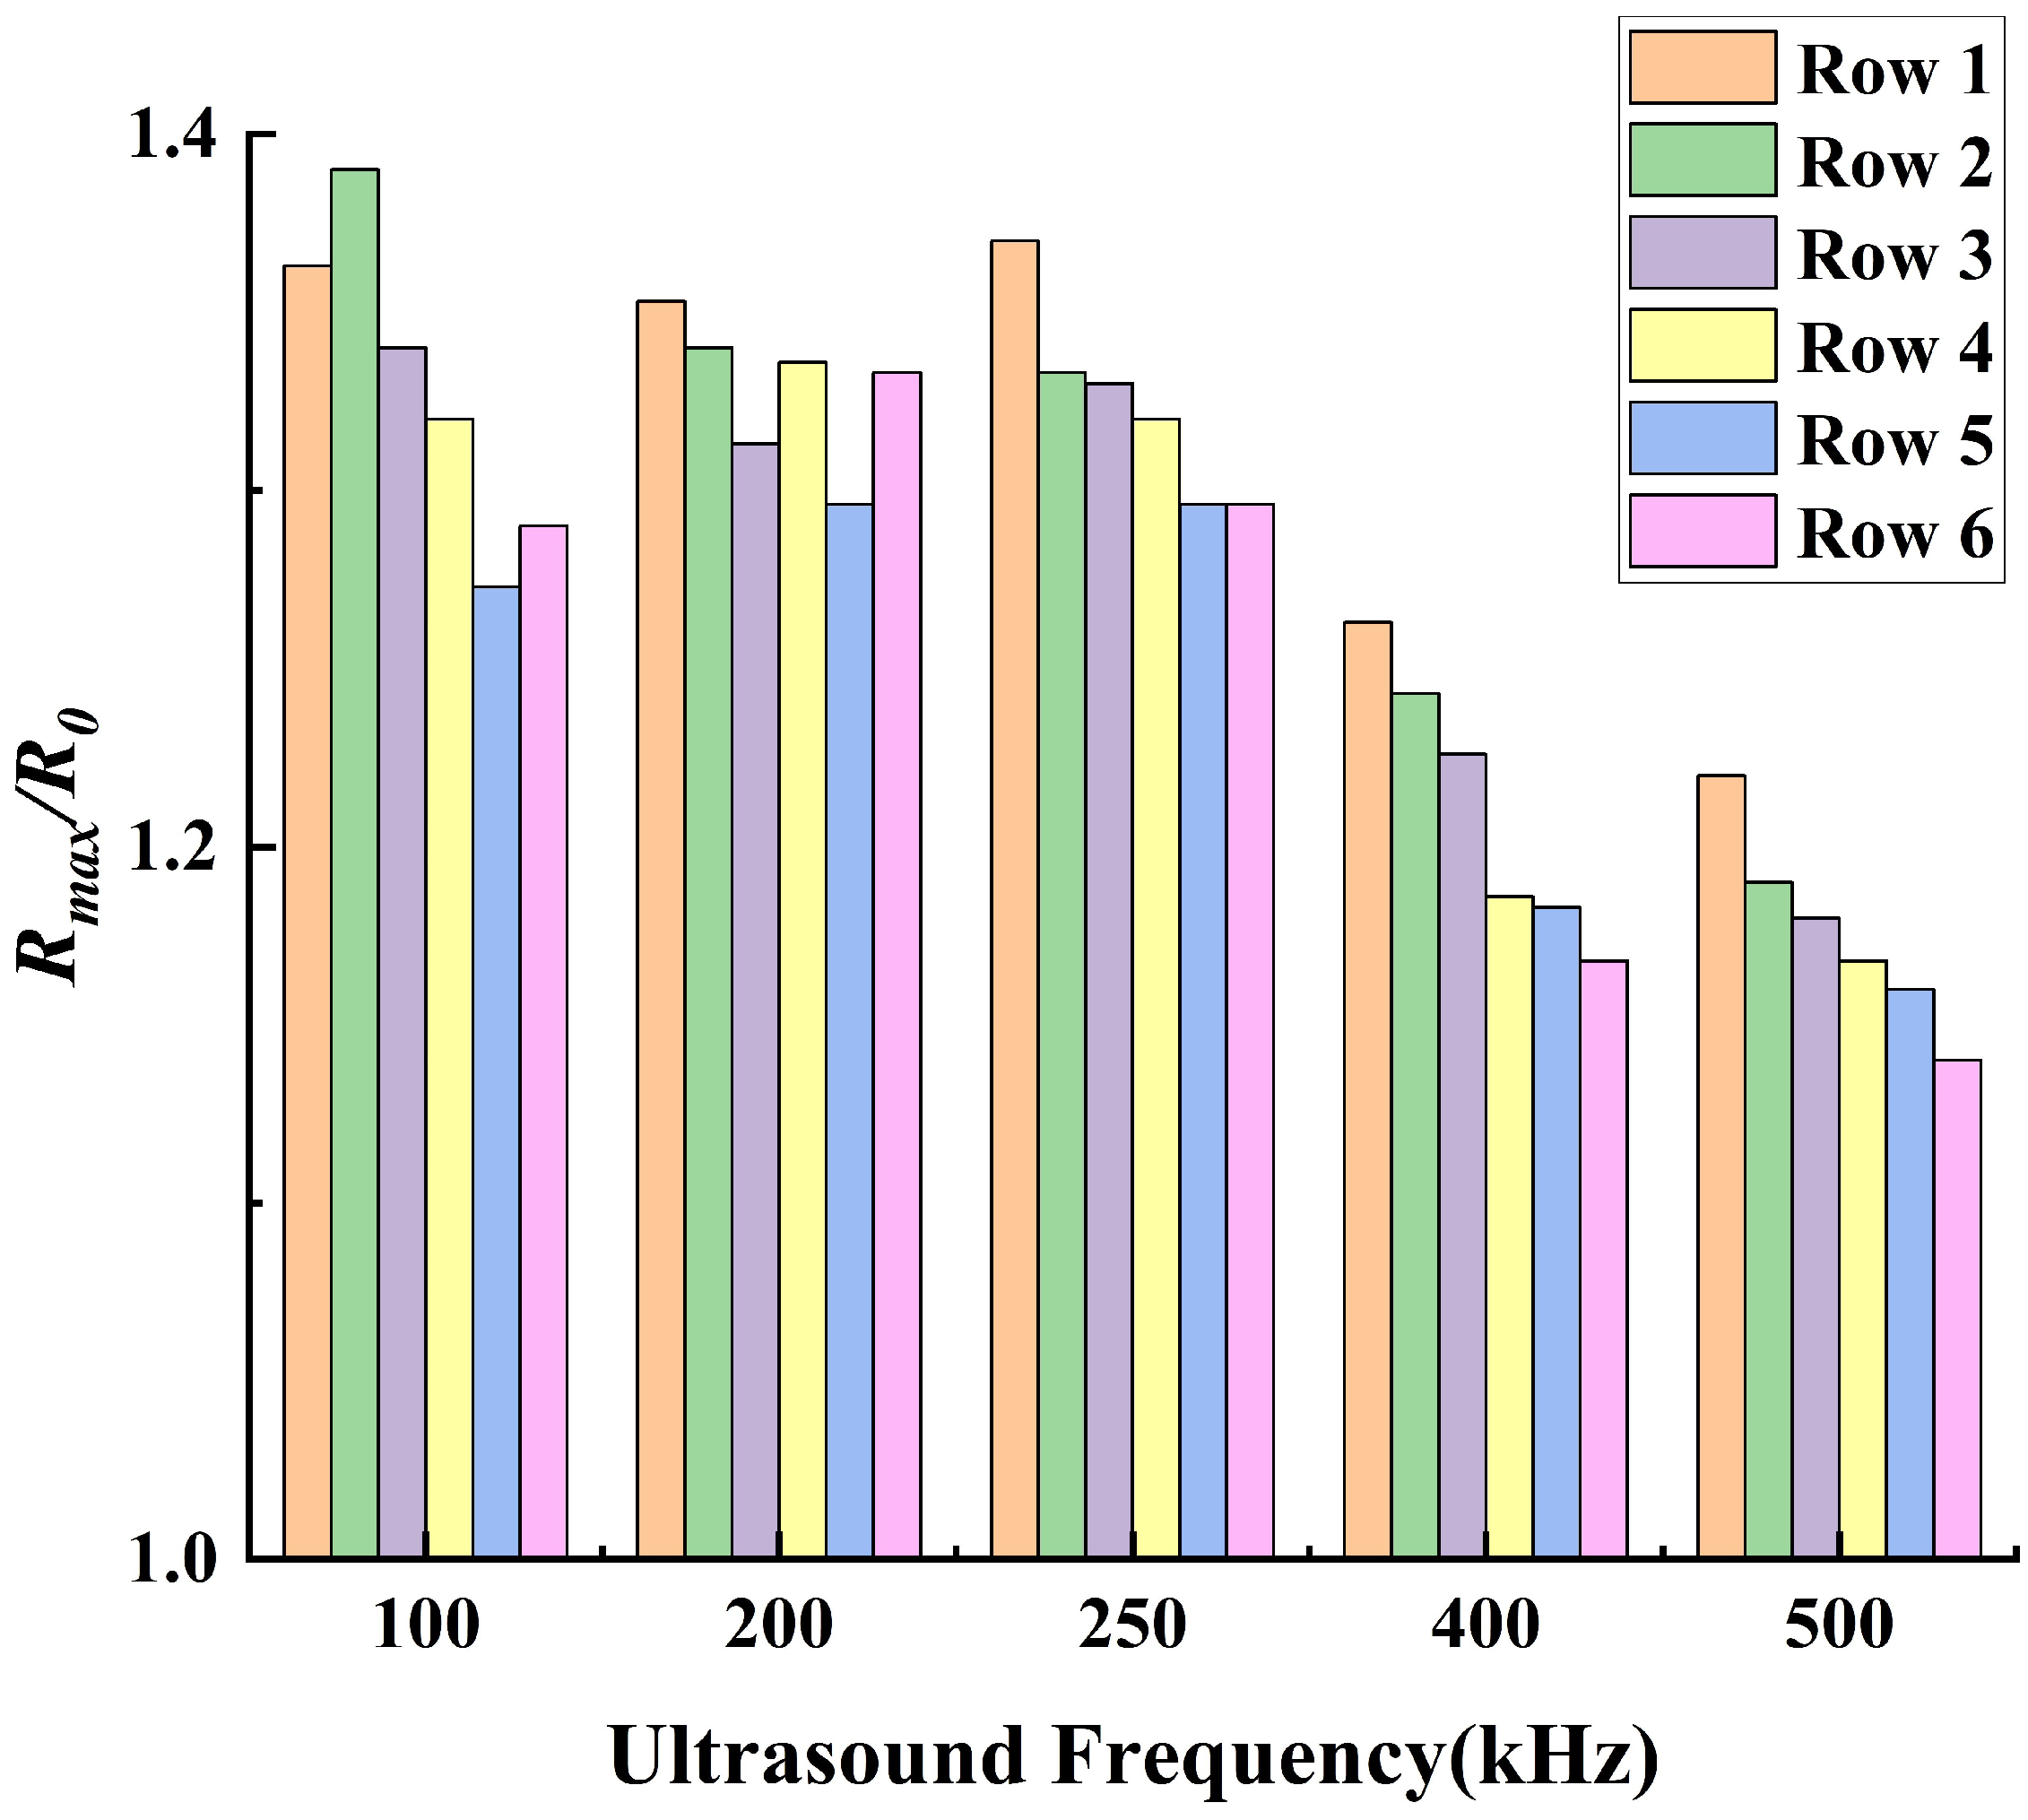
3.1. The Dynamic Behavior of Bubbles in Stable Cavitation

During the bubbles’ oscillation, the maximum volume of a bubble represents the maximum potential energy the bubble can achieve. Thus, this section first analyzes the maximum volume and distribution of bubbles within the cluster during ultrasound cavitation. Moreover, since the bubbles are assumed to be spherical, the maximum radius, R m a x , is utilized to simplify the interpretation of the analysis.
Figure 7 illustrates the distribution of the maximum bubble radius at an ultrasound frequency of 250 kHz with varying pressure amplitudes. The flow domain displays the volume variation distribution of bubbles across each row. Bubbles in the same row are arranged in descending order based on their maximum radius in the first few cycles and are represented by red, green, and blue colors, respectively. The bubbles displayed in red are the ones with the largest amplitude variation among the same row. Additionally, the accompanying table provides the ratio of the maximum bubble radius to the initial bubble radius, R m a x / R 0 , for bubbles in each row during both the first few cycles and the last few cycles of cavitation.
In Figure 7a, it is evident that while the oscillation of the entire bubble cluster is uneven, the distribution of oscillation intensity exhibits axial symmetry. As the bubble oscillations are primarily driven by acoustic pressure, it can be inferred that acoustic scattering occurs as the sound waves pass through the bubbles, resulting in partial acoustic pressure focusing within the flow field. Meanwhile, bubbles closer to the upstream region experience higher acoustic pressure, resulting in larger oscillations.
When the acoustic pressure amplitude increases to 100 kPa (Figure 7b), the oscillation amplitude distribution of bubbles in each row does not change, indicating that the acoustic pressure focuses at the same locations. Therefore, the acoustic pressure amplitude does not alter the propagation characteristics of the acoustic field. However, the influence of the acoustic pressure amplitude on the bubble amplitude is quite significant. As the pressure amplitude increases, the amplitude of all bubbles notably increases. Additionally, after prolonged exposure to ultrasound, the oscillation amplitude of most bubbles shows a downward trend. However, some bubbles, such as those in the first row with the largest oscillation amplitudes, exhibit an increasing trend in their oscillation amplitude.
To investigate the cause of the increasing oscillation amplitude, the maximum pressure experienced by bubbles 2–1 during each ultrasound cycle was compared with the corresponding bubble radius variation, R m a x / R 0 . The specific results are shown in Figure 8. The intersection point of the two straight lines is the turning point of the bubble oscillation amplitude. It can be observed that when the maximum pressure on the bubble surface exceeds 210 kPa, the oscillation amplitude increases. Moreover, as the pressure increases, the rate of increase in the oscillation amplitude accelerates. Conversely, as the oscillation amplitude decreases, the rate of radius growth slows down. However, once the maximum pressure drops below 210 kPa, the oscillation amplitude begins to decrease, with the rate of this decrease becoming slower at higher pressures.
Similarly, the total volume of the bubble cluster has also changed. Figure 9 presents the ratio between the instantaneous bubbles’ volume and the initial volume of the bubble cluster (V/ V 0 ) under different ultrasound conditions. It is obvious that the oscillation period of the total bubble volume corresponds to each ultrasound cycle. At low acoustic pressure amplitudes (50 kPa), the pressure experienced by each bubble does not exceed 210 kPa, so the magnitude and oscillation amplitude of the bubbles’ volume show a decreasing trend. In contrast, at a higher sound pressure amplitude (100 kPa), some bubbles experience pressures exceeding 210 kPa on their surfaces, causing their volume to increase more significantly than the decrease in volume of the remaining bubbles. Therefore, under long−period ultrasound, both the gas−phase total volume and oscillation amplitude show an increasing trend.
Meanwhile, Table 4 presents the total volume change rate of the bubble cluster after 200 ultrasound cycles under different ultrasound conditions. It can be observed that when the acoustic pressure amplitude is 50 kPa, the overall volume exhibits a decreasing trend, with the decrease being more pronounced at lower ultrasound frequencies. However, when the acoustic pressure amplitude is 100 kPa, the overall volume shows an increasing trend, although the increase is relatively small. At an ultrasound frequency of 500 kHz, significant acoustic attenuation occurs, resulting in both a smaller number and amplitude of expanding bubbles in the bubble cluster. As a result, the overall volume increases by only approximately 2%.
Figure 10 shows the average amplitude of bubbles in each row at different ultrasound frequencies, with an acoustic pressure amplitude of 50 kPa. It can be observed that when the ultrasound frequency exceeds 250 kHz, the higher the ultrasound frequency, the smaller the oscillation amplitude of the bubbles in each row. Since the bubbles are driven by acoustic pressure, this suggests that acoustic attenuation occurs within the flow field. The higher the ultrasound frequency, the greater the attenuation of acoustic pressure over the same propagation distance.
However, when the ultrasound frequency is below 250 kHz, there is no significant attenuation pattern in the oscillation amplitudes of the bubbles in each row, indicating that acoustic attenuation during the propagation process can be ignored at this point. Combined with the bubble amplitude distribution diagram under the same ultrasound conditions in Figure 11a,c,e,g,h, it can be observed that under these ultrasound conditions, the main influencing factor is acoustic focusing. Bubble acoustic scattering leads to acoustic pressure focusing, causing local pressure to exceed the amplitude of the incident acoustic wave. Therefore, the oscillation amplitude of the bubbles in each row is related to the focusing region. The higher the focused acoustic pressure, the more significant the changes in the bubble volume. Additionally, as the frequency decreases, the focal point tends to concentrate toward the central region and upstream.
Figure 12 shows the average amplitude of bubbles in each row at different ultrasound frequencies, with an acoustic pressure amplitude of 100 kPa. Compared to when the acoustic pressure amplitude is 50 kPa, the bubble oscillation amplitudes increase significantly, and the differences in oscillation amplitudes between the rows of bubbles become more pronounced, indicating more severe acoustic attenuation. At the same time, as the ultrasound frequency decreases, the effect of acoustic attenuation weakens considerably.
Similary, when the acoustic pressure amplitude is increased to 100 kPa, the distribution of bubbles is shown in Figure 11b,d,f and Figure 12. It can be observed that the acoustic pressure amplitude has little impact on the distribution of bubble oscillation amplitudes, and there is no significant change in the acoustic focusing region. The acoustic focusing region is mainly influenced by the ultrasound frequency. As the ultrasound frequency decreases, the acoustic focusing region converges towards the interior of the bubble cluster. At the same time, more acoustic pressure is also concentrated at the ultrasound inlet. Furthermore, the threshold frequency for noticeable attenuation remains at 250 kHz, regardless of the acoustic pressure amplitude.
To summarize the result above, under the conditions discussed in this paper, acoustic scattering leads to the focusing of acoustic pressure, which intensifies cavitation. Furthermore, when the pressure on the bubble surface exceeds the acoustic threshold of 210 kPa, cavitation is significantly amplified. Lastly, higher ultrasound frequencies result in more pronounced acoustic attenuation; therefore, selecting an appropriate ultrasound frequency is recommended to mitigate the effects of attenuation in ultrasound therapy.

3.2. The Thermal Effects of Stable Cavitation

In this section, to study the thermal effects of stable cavitation under varying ultrasound conditions, a circular array of 12 temperature probes was positioned at a distance of 3R around each bubble. The average temperature of the probes is taken to represent the temperature at the bubble interface.
When the ultrasound frequency is 250 kHz and the amplitude is 100 kPa, the representative temperature changes in the bubble domain are shown in Figure 13. It can be observed that the temperature in the bubble domain follows a fluctuating upward trend. During the initial stage, the rate of temperature increase accelerates, while in the middle stages, the rate slows and eventually stabilizes. Additionally, the temperature oscillation period within the bubble flow region corresponds to the ultrasound cycle, indicating that each stable cavitation cycle contributes to a consistent temperature increase. The synchronization of temperature fluctuations with ultrasound is related to the thermodynamic processes of bubble oscillation: when bubbles are subjected to positive pressure, their volume decreases, causing an internal temperature rise and initiating heat conduction. Simultaneously, viscous effects in the liquid generate internal energy, leading to a rapid increase in liquid temperature.
Figure 14 illustrates the distribution of bubble oscillation amplitude variations and temperature rise rates under the same ultrasound conditions. Obviously, for bubbles in the same row, a larger change in radius corresponds to a higher temperature rise rate. However, the relationship between oscillation amplitude change and temperature rise rate is non−linear for bubbles in different rows. This is due to the bubbles being at different positions, where they are influenced by the acoustic focusing region and the surrounding bubbles, resulting in varying temperature rise rates.
Figure 15 illustrates the average temperature rise rate of bubbles in each row at different ultrasound frequencies, with an acoustic pressure amplitude of 50 kPa. As the ultrasound frequency decreases, the temperature rise rate of the bubbles initially increases and then rapidly decreases, which differs from the variation pattern of the bubble radius.
To fully understand the reason above, Figure 16 presents the center temperature of bubbles 1–3 over four ultrasound cycles. When the ultrasound frequency is greater than 250 kHz, higher frequencies result in stronger acoustic attenuation, leading to lower bubble center temperatures. However, in addition to acoustic attenuation, thermodynamic properties also influence temperature variation. When the ultrasound frequency is below 250 kHz, the effect of acoustic attenuation becomes weaker or even negligible. At the same time, lower frequencies correspond to longer ultrasound cycles, requiring more internal energy for the same bubble−heating process, reducing energy absorption efficiency. For instance, at an ultrasound frequency of 100 kHz, the maximum bubble center temperature is only 301.5 K.
Furthermore, when the acoustic pressure amplitude is 100 kPa, the average temperature rise rate of bubbles in each row under different ultrasound frequencies is shown in Figure 17. It can be observed that when the acoustic pressure amplitude exceeds 100 kPa, the temperature rise rate in the bubble flow region significantly increases. Meanwhile, when the ultrasound frequency is 400 kHz and 500 kHz, the temperature rise rate varies more between the rows of bubbles, indicating more severe acoustic attenuation. Additionally, compared to ultrasound frequencies of 240 kHz and 260 kHz, the temperature rise rate in the bubble flow region is fastest when the ultrasound frequency is 250 kHz.
Similarly, when the acoustic pressure amplitude is increased to 100 kPa, the distribution of temperature rise rates is shown in Figure 18b,d,f. In the figure, the average temperature rise rate of bubbles is ranked respectively. The left side displays the distribution of temperature rise rates, while the right side provides the rise values. It can be observed that the regions with a faster temperature rise at 50 kPa still experience a faster temperature rise at 100 kPa. The change in acoustic pressure amplitude does not affect the acoustic focusing region formed by acoustic scattering. Simultaneously, a comparison of Figure 18a,c,e,g,h reveals that as the ultrasound frequency decreases, the energy within the flow field becomes more concentrated towards the interior of the flow domain. These observations are consistent with the changes in bubble oscillation amplitude.
The liquid phase temperature rise rate under different ultrasound conditions is shown in Figure 19a, where the liquid temperature is taken as the average of multiple probe temperatures at the center of the flow domain. It can be observed that, under different ultrasound conditions, the amplitude of the liquid phase temperature rise rate varies, but the trend remains the same. During the initial few ultrasound cycles, the temperature rise rate increases rapidly and peaks around the tenth cycle, with a maximum rate of up to 1250 K/s. In the early stages of cavitation, when bubble stable cavitation has not yet stabilized, the impact on the internal temperature of the bubbles is significant. After that, the temperature rise rate decreases sharply and gradually slows down after more than fifty cycles, with the rate of deceleration also decreasing. Eventually, it stabilizes and remains at a constant rate. This trend is consistent with the temperature variation pattern in the bubble field shown in Figure 13.
Since, in the two−dimensional model, the heat transfer process within the bubble is closer to the unsteady heat diffusion process in a cylinder, the liquid phase temperature rise rate was fitted with the unsteady cylindrical heat diffusion model from Crank’s [29] book, with the specific fitting results shown in Figure 19b–d. It can be observed that after approximately 50 ultrasound cycles, the temperature rise curve closely matches the trend and values of the fitted curve, indicating that the temperature rise behavior in the flow domain aligns more closely with this heat diffusion model. Additionally, during the steady cavitation process under long−period ultrasound, the bubble can be considered a heat source with a constant internal temperature, providing internal energy outward at a constant rate. Furthermore, in future studies, we plan to investigate the changes in heat absorption by a single bubble and explore the relationship between the diffusion model and this phenomenon.
To sum up, under the operating conditions discussed in this study, the rate of cavitation thermal effects reaches its maximum at an ultrasound frequency of 250 kHz. At this frequency, the acoustic attenuation in flow and the energy absorption by bubbles reach a balance. Additionally, when the acoustic pressure on the bubbles’ surface is above 210 kPa, the thermal effects of ultrasound cavitation are enhanced significantly. So, appropriate ultrasound frequency and pressure amplitudes should be selected based on the desired thermal effects during ultrasound therapy.

4. Conclusions

In order to investigate the bubble dynamics and mechanisms of thermal effects generated by stable cavitation in a biological fluid environment, a series of DNS approaches was computed in this study. The bubble radius and temperature variations were analyzed under different ultrasound frequencies and amplitudes. The bubble cluster has an individual bubble radius of 1.5 μm and a void ratio of 10 6 . The conclusions drawn from this study are as follows:
(i)
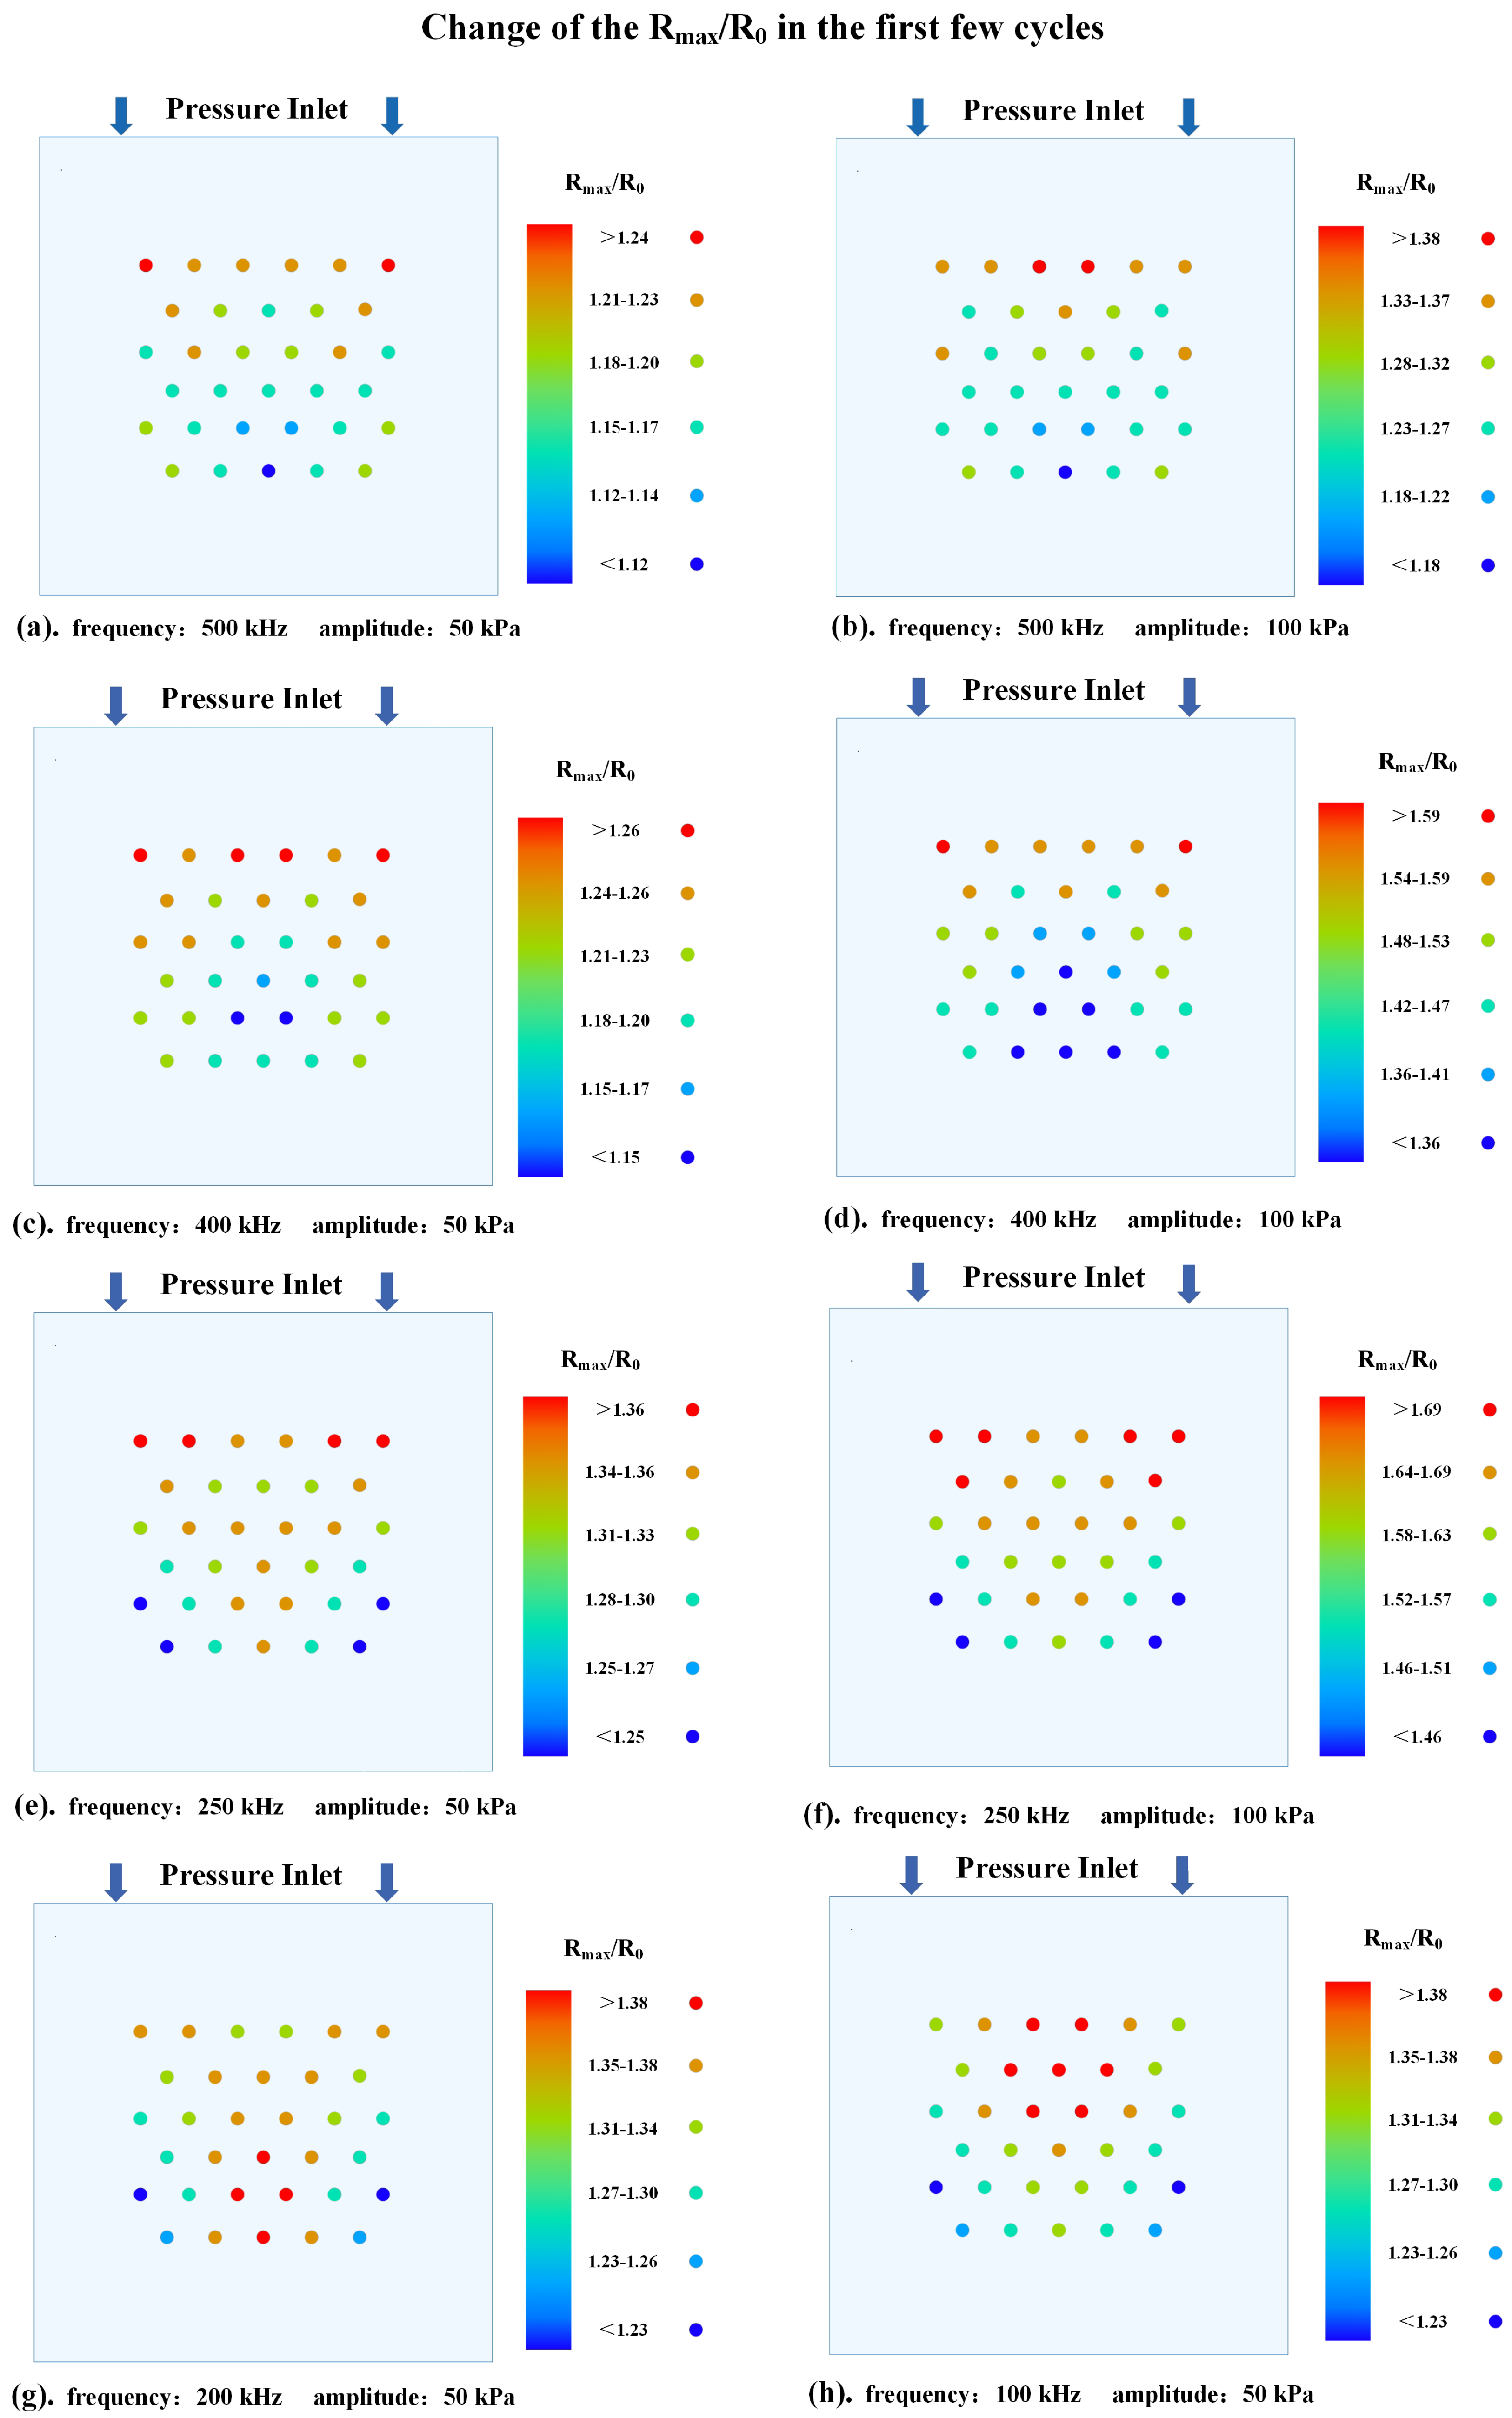
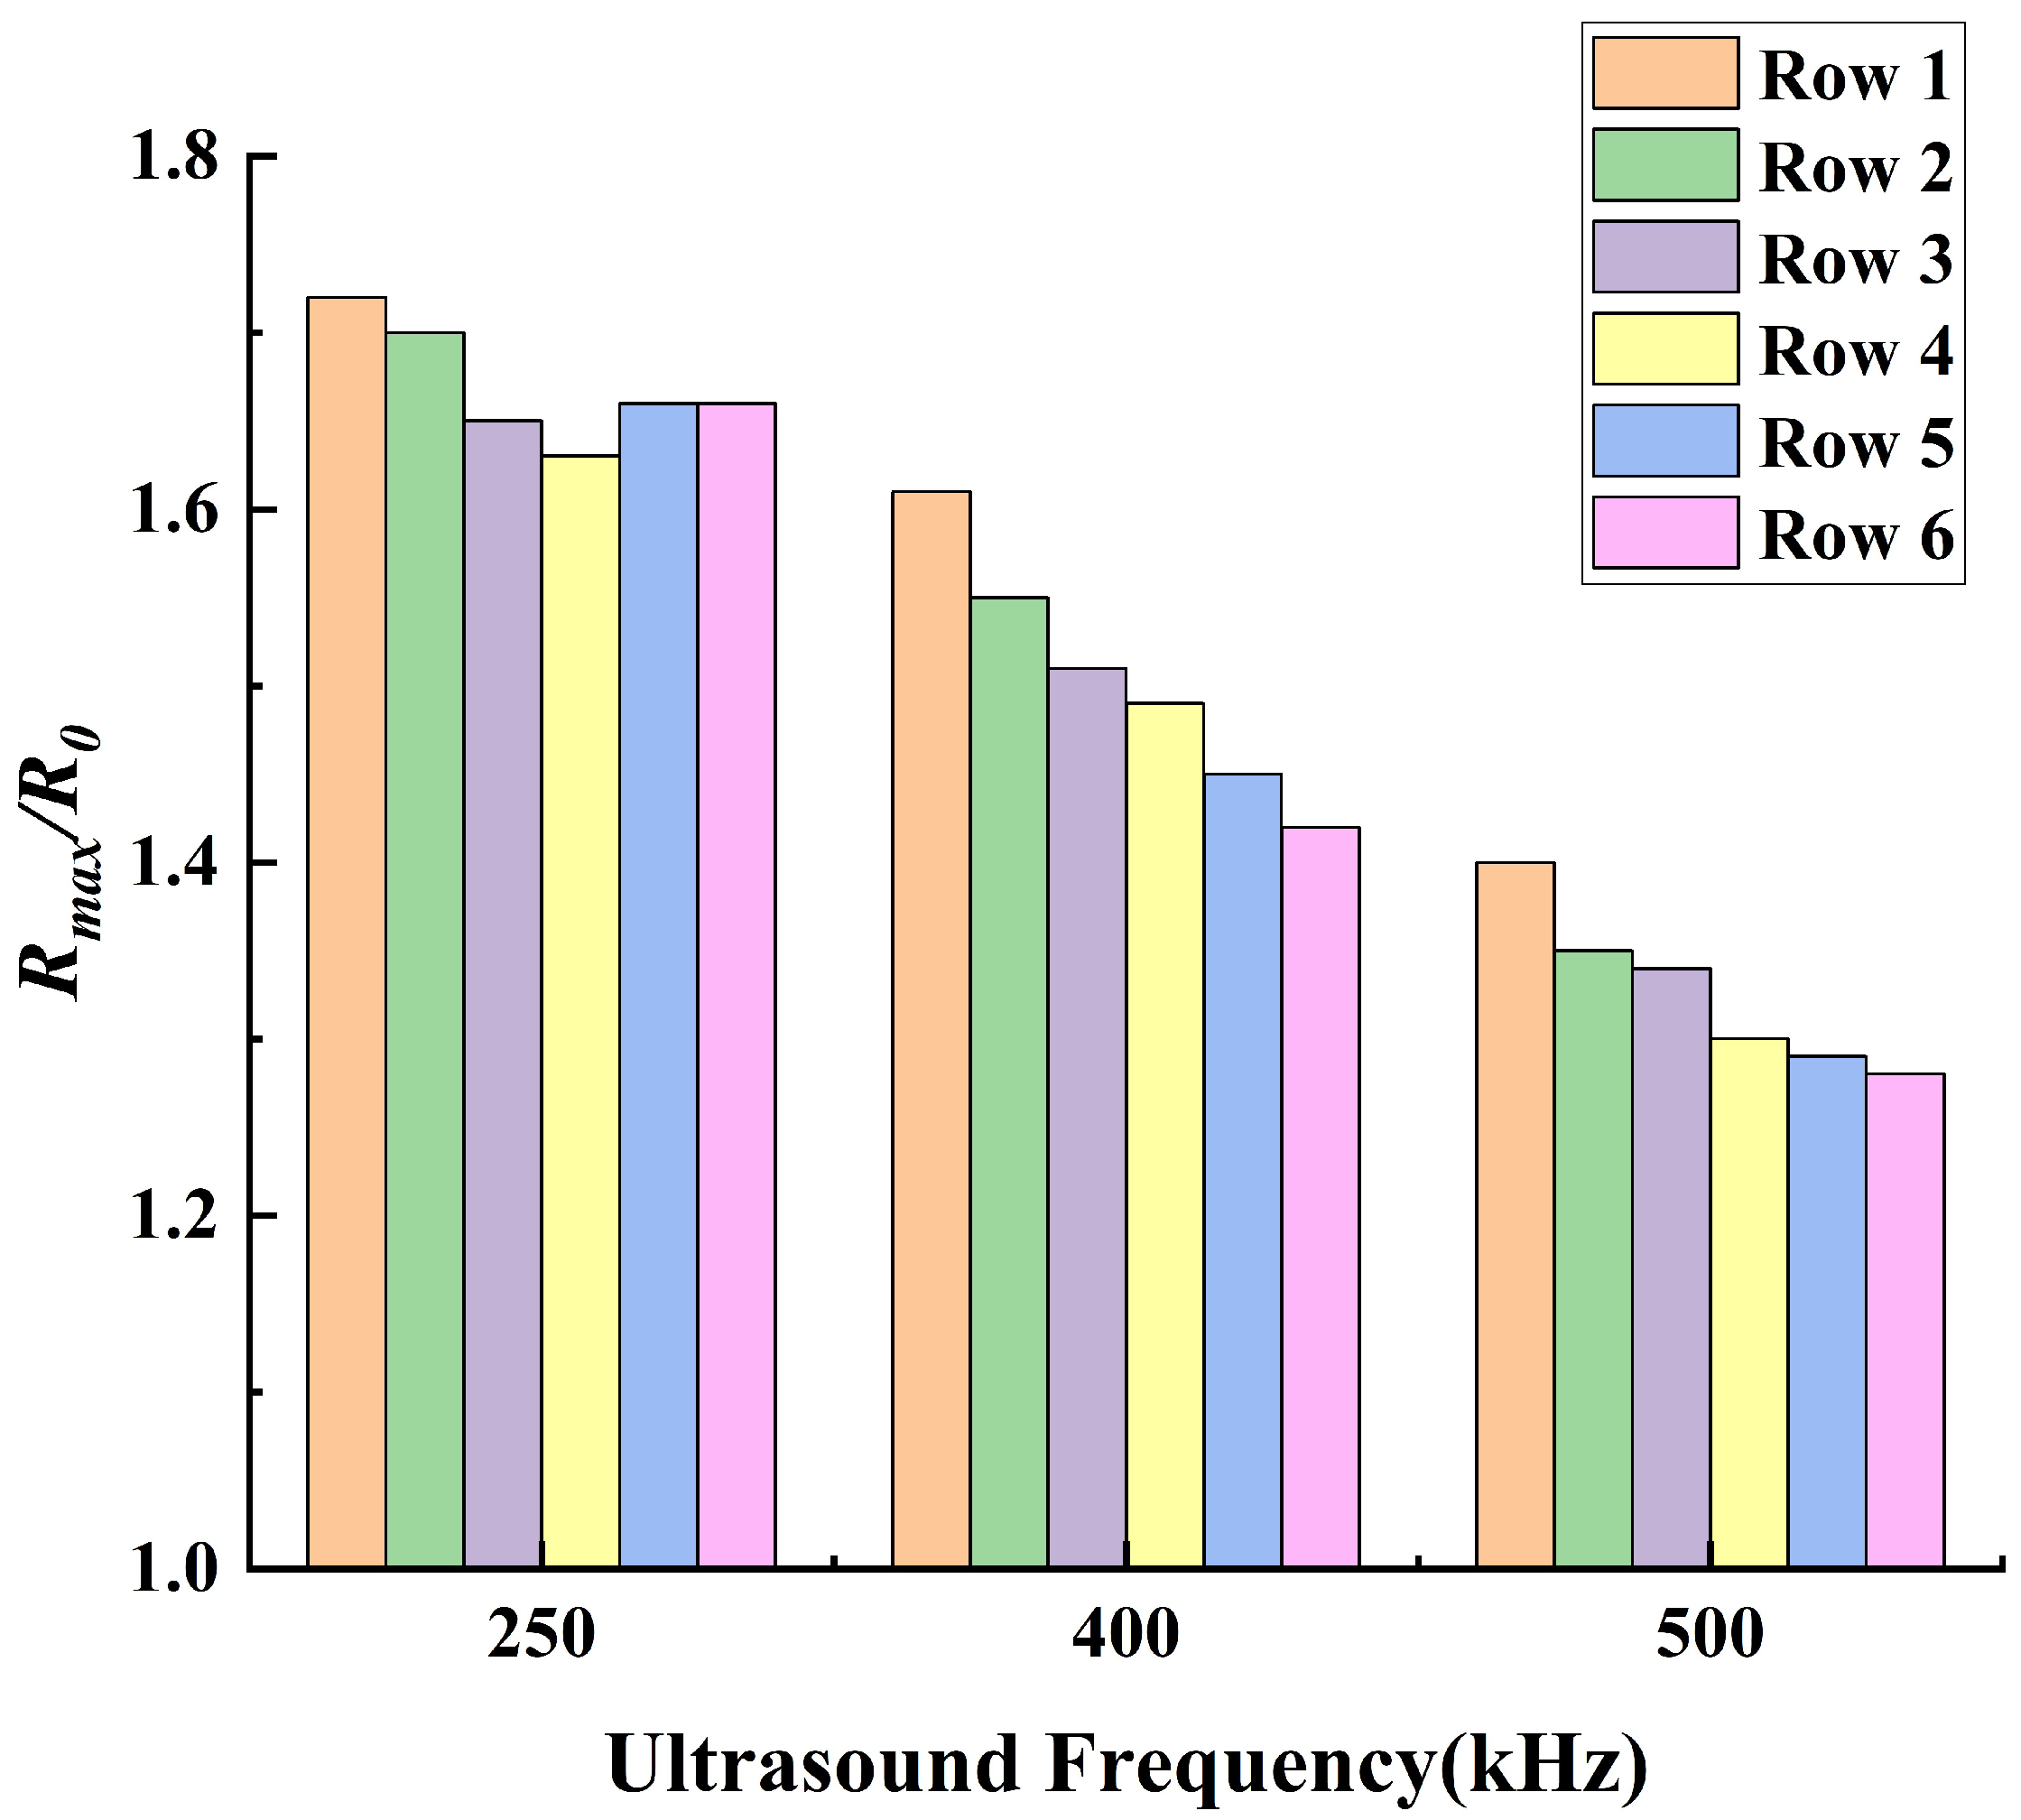
The thermal effect of ultrasound cavitation in bubbles is non−linearly positively correlated with the ultrasound pressure amplitude and the bubbles’ volume change. Additionally, acoustic scattering occurs when ultrasound passes through the bubbles, leading to acoustic focusing in the bubble cluster. Meanwhile, as the ultrasound frequency decreases, the intensity of acoustic focusing increases, with the focal point moving upstream.
(ii)
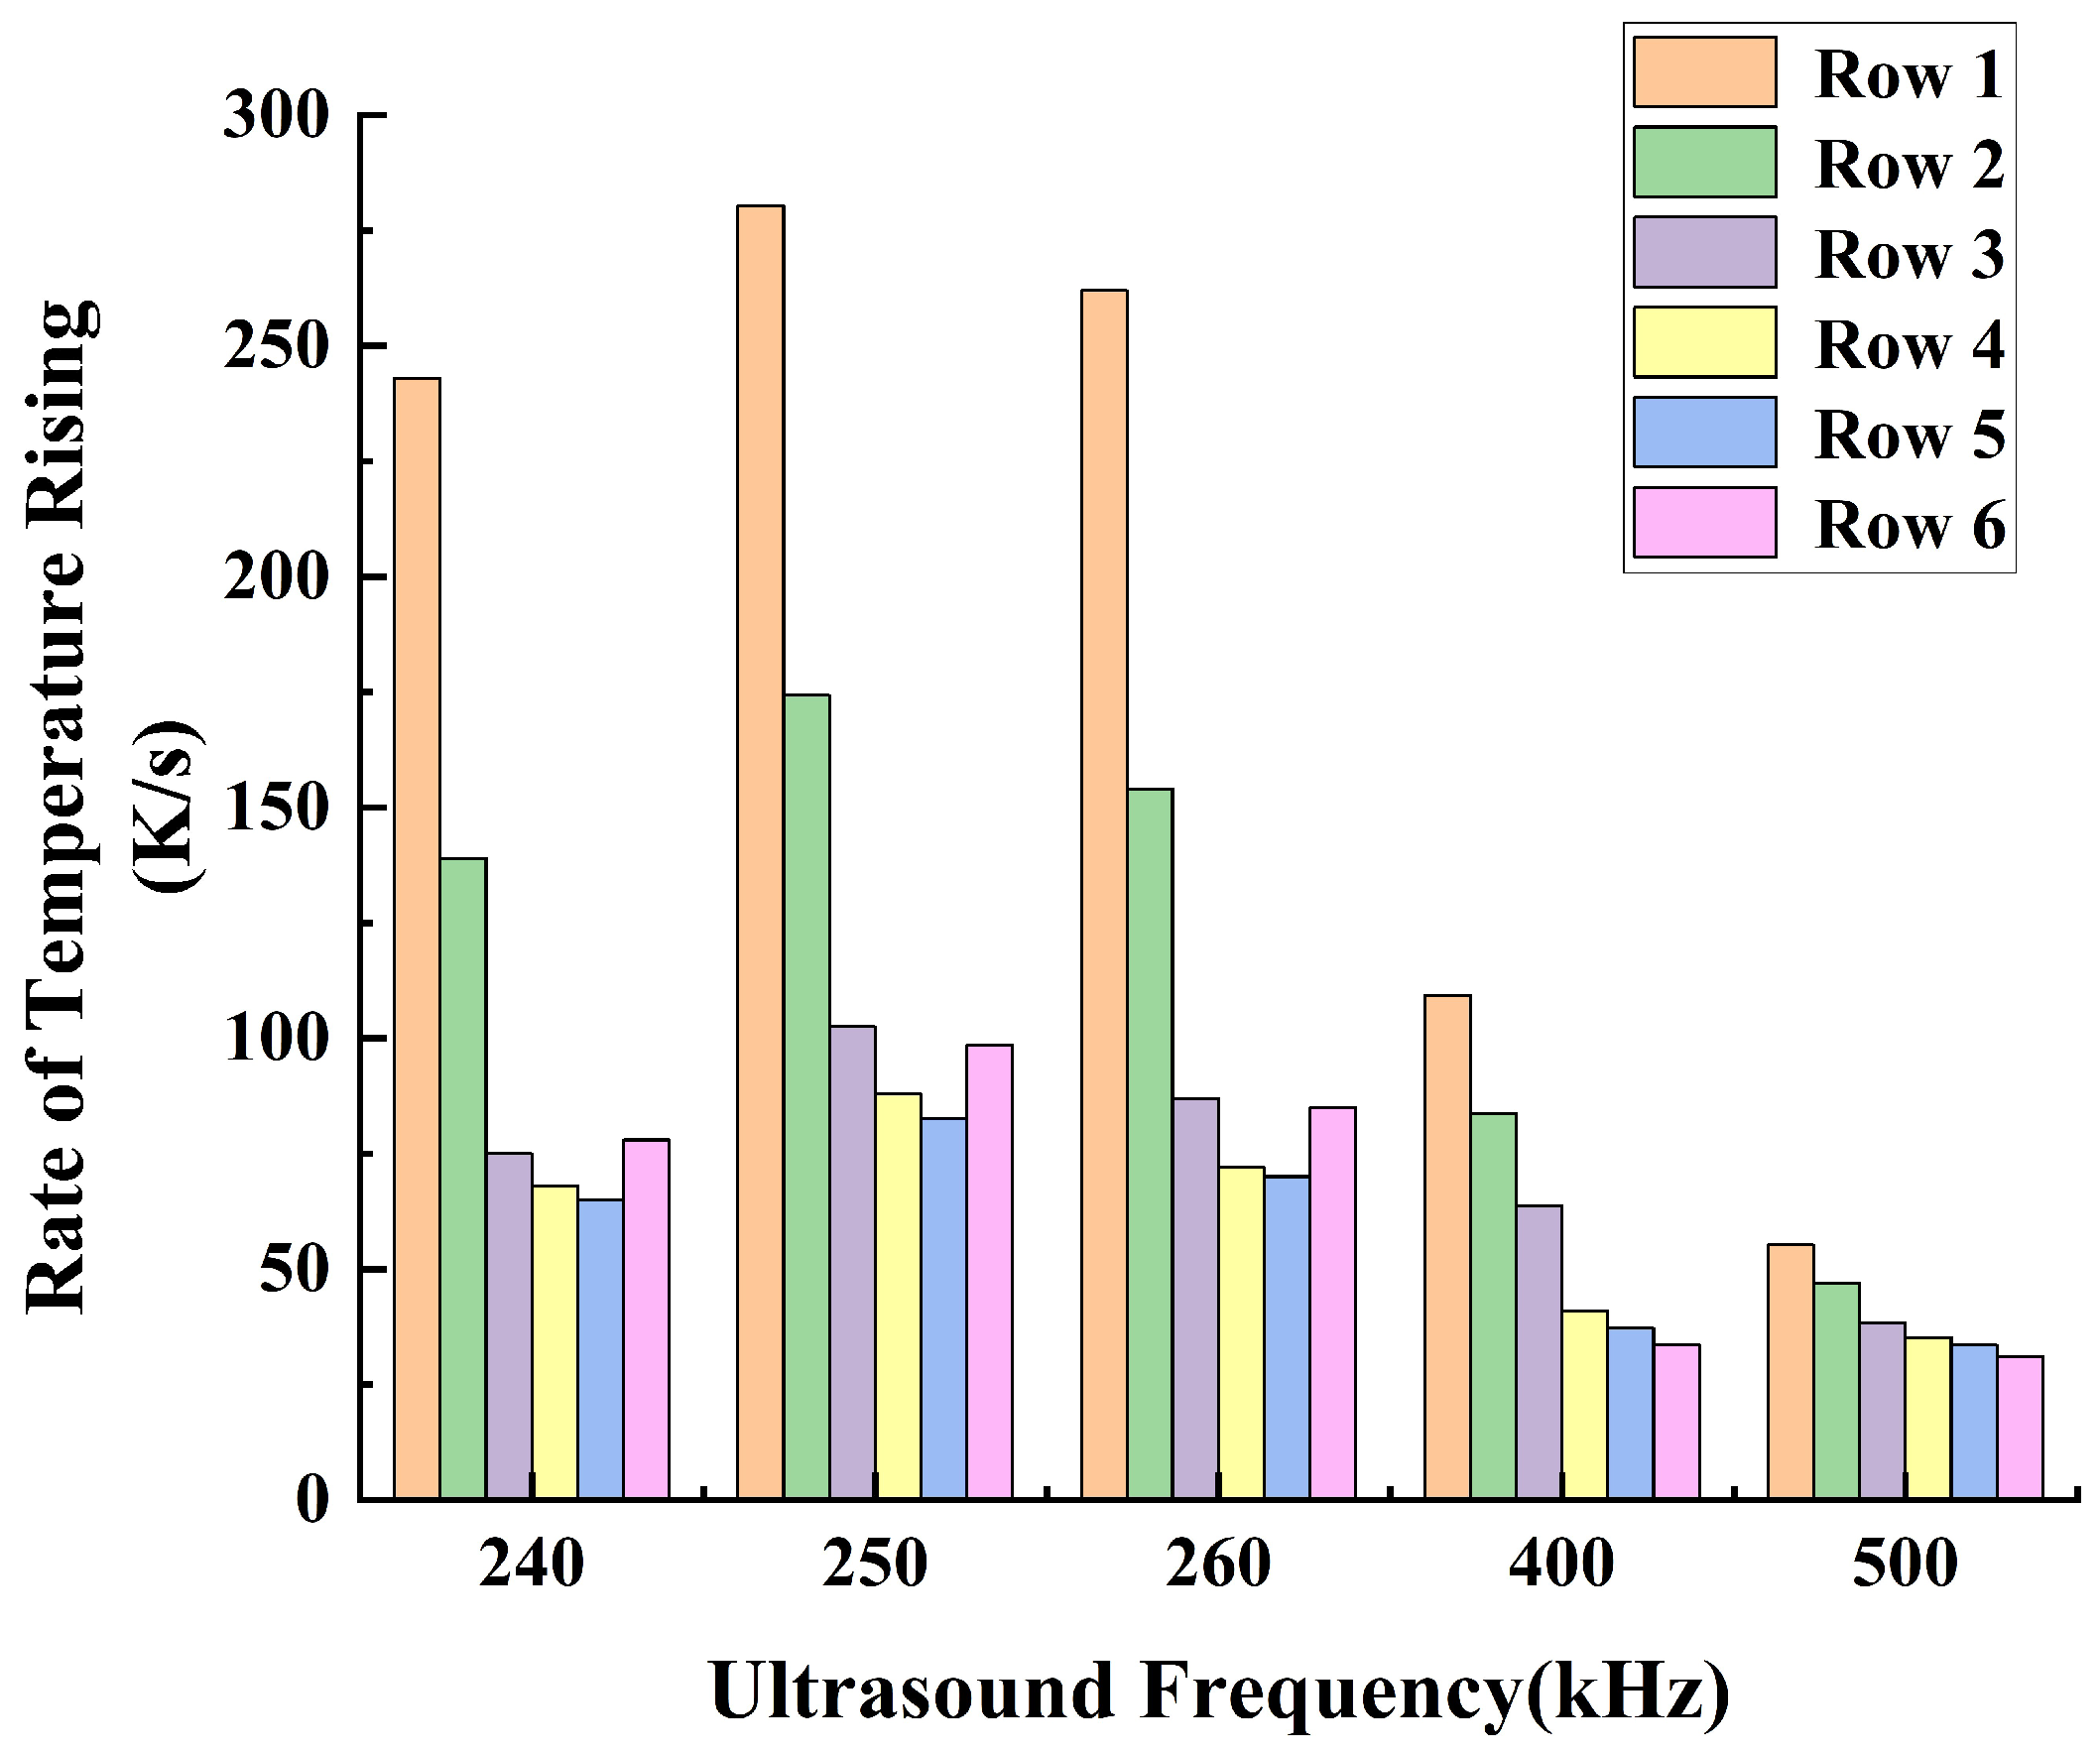
Under the operating conditions discussed in this study, the rate of cavitation thermal effects reaches its maximum at an ultrasound frequency of 250 kHz. At this frequency, the acoustic attenuation in flow and the energy absorption by bubbles reach a balance. When the ultrasound frequency is higher than 250 kHz, the acoustic attenuation is stronger, resulting in a slower temperature rise within the flow domain. Conversely, at a frequency lower than 250 kHz, the acoustic absorption of bubbles becomes weaker, also leading to a slower temperature rise in the flow domain.
(iii)
When the acoustic pressure on the bubble’s surface is above 210 kPa, both the bubble oscillation and the thermal effects of ultrasound cavitation are enhanced significantly. Conversely, when the acoustic pressure on the bubble’s surface is below 210 kPa, the bubble oscillation and thermal effects slightly weaken over time. In order to optimize and control the thermal effect of ultrasound therapy, the ultrasound frequency and amplitude should be carefully chosen based on the targeted bubble cluster.
(iv)
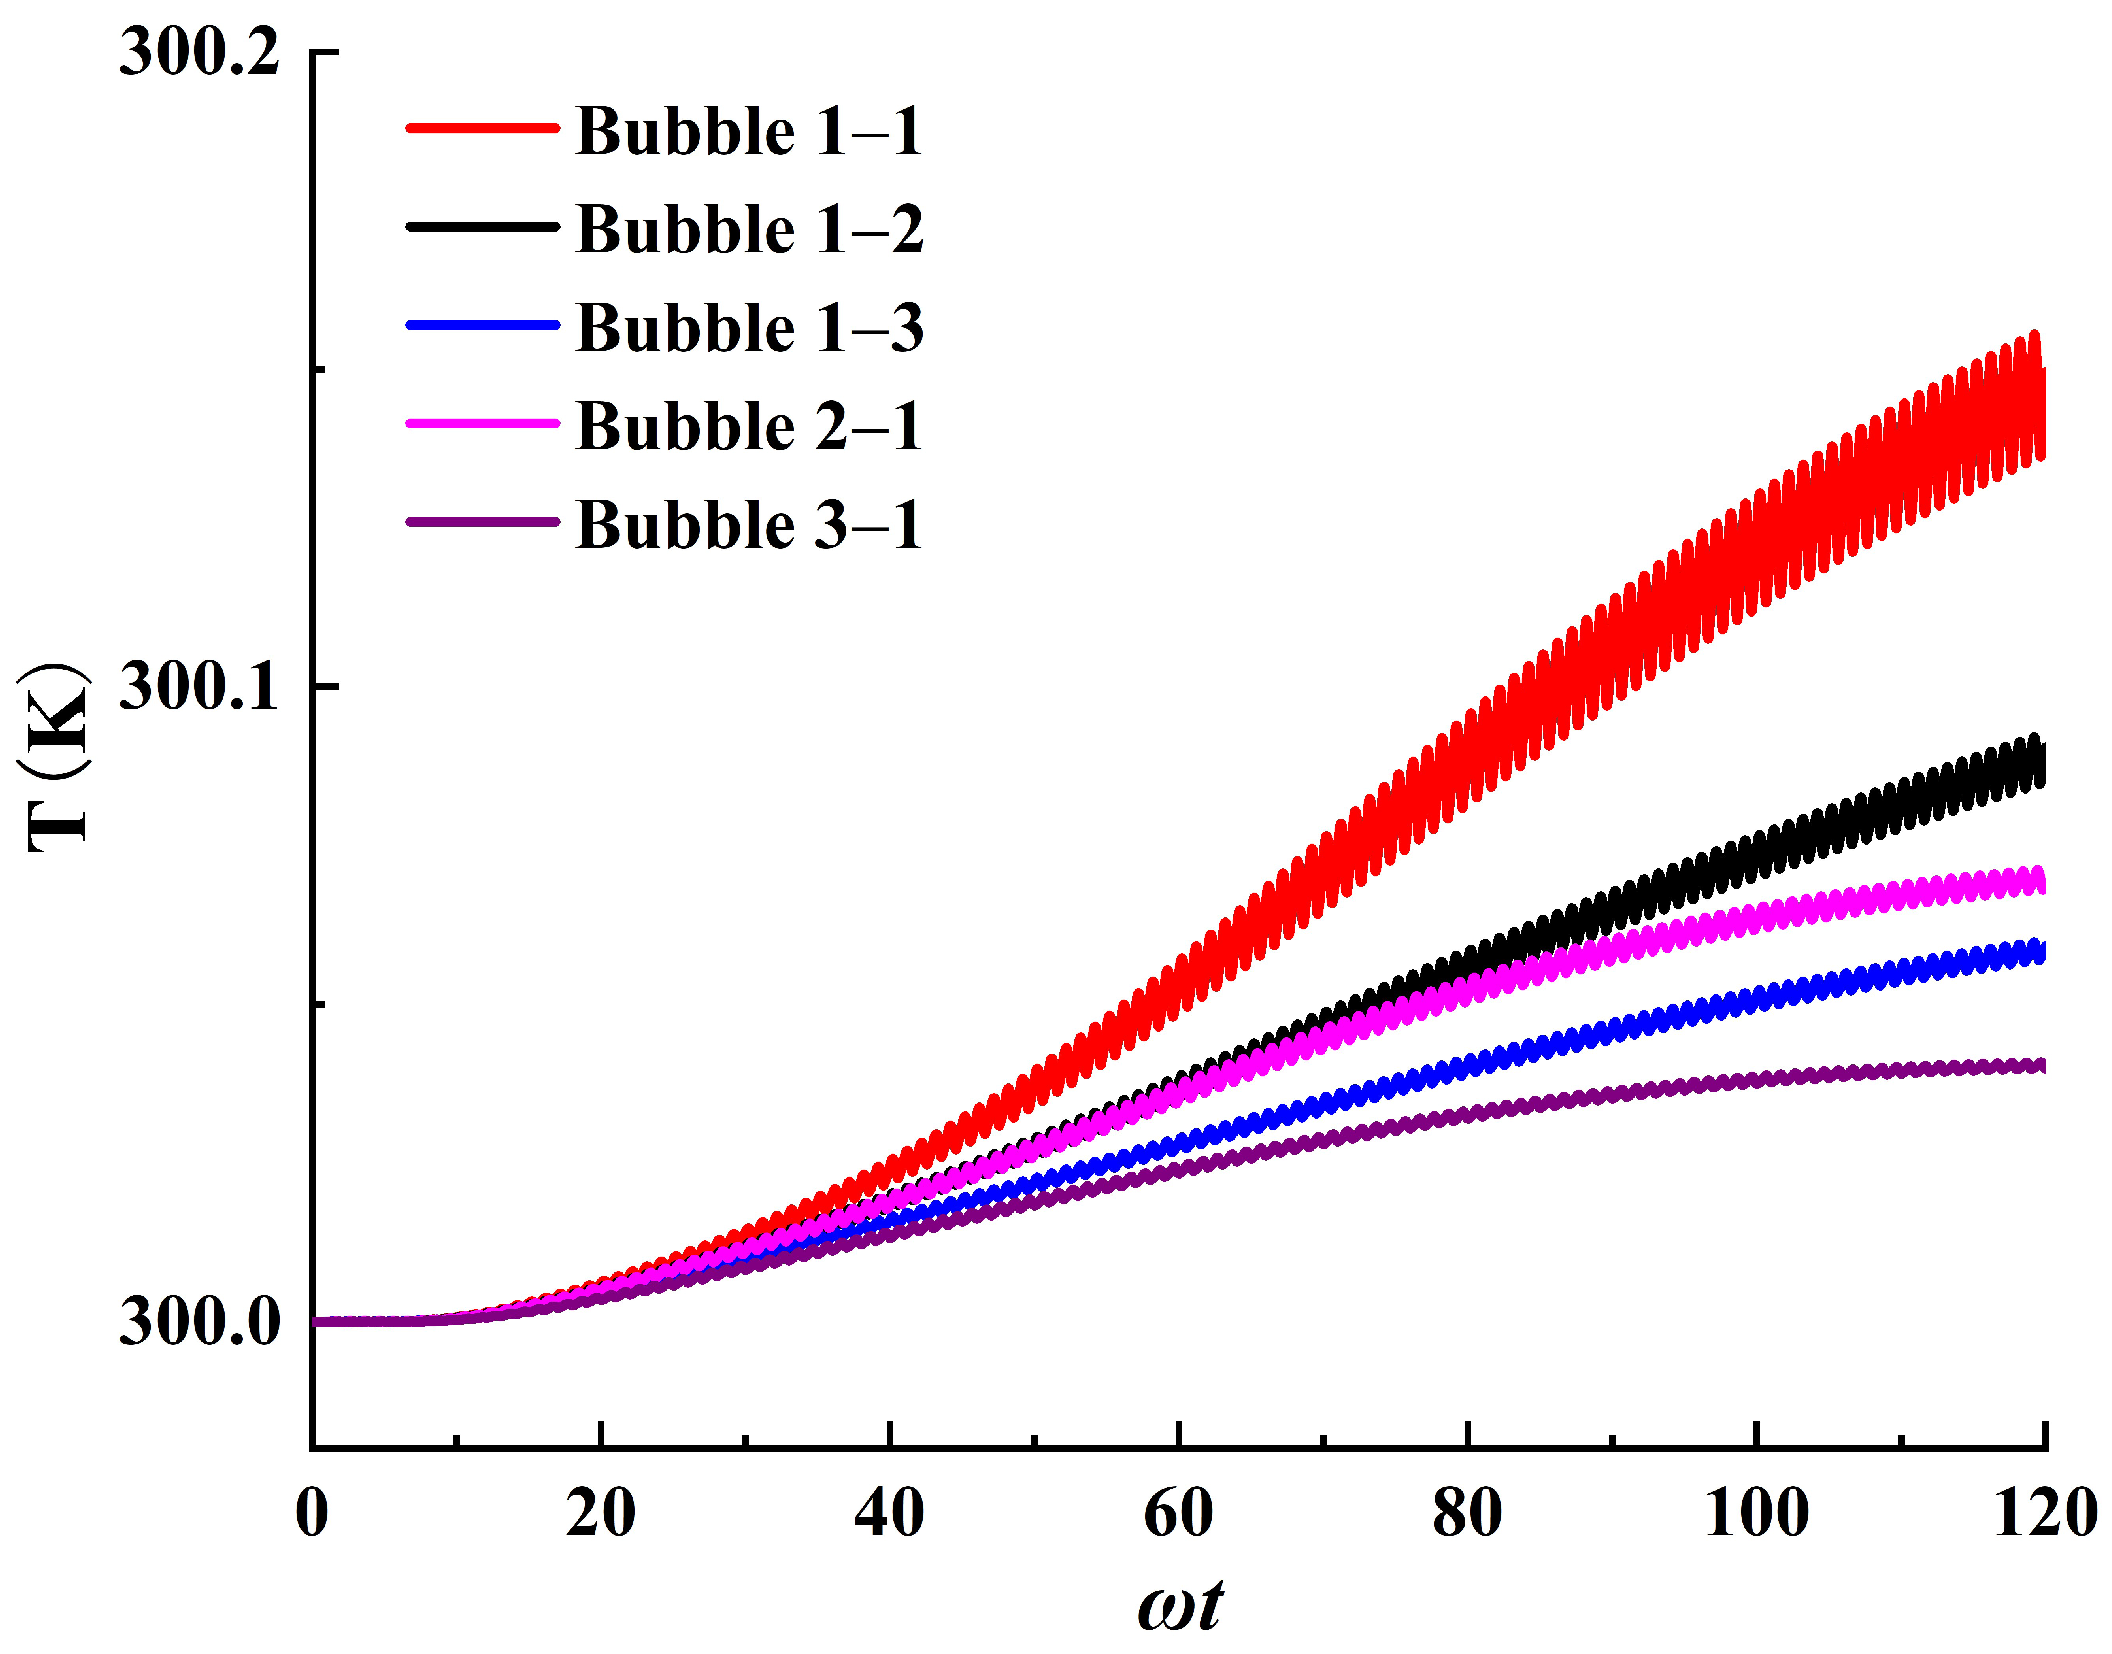
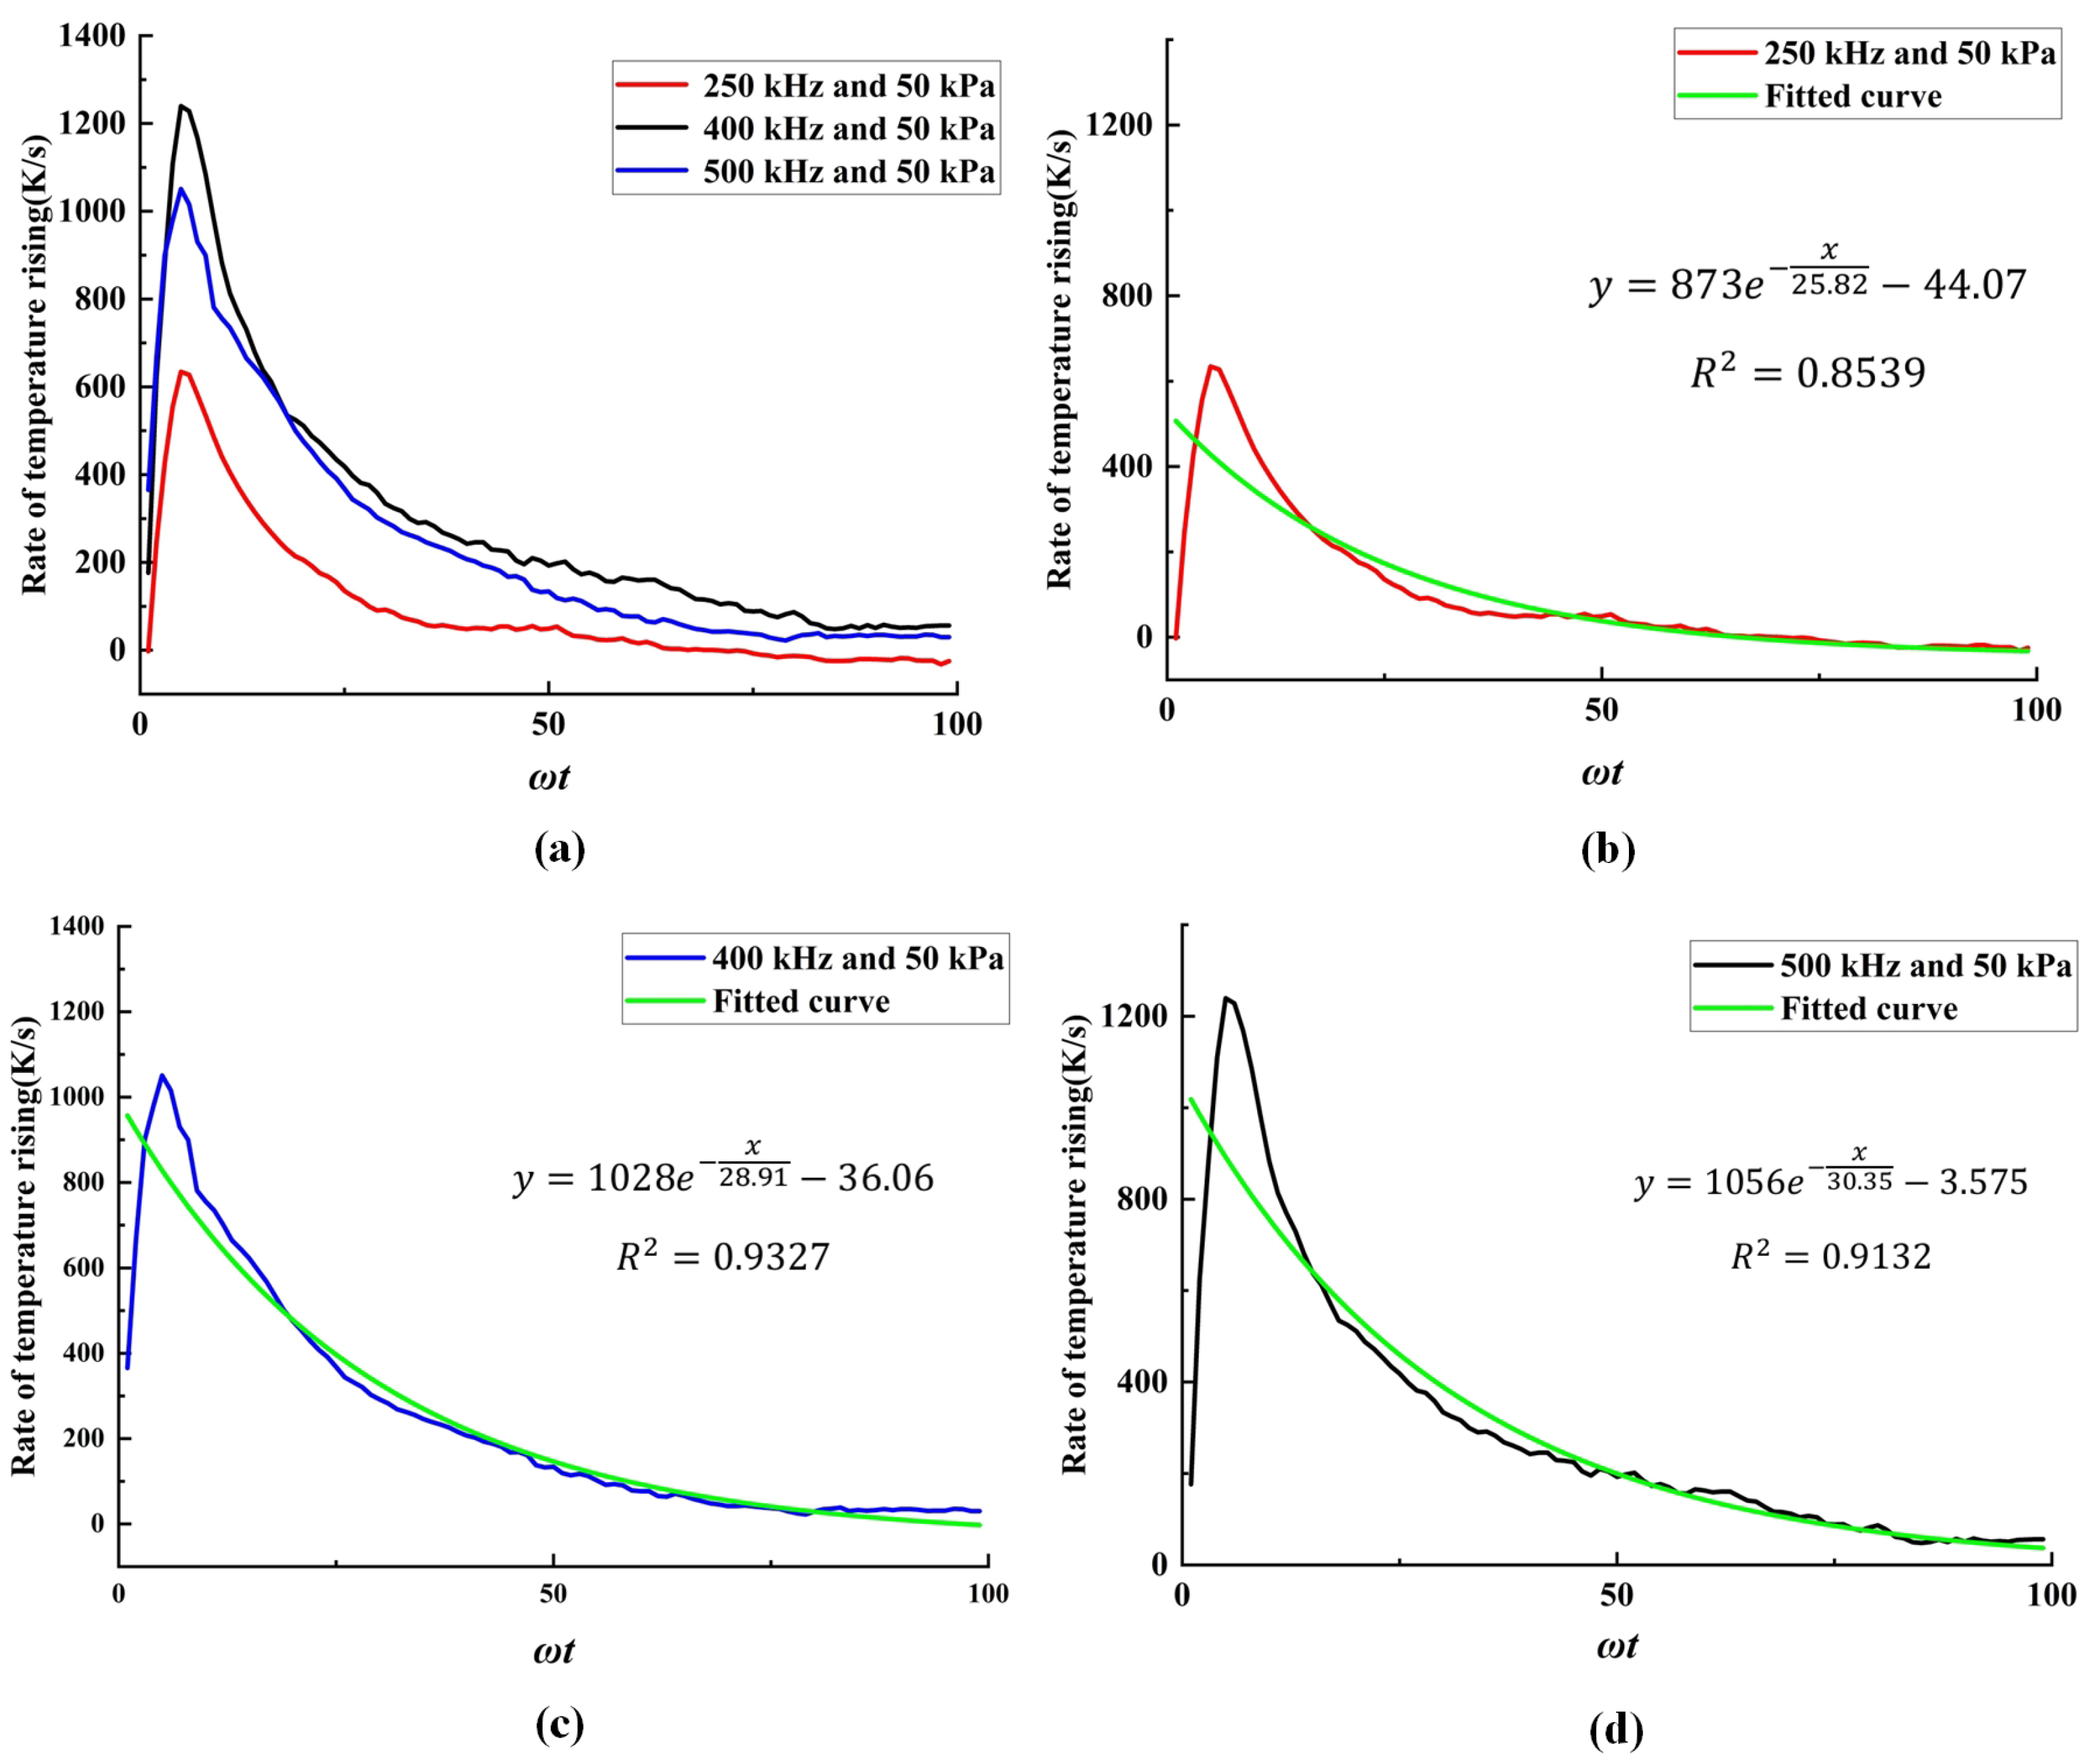
When bubbles start oscillating, a significant temperature rise occurs in the cavitation region, followed by a sharp decrease in the temperature rise rate, eventually stabilizing at a constant rate. Meanwhile, the temperature rise behavior tends to align with the unsteady heat diffusion model of a cylinder. During the stable cavitation process under long−period ultrasound, the bubble can be considered as a heat source with a constant internal temperature, supplying internal energy outward at a constant rate.
Based on the above results, when applying the sound field to control cavitation thermal effects, it is essential to first determine the target’s characteristic frequency and amplitude, and then precisely control the heat generation rate around this operating condition. Meanwhile, the bubble distribution in the simulation is relatively fixed, representing a simplified version of the bubble distribution commonly seen in experiments. Therefore, future analysis will focus on the patterns under various bubble group distributions. Additionally, due to computational cost limitations, this study used a two−dimensional model for analysis, which may have quantitative differences compared to a three−dimensional model. Future work will involve simulation calculations using a three−dimensional model.

Author Contributions

Conceptualization, T.H. and J.Z.; methodology, T.H., J.Z., and J.Y.; software, T.H., J.Z., and Z.G.; validation, T.H., J.Z., and J.Y.; investigation, T.H., J.Z., and J.Y.; resources, J.Z.; writing—original draft preparation, T.H. and J.Z.; writing—review and editing, T.H. and J.Z.; supervision, J.Z; project administration, T.H. and J.Z.; funding acquisition, J.Z. All authors have read and agreed to the published version of the manuscript.

Funding

This research received no external funding.

Data Availability Statement

The original contributions presented in this study are included in the article. Further inquiries can be directed to the corresponding author.

Conflicts of Interest

The authors declare no conflict of interest.

Abbreviations

The following abbreviations are used in this manuscript:
VOFVolume of Fluid
FVMFinite Volume Method

References

  1. Run-Yang, M.; Shu-Yu, L.; Cheng-Hui, W. Methods of study on sound cavitation. Appl. Acoust. 2009, 28, 389–400. [Google Scholar]
  2. Zirong, X. A quantitative study on the collapse mechanics of acoustic cavitation bubbles. Master’s Thesis, Harbin Institute of Technology, Harbin, China, 2021. [Google Scholar]
  3. Guédra, M.; Cornu, C.; Inserra, C. A derivation of the stable cavitation threshold accounting for bubble-bubble interactions. Ultrason. Sonochem. 2017, 38, 168–173. [Google Scholar] [PubMed]
  4. McLaughlan, J.; Rivens, I.; Leighton, T.; Ter Haar, G. A study of bubble activity generated in ex vivo tissue by high intensity focused ultrasound. Ultrasound Med. Biol. 2010, 36, 1327–1344. [Google Scholar] [CrossRef] [PubMed]
  5. Merouani, S.; Hamdaoui, O.; Rezgui, Y.; Guemini, M. Theoretical estimation of the temperature and pressure within collapsing acoustical bubbles. Ultrason. Sonochem. 2014, 21, 53–59. [Google Scholar] [CrossRef] [PubMed]
  6. Coussios, C.C.; Roy, R.A. Applications of acoustics and cavitation to noninvasive therapy and drug delivery. Annu. Rev. Fluid Mech. 2008, 40, 395–420. [Google Scholar]
  7. Vivino, A.A.; Boraker, D.K.; Miller, D.; Nyborg, W. Stable cavitation at low ultrasonic intensities induces cell death and inhibits 3H-TdR incorporation by Con-A-stimulated murine lymphocytes in vitro. Ultrasound Med. Biol. 1985, 11, 751–759. [Google Scholar] [CrossRef]
  8. Hill, C.R.; Bamber, J.C.; ter Haar, G.R. Physical Principles of Medical Ultrasonics; John Wiley & Sons: Hoboken, NJ, USA, 2004. [Google Scholar]
  9. Wu, J. Temperature rise generated by ultrasound in the presence of contrast agent. Ultrasound Med. Biol. 1998, 24, 267–274. [Google Scholar] [CrossRef]
  10. Chavrier, F.; Chapelon, J.; Gelet, A.; Cathignol, D. Modeling of high-intensity focused ultrasound-induced lesions in the presence of cavitation bubbles. J. Acoust. Soc. Am. 2000, 108, 432–440. [Google Scholar] [CrossRef]
  11. Coussios, C.; Farny, C.; Ter Haar, G.; Roy, R. Role of acoustic cavitation in the delivery and monitoring of cancer treatment by high-intensity focused ultrasound (HIFU). Int. J. Hyperth. 2007, 23, 105–120. [CrossRef]
  12. Chen, W.S.; Lafon, C.; Matula, T.J.; Vaezy, S.; Crum, L.A. Mechanisms of lesion formation in high intensity focused ultrasound therapy. Acoust. Res. Lett. Online 2003, 4, 41–46. [Google Scholar]
  13. Holt, R.G.; Roy, R.A. Measurements of bubble-enhanced heating from focused, MHz-frequency ultrasound in a tissue-mimicking material. Ultrasound Med. Biol. 2001, 27, 1399–1412. [Google Scholar] [CrossRef] [PubMed]
  14. Chapelon, J.; Dupenloup, F.; Cohen, H.; Lenz, P. Reduction of cavitation using pseudorandom signals [therapeutic US]. IEEE Trans. Ultrason. Ferroelectr. Freq. Control. 1996, 43, 623–625. [Google Scholar] [CrossRef]
  15. Pond, J.B. The role of heat in the production of ultrasonic focal lesions. J. Acoust. Soc. Am. 1970, 47, 1607–1611. [Google Scholar] [CrossRef]
  16. Rae, J.; Ashokkumar, M.; Eulaerts, O.; von Sonntag, C.; Reisse, J.; Grieser, F. Estimation of ultrasound induced cavitation bubble temperatures in aqueous solutions. Ultrason. Sonochem. 2005, 12, 325–329. [Google Scholar] [CrossRef]
  17. Misik, V.; Riesz, P. Free radical formation by ultrasound in organic liquids: A spin trapping and EPR study. J. Phys. Chem. 1994, 98, 1634–1640. [Google Scholar] [CrossRef]
  18. Zilonova, E.; Solovchuk, M.; Sheu, T. Simulation of cavitation enhanced temperature elevation in a soft tissue during high-intensity focused ultrasound thermal therapy. Ultrason. Sonochem. 2019, 53, 11–24. [Google Scholar] [CrossRef]
  19. Özsoy, Ç.; Lafci, B.; Reiss, M.; Deán-Ben, X.L.; Razansky, D. Real-time assessment of high-intensity focused ultrasound heating and cavitation with hybrid optoacoustic ultrasound imaging. Photoacoustics 2023, 31, 100508. [Google Scholar] [CrossRef]
  20. Wu, H.; Zheng, H.; Li, Y.; Ohl, C.D.; Yu, H.; Li, D. Effects of surface tension on the dynamics of a single micro bubble near a rigid wall in an ultrasonic field. Ultrason. Sonochem. 2021, 78, 105735. [Google Scholar] [CrossRef] [PubMed]
  21. Wang, X.c.; Bai, X.r.; Cheng, H.y.; Ji, B. Temporal and spatial characteristics of monopole acoustic energy dominated by unsteady thermodynamic cavitating flow. J. Hydrodyn. 2021, 33, 867–871. [Google Scholar] [CrossRef]
  22. Koch, M.; Lechner, C.; Reuter, F.; Köhler, K.; Mettin, R.; Lauterborn, W. Numerical modeling of laser generated cavitation bubbles with the finite volume and volume of fluid method, using OpenFOAM. Comput. Fluids 2016, 126, 71–90. [Google Scholar] [CrossRef]
  23. Osterman, A.; Dular, M.; Sirok, B. Numerical simulation of a near-wall bubble collapse in an ultrasonic field. J. Fluid Sci. Technol. 2009, 4, 210–221. [Google Scholar]
  24. Ma, X.; Huang, B.; Li, Y.; Chang, Q.; Qiu, S.; Su, Z.; Fu, X.; Wang, G. Numerical simulation of single bubble dynamics under acoustic travelling waves. Ultrason. Sonochem. 2018, 42, 619–630. [Google Scholar]
  25. Tian, L.; Zhang, Y.X.; Yin, J.Y.; Lv, L.; Zhang, J.Y.; Zhu, J.J. Study on the liquid jet and shock wave produced by a near-wall cavitation bubble containing a small amount of non-condensable gas. Int. Commun. Heat Mass Transf. 2023, 145, 106815. [Google Scholar]
  26. Keller, J.B.; Miksis, M. Bubble oscillations of large amplitude. J. Acoust. Soc. Am. 1980, 68, 628–633. [Google Scholar] [CrossRef]
  27. Rahmatizadeh, B.; Beheshti, M.T.H.; Azadegan, M.; Najafi, M. Stability analysis and sliding mode control of a single spherical bubble described by Keller–Miksis equation. Int. J. Dyn. Control. 2021, 9, 1757–1764. [Google Scholar]
  28. Stricker, L.; Prosperetti, A.; Lohse, D. Validation of an approximate model for the thermal behavior in acoustically driven bubbles. J. Acoust. Soc. Am. 2011, 130, 3243–3251. [Google Scholar] [PubMed]
  29. Crank, J. The Mathematics of Diffusion; Oxford University Press: Oxford, UK, 1979. [Google Scholar]
Figure 1. The refined grid surrounding the bubble.
Processes 13 00951 g001
Figure 2. Grid independence validation comparison chart.
Processes 13 00951 g002
Figure 3. Comparison of the radius variation between the simulation results and the numerical solution of the K−M equation.
Processes 13 00951 g003
Figure 4. Comparison of the maximum temperature variation in the bubble between the simulation and numerical solutions.
Processes 13 00951 g004
Figure 5. Comparison of the radius variation between the two−dimensional and three−dimensional models.
Processes 13 00951 g005
Figure 6. The numerical setup with detail of the flow field and bubbles arrangement.
Processes 13 00951 g006
Figure 7. The distribution of the maximum changes in bubble radius during the initial and last stages of cavitation under different acoustic pressure amplitudes.
Processes 13 00951 g007
Figure 8. Comparison of endured P m a x and R m a x / R 0 for Bubble 2–1.
Processes 13 00951 g008
Figure 9. Diagram of total volume variations of the gas phase at different ultrasound frequencies.
Processes 13 00951 g009
Figure 10. The average R m a x / R 0 values for each row of bubbles when the acoustic pressure amplitude is 50 kPa.
Processes 13 00951 g010
Figure 11. The distribution of the maximum changes in bubble radius during the initial stages of cavitation under different ultrasound frequencies and acoustic pressure amplitudes.
Processes 13 00951 g011
Figure 12. The average R m a x / R 0 values for each row of bubbles when the acoustic pressure amplitude is 100 kPa.
Processes 13 00951 g012
Figure 13. Temperature variation diagram for the bubble domain under conditions of 250 kHz frequency and 100 kPa sound pressure amplitude.
Processes 13 00951 g013
Figure 14. The distribution of bubble oscillation amplitude variations and temperature rise rates under conditions of 250 kHz frequency and 50 kPa acoustic pressure amplitude.
Processes 13 00951 g014
Figure 15. The average temperature rise rate for each row of bubbles when the acoustic pressure amplitude is 50 kPa.
Processes 13 00951 g015
Figure 16. The temperature changes at the centers of Bubbles 1–3 at different ultrasound frequencies under an acoustic pressure amplitude of 50 kPa.
Processes 13 00951 g016
Figure 17. The average temperature rise rate for each row of bubbles when the acoustic pressure amplitude is 100 kPa.
Processes 13 00951 g017
Figure 18. The distribution of bubble domain temperature rise rates over 100 ultrasound cycles under different ultrasound frequencies and acoustic pressure amplitudes.
Processes 13 00951 g018
Figure 19. The temperature rise rate of the liquid phase at different ultrasound frequencies under an acoustic pressure amplitude of 50 kPa and fitted curve.
Processes 13 00951 g019
Table 1. Model calculation parameters.
ModelTotal Cell NumCell Num in Bubble RadiusTime Step Size
3D single bubble600 w20 2 × 10 9
2D bubble cluster680 w20 1 × 10 9
Table 2. Model parameters.
Quantity (Unit)SymbolValue
adiabatic exponent (−) γ 1.40
bubble initial radius (μm) R 0 10
initial temperature (K) T 0 300
liquid phase dynamic viscosity (Pa·s)μ10.03645
liquid phase reference density (kg/m3) ρ 1 1087
atmospheric pressure (kPa) P 0 101.3
saturated vapor pressure (Pa) P v 2440
surface tension (kg/s2) σ 0.076
pressure amplitude (kPa) P a 80
pressure frequency (kHz) ω 0 250
Table 3. Calculation parameters for the example.
ParameterExample
Pressure amplitude (kPa)50/100
Pressure frequency (kHz)100/200/250/400/500
Table 4. The total bubble volume change rate after 200 ultrasound cycles under different ultrasound conditions.
Volume Change200 kHz250 kHz500 kHz
50 kPaDecrease 10%Decrease 8%Decrease 5%
100 kPaIncrease 5%Increase 5%Increase 2%
Disclaimer/Publisher’s Note: The statements, opinions and data contained in all publications are solely those of the individual author(s) and contributor(s) and not of MDPI and/or the editor(s). MDPI and/or the editor(s) disclaim responsibility for any injury to people or property resulting from any ideas, methods, instructions or products referred to in the content.

