1. Introduction
As the basic raw-material industry in the national economy, the steel industry plays an important role in the economic development of a country [
1]. China is a major steel producer, and the energy consumed by its steel industry accounts for more than 16% of the country’s total energy consumption [
2]. Sintering is one of the most important steps in the modern steelmaking process, accounting for 10–20% of the total energy consumption in the steelmaking process [
3,
4], and is the second most energy-intensive process after ironmaking. In the sintering process, about half of the heat energy is carried away by the flue gas from the sintering process as well as by the exhaust gas of the annular cooler. Among them, the waste heat carried away by the flue gas accounts for 13–23% of the total energy consumed during the sintering process, whereas the waste heat carried away by the exhaust gas from the annular cooler accounts for 20–25% of the total energy consumed during the sintering process [
5]. These losses not only increase the wastage of heat resources, but also cause environmental pollution. Therefore, studying the cooling process of hot sintered ore and the recovery of waste heat is of great significance to reducing the energy consumption during steelmaking [
6,
7,
8].
The annular cooler is a key piece of equipment for cooling high-temperature ore [
9]. The high-temperature sintered ore rotates at a uniform speed in the horizontal direction along with the trolley [
10]. The cooling gases enter the bed layer through the grille plate under the trolley, so that the sintering ore gradually cools to the targeted temperature. Meanwhile, the cooling gas that was heated after heat exchange is collected and sent to the residual heat boiler [
11]. As China’s steel industry faces increasingly stringent requirements for energy conservation and emission reduction, how to improve the cooling efficiency of the annular cooler and increase the utilization of waste heat have become urgent issues requiring immediate attention [
12,
13].
In response to the abovementioned challenges, a large number of scholars have studied the cooling of sintered ore and achieved important breakthroughs. In terms of numerical simulation, Caputo et al. [
14] established a stable-stabilized state model of sintering ore’s cooling process and studied the impacts of initial temperatures of ore and cooling air on the temperature field. Plagagge and others [
15,
16] proposed a two-dimensional heat exchange model and verified the proposed model through the data of sintering ore to prove the reliability of the model. Subsequently, Caputo and Plagagge [
17] reduced the total cost of sintering and cooling beds and obtained the optimum values for the movement speed of the cooling bed, air flow, and the width, length, and thickness of the cooling bed. Jangu et al. [
18] proposed a simple three-dimensional model to simulate the heat transfer and turbulence processes in an annular cooler. Leong et al. [
19] used the software package of Fluent 12.1 to simulate the gas flow field and sintering temperature field under different porosity distributions based on the porous medium-local heat balance theory. These scholars have achieved certain results in the study of annular coolers; however, the research objects were mainly concentrated on simplified trolley models. This means that they have focused mainly on the heat transfer mechanism using static models. As such, their experiments can only be performed under a single specified cooling condition, which cannot correspond to the actual operating conditions of the annular cooler and makes it difficult to provide accurate guidance for annular cooler optimization. The area of the trolley is actually in a dynamic process of continuous rotation, and the trolley will be cooling down under the impact of different temperatures and flow rates of air when passing through different wind areas [
20]. There are only a handful of studies on the three-dimensional dynamic simulation of the entire annular cooler. Therefore, it is necessary to perform a three-dimensional dynamic simulation on the overall annular cooler to understand the full dynamics of the process.
Starting from the source of heat exchange in the annular cooler, the present paper adopts the “dynamic-static combination” method (sliding mesh) to fit the actual working conditions and simulates the feeding process of the annular cooler through special programming to realize the simulation of the continuous operation and the cooling of high-temperature sintered ore in the annular cooler [
21]. In the present paper, the trolley area is simplified as a porous medium, and the sliding mesh method is applied to this area. The rotational speed of the porous medium is set to be consistent with the rotational speed of the trolley. Then, UDF is applied to the feed section to set the temperature of the porous medium rotating through the feed surface to 1073 K. By simulating the cooling process of sintered ore and fluid-solid heat transfer using the abovementioned method, a lot of data are obtained that cannot be obtained using previously reported simulation methods, such as the temperature conditions inside the annular cooler as a whole and the flow and temperature conditions at each outlet. These are important reference data that are needed for the optimum design of annular coolers. Moreover, more accurate experimental results can be obtained by performing the optimization of the simulation, which is of great significance for optimizing the thermal parameters of the annular cooler and guiding its structural design.
2. Fluent Modeling
2.1. Physical Model
Taking the annular cooler used in actual production by China Steel Equipment and Engineering Corporation (Beijing, China) as the research object, the cooling process of sintered ore is shown in
Figure 1. The high-temperature sintered ore, produced by the sintering machine, was loaded onto a trolley located at the feeding point of the annular cooler. The trolley moved in a counterclockwise direction to the outlet to complete the cooling process. The cooling air was supplied by the bellows under the trolley and blew through the trolley and the sintered ore [
10]. The cold air was heated by the hot sintered ore and flowed to the hood. The hood collected the gas and transported the high-temperature gas outwards through the hood port for the recovery of heat. The temperature of the sintered ore in the first and second sections was relatively high. Therefore, the gas collected from the wind-hood was sent to the waste heat boiler, whereas the utilized exhaust gas was circulated back to the second and third section bellows. The gas collected in the third section was blown into the first section bellows through the blower, thereby completing the waste heat recovery of the gas. The temperature of the sintered ore in the fourth and fifth stages decreased consistently, and the recovered heat was reduced. The air at normal temperature was blown in by the bellow at the bottom of the trolley, and the hot gas generated was directly discharged to the outside.
Figure 2 shows the schematic of the structure of the annular cooler. The model included five hood outlets. To avoid crossflow of the recycled gas, a partition was installed between every two adjacent hoods. The bellows of the annular cooler were divided into five sections (a total of 22 bellows, 5 each in the first to second sections, and 4 each in the third to fifth sections).
The annular cooler was composed of dozens of closely connected trolleys arranged in a ring. The cooling pattern of the sintered ore in each trolley was almost the same, and therefore the trolley area was simplified into a fixed material layer area, as shown in
Figure 2. Since the pore space between sintered ores in the annular cooler was large and the ore particle size was small, the process of heat exchange between the cooling medium and the ore when passing through the material layer was relatively complicated. Generally, the material layer was simplified to a working condition with uniform particle size and average distribution [
22]. The material layer was approximated to a porous medium region, while the process of cooling gas flowing through the material layer was approximated to the process of fluid passing through the porous medium region [
23].
The annular cooler has a height of 21.8 m, a center diameter of 38 m, a layer thickness of 1.5 m, a layer width of 3.4 m, and an effective cooling area of 360 m2.
Method of Continuous Feeding
Based upon the structure shown in
Figure 2, the present paper applied the sliding mesh function to the material layer area to simulate the actual operation of the trolley. The rotational speed of the material layer area was set to be 3600 s·r
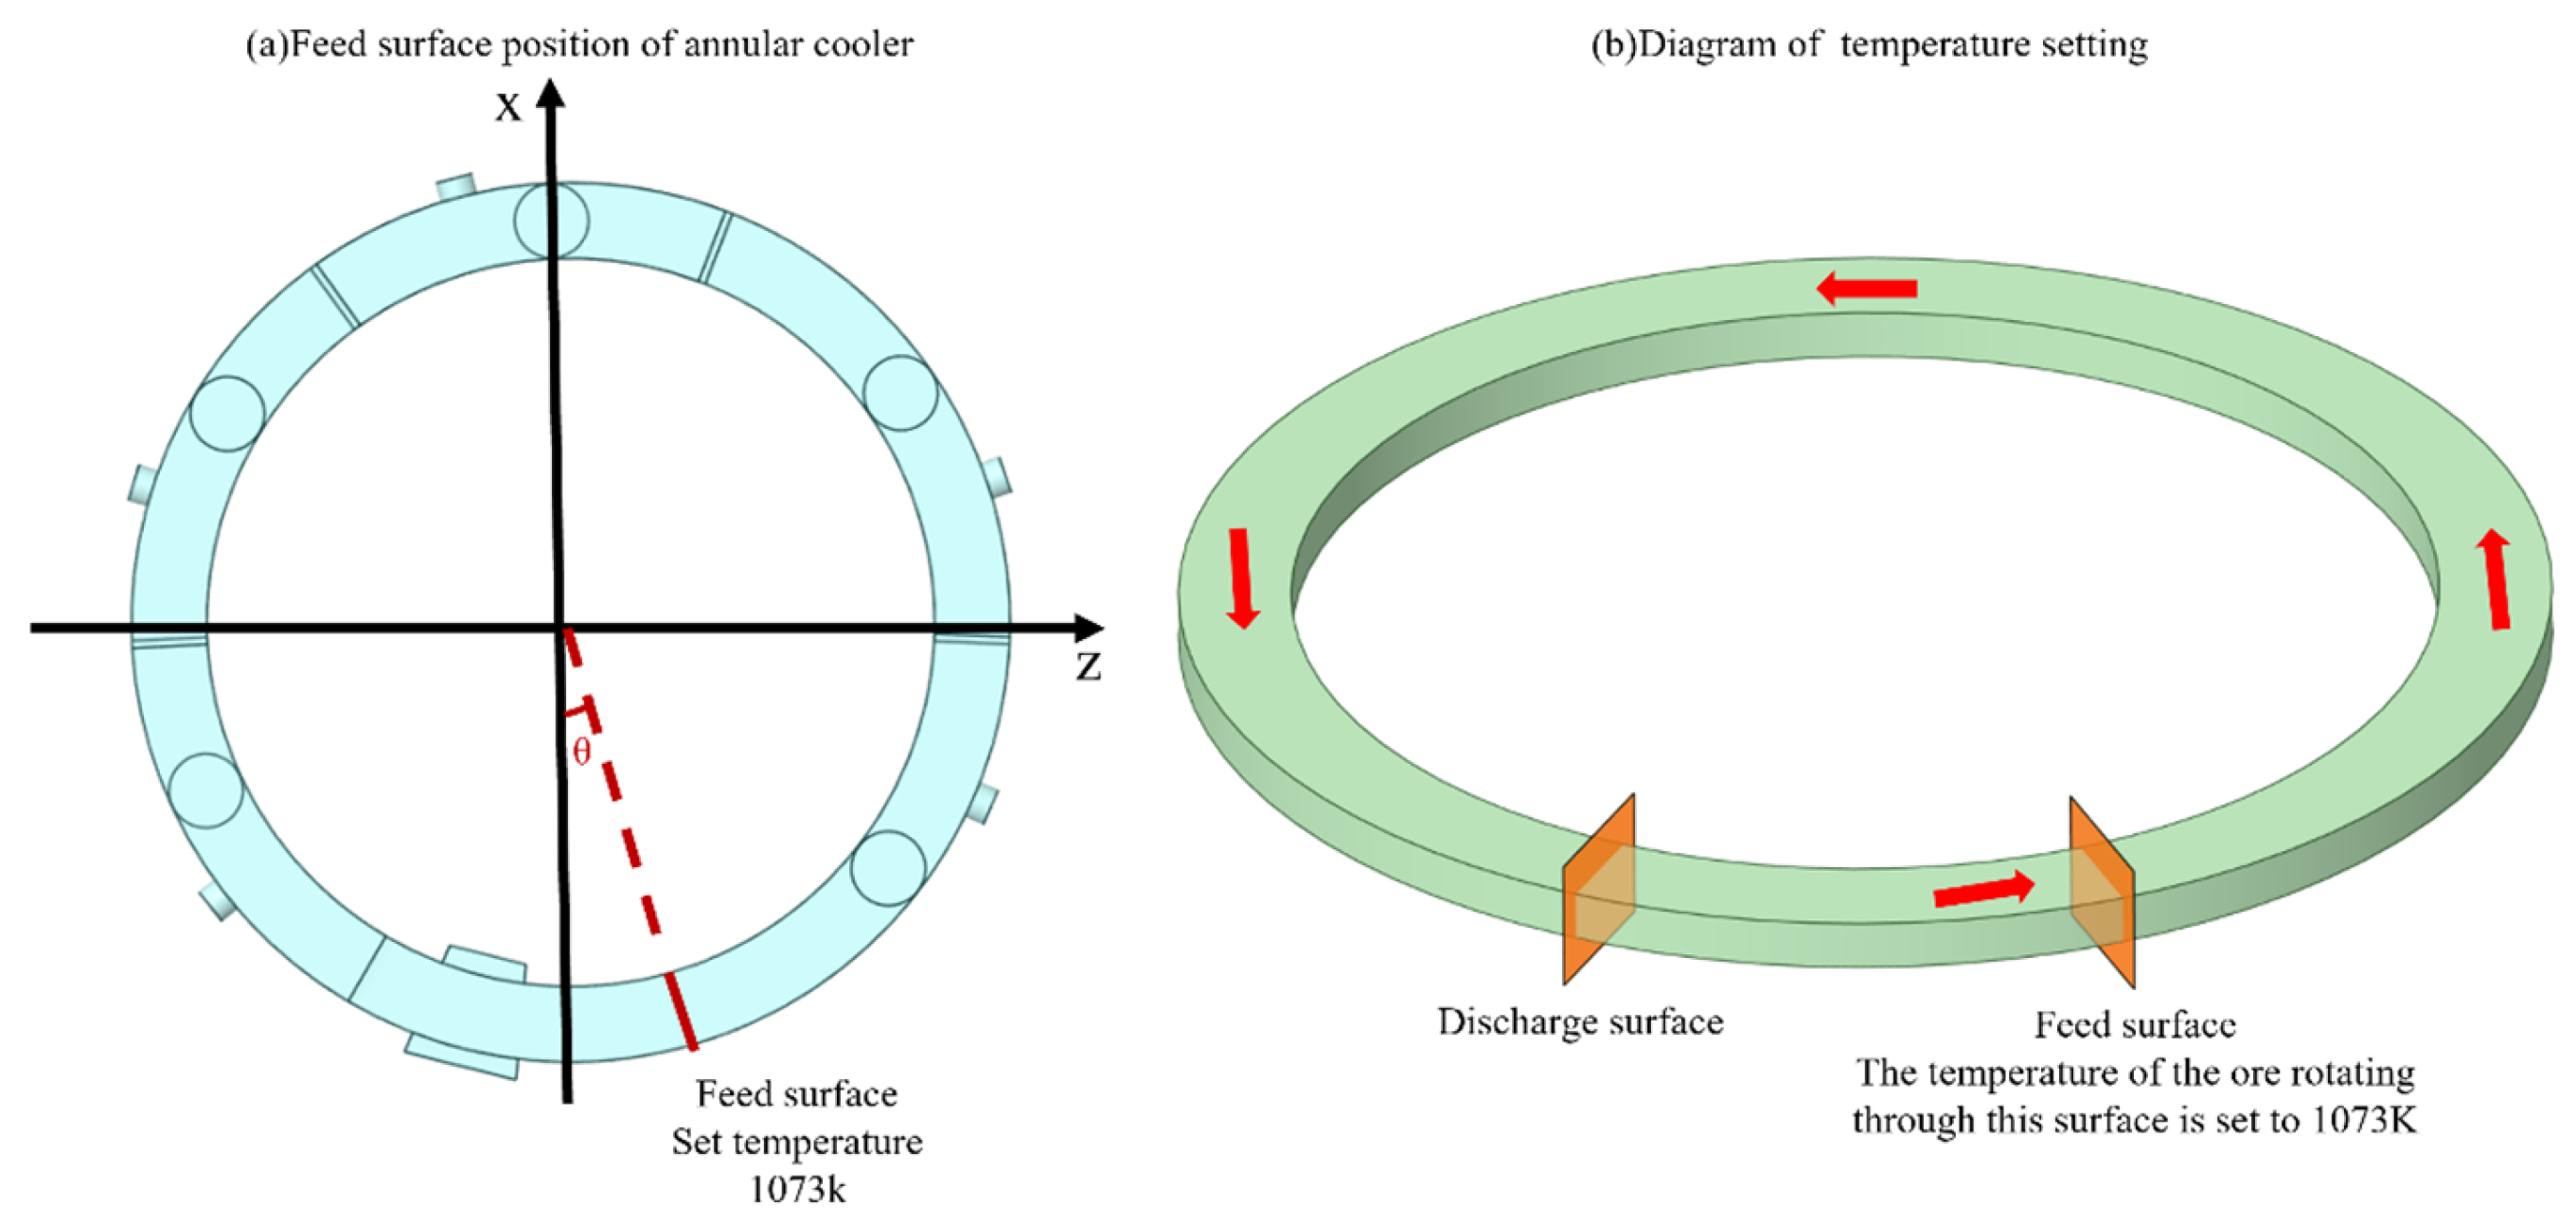
−1, which was consistent with the actual running speed of the trolley. The rotating material layer was dynamically heated through a user defined function (UDF) at the feeding point of the porous medium area. The continuous feeding process is shown in
Figure 3, in which the red arrow indicates the direction of rotation. The rotating porous medium continuously passed through the feed surface, whereas the porous medium passing through the feed surface was heated to 1073 K by the UDF. By combining sliding mesh with UDF, the actual feeding process of the annular cooler could be simulated, which ensured the use of transient numerical simulation methods to simulate the entire cooling process of the sintered ore from the inlet to the outlet of the annular cooler.
The design was based on a 360 m2 annular cooler with a center diameter of 38 m and a height of 21.8 m. The operation of the annular cooler was simplified to uniform circular motion, whereas the thickness of the material layer was 1.5 m and the rotation time was 3600 s.
2.2. Mathematical Model
2.2.1. Turbulence Models
A typical conservation equation to represent mass, energy, momentum, and species transfer is given by (1):
where
is the fluid density (kg·m
−3),
is the velocity (m·s
−1),
is the generalized variable,
is the diffusion coefficient, and
is the source term.
The effect of turbulence is represented by the standard
model, as given by Equations (2) and (3):
where
is the turbulence kinetic energy,
is the rate of dissipation of turbulence kinetic energy,
is the turbulence kinetic energy generated due to mean velocity gradient,
is the turbulence kinetic energy generated due to buoyancy,
,
, and
are constants with values of 1.44, 1.92, and 0.09, respectively, and
and
are the turbulent Prandtl numbers for
and
, with values of 1.0 and 1.3, respectively.
The standard
model relies on the wall function to simplify the near-wall treatment, assuming that the flow is in a fully turbulent state. However, in the viscous bottom and transition zones, where the velocity and temperature gradients vary significantly, the logarithmic law fails, which may lead to biased heat transfer predictions. The inlet cooling air flow rate of the annular cooler is 127.593 kg·s
−1, the outlet flow rate is around 100 kg·s
−1, and the internal structure of the annular cooler is relatively complex; at such a high flow rate, we assume that it is a completely turbulent state [
16]. Therefore, the standard
k-ε turbulence model is still used in this paper.
2.2.2. Porous Media Model
There were many tiny gaps in the sintered ore, whereas most of the pores were interconnected. To investigate the heat transfer characteristics of gas passing through the sintered ore, the present paper adopted a porous medium model and simplified the sintered ore into a porous medium [
24]. The viscous resistance coefficient and inertial resistance coefficient in porous media is calculated by the Ergun equation [
25], which is given by Equation (4):
From Equation (4), the corresponding viscous resistance coefficient can be calculated, as given by Equation (5):
The corresponding inertial drag coefficient is given by Equation (6):
where
is the pressure loss,
is the thickness of the material layer,
is the viscosity,
is the average particle size of the sintered ore,
is the porosity,
is the fluid velocity,
represents the difficulty of fluid flow, and
represents the additional resistance caused by the accelerated motion of the fluid in the flow process.
2.2.3. Non-Equilibrium Thermodynamic Model
Due to the large difference in the thermal conductivities of sintered ore and cooling gas, there was always a temperature difference between the sintered ore and the cooling gas. Due to this reason, the assumption of local thermodynamic equilibrium did not hold [
24]. In this paper, the local non-equilibrium thermodynamic equilibrium dual energy equation was adopted, and the sintering temperature as well as the cooling gas temperature were taken as two independent variables. The average sintering temperature is represented by
, whereas the average temperature of the cooling air is represented by
.
Solid phase energy equation is given by Equation (7):
Gas phase energy equation is given by Equation (8):
where
is the porosity,
is the density,
is the specific heat capacity,
and
are the thermal conductivities of the solid and gas, respectively,
and
are the heat source terms of the solid and gas phases, respectively,
is the gas phase temperature,
is the solid phase temperature, and
is the convective heat transfer coefficient per unit volume between the solid phase skeleton and the flowing medium.
2.3. Boundary Condition
The boundary conditions of the annular cooler were obtained by collecting the operating data of the annular cooler built by Sinosteel Equipment and Engineering Co., Ltd., Beijing, China.
The annular cooler consists of five mass flow inlets and five outlets. All wall surfaces are insulated. The temperature, flow, and pressure settings for each mass flow inlet are shown in
Table 1 All outlet types were set as the pressure outlets; each outlet pressure setting is shown in
Table 2. According to the actual operating conditions of the annular cooler, the flue gas from the third air outlet was directly introduced into the first air inlet through a pipe. Therefore, the cooling gas temperature at the Air Inlet 1 changed with the air temperature at the Air Outlet 3. This control was achieved using the built-in function in the software package of Fluent 12.1. Similarly, the mass flow rate of Air Outlet 3 was equal to the mass flow rate of Air Inlet 1. The present paper adopted the targeted mass flow rate to make the mass flow rate of Air Outlet 3 to be 127.593 kg·s
−1, which is consistent with the cooling gas flow rate of Air Inlet 1.
In the present paper, according to data provided by Sinosteel Equipment and Engineering Co., Ltd., China, the operation of the annular cooler was simplified to uniform circular motion, with a rotation time of 3600 s, a material layer thickness of 1.5 m, and a feed temperature of 1073 K. The solid sintered ore has a porosity of 0.4, a particle size of 0.012 m, a density of 1700 kg·m−3, a specific heat of 750 J·kg−1·K−1, and a thermal conductivity of 10 W·m−1·K−1. To simulate the actual feeding process, a sliding mesh was applied to the porous medium area, whereas the temperature of the porous medium passing through the feeding face was set to be 1073 K through UDF programming. According to the data from a previous study, the density, thermal conductivity, specific heat capacity, and kinematic viscosity of air were obtained using the interpolation method.
2.4. Meshing and Model Verification
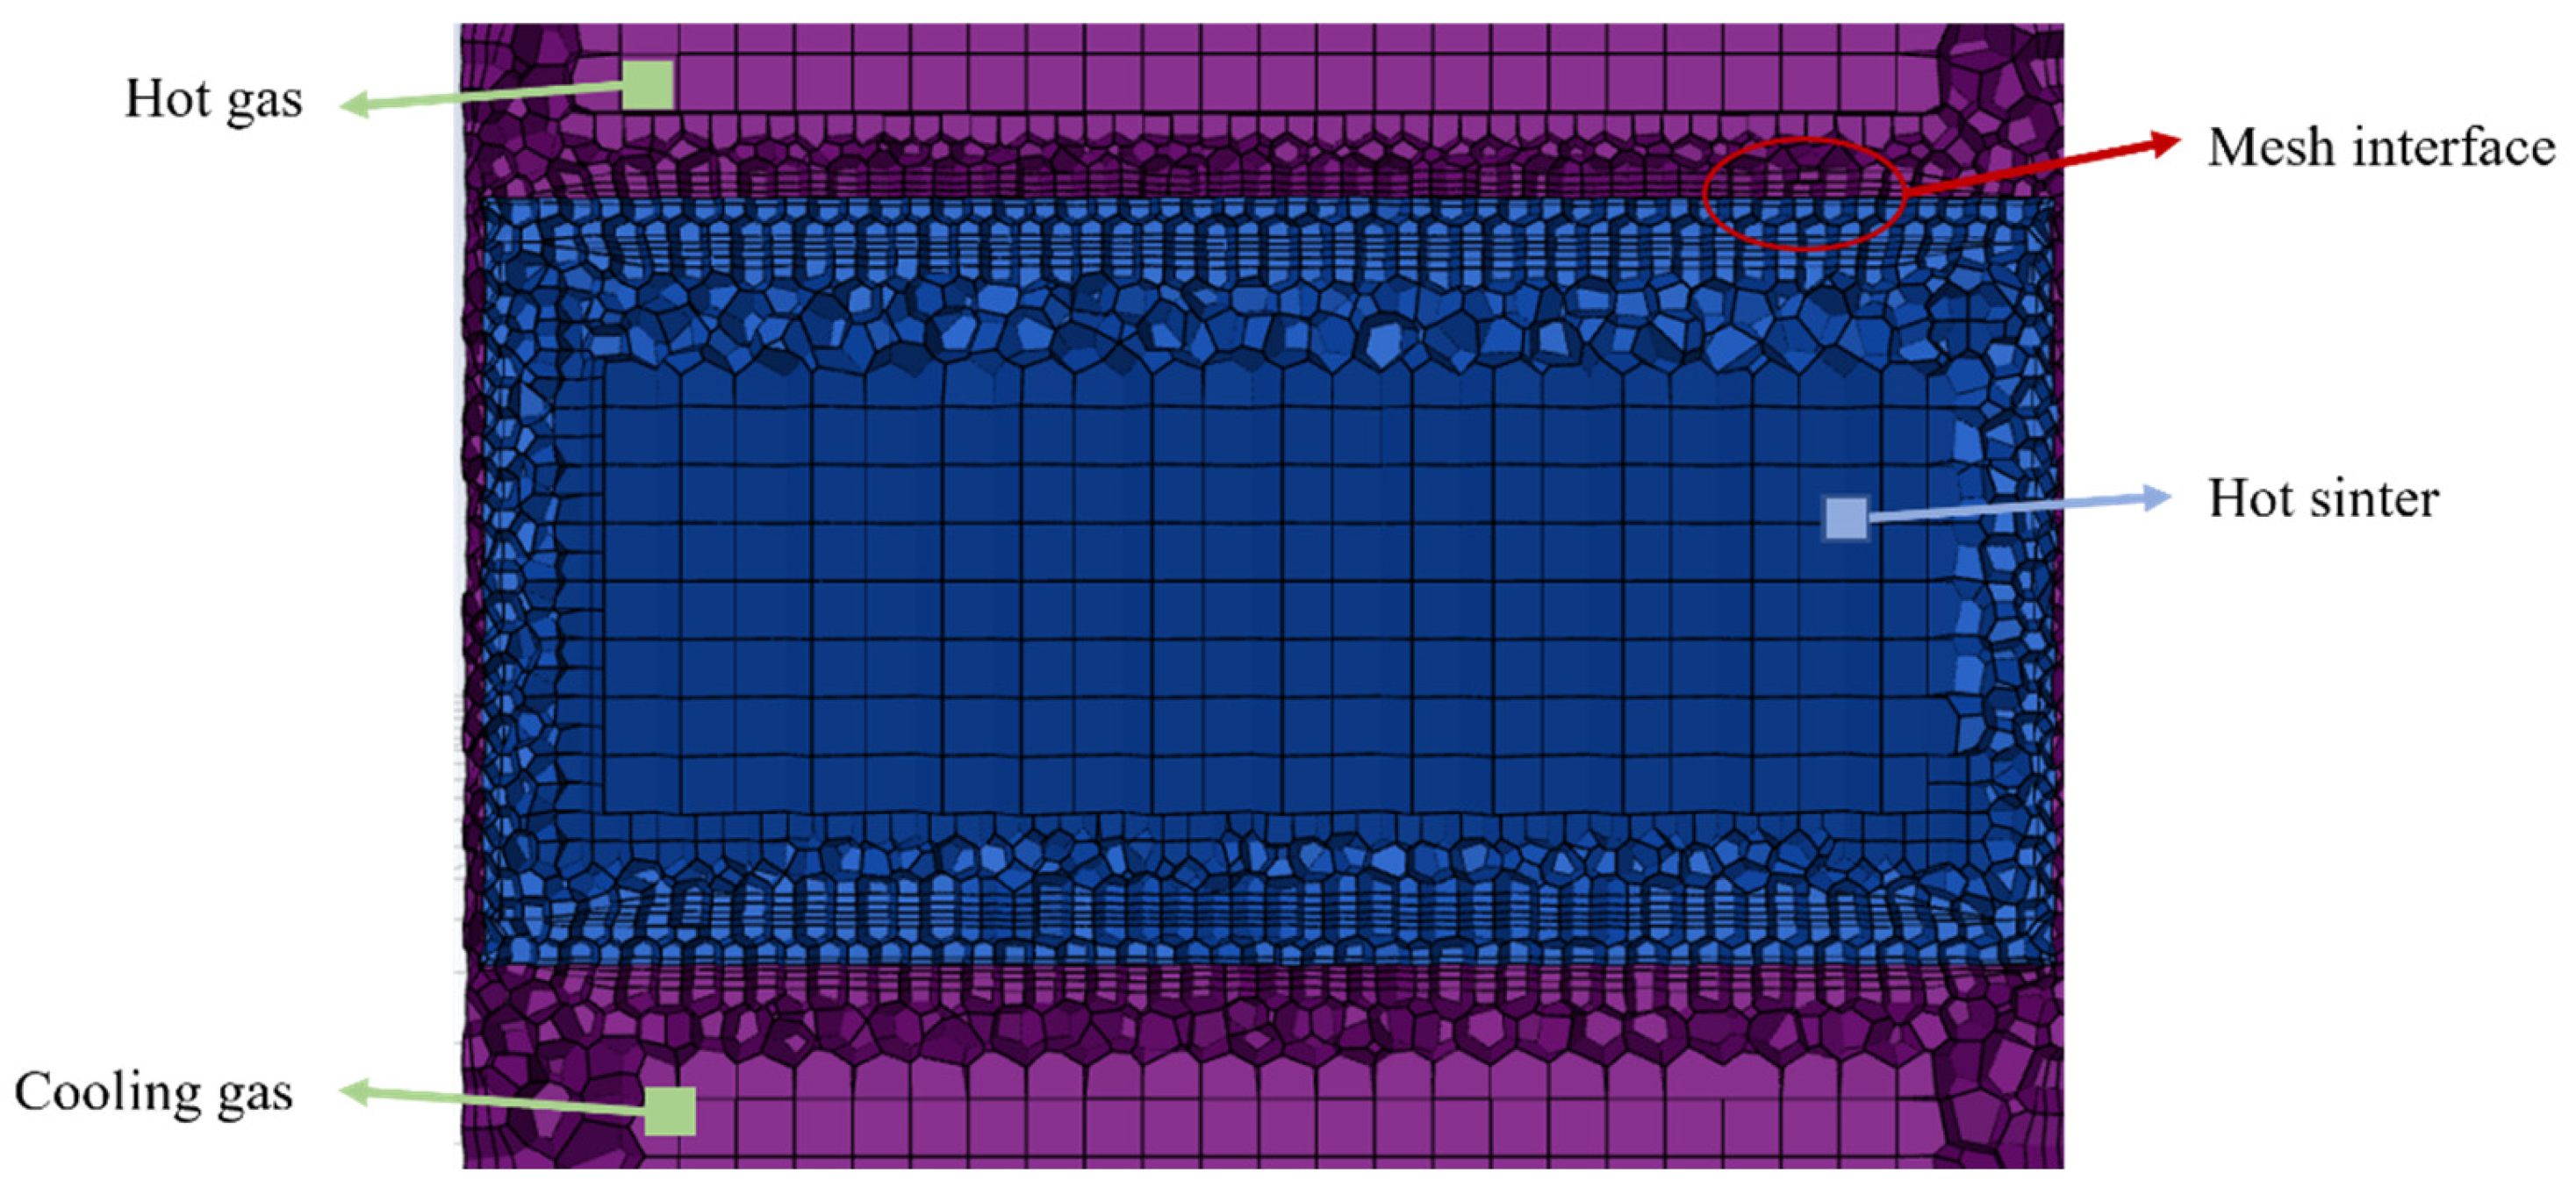
The grid of the model was obtained using the poly-hexcore mesh partitioning technique, where axis-aligned Cartesian elements were generated in the core of the domain and tetrahedral elements were generated at the edge. The effective grid size conversion from the edge to the core of the domain was achieved by performing the hanging node refinement on the Cartesian cells. As shown in
Figure 4, the grids near the rotating and stationary domains were refined to improve the accuracy of the sliding mesh data exchange.
The impact of the number of grids on the simulation was eliminated by gradually increasing the number of grids from 850,254 to 11,055,340. The interference of the number of grids in the simulation is eliminated by comparing the temperature at outlet 1, the temperature at outlet 2, and the discharge temperature separately. Results showed changes in those parameters by less than 2% (
Table 3). There were significant differences in the results between the medium grids and coarse grids. However, results obtained with the medium and fine grids were nearly identical. To save computing expenses, medium grids with a total of 9,803,257 cells were employed in the calculation.
The present paper verified the reliability of the number of grids and the selected mathematical model by comparing the simulation results with the measured data of the annular cooler manufactured by Sinosteel Equipment and Engineering Co., Ltd., China. The flue gas temperature at Pressure Outlets 1 and 2 and the discharge temperature of the ore were measured using a thermometer. Pressure drop in the sintered ore was measured by using a manometer. As shown by the data presented in
Table 4, the numerical difference between the simulation results and the field data was less than 3.84%, which proved the reliability of the mathematical model and the number of grids used in the simulations.
3. Results and Discussion
This section focuses on the temperature distribution inside the annular cooler, the air outlet mass flow rate, and the gas temperature. Moreover, the section explores the effect of the thickness of the material layer on the annular cooler’s outlet temperature and heat recovery.
3.1. Analysis of the Temperature Distribution
The temperature field is one of the most important physical fields in heat transfer simulations and serves as an important reference for measuring the heat transfer of sintered ore in the annular cooler.
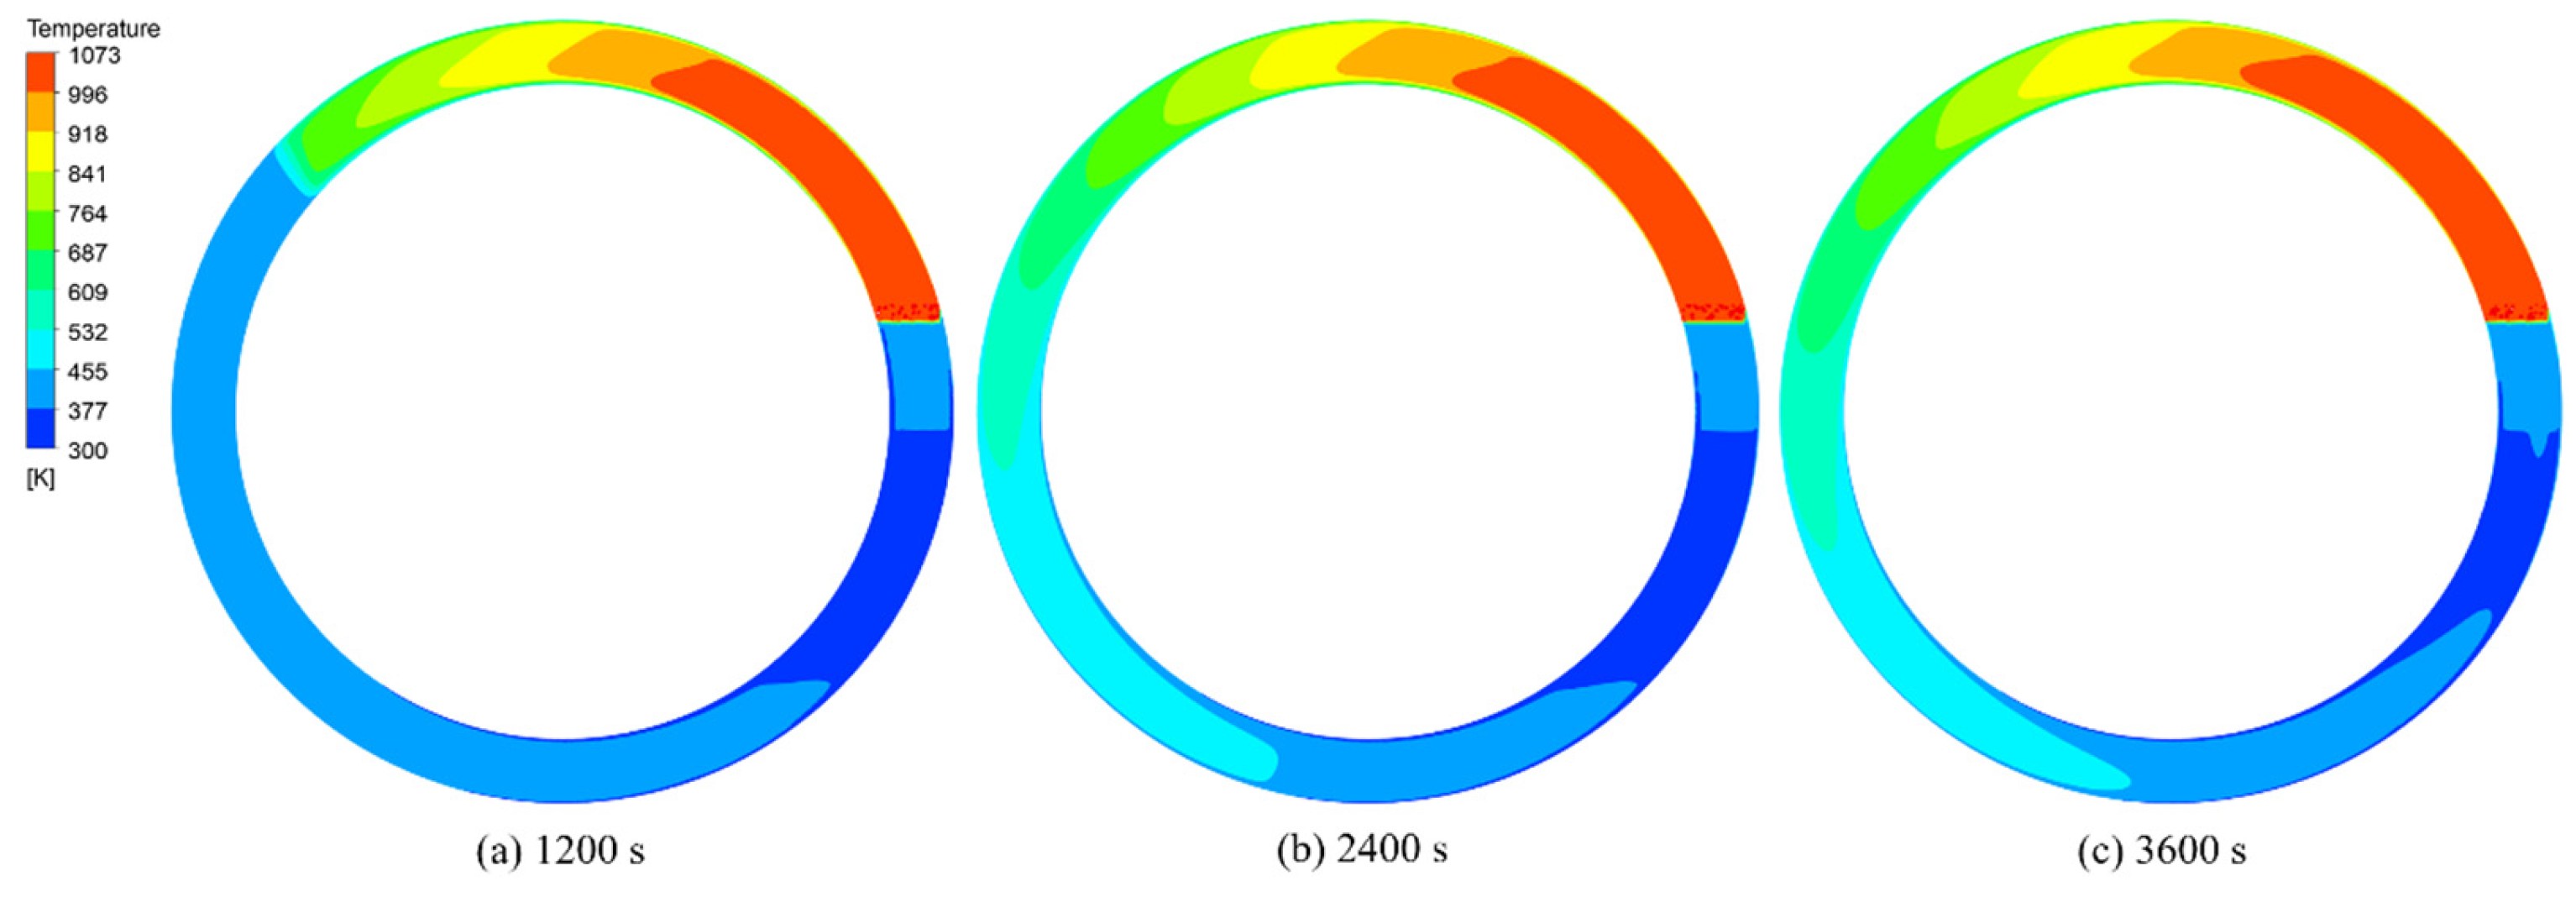
Figure 5 and
Figure 6 show the temperature distribution diagrams of sintered ore and flue gas at the middle section of the trolley when the material layer thickness is 1.5 m and the cooling time is 1200 s, 2400 s, and 3600 s, respectively. As shown in
Figure 5, the sintered ore was gradually cooled along the running direction of the trolley, whereas the ore temperature gradually decreased. Similarly, the variation trend for the temperature distribution of the gas in the porous medium area was similar to that of the sintered ore. The temperature distribution of ore at the discharge port is shown in
Figure 7. The average temperature was 377 K, which met the discharge requirements. The temperature of the ore was distributed in a layered distribution and gradually increased with height. Although the average temperature reached the demand for the discharge, the temperature of the upper part of the trolley was still high. This was because the cooling gas cooled the ore from bottom to top. When the cooling gas reached the upper ore after heat exchange with the bottom ore, the temperature difference between the gas and the ore decreased and the rate of heat exchange decreased. In addition, the present paper suggested appropriately improving the position of the wind box so that the cooling gas could enter the trolley more uniformly, ensuring that the ore at each position could be fully cooled. For example, the last section of the wind box is set in the upper part of the wind cover, so that the cooling gas is cooled from the top to the bottom, on the one hand, so that the cooling wind in the relatively regular wind cover more evenly distributed; on the other hand, cooling gas can be allowed to cool the higher temperature upper layer of ore first, so that the temperature distribution of the discharged ore is more even.
3.2. Analysis of the Pressure Outlet
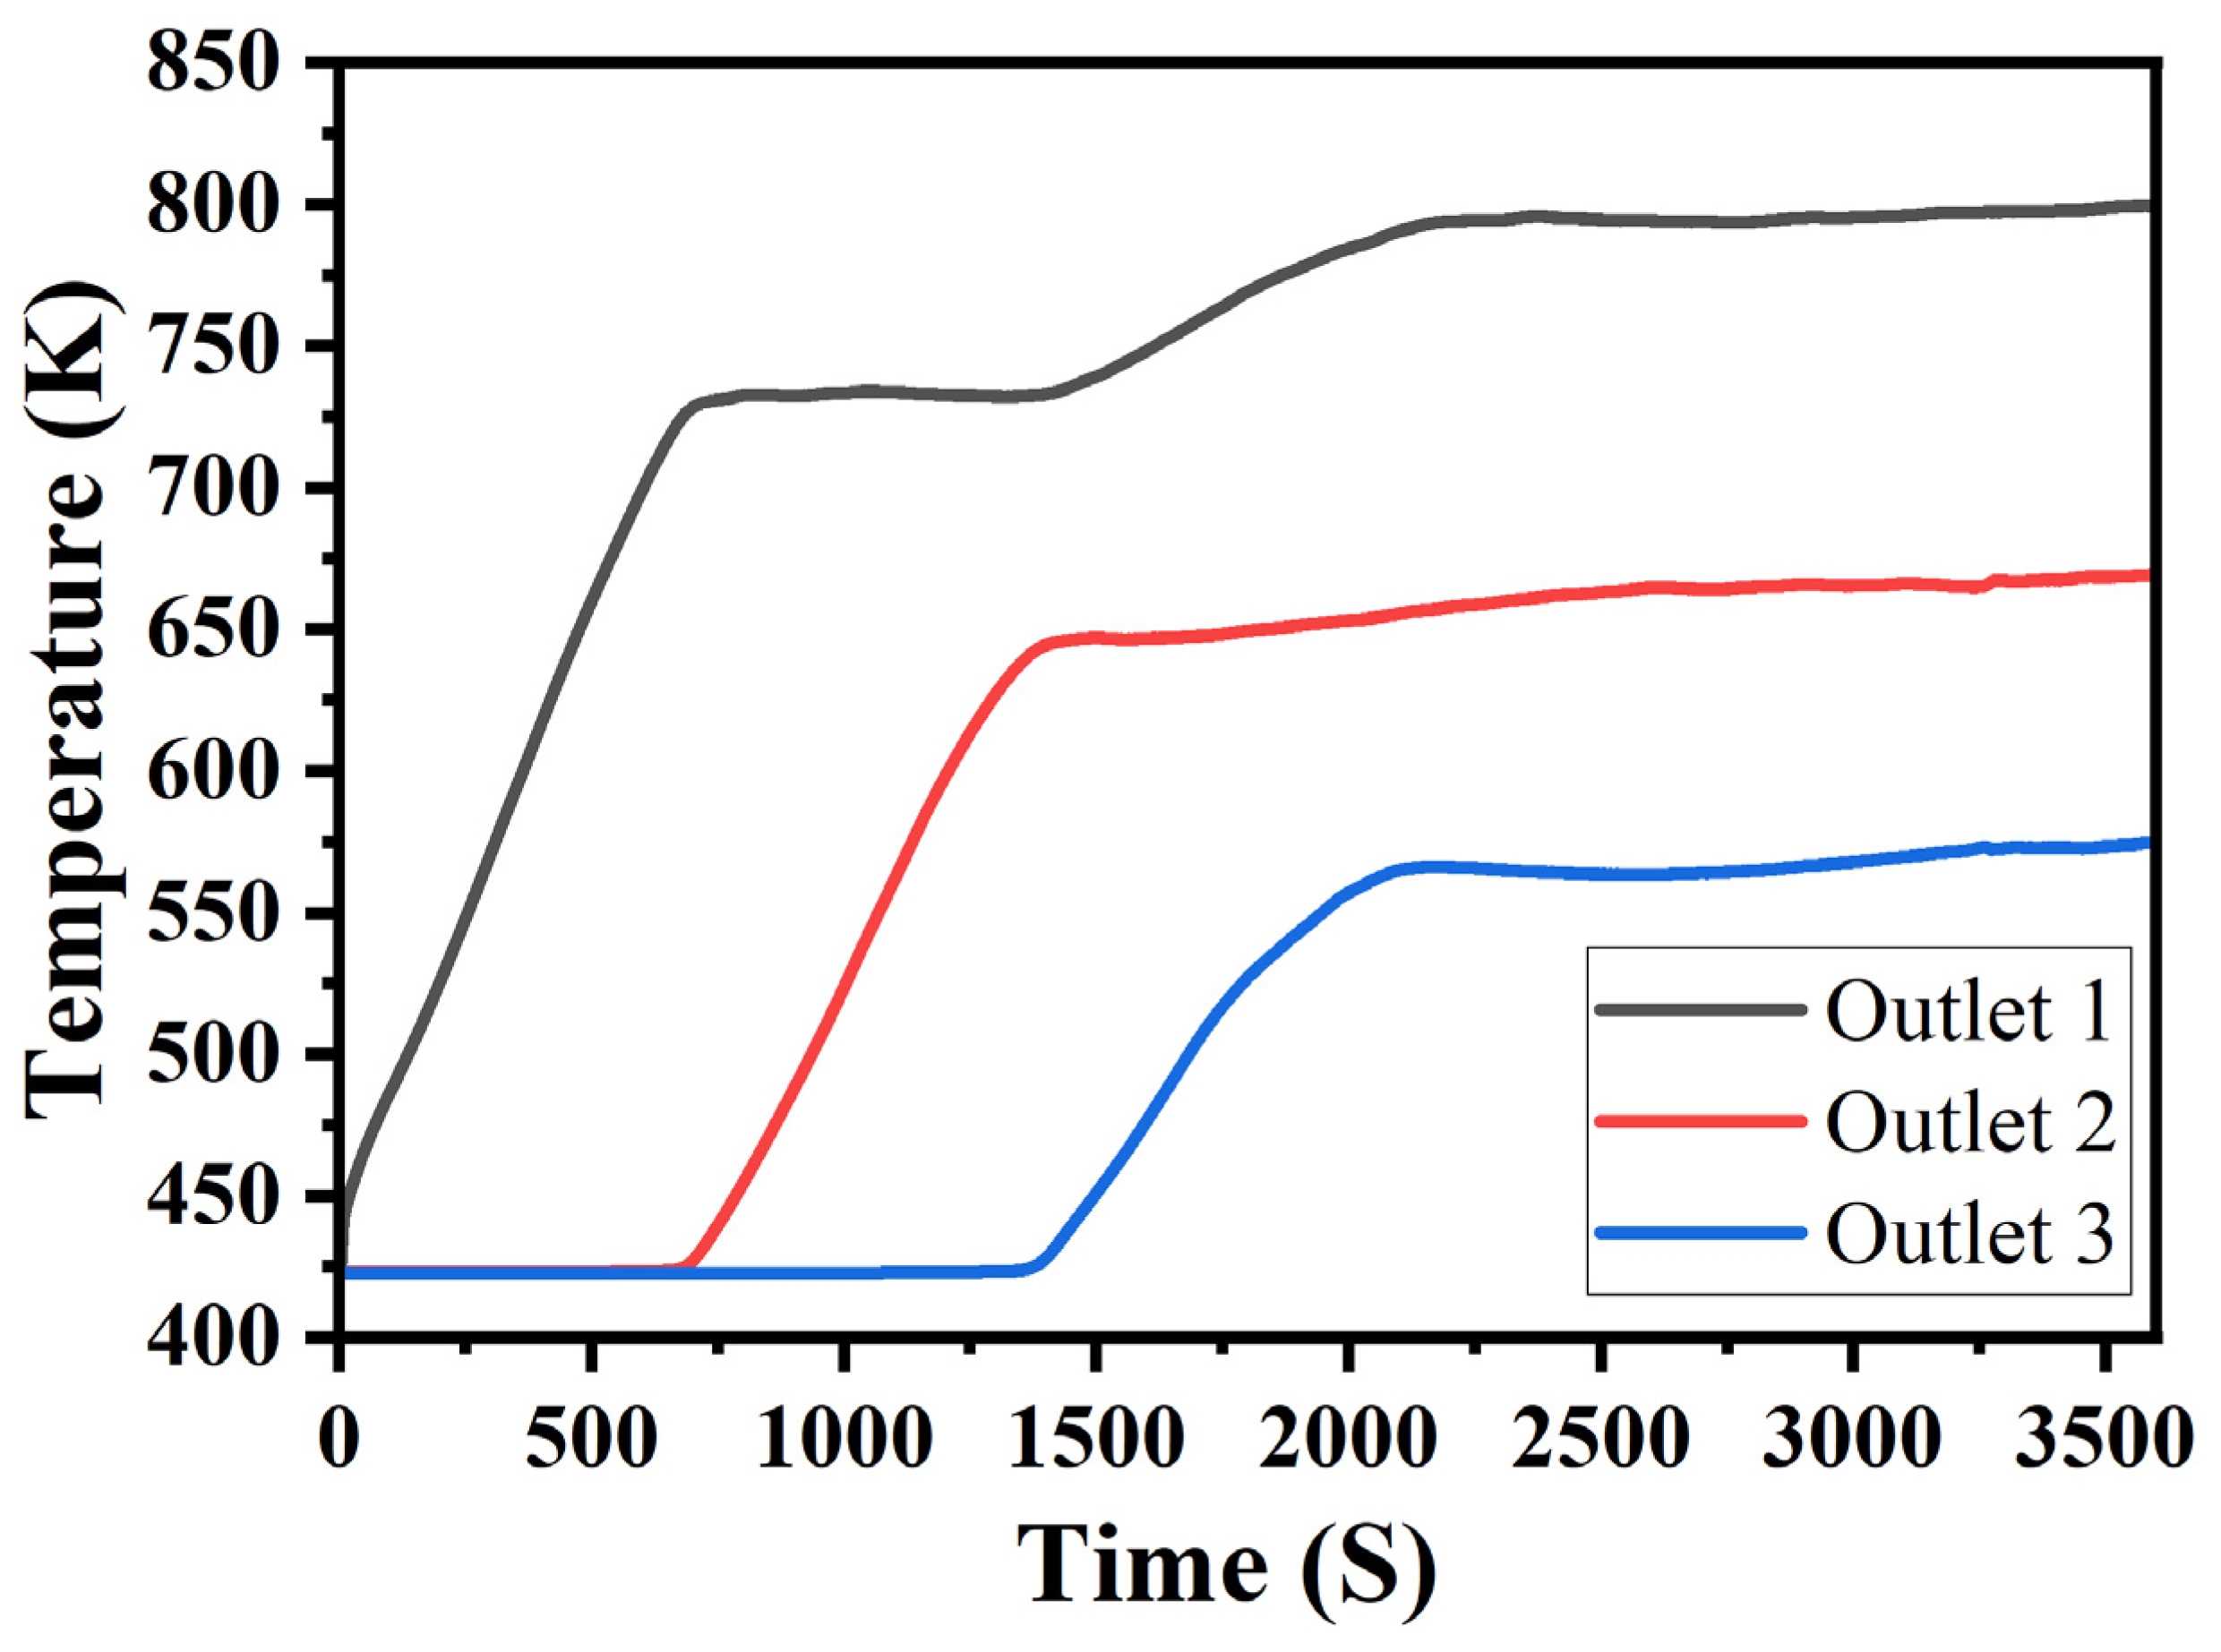
Since the flue gas from the last two sections was directly discharged, the present paper analyzed the distribution of the flue gas from the first three sections. As can be seen from
Figure 8, the flue gas temperature at each outlet gradually increased with the rotation of the trolley and reached stability after a certain period of time. The second increase in the flue gas temperature at the first section’s outlet was because, as the cooling proceeded, the flue gas temperature at the third section’s outlet gradually increased, and this part of the flue gas directly passed into the first section’s cooling gas inlet, which increased the initial temperature of the cooling gas in the first section. Meanwhile, the corresponding flue gas temperature at the first section’s outlet also increased. When the flue gas temperature at the third section’s outlet reached stability, the flue gas temperature at the first section’s outlet also stabilized. The flow rates at the first three sections’ outlets are presented in
Table 5. The outlet temperatures of each section decreased in turn. The outlet temperatures of the first two sections were relatively high and would be sent to the waste heat boiler for heat recovery. The flue gas temperature of the last two sections was lower than 473 K and the flow rate was reduced. Therefore, the flue gas would be directly discharged into the air. This paper suggested that the cooling gas flow rate at the inlet of the first three stages could be appropriately increased. On the one hand, it can increase the heat exchange between the gas and the ore, enhance the temperature of the outlet flue gas, and reduce the temperature of the discharged ore. On the other hand, the outlet flow rate can be increased to enhance the overall amount of the recovered waste heat.
3.3. Layer Thickness
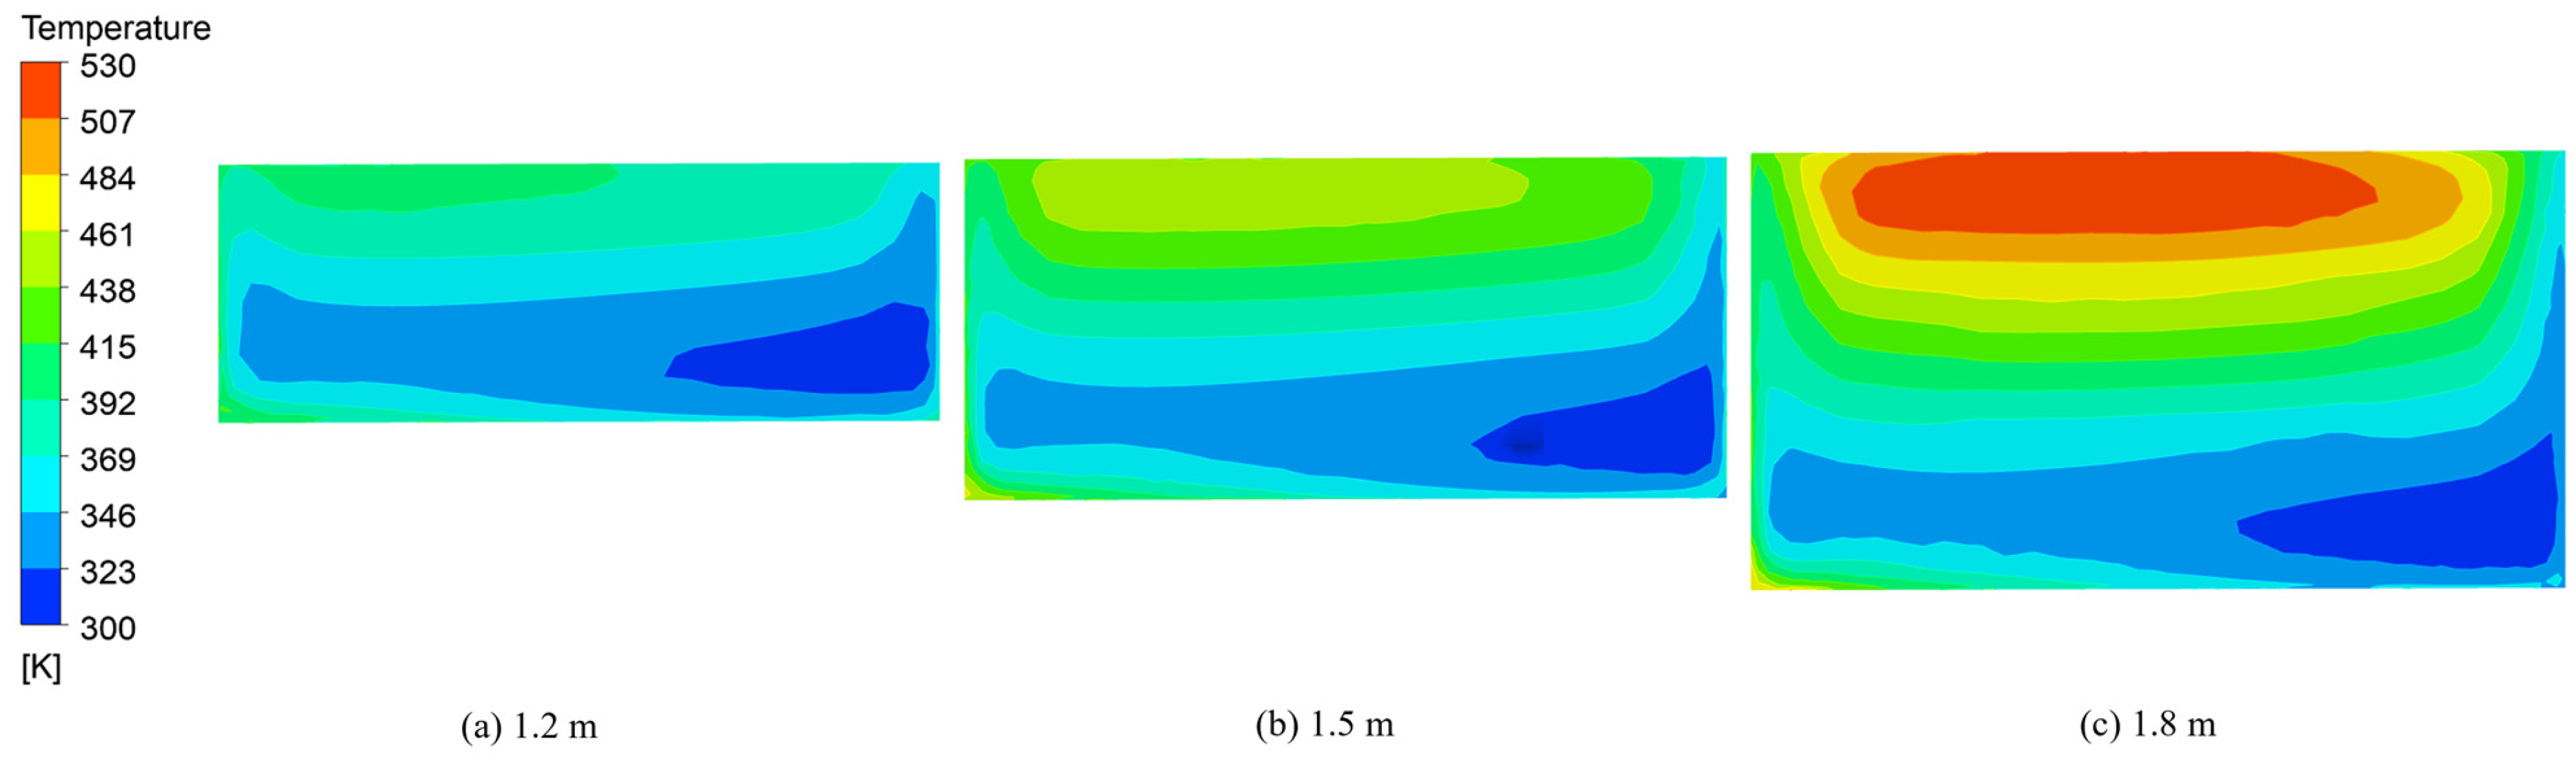
Figure 9 and
Figure 10 show the temperature distribution diagrams of sintered ore and flue gas at the middle section of the trolley when the cooling time is 3600 s and the material layer heights are 1.2 m, 1.5 m, and 1.8 m, respectively. For the three material layer thicknesses, the temperature distribution patterns of the sintered ore and the flue gas basically remained the same. From the inlet to the outlet, the temperatures of the sintered ore and flue gas gradually decreased.
Figure 11 shows the temperature distribution of sintered ore at the discharge section under different material layer thicknesses when the cooling time is 3600 s. The temperature distribution presents a layered distribution. As the thickness increased, the discharge temperature gradually increased, indicating that an excessive increase in material layer thickness posed some challenges to the cooling effect of the annular cooler. The average temperatures of the discharged ore were 371 K, 377 K, and 423 K.
Figure 12 shows a comparison of the temperature changes at each outlet under different material layer thicknesses. As shown in
Figure 12, the variation trends for temperature at each outlet for different thicknesses were similar to each other. The temperature of the third outlet increased with the increase in the thickness of the layer, which in turn increased the initial temperature of the cooling gas at the first inlet, ultimately leading to different heat recovery outlet temperatures. When the material layer height increased from 1.2 m to 1.5 m, the variation trends for the temperature of the flue gas at each outlet were consistent and the temperature increased successively after reaching stability.
As the thickness of the material layer increased, the volume and mass of the sintered ore needed to be cooled in the trolley increased. In the same cooling time, the cooling medium needed to exchange heat with more sintered ore, and the total heat exchange increased. However, since the flow rate of the blower was constant and the mass of the cooling gas entering the annular cooler per unit time was constant, the ore temperature at the discharge point increased with the increase in the layer thickness.
Therefore, on the basis of ensuring the designed output of the annular cooler, appropriately reducing the thickness of the layer is beneficial to the cooling of the sintered ore. At the current inlet airflow, a layer thickness of 1.5 m is recommended. In the waste heat utilization area, the values of the flow rate and temperature of each outlet are presented in
Table 6 and
Table 7. For different thicknesses, the flow rates at each outlet were not very different from each other; however, the flue gas temperature increased with the increase in thickness, thereby increasing the amount of recovered waste heat. It is possible to consider increasing the blower flow rate and the quality of the cooling medium to further enhance the heat exchange, thereby achieving a better cooling effect on the thick material layer. Meanwhile, the amount of recovered waste heat can also be increased.
4. Conclusions
A 3D transient CFD model was successfully designed to simulate the cooling process of the annular cooler with a full geometric model. The following conclusions were drawn.
Sliding mesh was creatively combined with user defined function to achieve the simulation of the continuous feeding process of the annular cooler. By comparing the simulation results with the field measurement data of the annular cooler built by Sinosteel Equipment and Engineering Co., Ltd., Beijing, China, the relative error between the simulation results and the field data was determined to be less than 3.84%, indicating the rationality of the selected mathematical model. Subsequently, the temperature distribution inside the annular cooler and the flow rate and the temperature at the waste heat recovery outlet were analyzed. This paper provides a new idea for CFD simulation of annular coolers. Based on the model’s settings, the optimization of operating parameters and geometric structures can not only shorten the design cycle but also reduce the need for massive research funds and design risks. The study is of great significance to future research on annular coolers.
The influence of the material layer’s thickness on the cooling effect and waste heat recovery from the annular cooler was investigated. When the material layer thickness was within the range of 1.2–1.5 m, increasing the material layer thickness increased the outlet flue gas temperature and the amount of the recovered waste heat, which is beneficial to waste heat recovery. However, the increase in the thickness of the material layer reduced the cooling rate of the sintered ore and the average discharge temperature. Therefore, under the premise of ensuring the output of the annular cooler, appropriately reducing the thickness of the material layer is beneficial to the cooling of the sintered ore. At the current inlet flow, a layer thickness of 1.5 m is recommended. This paper suggests that while increasing the thickness of the material layer and improving the processing capacity of the annular cooler per unit of time, the inlet cooling gas flow rate should be increased appropriately to enhance the heat exchange between the two, reduce the discharge temperature, and increase the recovered residual heat.


