
Optimizing Lime-Based Cemented Paste Backfill for Potash Mines: A Comprehensive Loop Test Study on Slurry Transportation Characteristics


 ,
,  ,
, 
Abstract
1. Introduction
2. Materials and Methods
2.1. Materials
2.1.1. Lime
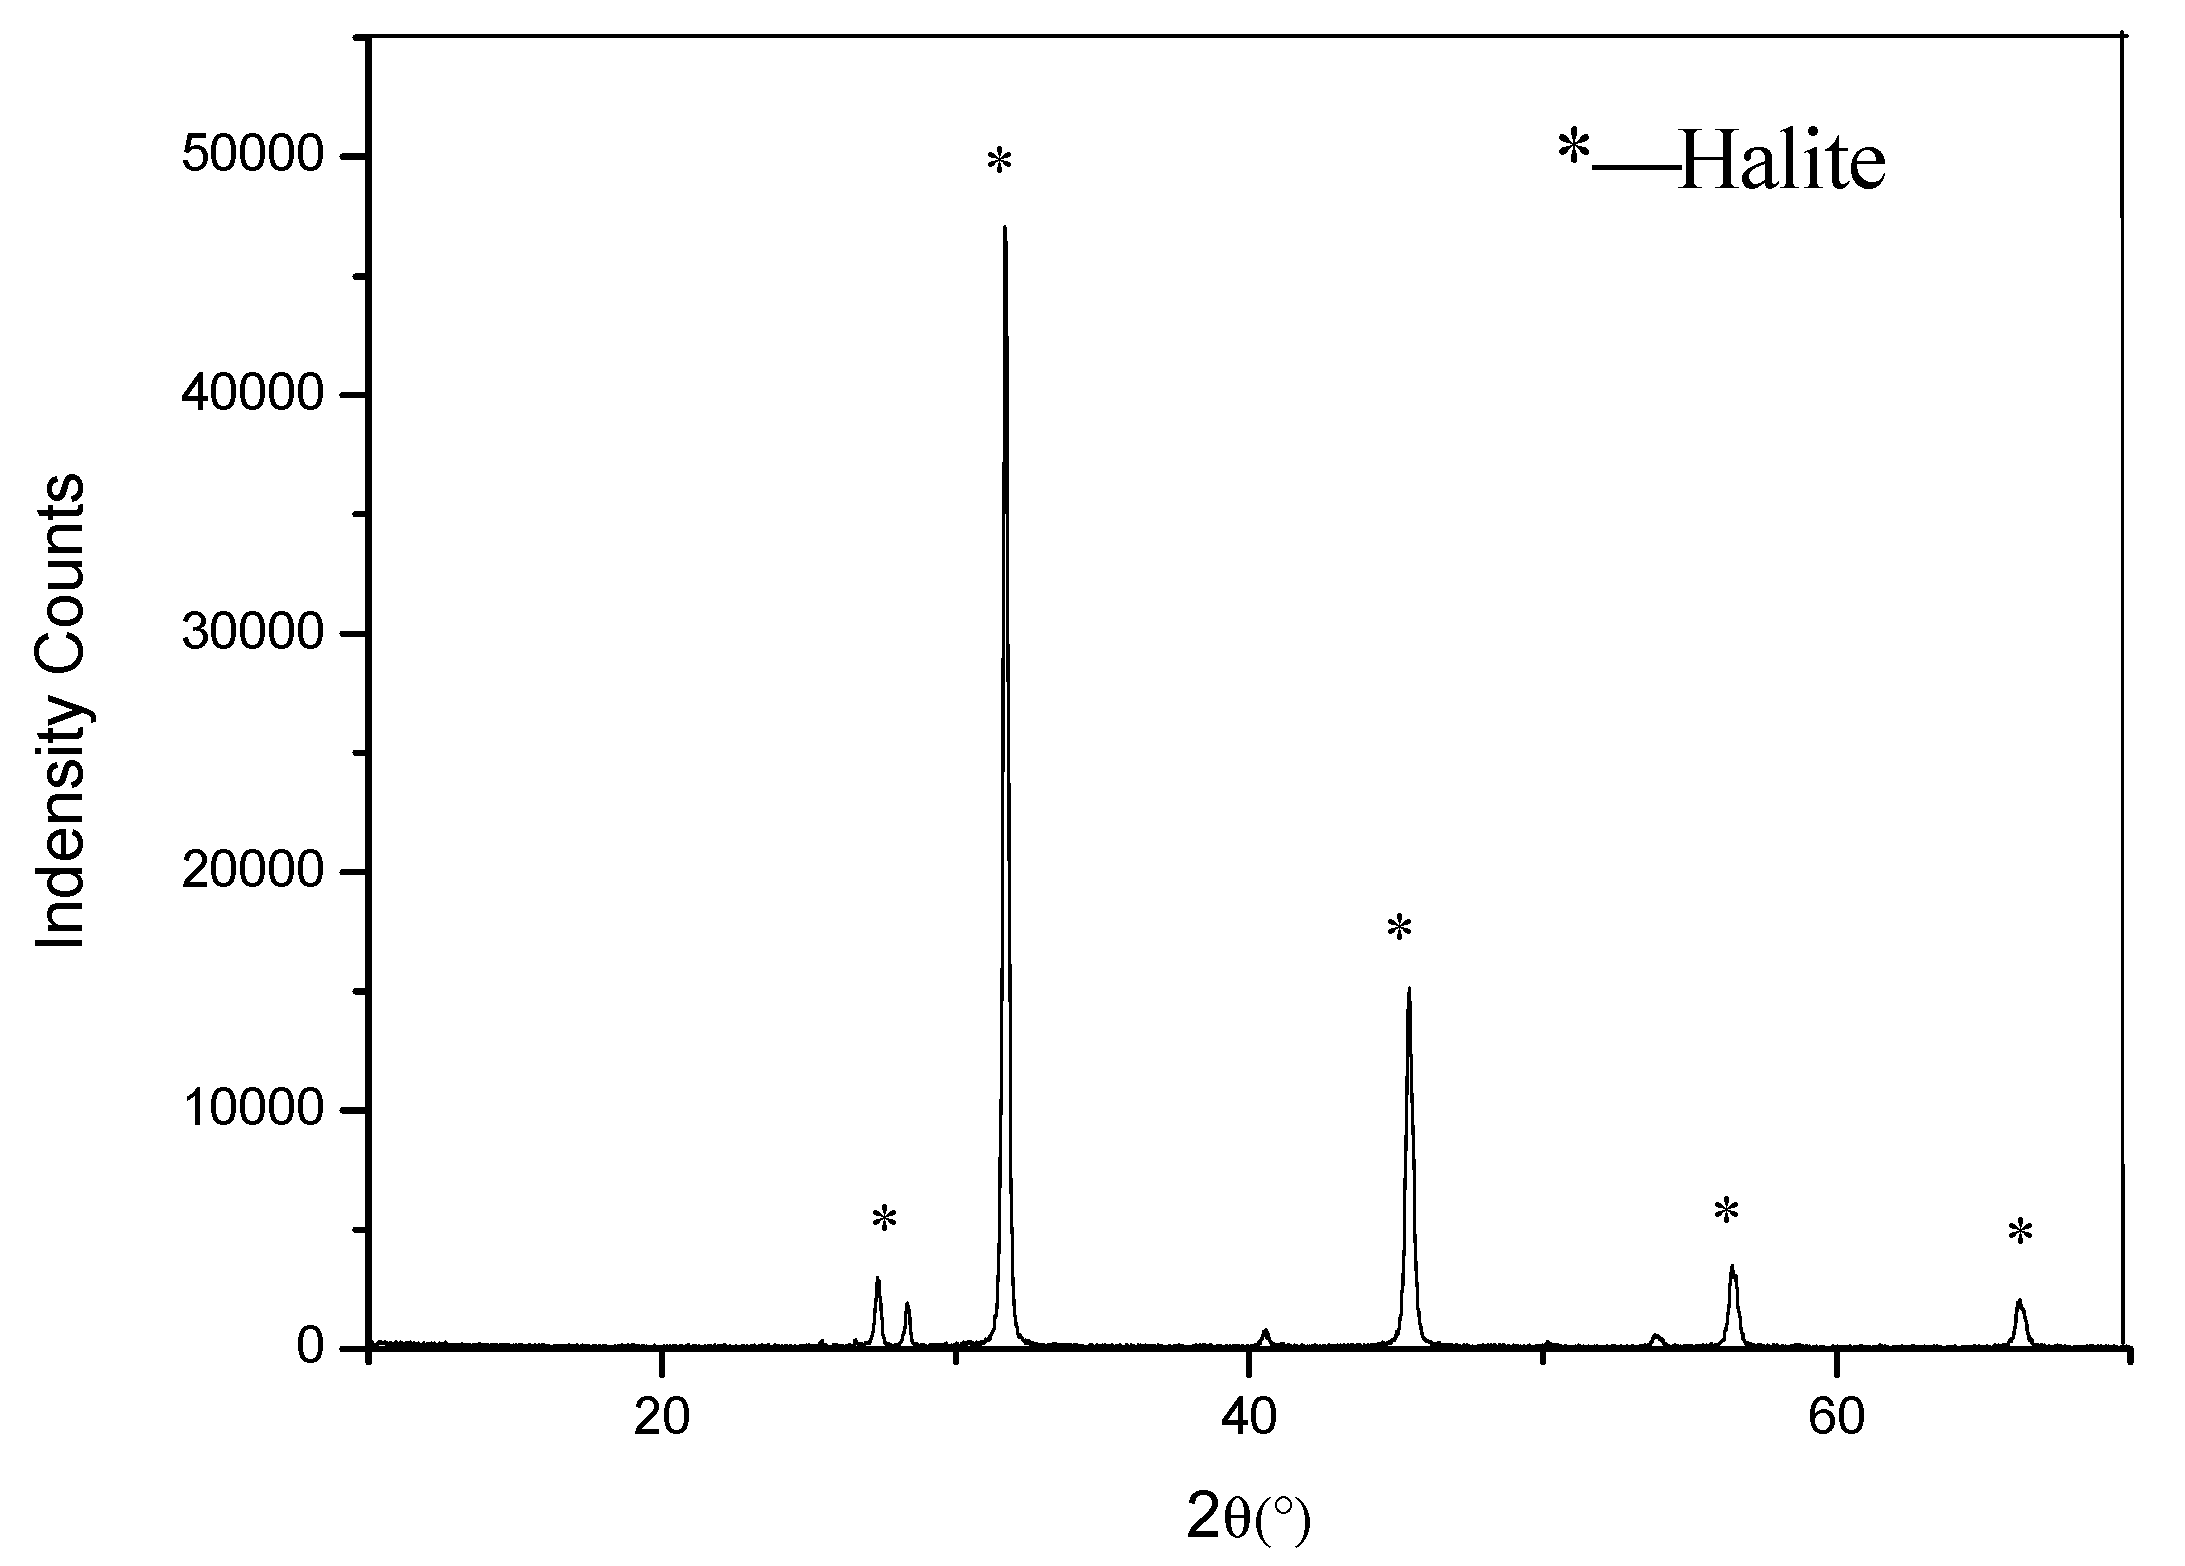
2.1.2. Tailings
2.1.3. Brine Water
2.2. Experiments
2.2.1. Backfill Slurry Preparation
2.2.2. Loop Test
2.2.3. Flowability
2.2.4. Compressive Strength
3. Results
3.1. Results of Loop Pipe Test on Backfill Material with Lime as Binder
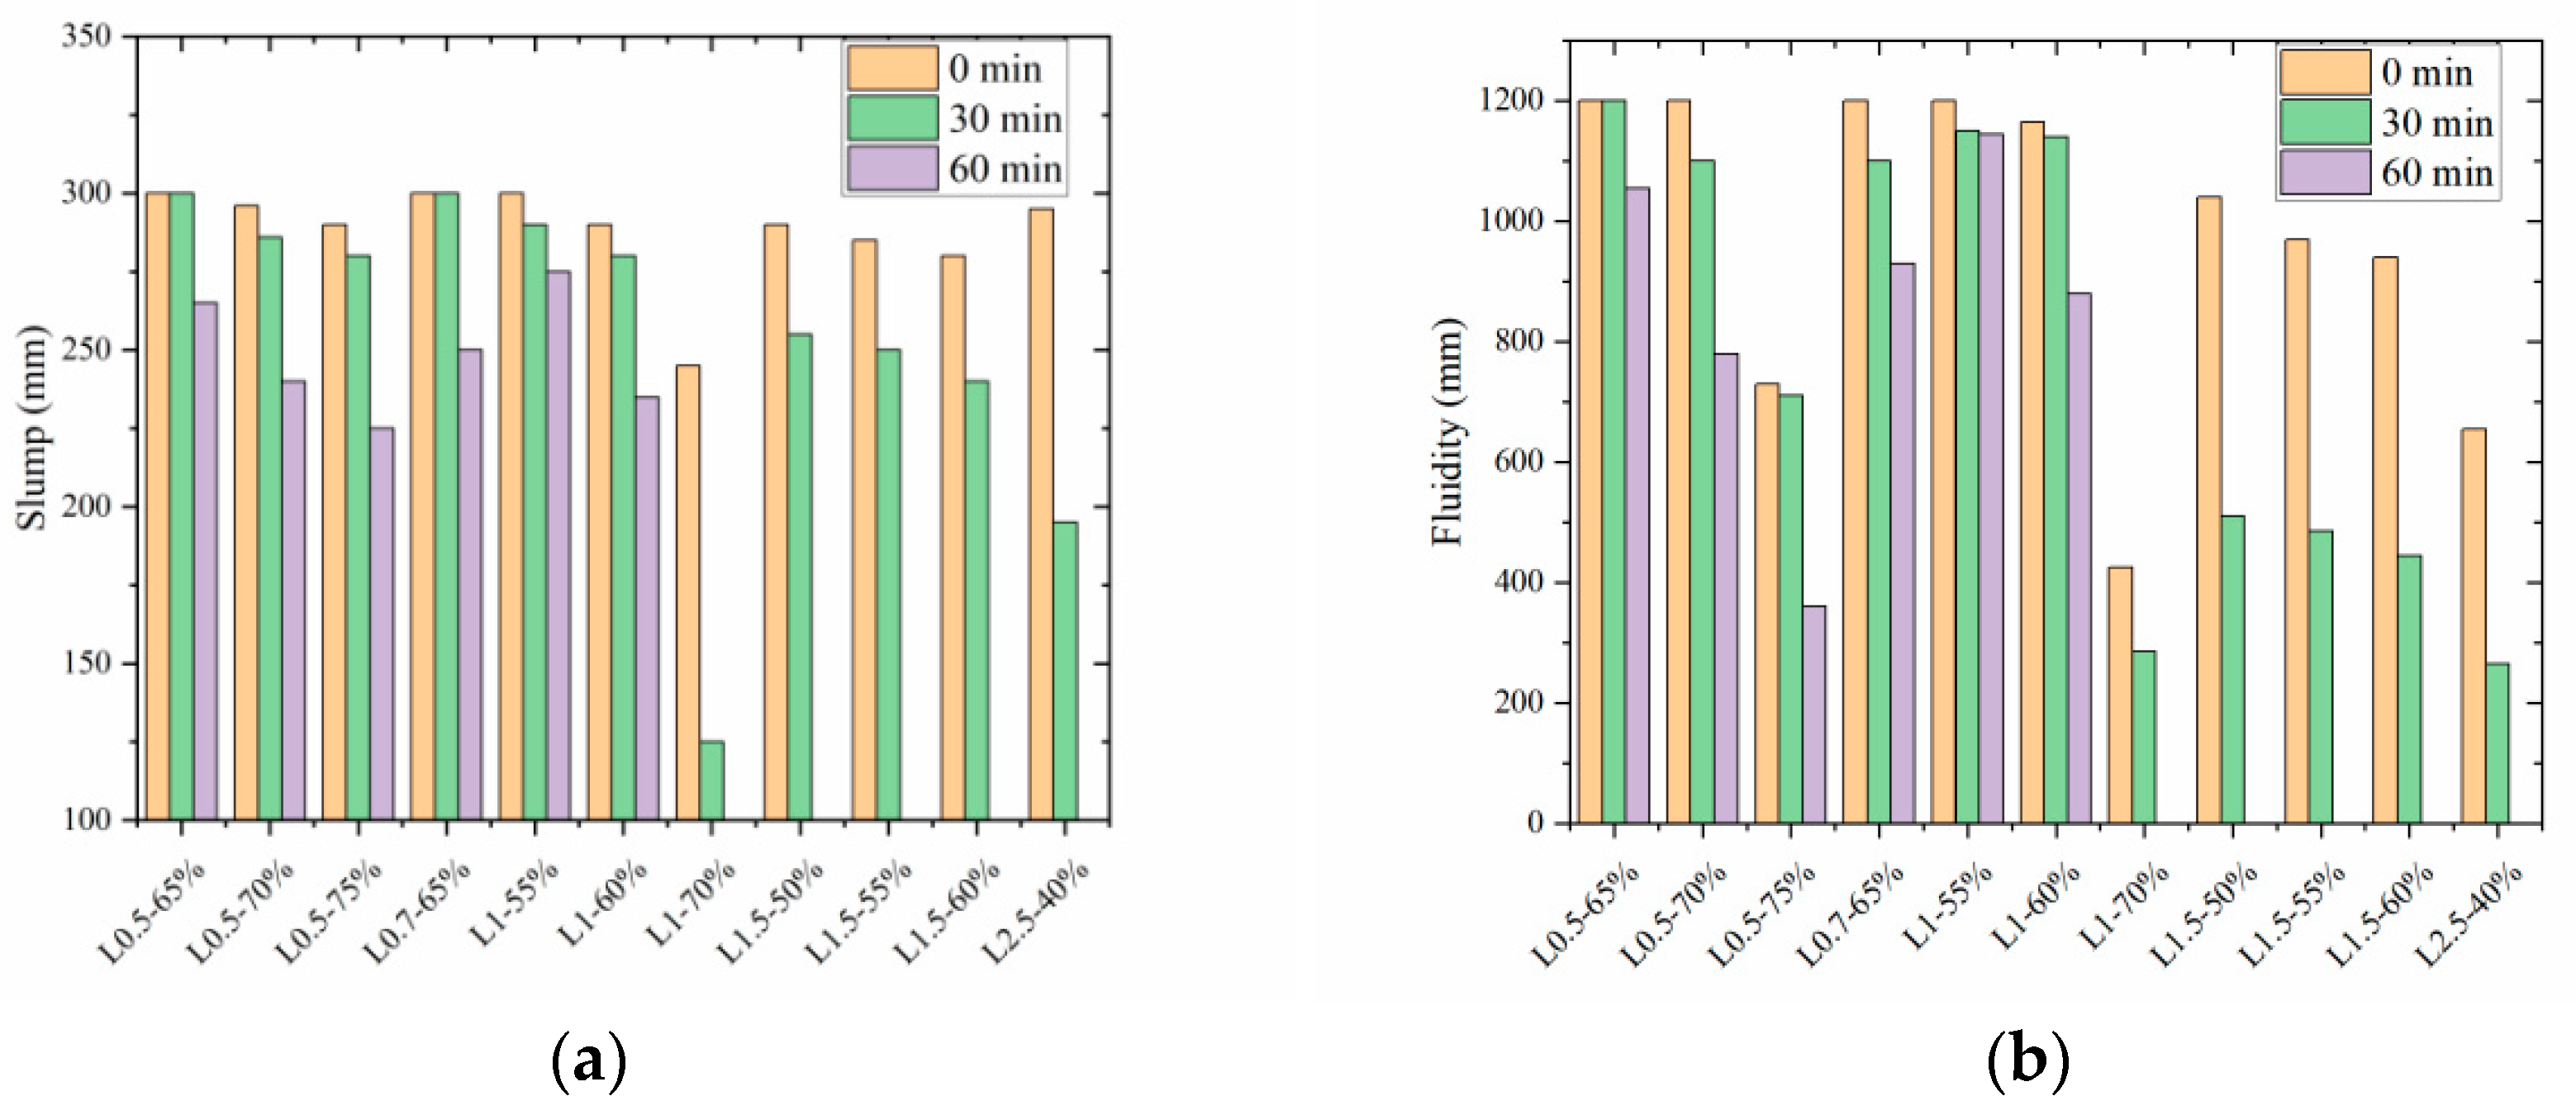
3.1.1. Flowability Variation of Lime-Cemented Backfill Slurry
3.1.2. Pressure Loss at a Bending Pipe
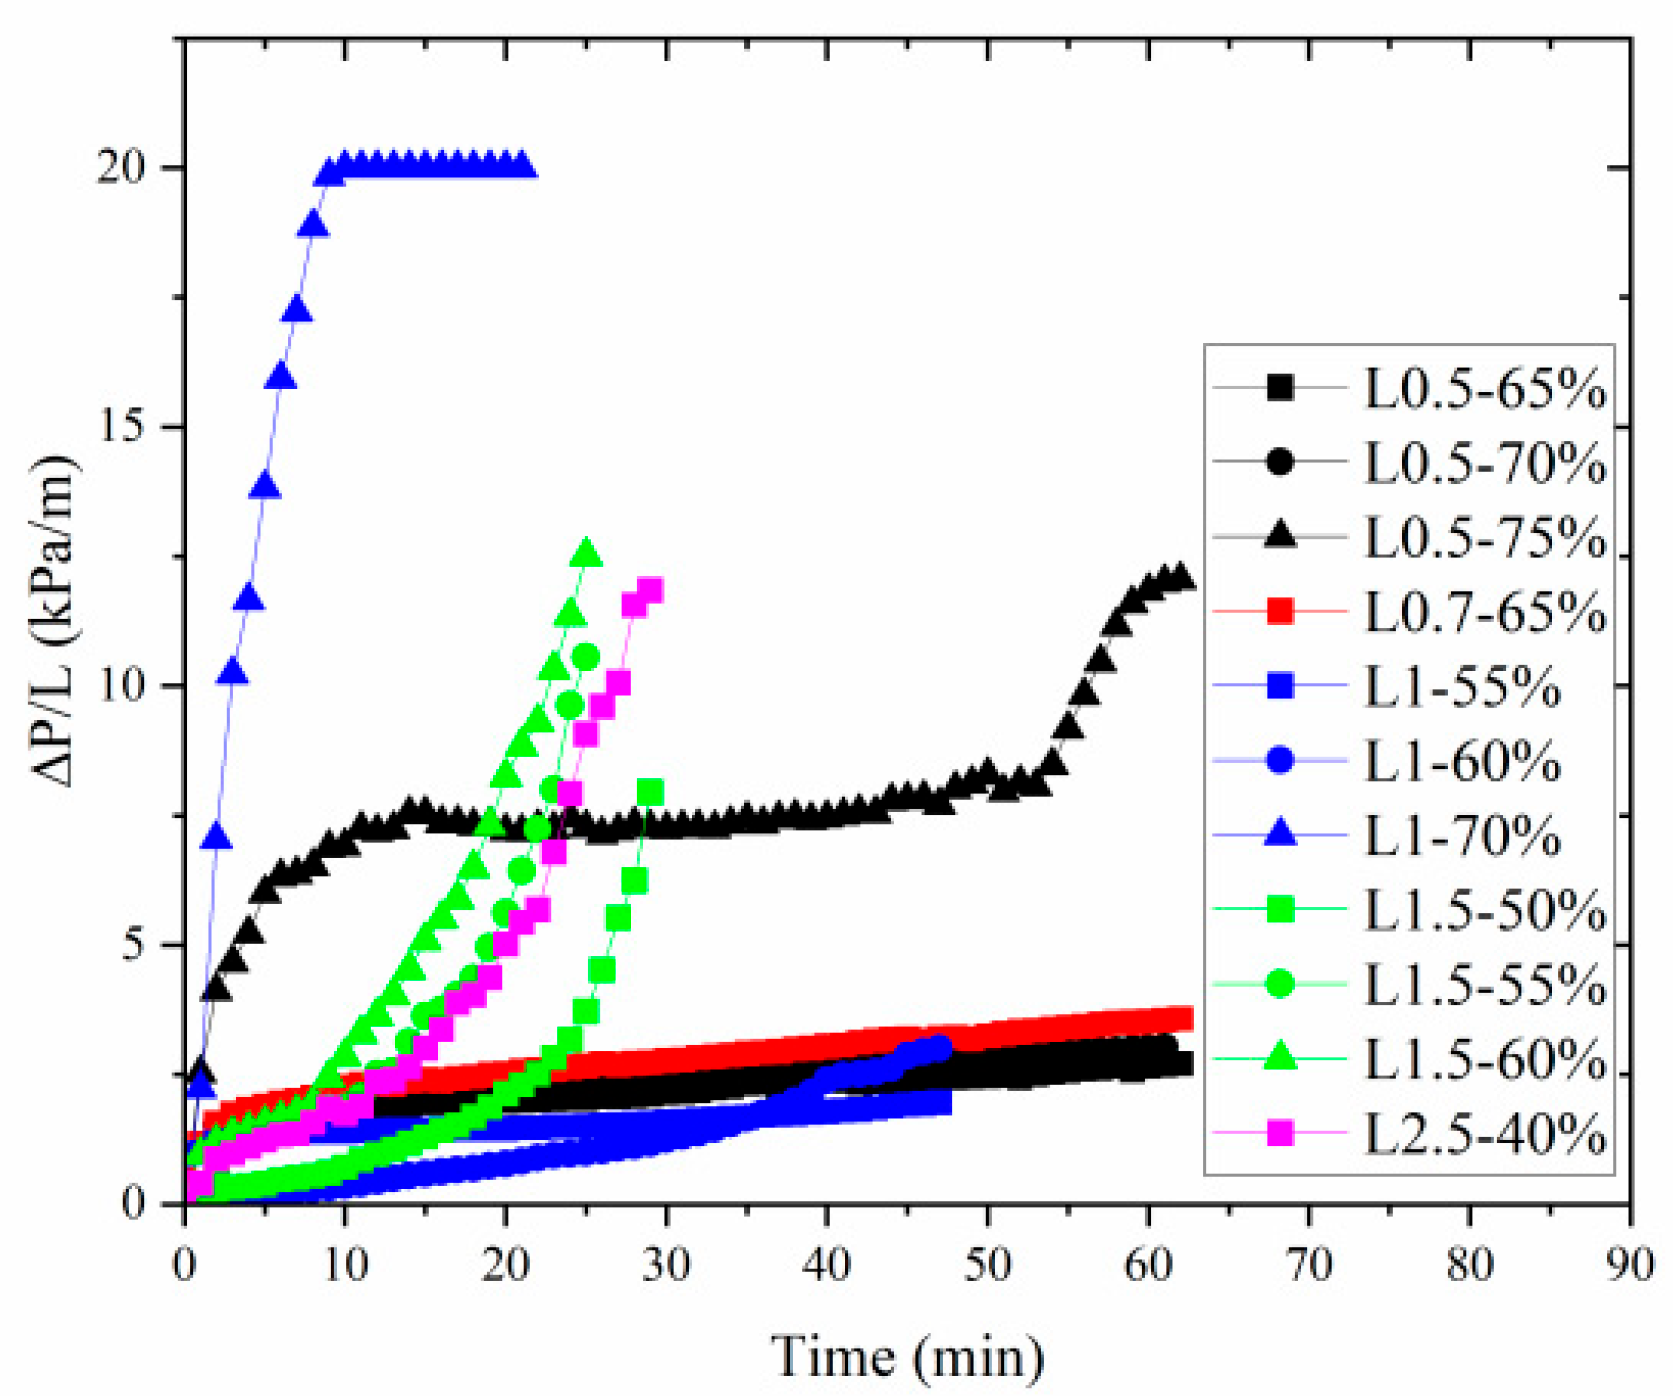
3.1.3. Pressure Loss per Meter in a Horizontal Pipe
3.2. Expanded Simulation Calculation
3.2.1. Case Study
3.2.2. Theoretical Free-Flow Distance
3.2.3. Critical Flow Rate for Engineering Applications
3.2.4. Comparison Between Calculated and Measured Pressure Loss per Meter in the Straight Pipe
3.3. Compressive Strength of Backfill Materials
4. Discussion
5. Conclusions
- (1)
- With the increase of lime dosage and solid content, the slump and fluidity of the backfill slurry decrease over time, with an accelerated rate of decline. To ensure that the backfill slurry remains flowable after 60 min, the solid content should be below 70% when the lime dosage is 1%, below 55% when the lime dosage is 1.5%, and above 40% when the lime dosage is 2.5%.
- (2)
- There are three patterns of pressure loss curves in bend pipes for lime-cemented backfill slurry. The change in the pressure loss per unit distance in a horizontal pipe of the lime-cemented backfill slurry is similar to the pressure loss in the bend pipe.
- (3)
- Under the actual backfill case, the theoretical free-flowing distance of the backfill slurry at the 11 designed lime dosage and solid contents is less than 2.5 km. The backfill material with lime dosages of 0.5 and 0.7 can be transported by pumping for 5 km.
- (4)
- The adjusted B.C. Knorrhodz formula can meet the requirements for calculating the critical flow rate of potash mine backfill materials. In actual backfill cases, the slurry flow rate is greater than the designed critical flow rate of the backfill material and will not cause pipe blockage.
- (5)
- The pressure loss per unit distance in a horizontal pipe of backfill slurry can be calculated using the formula. With the increases in pressure loss per unit distance in a horizontal pipe, the error of calculation increased. The calculated value aligns closely with the field test value. By introducing a k value, the pressure loss per unit distance in a horizontal pipe in the backfill site can be accurately predicted by calculation.
- (6)
- The compressive strength of the lime-cemented backfill materials after the loop tube test is comparable to that before the loop tube test. When the solid content exceeds 65%, the compressive strength of the lime-cemented backfill materials after the loop tube test is slightly greater than before the loop tube test. Particle friction under high solid content promotes hydration consolidation.
Author Contributions
Funding
Data Availability Statement
Conflicts of Interest
References
- Zheng, M.; Hou, X.; Zhan, Y.; Xing, E.; Li, H.; Yin, H.; Yu, C.; Wang, N.; Deng, X.; Wei, Z.; et al. The Latest Progress in the Investigation of Potash Resources in Western China. China Geol. 2018, 2, 392–401. [Google Scholar] [CrossRef]
- Bai, J.; She, Y. Study on the exploration and development of the potash in the world. China Min. Mag. 2017, 26, 1–4. [Google Scholar]
- Wang, X.; Wang, Q.; Zhang, B.; Ni, W.; Jin, R.; Zhao, K. Hydration Mechanism of Using Steel Slag as Binder for Backfill Materials in Potash Mines. Chinese J. Eng. 2018, 40, 1177–1186. [Google Scholar]
- Shang, P.; Qi, C.; Jiao, S.; Xiong, X.; Guan, B.; Zhang, Y. Potash Assessment Models and Resource Potential Analysis in China. Geol. Bull. China 2019, 38, 1758–1767. [Google Scholar]
- Tang, Q.; Zhang, X.Y.; Miao, W.; Ma, H.; Li, Y.; Li, W.; Yuan, X. Mineralogical Characteristics and Sedimentary Environment Significance of Water-Insoluble Minerals in Potash Deposits of Vientiane Basin of Laos. Carbonates Evaporites 2021, 36, 70. [Google Scholar]
- Zhao, Y.; Ma, Z.; Qiu, J.; Sun, X.; Gu, X. Experimental study on the utilization of steel slag for cemented ultrafine tailings backfill. Powder Technol. 2020, 375, 284–291. [Google Scholar]
- Zhao, Y.; Qiu, J.; Zhang, S.; Guo, Z.; Wu, P.; Sun, X.; Gu, X. Low carbon binder modified by calcined quarry dust for cemented paste backfill and the associated environmental assessments. J. Environ. Manag. 2021, 300, 113760. [Google Scholar] [CrossRef]
- Liu, B.; Liu, Y.; Zhang, L.; Fan, X. Mechanical Behavior and Acoustic Emission Characteristics of Cemented Tailings Backfill with Varied Water Loss. Geotech. Geol. Eng. 2024, 42, 6005–6025. [Google Scholar] [CrossRef]
- Zhang, X.; Zhu, S.; Yang, T.; Yang, T.; Wang, Y.; Li, J.; Li, K. The influence of coal gangue dosage and concentration on the properties and hydration mechanism of fly ash-based cemented filling materials. J. Clean. Prod. 2025, 492, 144903. [Google Scholar] [CrossRef]
- Wang, X.; Ni, W.; Jin, R.; Liu, B. Formation of Friedel’s Salt Using Steel Slag and Potash Mine Brine Water. Constr. Build. Mater. 2019, 220, 119–127. [Google Scholar] [CrossRef]
- Li, Q.; Li, J.; Zhang, S.; Huang, X.; Wang, X.; Wang, Y.; Ni, W. Research Progress of Low Carbon Cementitious Materials Based on Synergistic Industrial Wastes. Energies 2023, 16, 2376. [Google Scholar] [CrossRef]
- Zhao, Y.; Sun, Y.; Guo, Z.; Sun, X.; Qiu, J. Increasing arsenic immobilization capacity of a binder prepared by arsenic-containing biohydrometallurgy waste: Effects of ferric/ferrous salts addition. J. Environ. Chem. Eng. 2023, 11, 110206. [Google Scholar] [CrossRef]
- Qi, G.; Wang, D.; Xu, D.; Zhang, D.; Wang, Q.; Tang, Y.; Zhu, Y. Analysis of lime paste and bricks from the Ming Dynasty: Composition, structure, properties, and adhesion mechanism. Constr. Build. Mater. 2025, 461, 139929. [Google Scholar] [CrossRef]
- Parra-Fernandez, C.; Arizzi, A.; Secco, M.; Cultrone, G. The manufacture of natural hydraulic limes: Influence of raw materials’ composition, calcination and slaking in the crystal-chemical properties of binders. Cem. Concr. Res. 2024, 185, 107631. [Google Scholar] [CrossRef]
- Athira, V.S.; Lekshmi, S.; Sharanya, A.G.; Tripathi, A.; Manohar, S. Potential application of bio-admixtures in synthesizing traditional lime binders- A comprehensive review. J. Build. Eng. 2024, 90, 109464. [Google Scholar] [CrossRef]
- Zhang, D.; Xu, D.; Wang, Y.; Cui, S.; Wang, D. Study on the fluid-solid transition mechanism of natural hydraulic lime pastes: Consider the water to binder ratio and polycarboxylate superplasticizer. Constr. Build. Mater. 2024, 453, 139119. [Google Scholar] [CrossRef]
- Zhao, Y.; Qiu, J.; Zhang, S.; Guo, Z.; Ma, Z.; Sun, X.; Xing, J. Effect of sodium sulfate on the hydration and mechanical properties of lime-slag based eco-friendly binders. Constr. Build. Mater. 2020, 250, 118603. [Google Scholar] [CrossRef]
- Zheng, J. An experiment research on the optimization of fines and lime contents of tailings-binder pastes backfills for mining. J. Xiangtan Min. Inst. 2000, 4, 68–70. [Google Scholar]
- Li, L.T.; Yang, Z.Q.; Gao, Q. Experiment on Proportion Optimization of Filling Cementitious Material on Tailings from Shirengou Iron Mine. Met. Mine 2016, 45, 177–180. [Google Scholar]
- Jin, R.; Wang, X.; Ma, X.; Huo, H.; Zhang, S.; Li, J.; Ni, W. Hydration mechanisms of gelled paste backfill for potash mines using lime as a gel material. Gels 2024, 10, 832. [Google Scholar] [CrossRef]
- Lesmana, A.; Hitch, M. Heavy media coal hydro-transport in Malinau, Indonesia: A Process Study. Int. J. Min. Miner. Eng. 2021, 3, 1–15. [Google Scholar] [CrossRef]
- Yin, S.; Shao, Y.; Wu, A.; Wang, H.; Liu, X.; Wang, Y. A systematic review of paste technology in metal mines for cleaner production in China. J. Clean. Prod. 2020, 247, 119590. [Google Scholar] [CrossRef]
- Qi, C.; Guo, L.; Ly, H.B.; Van Le, H.; Pham, B.T. Improving pressure drops estimation of fresh cemented paste backfill slurry using a hybrid machine learning method. Miner. Eng. 2021, 163, 106790. [Google Scholar] [CrossRef]
- Wang, Y.; Na, Q.; Wu, A.; Zhang, H.; Wang, G.; Wang, Y.; Zhang, W.; Wang, X. Comparison of resistance between pipe loop test and theoretical calculations in fly ash−slag slurry. J. Cent. South Univ. Sci. Technol. 2022, 53, 2234–2244. [Google Scholar]
- Wu, D.; Yang, B.; Liu, Y. Pressure drop in loop pipe flow of fresh cemented coal gangue–fly ash slurry: Experiment and simulation. Adv. Powder Technol. 2015, 26, 920–927. [Google Scholar] [CrossRef]
- Jin, R.; Wang, X.; Zhang, S.; Huo, H.; Li, J.; Wen, N. Slurry transportation characteristics of potash mine cemented paste backfills via loop tests processing. Processes 2024, 12, 2929. [Google Scholar] [CrossRef]
- Wu, D.; Yang, B.; Liu, Y. Transportability and pressure drop of fresh cemented coal gangue-fly ash backfill (CGFB) slurry in pipe loop. Powder Technol. 2015, 284, 218–224. [Google Scholar] [CrossRef]
- GB/T2419-2005; Test Method for Fluidity of Cement Mortar. State General Administration of the People’s Republic of China for Quality Supervision and Inspection and Quarantine, National Standardization Administration: Beijing, China, 2005.
- GB/T50080-2016; Standard for Test Method of Performance on Ordinary Fresh Concrete. Ministry of Housing and Urban-Rural Development, State General Administration of the People’s Republic of China for Quality Supervision and Inspection and Quarantine: Beijing, China, 2017.
- GB/T 50107-2010; Standard for Evaluation of Concrete Compressive Strength. Ministry of Housing and Urban-Rural Development, State General Administration of the People’s Republic of China for Quality Supervision and Inspection and Quarantine: Beijing, China, 2010.
- Wang, L.; Cheng, L.; Yin, S.; Yan, Z.; Zhang, X. Multiphase slurry flow regimes and its pipeline transportation of underground backfill in metal mine: Mini review. Constr. Build. Mater. 2023, 402, 133014. [Google Scholar] [CrossRef]


| Chemical Composition | SiO2 | CaO | K2O | Fe2O3 | Al2O3 | LOI |
|---|---|---|---|---|---|---|
| Content/% | 0.10 | 41.98 | 0.02 | 0.05 | 0.02 | 57.83 |
| Size/μm | +150 μm | −150 + 74 μm | −74 μm |
|---|---|---|---|
| Content/% | 51.56 | 25.21 | 23.23 |
| Size/mm | −4 + 2.5 | −2.5 + 0.63 | −0.63 + 0.3 | −0.3 + 0.25 | −0.25 + 0.15 | −0.15 |
|---|---|---|---|---|---|---|
| Content/% | 1.6 | 37.44 | 22.65 | 5.36 | 8.72 | 24.23 |
| Mineral Composition | MgCl2 | KCl | NaCl | CaCl2 | Total |
|---|---|---|---|---|---|
| Weight percentage/% | 34.78 | 0.85 | 1.12 | 0.18 | 36.93 |
| Sample ID | Lime Dosage/% | Tail Salt Aggregate/% | Waste Brine Water/% | Solid Content/% |
|---|---|---|---|---|
| L0.5-65% | 0.5 | 64.5 | 35.0 | 65.0 |
| L0.5-70% | 0.5 | 69.5 | 30.0 | 70.0 |
| L0.5-75% | 0.5 | 74.5 | 25.0 | 75.0 |
| L0.7-65% | 0.7 | 64.3 | 35.0 | 65.0 |
| L1-55% | 1.0 | 54.0 | 45.0 | 55.0 |
| L1-60% | 1.0 | 59.0 | 40.0 | 60.0 |
| L1-70% | 1.0 | 69.0 | 30.0 | 70.0 |
| L1-50% | 1.5 | 48.5 | 50.0 | 50.0 |
| L1-55% | 1.5 | 53.5 | 45.0 | 55.0 |
| L1.5-60% | 1.5 | 58.5 | 40.0 | 60.0 |
| L2.5-40% | 2.5 | 37.5 | 60.0 | 40.0 |
| No. | Lime Dosage/% | Solid Content/% | Slurry Density/g·cm−3 | Pump Time/min | Conveying Distance/km | Bend Pressure Difference/kPa | Horizontal Pressure Loss/kPa·m−1 | Weight Pressure/MPa | Theoretical Free-Flow Distance/km |
|---|---|---|---|---|---|---|---|---|---|
| 1 | 0.5 | 65 | 1.74 | 60 | 5.8 | 5.9 | 2.7 | 5.22 | 1.93 |
| 2 | 70 | 1.79 | 60 | 5.8 | 6.5 | 3.0 | 5.37 | 1.79 | |
| 3 | 75 | 1.90 | 60 | 5.8 | 20 | 11.8 | 5.70 | 0.48 | |
| 4 | 0.7 | 65 | 1.74 | 60 | 5.8 | 6.9 | 3.5 | 5.22 | 1.49 |
| 5 | 1 | 55 | 1.67 | 47 | 4.5 | 4.9 | 2.0 | 5.01 | 2.50 |
| 6 | 60 | 1.68 | 40 | 3.8 | 8.9 | 3.0 | 5.04 | 1.68 | |
| 7 | 70 | 1.81 | 21 | 2.0 | 20 | 20 | 5.43 | 0.27 | |
| 8 | 1.5 | 50 | 1.63 | 30 | 2.9 | 15.1 | 7.9 | 4.89 | 0.62 |
| 9 | 55 | 1.65 | 25 | 2.4 | 18.2 | 10.6 | 4.95 | 0.47 | |
| 10 | 60 | 1.69 | 20 | 1.9 | 19.8 | 12.5 | 5.07 | 0.40 | |
| 11 | 2.5 | 40 | 1.50 | 27 | 2.6 | 18.1 | 11.8 | 4.50 | 0.38 |
| No. | Lime Dosage/% | Cw/% | ρg/g·cm−3 | P | β | v’/m·s−1 | v/m·s−1 |
|---|---|---|---|---|---|---|---|
| 1 | 0.5 | 65 | 1.74 | 1.86 | 0.44 | 1.31 | 1.51 |
| 2 | 70 | 1.79 | 2.33 | 0.46 | 1.50 | 1.73 | |
| 3 | 75 | 1.90 | 3.00 | 0.53 | 1.85 | 2.13 | |
| 4 | 0.7 | 65 | 1.74 | 1.86 | 0.44 | 1.31 | 1.51 |
| 5 | 1 | 55 | 1.67 | 1.22 | 0.39 | 1.05 | 1.20 |
| 6 | 60 | 1.68 | 1.50 | 0.40 | 1.13 | 1.30 | |
| 7 | 70 | 1.81 | 2.33 | 0.48 | 1.54 | 1.77 | |
| 8 | 1.5 | 50 | 1.63 | 1.00 | 0.37 | 0.93 | 1.07 |
| 9 | 55 | 1.65 | 1.22 | 0.38 | 1.02 | 1.17 | |
| 10 | 60 | 1.69 | 1.50 | 0.41 | 1.15 | 1.32 | |
| 11 | 2.5 | 40 | 1.50 | 0.67 | 0.29 | 0.65 | 0.75 |
| No. | Lime Dosage/% | Solid Content/% | Compressive Strength Before Loop Tests/MPa | Compressive Strength After Loop Tests/MPa | ||||
|---|---|---|---|---|---|---|---|---|
| 28 d | 60 d | 180 d | 28 d | 60 d | 180 d | |||
| 1 | 0.5 | 65 | 0.77 | 0.81 | 0.83 | 0.89 | 0.93 | 1.00 |
| 2 | 70 | 1.01 | 1.12 | 1.15 | 1.01 | 1.08 | 1.10 | |
| 3 | 75 | 1.09 | 1.11 | 1.18 | 1.15 | 1.15 | 1.24 | |
| 4 | 0.7 | 65 | 0.84 | 0.96 | 1.04 | 0.95 | 0.98 | 1.05 |
| 5 | 1 | 55 | 0.69 | 0.72 | 0.85 | 0.73 | 0.82 | 0.91 |
| 6 | 60 | 0.88 | 0.92 | 1.03 | 0.89 | 0.92 | 0.97 | |
| 7 | 70 | 1.18 | 1.21 | 1.53 | 1.38 | 1.40 | 1.46 | |
| 8 | 1.5 | 50 | 0.89 | 0.91 | 1.02 | 0.84 | 0.88 | 0.92 |
| 9 | 55 | 0.97 | 1.04 | 1.15 | 1.01 | 1.05 | 1.12 | |
| 10 | 60 | 1.22 | 1.26 | 1.33 | 1.20 | 1.25 | 1.42 | |
| 11 | 2.5 | 40 | 0.91 | 0.98 | 1.13 | 0.86 | 0.93 | 1.11 |
Disclaimer/Publisher’s Note: The statements, opinions and data contained in all publications are solely those of the individual author(s) and contributor(s) and not of MDPI and/or the editor(s). MDPI and/or the editor(s) disclaim responsibility for any injury to people or property resulting from any ideas, methods, instructions or products referred to in the content. |
© 2025 by the authors. Licensee MDPI, Basel, Switzerland. This article is an open access article distributed under the terms and conditions of the Creative Commons Attribution (CC BY) license (https://creativecommons.org/licenses/by/4.0/).
Share and Cite
Jin, R.; Li, J.; Wang, X.; Ma, X.; Ntokoma, D.; Huo, H.; Zhang, S.; Ni, W.; Hitch, M. Optimizing Lime-Based Cemented Paste Backfill for Potash Mines: A Comprehensive Loop Test Study on Slurry Transportation Characteristics. Processes 2025, 13, 1171. https://doi.org/10.3390/pr13041171
Jin R, Li J, Wang X, Ma X, Ntokoma D, Huo H, Zhang S, Ni W, Hitch M. Optimizing Lime-Based Cemented Paste Backfill for Potash Mines: A Comprehensive Loop Test Study on Slurry Transportation Characteristics. Processes. 2025; 13(4):1171. https://doi.org/10.3390/pr13041171
Chicago/Turabian StyleJin, Rongzhen, Jiajie Li, Xue Wang, Xuming Ma, Desire Ntokoma, Huimin Huo, Siqi Zhang, Wen Ni, and Michael Hitch. 2025. "Optimizing Lime-Based Cemented Paste Backfill for Potash Mines: A Comprehensive Loop Test Study on Slurry Transportation Characteristics" Processes 13, no. 4: 1171. https://doi.org/10.3390/pr13041171
APA StyleJin, R., Li, J., Wang, X., Ma, X., Ntokoma, D., Huo, H., Zhang, S., Ni, W., & Hitch, M. (2025). Optimizing Lime-Based Cemented Paste Backfill for Potash Mines: A Comprehensive Loop Test Study on Slurry Transportation Characteristics. Processes, 13(4), 1171. https://doi.org/10.3390/pr13041171