

Study of Carvedilol–β-Cyclodextrin Derivatives Interactions

 ,
,  ,
,  , , ,
, , ,  , ,
, ,  ,
,  and
and 
Abstract
1. Introduction
2. Materials and Methods
2.1. Materials
2.2. Preparation of the Solid Binary Systems
2.3. Determination of the Stability Constant and Binding Ratio
2.4. Encapsulation Efficiency and Loading Efficiency Analysis
2.5. Thermal Analysis
2.6. Powder X-Ray Diffraction
2.7. FTIR Spectroscopy
2.8. Solubility Profile After Complexation
3. Results and Discussion
3.1. Determination of the Stability Constant and Binding Ratio
3.2. Encapsulation Efficiency and Loading Efficiency Analysis
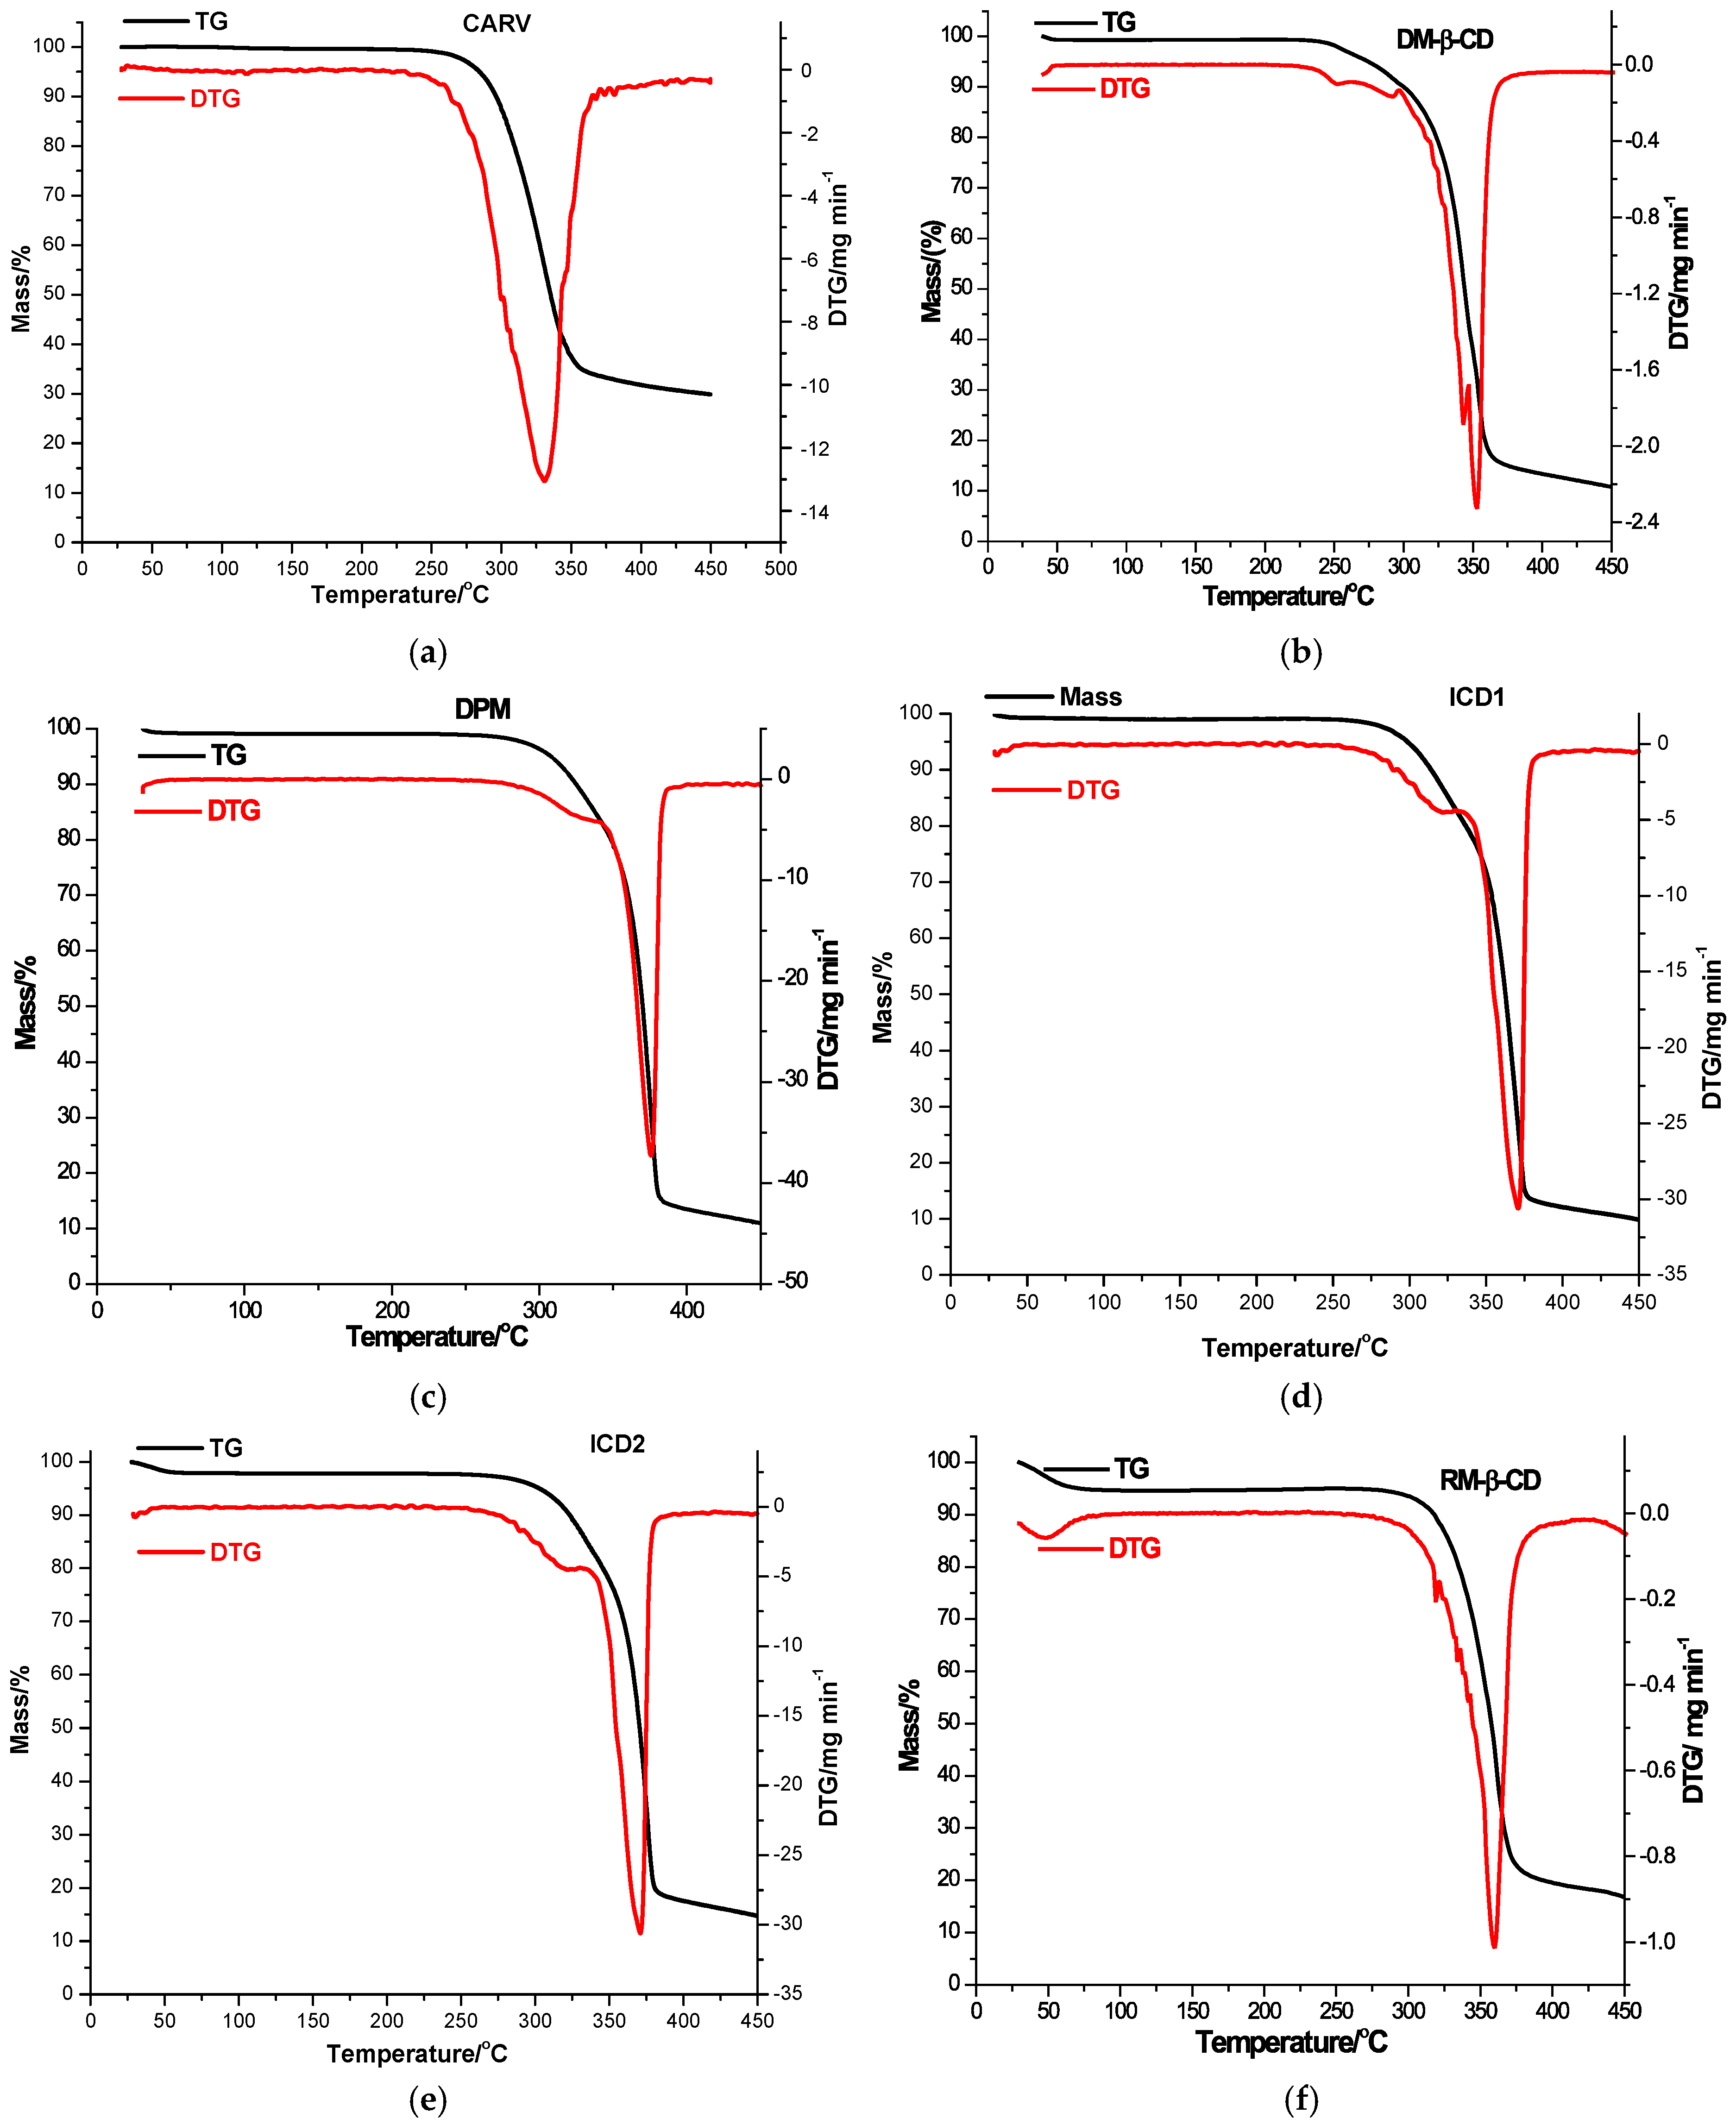
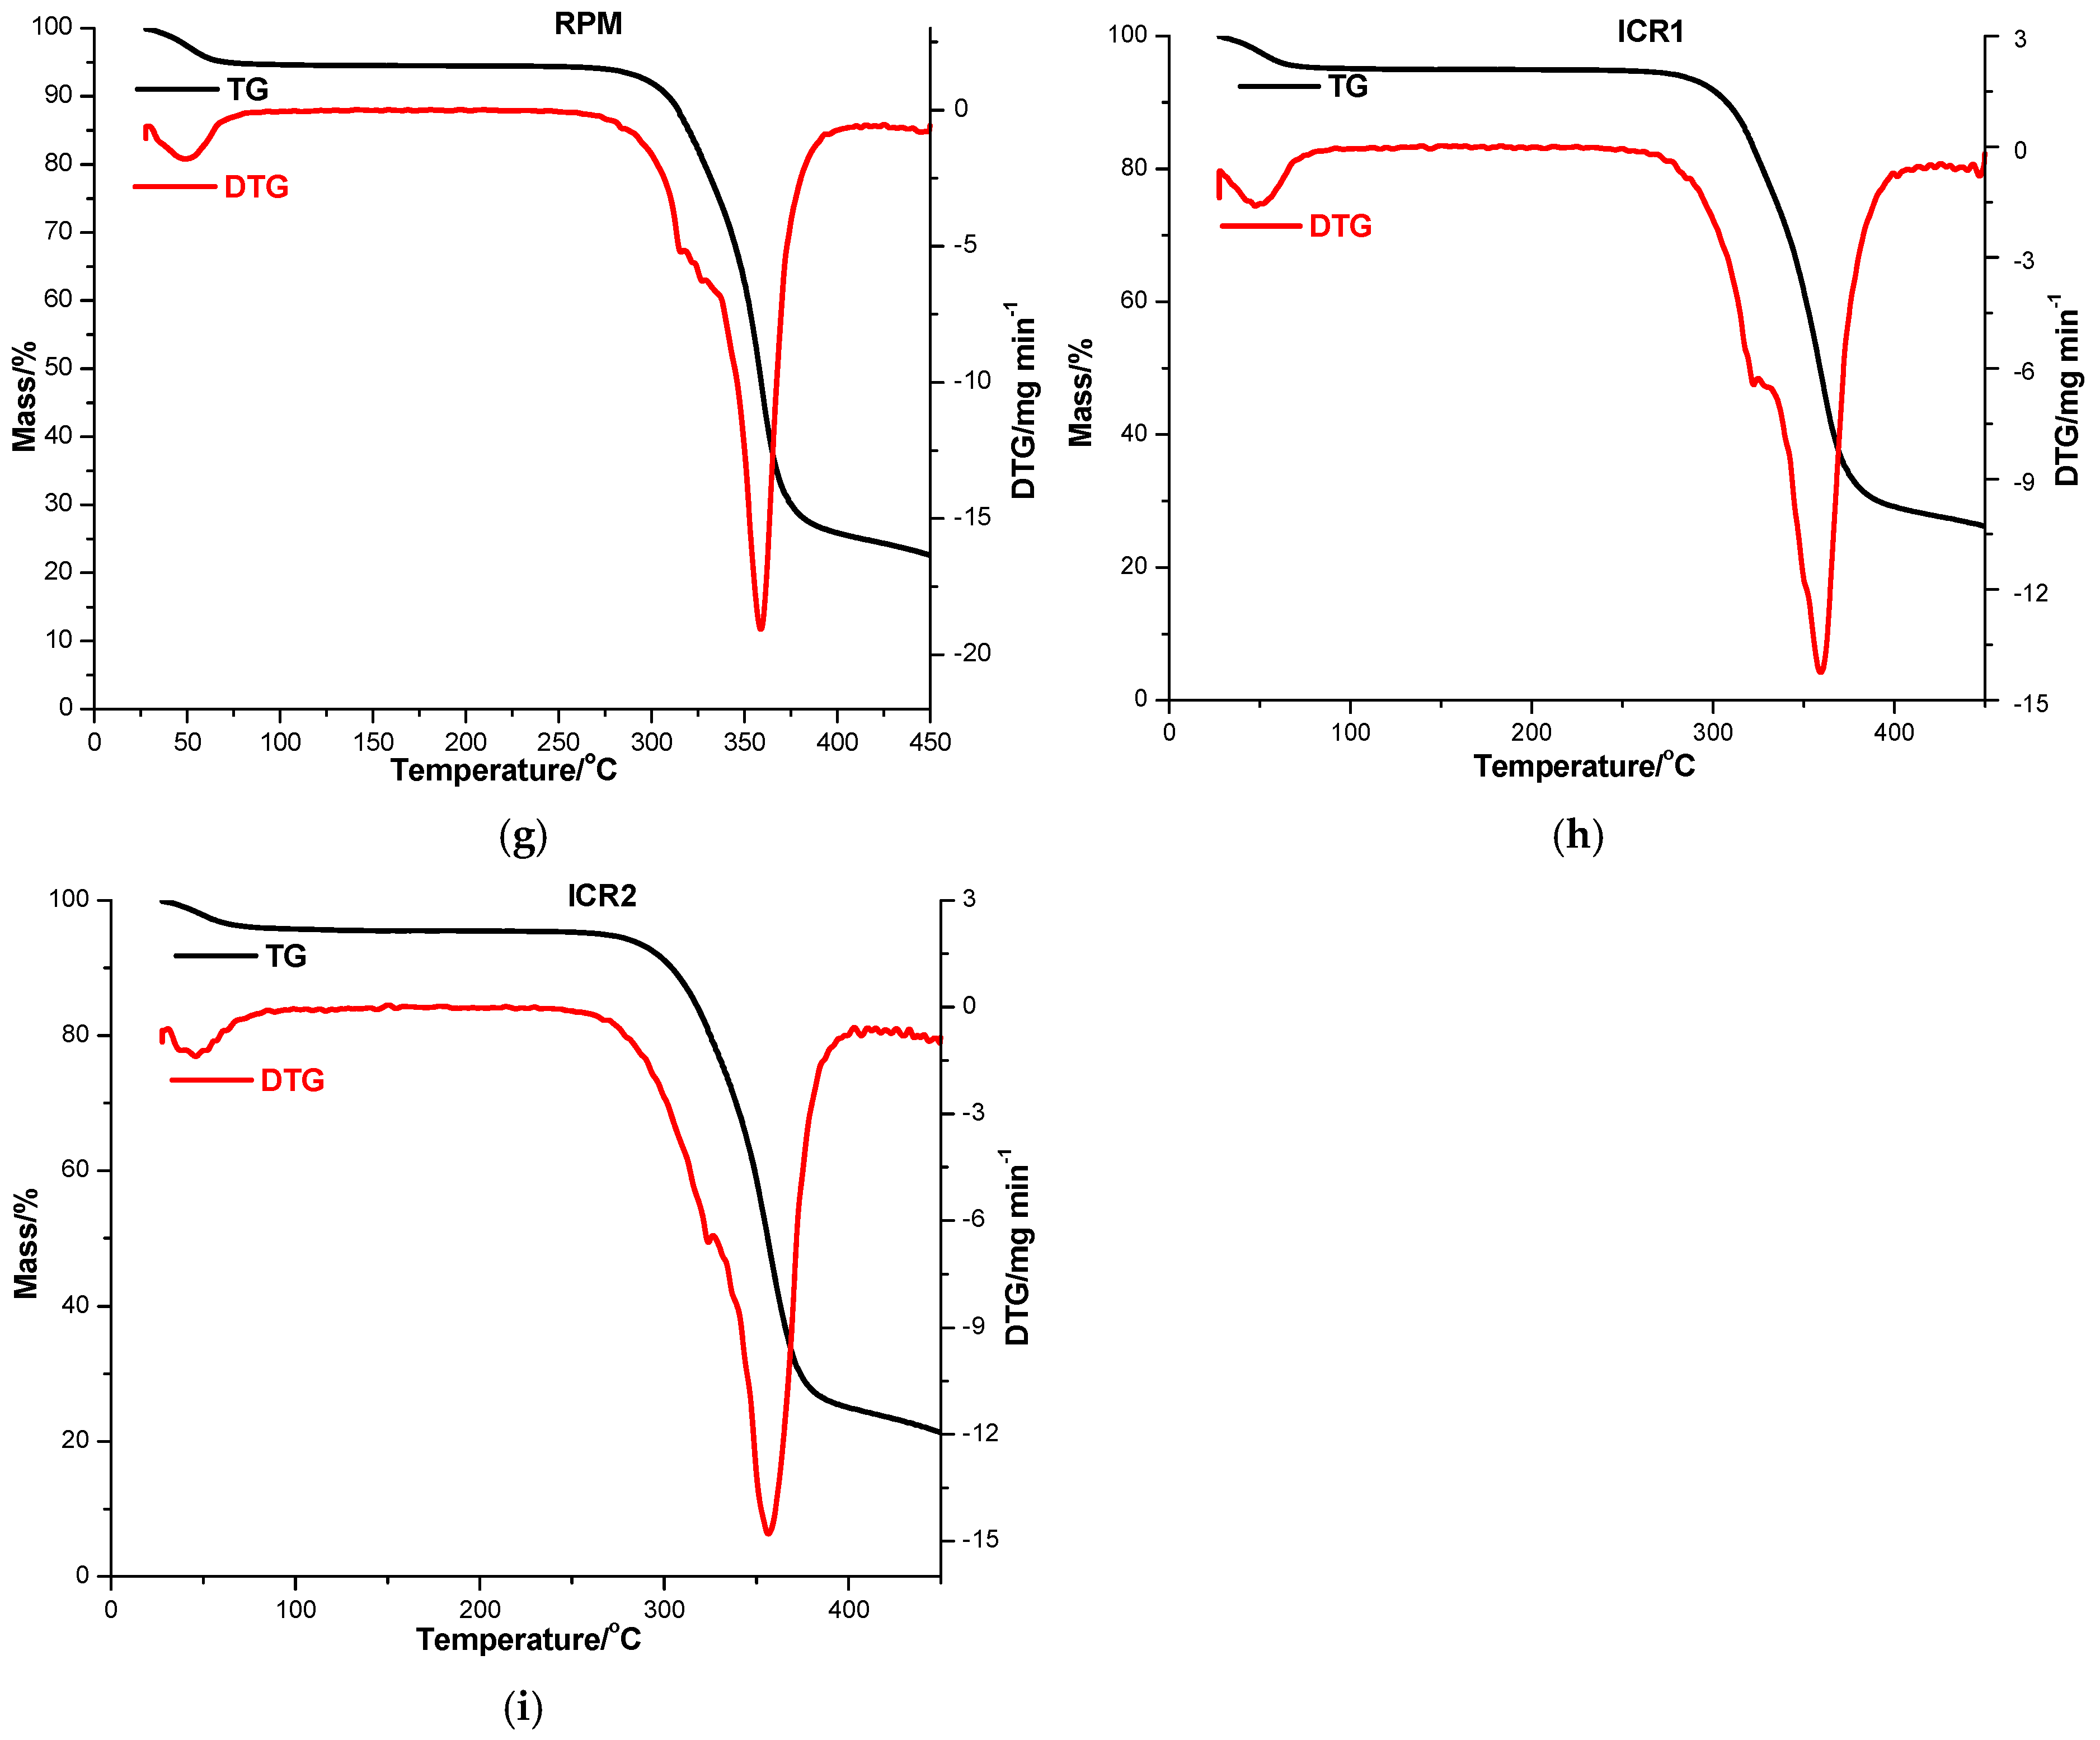
3.3. Thermal Analysis
3.4. FTIR Spectroscopy
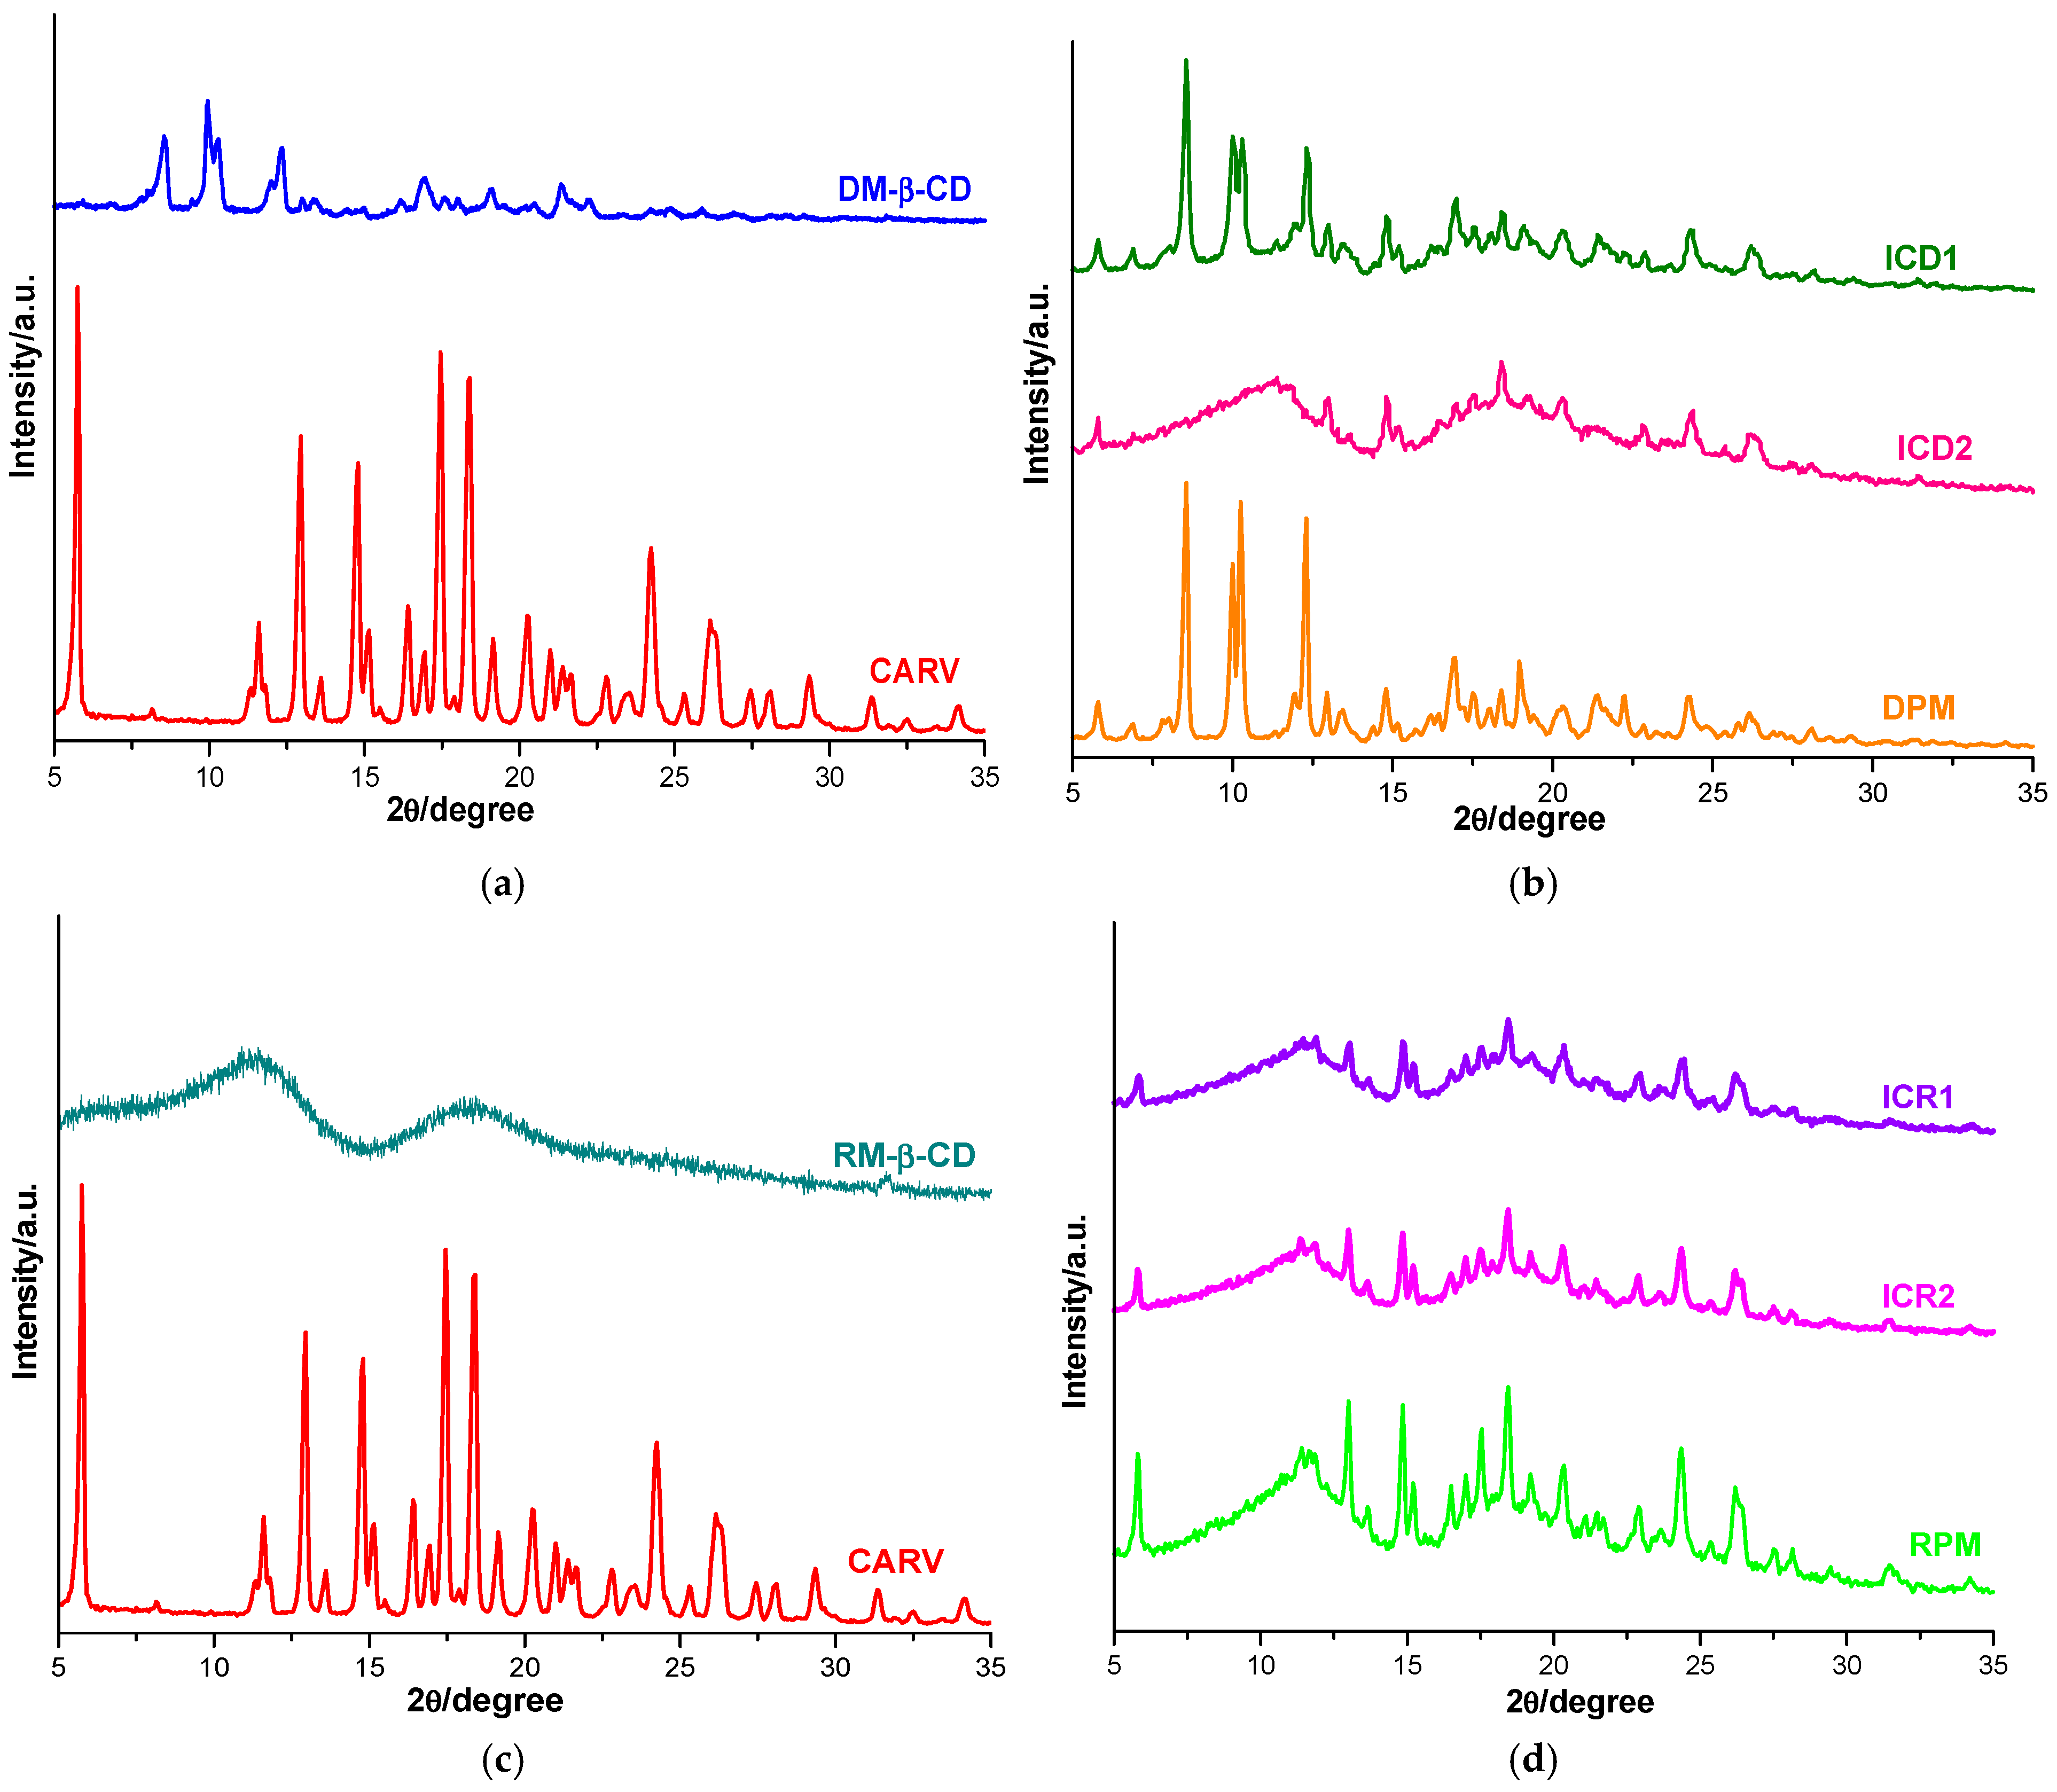
3.5. Powder X-Ray Diffraction
3.6. Solubility Profile After Complexation
4. Conclusions
Supplementary Materials
Author Contributions
Funding
Data Availability Statement
Conflicts of Interest
Abbreviations
| CARV | Carvedilol |
| CD | Cyclodextrin |
| IC | Inclusion complex |
| UV | Ultraviolet |
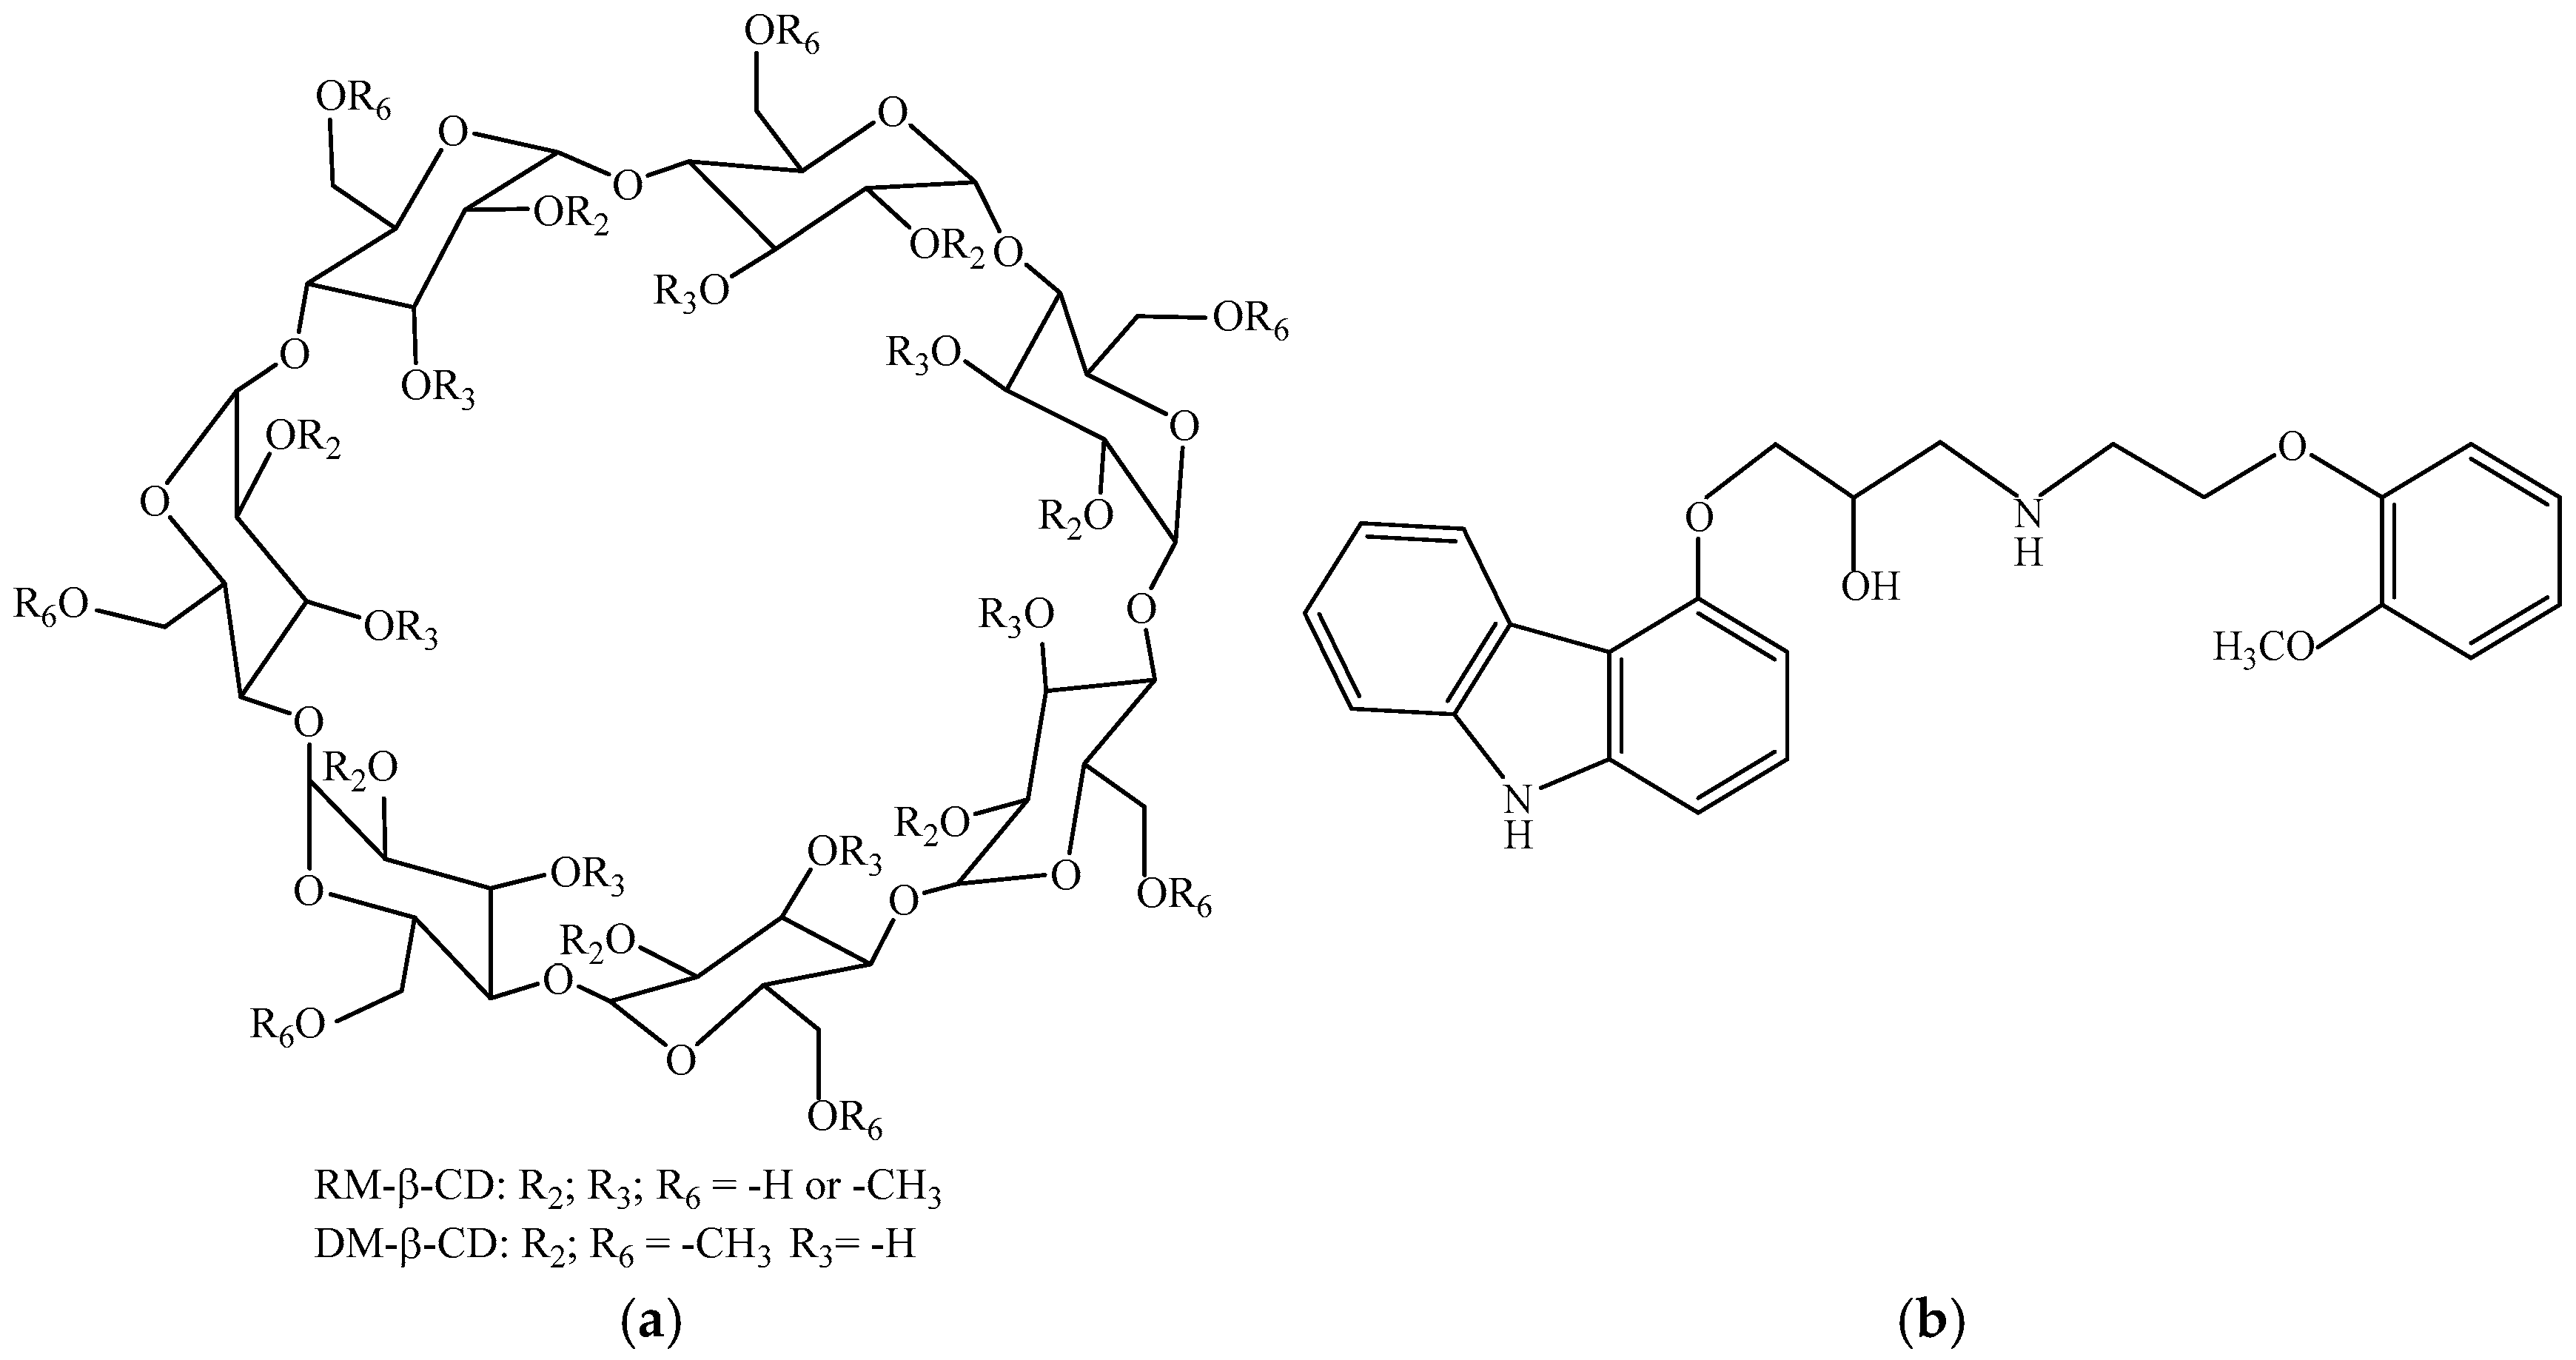
| DM-β-CD | Heptakis(2,6-di-O-methyl)-β-cyclodextrin |
| RM-β-CD | Randomly methylated β-cyclodextrin |
| α-CD | Alpha cyclodextrin |
| β-CD | Beta cyclodextrin |
| γ-CD | Gamma cyclodextrin |
| HP-β-CD | Hydroxypropyl-β-cyclodextrin |
| TG | Thermogravimetry |
| DTG | Derivative thermogravimetry |
| PXRD | Powder X-ray diffractometry |
| UATR-FTIR | Universal-attenuated total reflectance Fourier transform infrared |
| DS | Degree of substitution |
| ICD1 | CARV/DM-β-CD inclusion complex prepared with distilled water (without ethanol) |
| ICR1 | CARV/RM-β-CD inclusion complex prepared with distilled water (without ethanol) |
| ICD2 | CARV/DM-β-CD inclusion complex prepared with distilled water/ethanol |
| ICR2 | CARV/RM-β-CD inclusion complex prepared with distilled water/ethanol |
| PM | Physical mixture |
| KP | Kneaded product |
| A | Absorbance |
| C | Concentration |
| DPM | Physical mixture of CARV with DM-β-CD |
| RPM | Physical mixture of CARV with RM-β-CD |
References
- Zarghampour, A.; Jouyban, K.; Jouyban-Gharamaleki, V.; Jouyban, A.; Rahimpour, E. A Description on the Shake-Flask and Laser Monitoring-Based Techniques for Determination of the Drug’s Solubility. Pharm. Sci. 2024, 30, 274–278. [Google Scholar] [CrossRef]
- Nyamba, I.; Sombié, C.B.; Yabré, M.; Zimé-Diawara, H.; Yaméogo, J.; Ouédraogo, S.; Lechanteur, A.; Semdé, R.; Evrard, B. Pharmaceutical Approaches for Enhancing Solubility and Oral Bioavailability of Poorly Soluble Drugs. Eur. J. Pharm. Biopharm. 2024, 204, 114513. [Google Scholar] [CrossRef]
- Zhuo, Y.; Zhao, Y.G.; Zhang, Y. Enhancing Drug Solubility, Bioavailability, and Targeted Therapeutic Applications Through Magnetic Nanoparticles. Molecules 2024, 29, 4854. [Google Scholar] [CrossRef]
- Kumari, L.; Choudhari, Y.; Patel, P.; Gupta, G.D.; Singh, D.; Rosenholm, J.M.; Bansal, K.K.; Kurmi, B. Das Advancement in Solubilization Approaches: A Step Towards Bioavailability Enhancement of Poorly Soluble Drugs. Life 2023, 13, 1099. [Google Scholar] [CrossRef] [PubMed]
- Mura, P. Analytical Techniques for Characterization of Cyclodextrin Complexes in the Solid State: A Review. J. Pharm. Biomed. Anal. 2015, 113, 226–238. [Google Scholar] [CrossRef]
- Nicolaescu, O.E.; Belu, I.; Mocanu, A.G.; Manda, V.C.; Rău, G.; Pîrvu, A.S.; Ionescu, C.; Ciulu-Costinescu, F.; Popescu, M.; Ciocîlteu, M.V. Cyclodextrins: Enhancing Drug Delivery, Solubility and Bioavailability for Modern Therapeutics. Pharmaceutics 2025, 17, 288. [Google Scholar] [CrossRef]
- Hădărugă, N.G.; Bandur, G.N.; David, I.; Hădărugă, D.I. A Review on Thermal Analyses of Cyclodextrins and Cyclodextrin Complexes. Environ. Chem. Lett. 2019, 17, 349–373. [Google Scholar] [CrossRef]
- Chandra, S.; Sangeetha, S.; Kavibharathi, S.; Nandhini, B.; Suresh, R.; Sanjeevkumar, C. Approach to enhance the solubility of carvedilol using β-CD complexation. World J. Pharm. Res. 2015, 10, 163. [Google Scholar] [CrossRef]
- Poulson, B.G.; Alsulami, Q.A.; Sharfalddin, A.; El Agammy, E.F.; Mouffouk, F.; Emwas, A.H.; Jaremko, L.; Jaremko, M. Cyclodextrins: Structural, Chemical, and Physical Properties, and Applications. Polysaccharides 2022, 3, 1. [Google Scholar] [CrossRef]
- Kou, X.; Xu, X.; Gao, N.; Zhang, Y.; Huang, X.; Chen, F.; Ke, Q.; Meng, Q. Supramolecular Chemistry in Cyclodextrin Inclusion Complexes: The Formation Rules of Terpenes/β-Cyclodextrin Inclusion Complexes. Food Hydrocoll. 2024, 157, 110441. [Google Scholar] [CrossRef]
- Zhou, J.; Jia, J.; He, J.; Li, J.; Cai, J. Cyclodextrin Inclusion Complexes and Their Application in Food Safety Analysis: Recent Developments and Future Prospects. Foods 2022, 11, 3871. [Google Scholar] [CrossRef]
- Ahad, A.; Jardan, Y.A.B.; Raish, M.; Al-Mohizea, A.M.; Al-Jenoobi, F.I. Ternary Inclusion Complex of Sinapic Acid with Hydroxypropyl-β-Cyclodextrin and Hydrophilic Polymer Prepared by Microwave Technology. Processes 2022, 10, 2637. [Google Scholar] [CrossRef]
- Sbârcea, L.; Udrescu, L.; Ledeţi, I.; Szabadai, Z.; Fuliaş, A.; Sbârcea, C. β-Cyclodextrin Inclusion Complexes of Lisinopril and Zofenopril: Physicochemical Characterization and Compatibility Study of Lisinopril-β-Cyclodextrin with Lactose. J. Therm. Anal. Calorim. 2016, 123, 2377–2390. [Google Scholar] [CrossRef]
- Arruda, T.R.; Silva, R.R.A.; Marques, C.S.; e Moraes, A.R.F.; Bernardes, P.C.; de Oliveira, T.V.; de Oliveira, S.O.; Muranyi, P.; Soares, N.d.F.F. β-Cyclodextrin versus Hydroxypropyl-β-Cyclodextrin: Is Inclusion Complexation a Suitable Alternative to Improve the Properties of Hop-Derived β-Acids? Food Hydrocoll. 2024, 149, 109622. [Google Scholar] [CrossRef]
- Li, H.; Chang, S.L.; Chang, T.R.; You, Y.; Wang, X.D.; Wang, L.W.; Yuan, X.F.; Tan, M.H.; Wang, P.D.; Xu, P.W.; et al. Inclusion Complexes of Cannabidiol with β-Cyclodextrin and Its Derivative: Physicochemical Properties, Water Solubility, and Antioxidant Activity. J. Mol. Liq. 2021, 334, 116070. [Google Scholar] [CrossRef]
- Shinde, B.; Patil, D.; Nandre, V.; Gautam, M.; Doshi, P.; Gairola, S. Development and Validation of a Spectrophotometric Method for Quantification of Residual Cyclodextrin (DIMEB; Heptakis) in Pertussis Antigens. Biologicals 2023, 81, 101663. [Google Scholar] [CrossRef]
- Wang, M.; Bai, J.; Chen, W.N.; Ching, C.B. Metabolomic Profiling of Cellular Responses to Carvedilol Enantiomers in Vascular Smooth Muscle Cells. PLoS ONE 2010, 5, e15441. [Google Scholar] [CrossRef]
- Zawadzka, K.; Bernat, P.; Felczak, A.; Lisowska, K. Microbial Detoxification of Carvedilol, a Β-Adrenergic Antagonist, by the Filamentous Fungus Cunninghamella Echinulata. Chemosphere 2017, 183, 18–26. [Google Scholar] [CrossRef]
- Loftsson, T.; Vogensen, S.B.; Desbos, C.; Jansook, P. Carvedilol: Solubilization and Cyclodextrin Complexation: A Technical Note. AAPS PharmSciTech 2008, 9, 425–430. [Google Scholar] [CrossRef] [PubMed]
- Ruffolo, R.R.; Feuerstein, G.Z. Carvedilol. In Comprehensive Medicinal Chemistry II; Elsevier: Amsterdam, The Netherlands, 2007; pp. 137–147. [Google Scholar] [CrossRef]
- Zawadzka, K.; Bernat, P.; Felczak, A.; Różalska, S.; Lisowska, K. Antibacterial Activity of High Concentrations of Carvedilol against Gram-Positive and Gram-Negative Bacteria. Int. J. Antimicrob. Agents 2018, 51, 458–467. [Google Scholar] [CrossRef]
- Zawadzka, K.; Felczak, A.; Głowacka, I.E.; Piotrowska, D.G.; Lisowska, K.; Janga, C. Evaluation of the Antimicrobial Potential and Toxicity of a Newly Synthesised 4-(4-(Benzylamino)Butoxy)-9H-Carbazole. Int. J. Mol. Sci. 2021, 22, 12796. [Google Scholar] [CrossRef] [PubMed]
- Hajighasemi, F.; Gaeini, A. Sensitivity of Human Leukemic Cells to Carvedilol. J. Basic Clin. Pathophysiol. 2018, 7, 37–42. [Google Scholar] [CrossRef]
- O’Reilly, M.; Kirkwood, N.K.; Kenyon, E.J.; Huckvale, R.; Cantillon, D.M.; Waddell, S.J.; Ward, S.E.; Richardson, G.P.; Kros, C.J.; Derudas, M. Design, Synthesis, and Biological Evaluation of a New Series of Carvedilol Derivatives That Protect Sensory Hair Cells from Aminoglycoside-Induced Damage by Blocking the Mechanoelectrical Transducer Channel. J. Med. Chem. 2019, 62, 5312–5329. [Google Scholar] [CrossRef]
- Abdullah Shamim, M.; Yeung, S.; Shahid, A.; Chen, M.; Wang, J.; Desai, P.; Parsa, C.; Orlando, R.; Meyskens, F.L.; Kelly, K.M.; et al. Topical Carvedilol Delivery Prevents UV-Induced Skin Cancer with Negligible Systemic Absorption. Int. J. Pharm. 2022, 611, 121302. [Google Scholar] [CrossRef]
- Huang, K.M.; Liang, S.; Yeung, S.; Oiyemhonlan, E.; Cleveland, K.H.; Parsa, C.; Orlando, R.; Meyskens, F.L.; Andresen, B.T.; Huang, Y. Topically Applied Carvedilol Attenuates Solar Ultraviolet Radiation Induced Skin Carcinogenesis. Cancer Prev. Res. 2017, 10, 598–606. [Google Scholar] [CrossRef]
- Prieto, C.; Evtoski, Z.; Pardo-Figuerez, M.; Lagaron, J.M. Bioavailability Enhancement of Nanostructured Microparticles of Carvedilol. J. Drug Deliv. Sci. Technol. 2021, 66, 102780. [Google Scholar] [CrossRef]
- Sharapova, A.V.; Ol’khovich, M.V.; Blokhina, S.V. Thermodynamic Consideration of Dissolution and Distribution Behavior of Carvedilol in Pharmaceutical Significant Media. J. Chem. Thermodyn. 2024, 190, 107207. [Google Scholar] [CrossRef]
- Beattie, K.; Phadke, G.; Novakovic, J. Carvedilol. In Profiles of Drug Substances, Excipients and Related Methodology; Academic Press Inc.: Cambridge, MA, USA, 2013; Volume 38, pp. 113–157. [Google Scholar]
- Deris Prado, L.; Vinícius, H.; Rocha, A.; Lamounier, J.A.; Resende, C.; Ferreira, G.B.; Rangel, A.M.; Teixeira, F. An insight into carvedilol solid forms: Effect of supramolecular interactions on the dissolution profiles. CrystEngComm 2014, 16, 3168–3179. [Google Scholar] [CrossRef]
- Sopyan, I.; Sari, W.A.; Megantara, S.; Rusdiana, T. Solubility Enhancement of Carvedilol by Multicomponent Crystal Approach Using Glycine and Arginine as Coformers. Pharmacia 2023, 70, 1479–1486. [Google Scholar] [CrossRef]
- Hosny, K.M.; El-Say, K.M.; Alkhalidi, H.M. Quality by Design Approach to Screen the Formulation and Process Variables Influencing the Characteristics of Carvedilol Solid Lipid Nanoparticles. J. Drug Deliv. Sci. Technol. 2018, 45, 168–176. [Google Scholar] [CrossRef]
- Zhang, Y.; Zhi, Z.; Li, X.; Gao, J.; Song, Y. Carboxylated Mesoporous Carbon Microparticles as New Approach to Improve the Oral Bioavailability of Poorly Water-Soluble Carvedilol. Int. J. Pharm. 2013, 454, 403–411. [Google Scholar] [CrossRef] [PubMed]
- Wei, L.; Sun, P.; Nie, S.; Pan, W. Preparation and Evaluation of SEDDS and SMEDDS Containing Carvedilol. Drug Dev. Ind. Pharm. 2005, 31, 785–794. [Google Scholar] [CrossRef]
- Sharma, A.; Jain, C.P. Carvedilol-β-Cyclodextrin Systems: Preparation, Characterization and In Vitro Evaluation. Dhaka Univ. J. Pharm. Sci. 2013, 12, 51–58. [Google Scholar] [CrossRef]
- Rigaud, S.; Mathiron, D.; Moufawad, T.; Landy, D.; Djedaini-Pilard, F.; Marçon, F. Cyclodextrin Complexation as a Way of Increasing the Aqueous Solubility and Stability of Carvedilol. Pharmaceutics 2021, 13, 1746. [Google Scholar] [CrossRef]
- Yuvaraja, K.; Khanam, J. Enhancement of Carvedilol Solubility by Solid Dispersion Technique Using Cyclodextrins, Water Soluble Polymers and Hydroxyl Acid. J. Pharm. Biomed. Anal. 2014, 96, 10–20. [Google Scholar] [CrossRef] [PubMed]
- Pham, T.L.; Usacheva, T.R.; Kuz’mina, I.A.; Nguyen, T.N.; Thai, H.; Volkova, M.A.; Le, H.K.; Nguyen, T.D.; Volynkin, V.A.; Tran, D.L. Effect of Cyclodextrin Types and Reagents Solvation on the Stability of Complexes Between B-Cyclodextrins and Rutin in Water-Ethanol Solvents. J. Mol. Liq. 2020, 318, 114308. [Google Scholar] [CrossRef]
- Li, P.; Zhao, L.; Yalkowsky, S.H. Combined Effect of Cosolvent and Cyclodextrin on Solubilization of Nonpolar Drugs. J. Pharm. Sci. 1999, 88, 1107–1111. [Google Scholar] [CrossRef]
- Crestani De Miranda, J.; Elyan, T.; Martins, A.; Veiga, F.; Gomes Ferraz, H. Cyclodextrins and Ternary Complexes: Technology to Improve Solubility of Poorly Soluble Drugs. Braz. J. Pharm. Sci. 2011, 47, 665–681. [Google Scholar] [CrossRef]
- Chatjigakis, A.K.; Donz6, C.; Coleman, A.W.; Cardot, P. Solubility Behavior of @-Cyciodextrin In WaterKosolvent Mixtures. Amerlcan Chem. Soc. 1992, 64, 1632–1634. [Google Scholar]
- Charumanee, S.; Okonogi, S.; Sirithunyalug, J.; Wolschann, P.; Viernstein, H. Effect of Cyclodextrin Types and Co-Solvent on Solubility of a Poorly Water Soluble Drug. Sci. Pharm. 2016, 84, 694–704. [Google Scholar] [CrossRef]
- Kou, X.; Zhang, Y.; Su, D.; Wang, H.; Huang, X.; Niu, Y.; Ke, Q.; Xiao, Z.; Meng, Q. Study on Host-Guest Interaction of Aroma Compounds/γ-Cyclodextrin Inclusion Complexes. LWT 2023, 178, 114589. [Google Scholar] [CrossRef]
- Xiao, Z.; Yu, P.; Sun, P.; Kang, Y.; Niu, Y.; She, Y.; Zhao, D. Inclusion Complexes of β-Cyclodextrin with Isomeric Ester Aroma Compounds: Preparation, Characterization, Mechanism Study, and Controlled Release. Carbohydr. Polym. 2024, 333, 121977. [Google Scholar] [CrossRef] [PubMed]
- Hu, Z.; Li, S.; Wang, S.; Zhang, B.; Huang, Q. Encapsulation of Menthol into Cyclodextrin Metal-Organic Frameworks: Preparation, Structure Characterization and Evaluation of Complexing Capacity. Food Chem. 2021, 338. [Google Scholar] [CrossRef] [PubMed]
- Yin, H.; Wang, C.; Yue, J.; Deng, Y.; Jiao, S.; Zhao, Y.; Zhou, J.; Cao, T. Optimization and Characterization of 1,8-Cineole/Hydroxypropyl-β-Cyclodextrin Inclusion Complex and Study of Its Release Kinetics. Food Hydrocoll. 2021, 110, 106159. [Google Scholar] [CrossRef]
- Man, D.E.; Nițu, E.T.; Temereancă, C.; Sbârcea, L.; Ledeți, A.; Ivan, D.; Ridichie, A.; Andor, M.; Jîjie, A.R.; Barvinschi, P.; et al. Host–Guest Complexation of Olmesartan Medoxomil by Heptakis(2,6-Di-O-Methyl)-β-Cyclodextrin: Compatibility Study with Excipients. Pharmaceutics 2024, 16, 1557. [Google Scholar] [CrossRef]
- Sbârcea, L.; Tănase, I.M.; Ledeți, A.; Cîrcioban, D.; Vlase, G.; Barvinschi, P.; Miclău, M.; Văruţ, R.M.; Suciu, O.; Ledeți, I. Risperidone/Randomly Methylated β-Cyclodextrin Inclusion Complex—Compatibility Study with Pharmaceutical Excipients. Molecules 2021, 26, 1690. [Google Scholar] [CrossRef]
- Savic-Gajic, I.; Savic, I.M.; Nikolic, V.D.; Nikolic, L.B.; Popsavin, M.M.; Kapor, A.J. Study of the Solubility, Photostability and Structure of Inclusion Complexes of Carvedilol with β-Cyclodextrin and (2-Hydroxypropyl)-β-Cyclodextrin. J. Incl. Phenom. Macrocycl. Chem. 2016, 86, 7–17. [Google Scholar] [CrossRef]
- Ramanjaneyulu, G.S.; Kumar, I.V.S.; Rao, K.N.; Kishore, J.V.V.K. Process for the Preparation of Carvedilol Form II. U.S. Patent 8,058,453 B2, 1 November 2011. [Google Scholar]
- Jagannathan, L.; Meenakshi, R.; Gunasekaran, S.; Srinivasan, S. FT-IR, FT-Raman and UV-Vis Spectra and Quantum Chemical Investigation of Carvedilol. Mol. Simul. 2010, 36, 283–290. [Google Scholar] [CrossRef]
- Tănase, I.M.; Sbârcea, L.; Ledeţi, A.; Barvinschi, P.; Cîrcioban, D.; Vlase, G.; Văruţ, R.M.; Ledeţi, I. Compatibility Studies with Pharmaceutical Excipients for Aripiprazole–Heptakis (2,6-Di-O-Methyl)-β-Cyclodextrin Supramolecular Adduct. J. Therm. Anal. Calorim. 2020, 142, 1963–1976. [Google Scholar] [CrossRef]
- Circioban, D.; Ledeţi, I.; Vlase, G.; Ledeţi, A.; Axente, C.; Vlase, T.; Dehelean, C. Kinetics of Heterogeneous-Induced Degradation for Artesunate and Artemether. J. Therm. Anal. Calorim. 2018, 134, 749–756. [Google Scholar] [CrossRef]
- Tănase, I.M.; Sbârcea, L.; Ledeți, A.; Vlase, G.; Barvinschi, P.; Văruţ, R.M.; Dragomirescu, A.; Axente, C.; Ledeți, I. Physicochemical Characterization and Molecular Modeling Study of Host–Guest Systems of Aripiprazole and Functionalized Cyclodextrins. J. Therm. Anal. Calorim. 2020, 141, 1027–1039. [Google Scholar] [CrossRef]
- Sbârcea, L.; Tănase, I.M.; Ledeți, A.; Cîrcioban, D.; Vlase, G.; Barvinschi, P.; Miclău, M.; Văruţ, R.M.; Trandafirescu, C.; Ledeți, I. Encapsulation of Risperidone by Methylated β-Cyclodextrins: Physicochemical and Molecular Modeling Studies. Molecules 2020, 25, 5694. [Google Scholar] [CrossRef] [PubMed]
- Detrich, Á.; Dömötör, K.J.; Katona, M.T.; Markovits, I.; Vargáné Láng, J. Polymorphic Forms of Bisoprolol Fumarate: Preparation and Characterization. J. Therm. Anal. Calorim. 2019, 135, 3043–3055. [Google Scholar] [CrossRef]
- Zoghbi, A.; Geng, T.; Wang, B. Dual Activity of Hydroxypropyl-β-Cyclodextrin and Water-Soluble Carriers on the Solubility of Carvedilol. AAPS PharmSciTech 2017, 18, 2927–2935. [Google Scholar] [CrossRef] [PubMed]
- Kaczmarek-Klinowska, M.; Łudzik, K.; Jażdżewska, M.; Jóźwiak, M.; Hornowski, T.; Bilski, P. Characterization of Behavior of the Inclusion Complex between Methyl-β-Cyclodextrin and Nimodipine in Water-Ethanol Mixed Media. J. Mol. Liq. 2024, 395. [Google Scholar] [CrossRef]
- Jambhekar, S.S.; Breen, P. Cyclodextrins in Pharmaceutical Formulations II: Solubilization, Binding Constant, and Complexation Efficiency. Drug Discov. Today 2016, 21, 363–368. [Google Scholar] [CrossRef]
- Saokham, P.; Muankaew, C.; Jansook, P.; Loftsson, T. Solubility of Cyclodextrins and Drug/Cyclodextrin Complexes. Molecules 2018, 23, 1161. [Google Scholar] [CrossRef]
- Andor, M.; Temereancă, C.; Sbârcea, L.; Ledeți, A.; Man, D.E.; Mornoș, C.; Ridichie, A.; Cîrcioban, D.; Vlase, G.; Barvinschi, P.; et al. Host–Guest Interaction Study of Olmesartan Medoxomil with β-Cyclodextrin Derivatives. Molecules 2024, 29, 2209. [Google Scholar] [CrossRef]


| Sample | Solvent Used | Fitting Correlation Coefficients of 1/ΔA vs. 1/[CD] | Fitting Correlation Coefficients of 1/ΔA vs. 1/[CD]2 | Stoichiometric Ratio of CARV to CD |
|---|---|---|---|---|
| CARV/DM-β-CD | distilled water | 0.9890 | 0.9355 | 1:1 |
| CARV/RM-β-CD | distilled water | 0.9875 | 0.9905 | 1:1 |
| CARV/DM-β-CD | distilled water/ ethanol absolute | 0.9898 | 0.9206 | 1:1 |
| CARV/RM-β-CD | distilled water/ ethanol absolute | 0.9900 | 0.8959 | 1:1 |
| Sample | Solvent Used | Binding Constant |
|---|---|---|
| CARV/DM-β-CD | distilled water | 486.614 ± 3.958 M−1 |
| CARV/RM-β-CD | distilled water | 531.848 ± 4.137 M−1 |
| CARV/DM-β-CD | distilled water/ethanol absolute | 559.731 ± 5.541 M−1 |
| CARV/RM-β-CD | distilled water/ethanol absolute | 492.649 ± 4.015 M−1 |
| Sample | TG | Δm (%) | Mass Residue (%) | DTG | ||
|---|---|---|---|---|---|---|
| Tonset (°C) | Toffset (°C) | Tonset (°C) | Tpeak (°C) | |||
| CARV | 220 | 450 | 70.12 | 29.88 | 220 | 331 |
| DM-β-CD | 30 | 57 | 0.83 | 10.77 | – | – |
| 226 | 347 | 56.26 | 226 | 343 | ||
| 347 | 450 | 32.14 | 347 | 353 | ||
| DPM | 30 | 55 | 0.78 | 10.98 | – | – |
| 242 | 342 | 16.24 | 242 | 323 | ||
| 342 | 450 | 72.00 | 342 | 376 | ||
| ICD1 | 30 | 55 | 0.72 | 9.89 | – | – |
| 250 | 330 | 16.45 | 250 | 322 | ||
| 330 | 450 | 72.94 | 330 | 371 | ||
| ICD2 | 30 | 64 | 2.09 | 14.77 | – | – |
| 257 | 345 | 17.69 | 257 | 322 | ||
| 345 | 450 | 65.45 | 345 | 371 | ||
| RM-β-CD | 30 | 100 | 5.36 | 16.78 | 30 | 48 |
| 262 | 450 | 77.86 | 262 | 360 | ||
| RPM | 30 | 84 | 5.22 | 22.60 | 30 | 49 |
| 250 | 450 | 72.18 | 140 | 359 | ||
| ICR1 | 30 | 84 | 4.76 | 26.20 | 30 | 48 |
| 256 | 450 | 69.04 | 256 | 359 | ||
| ICR2 | 30 | 96 | 4.21 | 21.32 | 30 | 46 |
| 250 | 450 | 74.47 | 250 | 356 | ||
| Sample | FTIR Spectral Regions (cm−1) | ||
|---|---|---|---|
| 4000–2200 | 2000–1000 | 1000–600 | |
| CARV | 3342; 3304; 2923; 2835 | 1607; 1588; 1502; 1453; 1443; 1348; 1334; 1303; 1286; 1252; 1239; 1223; 1213; 1177; 1156; 1118; 1097; 1041; 1021 | 980; 958; 914; 870; 858; 850; 784; 759; 746; 728; 719; 620 |
| DM-β-CD | 3408; 2925; 2835 | 1451; 1365; 1194; 1156; 1084; 1045; 1008 | 967; 948; 915; 857; 765; 705; 672 |
| DPM | 3342; 2923; 2835; 2359; 2324 | 1608; 1588; 1502; 1453; 1444; 1364; 1348; 1334; 1303; 1256; 1252; 1223; 1213; 1176; 1156; 1118; 1088; 1042; 1021 | 968; 958; 914; 870; 857; 851; 784; 759; 748; 728; 719; 619; 667 |
| ICD1 | 3343; 2924; 2844; 2363; 2322 | 1608; 1507; 1457; 1364; 1258; 1216; 1199; 1156; 1085; 1047; 1021 | 968; 916; 857; 784; 761; 746; 729; 721; 669 |
| ICD2 | 3345; 2924; 2835; 2364; 2322 | 1608; 1560; 1507; 1457; 1256; 1216; 1198; 1156; 1085; 1045; 1021 | 966; 916; 858; 784; 759; 749; 728; 721; 669 |
| RM-β-CD | 3369; 2927; 2835 | 1643; 1452; 1365; 1196; 1154; 1081; 1029 | 966; 857; 755; 703 |
| RPM | 3342; 2924; 2835; 2363; 2324 | 1608; 1591; 1502; 1453; 1444; 1364; 1348; 1305; 1256; 1239; 1223; 1214; 1176; 1156; 1118; 1021 | 959; 914; 870; 859; 851; 784; 760; 748; 729; 719; 669 |
| ICR1 | 3343; 2924; 2835; 2360; 2323 | 1609; 1588; 1540; 1507; 1457; 1256; 1214; 1154; 1084; 1038; 1022 | 965; 914; 858; 784; 759; 748; 728; 721; 669 |
| ICR2 | 3343; 2924; 2835; 2359; 2324 | 1609; 1559; 1540; 1507; 1457; 1256; 1214; 1154; 1084; 1036; 1021 | 965; 914; 857; 784; 758; 748; 728; 719; 669 |
Disclaimer/Publisher’s Note: The statements, opinions and data contained in all publications are solely those of the individual author(s) and contributor(s) and not of MDPI and/or the editor(s). MDPI and/or the editor(s) disclaim responsibility for any injury to people or property resulting from any ideas, methods, instructions or products referred to in the content. |
© 2025 by the authors. Licensee MDPI, Basel, Switzerland. This article is an open access article distributed under the terms and conditions of the Creative Commons Attribution (CC BY) license (https://creativecommons.org/licenses/by/4.0/).
Share and Cite
Niţu, E.-T.; Ridichie, A.; Temereancă, C.; Mitrofan, I.; Buliga, L.; Simu, S.; Muntean, C.; Rusu, G.; Ledeţi, I.; Ledeţi, A.; et al. Study of Carvedilol–β-Cyclodextrin Derivatives Interactions. Processes 2025, 13, 1141. https://doi.org/10.3390/pr13041141
Niţu E-T, Ridichie A, Temereancă C, Mitrofan I, Buliga L, Simu S, Muntean C, Rusu G, Ledeţi I, Ledeţi A, et al. Study of Carvedilol–β-Cyclodextrin Derivatives Interactions. Processes. 2025; 13(4):1141. https://doi.org/10.3390/pr13041141
Chicago/Turabian StyleNiţu, Ema-Teodora, Amalia Ridichie, Claudia Temereancă, Ioana Mitrofan, Luciana Buliga, Sebastian Simu, Cornelia Muntean, Gerlinde Rusu, Ionuţ Ledeţi, Adriana Ledeţi, and et al. 2025. "Study of Carvedilol–β-Cyclodextrin Derivatives Interactions" Processes 13, no. 4: 1141. https://doi.org/10.3390/pr13041141
APA StyleNiţu, E.-T., Ridichie, A., Temereancă, C., Mitrofan, I., Buliga, L., Simu, S., Muntean, C., Rusu, G., Ledeţi, I., Ledeţi, A., & Sbârcea, L. (2025). Study of Carvedilol–β-Cyclodextrin Derivatives Interactions. Processes, 13(4), 1141. https://doi.org/10.3390/pr13041141