Article

New TLC-Densitometric Method for the Quantification of Donepezil in Tablets

Department of Analytical Chemistry, Faculty of Pharmaceutical Sciences in Sosnowiec, Medical University of Silesia in Katowice, Jagiellońska 4, 41-200 Sosnowiec, Poland
*
Authors to whom correspondence should be addressed.
Processes 2025, 13(4), 1106; https://doi.org/10.3390/pr13041106
Submission received: 6 March 2025 / Revised: 28 March 2025 / Accepted: 4 April 2025 / Published: 7 April 2025

Abstract

:
A new TLC method combined with densitometry was developed for the determination of donepezil hydrochloride in Cogiton Biofarm and Donecept Actavis tablets. The analyses were performed on TLC silica gel 60F254 plates with mobile phase of n-butanol + n-propanol + acetone + water + glacial acetic acid at ratio of 2:2:1:1:1, v/v. The proposed mobile phase is miscible and after development the chromatographic plate has a homogeneous background in visible light. Densitometric analysis at λ = 319 nm was used for quantitative studies. The method was linear from 1.0 to 5.0 µg/spot and from 0.2 to 1.0 µg/spot and it was validated for both concentration ranges. The presented method is rapid, selective, linear, accurate, precise, robust, and economical. The results of the donepezil content in drugs calculated from both calibration curves were that no statistically significant differences were observed. The obtained content of donepezil in Cogiton (99.2%) and Donecept (99.0%) tablets is within the deviations permitted by the European Pharmacopoeia in relation to the amount declared by the manufacturer. The novelty of the study consists of the development of chromatographic conditions allowing the separation of as many as six donepezil degradation products with the simultaneous use of TLC chromatographic plates. As a result, the proposed method is economical, since it is several times cheaper than using HPTLC plates. While Ali et al. separated a maximum of three degradation products from donepezil, Pandey et al. successfully separated only two donepezil-related substances from donepezil. The proposed new TLC method combined with densitometry can be used for the routine control of donepezil in pharmaceutical preparations (tablets). Since TLC is less sensitive and precise compared to HPLC, it can be used as a complementary technique.

1. Introduction

Alzheimer’s disease is a neurodegenerative disorder and causes memory dysfunction, cognitive impairment and other symptoms [1]. Donepezil hydrochloride is a drug for the treatment of mild to moderate dementia of the Alzheimer’s type. It belongs to the group of acetylcholinesterase inhibitors [2]. In pharmaceutical preparations, donepezil hydrochloride is in the form of tablets in doses of 5 mg or 10 mg, and it is marketed in Poland under the trade name of Cogiton, Donecept, Alzepezil, and Memorion [3]. The most commonly used techniques for the determination of donepezil hydrochloride in pharmaceutical preparations are RP-HPLC with a UV detector [4,5,6,7,8], RP-HPLC with a DAD detector [9,10], RP-HPLC with a PDA detector [11,12], RP-HPLC with a fluorescence detector [13], the chiral HPLC method [14], the spectrophotometric method [15], and the voltammetric method [16].
Kumar et al. [4] developed the RP-HPLC method with UV detection at 268 nm for the determination of donepezil hydrochloride in tablets. Chromatographic separation was achieved using a Keystone Phenyl RP column (250 × 4.6 mm, 5 μm) with a mobile phase of methanol, 0.02 M phosphate buffer (pH = 7.5), and triethylamine at a ratio of 60:40:0.5, v/v. The flow rate and retention time were 1.0 mL/min and 7.05 min, respectively. Liew et al. [5] elaborated the RP-HPLC method for the determination of donepezil hydrochloride in a drug solution and orally disintegrating tablet. The separation was carried out using an Agilent Eclipse Plus C-18 column (250 × 4.6 mm, 5 μm) with UV detection at 268 nm and with a mobile phase of phosphate buffer (pH = 2.7), methanol, and acetonitrile (50:30:20, v/v). Saleh et al. [6] reported the RP-HPLC method with UV detection at 210 nm for the determination of donepezil hydrochloride in tablets. Chromatographic separation was achieved within 10 min on a Hypersil column (250×4.6 mm, 5 μm) with a mobile phase of acetonitrile and 0.025 M phosphate buffer (pH = 3.5) at a ratio of 80:20, v/v. Abdul-Sattar et al. [7] developed the RP-HPLC method with UV detection at 232 nm for the determination of donepezil and memantine in tablets. The separation was performed on a Hypersil BDS C18 column (250 × 4.6 mm, 5 μm) with a mobile phase of phosphate buffer and acetonitrile at a ratio of 60:40, v/v. The flow rate and retention time were 1.0 mL/min and 8 min, respectively. In another study, the RP-HPLC method with UV detection at 268 nm was used to determine donepezil hydrochloride in tablets. Chromatographic separation was carried out on an Ace 5 C18 column (250 × 460 mm, 5 μm) with a mobile phase of 0.05 M phosphate buffer (pH = 2.0) and acetonitrile (55:45, v/v) [8]. Korany et al. [9] developed the eco-friendly RP-HPLC-DAD method for the determination of donepezil hydrochloride in tablet dosage form in the presence of its pharmacopoeia-related compound (donepezil-related compound A) and its various degradation products. For this purpose, Zorbax Eclipse Plus C18 fast resolution column (4.6 × 100 mm, 3.5 μm) and a mobile phase consisting of 0.05 M acetate buffer (pH = 5.5) and ethanol (72.5:27.5, v/v) were used. The flow rate was 1.0 mL/min, and the DAD detector was set to 315 nm [9]. Ragab and Bahgat [10] reported the RP-HPLC-DAD method for the simultaneous assay of donepezil hydrochloride and citalopram in tablets. Drug separation was performed on an RP-C18 Hypersil Gold C18 column (100 mm × 4.6 mm, 5 μm) with a mobile phase of acetonitrile and 0.05 M phosphate buffer (35:65, v/v). The DAD detector was set at 232 nm [10]. In another study, the RP-HPLC-PDA method was used to determine donepezil hydrochloride in tablets [11,12]. Barot and Patel [11] performed chromatographic separation on an Intersil C8-3 column (250 × 4.6 mm, 5 μm) with a mobile phase of phosphate buffer, methanol, and triethylamine (550:450:5 v/v) with detection at 271 nm. Singh et al. [12] obtained chromatographic separation using a Kromasil C18 column (250 × 4.6 mm, 5 m) and a mobile phase of methanol and phosphate buffer (40:60, v/v). The flow rate and retention time were 1.2 mL/min and 15 min, respectively. A PDA detector was used at a wavelength of 268 nm [12]. In the study conducted by Abonassif et al. [13], the RP-HPLC-FLD method was developed to determine donepezil hydrochloride in tablets. The internal standard was pindolol. Chromatographic separation was carried out on a Phenyl Hypersil C18 column (125 mm × 4.6 mm, 3 μm) with a mobile phase of methanol, phosphate buffer (pH = 3.5), and triethylamine (55:45:0.5, v/v). The flow rate was 0.9 mL/min [13]. Alzoman et al. [14] elaborated on the chiral HPLC method for the simultaneous assay of S-(+)- and R(-)-donepezil enantiomers in tablets. The separation was carried out on a Chiracel-OJ-H column (250 mm × 4.6 mm) with a mobile phase of ethanol, n-hexane, and triethylamine (20:80:0.3, v/v). The internal standard was arotinolol. Shirwaikar et al. [15] reported a spectrophotometric method to determine donepezil hydrochloride in tablets. It involved the formation of an ionic complex between donepezil and the dye bromocresol purple in a phthalate buffer solution. The formed complex was extracted with chloroform and then the absorbance was measured using a spectrophotometer. The absorption maximum was at a wavelength of 410 nm [15]. Öztürk et al. [16] developed novel voltammetric methods for the determination of donepezil using the prepared carbon paste electrode. As a result of the optimization, the composition of the carbon paste was set as 25% mineral oil and 75% graphite powder. A quantitative analysis of donepezil was carried out using differential pulse voltammetry (DPV) or square wave voltammetry (SWV) in a Britton–Robinson buffer at pH = 8.0.
A review of the literature reveals that there are not many TLC-densitometric methods available for the determination of donepezil hydrochloride in tablet dosage forms. Ali et al. [17] reported the HPTLC method using aluminum plates coated with silica gel 60 F254 and a mobile phase of butanol, water, and glacial acetic acid at a ratio of 5:4:1, v/v [17]. Pandey and Dongre [18] used the same mobile phase but at a ratio of 4:5:1, v/v. The authors presented densitograms of the donepezil standard, the donepezil from the drug, and densitograms of three related substances that differed only slightly in RF values. The authors did not present details of the study methodology used. The results and discussion were presented in a very general manner [18]. The mobile phase used in works [17,18] was immiscible. As a result, the background of the obtained chromatographic plate after development was not homogeneous. For this reason, the results of densitometric analyses and the detection of potential impurities may be falsified. Therefore, the aim of this work was to develop a new, fully validated TLC method combined with densitometry using other mobile phases to quantify donepezil hydrochloride in Cogiton Biofarm 5 mg and Donecept Actavis 5 mg tablets.

2. Materials and Methods

2.1. Chemicals and Reagents

The following solvents were used as components of the mobile phases in the study: methanol (POCh, Gliwice, Poland), n-propanol (Eurochem, Tarnów, Poland), n-butanol (Roanal, Budapest, Hungary), acetone (PPH Stanlab, Lublin, Poland), glacial acetic acid (POCh, Gliwice, Poland), and distilled water (Analytical Chemistry Department, Sosnowiec, Poland). An amount of 30% hydrogen peroxide (Chempur, Piekary Śląskie, Poland), physiological salt (Gilbert, Hérouville-Saint-Clair, France), hydrochloric acid (POCh, Gliwice, Poland), and sodium hydroxide (POCh, Gliwice, Poland) were also used. All reagents used were of analytical purity. Donepezil hydrochloride (Sigma-Aldrich, St. Louis, MI, USA) was used in the form of a powder, registered as a pharmaceutical standard. TLC analyses were carried out on aluminum plates coated with silica gel 60 F254 (#1.05554 and #1.05570, E. Merck, Darmstadt, Germany).

2.2. Preparation of Drug Solutions

To prepare the Cogiton Biofarm (CG) and Donecept Actavis (DT) drug solutions, 10 tablets of each drug were used. The tablets were placed in a plastic container, and 15 mL of methanol and three-balls mill were added. The contents of the container were then thoroughly mixed using an Ika® Ultra Turrax® Tube Drive. Extraction was carried out at 8000 rpm for 25 min. The obtained solutions were then filtered into a volumetric flask and supplemented with methanol to a volume of 50 mL. Final concentrations of 5 mg/5 mL were obtained, designated as CG1 and DT1 solutions. During extraction and subsequent filtration, the methanol-insoluble excipients present in donepezil tablets remained on the filter. However, the remaining components that dissolved in methanol did not interfere with donepezil, which can be seen on the densitograms of donepezil from tablets, because only one chromatographic band originating from donepezil is present on the densitogram.
Next, drug dilutions were prepared with the following concentrations: 3 mg/5 mL (CG2 and DT2), 1 mg/5 mL (CG3 and DT3), 0.6 mg/5 mL (CG4 and DT4), and 0.2 mg/5 mL (CG5 and DT5).

2.3. Donepezil Solutions Exposed to Stress Conditions

Donepezil standard solution was prepared by dissolving 50 mg of donepezil hydrochloride in 50 mL of methanol. From this solution, 1Dwz solution was prepared—i.e., a standard solution not subjected to stress conditions, as well as donepezil solutions subjected to stress conditions (UV light, heat, acid/base hydrolysis, and oxidation): 2Do—solution with the addition of distilled water, 3Do—solution with the addition of methanol, 4Do—solution with the addition of physiological salt, 5Do—solution with the addition of 30% hydrogen peroxide, 6Do—solution with the addition of hydrochloric acid, 7Do—solution with the addition of sodium hydroxide, 8DUV—solution with the addition of distilled water. Solutions: 2Do, 3Do, 4Do, 5Do, 6Do, and 7Do were heated at 80 °C for 4 h. 8DUV solution was irradiated with UV at a wavelength of 254 nm for 4 h. Details of the prepared solutions are presented in Table S1.

2.4. Method Validation

The validation was performed by determining selectivity, range and linearity, intraday and interday precision, accuracy, limit of detection, and quantification and robustness in accordance with applicable validation guidelines [19,20,21,22,23].

2.4.1. Selectivity

The selectivity of the method was established by selecting chromatographic conditions allowing for the separation of as many donepezil degradation products as possible. Degraded donepezil solutions (described in Section 2.3) were applied onto silica gel 60F254 plates (#1.05554) and then developed using the tested mobile phases A, B, and A1 to A8 (Table S2). Mobile phases A and B with the composition of n-butanol + water + glacial acetic acid at a volume ratio of 5:4:1 [17] and 4:5:1 [18] were taken from the literature. Finally, analyses were performed on activated (120 °C, 30 min) silica gel 60F254 plates and the optimal mobile phase selected was n-butanol, n-propanol, acetone, water, and glacial acetic acid at a volume ratio of 2:2:1:1:1 (chromatographic chamber saturation time was 30 min) and developed to a distance of 7.5 cm. After drying, the chromatographic plates were analyzed using densitometry and spectrodensitometry. The following parameters were used for densitometric analysis: slit size, 10 × 0.6 (mm, Macro), scanning speed, 40 nm/s, resolution, 200 µm/step. The parameters of the spectrodensitometric analyses were as follows: slit size, 10 × 0.6 (mm, Macro), scanning speed, 100 nm/s; resolution, 1 nm/step and UV range 200–450 nm. The wavelength of 319 nm (Figure S1) was optimal for densitometric studies and was used in the quantitative analysis of donepezil.

2.4.2. Range and Linearity

The donepezil hydrochloride standard solution was prepared by dissolving 50 mg of standard in 50 mL of methanol. A stock solution with a concentration of 5 mg/5 mL was obtained in this way. From a stock solution, a series of dilutions were prepared with the following concentrations: 5.0; 4.0; 3.0; 2.0; 1.0; 0.9; 0.8; 0.7; 0.6; 0.5; 0.4; 0.3; 0.2; and 0.1 mg/5 mL. Details are described in Table S3.

2.4.3. Precision

Intraday and interday precisions were determined by analyzing of donepezil solutions from Cogiton and Donecept preparations with the following concentrations: 5 mg/5 mL (CG1, DT1); 3 mg/5 mL (CG2, DT2); and 1 mg/5 mL (CG3, DT3) for the linear range from 1 to 5 µg/spot and 1.0 mg/5 mL (CG3 and DT3), 0.6 mg/5 mL (CG4 and DT4), and 0.2 mg/5 mL (CG5 and DT5) for the linear range from 0.2 to 1 µg/spot. Details are described in Table S3.

2.4.4. Accuracy

Accuracy was assessed based on recovery measurements. Three drug solutions containing 5 mg of donepezil were prepared, then the donepezil standard was added to them, which increased the donepezil content in its solutions by 50, 100, and 150%. Details are described in Table S3.

2.4.5. Limit of Detection (LOD) and Limit of Quantification (LOQ)

Donepezil standard solutions with the following concentrations: 0.2 mg/5 mL, 0.1 mg/5 mL, and 0.05 mg/5 mL were used to determine the limits of detection and quantification. Details are described in Table S3.

2.4.6. Robustness

The robustness of the method was checked according to the guidelines described in the publications by Nagy-Turák, Ferenczi-Fodor et al. [20,21,22], and Hendix [23] by changing seven parameters (Table S4). Details are described in Tables S3 and S4.
The results of donepezil content in the drugs were used to calculate the effects (E) characterizing the different conditions of analysis. The effects (E) were calculated from the equations:
E1 = 0.25·(y1 + y2 + y3 + y4) − 0.25·(y5 + y6 + y7 + y8)
E2 = 0.25·(y1 + y2 + y5 + y6) − 0.25·(y3 + y4 + y7 + y8)
E3 = 0.25·(y1 + y3 + y5 + y7) − 0.25·(y2 + y4 + y6 + y8)
E4 = 0.25·(y1 + y2 + y7 + y8) − 0.25·(y3 + y4 + y5 + y6)
E5 = 0.25·(y1 + y4 + y5 + y8) − 0.25·(y2 + y3 + y6 + y7)
E6 = 0.25·(y1 + y3 + y6 + y8) − 0.25·(y2 + y4 + y5 + y7)
E7 = 0.25·(y1 + y4 + y6 + y7) − 0.25·(y2 + y3 + y5 + y8)
where yi are the contents of donepezil in the tested tablets obtained under changed analysis conditions at high and low levels.
The calculated effects (E) were then evaluated using the half-normal probability plot [20]. The ranking probability was calculated from the formula:
pi = (i − 0.5)/N
where pi is the ranking probability of the i-th effect, i is the ranking of the effect under study, and N is the number of all effects [20,21,22,23].

2.5. Quantitative Determination of Donepezil in Donecept and Cogiton Preparation

The quantitative determination of donepezil in pharmaceutical preparations was performed using standard solutions and drug extracts (CG1, CG2, CG3, CG4, CG5, DT1, DT2, DT3, DT4, DT5).

2.6. Comparison of Determination of Donepezil in Tablets Using Two Ranges (Calibration Curves)

To check the significance of differences between the determined donepezil contents in tablets using two calibration curves, the Student’s t-test can be used.
Because the series had the same number, the value of the parameter t was calculated using the following formula:
t = x ¯ 1 x ¯ 2 s 1 2 + s 2 2 n
where: x ¯ 1 , x ¯ 2 were the average values, s1, s2 were the calculated standard deviations for the results obtained using the two compared ranges (calibration curves); n was the number of results.
The F-Snedecor value was also calculated using the following formula:
F = s 1 2 s 2 2
where: s1, s2 were the calculated standard deviations for the results obtained using the two calibration curves compared, on the assumption that s1 > s2.

2.7. Statistical Analysis

The Statistica v. 13 PL program (StatSoft, Kraków, Poland) was used to evaluate the obtained results, while the figures were created using the Microsoft Office Excel computer program.

3. Results and Discussion

3.1. Validation

The developed TLC-densitometric method was fully validated and the results are presented in Table 1 and Table 2, Figure 1 and Figure 2, Tables S5–S8, and Figures S1–S22, and in the following subsections.

3.1.1. Selectivity

The first mobile phases tested were labeled as ‘A’ and ‘B’ and consisting of n-butanol, water, and glacial acetic acid at a volume ratio of 5:4:1 [17] and 4:5:1 [18]. The phases separated into two after mixing the components of the literature mobile phases (A) and (B). The immiscibility of mobile phases A and B is due to the fact that n-butanol is poorly soluble in water, i.e., 79 g of n-butanol dissolves in 1000 g of water [24]. As a result, inhomogeneous backgrounds of the chromatographic plates were obtained after development. This is evidenced by the photo of the plate under UV light = 254 nm after development in the mobile phase (A), presented in Figure S2. It was found that plates with such inhomogeneous chromatographic backgrounds cannot be the basis for densitometric scanning. Therefore, new chromatographic conditions were sought. Namely, they were performed on TLC plates, not HPTLC, as was the case in the presented publications [17,18]. In addition, a suitable mobile phase was sought (by modifying mobile phases A and B) which would allow for the separation of as many donepezil degradation products as possible. Eight mobile phases labeled A1 to A8 were tested (Table S2). Figures S3 to S10 show photographs of the chromatographic plates under UV light at λ = 254 nm, after developing using the mobile phases A1 to A8, respectively. Table S5 presents the RF values of donepezil samples and its degradation products, as well as their spectral characteristics. No drug degradation products were detected in 1Dwz, 2Do, 3Do and 8DUV samples. Donepezil was not stable under the following conditions: after adding hydrogen peroxide and heating at 80 °C for 4 h (5Do); after adding hydrochloric acid and heating at 80 °C for 4 h (6Do); and after adding sodium hydroxide and heating at 80 °C for 4 h (7Do). In the case of the donepezil sample with the addition of physiological salt and heating at 80 °C for 4 h (4Do), after developing the chromatographic plates using the mobile phases A4, A6, and A7, the presence of one chromatographic spot was observed on the chromatograms, but with a different (higher) RF value than the donepezil standard. Table S6 presents a summary of donepezil stability study results using individual mobile phases and 4Do, 5Do, 6Do, and 7Do samples, taking into account the numbers of drug degradation products and the presence or absence of donepezil. Figures S11 to S14 show the densitograms of the donepezil standard and 5Do, 6Do, and 7Do samples after separation using mobile phase A6. Figures S15 to S18 show the densitograms of donepezil standard and 5Do, 6Do, and 7Do samples after separation using mobile phase A7. After analyzing the results presented in Table S6, it was stated that the most optimal phase for determining the drug stability was the mobile phase A6 due to the presence of the largest amount of donepezil degradation products in 5Do, 6Do and 7Do samples and the possibility of detecting the degradation product 4Do. This also means that the proposed chromatographic conditions allowed for the detection of a larger number of degradation products in comparison to the results of the publication by Ali et al. [17]. Namely, authors found the presence of a maximum of three donepezil degradation products in the sample with 30% hydrogen peroxide and after dry heat treatment, and two degradation products of donepezil samples in acidic and alkaline environments [17]. The proposed new mobile phase A6 (n-butanol + n-propanol + acetone + water + glacial acetic acid, 2:2:1:1:1, v/v) allowed the separation of the largest amount of donepezil degradation products. A maximum of six drug degradation products were detected. This was the case when using the A6 mobile phase for the sample with 2M hydrochloric acid (6Do) and 2M sodium hydroxide (7Do). In the case of the sample with the addition of 30% hydrogen peroxide (5Do), the presence of five donepezil degradation products was detected (no other tested mobile phase did not provide the detection of a larger number of donepezil degradation products). Therefore, the A6 mobile phase was indicated to be the optimal and used for the quantitative determination of donepezil in tablets.
Many impurities and degradation products of donepezil are known and have been separated and structurally identified [25,26,27,28,29]. Although the presence of six additional chromatographic bands on the densitograms was observed in the presented studies, there is no certainty that all degradants were separated via TLC, and there is also no guarantee that these are truly unique degradants of donepezil without confirmatory analysis, e.g., using the LC-MS or NMR techniques. This indicates major limitations of the TLC technique.

3.1.2. Range and Linearity

The linearity range was determined based on the area of donezepil chromatographic bands (Table S7). Linearity does not mean that in the entire concentration range, the function describing the dependence of the output signal on the analyte content takes the same form (the same values of the calibration curve coefficients). Linearity is a parameter indicating the proportional relationship between the signal and the quantity being determined, and it can be described by several equations (for a given range) depending on the analyte concentration level [30]. Therefore, in the studied concentration range from 0.1 to 5.0 µg/spot, two calibration curves were found: the first from 1.0 to 5.0 µg/spot (Figure S19A) and the second from 0.2 to 1.0 µg/spot (Figure S20A). The correlation coefficient in both cases was above 0.99. The significance level (p) equal to 0.0001 shows that there is a statistically significant correlation between the peak area registered from the chromatogram and the amount of donepezil. In addition to this, the residual plots (Figures S19B and S20B) against the concentration of donepezil were also plotted. The points in the residual plots are randomly scattered above and below the residual line = zero. The residuals shown in Figures S19B and S20B are not correlated; they are independent, and the correlation coefficients are equal to −0.00003 and −0.00000009, respectively. Therefore, the linear models are appropriate for modeling the data. The normality plots of residuals (Figures S19C and S20C) indicate that the points of residuals lie along straight lines, which confirms the normality of the residual’s distribution and, thus, the linearity of the proposed TLC method for the determination of donepezil in pharmaceutical preparations. The full method validation for both ranges is presented in Table 1. Ali et al. [17] obtained linearity from 50–1000 ng/spot, and the correlation coefficient was above 0.99. Thus, values of a similar order were obtained.

3.1.3. Accuracy

Accuracy was determined based on the mean recovery and the coefficient of variation values. For donepezil determined in the higher range, the mean recovery values R were from 96.1% to 98.0%, and from 96.9% to 99.8% in the Cogiton and Donecept preparations, respectively. The CV values in the tested preparations ranged from 0.88% to 1.17% and from 1.40% to 1.82%, respectively (Table 1). For donepezil determined in the lower range, the mean recovery values R were from 97.8% to 99.2%, and from 97.1% to 98.4% in the Cogiton and Donecept preparations, appropriately. The CV values in the examined preparations ranged from 1.11% to 2.01% and from 1.78% to 2.13%, appropriately (Table 1). The calculated CV values were less than 3% in both cases, confirming that the TLC method used is accurate. The method developed by Ali et al. [17] was characterized by similar accuracy; the recovery value R ranged from 98.98% to 99.98%.

3.1.4. Precision

The precision of the method used was determined based on the area of donepezil chromatographic bands. For intraday precision determined in the higher range, the CV values were from 0.52% to 2.66%, and from 0.32% to 0.93% in the Cogiton and Donecept preparations, respectively. For interday precision determined in the higher range, the CV values were from 0.28% to 0.88%, and from 0.50% to 1.09% in the Cogiton and Donecept preparations, respectively (Table 1). For intraday precision determined in the lower range, the CV values were from 1.73% to 2.66%, and from 0.93% to 2.04% in the Cogiton and Donecept preparations, appropriately. For interday precision determined in the lower range, the CV values were from 0.88% to 1.89%, and from 0.85% to 2.18% in the Cogiton and Donecept preparations, respectively (Table 1). The CV values were less than 3% in both cases, confirming that the TLC method used is precise. Ali et al. [17] obtained the results ≤ 0.303% (intraday precision) and ≤0.357% (interday precision), which indicates that their method was also precise.
After reviewing the publicly available literature on the determination of donepezil using liquid chromatography and spectrophotometry, the obtained precision and LOD results were compared with those obtained by the authors of other studies (Table 3). A comparison of donepezil precision using TLC and HPLC techniques (Table 3) shows that in the vast majority of analyses, lower precision CV values were obtained using HPLC and spectrophotometric methods. This indicates certain limitations of the TLC technique.

3.1.5. Limit of Detection (LOD) and Limit of Quantification (LOQ)

The limit of detection and quantification of donepezil were calculated using formulas (11) and (12) presented in Table S3. Two calculation methods were used, one using the standard deviation of the intercept and the second using the residual standard deviation. Based on the obtained results, the mean LOD and LOQ values for donepezil were 0.049 and 0.147 µg/spot, respectively. The low LOD value indicates that the proposed TLC-densitometric method is sensitive.
In order to consider the calculated LOD and LOQ values as correct, the solutions used should satisfy the following relationship:
10 × L O D > c
and
L O D < c
c—concentration of substance in standard solutions.
The concentrations of donepezil used to determine the LOD and LOQ were 0.05, 0.1, and 0.2 µg/spot, which meets the above relationships; therefore, the calculated LOD and LOQ values were determined correctly.
Ali et al. [17] and Pandey et al. [18] achieved the LOD of 15.4 ng/spot and 80.85 ng/spot, respectively, using the HPTLC method. The LODs of a similar order were also obtained for donepezil assayed using RP-HPLC-UV [7,8]. The LOD of a similar order was achieved in the proposed method. A comparison of the LOD of donepezil determination using TLC and HPLC techniques (Table 3) shows that in the vast majority of analyses, lower LOD values were obtained using the HPLC and spectrophotometric methods. This indicates certain limitations of the TLC technique.

3.1.6. Robustness

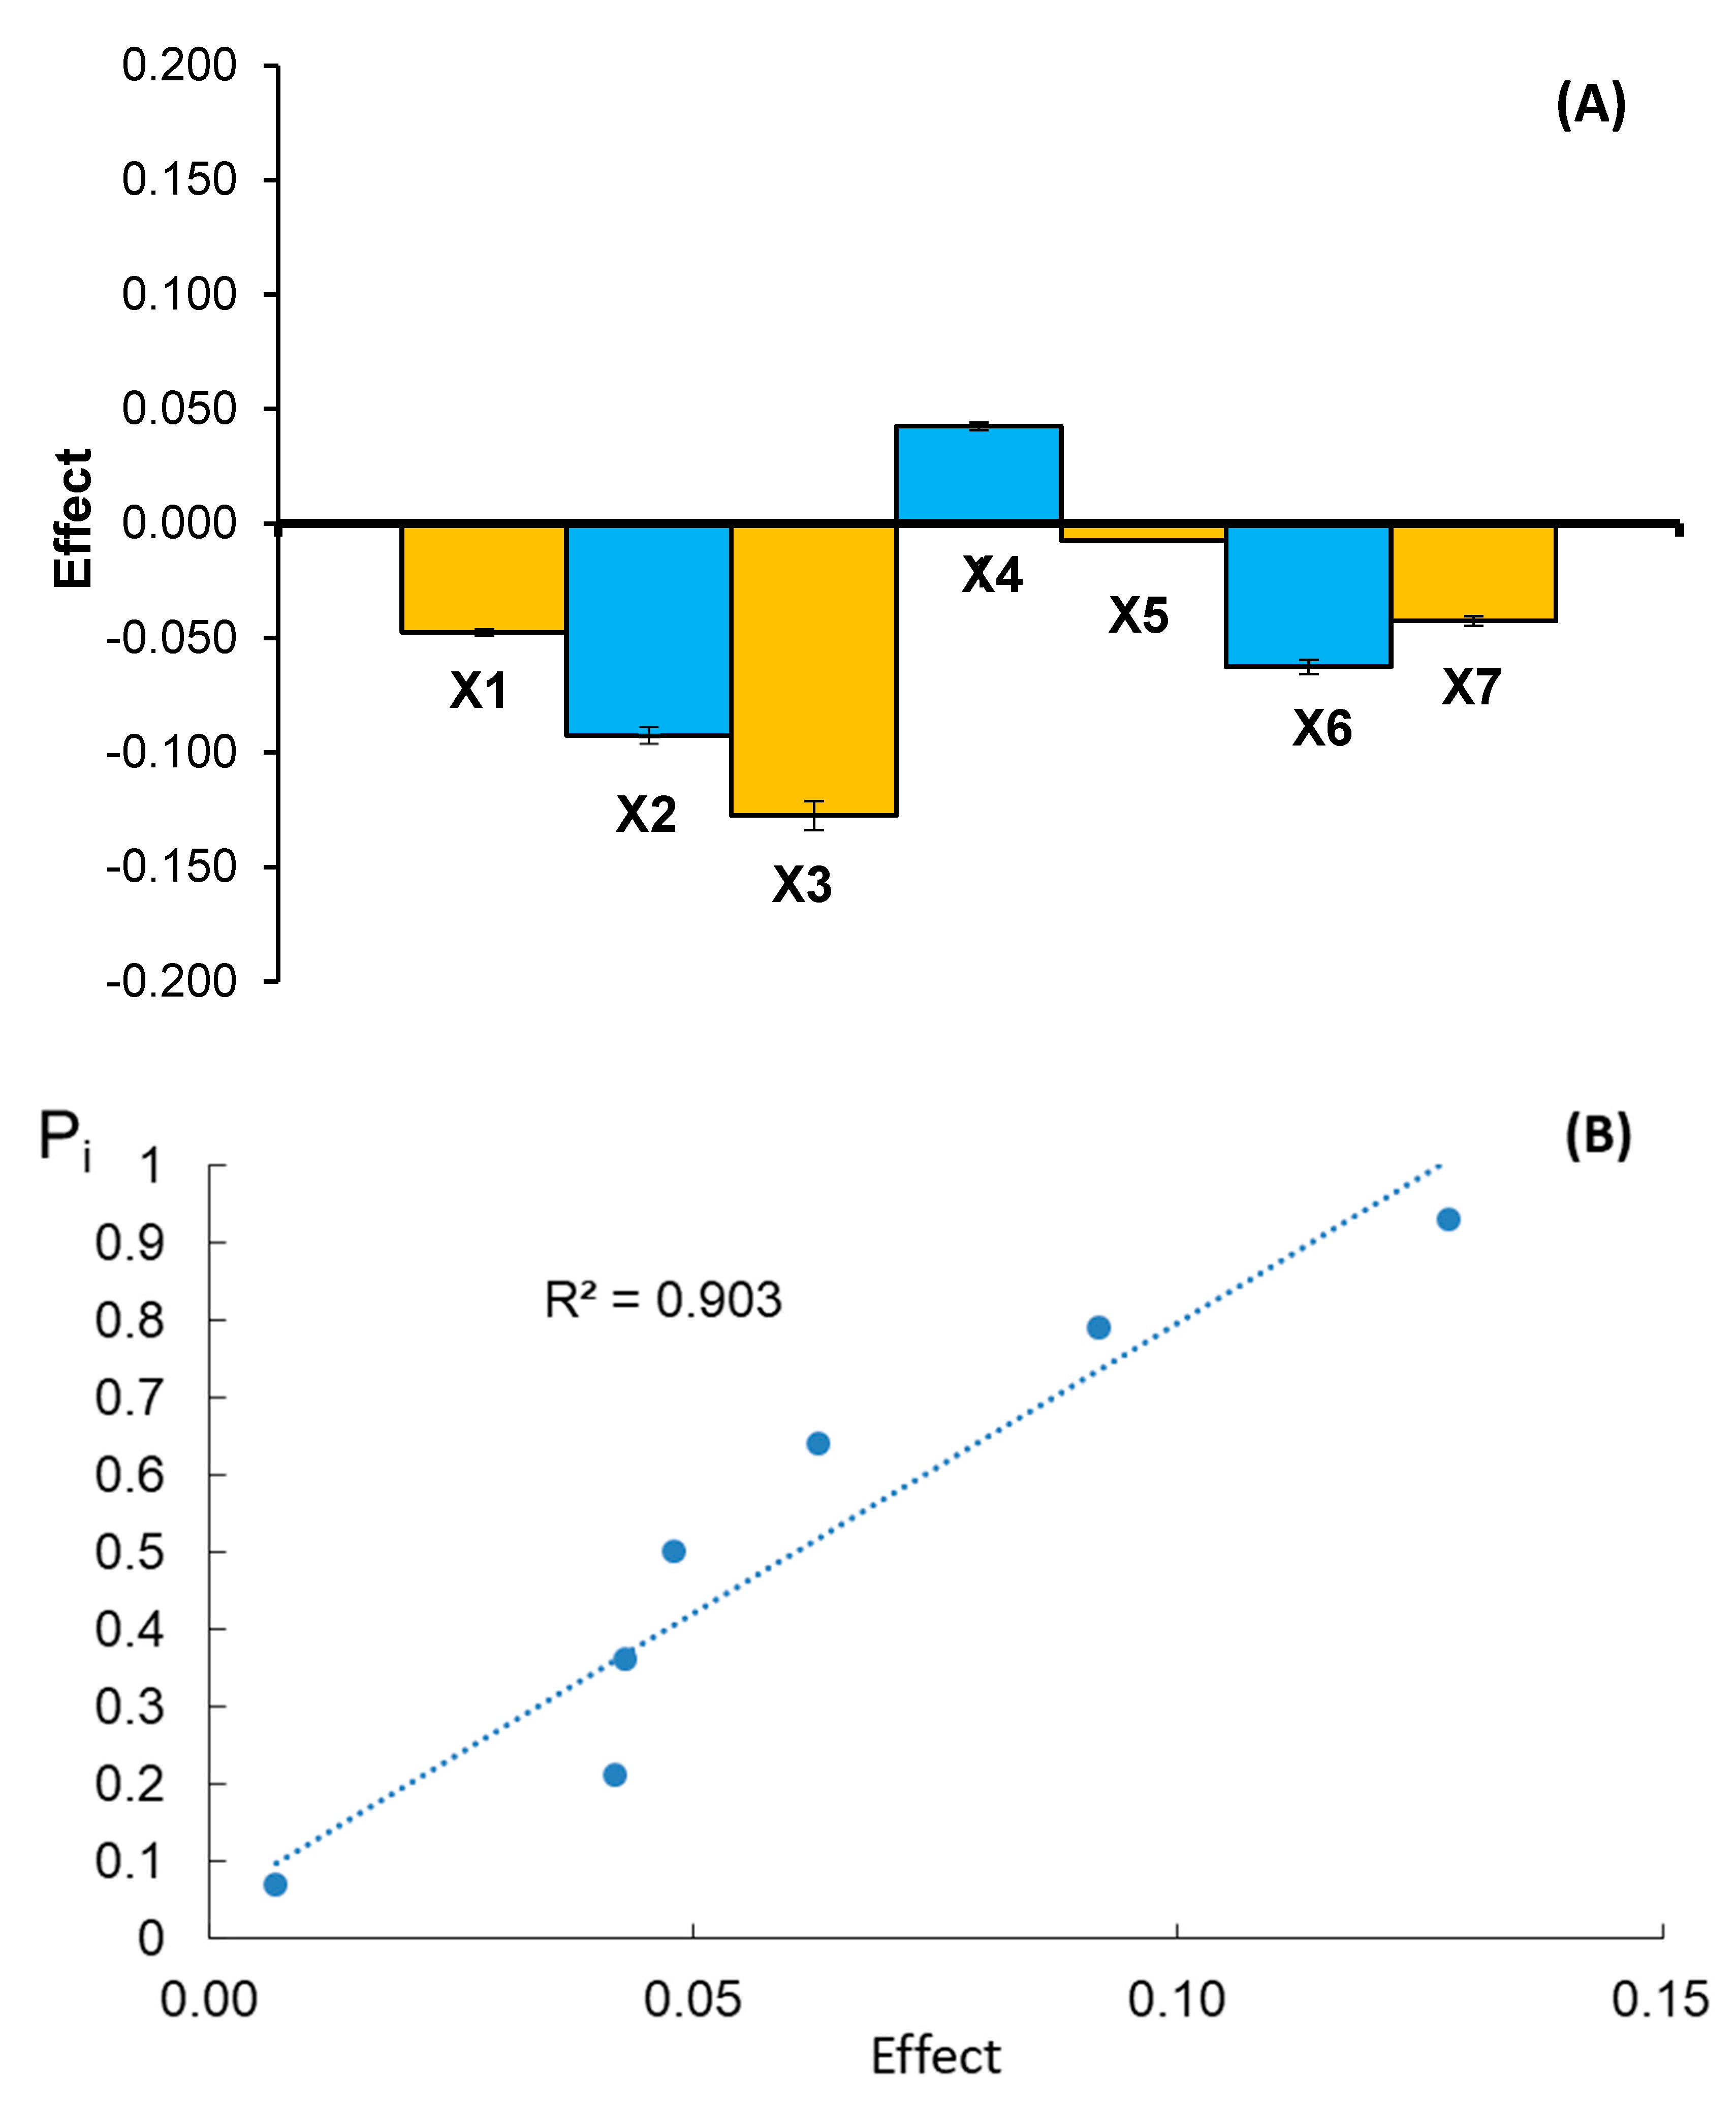
In the case of drug analysis, only the United States Pharmacopoeia requires robustness testing [25]. The robustness of the method is checked in order to determine the influence of small fluctuations in the conditions of the analytical methodology on the value of the final result of the determination of the biologically active substance in individual drugs. The changed analysis conditions were the sorbent type, development distance, extraction time, saturation time of the chamber, wavelength in densitometric analysis at λ, and the volume of n-butanol and n-propanol in mobile phase. The effects of changes in the seven above-mentioned analysis factors were tested at two levels in eight experiments. Table 2 presents the results of donepezil determinations per tablet of the individual drugs tested and the effects of changing the analysis conditions on the quantitative determination of donepezil in the drugs. The effect values (E) for each changed analysis condition were calculated from Formulas (1)–(7) and the half normal probability (pi) was calculated from formula (8). The effect values (E) for individuals of the changed analysis conditions are presented in Table 2 and Table S8, Figure 1A and Figure 2A, and Figures S21A and S22A for the donepezil determinations in the Cogiton and Donecept tablets, respectively. The results were also assessed using plots of half-normal probability (pi) versus absolute values of the main effects (E), which are presented in Figure 1B and Figure 2B, and Figures S21B and S22B for the donepezil determinations in the Cogiton and Donecept tablets, respectively. All points on the half-normal probability plots are located close to a straight line (R2 > 0.90). The standard deviations of donepezil content (yi) in commercial pharmaceutical preparations for seven parameters, which were changed in the conducted experiment in order to check the robustness of the applied method, are <3% and indicate the reliability of the proposed TLC-densitometric method during its normal use. Of particular interest here are the standardized skewness and standardized kurtosis, which can be used to determine donepezil content (yi) and whether the sample comes from a normal distribution. Values of these statistics outside the range of −2 to +2 indicate significant departures from the standard deviation [31]. In this case, the standardized skewness and kurtosis values are within the range expected for data from a normal distribution. Additionally, the normal distribution of the obtained donepezil (yi) values, with the seven analysis parameters varied, was checked in histograms and normal probability plots, which are presented in the summary graphs (Figures S23–S26). The normal probability plot is a graphical technique for assessing whether or not a data set is approximately normally distributed. The decision regarding the normal distribution of the obtained results is made on the basis of the normal probability plot, on which the values of the analyzed results are represented as points. If these points are arranged approximately on a straight line, without a clear curvilinear tendency, then this is a sufficient argument for normality. All four sets of the donepezil analysis results are arranged along a straight line, which indicates that they are characterized by a normal distribution. This confirms the robustness of the proposed method.
These results indicate that minor changes in the analysis conditions do not affect the final result of donepezil determination in the pharmaceutical preparations tested. Therefore, it can be considered that the proposed TLC method combined with densitometry is robust for the determination of donepezil in drugs.

3.2. Quantitative Determination of Donepezil in the Tested Pharmaceutical Preparations

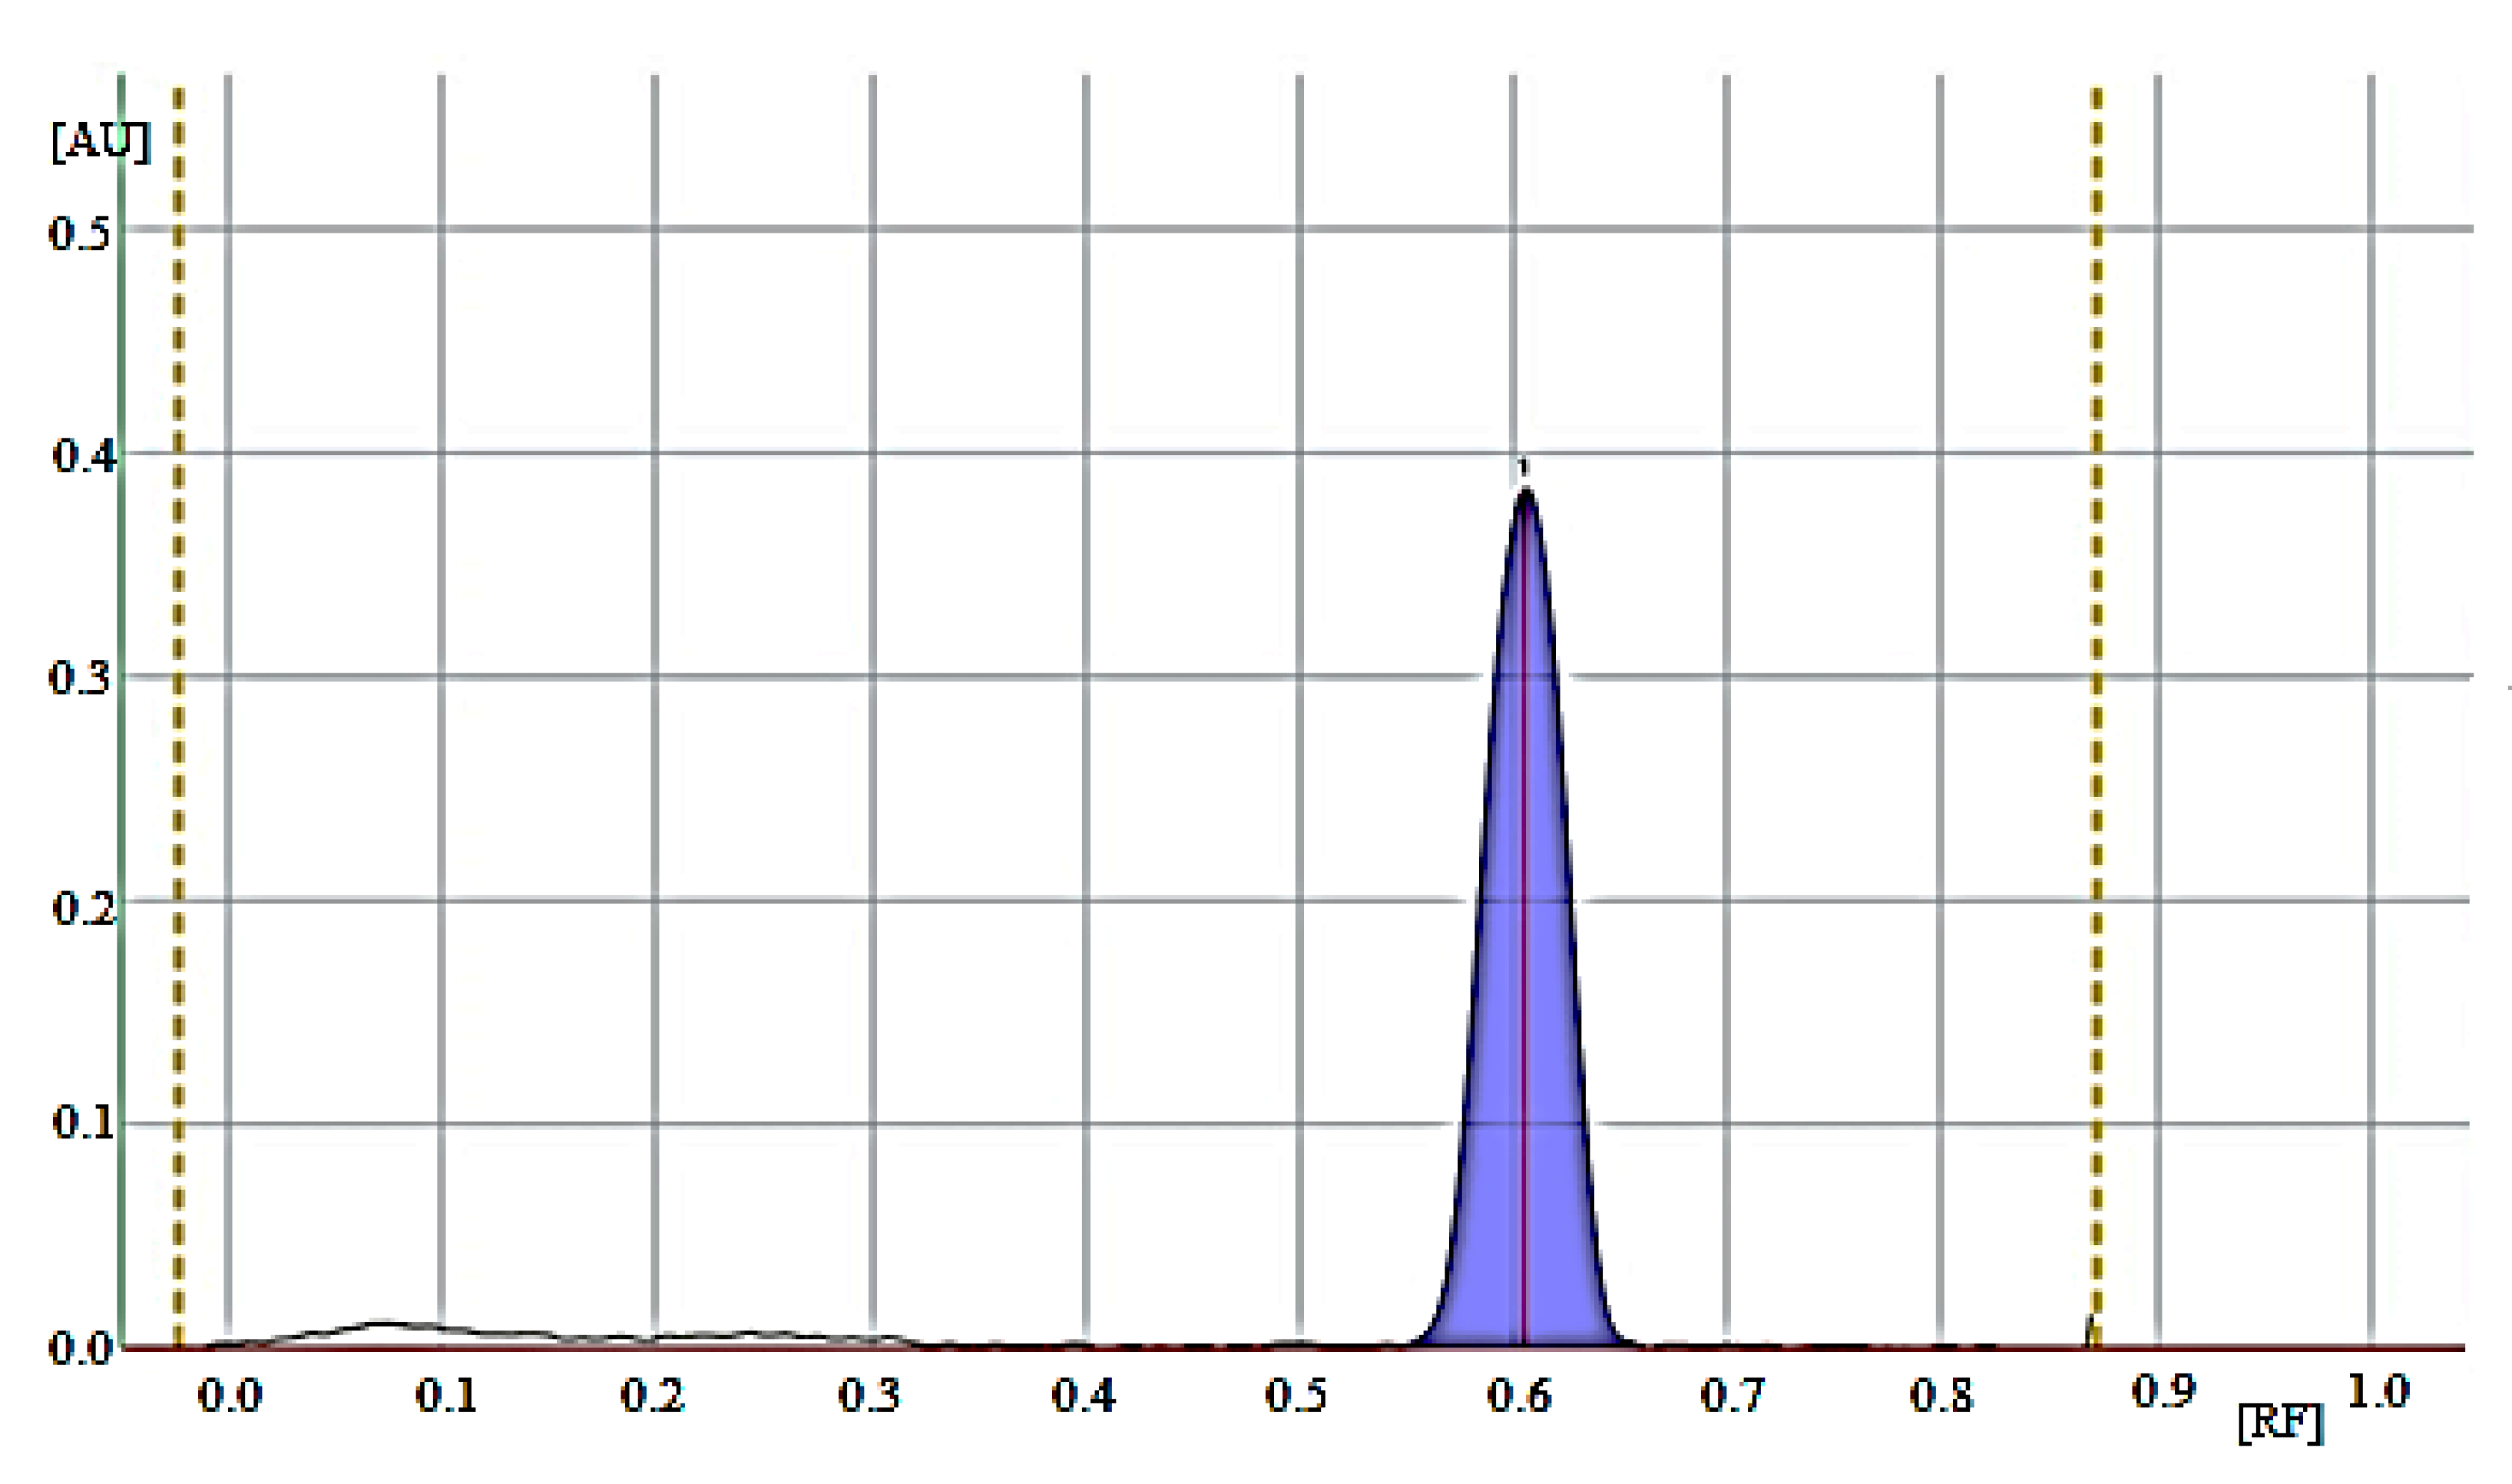
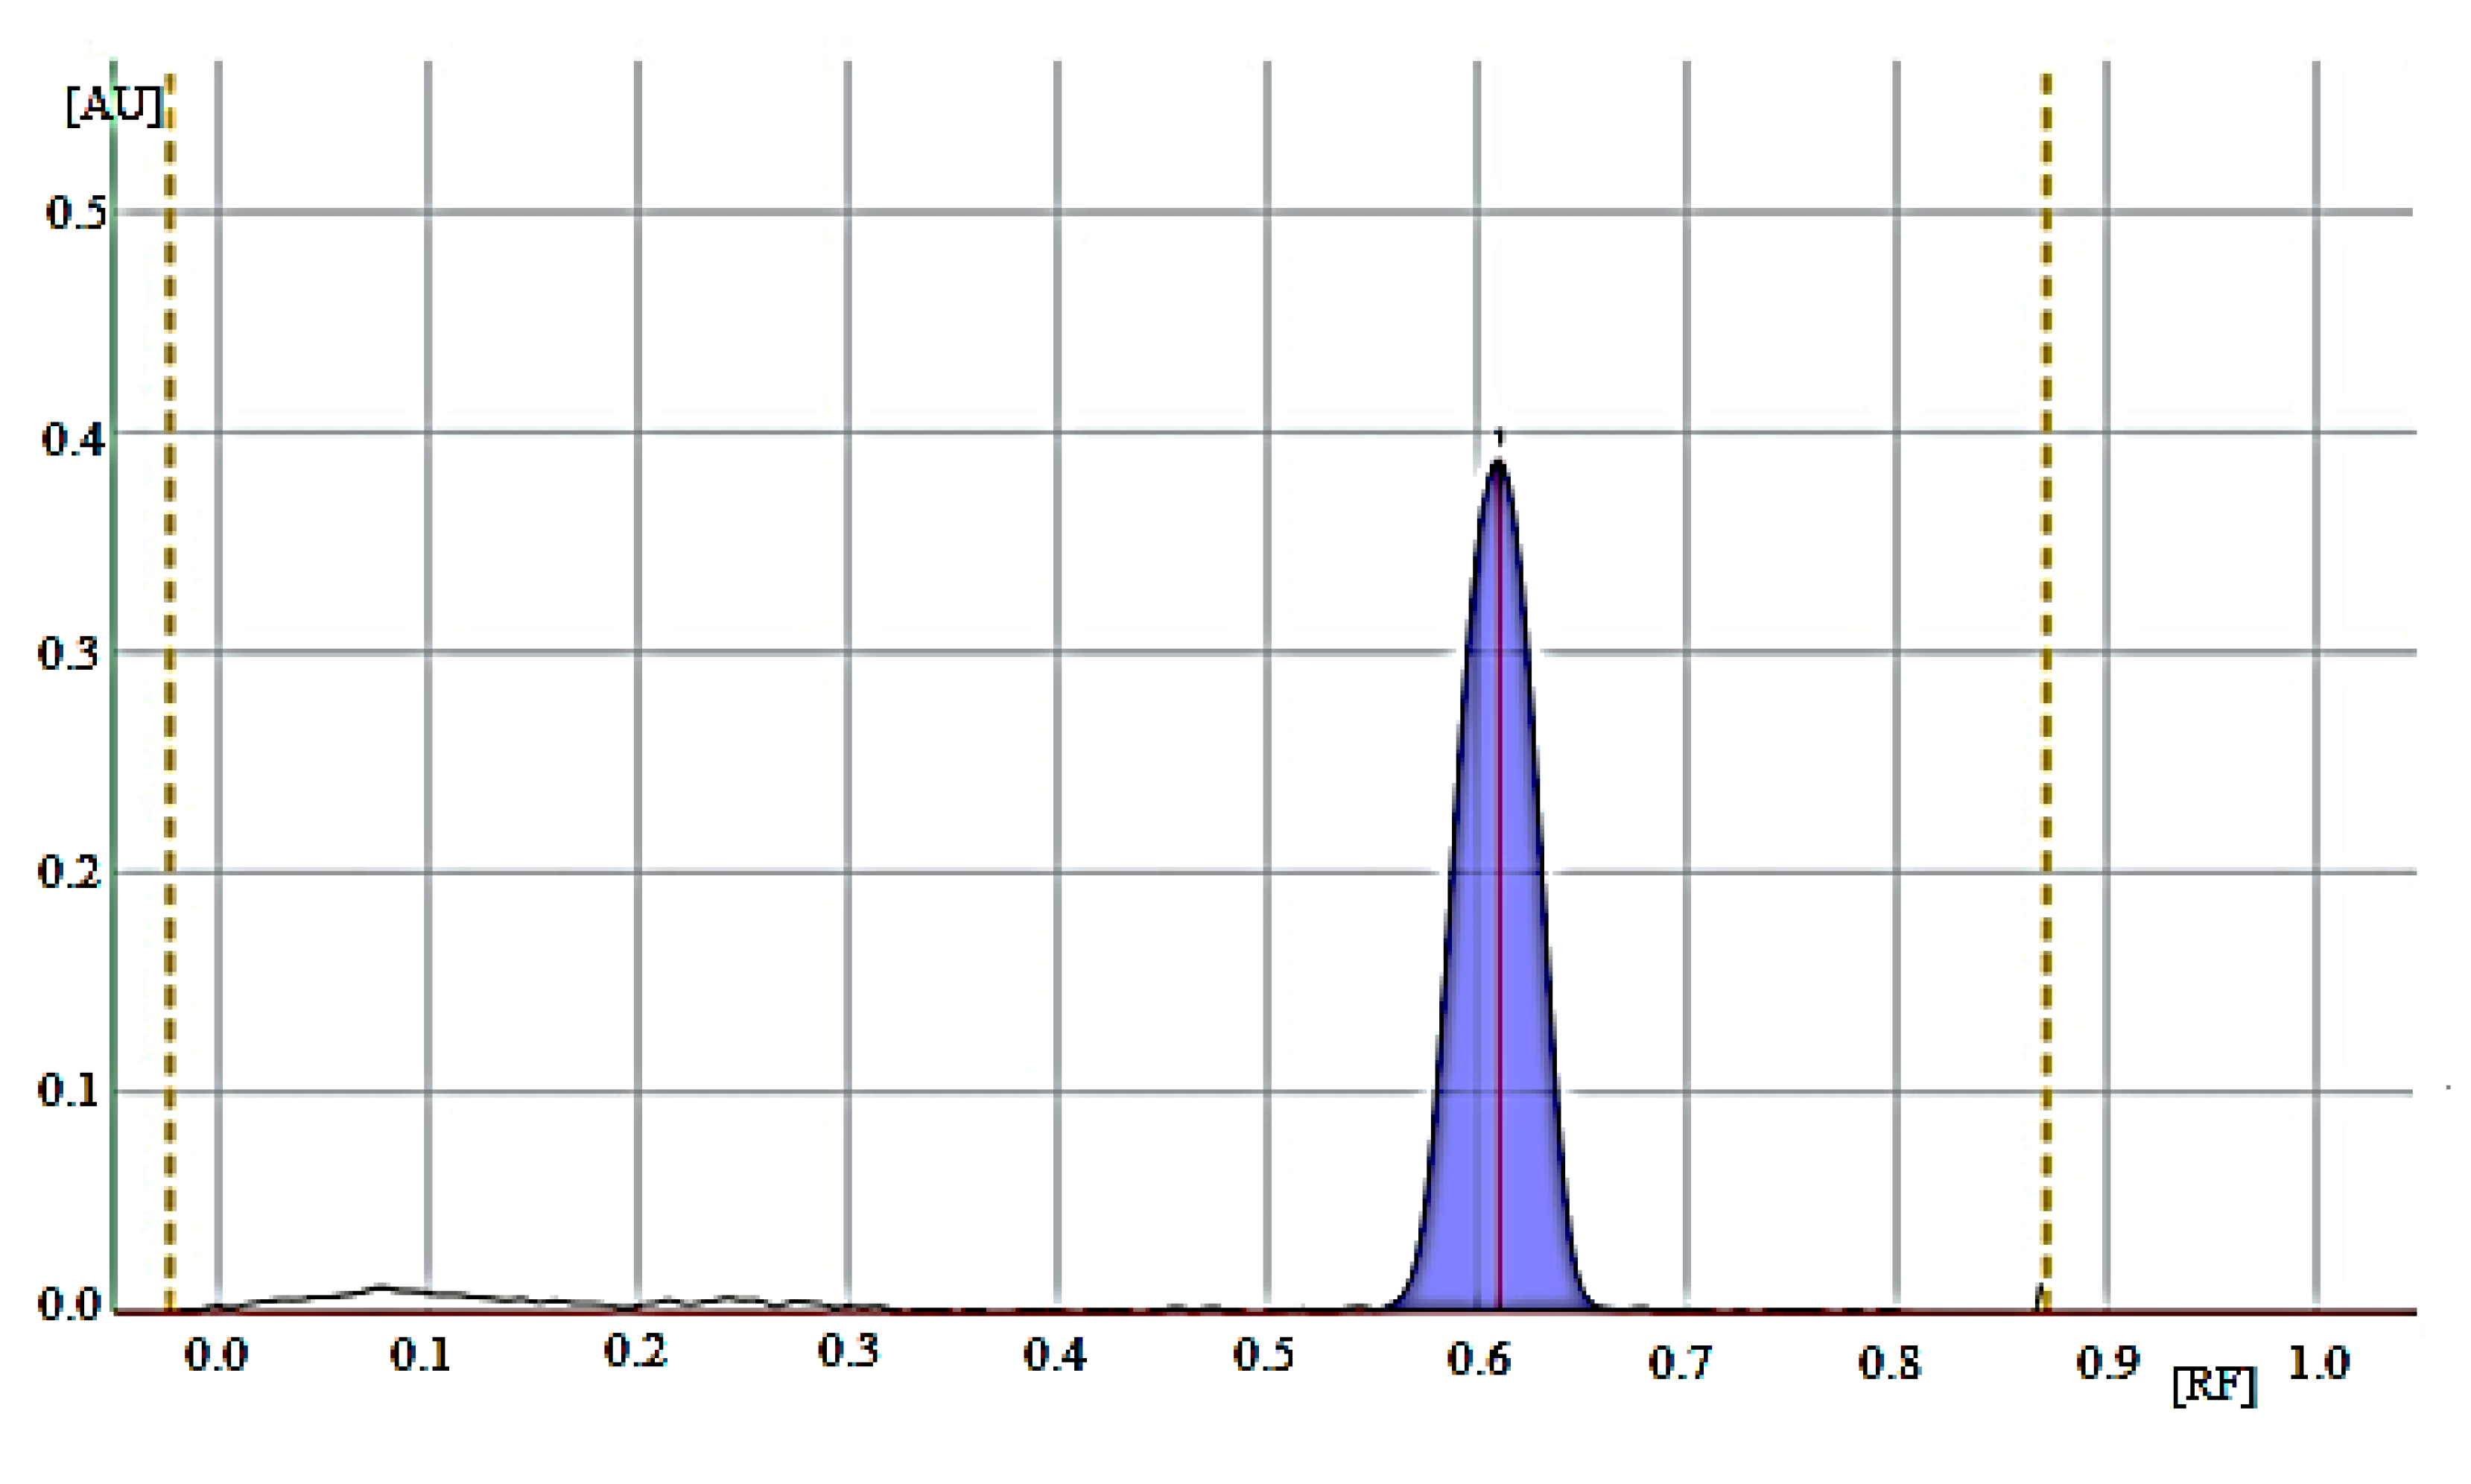
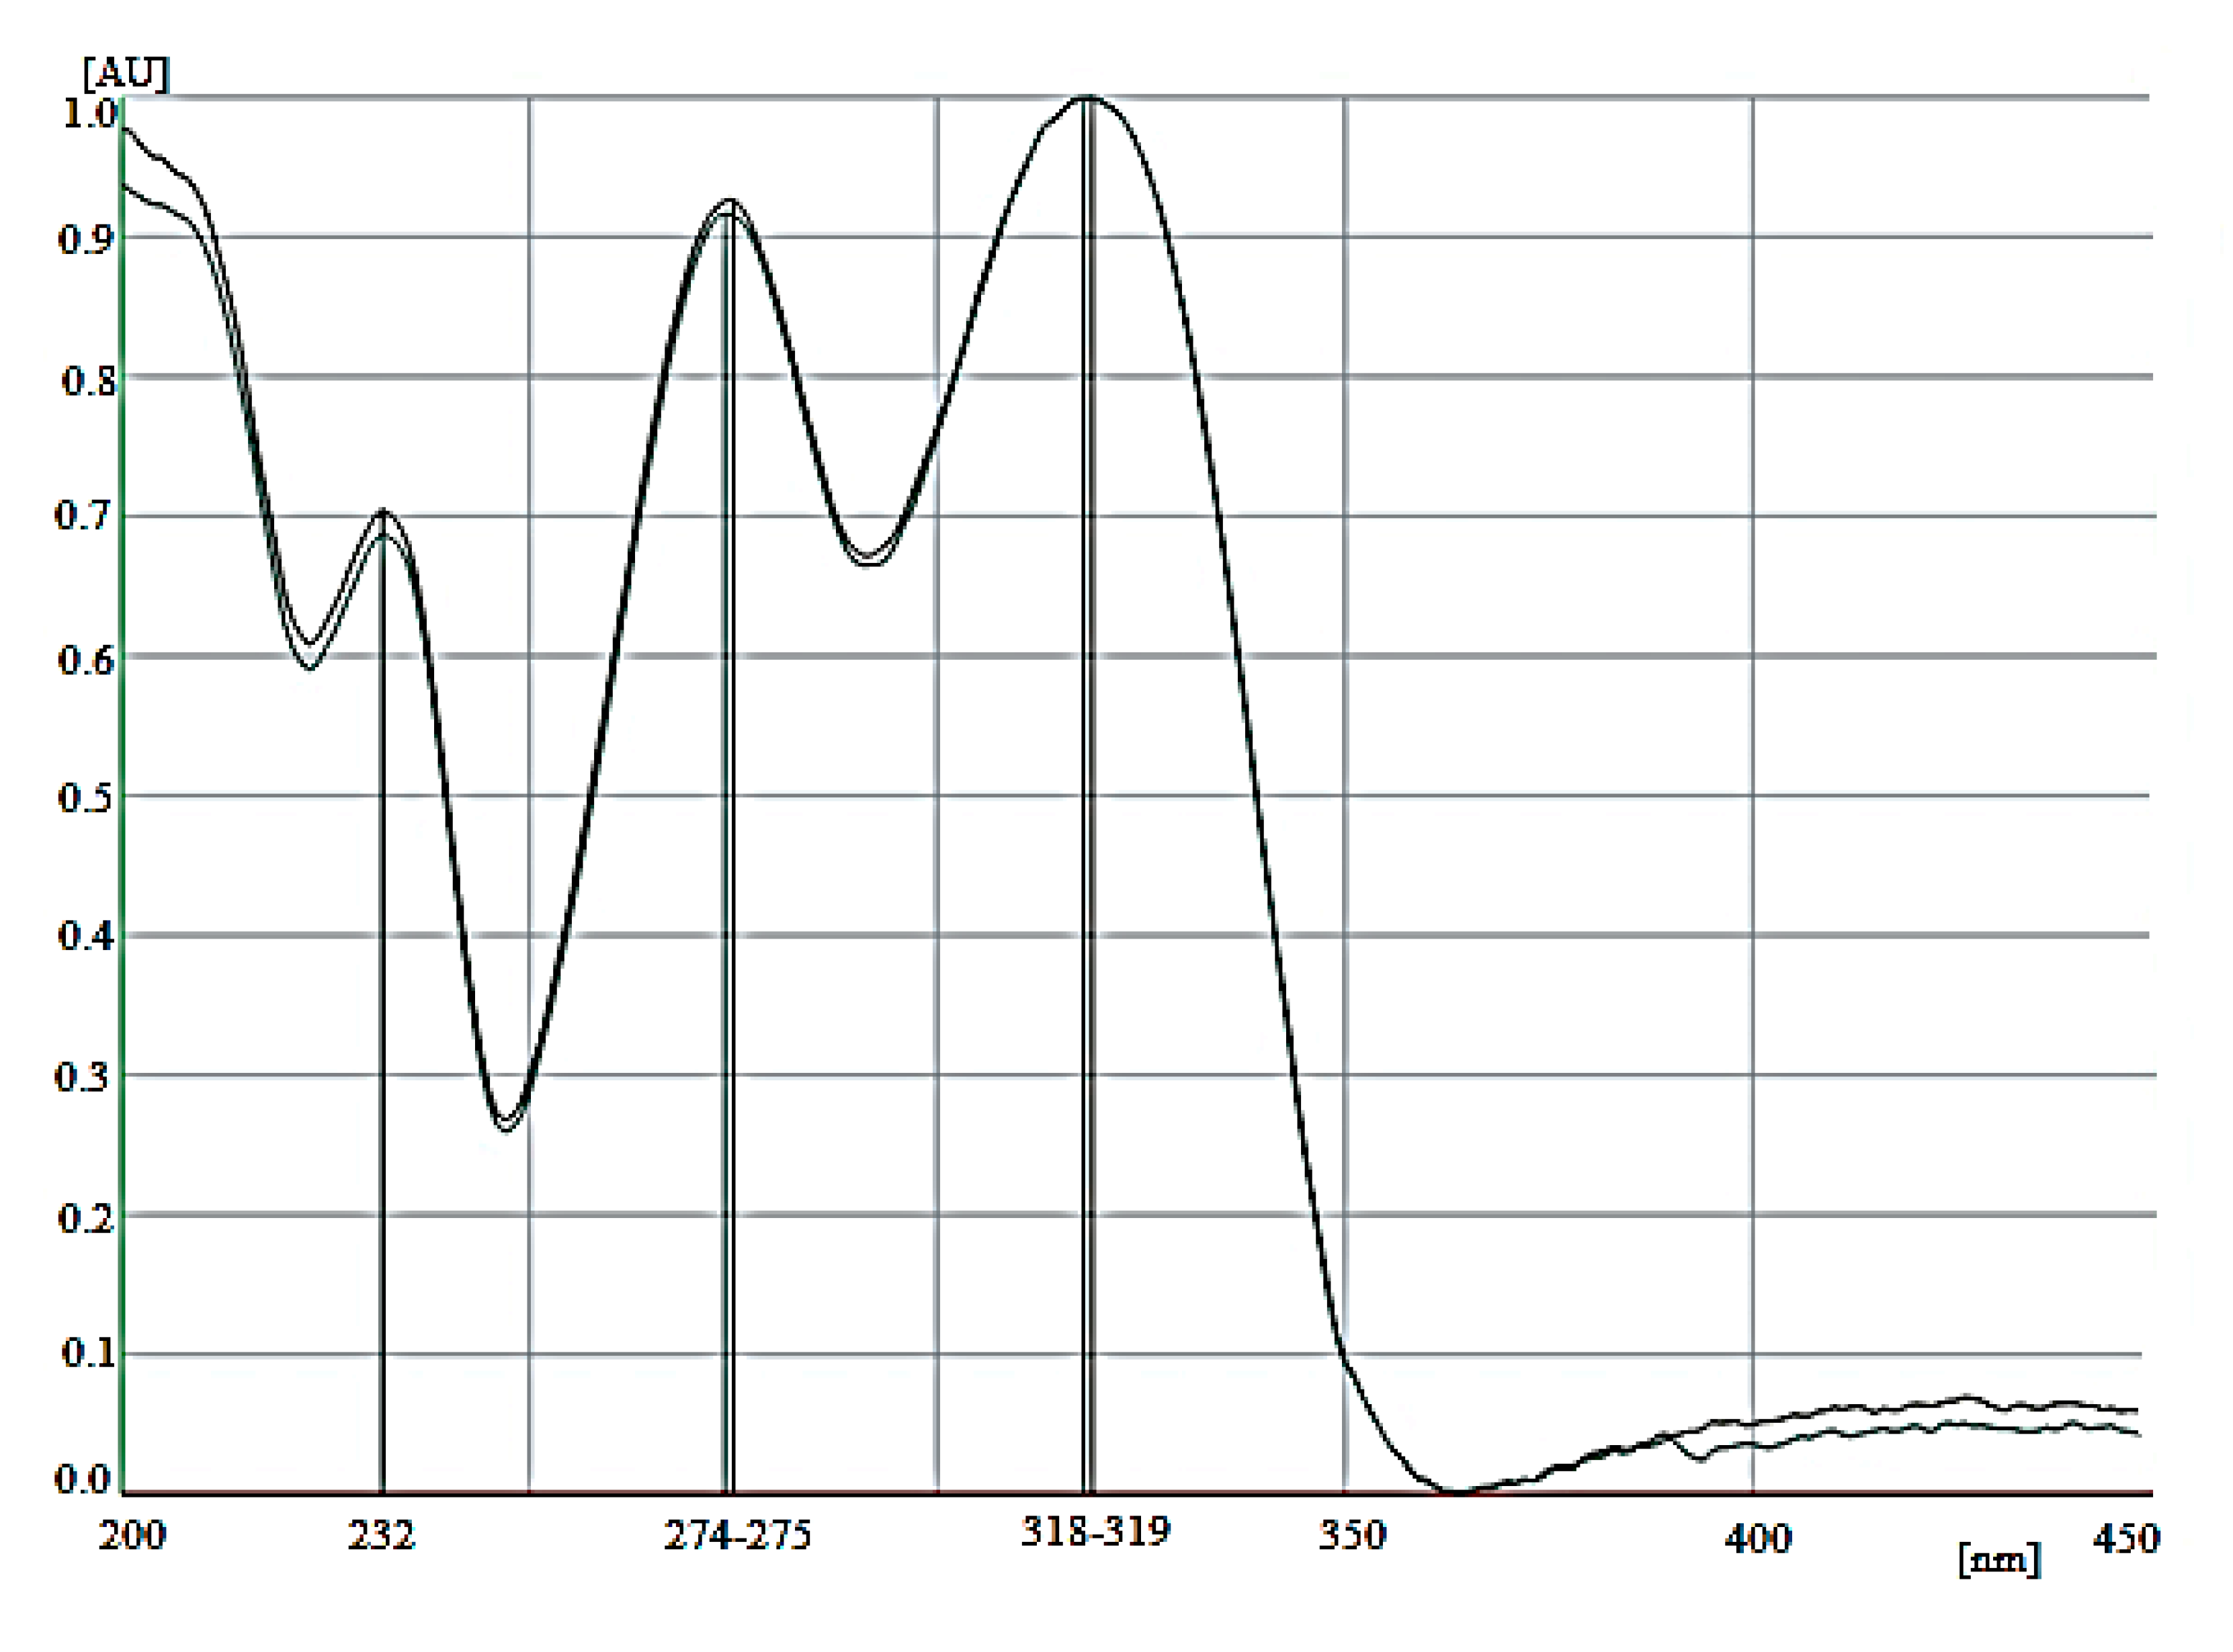
The quantitative determination of donepezil in pharmaceutical preparations was performed by analyzing the measurements of chromatographic bands in Cogiton (donepezil 5 mg) and Donecept (donepezil 5 mg) drug solutions in the high (1.0–5.0 µg/spot) and low (0.2–1.0 µg/spot) linearity range. Drug extract samples at concentrations of 1, 3, and 5 µg/spot were tested, and the real donepezil content in the drugs was calculated from the calibration curve given in Table 1. Drug extract samples at concentrations of 0.2, 0.6, and 1.0 µg/spot were tested, and the real donepezil content in the drugs was calculated from the calibration curve given in Table 1. Figure 3, Figure 4 and Figure S27 show the densitogram of donepezil standard and the densitograms of donepezil from the Cogiton and Donecept tablets, respectively. No additional chromatographic bands were detected on the analyzed densitograms, i.e., no contamination was detected in the donepezil tablets. It was also observed that the excipients present in the formulations did not interfere with donepezil bands. The RF value of donepezil standard was consistent with the RF of donepezil from both drugs, i.e., Cogiton and Donecept (RF = 0.62 ± 0.03). The spectra of donepezil standard were also consistent with the spectrum of donepezil from the Cogiton (Figure 5) and Donecept (Figure S28) tablets. The peak purities of donepezil from the Cogiton and Donecept tablets were also assessed by comparing the spectra obtained from donepezil standard at the peak start (S), peak apex (M), and peak end (E) of the spot. It was found that r(S,M) > 0.999, and r(M,E) > 0.999. The compatibility of the spectrodensitograms of the donepezil standard with the spectrodensitograms of the donepezil from tablets confirms a high selectivity of the developed TLC method.
Based on the study performed using the TLC-densitometric method, the results of the real drug content in the Cogiton and Donecept preparations (Table 3) were obtained, calculated from two calibration curves (for linearity ranges of 1.0 to 5.0 and 0.2 to 1.0 µg/spot). The real donepezil content per tablet was 4.98 mg and 4.94 mg in Cogiton preparation, and 4.95 mg (for both linearity ranges) in the Donecept preparation, which, in relation to the content of the active substance declared by the manufacturer—5 mg, gives an average content of 99.2% and 99.0%, respectively. European Pharmacopoeia VIII [32] allows for a deviation from the substance content in tablets in the range of 85 to 115%. That is, the results obtained in this study fulfill the pharmacopoeial requirements. The results obtained from the two calibration curves (donepezil content in the drugs) were statistically evaluated. A Student’s t-test and Snedecor’s F-test were used. The calculated values of the t and F tests are smaller than the tabulated ones for a given number of measurements. The standardized skewness and kurtosis values are within the range expected for data from a normal distribution. For this reason, it can be stated that in the results obtained from both calibration curves, no statistically significant differences were observed (Table 4).

4. Conclusions

It was stated that the highest number of donepezil degradation products could be detected on silica gel plates using the proposed new mobile phase n-butanol + n-propanol + acetone + water + glacial acetic acid (2:2:1:1:1, v/v), based on the study of donepezil degradation products in different solutions. The advantage of the proposed TLC-densitometric method is the fact that the mobile phase used is miscible and, therefore, the chromatographic plate is homogeneous after development. In addition, the proposed mobile phase allowed the separation of as many as six degradation products from donepezil. On the other hand, Ali et al. [17] separated a maximum of three degradation products from donepezil. Furthermore, Pandey et al. [18] successfully separated only two donepezil-related substances from donepezil. The TLC-densitometric method used for the quantification of donepezil in the Cogiton and Donecept pharmaceutical preparations is rapid, selective, linear, accurate, precise, robust, and economical. It is characterized by a similar sensitivity (LOD) as the previously described HPTLC [17,18] methods for the determination of donepezil in pharmaceuticals. The proposed TLC-densitometric method was linear from 1.0 to 5.0 µg/spot and from 0.2 to 1.0 µg/spot, and it was validated for both concentration ranges. When assessing accuracy based on the recovery measurement, the coefficient of variation for both preparations tested was less than 3%, indicating a high accuracy of the method used. The proposed TLC-densitometric method was also characterized by good precision; the CV values for intraday and interday precision ranged from 0.52% to 2.66% and 0.28% to 2.04% in the Cogiton tablets, and from 0.32% to 1.89% and 0.50% to 2.18% in the Donecept tablets. The results of the assay of donepezil in the Cogiton (99.2%) and Donecept (99.0%) tablets in relation to the label claim are in good agreement with the European Pharmacopoeia. In the results of donepezil content in the drugs obtained from both calibration curves, no statistically significant differences were observed. The proposed new TLC method, combined with densitometry, can be used for the routine control of donepezil in pharmaceutical preparations (tablets). It is more economical compared to high-performance liquid chromatography (HPLC), for example. Since TLC is less sensitive and precise compared to HPLC, it can be used as a complementary technique. The method developed in this work allows for the analysis of several samples on one chromatographic plate at the same time. It is suitable for quick and routine testing of the contents of pharmaceutical preparations and for routine quality control checks of products in the pharmaceutical industry.

Supplementary Materials

The following supporting information can be downloaded at: https://www.mdpi.com/article/10.3390/pr13041106/s1, Table S1: Studied solutions of donepezil, Table S2: Characteristics of the mobile phases, Table S3: Details of the validation of the proposed TLC-densitometric method, Figure S1: Spectrodensitogram of donepezil standard after developing using the mobile phase A6, Table S4: The factors and their levels investigated in robustness test, Figure S2: Photograph of the chromatographic plate after developing using the mobile phase A, taken under UV light at λ = 254 nm, Figure S3: Photograph of the chromatographic plate after developing using the mobile phase A1, taken under UV light at λ = 254 nm, Figure S4: Photograph of the chromatographic plate after developing using the mobile phase A2, taken under UV light at λ = 254 nm, Figure S5: Photograph of the chromatographic plate after developing using the mobile phase A3, taken under UV light at λ = 254 nm, Figure S6: Photograph of the chromatographic plate after developing using the mobile phase A4, taken under UV light at λ = 254 nm, Figure S7: Photograph of the chromatographic plate after developing using the mobile phase A5, taken under UV light at λ = 254 nm, Figure S8: Photograph of the chromatographic plate after developing using the mobile phase A6, taken under UV light at λ = 254 nm, Figure S9: Photograph of the chromatographic plate after developing using the mobile phase A7, taken under UV light at λ = 254 nm, Figure S10: Photograph of the chromatographic plate after developing using the mobile phase A8, taken under UV light at λ = 254 nm, Figure S11: Densitogram of donepezil standard after developing on the chromatographic plate coated with silica gel, using the mobile phase A6, Figure S12: Densitogram of donepezil (5Do) in hydrogen peroxide (30%), which was heated at 80 °C for 4 h, and developed using mobile phase A6, Figure S13: Densitogram of donepezil (6Do) in hydrochloric acid (2 mol/L), which was heated at 80 °C for 4 h, and developed using mobile phase A6, Figure S14: Densitogram of donepezil (7Do) in sodium hydroxide (2 mol/L), which was heated at 80 °C for 4 h, and developed using mobile phase A6, Figure S15: Densitogram of donepezil standard after developing on the chromatographic plate coated with silica gel, using the mobile phase A7, Figure S16: Densitogram of donepezil (5Do) in hydrogen peroxide (30%), which was heated at 80 °C for 4 h, and developed using mobile phase A7, Figure S17: Densitogram of donepezil (6Do) in hydrochloric acid (2 mol/L), which was heated at 80 °C for 4 h, and developed using mobile phase A7, Figure S18: Densitogram of donepezil (7Do) in sodium hydroxide (2 mol/L), which was heated at 80 °C for 4 h, and developed using mobile phase A7, Table S5: RF values, wavelengths and maximum wavelengths of donepezil samples and its degradation products using particular mobile phases, Table S6: Summary of donepezil stability study results, Table S7: Average area of the chromatographic bands, standard deviations, coefficient of variations for solution series of chromatographed donepezil, Figure S19: Donepezil calibration curve (A), residual plot (B), and normality plot of residuals (C) in the range of 1.0 to 5.0 µg/spot, Figure S20: Donepezil calibration curve A), residual plot (B), and normality plot of residuals (C) in the range of 0.2 to 1.0 µg/spot, Table S8: Experimental design matrix (23) for robustness test for donepezil in Cogiton (CG) and Donecept (DT) tablets in the range of 0.2 to 1.0 µg/spot, Figure S21: Robustness test for the range of 0.2 to 1.0 µg/spot: the effects of changing the analysis conditions (A) and the half-normal plot of the probability of effects (B) for determination of donepezil in Cogiton tablets, Figure S22: Robustness test for the range of 0.2 to 1.0 µg/spot: the effects of changing the analysis conditions (A) and the half-normal plot of the probability of effects (B) for determination of donepezil in Donecept tablets, Figure S23: Plot summarizing the evaluation of the method’s robustness in the higher concentration range of donepezil in Cogiton tablets, Figure S24: Plot summarizing the evaluation of the method’s robustness in the higher concentration range of donepezil in Donecept tablets, Figure S25: Plot summarizing the evaluation of the method’s robustness in the lower concentration range of donepezil in Cogiton tablets, Figure S26: Plot summarizing the evaluation of the method’s robustness in the lower concentration range of donepezil in Donecept tablets, Figure S27: Densitogram of donepezil from Donecept tablets (RF = 0.62 ± 0.03), Figure S28: Spectrodensitograms of donepezil standard and donepezil from Donecept tablets.

Author Contributions

Conceptualization, W.P. and A.P.-P.; methodology, A.P.-P.; software, A.P.-P.; investigation, W.P. and A.P.-P.; writing—original draft preparation, W.P. and A.P.-P.; writing—review and editing, W.P. and A.P.-P. All authors have read and agreed to the published version of the manuscript.

Funding

This research was funded by the Medical University of Silesia under grant number BNW-1-005/K/3/F.

Data Availability Statement

Data are contained within the article and the Supplementary Materials.

Conflicts of Interest

The authors declare no conflicts of interest.

References

  1. Mangialasche, F.; Solomon, A.; Winblad, B.; Mecocci, P.; Kivipelto, M. Alzheimer’s disease: Clinical trials and drug development. Lancet Neurol. 2010, 9, 702–716. [Google Scholar] [CrossRef] [PubMed]
  2. Winblad, B. Donepezil in Severe Alzheimer’s Disease. Am. J. Alzheimers Dis. Other Demen. 2009, 24, 185–192. [Google Scholar] [CrossRef] [PubMed]
  3. Janiec, W. Compendium of Pharmacology; Medical Publishing House PZWL: Warsaw, Poland, 2021. (In Polish) [Google Scholar]
  4. Kumar, T.S.; Solairaj, P.; Thangathirupathi, A. Analytical method development and validation of donepezil hydrochloride tablets by RP-HPLC. Int. J. Pharm. Pharm. Sci. 2011, 3, 62–65. [Google Scholar]
  5. Liew, K.B.; Peh, K.K.; Tan, Y.T.F. RP-HPLC analytical method development and optimization for quantification of donepezil hydrochloride in orally disintegrating tablet. Pak. J. Pharm. Sci. 2013, 26, 961–966. [Google Scholar] [PubMed]
  6. Saleh, H.M.; Ragab, G.H.; Amin, A.S.; Kamel, E.S. Stability-indicating HPLC method for determination of donepezil hydrochloride in pure and in tablet dosage forms. Asian J. Pharm. Anal. Med. Chem. 2016, 4, 14–24. [Google Scholar]
  7. Abdul-Sattar, M.D.; Achanta, S. Development and validation of a simple method for simulations estimation of memantine and donepezil in pharmaceutical dosage forms by using RP-HPLC. Int. J. Pharm. Res. 2018, 10, 155–166. [Google Scholar]
  8. Bulduk, I.; Aydin, B.S. Simple high-performance liquid chromatographic method for determination of Donepezil HCl in pharmaceutical formulations. J. Chem. Metrol. 2020, 14, 69–76. [Google Scholar] [CrossRef]
  9. Korany, M.A.; Mahgoub, H.; Haggag, R.S.; Ragab, M.A.A.; Elmallah, O.A. Development of a green stability-indicating HPLC–DAD method for the determination of donepezil hydrochloride in the presence of its related substance and degradation products. J. Liq. Chromatogr. Relat. Technol. 2017, 40, 930–942. [Google Scholar] [CrossRef]
  10. Ragab, G.H.; Bahgat, E.A. Development of bioanalytical HPLC method for simultaneous determination of the antialzhiemer, donepezil hydrochloride and the antidepressant, citalopram hydrobromide in raw materials, spiked human plasma and tablets dosage form. Ann. Pharm. Fr. 2019, 77, 112–120. [Google Scholar] [CrossRef]
  11. Barot, T.G.; Patel, P.K. RP-HPLC Method for the Estimation of Donepezil Hydrochloride Dosage form. J. Chem. 2009, 6, 594–600. [Google Scholar] [CrossRef]
  12. Singh, B.K.; Srivastava, R.K.; Kumar, S.S.; Dutta, P.K. Stability-indicative HPLC determination of donepezil hydrochloride in tablet dosage form. Pharm. Chem. J. 2012, 45, 766–770. [Google Scholar] [CrossRef]
  13. Abonassif, M.A.; Hefnawy, M.M.; Kassem, M.G.; Mostafa, G.A. Determination of donepezil hydrochloride in human plasma and pharmaceutical formulations by HPLC with fluorescence detection. Acta. Pharm. 2011, 61, 403–413. [Google Scholar] [CrossRef] [PubMed]
  14. Alzoman, N.Z.; Hefnawy, M.; Al-majed, A.; Alanazi, A.; Mostafa, G.; Arabia, S. Chiral stability-indicating HPLC method for analysis of donepezil in pharmaceutical formulations. Dig. J. Nanomater. Biostruct. 2013, 8, 825–834. [Google Scholar]
  15. Shirwaikar, A.; Devi, S.; Rajagopal, P.L.; Kiron, S.S.; Sreejith, K.R. Development and validation of analytical method for determination of donepezil hydrochloride in pure and dosage forms. Asian. J. Pharm. Clin. Res. 2014, 7, 149–153. [Google Scholar]
  16. Öztürk, G.; Sofu, Ü.; Kul, D. Development of low-cost, fast, and sensitive voltammetric methods for the determination of donepezil using unmodified carbon paste electrode. Monatsh. Chem. 2024, 155, 1159–1167. [Google Scholar] [CrossRef]
  17. Ali, J.; Ali, M.; Ahmad, S.; Bhavna, M. Stability-Indicating HPTLC method for determination od donepezil hydrochloride in bulk drug and pharmaceutical dosage form. Chem. Anal. 2009, 54, 1501–1516. [Google Scholar]
  18. Pandey, L.L.; Dongre, N. Development and validation of stability indicating HPTLC method for determination of donepezil hydrochloride and its related substances in bulk drug and pharmaceutical dosage form. Res. J. Pharm. Technol. 2023, 16, 2890–2894. [Google Scholar] [CrossRef]
  19. ICH. Harmonised Tripartite Guideline: Validation of Analytical Procedures: Text and Methodology, Q2(R1); ICH: Geneva, Switzerland, 2005; Available online: https://database.ich.org/sites/default/files/Q2%28R1%29%20Guideline.pdf (accessed on 14 November 2024).
  20. Ferenczi-Fodor, K.; Renger, B.; Végh, Z. The frustrated reviewer—Recurrent failures in manuscripts describing validation of quantitative TLC/HPTLC procedures for analysis of pharmaceuticals. J. Planar Chromatogr. Mod. TLC 2010, 23, 173–179. [Google Scholar] [CrossRef]
  21. Nagy-Turák, A.; Végh, Z.; Ferenczi-Fodor, K. Validation of the quantitative planar chromatographic analysis of drug substances. III. Robustness testing in OPLC. J. Planar Chromatogr. Mod. TLC 1995, 8, 188–193. [Google Scholar]
  22. Ferenczi-Fodor, K.; Nagy-Turák, A.; Végh, Z. Validation and monitoring of quantitative thin layer chromatographic purity tests for bulk drug substances. J. Planar Chromatogr. Mod. TLC 1995, 8, 349–356. [Google Scholar]
  23. Hendix, C.D. What every technologist should know about experiment design. Chem. Technol. 1979, 9, 167–174. [Google Scholar]
  24. Haynes, W.M. CRC Handbook of Chemistry and Physics, 97th ed.; CRC Press: Boca Raton, FL, USA, 2016. [Google Scholar]
  25. USP. The United States Pharmacopeia, 34th ed.; United States Pharmacopeial Convention: Rockville, MD, USA, 2011. [Google Scholar]
  26. Kafkala, S.; Matthaiou, S.; Alexaki, P.; Abatzis, M.; Bartzeliotis, A.; Katsiabani, M. New gradient high-performance liquid chromatography method for determination of donepezil hydrochloride assay and impurities content in oral pharmaceutical formulation. J. Chromatogr. A 2008, 1189, 392–397. [Google Scholar] [PubMed]
  27. Salakolusu, S.; Katari, N.K.; Sharma, G.V.R.; Rendedula, D.P.; Ranga, M.; Kaliyaperumal, M.; Raghupathi, J.K. Utilizing cutting-edge analytical techniques for the Identification, Isolation, and structural characterization of donepezil HCl forced degradation products. Microchem. J. 2024, 207, 111665. [Google Scholar]
  28. Ruela, A.L.M.; Santos, M.G.; Figueiredo, E.C.; Pereira, G.R. LC-PDA and LC-MS studies of donepezil hydrochloride degradation behavior in forced stress conditions. J. Braz. Chem. Soc. 2014, 25, 2094–2101. [Google Scholar]
  29. BOC Sciences. Available online: https://www.bocsci.com/im-donepezil-and-impurities-list-794.html?srsltid=AfmBOooqc3BCTzTvuv4weZP6VuJO4UvPjfyof4CKQAUVtp39VF6_9ROZ (accessed on 26 March 2025).
  30. Konieczka, P.; Namieśnik, J. Validation of Analytical Procedures. In Evaluation and Quality Control of Analytical Measurement Results, 1st ed.; Konieczka, P., Namieśnik, J., Eds.; PWN: Warsaw, Poland, 2017; pp. 225–299. (In Polish) [Google Scholar]
  31. Hair, J.F.; Hult, G.T.M.; Ringle, C.M.; Sarstedt, M. A Primer on Partial Least Squares Structural Equation Modeling (PLS-SEM), 3rd ed.; Sage: Thousand Oaks, CA, USA, 2022. [Google Scholar]
  32. Council of Europe. European Pharmacopoeia, 8th ed.; Council of Europe: Strasbourg, France, 2013. [Google Scholar]
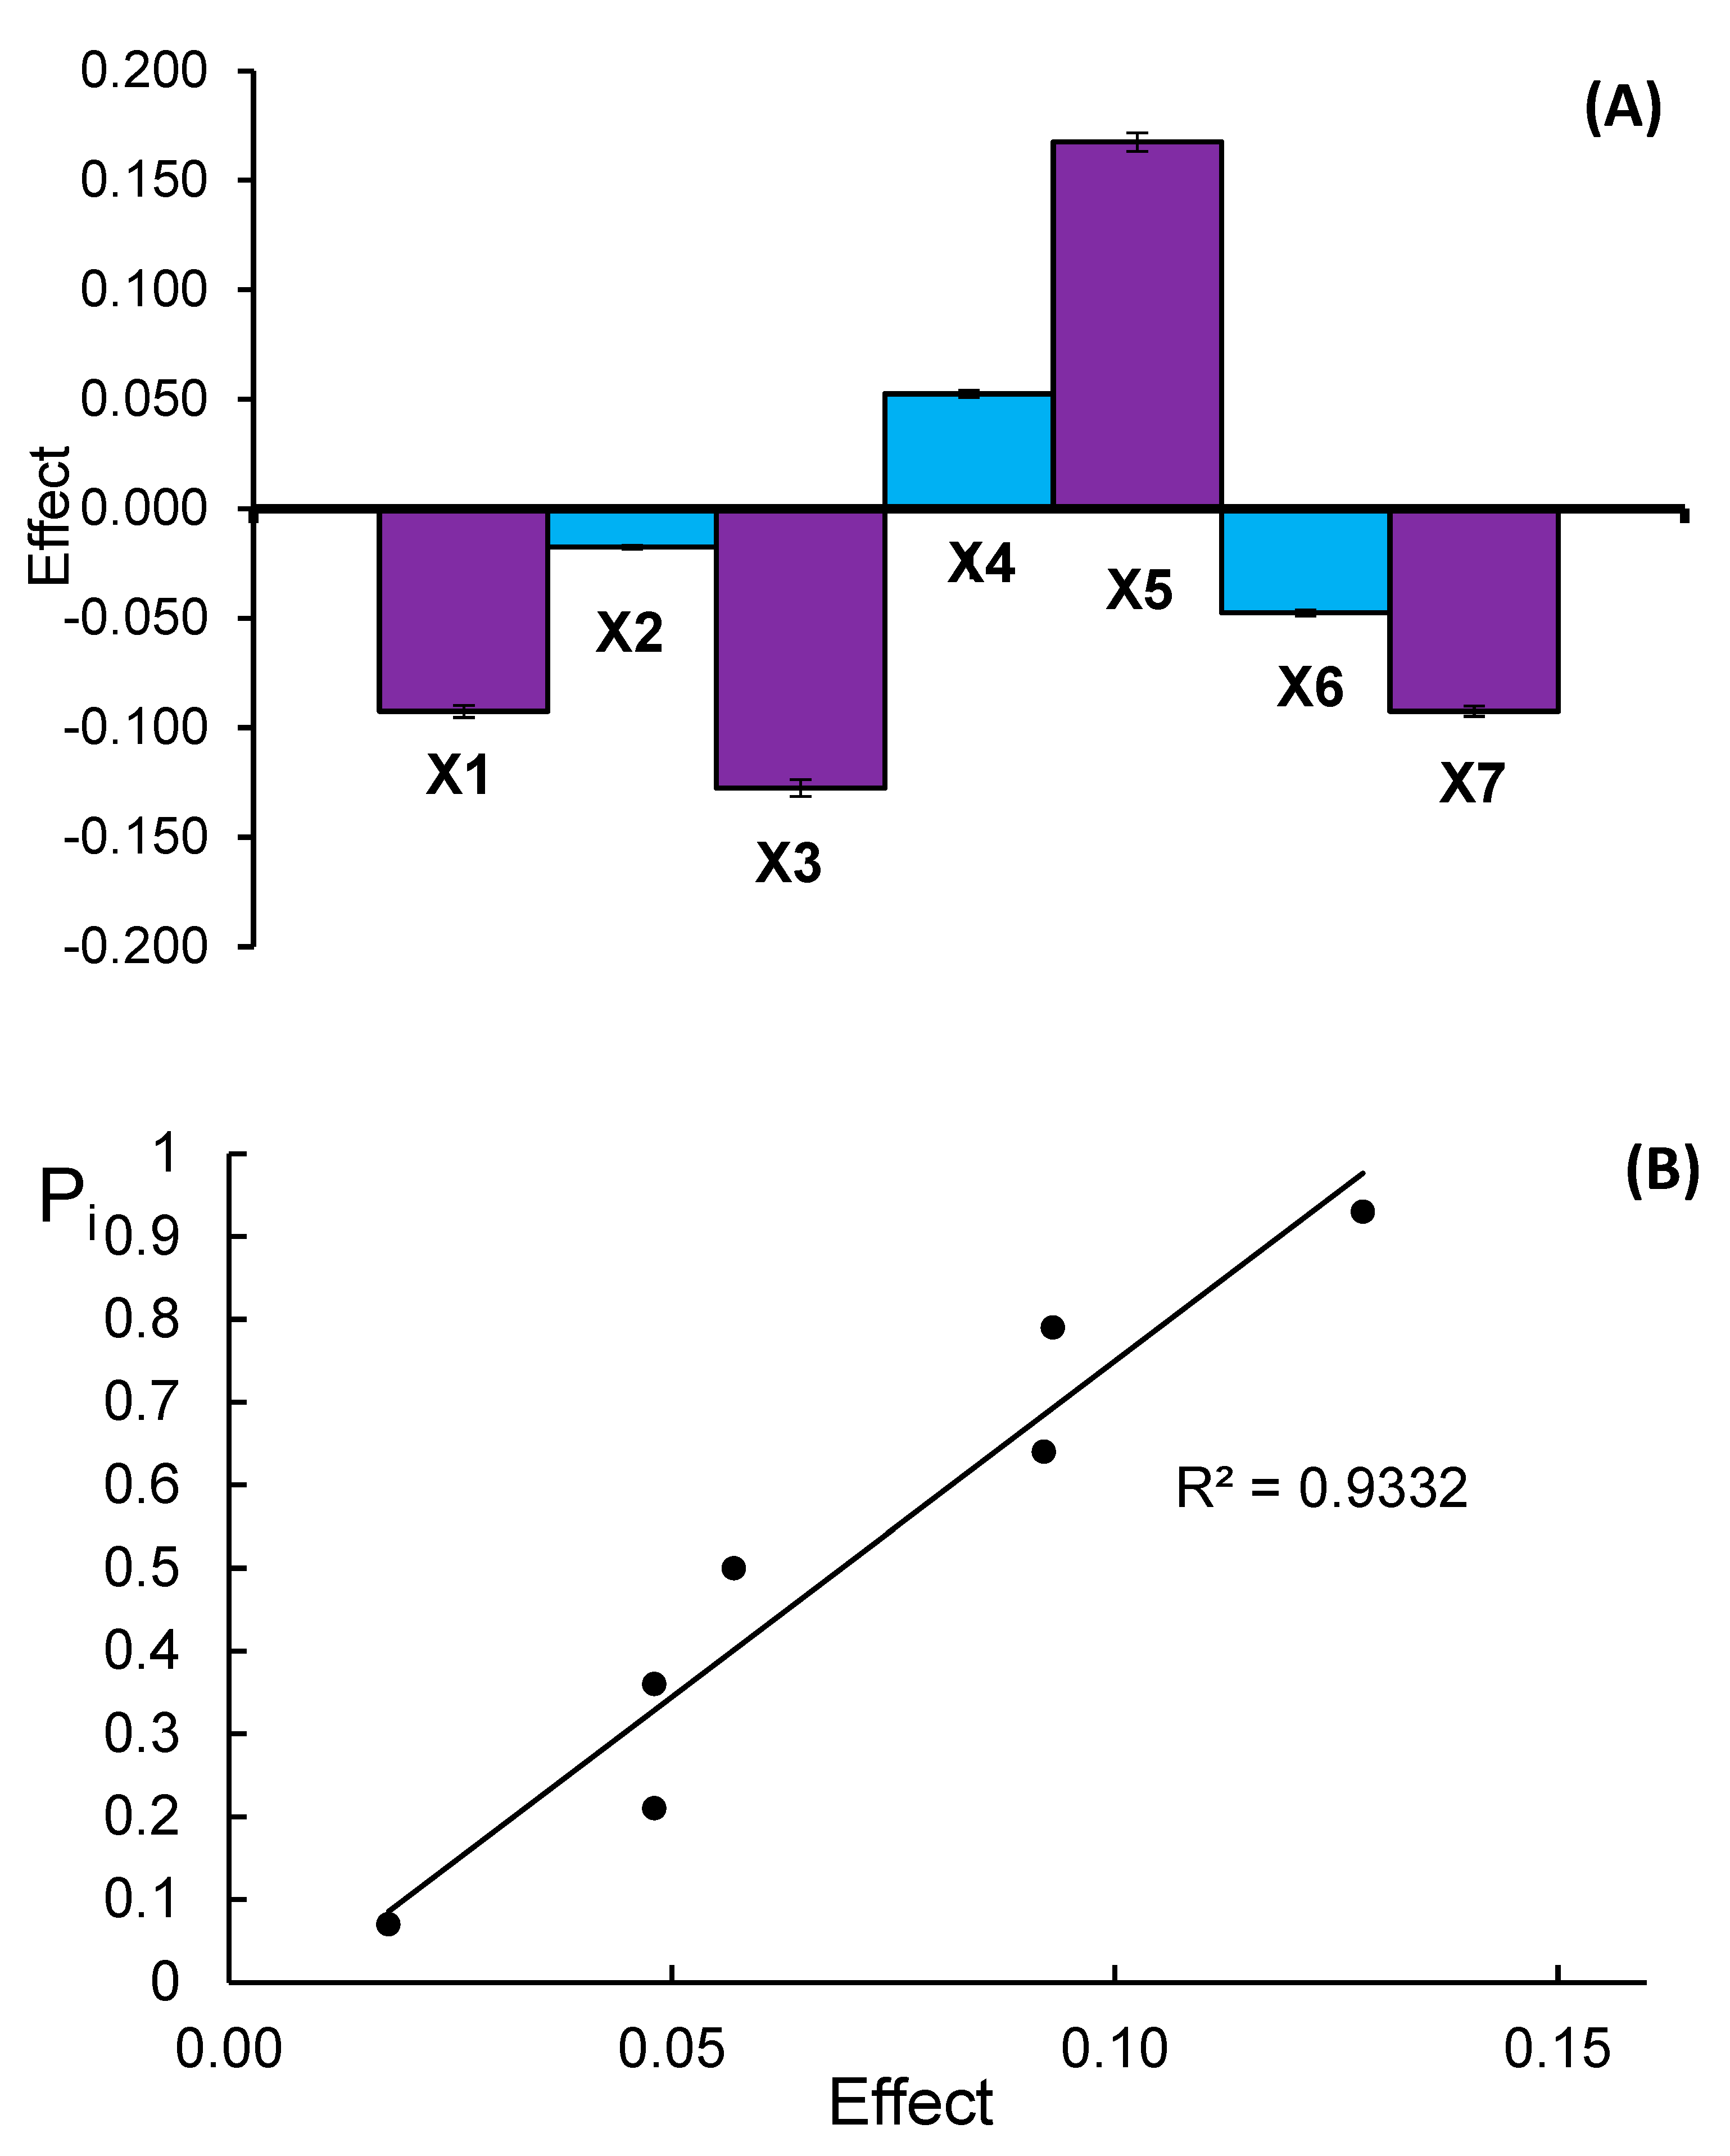
Figure 1. Robustness test for the range 1.0–5.0 µg/spot: the effects of changing the analysis conditions (A) and the half-normal plot of the probability of effects (B) for determination of donepezil in Cogiton tablets.
Processes 13 01106 g001
Figure 2. Robustness test for the range 1.0–5.0 µg/spot: the effects of changing the analysis conditions (A) and the half-normal plot of the probability of effects (B) for determination of donepezil in Donecept tablets.
Processes 13 01106 g002
Figure 3. Densitogram of donepezil standard (RF = 0.62 ± 0.03).
Processes 13 01106 g003
Figure 4. Densitogram of donepezil from Cogiton tablets (RF = 0.62 ± 0.03).
Processes 13 01106 g004
Figure 5. Spectrodensitogram of donepezil standard and donepezil from Cogiton tablets.
Processes 13 01106 g005
Table 1. Method-validation data in the ranges 1.0–5.0 and 0.2–1.0 μg/spot for the quantitative determination of donepezil using thin-layer chromatography with densitometry.
Method CharacteristicDonepezil
Retardation factor (RF)0.62 ± 0.03
LOD [µg/spot]0.049
LOQ [µg/spot]0.147
Range [μg/spot]1.0–5.0
Linearity [μg/spot]A = x ·0.00397(±0.00008) + 0.00920(±0.0027)
n = 5, r = 0.9994, s = 0.00025, F = 2425, p < 0.0001
For tablets
Cogiton (CG)Donecept (DT)
Accuracy (n = 6)
for 50% standard addedR = 98.0%; CV = 1.17%R = 99.8%; CV = 1.40%
for 100% standard added R = 96.1%; CV = 0.88%R = 97.3%; CV = 1.49%
for 150% standard addedR = 96.3 %; CV = 1.09%R = 96.9%; CV = 1.82%
Average recovery96.8%98.0%
Precission (CV, [%])
Intraday (n = 3)
for 1.0 µg/spot2.660.93
for 3.0 µg/spot1.090.32
for 5.0 µg/spot0.520.69
Interday (n = 3)
for 1.0 µg/spot0.880.85
for 3.0 µg/spot 0.471.09
for 5.0 µg/spot 0.280.50
Range [μg/spot]0.2–1.0
Linearity [μg/spot]A = 0.01058 (±0.00020) x + 0.00261 (±0.00013)
n = 9, r = 0.9988; s = 0.00015, F = 2896, p ˂ 0.0001
For tablets
Cogiton (CG)Donecept (DT)
Accuracy (n = 6)
for 50% standard addedR = 99.2%; CV = 2.01%R = 98.4%; CV = 1.89%
for 100% standard added R = 98.9%; CV = 1.11%R = 98.2%; CV = 2.13%
for 150% standard addedR = 97.8%; CV = 1.25%R = 97.1%; CV = 1.78%
Average recovery98.6%97.9%
Precission (CV, [%])
Intraday (n = 3)
for 0.2 µg/spot1.732.04
for 0.6 µg/spot2.150.99
for 1.0 µg/spot2.660.93
Interday (n = 3)
for 0.2 µg/spot1.891.23
for 0.6 µg/spot 1.112.18
for 1.0 µg/spot 0.880.85
Robustness (CV, [%])robustrobust
where: A is the area of the chromatographic band (spot) of donepezil [AU], n is the number of measurement points, x is the micrograms donepezil/spot, and r is the correlation coefficient.
Table 2. Experimental design matrix (23) for robustness test for donepezil in Cogiton (CG) and Donecept (DT) tablets in the range 1.0–5.0 µg/spot.
Experiment
No
X1X2X3X4X5X6X7Donepezil Content (yi)
[mg/Tablet]
CGDT
1+++++++4.894.78
2++-+---4.995.02
3+-+--+-4.784.88
4+---+-+5.035.02
5-++-+--5.074.89
6-+---++4.894.92
7--++--+4.884.99
8---+++-5.225.09
Size of effectCG−0.092−0.018−0.1280.0520.168−0.048−0.093
DT−0.048−0.092−0.1280.043−0.007−0.063−0.042
The label claim [mg] 55
Average amount [mg] 4.974.95
Variance 0.0190.010
Standard deviation (SD) 0.140.10
Coefficient of variation [CV, %] 2.82.0
Standardized skewness 0.730−0.390
Standardized kurtosis 0.172−0.206
Table 3. Comparison of precision and LOD values of donepezil investigated using liquid chromatography and spectrophotometric methods obtained by other authors.
TechniqueLODIntraday
Precision (CV, %)
Interday
Precision (CV, %)
Ref.
RP-HPLC-UV0.03 µg/mL0.24–1.831.41–1.81[5]
RP-HPLC-UV0.14 µg/mL0.512–1.1500.228–1.351[6]
RP-HPLC-UV2.96 µg/mL<2<2[7]
RP-HPLC-UV1.40 µg/mL1.443.54[8]
RP-HPLC-DAD0.031 µg/mL<2<2[9]
RP-HPLC-DAD0.017 µg/mL0.358–0.6551.522–2.679[10]
RP-HPLC-PDA0.04 µg/mL<2<2[11]
RP-HPLC-FLD5.0 ng/mL<2<2[13]
Chiral HPLC10 ng/mL1.01–1.290.57–1.28[14]
Spectrophotometric0.0770 µg/mL0.17230.3140[15]
HPTLC15.4 ng/spot0.086–0.3030.218–0.357[17]
HPTLC80.85 ng/spot--[18]
TLC0.049 µg/spot = 49 ng/spot
= 9.8 µg/mL
<3<3In this work
Table 4. Donepezil assays [mg/tablet] obtained from nine repeated different analyses using the proposed TLC-densitometric method, with two ranges of linearity.
Donepezil in
CogitonDonecept
Calculated Using Range [µg/Spot]
1.0–5.00.2–1.01.0–5.00.2–1.0
Number of analyses9999
Content in tablet [mg]
14.775.024.764.89
25.064.875.044.97
34.944.924.865.09
44.984.854.995.01
55.024.965.074.87
64.944.914.884.93
74.985.035.014.94
85.024.984.954.90
95.104.895.024.97
Average [mg]4.984.944.954.95
Average using two ranges [mg]4.964.95
Label claimed [mg/tablet]55
Amount of donepezil (%) in relation to the label claim99.698.899.099.0
Amount of donepezil (%) using two ranges in relation to the label claim99.299.0
Standardized skewness (n = 9)−1.5870.304−1.0831.171
Standardized kurtosis (n = 9)1.688−0.805−0.0010.583
Standard deviation (SD)0.0940.0640.1010.068
Coefficient of variation [CV, %]1.881.302.041.37
Confidence interval of
arithmetic mean with
confidence level equal to 95%
µ = 4.98 ± 0.06µ = 4.94 ± 0.02µ = 4.95 ± 0.08µ = 4.95 ± 0.05
t calculated0.8520.000
t(95%.16) tabulated2.1202.120
F calculated1.72
3.44
2.21
3.44
F(95%.f1=f2=8) tabulated
Standardized skewness (n = 18)−0.842−0.733
Standardized kurtosis (n = 18)0.2810.153
Disclaimer/Publisher’s Note: The statements, opinions and data contained in all publications are solely those of the individual author(s) and contributor(s) and not of MDPI and/or the editor(s). MDPI and/or the editor(s) disclaim responsibility for any injury to people or property resulting from any ideas, methods, instructions or products referred to in the content.