Abstract
SmF3 cannot be reduced to metallic samarium by aluminum due to variable valence states of Sm. This study investigates the reduction products of SmF3 via an aluminothermic reduction. The effect of molar ratios of Al/SmF3 on the morphology, elemental distribution, crystal structure, and chemical valence of the samples were investigated by scanning electron microscopy (SEM), energy-dispersive X-ray spectroscopy (EDS), X-ray diffraction (XRD), and X-ray photoelectron spectroscopy (XPS). The thermodynamic results show that it is feasible for SmF3 reduction by Al to form SmF2 in 933~1356 K. SmF2.413, AlF3, and Sm(AlF)5 are obtained under the condition of the molar ratio of Al to SmF3 at 1:3, 2:3, 3:3, 4:3, and 5:3. The samarium of the reduction products exhibits mixed valence states of Sm3+ and Sm2+, with the ratio δ of F to Sm determined by a(δ) = −0.1794δ + 5.819 (0 ≤ δ ≤ 0.4615). The presence of adsorbed oxygen in the products facilitates the oxidation process from Sm2+ to Sm3+. These findings may provide a theoretical basis on the development of valence states for other rare earth elements in aluminothermic reduction.
1. Introduction
Samarium (Sm) and its compounds are widely studied for their unique physicochemical properties and applications in optics, catalysis, and materials science. Among these compounds, samarium (II) fluoride (SmF2) is notable for its high melting point, thermal stability, and optical performance, making it valuable for high-performance optics and display technologies [1,2,3]. After Ba2+ was partially replaced by Sm2+ in BaAl2Si3O4N4, it was found that the photoluminescence spectrum at a low temperature consists of some sharp spectral lines, and BaAl2Si3O4N4:Sm2+ showed excellent thermal stability [4]. In terms of catalysis, Sm: WO3 nanoparticles were prepared by chemical co-precipitation. The results showed that the photocatalytic performance and photogenerated carrier separation efficiency were improved with increasing the Sm doping concentration from 0 to 7 wt.%, and the superior antibacterial activity against staphylococcus aureus (18 mm) was obtained with the Sm: WO3 (7 wt.%) sample [5].
The diverse oxidation states of Sm are critical to its functional versatility in materials science and chemistry. While the +3 oxidation state is the most thermodynamically stable and widely observed, the +2 state has gained significant attention due to its distinctive electronic configuration (4f) and relative stability under specific conditions. Zuo et al. [6] systematically investigated the electrochemical behavior of the Sm(III)/Sm(II) redox couple in 2LiF-BeF2(FLiBe) molten salt in the range of 773–973 K. Their study confirmed the coexistence of Sm(III) and Sm(II) in the molten salt system, with the redox reaction on an inert tungsten electrode exhibiting quasi-reversible kinetics. Furthermore, the growth of single crystals with the composition La1−y(Sm3+1−xSm2+x)yF3−xy (y = 0.04) via the vertical Bridgman method provided direct evidence of the reduction of Sm3+ to Sm2+ during crystallization. The observed phenomenon was attributed to interactions with carbonaceous species in the melt [7]. In the co-deposition of SmCo in an aqueous solution [8], as well as in the electrodeposition process using 1-Butyl-1-Methylpyrrolidinium dicyanamide ionic liquid [9], NaCl-KCl melts [10], LiCl-KCl Eutectic Molten Salt [11], and LiCl-KCl-SmCl3 melt [12], only Sm2+ was detected. These findings underscore the significance of elucidating the valence state evolution of samarium in diverse chemical environments, as it profoundly influences the structural, electronic, and functional properties of the resulting materials.
However, the reduction of samarium compounds remains a challenging process due to the complex reaction mechanisms and the stability of Sm2+. Traditional reduction methods using alkali metals (Li, Na, K) or alkaline earth metals (Ca, Mg) often result in the formation of stable bivalent samarium halides (Sm2+) rather than Sm0, owing to the tendency of samarium to achieve a stable electron configuration (3d104f6) close to the semi-full state of the 4f shell [13]. Recent studies have demonstrated that hydrogen reduction can generate non-integer valence states of samarium, such as SmF2.29 and SmFx, with the valence state of samarium ranging from +2.0 to +2.5 [14,15,16]. These findings indicate that samarium can exhibit non-integer valence states between +2 and +3, further complicating the reduction process.
Previous studies on the reduction of samarium halides using Li, Na, K, Ca, and Mg have shown that none of these methods can produce Sm. In the preparation of rare earth aluminum alloys, aluminum has been widely used in the production of rare earth aluminum alloys, such as La-Al and Y-Al alloys [17]. While its application in the reduction of SmF3 to Sm has not been systematically investigated. In this study, the valence state evolution of samarium during the aluminothermic reduction of SmF3 was investigated. The effect of the Al/SmF3 molar ratios on the products was examined. The phase structure, chemical valence, and morphology of the reduction products were analyzed. The variation in the valence state of samarium in the reduction products was elucidated. These findings will provide an important reference for understanding the mechanism of samarium valence changes during the aluminothermic reduction process.
2. Materials and Methods
2.1. Raw Materials
The chemical reagents used in this work included SmF3 powder (purity > 99.99%); it was supplied by Ganzhou Shilei Rare Earth Materials Co., Ltd., Ganzhou, China. Al strip (purity > 99.99%) was supplied by Dongguan Changan Baolu Metal Materials Co., Ltd., Dongguan, China. The argon gas (purity > 99.99%) was supplied by Ganzhou Jianli Gas Co., Ltd., Ganzhou, China. The SmF3 powder was pretreated before the experiment under vacuum at 423 K for 5 h to remove any moisture. The molar ratios of Al and SmF3 were set as 1:3, 2:3, 3:3, 4:3, and 5:3.
2.2. Sample Preparation
Before the experiment, Al strips were cut into pieces, mixed with SmF3 in proportion. The reactants were pressed into chunks using a tablet press (Model FW-4, Tianjin TianGuang Optical Instrument Co., Ltd., Tianjin, China) and loaded into a tungsten crucible. The experiments were conducted using a high-vacuum induction melting furnace (Model VGL-400, Shenyang Oute Vacuum Technology Co., Ltd., Shenyang, China). During the experiment, the reactants were gradually heated to 500~600 °C and maintained at this range for three to five minutes. Subsequently, the temperature rapidly increased until complete melting was achieved, after which heating was discontinued. After undergoing furnace cooling, the reduction products were retrieved and collected.
2.3. Material Characterization
The phase composition of the reduction products was characterized by powder X-ray diffraction (XRD, Empyrean, Netherlands, Cu Kα, 10° ≤ 2θ ≤ 90°), and the XRD data were analyzed using the HighScore software (version 4.9, PANalytical B.V., Almelo, Netherlands). Scanning electron microscopy (SEM, MLA650F, FEI Company, Hillsboro, Oregon, USA) was used to analyze the microstructure of the reduction products, and energy-dispersive spectrometry (EDS, JSM-6480A; JEOL Ltd., Tokyo, Japan) was utilized to analyze the micro-chemical zone of the reduction products. X-ray photoelectron spectroscopy (XPS, 250Xi, Thermo Fisher Scientific, Waltham, MA, USA) was performed to explore the composition detection and valence analysis of the reduction products.
3. Results and Discussion
3.1. Thermodynamic Calculation
The potential reduction reactions of SmF3 using Al as a reducing agent at various temperatures are presented, along with the corresponding Gibbs free energy values for each reaction in relation to the temperature. The Gibbs free energy change () for these reactions was calculated using the Gibbs–Helmholtz equation, as shown in Equation (1).
where is the standard reaction enthalpy, is the standard reaction entropy, and T is the absolute temperature in Kelvin. The thermodynamic calculations for the reduction reaction of SmF3 by Al were performed using data from the handbook [18].
Al(l) + 3SmF3(s) = AlF3(l) + 3SmF2(s),
Al(l) + SmF3(s) = AlF3(l) + Sm(s),
Figure 1 illustrates the dependence of Gibbs free energy ( on the temperature (T) for the two chemical reactions (2) and (3). As depicted in Figure 1, it can be observed that the Gibbs free energy of the reaction is positive when SmF3 reduced by Al to yield metallic Sm, indicating that the reaction is thermodynamically non-spontaneous. In contrast, when the reduction product is SmF2, the Gibbs free energy of the reaction becomes negative below 1356 K, suggesting that the reaction is thermodynamically feasible. The lower limit of 933 K was chosen based on the melting point of aluminum, ensuring its molten state for the reduction reaction. Therefore, the temperature range of 933~1356 K was selected.
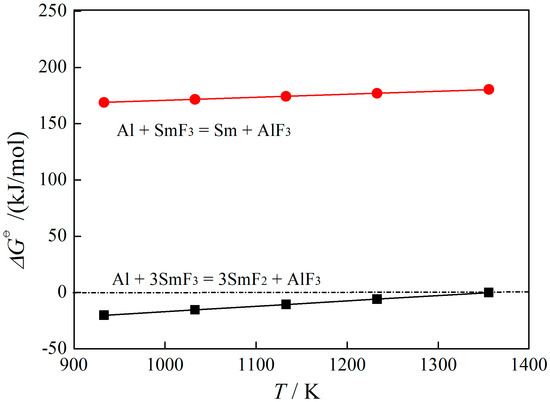
Figure 1.
The dependence of
on T of SmF3 reduced by Al.
3.2. Phase Analysis
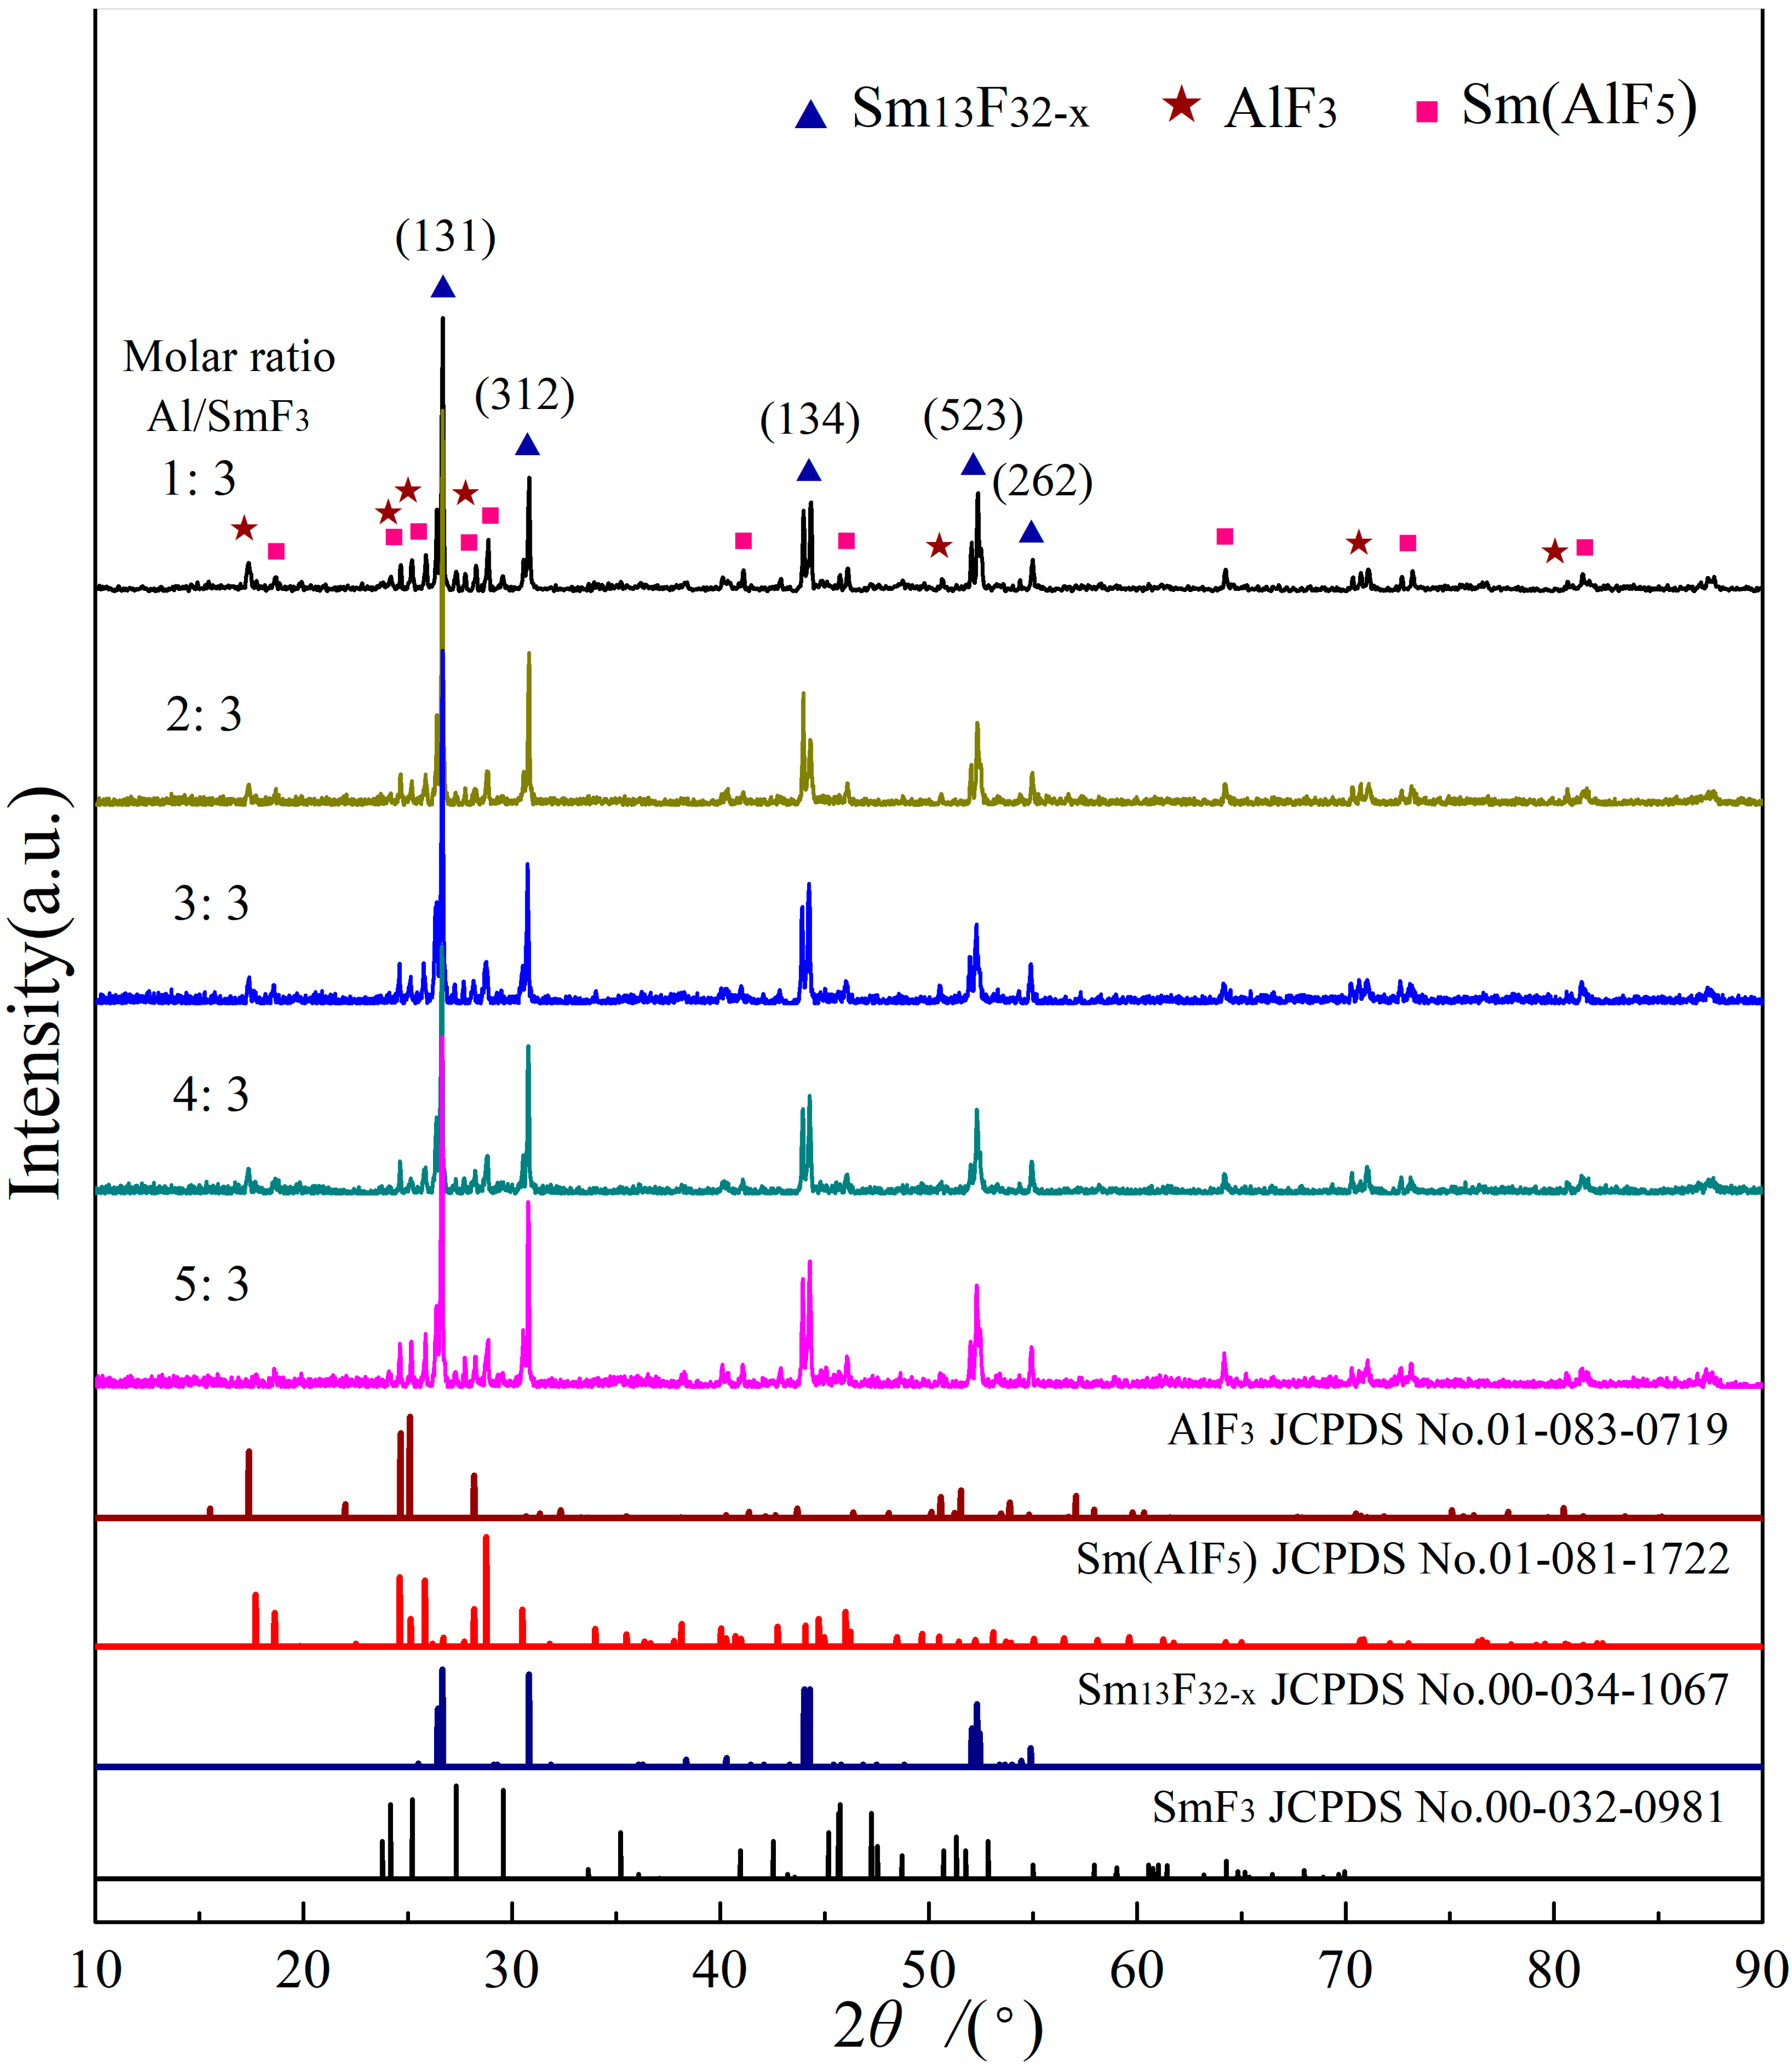
The XRD results of the reduction products corresponding to SmF3 reduced by Al are shown in Figure 2. It shows a high degree of conformity between the diffraction peaks of the reduction products and those of the Sm13F32−x standard card (JCPDS No. 00-034-1067), suggesting that Sm13F32−x (0 ≤ x ≤ 1) is the main reduction product. Furthermore, the XRD pattern of the Sm13F32−x is entirely different from that of the SmF3 standard card (JCPDS No. 00-032-0981), confirming that SmF3 participated in the reaction and was transformed into new phases. Simultaneously, upon comparison with the diffraction peaks of AlF3 standard card (JCPDS No. 01-083-0719) and Sm(AlF5) standard card (JCPDS No. 01-081-1722), it is evident that the product’s diffraction peaks closely correspond to the standard peaks. The results indicate the presence of AlF3 and Sm(AlF5) in the reduction products. Moreover, variations in the molar ratio of Al/SmF3 have a minimal impact on the type of product phase. However, according to chemical Equation (2), the reaction products only consist of SmF2 and AlF3. Therefore, the formation of Sm(AlF5) must be attributed to other chemical reactions.

Figure 2.
XRD patterns of reduction products with different Al/SmF3 molar ratios.
The preparation of Sm(AlF5) involved the use of SmF3, Sm, and AlF3 in a molar ratio of 2:1:3, which were heated to 1023 K and held for 7~10 days under argon protection. The reaction process involved the reduction of Sm from SmF3, followed by its reaction with AlF3 to produce SmF2 [19]. In this reaction process, SmF2 was obtained through the reduction of SmF3 with Sm, followed by its reaction with AlF3. The high temperature (1300 K) accelerates the formation of Sm(AlF5), which can be expressed by the following equation:
SmF2(s) + AlF3(s) = Sm(AlF5)(s),
The XRD results indicate that the valence state of Sm in the compound is non-integral. As reported by Greis [15], the partial substitution of Sm2+ with Sm3+ occurs in Sm13F32−x, and the chemical formula of samarium fluoride can be expressed as or (SmII,SmIII)F2+δ, indicating that the valence states of samarium ions in the sample are not integers. The XRD results show that the sample does not consist of mechanical mixture of SmF3 and SmF2 but rather exhibits an intermediate valence state between 2+ and 3+.
To further determine the value of x in the reduction products, Table 1 lists the diffraction data of products with different molar ratios of Al and SmF3 and Sm13F32−x standard card. The d values corresponding to each index of lattice planes exhibit a high level of consistency with the standard d value, indicating a significant degree of conformity. The ratio δ of F to Sm has been investigated in the literature [20,21,22], which can be determined through a functional equation; the lattice parameter a(δ) is expressed as:
where a represents the lattice parameter in the Rhombohedral system with space group R-3. based on the relationship between the chemical formulas SmF2+δ and Sm13F32−x. The fluorine-to-samarium ratio can be equated as:
This equation establishes a quantitative relationship between δ and x, demonstrating how the stoichiometric deviation (δ) varies with the fluorine deficiency (x) in the reduction product. From Equation (6), the range of δ is determined to be 0 ≤ δ ≤ 0.4615.
a(δ) = −0.01794δ + 0.5819, (units in nm)
δ = (6 − x)/13

Table 1.
Diffraction data of different Al/SmF3 molar ratios and standard data of Sm13F33−x.
Based on the data in Table 1, the low standard deviations (σ) indicate high precision in the experimental results. The parameter δ remains nearly constant across different Al/SmF3 molar ratios, suggesting that the molar ratios of aluminum to SmF3 does not significantly affect the valence state evolution of samarium in the reduction products. This consistency demonstrates that the valence state of samarium in the reduction products is not influenced by variations in the Al/SmF3 molar ratios. According to the XRD results, the lattice constant of the reaction product (molar ratio of Al/SmF3 1:3) was calculated as 0.5745 nm, and δ was 0.413 by substituting into the function Equation (5). Therefore, the value of x in Sm13F32−x obtained through Al reduction of SmF3 was 0.631, indicating that product should be formulated as SmF2.413. The reduction products consist of a mixture of phases, as confirmed by XRD analysis. The separation of individual components was not attempted in this study, but future research could explore methods to isolate these phases, which may provide further insights into their properties and applications.
3.3. Microstructure of Reduction Products
Figure 3 displays the SEM and elemental scanning images of the reduction products corresponding to an Al to SmF3 molar ratio of 1:3. As depicted in Figure 3a, the sample’s fracture surface is uneven, with clearly visible fracture cracks. As depicted in Figure 3b–f, the primary constituents of the sample comprise Sm, F, Al, and O. The presence of O can be attributed to its adsorption from the ambient air during sample preparation. The overall distribution of all elements appears to be uniform; however, the localized enrichment of the Al and O elements is observed in Figure 3d and Figure 3f, respectively. The results of the atomic number ratio of the Sm, F, Al, and O elements are nearly 30:7:1:1. Point scanning was conducted by selecting points 1 and 2 in Figure 3a. The results depicted in Figure 3g,h reveal that point 1 predominantly comprised Sm, F, and a minor quantity of O. The mass ratio of Sm to F was determined to be 5.6:1. Hence, the presence of Sm13F32−x product is plausible at this location. Point 2 is a region with high levels of O and Al, with an O content of 25.50% and an Al of 36.45%, which may exist in the form of Al2O3. During the reaction process, Al2O3 with a high melting point is enveloped in melt. The mass ratio of Sm and F is almost 3:1, indicating that Sm(AlF5) may coexist with Al2O3.
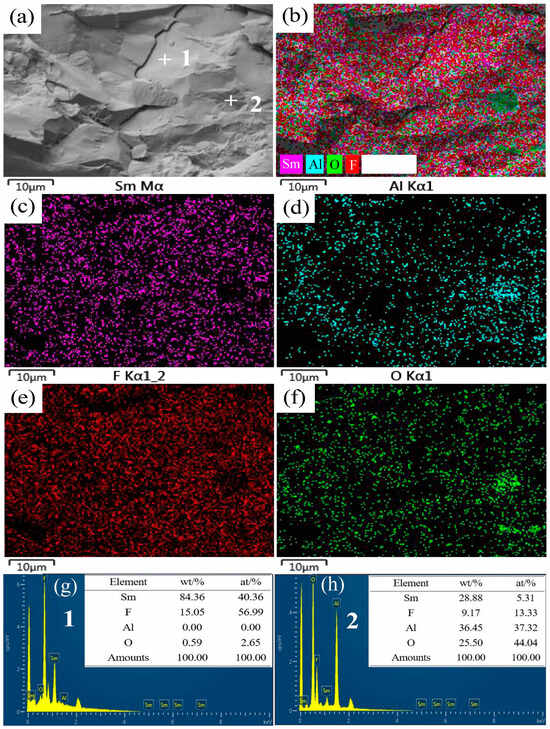
Figure 3.
SEM image and EDS mappings of the sample with an Al/SmF3 molar ratio of 1:3. (a) SEM; (b) EDS mapping; (c) Sm; (d) Al; (e) F; (f) O; (g) Point 1 EDS; (h) Point 2 EDS.
3.4. Surface Composition and Valence State of Reduction Products
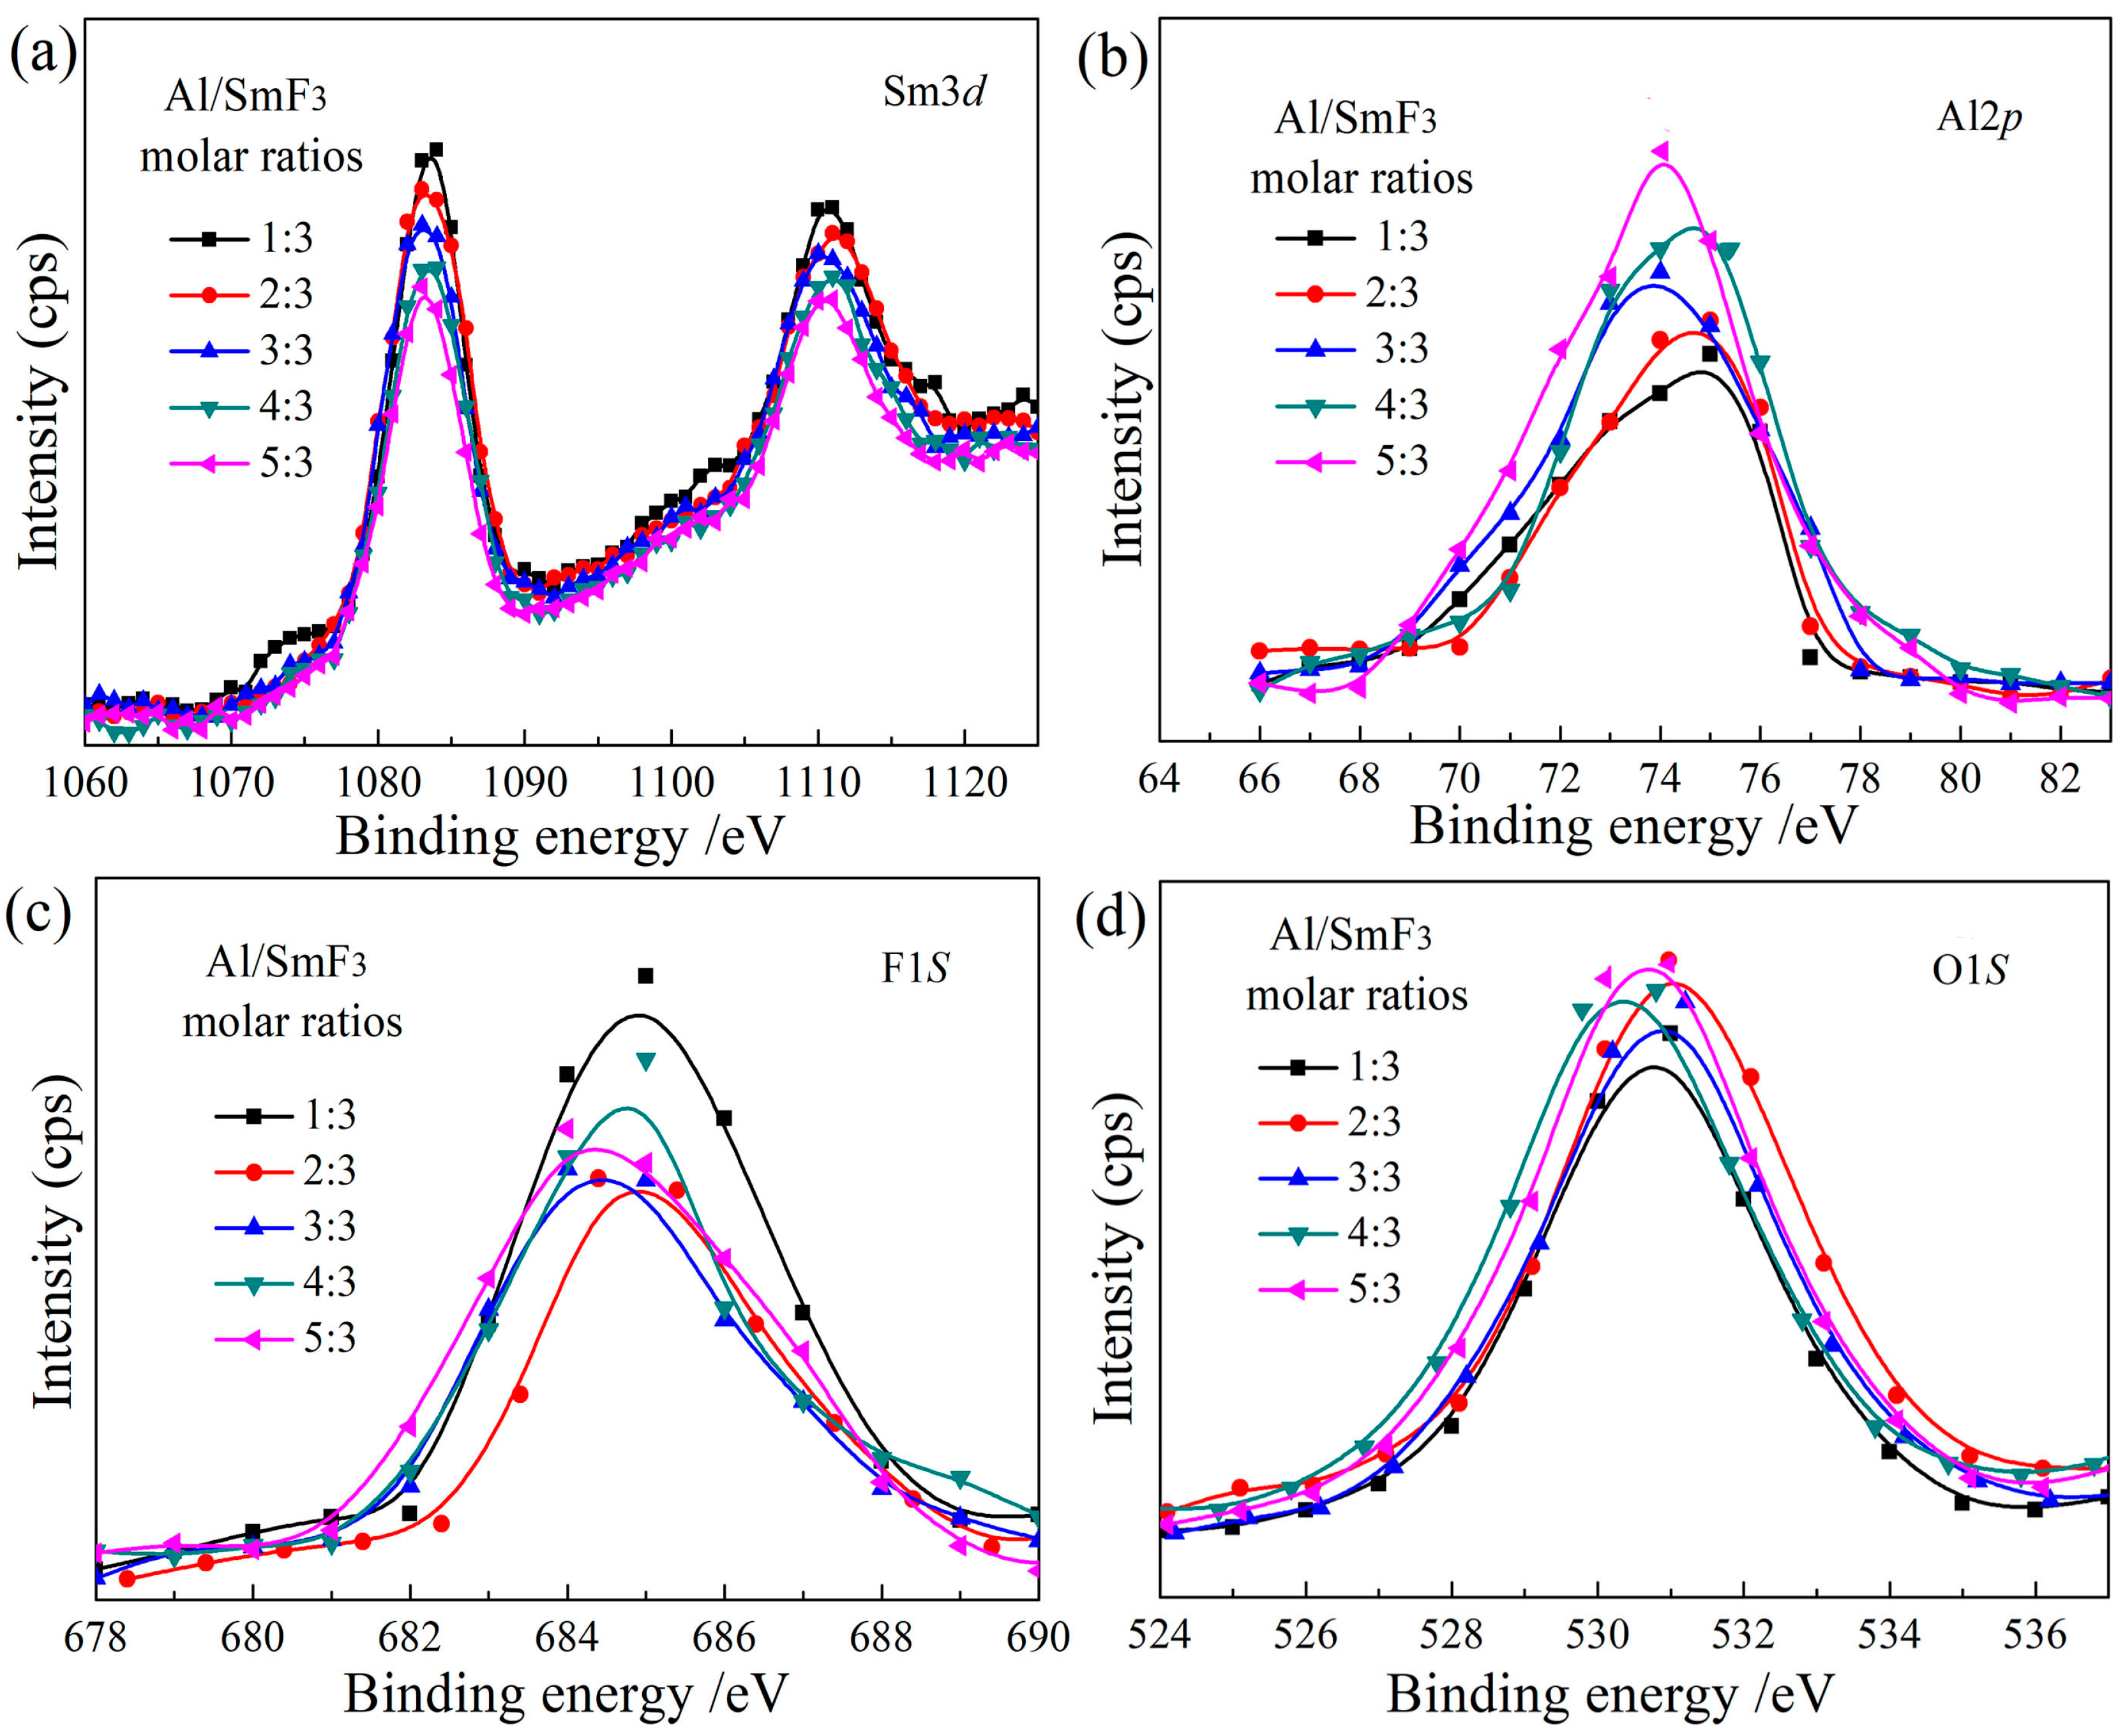
Figure 4 displays the XPS full spectrum scan of the corresponding reduction products obtained at different molar ratios of Al to SmF3 of 1:3, 2:3, 3:3, 4:3, and 5:3. As depicted in Figure 4a–d, the reduction products exhibit characteristic peaks of Sm 3d, Sm 4d, F1s, O 1s, and Al 2p signals, indicating that the products mainly consist of the Sm, F, O, and Al elements. By comparing the characteristic peak intensities of each element, it can be observed that the characteristic peak intensity of Sm gradually decreases in Figure 4a, while a continuous increase in Al content can be observed in Figure 4b. In Figure 4c, the fluorine (F) content generally increases with the Al/SmF3 molar ratios. Meanwhile, in Figure 4d, the oxygen (O) content exhibits an overall increasing trend; however, the characteristic peak intensity of O shows little variation among the samples and remains essentially constant. The relative contents of the Sm, F, O, and Al elements in the sample were determined by calculating the characteristic peak area ratio, as presented in Table 2. The proportion of Al content increases from 5.63% to 12.31%, while the relative concentration of Sm gradually decreases with the rise in the Al content, ranging from 27.2% to 20.43%. The content of O remains essentially unaltered at approximately 35%, with any minor fluctuations primarily attributable to the adsorption of atmospheric oxygen by reduction products. The F content exhibits a slight decrease as the Al content increases, but no significant changes are observed.

Figure 4.
XPS spectra of the reduction products with varying Al/SmF3 molar ratios. (a) Sm3d; (b) Al2p; (c) F1s; (d) O1s.
Table 2.
Relative content of elements in reduction products with different Al/SmF3 molar ratios.
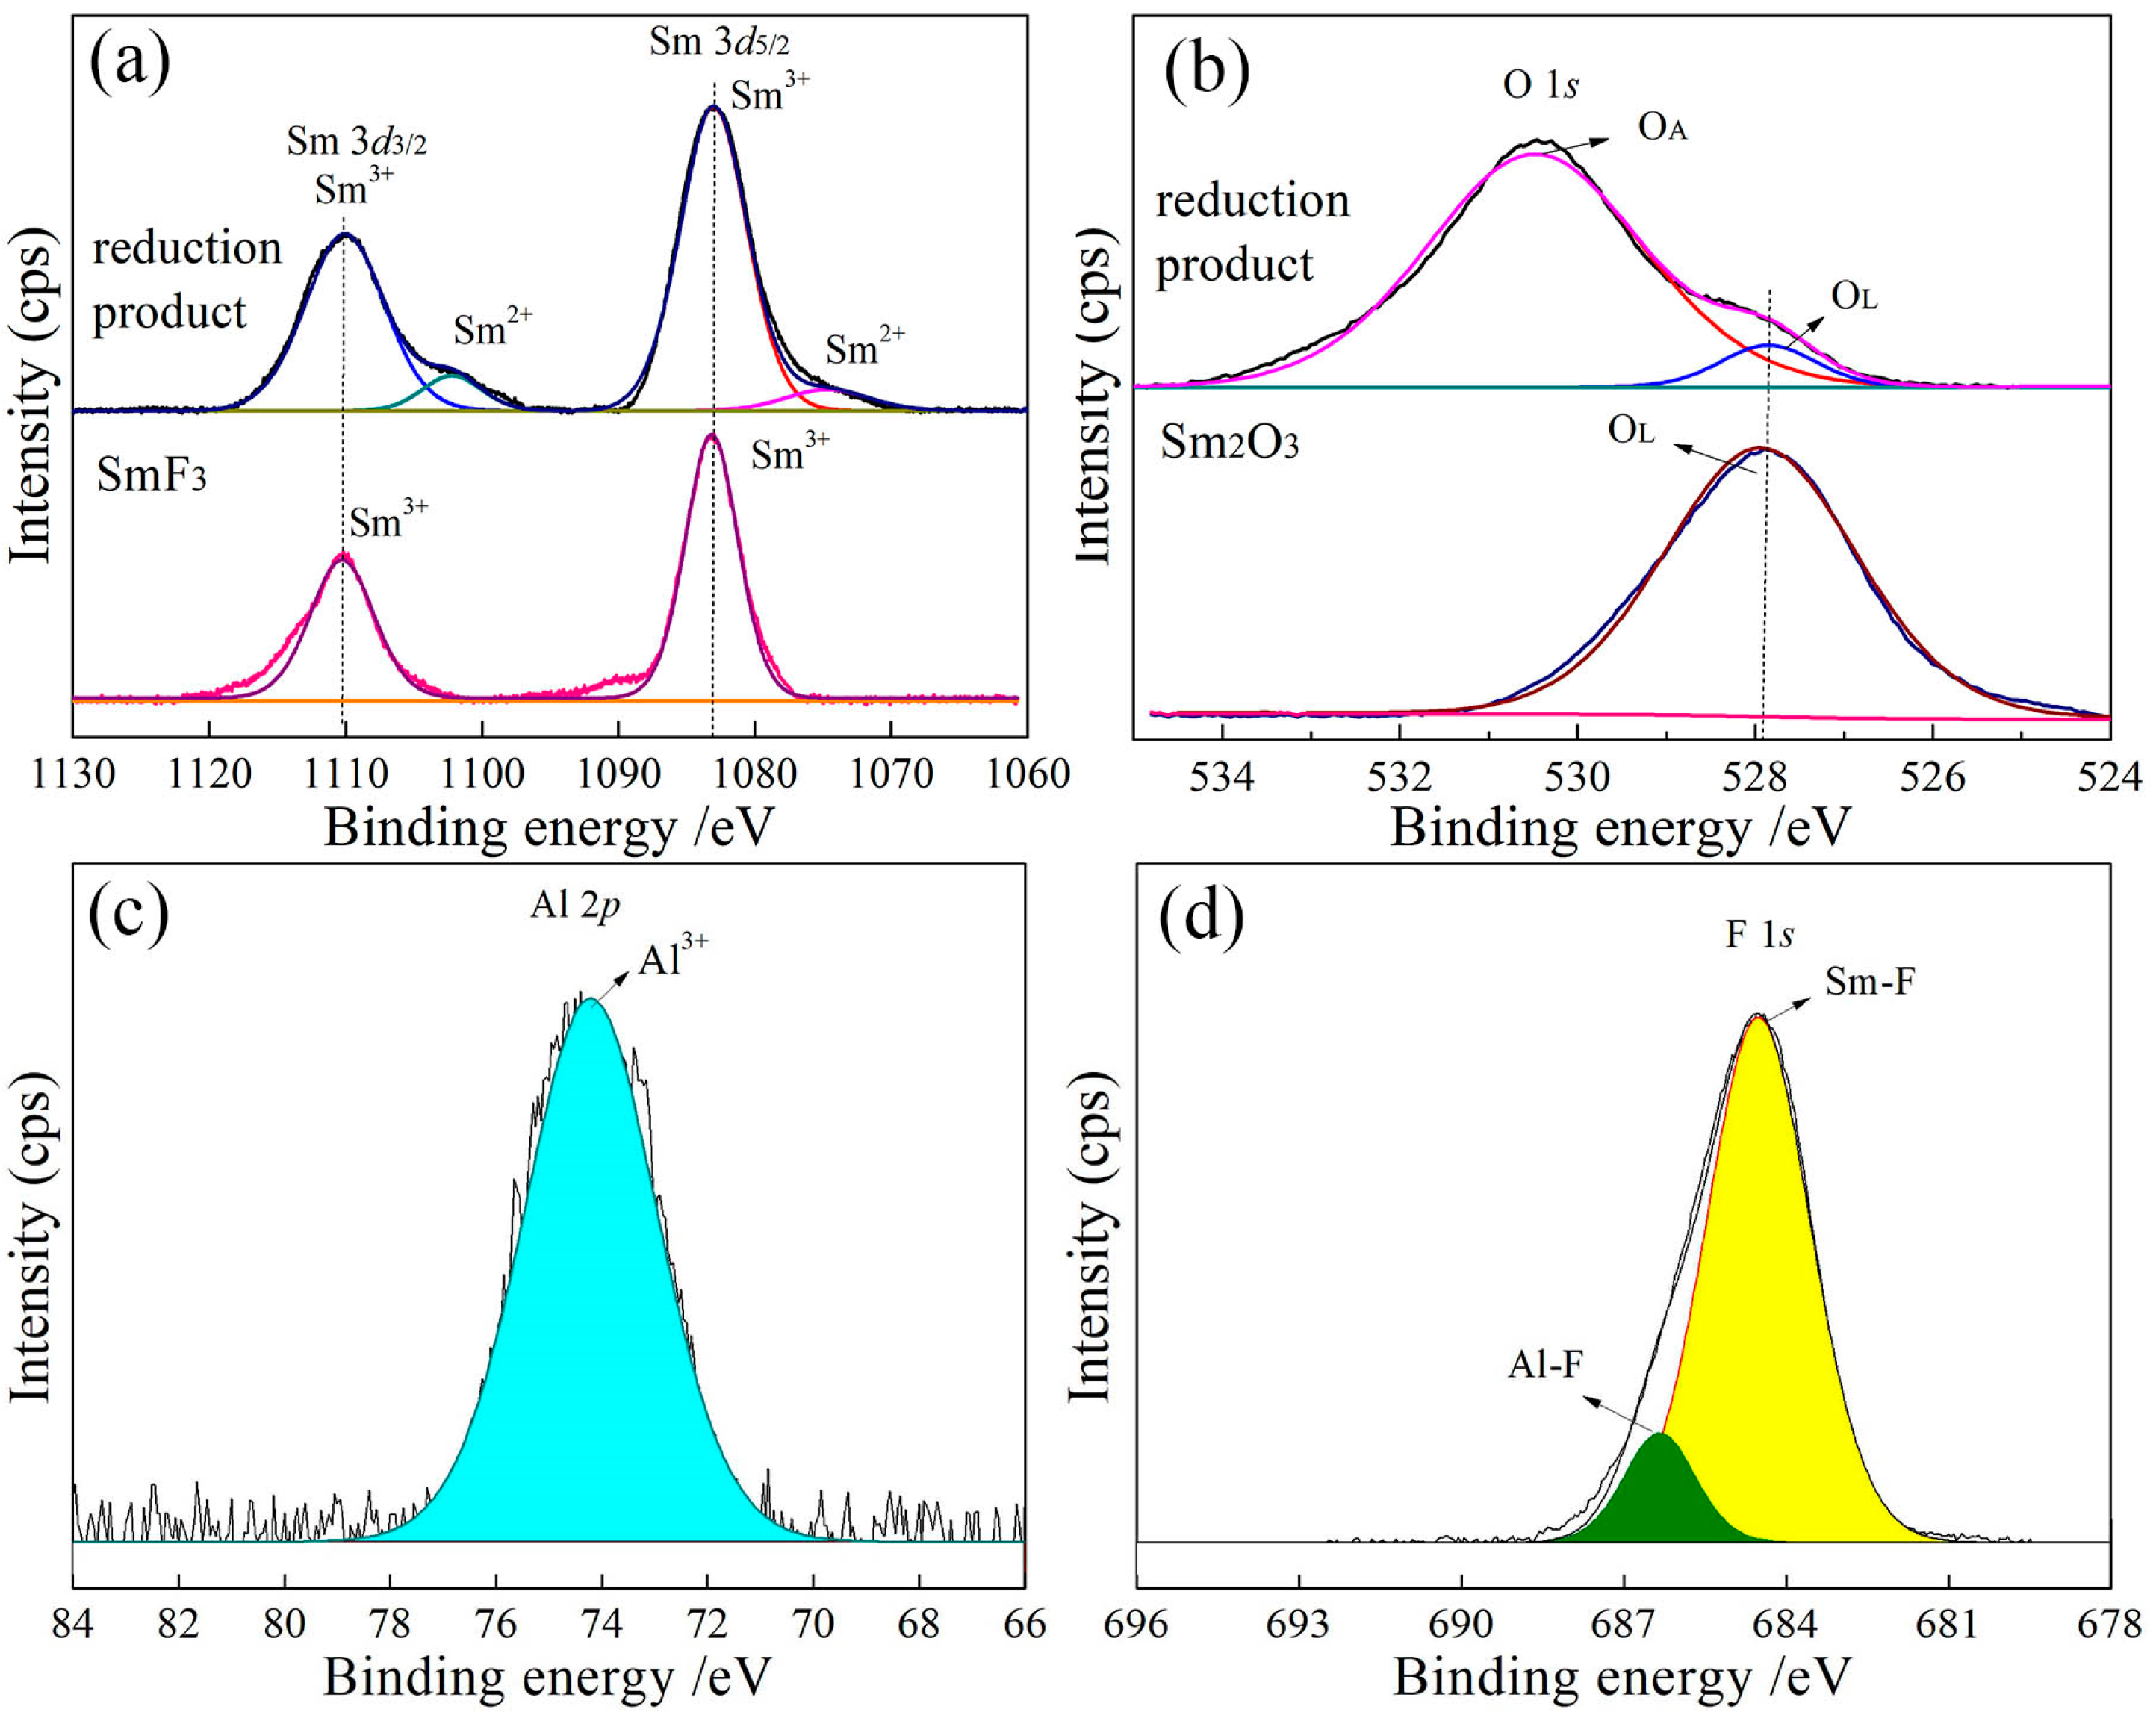
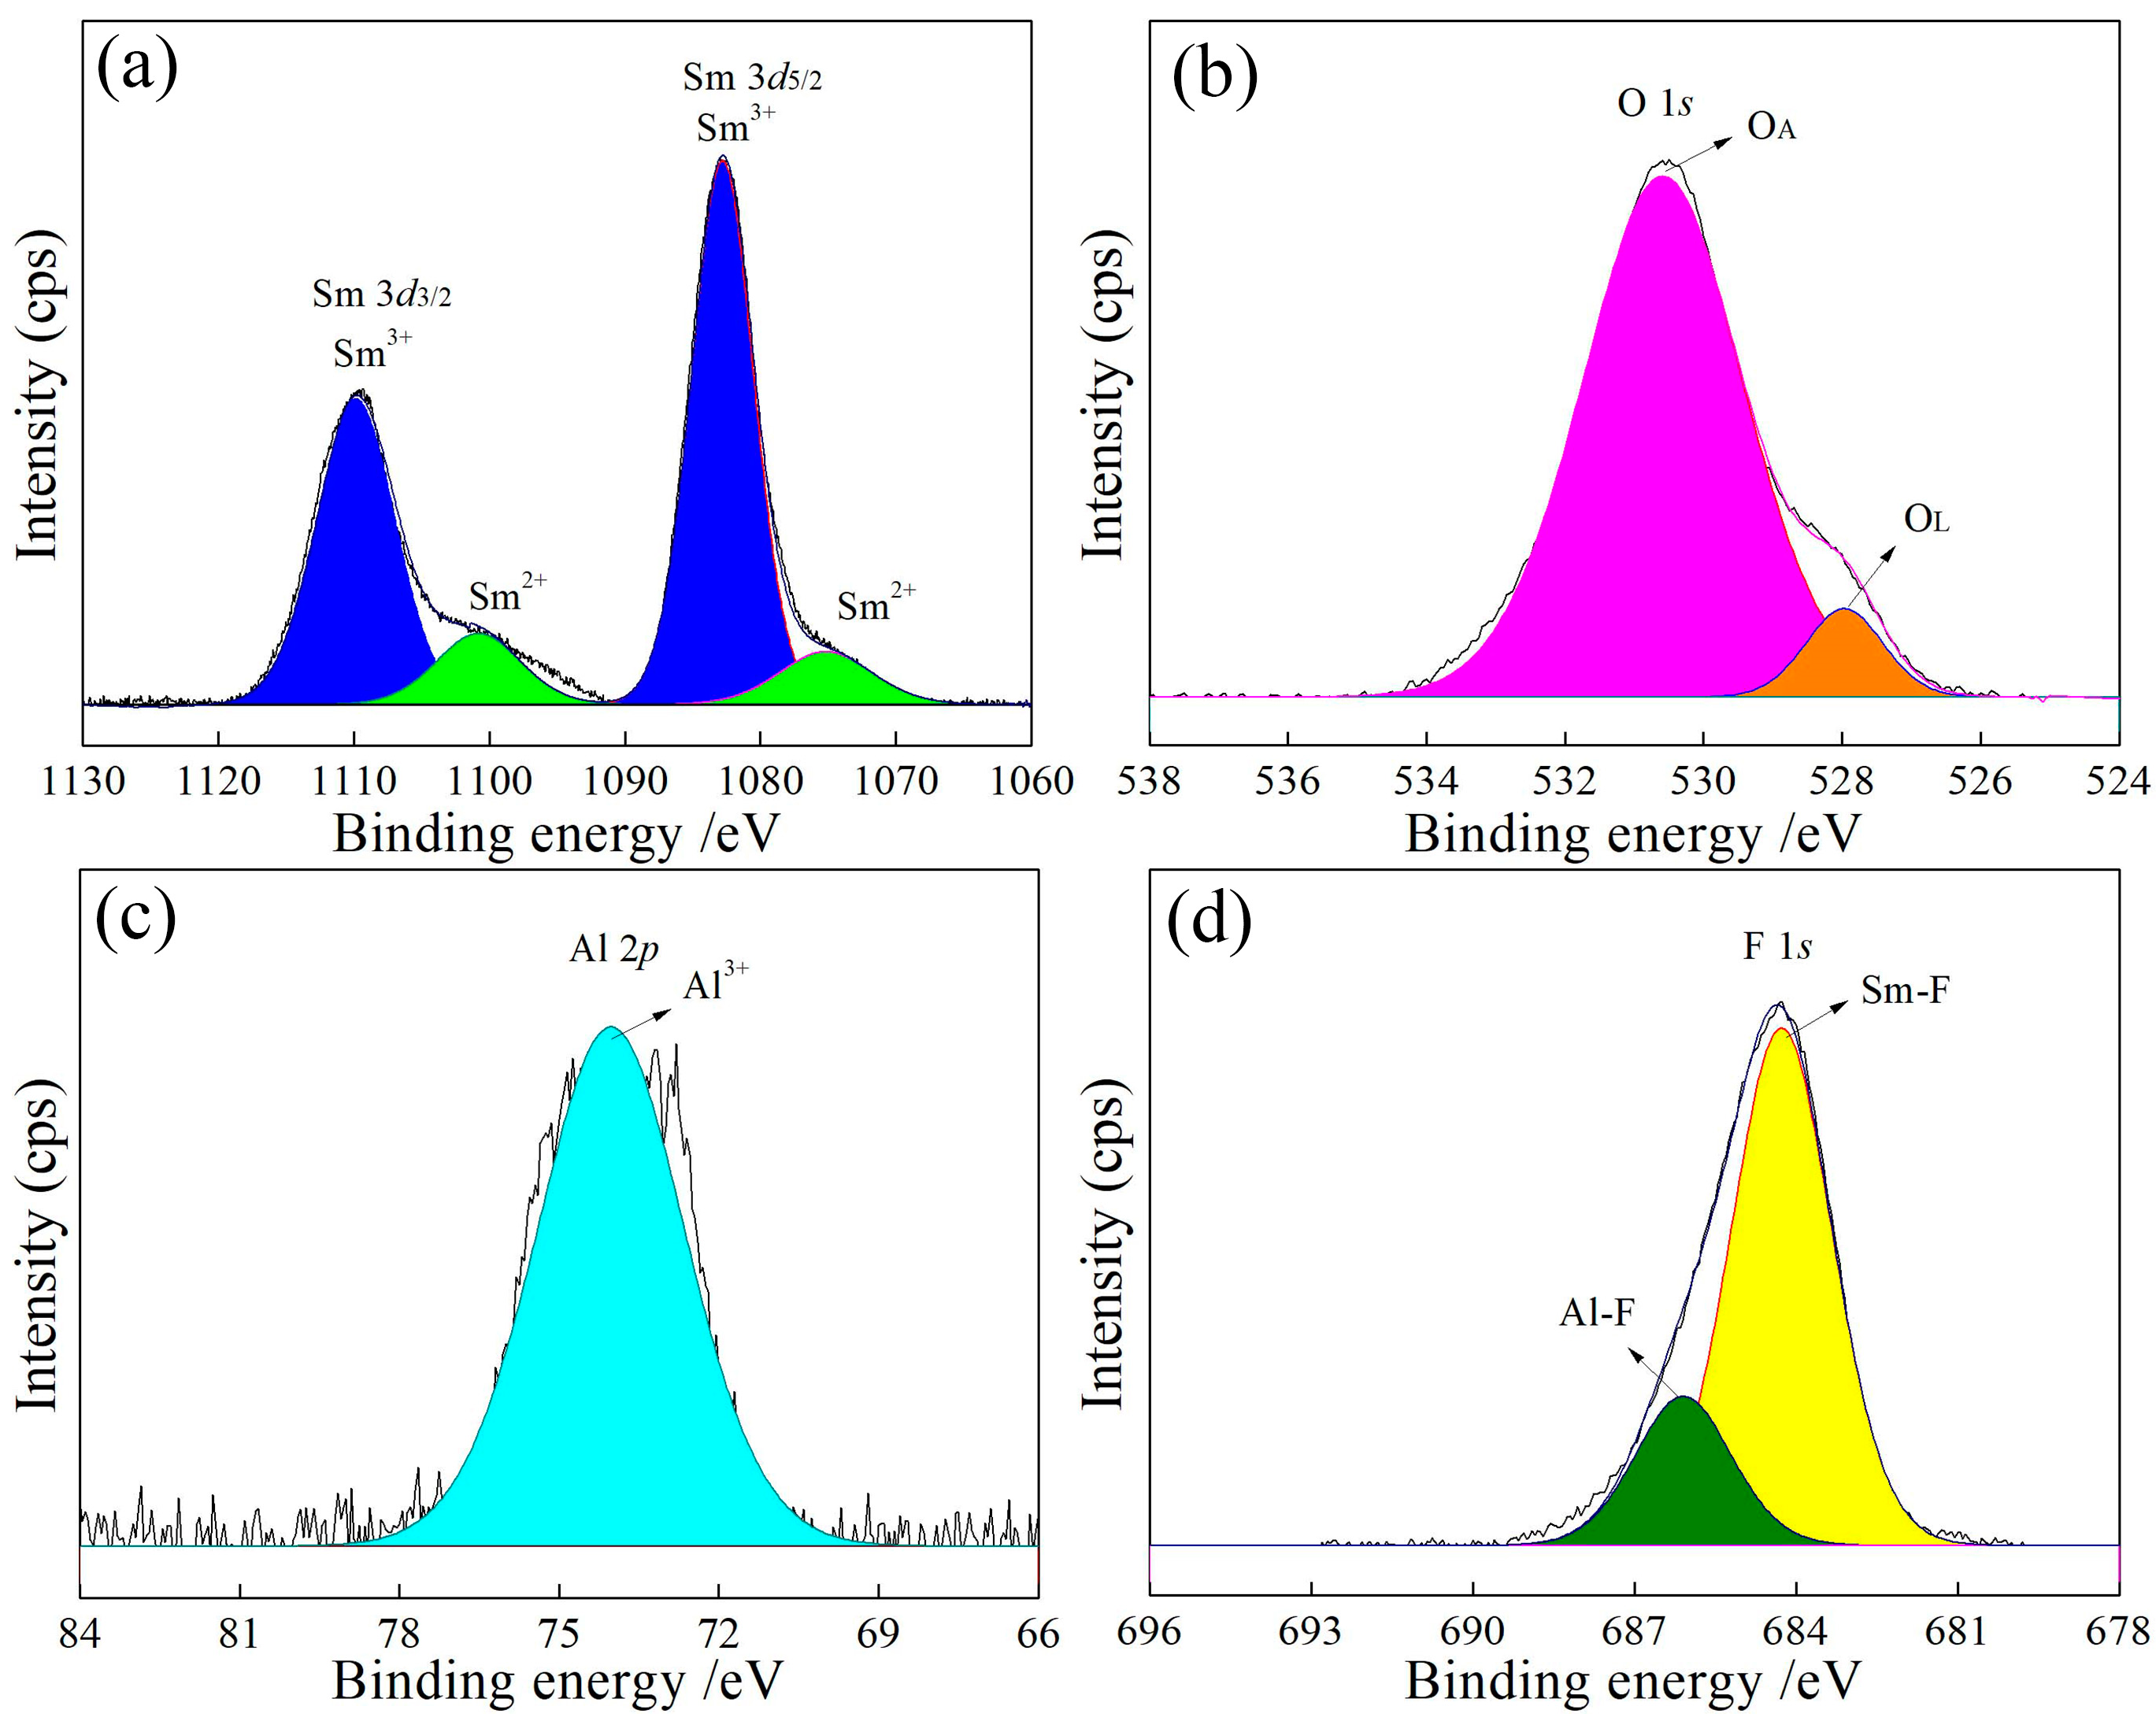
The XPS high-resolution spectra of the Sm, Al, O, and F elements in the reduction products are presented in Figure 5, Figure 6, Figure 7, Figure 8 and Figure 9. In Figure 5a, the Sm 3d emission exhibits two characteristic peaks of Sm 3d3/2 and Sm 3d5/2 due to atomic spin–orbit splitting, with binding energies of 1110.08 eV and 1082.78 eV, respectively, showing a peak distance difference of 27.3 eV that is within the standard range (27.2 eV). After peak splitting, four characteristic peaks are observed. A pair of characteristic peaks at the binding energies of 1082.78 eV and 1073.76 eV match with the states of 3d104f5 and 3d104f6, respectively. The binding energies of 1082.78 eV and 1110.08 eV correspond to Sm3+ [23], while those at 1073.76 eV and 1100 eV are attributed to Sm2+ [24]. Compared to the XPS spectrum of Sm3+ in SmF3, the presence of an additional peak at 1073.76 eV indicates the existence of Sm2+ in the reduction products. This confirms that the valence state of samarium in the products includes both +2 and +3 states. The relative contents of Sm3+ and Sm2+ are 83.53% and 16.47%, respectively, with the predominant form of Sm3+.
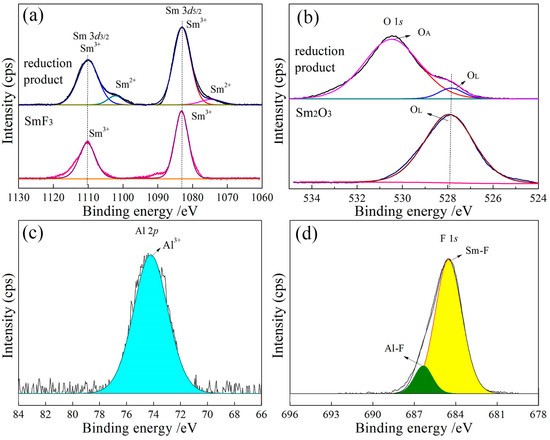
Figure 5.
High-resolution XPS spectra of the product with an Al/SmF3 molar ratio of 1:3. (a) Sm3d; (b) O1s; (c) Al2p; (d) F1s.
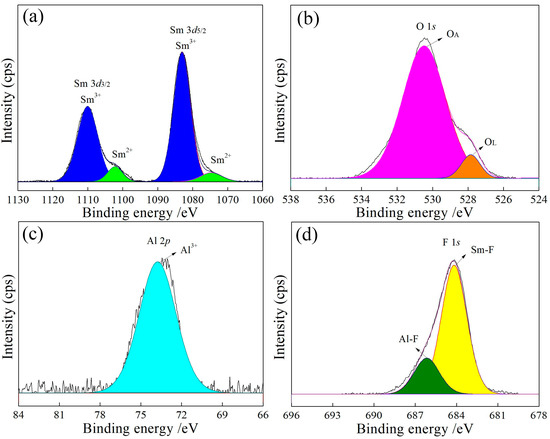
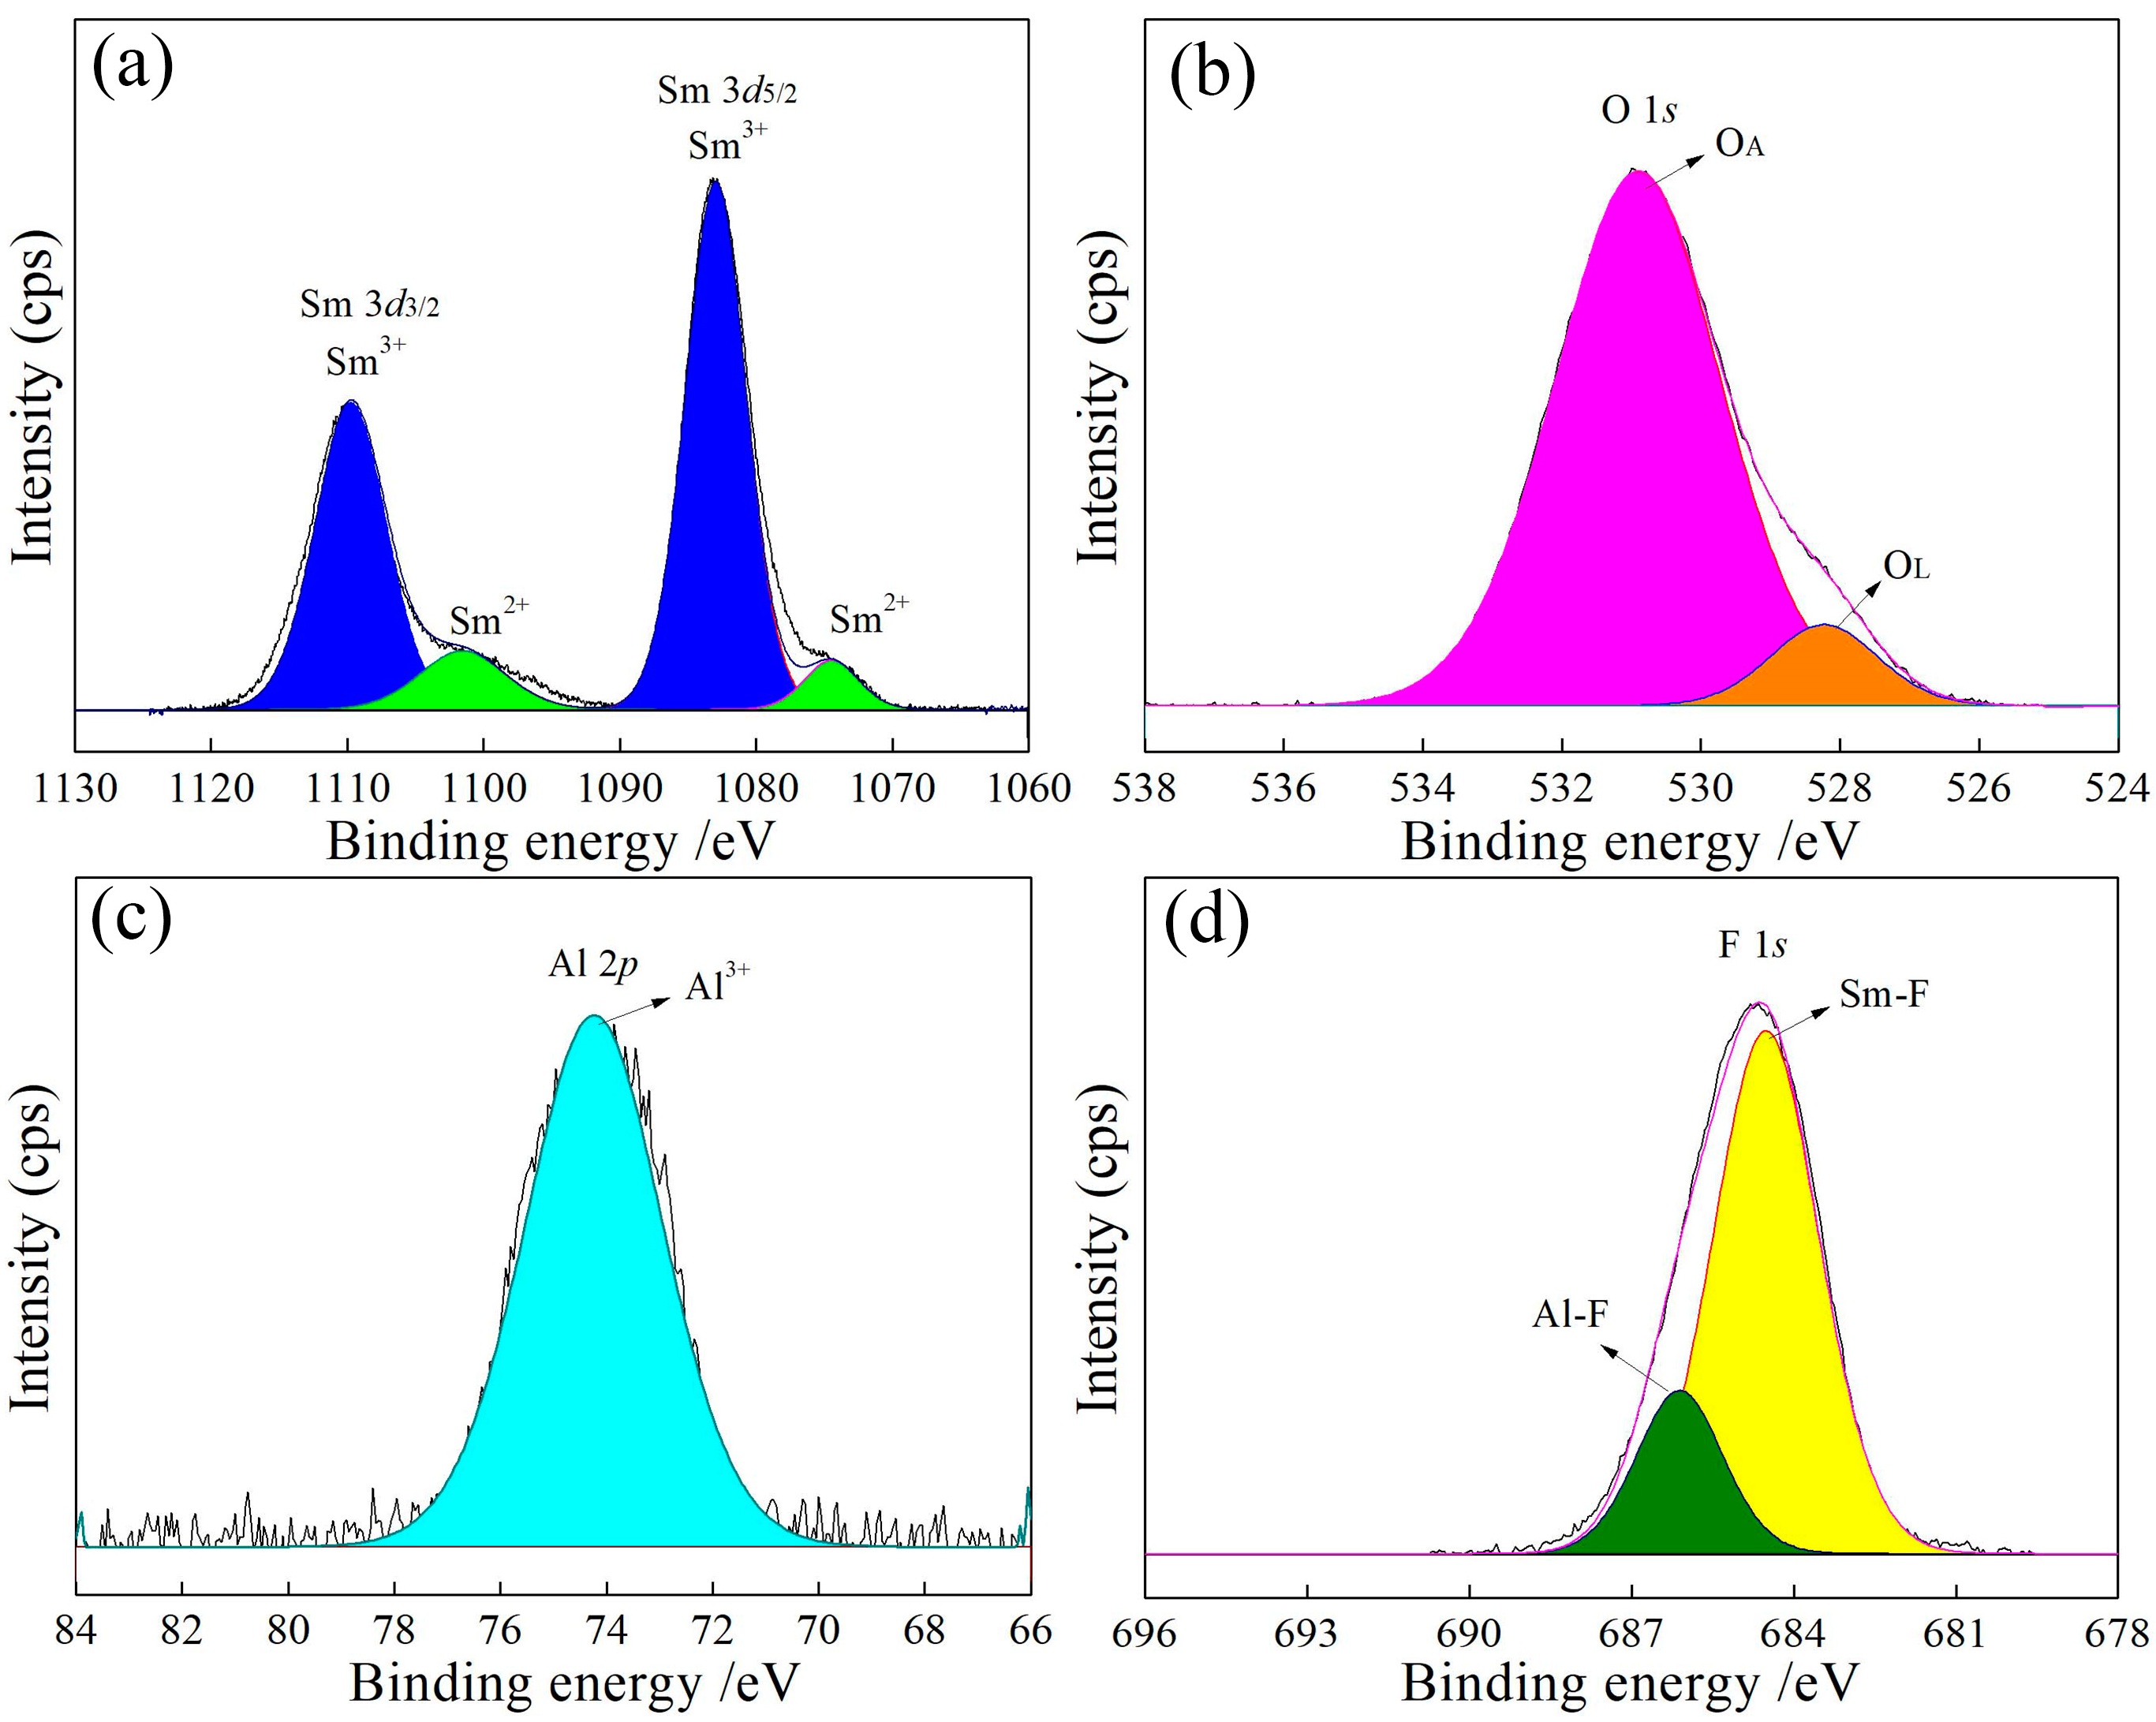
Figure 6.
High-resolution XPS spectra of the product with an Al/SmF3 molar ratio of 2:3. (a) Sm3d; (b) O1s; (c) Al2p; (d) F1s.

Figure 7.
High-resolution XPS spectra of the product with an Al/ SmF3 molar ratio of 3:3. (a) Sm3d; (b) O1s; (c) Al2p; (d) F1s.
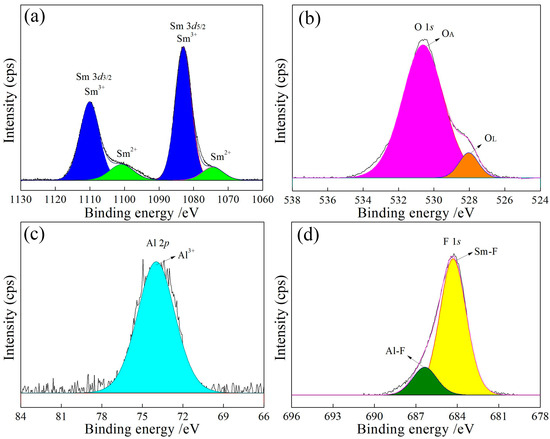
Figure 8.
High-resolution XPS spectra of the product with an Al/ SmF3 molar ratio of 4:3. (a) Sm3d; (b) O1s; (c) Al2p; (d) F1s.

Figure 9.
High-resolution XPS spectra of the product with an Al/SmF3 molar ratio of 5:3. (a) Sm3d; (b) O1s; (c) Al2p; (d) F1s.
In Figure 5b, the high-resolution spectrum of O exhibits significant asymmetry. The subsequent peak fitting of the O 1s spectrum reveals two distinct peaks at the binding energies of 527.92 eV and 530.75 eV, respectively. Extensive studies have been conducted on the forms of oxygen [25,26]. Lattice oxygen (OL) primarily exists as O²⁻ through chemical adsorption, with binding energies typically lower 530 eV. In contrast, adsorbed oxygen (OA) undergoes physical adsorption via surface adsorption reactions, existing mainly in the intermediate states of, and O−, with binding energies generally falling between 530 and 532 eV. Combined with the previous analysis, it can be inferred that the binding energy of 527.92 eV corresponds to OL, while the binding energy of 530.75 eV is attributed to OA. Compared to the XPS spectrum of O in Sm2O3, it only exhibits lattice oxygen. The presence of OA in the reduction products shows surface interactions or partial oxidation during the reduction process. OA in the reduction products originates from oxygen introduced during sample preparation. In the process of grinding, the high surface energy of fine particle samples renders them susceptible to oxygen adsorption from air, resulting in physical adsorption. The relative contents of OA and OL are 95.20% and 4.80%, respectively, as shown in Table 3. Consequently, the oxygen present in the reduction products predominantly exists in the form of OA. Therefore, the significant presence of Sm3+ in the product is attributed to OA that facilitates the oxidation of Sm2+. Faldt’s results confirmed that the presence of oxygen significantly alters the binding energy alignment and peak position of Sm3+, leading to the transformation from Sm2+ to Sm3+ [27].
Table 3.
Relative content of Sm and O in products at different Al/SmF3 ratios.
Figure 5c displays the XPS high-resolution spectrum of Al, which exhibits a well-balanced characteristic peak with a distinct feature at 74.53 eV attributed to Al3+. This indicates that Al exists in the form of Al3+ [28]. In Figure 5d, combined with the characteristic peak of F 1s at 684.49 eV, the two distinctive peaks emerge after peak splitting, and the F 1s spectrum exhibits dual features of Al-F and Sm-F. The Al-F peak is situated at a binding energy of 686.82 eV [29], whereas the Sm-F peak is observed at 684.08 eV [30]. The relative intensities of these peaks are 38.57% and 61.43%, respectively, corresponding to an approximate ratio of 1:1.6.
In Figure 6a, Figure 7a, Figure 8a and Figure 9a, the binding energies of 1083 eV and 1073 eV correspond to Sm3+ [23] and Sm2+ [24], respectively, with a Sm3+ to Sm2+ ratio close to 9:1 (Table 3). The increase in the Al content raises the lattice oxygen content, as shown in Figure 6b, Figure 7b, Figure 8b and Figure 9b and Table 3. The Al 2p peak at approximately 74 eV (Figure 6c, Figure 7c, Figure 8c and Figure 9c) corresponds to Al3+, while the F 1s peaks at approximately 684 eV and 686 eV (Figure 6d, Figure 7d, Figure 8d and Figure 9d) are attributed to Sm-F and Al-F bonds, respectively.
4. Conclusions
The reaction behavior of and valence state changes in samarium ions in reduction products were investigated using Al as a reducing agent at different molar ratios of Al/SmF3. The reduction of SmF3 to SmF2 by Al is thermodynamically feasible at 933~1356 K. However, the reduction to metallic Sm is thermodynamically non-spontaneous. The valence state of Sm in the products remains unchanged despite variations in the Al/SmF3 molar ratios, as confirmed by the nearly constant ratio δ of F to Sm, determined by the functional equation: a(δ) = –0.1794δ + 5.819 (0 ≤ δ ≤ 0.4615). The corresponding products SmF2.413, AlF3, and Sm(AlF)5 are consistently obtained across Al/SmF3 molar ratios of 1:3, 2:3, 3:3, 4:3, and 5:3. Sm(AlF)5 is primarily formed from the reaction of AlF3 with divalent samarium. The XPS analysis shows that samarium in the reduction products predominantly exists in the +3 oxidation state, with a minor presence of the +2 state, in a ratio of approximately 9:1. The high concentration of Sm3+ is attributed to the oxidation of abundant adsorbed oxygen in the products. The findings contribute to the understanding of variable valence rare earth elements, and the valence evolution of samarium may play a key role in optimizing alloy preparation processes and achieving desired material properties.
Author Contributions
Writing—original draft preparation, methodology, D.L.; investigation, Y.Y.; writing—original draft preparation, G.L.; validation, data curation, K.S.; resources, writing—review and editing, K.Z.; conceptualization, supervision, X.Z. All authors have read and agreed to the published version of the manuscript.
Funding
This work was financially supported by Gannan University of Science and Technology College students’ innovation and entrepreneurship training funding project (S202413434030), the “Jiujiang Bank Cup” Ganzhou Youth Science and Technology Innovation Empowerment Unveiling and Leading Project (0520107), GanPo Yingcai Support Program. Youth Innovative leading Talent Support Project (No. gpyc20240040), and Ganpo Juncai Support Program·Youth Science and Technology Talent Support Project (2025QT15).
Data Availability Statement
The original contributions presented in this study are included in the article. Further inquiries can be directed to the corresponding author.
Conflicts of Interest
The authors declare that they have no known competing financial interests or personal relationships that could appear to influence the work reported in this paper.
References
- Todd, N.P.; Sarah, E.M.; Hannah, B.W.; Thomas, E.A. Isolation of Inner-Sphere Aquo Complexes of Samarium(II). J. Am. Chem. Soc. 2025, 147, 2323–2334. [Google Scholar] [CrossRef]
- Georgia, M.; Richardson, T.R.; Finlay, M.B.; Scott, A.C.; Brooke, D.N.; Joanne, E.H.; Robert, A.K.; Tane, B.; Simon, G.; Liu, L.J.; et al. Four-electron reduction of benzene by a samarium(ii)-alkyl without the addition of external reducing agents. Nat. Chem. 2025, 17, 20–28. [Google Scholar] [CrossRef]
- Galimov, D.I.; Yakupova, S.M.; Bulgakov, B.G. Synthesis and luminescent properties of new molecular compounds of divalent lanthanides LnCl2·0.5H2O (Ln = Yb, Sm, Tm, and Eu). J. Photochem. Photobiol. A Chem. 2023, 438, 114559. [Google Scholar] [CrossRef]
- Pan, J.J.; Hua, Y.J.; Fan, Z.H.; Ma, H.P. A novel Sm2+ doped broadband far-red BaAl2Si3O4N4: Sm2+ phosphor for plant lighting applications. Opt. Mater. 2023, 146, 114513. [Google Scholar] [CrossRef]
- Subramani, T.; Nagarajan, S.K. Synergic effect of rare earth doped Sm doped WO3 nanoparticles for enhanced MB dye photocatalytic activities of waste water treatment and antibacterial activities against Staphylococcus aureus. Ceram. Int. 2024, 50, 34226–34239. [Google Scholar] [CrossRef]
- Zuo, Y.; Li, X.J.; Jiang, F.; She, C.F.; Huang, W.; Gong, Y. Electrochemical behavior of Sm(III)/Sm(II) and extraction of Sm on reactive electrode from molten LiF-BeF2. Sep. Purif. Technol. 2023, 315, 123737. [Google Scholar] [CrossRef]
- Karimov, D.N.; Sorokin, N.I. Mixed-valence Sm-doped LaF3 crystals as ion-electron conductors: Crystal growth and impedance characterization. Solid State Ionics 2024, 417, 116710. [Google Scholar] [CrossRef]
- Long, X.F.; Guo, G.H.; Li, X.H.; Xia, Q.L.; Zhang, J.F. Electrodeposition of Sm-Co film with high Sm content from aqueous solution. Thin Solid Films 2013, 548, 259–262. [Google Scholar] [CrossRef]
- Andrew, C.; Murugesan, C.; Jayakumar, M. Electrochemical behavior of Sm(III) and electrodeposition of samarium from 1-Butyl-1-Methylpyrrolidinium dicyanamide ionic liquid. J. Electrochem. Soc. 2022, 169, 022503. [Google Scholar] [CrossRef]
- Kuznetsov, S.A.; Stulov, Y.V.; Gaune-Escard, M. Kinetic and thermodynamic properties of samarium chlorides dissolved in alkali chloride melts obtained by electrochemical transient techniques. J. Electrochem. Soc. 2021, 168, 036512. [Google Scholar] [CrossRef]
- Yang, W.; Choi, S.; Park, T.H.; Choi, S.; Bae, S.E. Rotating Disk Electrode Study of Sm(III)/Sm(II) in LiCl-KCl Eutectic Molten Salt. J. Electrochem. Soc. 2024, 171, 096508. [Google Scholar] [CrossRef]
- Zhao, J.; Liu, Z.T.; Liang, W.S.; Lu, G.M. Evaluation of the local structure and electrochemical behavior in the LiCl-KCl-SmCl3 melt. J. Mol. Liq. 2022, 363, 119818. [Google Scholar] [CrossRef]
- Li, Y.C.; Liu, Q.; Li, T.H.; Bi, H.; Shen, Z.R. Recent achievements in rare earth modified metal oxides for environmental and energy applications: A review. Chin. Chem. Lett. 2024, 110698. [Google Scholar] [CrossRef]
- Asprey, L.B.; Ellinger, F.H.; Staritzky, E. Compounds of Divalent-Lanthanides. Preparation, Optical Properties, and Crystal Structure; Los Alamos National Lab. (LANL): Los Alamos, NM, USA, 1963; Volume 17, p. 4748830. [Google Scholar] [CrossRef]
- Stezowski, J.J.; Eick, H.A. Nonstoichiometry in the samarium(II) fluoride-samarium(III) fluoride system. Inorg. Chem. 1970, 9, 1102–1105. [Google Scholar] [CrossRef]
- Greis, O. Über neue verbindungen im system SmF2-SmF3. J. Solid State Chem. 1978, 2, 4227–4232. [Google Scholar] [CrossRef]
- Rogachev, S.O.; Naumova, E.A.; Vasileva, E.S.; Sundeev, R. Al-Ca, Al-Ce, and Al-La eutectic aluminum alloys processed by high-pressure torsion. Adv. Eng. Mater. 2022, 24, 2100772. [Google Scholar] [CrossRef]
- Liang, Y.J.; Che, Y.C. Thermodynamic Data Handbook of Inorganic Substances; Northeast University Press: Shenyang, China, 1993. [Google Scholar]
- EKöhler, J. SmAlF5-ein neues SmII-fluoroaluminat mit Al2F10-Oktaederdoppeln und [AlF2/2F4/1]-Ketten. Z. Für Anorg. Allg. Chem. 1993, 619, 181–188. [Google Scholar] [CrossRef]
- Greis, O.; Knappe, P.; Müller, H. Phase relationships in the systems SmH2 SmH3 and SmD2 SmD3. J. Solid State Chem. 1981, 39, 49–55. [Google Scholar] [CrossRef]
- Ivanenko, A.P.; Kompanichenko, N.M.; Omelchuk, A.A.; Zinchenko, V.F.; Timukhina, E.V. Synthesis and optical properties of non-stoichiometric lanthanide (Sm, Eu, Tm, Yb) fluorides. Russ. J. Inorg. Chem. 2010, 55, 841–847. [Google Scholar] [CrossRef]
- Cao, Z.C.; Shi, C.S. Valency and its change process of samarium ion in samarium fluoride system. Sci. China Ser. A 1993, 36, 385–392. Available online: http://www.nstl.gov.cn/paper_detail.html?id=8c9b43734d87be7991b327550aa94583 (accessed on 5 January 2025).
- Si, Y.Q.; Mamatrishat, M.; Yiliyasi, B.; Fuerkaiti, X. Effects of doping of Sm, Y, Ce and La on crystal structure, phase and photocatalytic performance of TiO2 powders prepared by sol-gel method. Phys. Lett. A 2024, 525, 129929. [Google Scholar] [CrossRef]
- Zhou, M.H.; Lv, H.; Chen, S.L.; Wang, X.J.; Wang, Q.S.; Liu, C.L. Plasma-assisted synthesis and photoluminescence properties of amorphous SiO2 nanowires doped with optically active ions. Ceram. Int. 2024, 51, 7557–7565. [Google Scholar] [CrossRef]
- Li, Y.K.; Zhang, Y.S.; Hou, R.H.; Ai, Y.Y.; Cai, M.; Shi, Z.H.; Zhang, P.; Shao, G.S. Revealing electron numbers-binding energy relationships in heterojunctions via in-situ irradiated XPS. Appl. Catal. B Environ. Energy 2024, 356, 124223. [Google Scholar] [CrossRef]
- Chen, Y.M.; Zhao, S.Z.; Gao, F.Y.; Yu, C.J.; Zhou, Y.S.; Tang, X.L.; Yi, H.H. The Promoting Effect of Metal Vacancy on CoAl Hydrotalcite-Derived Oxides for the Catalytic Oxidation of Formaldehyde. Processes 2023, 11, 2154. [Google Scholar] [CrossRef]
- Vavouraki, A.I. Utilization of Industrial Waste Slags to Enhance Ground Waste Concrete-Based Inorganic Polymers. J. Sustain. Metall. 2020, 6, 383–399. [Google Scholar] [CrossRef]
- Faldt, Å.; Myers, H.P. The valence and structure of overlayers of Sm on Al(001) and Cu(001)-ScienceDirect. J. Magn. Magn. Mater. 1985, 47, 225–227. [Google Scholar] [CrossRef]
- Mustapha, U.; Abdulkadir, T.; Saheed, A.G.; Hatem, D.; Ivan, K.; Khalid, A. Role of 3D Alumina Foam Support on the Formation and Dispersion of Active NiMoS Phase for Hydrodesulfurization Application. Energy Fuels 2020, 34, 9948. [Google Scholar] [CrossRef]
- Binita, G.; Saswata, H.; Santiranjan, S.; Sinha, T.P. X-ray photoelectron spectroscopic study and electronic structure of double-perovskites A2SmTaO6 (A = Ba, Sr, Ca). Solid State Sci. 2017, 67, 114–118. [Google Scholar] [CrossRef]


Disclaimer/Publisher’s Note: The statements, opinions and data contained in all publications are solely those of the individual author(s) and contributor(s) and not of MDPI and/or the editor(s). MDPI and/or the editor(s) disclaim responsibility for any injury to people or property resulting from any ideas, methods, instructions or products referred to in the content. |
© 2025 by the authors. Licensee MDPI, Basel, Switzerland. This article is an open access article distributed under the terms and conditions of the Creative Commons Attribution (CC BY) license (https://creativecommons.org/licenses/by/4.0/).