Abstract
The usefulness of the well-built electrical power system is efficient supply generation of electrical power for consumers. For a reliability assessment of power systems, the system’s actual components in terms of performance and random behavior should be evaluated. This paper presents a reliability analysis based on the Fault Tracing Paths (FTP) method to identify component outages in composite power systems. This study focuses on composite power systems because these systems are linked to generating and distribution systems, in addition to having the primary equipment in these systems being used to move the electrical power. The FTP approach will identify the primary equipment that caused the composite power systems failure. This method gives out the events matrix for numerous flow Fault Tracing paths from the power sources to the loads. The proposed events matrix is applied as input data to simulate the system behavior. A power flow study is conducted using the RTS test system to evaluate the reliability of generators, transformers, and transmission lines during an outage. The study employs a simplified one-line diagram method to determine system stability and failure impacts. Finally, the proposed FTP method can be applied to complicated composite power systems.
1. Introduction
Electric power systems are complex because of the complex interconnection and integration of diverse components such as generators, transformers, transmission lines, and loads [1]. The electrical power systems are divided into three levels according to their functional; namely, generating, composite, and distributed systems, and those levels include many uneven and diverse components [2,3]. Many studies have dealt with the reliability analysis of power systems at the three levels using several various techniques. Many of these studies have focused on the reliability analysis of electrical power plants and distribution systems according to the frequency and the causes of failures [4,5]. Numerous approaches proposed in the literature measure the performance of the electrical power supply reliability by using either the deterministic, simulation, or probabilistic methods. The most generality popular method utilized for power system reliability estimation is the probabilistic method, which includes the block diagram [6,7], the fault tree diagram [8,9], the Markov approach [10,11], and Monte Carlo simulation [12,13].
Several recent studies have addressed the importance of the reliability of power transmission equipment in electrical power systems, using effective techniques that are capable of detecting weak points in the system equipment. The proposed techniques evaluate the system’s contingency states, demonstrate the system’s weak points, and conduct an analysis to show the link between the reliability of each component and the overall system reliability. Accordingly, these techniques can be employed by power system designers to identify areas that need to be maintained and sustained to increase the reliability of system equipment and the system as a whole [14,15,16].
This research focuses on the analysis of the equipment’s reliability in the composite systems for the reason of the power feeding availability at load buses [17,18,19]. In this content, a system failure is an event that results in the inability to meet the requirements of load [20]. This paper conducts a reliability analysis based on the Fault Tracing Paths (FTP) to identify information on component outages in the composite power system. The fault tree analysis is widely used in the system components safety and reliability analysis. Consequently, the following points show the advantages of using the technique FTP:
- The fault tracing paths method provides a straightforward approach to constructing fault trees, as it considers all possible failure causes.
- This method can identify manually the top event and the minimal cut set for simple power systems without the need for complex programs. When the systems become more complicated, it will need a computer program (or simulation).
- The fault tracing paths method gives out the events matrix, which can be applied as input data to other probabilistic or simulation methods.
This method gives out the events matrix for numerous flows Fault Tracing paths from the power sources to the loads. “A fault tree is a graphical technique through which the combinations of events leading to a defined system failure are described”. The fault tree is used to deduce the top event, which can mostly be constructed by an OR gate, and AND gate; the description of basic concepts of these logic gates has been reported [21,22]. The RTS test system is used to validate the effectiveness and applicability of the fault tracing paths method. It is not a large composite system, but it has adequate detail and the complexity to reflect the actual complexity involved in an actual system. The RBTS is an essential reliability test system for educational and research purposes, and all required reliability parameters for applying the proposed method are available in this test system. “The RTS test system used in this study follows the standard configuration described in [23], including five load points (20, 85, 40, 20, 20 MW), two generators with 11 units ranging from 5 to 40 MW, six buses, nine transmission lines, and two transformers”. The total system load is 185 MW, with a generation capacity of 240 MW, as depicted in Figure 1. The benefit of this study is determining the component (top event) that cut off and led to the outage of power supply from the load and the reliability evaluation of this component, as illustrated through the analysis of the RTS system. The RTS permits the evaluation of the reliability of every bus bar considering all realistic failure modes.
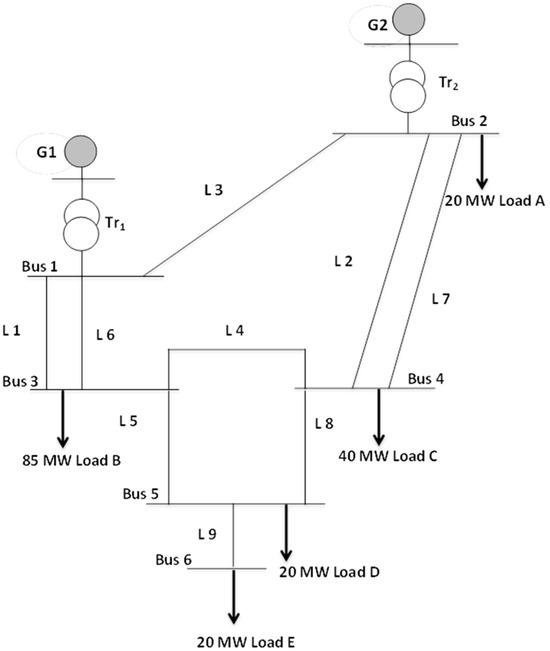
Figure 1.
The test system RBTS Diagram.
2. Methodology of the Fault Tracing Paths Technique
The reliability of composite systems can be assessed based on the sustainability of the components of the systems and the ability of the systems to supply electric power to the load. The fault tracing method is dedicated to finding the probability of component failure in power systems through the fault tree analysis. In the fault tracing method, every fault path from the starting point to the ending point is considered. While in the reliability block diagrams method, which employed the fault tree analysis method for finding the probability of component failure, only the path of success are displayed.
The procedure can be summarized by the following flow chart showing the important stages in this method is to identify the event matrix, top event, and MCSs for the system as shown in Figure 2. The procedure for carrying out a reliability assessment of power equipment in an RTS test system using the fault tree analysis technique is shown in Figure 2.
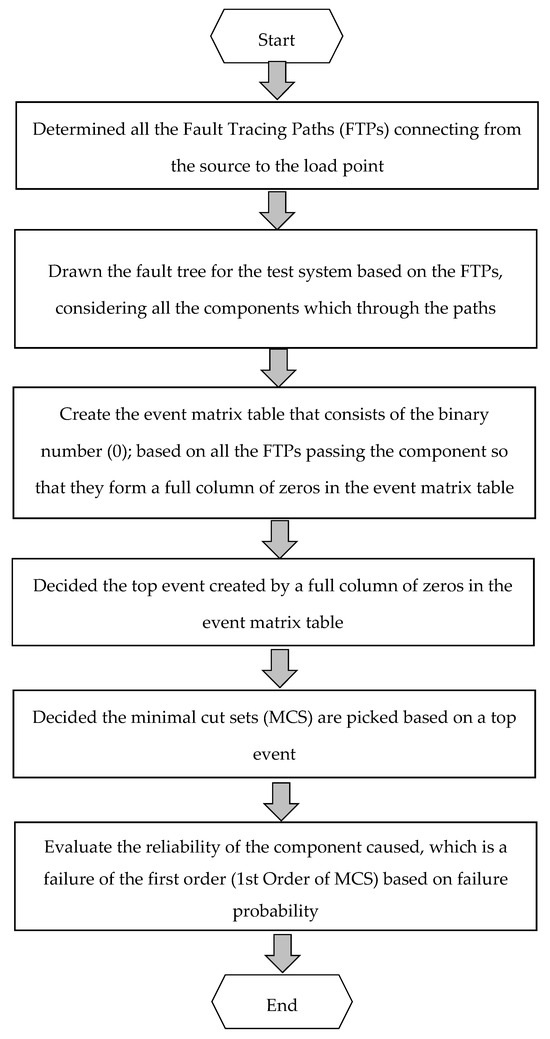
Figure 2.
The procedure showing the important stages in this method is to identify the event matrix, top event, and MCSs for the system.
In this paper, the FTP path methodology is employed to deduce undesirable events; it is an approach for fail analysis, starting from the top point that represents the generating units to the end point represents the load. Here, the performance of the RTS test system under outage conditions of generators, transmission lines, transformers, buses, or all, is examined. “The fault tracing path algorithm is employed to deduce failure paths from the fault tree. In the fault tracing path method, every path from the starting point to the ending point is considered” [24]. This section provides an illustration of the key steps involved in the proposed technique:
- Step 1—Determined all the FTPs connecting from the source to the load. Here, all the FTPs for each load point in the RTS test system are determined separately.
- Step 2—Subsequently, the fault tree is drawn for the RTS test system based on the FTP method, considering all the components that the paths pass through. A fault tree diagram gives a graphical representation of a system’s components [25]. Each element in the fault tree has two states: failure (Fail) or not being equipped (No supply) with power.
- Step 3—Repeat the first and second steps for the rest of the loads at points (B, C, D, and E), and determine each of the FTPs the components that these paths pass through, and the state of the components.
- Step 4—Create the event matrix that consists of the binary numbers (0) & (1). “The event matrix is constructed using binary logic, where ‘0’ represents a failed component and ‘1’ an operational one. If a full column of zeros appears in the matrix, the corresponding component is identified as the ‘top event’, meaning its failure results in a complete power outage to the load.”
- Step 5—Repeat step 3 for all load points in the RTS test system.
- Step 6—Identify the minimal cut sets (MCS) from the power sources to the load points that are connected.
- Step 7—The minimal cut sets (MCS) are deducted by an events matrix through the failure paths [24]. Then, the order of the minimal cut sets is determined by merging the binary number (0) of one column on the events matrix [26,27].
- Step 8—“An order of failure on the whole of the system, caused by a failure in only one component, is a failure of the first order (1st Order of MCS). If it takes two components to fail at the same time, to cause a complete system failure, it is a failure of the second order (2nd Order of MCS); a failure of the third order (3rd Order of MCS) requires three components to fail, and so on” [28].
- Step 9—Evaluate the reliability of the component caused, which is a failure of the first order (1st Order of MCS) based on failure probability [29].
In this paper, the reliability assessment of the system equipment utilizes the reliability index expressions to determine the probability of occurrence of the top events. The reliability indices presented below are derived using the Fussell Algorithm method. These indices quantify the probability of system failure based on component reliability parameters, as described in [8,18,22].
- where:
- R(t) = Reliability of component
- P(F) = Failure probability
- λ = Failure Rate
- µ = Repair Rate
- k = Number of minimal cut set
- MCSi = Combination of a specific top event
- n = Number of component in MCS
3. Results and Discussion
In this paper, the reliability indices are evaluated for individual buses of the RTS test system. The FT path approach is used for the evaluation of reliability indices, which measure the probability of fail supplying power to the load connected to a certain bus and also for measuring the probability of fail supplying all connected loads existing in the system. The RTS test system shown in Figure 1 is used to demonstrate the easy application of the FTP technique. It is not a large test system, but it has sufficient components to reflect the real complexity that can applied to a practical composite system. In the results section, each load in the test system will be studied separately and the number of fault paths, the number of MCSs, and their order will be determined, as follows:
For load at point A, all fault tracing paths between the sources and the load point are determined by FTPs as reported in Table 1. Subsequently, the fault tree is drawn for the load at point A considering all the components that the fault paths pass through; the fault tree is demonstrated in Figure 3. The fault tree diagram in Figure 3 gives a graphical representation of a system’s components. Each element in the fault tree has two states: failure (Fail) or not being equipped (No supply) with power.

Table 1.
No. of the FTP of load A on bus 2.
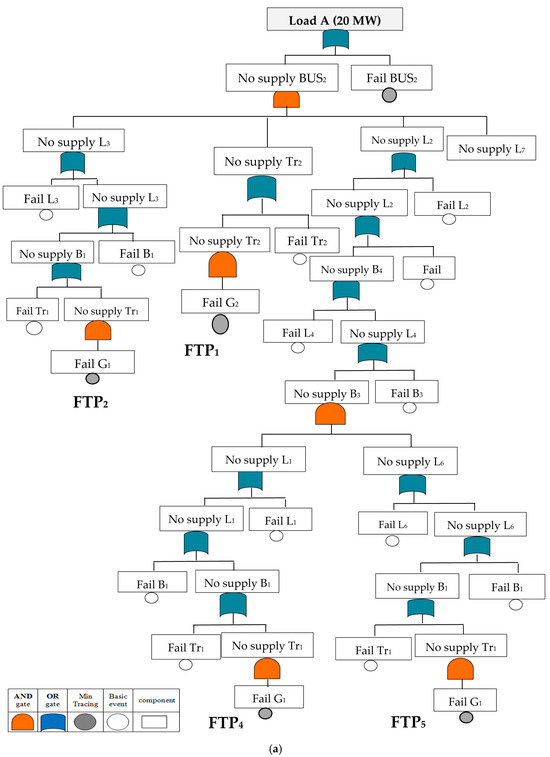
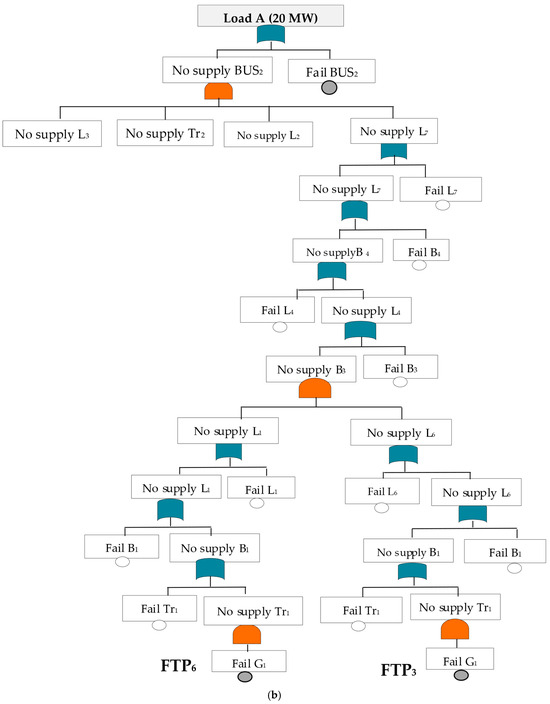
Figure 3.
Shows the fault tracing paths based on fault tree structure for load at point A. (a) Represents fault tracing paths FTP1, FTP2, FTP4, and FTP5 between the sources and the load point: (b) Represents fault tracing paths FTP3 and FTP6 between the sources and the load point.
Then, construct the event matrix that represents the binary number (0) for all paths. If all the fault paths pass through the component so that they form a full column of zeros in the event matrix, this component represents the top event. Here, the failure of the top event leads to a power outage to the load, and MCSs from all possible failure paths must be deduced by combining the system components. The minimal cut sets (MCS) are deducted by an events matrix through the failure paths. Then, the order of the minimal cut sets is determined by merging the binary number (0) of one column on the events matrix. The results represent failure paths, event matrix, and MCSs as reported in Table 1 and Table 2.
Table 2.
No of the MCS of load A on bus 2.
For loads at points B and C, we repeat all previous steps applied at load point A and describe all FTPs between the sources and the load point with a fault tree, as shown in Figure 4 and Figure 5. Then, construct the event matrix and deduce MCSs from all possible failure paths by combining the system components. The results in Table 3, Table 4, Table 5 and Table 6 represent the failure paths, the event matrix, and the MCS for loads B, and C, respectively.
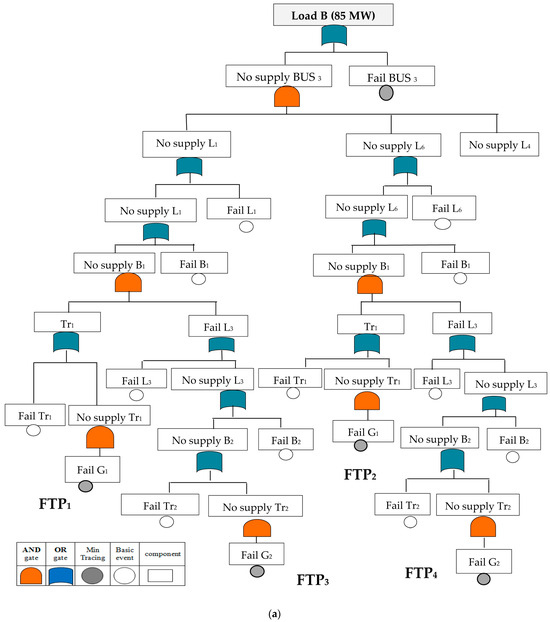
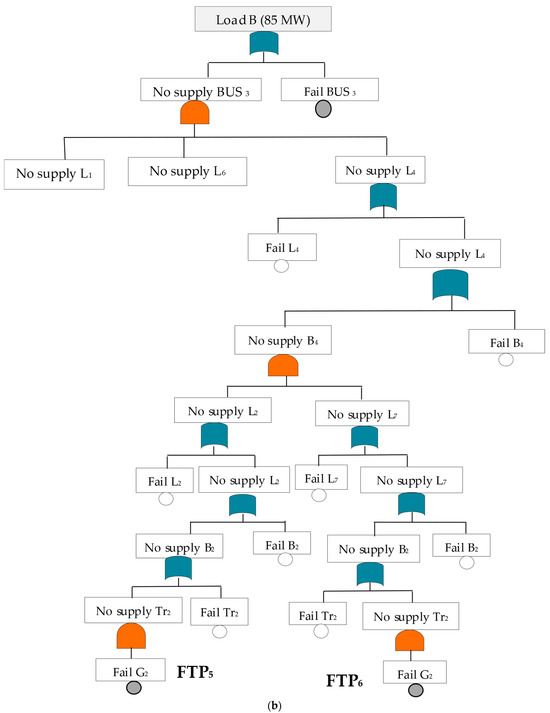
Figure 4.
Shows the fault tracing paths based on fault tree structure for load at point B. (a) Represents fault tracing paths FTP1, FTP2, FTP3, and FTP4 between the sources and the load point: (b) Represents fault tracing paths FTP5 and FTP6 between the sources and the load point.
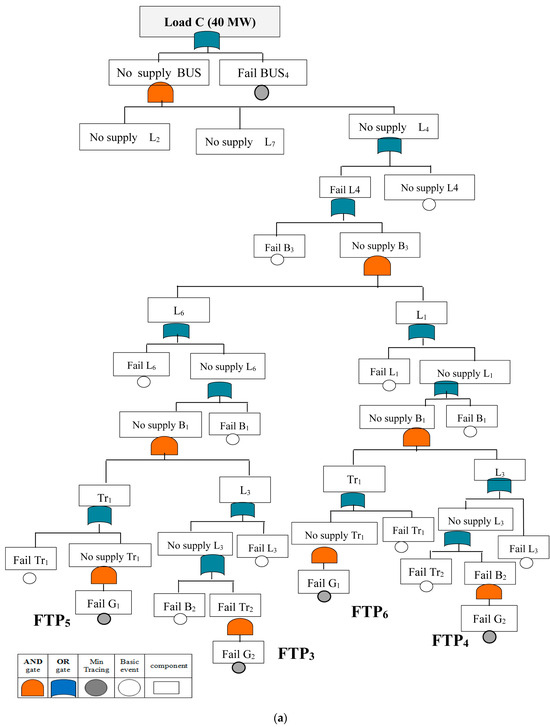
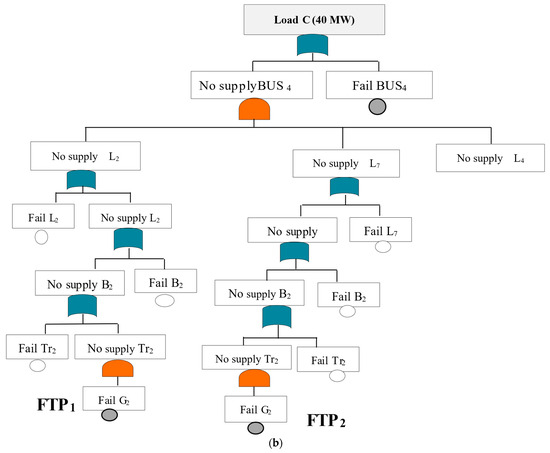
Figure 5.
Shows the fault tracing paths based on fault tree structure for load at point C. (a) Represents fault tracing paths FTP3 and FTP4, FTP5, and FTP6 between the sources and the load point: (b) Represents fault tracing paths FTP1 and FTP2 between the sources and the load point.
Table 3.
No. of the FTP of load B on bus 3.
Table 4.
No. of the MCS of load B on bus 3.
Table 5.
No. of the FTP of load C on bus 4.
Table 6.
No. of the MCS of load C on bus 4.
For the load at points D and E, we repeat the drawing of the fault trees as displayed in the previous cases based on all fault tracing paths between the sources and the load points as shown in Table 7, Table 8 and Table 9, and then deduce MCSs from all possible failure paths by combining the system components. The results reported in Table 7, Table 8, Table 9 and Table 10 represent the event matrix and MCSs, for loads D and E.
Table 7.
No. of the FTP of load D on bus 5.
Table 8.
No. of the MCS of load D on bus 5.
Table 9.
No. of the FTP of load E on bus 6.
Table 10.
No. of the MCS of load E on bus 6.
The fault trees for loads at points A, B, C, and D have one event [B2], [B3], [B4], and [B5], which when they occur leads to the top event. Therefore, the failure probability for minimal cut sets [B2], [B3], [B4], and [B5] were evaluated. Meanwhile, the fault tree for the load at point E has three events, event [B6], [B5], and event [L9], which when they occur leads to the top event. Therefore, the failure probability for minimal cut sets [B6], [B5], and [L9] were evaluated. This work also presented the reliability evaluation in every load point of the RTS test system based on failure probability. By applying Equation (2), they evaluate the reliability of the component caused, which is a failure of the first order (1st Order of MCS) based on failure probability. Table 11 compares the first-order minimal cut set failure probabilities calculated using the proposed method and those obtained from [17]. The results indicate accuracy and reduced computational complexity, suggesting that the proposed approach provides effectiveness in applicability for large power systems.
Table 11.
Present the 1st order cut set and the failure probability evaluation.
4. Conclusions
This paper conducts a reliability analysis based on the Fault Tracing Paths (FTP) to identify information on component outages in the composite power system. This method reduces the complexity of the composite power system analysis, which is difficult to analyze due to its size, by the fault tree method. In addition, the method can identify manually the top event and minimal cut set easily for simple power systems without the need for complex programs. For more complex systems, the application of a computer program or simulation becomes necessary.
The reliability analysis of the composite system was conducted based on the Fault Tracing paths (FTP) method, which presents the flow of the FTP through the fault tree logic gates. From the FTP method, the minimal cut sets were deduced (1st, 2nd, 3rd, and 4th). In addition, this method demonstrates that the failure of the basic components will affect the whole system. For load point A, the 1st order minimal cut set is bus B2, for load point B the 1st order minimal cut set is bus B3, for load point C the 1st order minimal cut set is bus B4, for load point D the 1st order minimal cut set is bus B5, and for load point E the 1st order minimal cut set is bus B6, line L9, and bus B5. The analysis also provided information on the number of components that caused power outages to the load. Future studies may consider using the proposed method (FTP) to evaluate the reliability of real-world power distribution network systems. The practical benefit of applying this technique to real interconnected power systems (systems that are fed from more than one source) is to help power system planners identify the most reliable paths and the paths that need to be increased in reliability to transfer and deliver power from the generation sources to the load.
Funding
This research received no external funding.
Data Availability Statement
The original contributions presented in this study are included in the article. Further inquiries can be directed to the corresponding author(s).
Conflicts of Interest
The authors declare no conflicts of interest.
Abbreviations
The following abbreviations are used in this manuscript:
| FTP | Fault Tracing Paths |
| RTS | Reliability test system |
| MCS | Minimal Cut Set |
| FT | Fault Tracing |
References
- Cheng, L.; Liu, M.; Ye, C.; Li, Q.; Zhao, Q. An extended minimal cut set algorithm applied into overall power system reliability assessment. In Proceedings of the 2014 International Conference on Power System Technology, Chengdu, China, 20–22 October 2014; pp. 368–373. [Google Scholar] [CrossRef]
- Kadhem, A.A.; Wahab, N.I.A.; Aris, I.; Jasni, J.; Abdalla, A.N. Computational techniques for assessing the reliability and sustainability of electrical power systems: A review. Renew. Sustain. Energy Rev. 2017, 80, 1175–1186. [Google Scholar] [CrossRef]
- Kolev, V.; Georgiev, A.; Sulakov, S. Probabilistic modelling and evaluation of system adequacy. In Proceedings of the 10th Electrical Engineering Faculty Conference (BulEF), Sozopol, Bulgaria, 11–14 September 2018; pp. 1–4. [Google Scholar] [CrossRef]
- Boussahoua, B.; Elmaouhab, A. Reliability Analysis of Electrical Power System Using Graph Theory and Reliability Block Diagram. In Proceedings of the 2019 Algerian Large Electrical Network Conference (CAGRE), Algiers, Algeria, 26–28 February 2019; pp. 152–157. [Google Scholar] [CrossRef]
- Kadhem, A.A.; Wahab, N.I.A.; AbdAlla, A.N. Differential evolution optimization algorithm based on generation systems reliability assessment integrated with wind energy. In Proceedings of the 2019 International Conference on Power Generation Systems and Renewable Energy Technologies (PGSRET), Istanbul, Turkey, 26–27 August 2019; pp. 26–27. [Google Scholar] [CrossRef]
- Benabid, R.; Merrouche, D.; Bourenane, A.; Alzbutas, R. Reliability Assessment of Redundant Electrical Power Supply Systems using Fault Tree Analysis, Reliability Block Diagram, and Monte Carlo Simulation Methods. In Proceedings of the 2018 International Conference on Electrical Sciences and Technologies in Maghreb (CISTEM), Algiers, Algeria, 28–31 October 2018; pp. 1–7. [Google Scholar] [CrossRef]
- Jaleel, J.A. Reliability analysis using fault tree method and its prediction using neural networks. In Proceedings of the 2013 International Conference on Control Communication and Computing (ICCC), Thiruvananthapuram, India, 13–15 December 2013; pp. 119–124. [Google Scholar] [CrossRef]
- Agwa, A.M.; Hassan, H.M. Onsite power system risk assessment for nuclear power plants considering components ageing. Prog. Nucl. Energy 2019, 110, 384–392. [Google Scholar] [CrossRef]
- Agwa, A.M.; Hassan, H.M.; Matter, Z.E.; Eisawy, E.A. Electrical grid reliability assessment by fault tree analysis. Indones. J. Electr. Eng. Comput. Sci. 2019, 17, 1127–1134. [Google Scholar] [CrossRef]
- Lisnianski, A. Extended block diagram method for a multi-state system reliability assessment. Reliab. Eng. Syst. Saf. 2007, 92, 1601–1607. [Google Scholar] [CrossRef]
- Dutuit, Y.; Innal, F.; Rauzy, A.; Signoret, J.P. Probabilistic assessments in relationship with safety integrity levels by using Fault Trees. Reliab. Eng. Syst. Saf. 2008, 93, 1867–1876. [Google Scholar] [CrossRef]
- Kadhem, A.A.; Wahab, N.I.A.; Aris, I.B.; Jasni, J.B.; Abdalla, A.N. Effect of Wind Energy Unit Availability on Power System Adequacy. Indian J. Sci. Technol. 2016, 9, 1–7. [Google Scholar] [CrossRef]
- Kadhem, A.A.; Wahab, N.I.A. Effects of Unavailability of Conventional Energy Units on Power Generation System Adequacy. Pertanika J. Sci. Technol. 2024, 32, 1687–1706. [Google Scholar] [CrossRef]
- Abbasghorbani, M. Prioritization of Transmission Network Components Based on their Failure Impact on Reliability of Composite Power Systems. Int. J. Eng. 2022, 35, 502–509. [Google Scholar]
- Meliopoulos, A.P.S.; Papic, M.; Tindemans, S.H.; Ekisheva, S.; Yue, M.; Logan, D.M. Composite Power System Reliability with Renewables and Customer Flexibility. In Proceedings of the 2022 17th International Conference on Probabilistic Methods Applied to Power Systems (PMAPS), Manchester, UK, 12–15 June 2022. [Google Scholar] [CrossRef]
- Idoniboyeobu, D.C.; Braide, S.L.; Songo, Y. Investigating Reliability of Power Distribution System Using Fault Tree Analysis (FTA). Glob. Sci. J. 2020, 8, 663–691. [Google Scholar]
- Kumar, T.B.; Sekhar, O.C.; Ramamoorty, M. Composite power system reliability evaluation using modified minimal cut set approach. Alex. Eng. J. 2018, 57, 2521–2528. [Google Scholar] [CrossRef]
- Kumar, T.B.; Sekhar, O.C.; Ramamoorty, M.; Lalitha, S.V.N.L. Evaluation of Power Capacity Availability at Load Bus in a Composite Power System. IEEE J. Emerg. Sel. Top. Power Electron. 2016, 4, 1324–1331. [Google Scholar] [CrossRef]
- Awosope, C.O.A.; Akinbulire, T.O. A Computer Program for Generating Power-System Load-Point Minimal Paths. IEEE Trans. Reliab. 1991, 40, 302–308. [Google Scholar] [CrossRef]
- Odeyar, P.; Apel, D.B.; Hall, R.; Zon, B.; Skrzypkowski, K. A Review of Reliability and Fault Analysis Methods for Heavy Equipment and Their Components Used in Mining. Energies 2022, 15, 6263. [Google Scholar] [CrossRef]
- Jiang, G.J.; Li, Z.Y.; Qiao, G.; Chen, H.X.; Li, H.B.; Sun, H.H. Reliability Analysis of Dynamic Fault Tree Based on Binary Decision Diagrams for Explosive Vehicle. Math. Probl. Eng. 2021, 2021, 1–13. [Google Scholar] [CrossRef]
- Verma, M.; Kumar, A.; Singh, Y. Power System Reliability Evaluation Using Fault Tree Approach Based on Generalized Fuzzy Number. J. Fuzzy Set Valued Anal. 2012, 2012, 1–13. [Google Scholar] [CrossRef]
- Billinton, R.; Kumar, S.; Chowdhury, N.; Chu, K.; Debnath, K.; Goel, L.; Khan, E.; Kos, P.; Nourbakhsh, G.; Oteng-Adjei, J. A reliability test system for educational purposes—Basic data. IEEE Trans. Power Syst. 1989, 4, 1238–1244. [Google Scholar] [CrossRef]
- Kadhem, A.A.; Wahab, N.I.A. Minimal cut sets deduction using a simple method via tracing minimal paths to assess reliability of power systems. Lect. Notes Electr. Eng. 2017, 398, 697–706. [Google Scholar] [CrossRef]
- Khare, V.; Nema, S.; Baredar, P. Reliability analysis of hybrid renewable energy system by fault tree analysis. Energy Environ. 2019, 30, 542–555. [Google Scholar] [CrossRef]
- Behzadirafi, S.; Salehfar, H.; Manoharan, A.K.; Nadipalli, S.R.; Aravinthan, V. Electric Circuit Theory Based Minimal Cut-Set Realization for Reliability Evaluation of Non-Directional Networks. In Proceedings of the 2018 North American Power Symposium (NAPS), Fargo, ND, USA, 9–11 September 2018; pp. 1–6. [Google Scholar] [CrossRef]
- Fotuhi-Firuzabad, M.; Billinton, R.; Munian, T.S.; Vinayagam, B. A novel approach to determine minimal tie-sets of complex network. IEEE Trans. Reliab. 2004, 53, 61–70. [Google Scholar] [CrossRef]
- Zhao, Y.; Che, Y.; Lin, T.; Wang, C.; Liu, J.; Xu, J.; Zhou, J. Minimal Cut Sets-Based Reliability Evaluation of the More Electric Aircraft Power System. Math. Probl. Eng. Vol. 2018, 2018, 1–11. [Google Scholar] [CrossRef]
- Billinton, J.O.-A.R.; Kumar, S.; Chowdhury, N.; Chu, K.; Debnath, K.; Goel, L.; Khan, E.; Kos, P.; Nourbakhsh, G. A reliability test system for educational purposes-basic results. IEEE Trans. Power Syst. 1990, 5, 319–325. [Google Scholar] [CrossRef]
Disclaimer/Publisher’s Note: The statements, opinions and data contained in all publications are solely those of the individual author(s) and contributor(s) and not of MDPI and/or the editor(s). MDPI and/or the editor(s) disclaim responsibility for any injury to people or property resulting from any ideas, methods, instructions or products referred to in the content. |
© 2025 by the author. Licensee MDPI, Basel, Switzerland. This article is an open access article distributed under the terms and conditions of the Creative Commons Attribution (CC BY) license (https://creativecommons.org/licenses/by/4.0/).