Abstract
Focusing on an energy-saving winch-type heave compensation system applicable to real working conditions, with the objective of enhancing compensation accuracy, a wavelet neural network was employed for platform velocity prediction, and the prediction results were applied to velocity disturbance compensation control. Initially, the ITTC two-parameter spectrum was utilized to generate wave spectral diagrams under different sea conditions, along with displacement and velocity data of the floating platform’s heave motion. Subsequently, a time-series-based wavelet neural network velocity prediction model was developed, trained, and tested. Comparative analyses were performed on prediction performance differences across varying prediction steps and sea condition levels. Then, the effectiveness of the time-series-based wavelet neural network prediction model was validated through a valve-controlled hydraulic cylinder heave motion simulation system. Experimental results indicated that the wavelet neural network-based velocity prediction method effectively improved the compensation accuracy of the winch-type heave compensation system. Finally, after verifying the effectiveness of the wavelet neural network prediction model based on time series, the compensation performance of the system after adding the velocity prediction module was tested and verified using the winch-type heave compensation simulation test bench built by the research team. After experimental verification, after adding velocity prediction, the compensation accuracy of the system was improved by 19% compared with that without velocity prediction.
1. Introduction
When operating at sea, the hull is subjected to the combined effects of wind, waves, and currents, causing the ship to move in six directions: roll, pitch, bow, sway, surge, and heave. Usually, a dynamic positioning system is installed on a ship, which uses thrusters to resist environmental forces to eliminate the effects of sway, pitch, and bow motion. However, the effect of heave motion on ship operations cannot be eliminated by the dynamic positioning system [1]. Heave compensation technology is a key technology that ensures the smooth execution of offshore engineering operations. It is mainly used to correct and compensate for motion in the heave direction caused by environmental factors such as wind, waves, and currents during offshore operations. This technology monitors the heave motion of the vessel in real time through sensors installed on the hull, transmitting the measured data to the control system, which then calculates the required displacement or force to be compensated. The corresponding actuators adjust the operation equipment to achieve heave compensation. The application of this technology effectively prevents the impact of heave motion on operational equipment and research personnel, further improving the efficiency and safety of offshore operations [2,3].
Since the last century, the application value of the short-term motion prediction of floating platforms in practical engineering has been widely explored, and a large number of prediction models have been developed. According to the theoretical differences of various methods, short-term prediction models can be divided into three types: prediction models based on fluid dynamics, classical time series, and prediction models related to nonlinear and intelligent learning [4]. In essence, the prediction models related to classical time series and nonlinear intelligent learning are both based on statistical data.
Fluid dynamics-based predictions include convolution-based methods and state-space-based Kalman filter methods. Yanbing Dou aims to solve the problem concerning the difficulty in capturing temporal and spatial features in the ship track sequence data under high sea conditions. It designs and uses convolutional neural networks and long short-term memory neural networks to extract the spatial trend features and time series features in the input, respectively, and finds that this method can improve the prediction effect. Finally, the experimental results on the real ship track data set show that the prediction accuracy and real-time performance of the motion prediction system meet the actual needs [5]. This method requires accurate response functions and wave inputs. Kalman filtering is another prediction method based on fluid dynamics. Xiaoli WANG and Zhanjie GUO used the Kalman filtering method to establish a random wave model and a ship rolling motion model, and conducted a systematic study on the prediction of ship roll and other postures [6]. The prediction accuracy of this method depends largely on the wave frequency and noise. However, in practical engineering, accurate state-space equations and noise statistics are difficult to obtain, which makes the Kalman filter difficult to apply.
Compared with the prediction model based on fluid dynamics, the method based on statistical data is easier to model and has lower requirements on computer memory and time. When modeling, time series analysis only needs to consider the historical data of the platform movement. Commonly used classical time series prediction models include autoregressive (AR) and autoregressive moving average (ARMA) models. Although the classical time series model is efficient and adaptive, its prediction results in severe sea conditions are not ideal. Obviously, for drilling platforms operating in the deep sea, the ship platform and the waves are always unstable, so it is difficult to accurately establish the prediction model of the classical time series.
In order to overcome the hidden nonlinearity in real ship motion, prediction models related to nonlinear intelligent learning have been widely studied, such as artificial neural networks, back propagation networks, and wavelet neural networks, which can perform nonlinear modeling without prior knowledge of the relationship between input and output variables. Compared with the traditional BP neural network, the wavelet neural network has obvious advantages. First, the neurons and network topology of the wavelet neural network are determined based on the wavelet analysis theory, which can avoid the arbitrariness of the network structure design. Second, the wavelet neural network has a stronger learning ability. Finally, for the same learning task, the wavelet neural network can converge faster with a simpler network structure. Weiyuan GUO et al. used wavelet neural networks to predict the reliability of ship power systems and improve the service life of ships [7]. Chuang DAI proposed a ship posture prediction model that integrates wavelet transform and attention. It was verified that this method can effectively improve the stability of the ship platform [8]. Wenjun ZHANG introduced a wavelet neural network into the field of ship motion control and constructed a ship motion prediction controller based on an improved wavelet neural network. The wavelet neural network was used to perform the online identification and prediction of ship motion dynamics, and ship motion prediction control was performed based on the prediction results. The simulation results verified that the control system has high control accuracy and strong anti-interference ability [9].
Researchers have conducted a lot of research on floating platform motion prediction, especially focusing on how to improve the accuracy of motion prediction [10,11]. However, for the motion prediction of floating platforms that need to be used for real-time compensation control, there is little research on the method of combining platform heave motion prediction with compensation control to ultimately improve the compensation accuracy [12].
In the winch-type heave compensation system, the conventional feedback control accuracy is not high. The compensation starts only after the error occurs, and the disturbance cannot be eliminated synchronously. The compensation has a lag. Therefore, this paper intends to first perform necessary processing and short-term prediction on the measured platform heave data and use the predicted platform motion velocity for velocity disturbance compensation to achieve a better heave compensation effect [13].
2. Materials and Methods
2.1. Energy-Saving Heave Compensation Winch
2.1.1. Working Principle of Energy-Saving Heave Compensation Winch
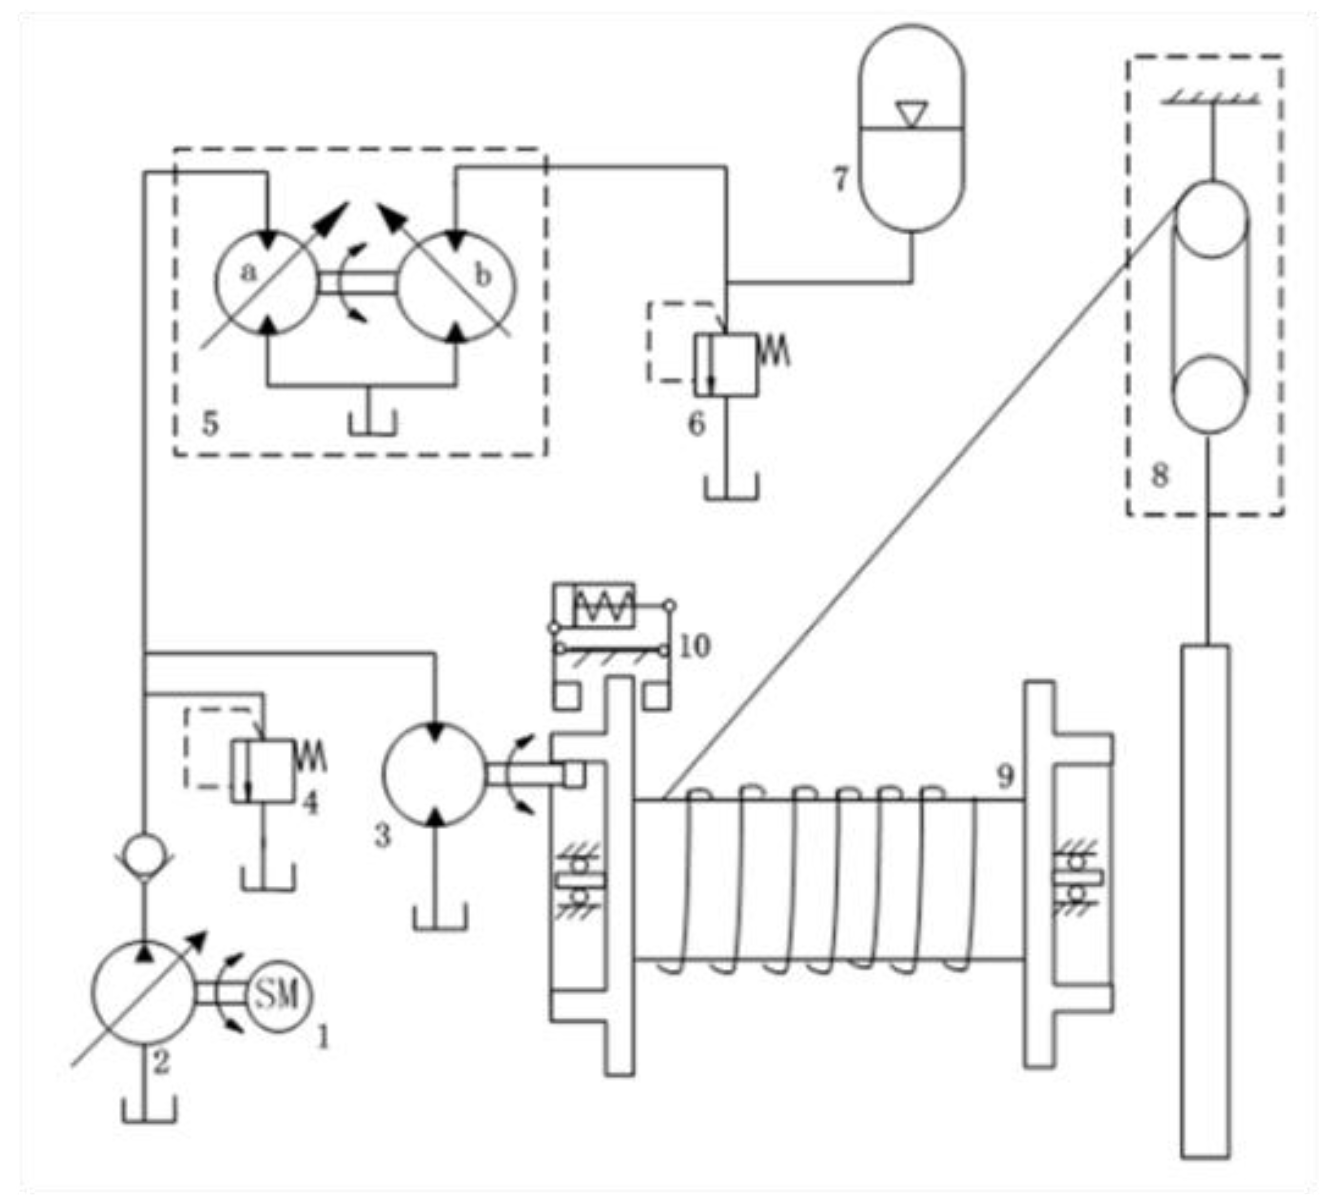
As shown in Figure 1, the working principle diagram of the energy-saving heave compensation winch is depicted. This winch device consists of a direct-drive pump source (composed of servo motor 1 and variable pump 2), hydraulic motor 3, relief valves 4 and 6, hydraulic transformer 5, accumulator 7, pulley system 8, drum 9, brake 10, and other components. In addition to the functions of a drilling winch, such as lifting, lowering, and braking, this winch also features a heave compensation function, with an unlimited compensation stroke, and is capable of recovering the gravitational potential energy of the load.

Figure 1.
Working principle diagram of energy-saving winch-type heave compensation system.
2.1.2. Control Block Diagram of Heave Compensation Winch Based on Velocity Prediction
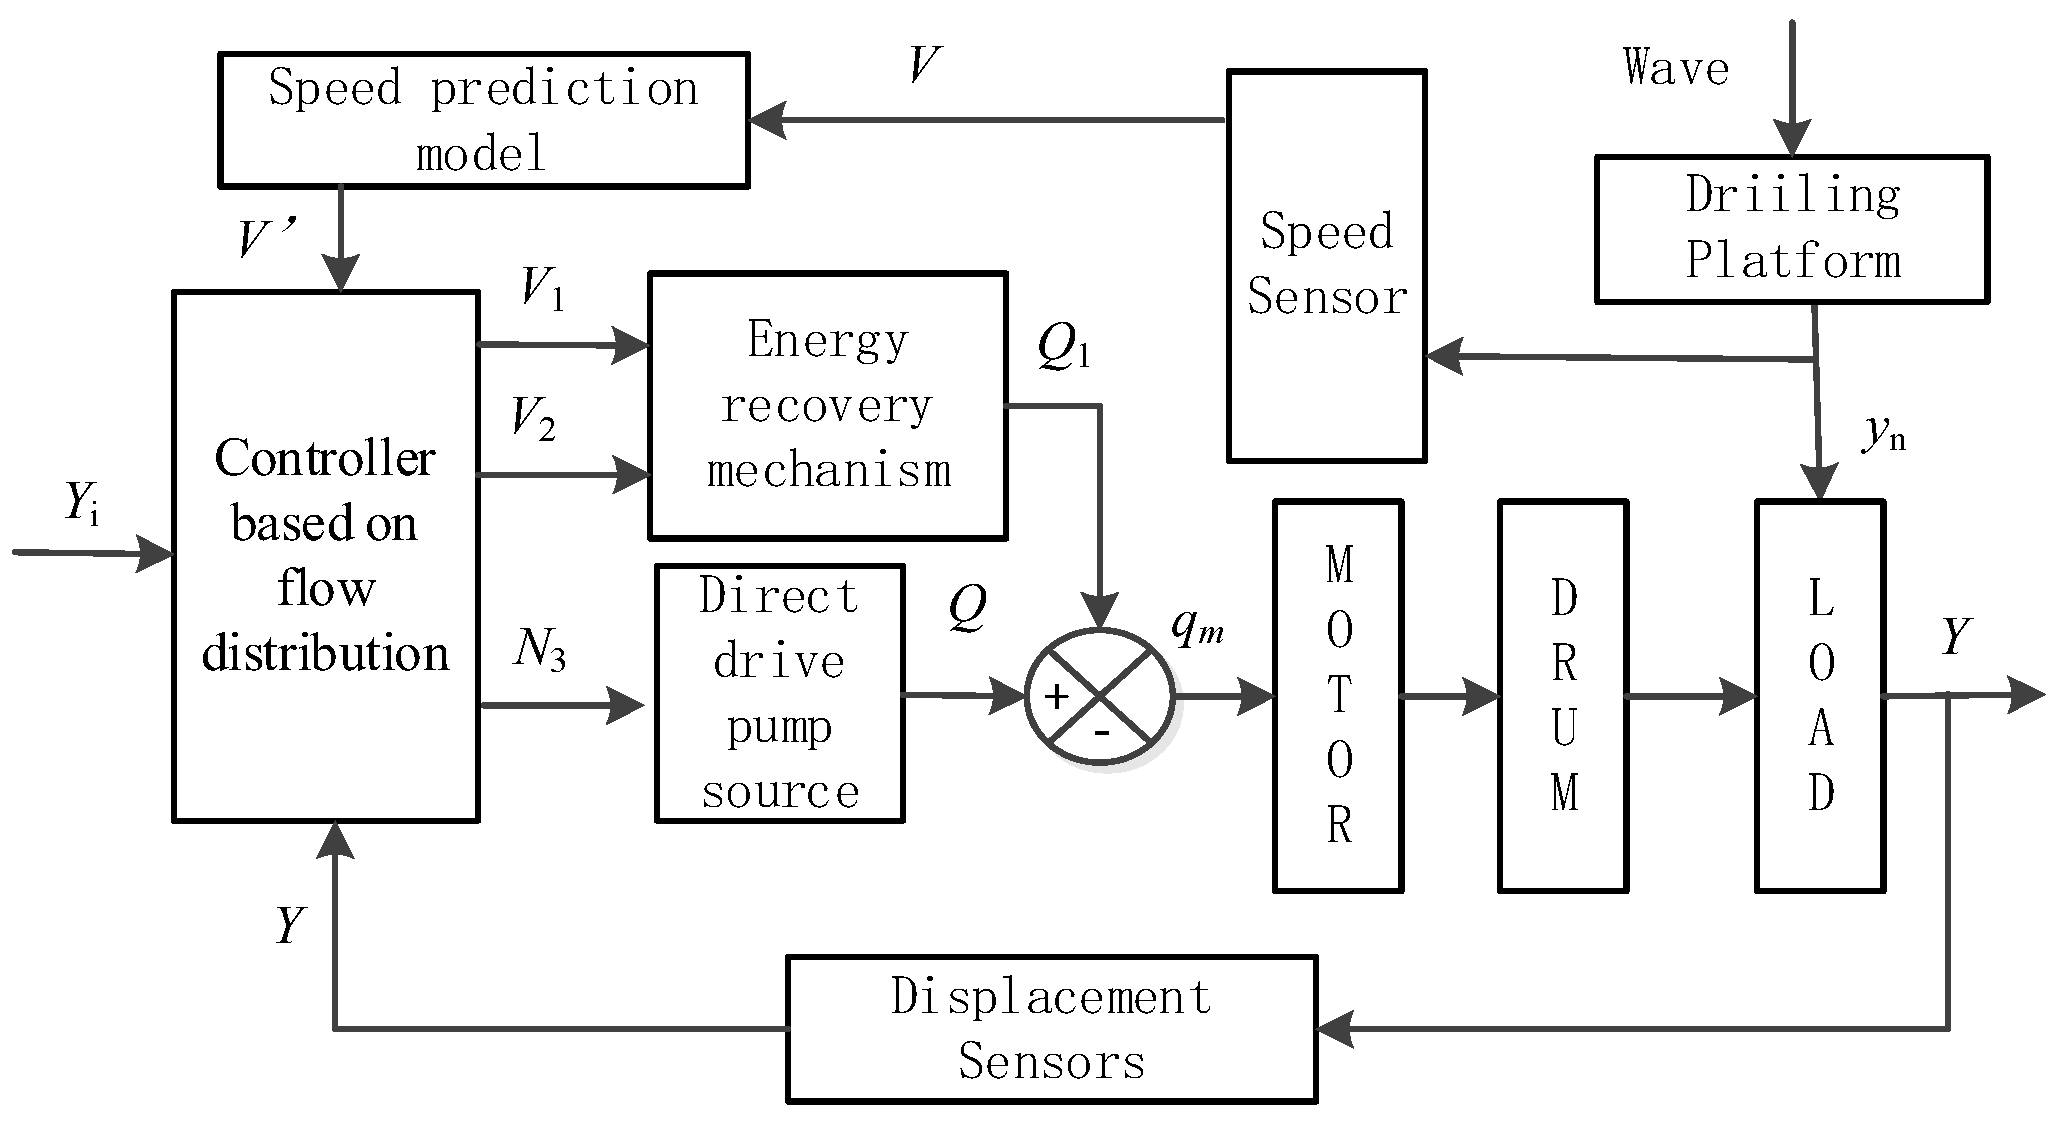
Figure 2 shows the block diagram of the control system. The control system implements a flow control strategy [14]: The heave velocity V of the floating platform, measured by a speed sensor, is integrated to obtain displacement. This displacement is then fed into the velocity prediction model, which outputs the predicted heave velocity V’ for the subsequent time step. Based on V’, the desired displacement Yi, and the measured load displacement Y, a flow distribution controller calculates the required total flow rate q. This total flow is allocated into two components: the target flow q1 for the energy regeneration unit and q2 for the direct-drive pump unit.

Figure 2.
Control system block diagram.
The energy regeneration controller regulates the displacements V1 and V2 of the primary and secondary hydraulic motors using q1, the hydraulic transformer speed N2, and the operating pressures P1 and P2 of the respective motors. Concurrently, the direct-drive pump controller adjusts the servo motor speed N3 according to q2 and the actual pump output flow Q. The combined flow from both subsystems delivers the total motor input flow qm. In this architecture, the platform heave velocity V acts as a disturbance input, while the load displacement Y provides closed-loop feedback.
2.2. Velocity Prediction Based on Wavelet Neural Network Based on Time Series
2.2.1. Construction of Velocity Prediction Model Based on Wavelet Neural Network
The wavelet basis function used in this paper is the Morlet wavelet, and its calculation expression is as follows [15]:
In Formula (1), x is the input layer parameter and y is the predicted output. The wavelet neural network in this paper adopts the common 4-6-1 structure, which includes 4 input layer nodes, 6 hidden layer nodes, and 1 output layer node. The input layer nodes represent the platform heave velocity of the 4 sampling intervals before the prediction time node, and the output layer nodes represent the platform heave velocity obtained after the wavelet neural network prediction.
Figure 3 shows the construction and simulation flow chart of the wavelet neural network prediction model. Considering the fact that the wave level is constantly changing in actual working conditions, the changes in the platform mass and the contact area between the platform and the seawater at the waterline will also affect the response relationship between the wave motion and the platform motion. A fixed prediction model is difficult to adapt to various working conditions. Therefore, an online self-learning module is added during the simulation. That is, when there is a large error between the prediction result and the measured result, the relevant parameters will be adjusted in time to correct the prediction model to adapt to the latest situation.
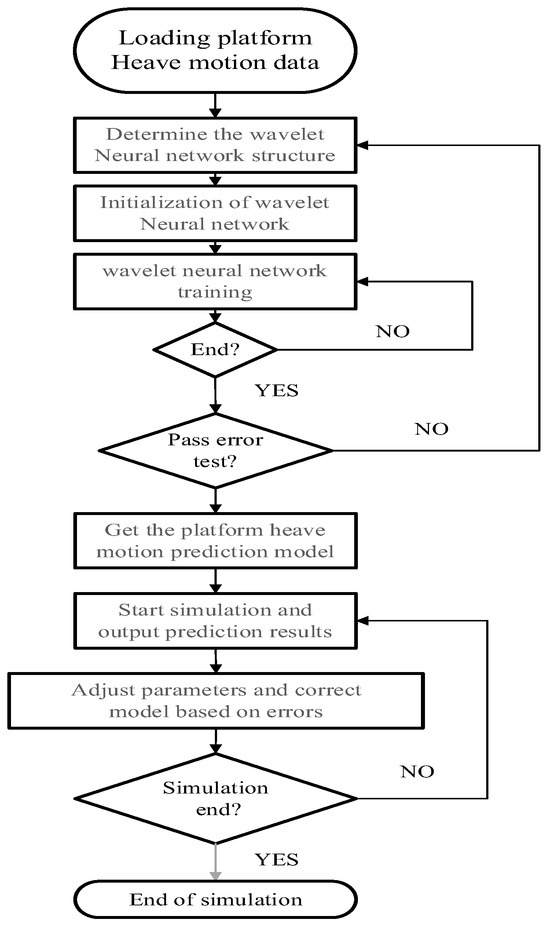
Figure 3.
Construction of wavelet neural network velocity prediction model and simulation flow chart.
2.2.2. Acquisition of Heave Motion Data of Wave Platform
The heave motion of a floating platform at sea is mainly caused by waves. In order to study the motion characteristics of a floating platform at sea, it is necessary to study the waves. When studying the heave motion of a floating platform, it is generally treated as a stationary random process. Time domain analysis and frequency domain analysis can be used to estimate the statistical characteristics of this stationary random process [16]. The former is used to perform an analysis in the time domain after random sampling, and the latter is used to perform a spectral analysis in the frequency domain after random sampling. This is a more widely used method at present.
To analyze the characteristics of waves using the spectral analysis method, it is necessary to count and calculate the wave spectrum density of the floating platform working area. However, it is inconvenient and unrealistic to measure the wave spectrum of a sea area on the spot. Researchers have conducted a theoretical analysis based on a large amount of marine observation data and obtained a variety of wave spectrum density expressions. Commonly used spectral formulas include the P-M spectrum, ITTC single-parameter spectrum, etc. This paper introduces the wave characteristic period into the spectral formula to obtain the ITTC two-parameter spectrum.
The random wave heave motion can be regarded as the superposition of simple harmonic waves of different frequencies, and its heave displacement function is as follows [17]:
The calculation formula of ζai is as follows [18]:
In Formula (3), ζa(t) is the displacement of the wave heave motion, ζai is the peak value of the i-th harmonic, ωi is the angular frequency of the i-th harmonic, and εi is the initial phase angle of the i-th harmonic.
The Sξ(ω) in the formula adopts the ITTC two-parameter spectrum, and its expression is as follows:
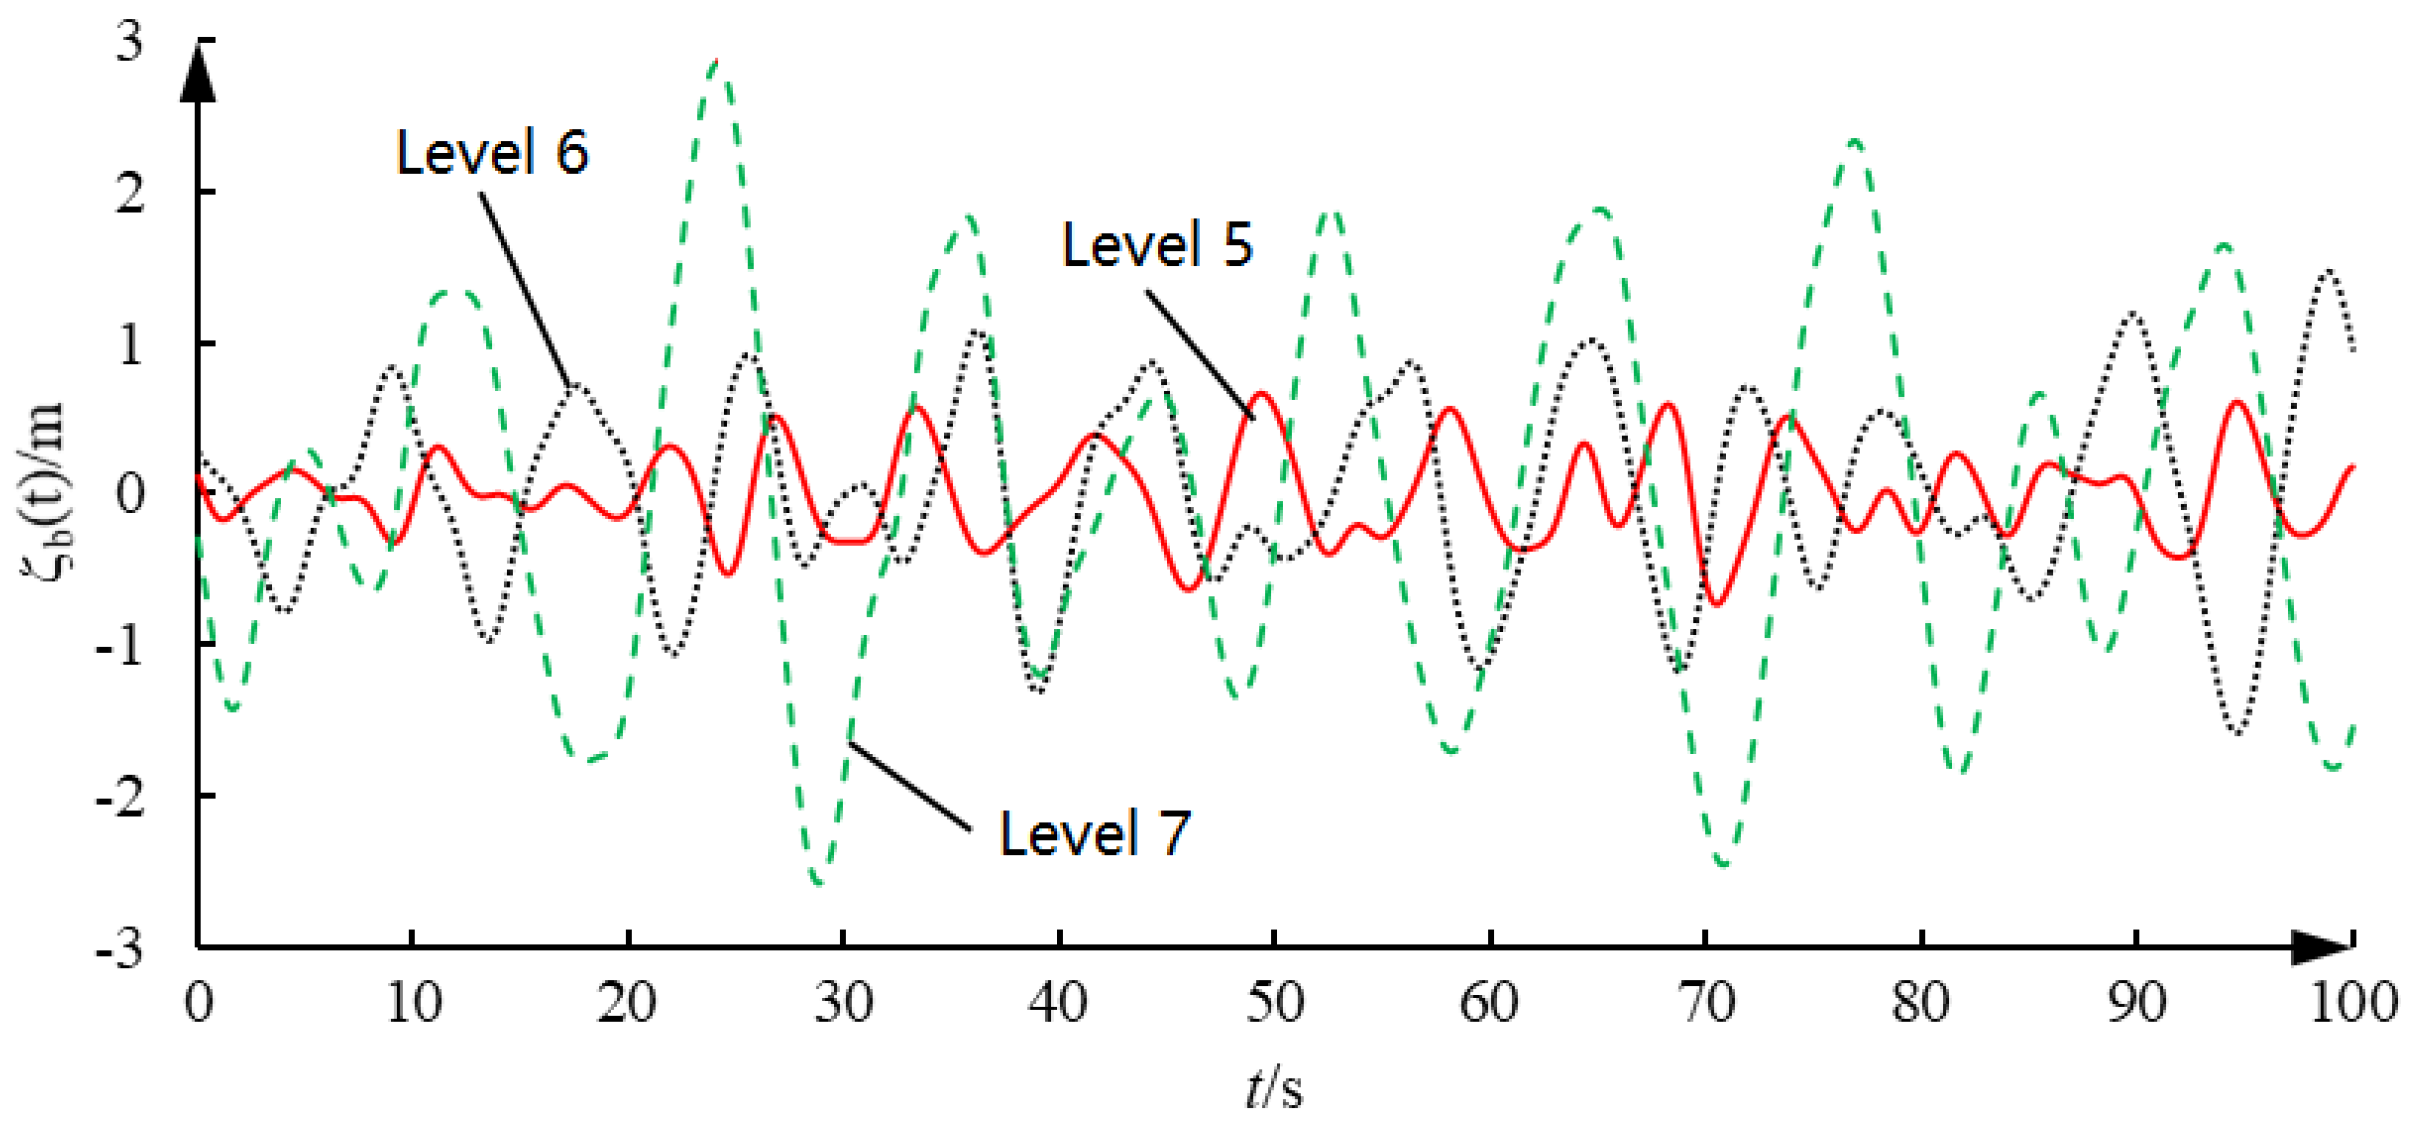
where T1 is the characteristic period, in seconds; h1/3 is the significant wave height, in meters. Their values vary under different sea conditions, as shown in Table 1. In Figure 4, the wave heave displacement is shown under different levels of sea conditions.

Table 1.
Parameter values under different grades of sea conditions.
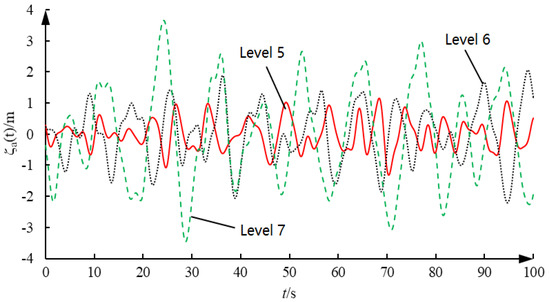
Figure 4.
Wave heave displacement under different levels of sea conditions.
2.2.3. Analysis of Ocean Waves and Heave Motion of Floating Platform
The heave motion response model between the floating platform and the waves is as follows [18]:
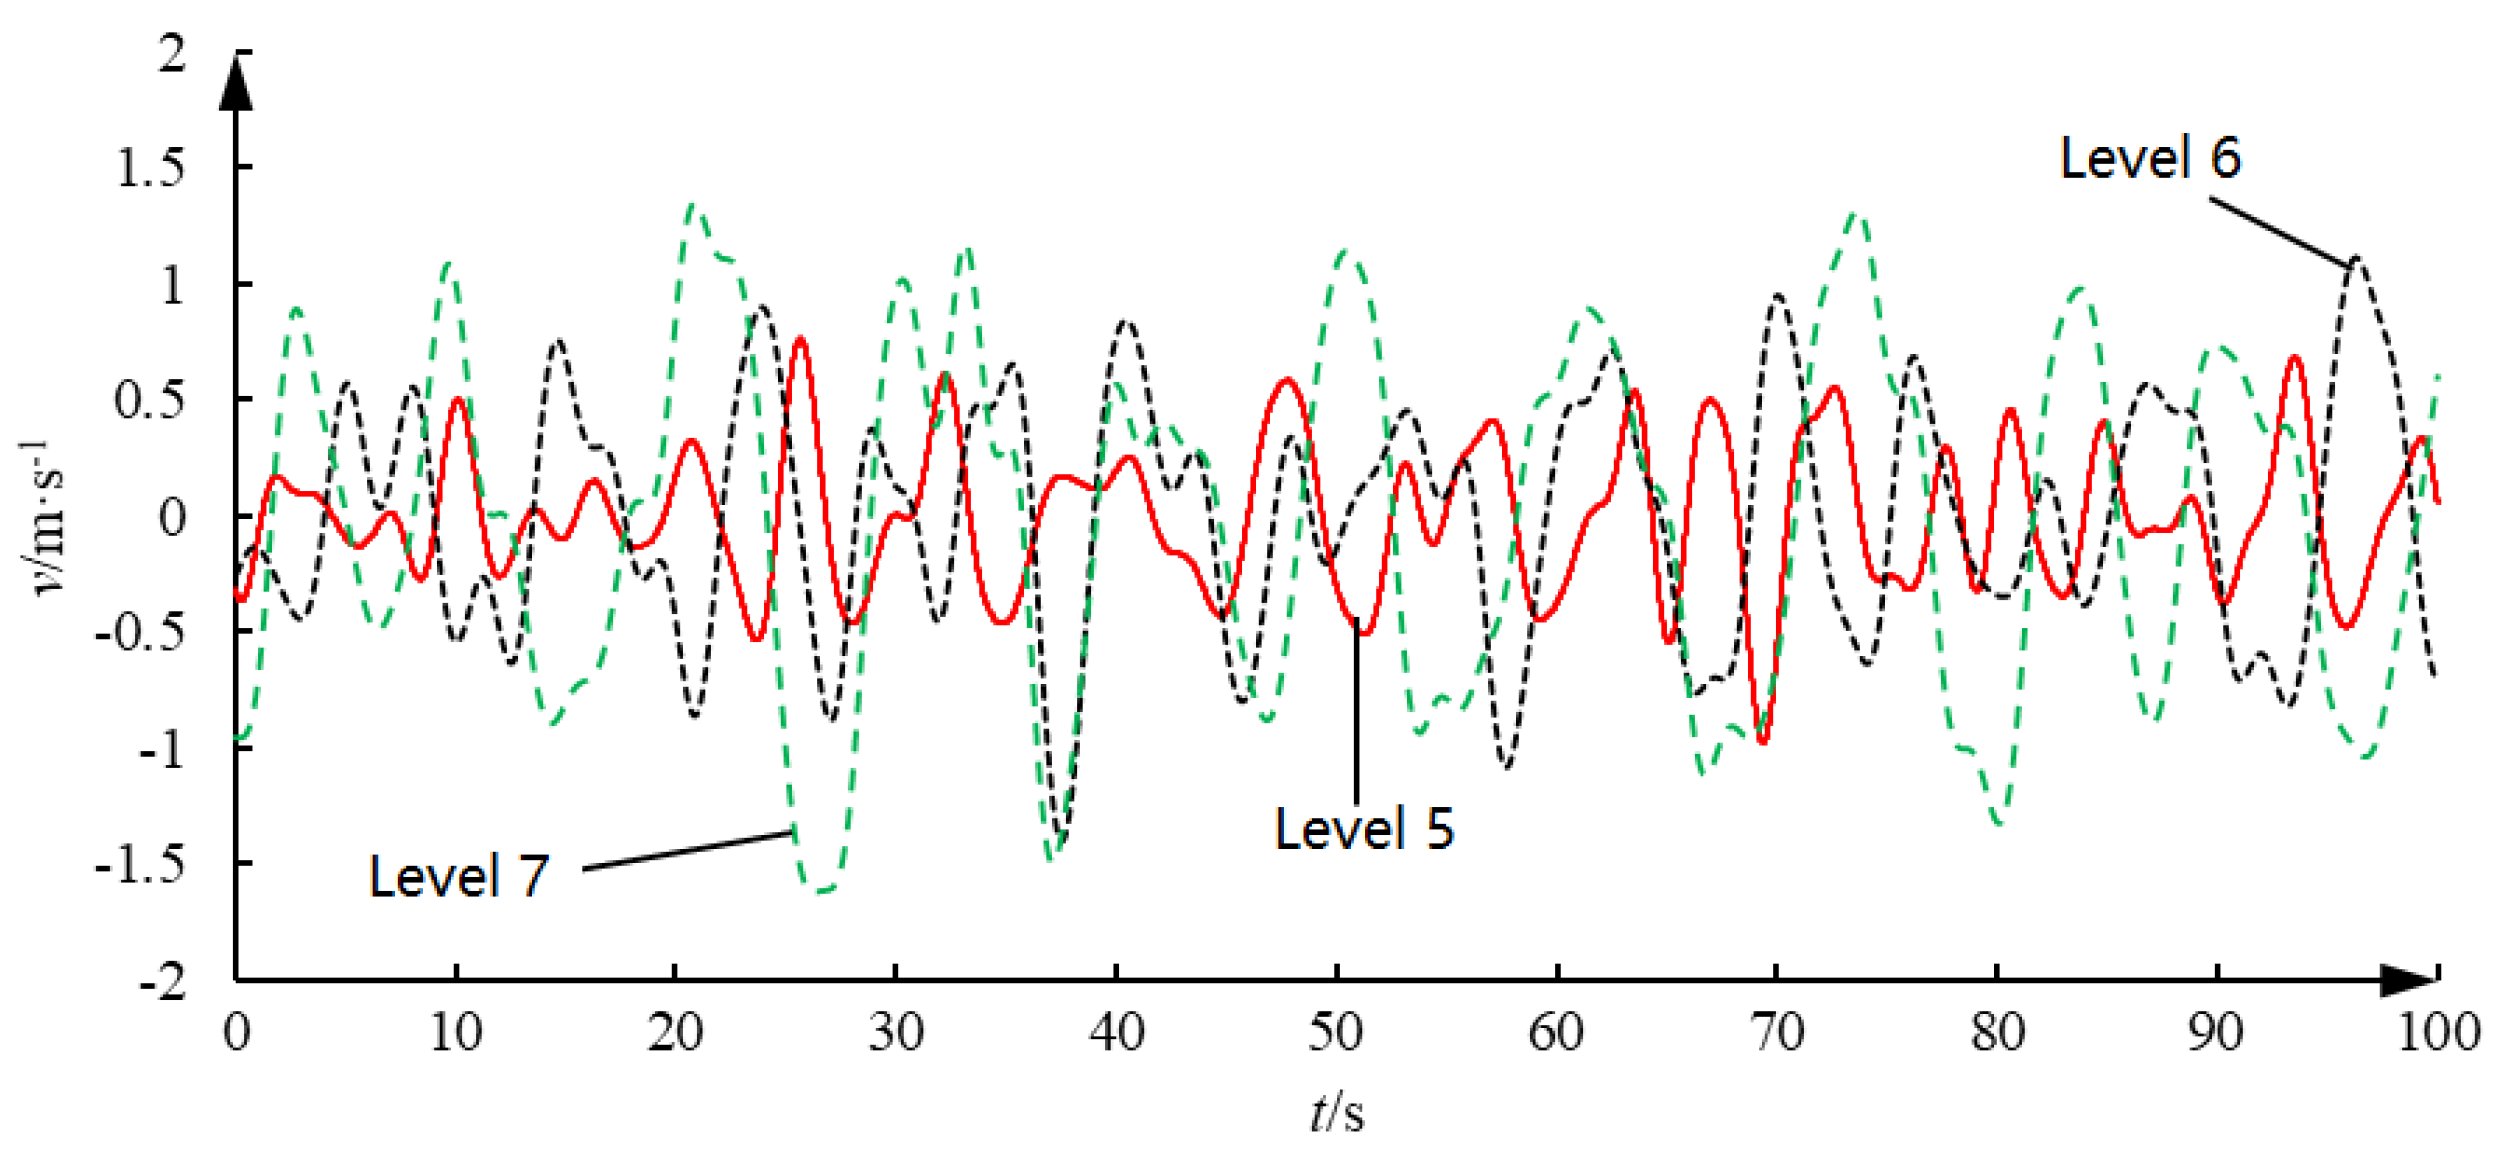
In Equation (5), ρ represents the seawater density, S represents the contact area between the floating platform’s waterline and the seawater, M represents the platform’s mass, and g represents the gravitational acceleration. This paper takes the floating platform shown in Table 2 as the object to obtain the platform’s heave motion displacement data. Through simulation, the heave displacement and heave velocity of the floating platform under different levels of sea conditions are obtained, as shown in Figure 5 and Figure 6.
Table 2.
Related parameters of a floating platform.
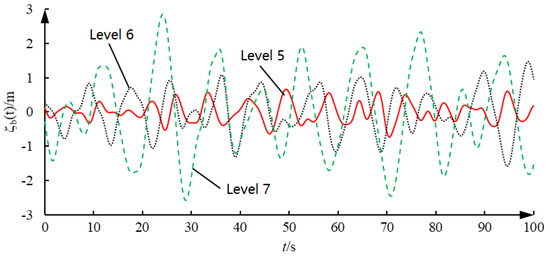
Figure 5.
Heave displacement of floating platform under different levels of sea conditions.
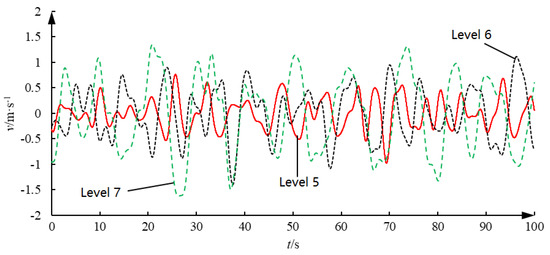
Figure 6.
Heave velocity of floating platform under different levels of sea conditions.
2.2.4. Prediction Results Analysis
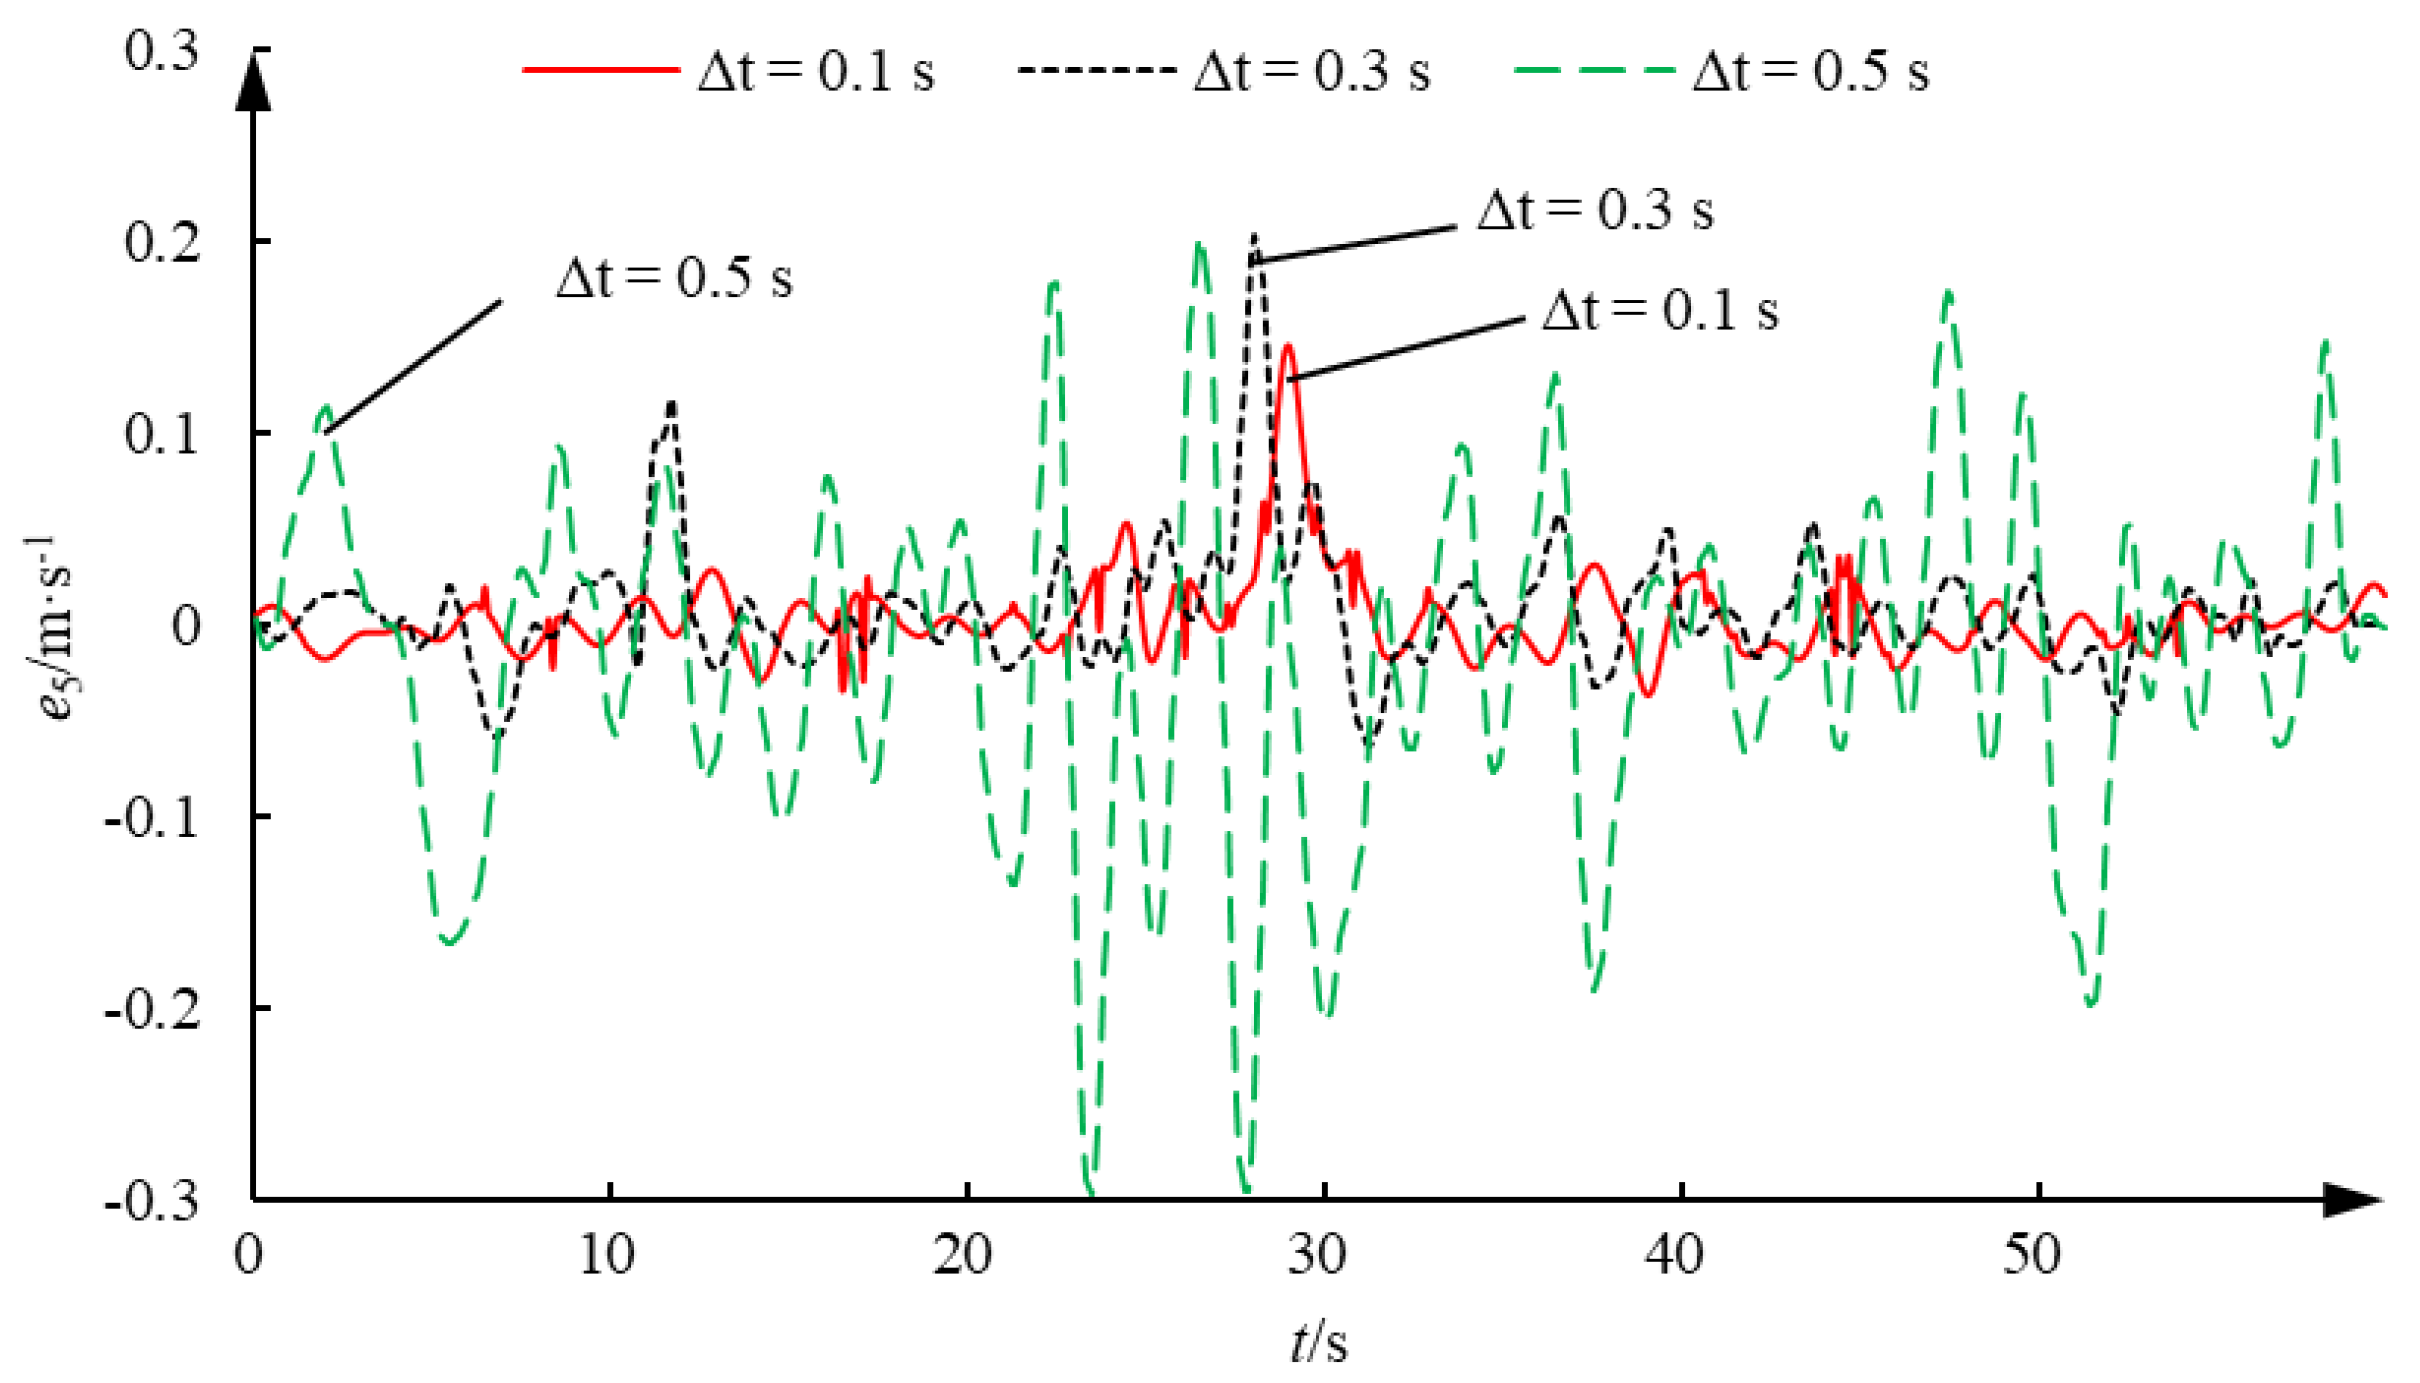
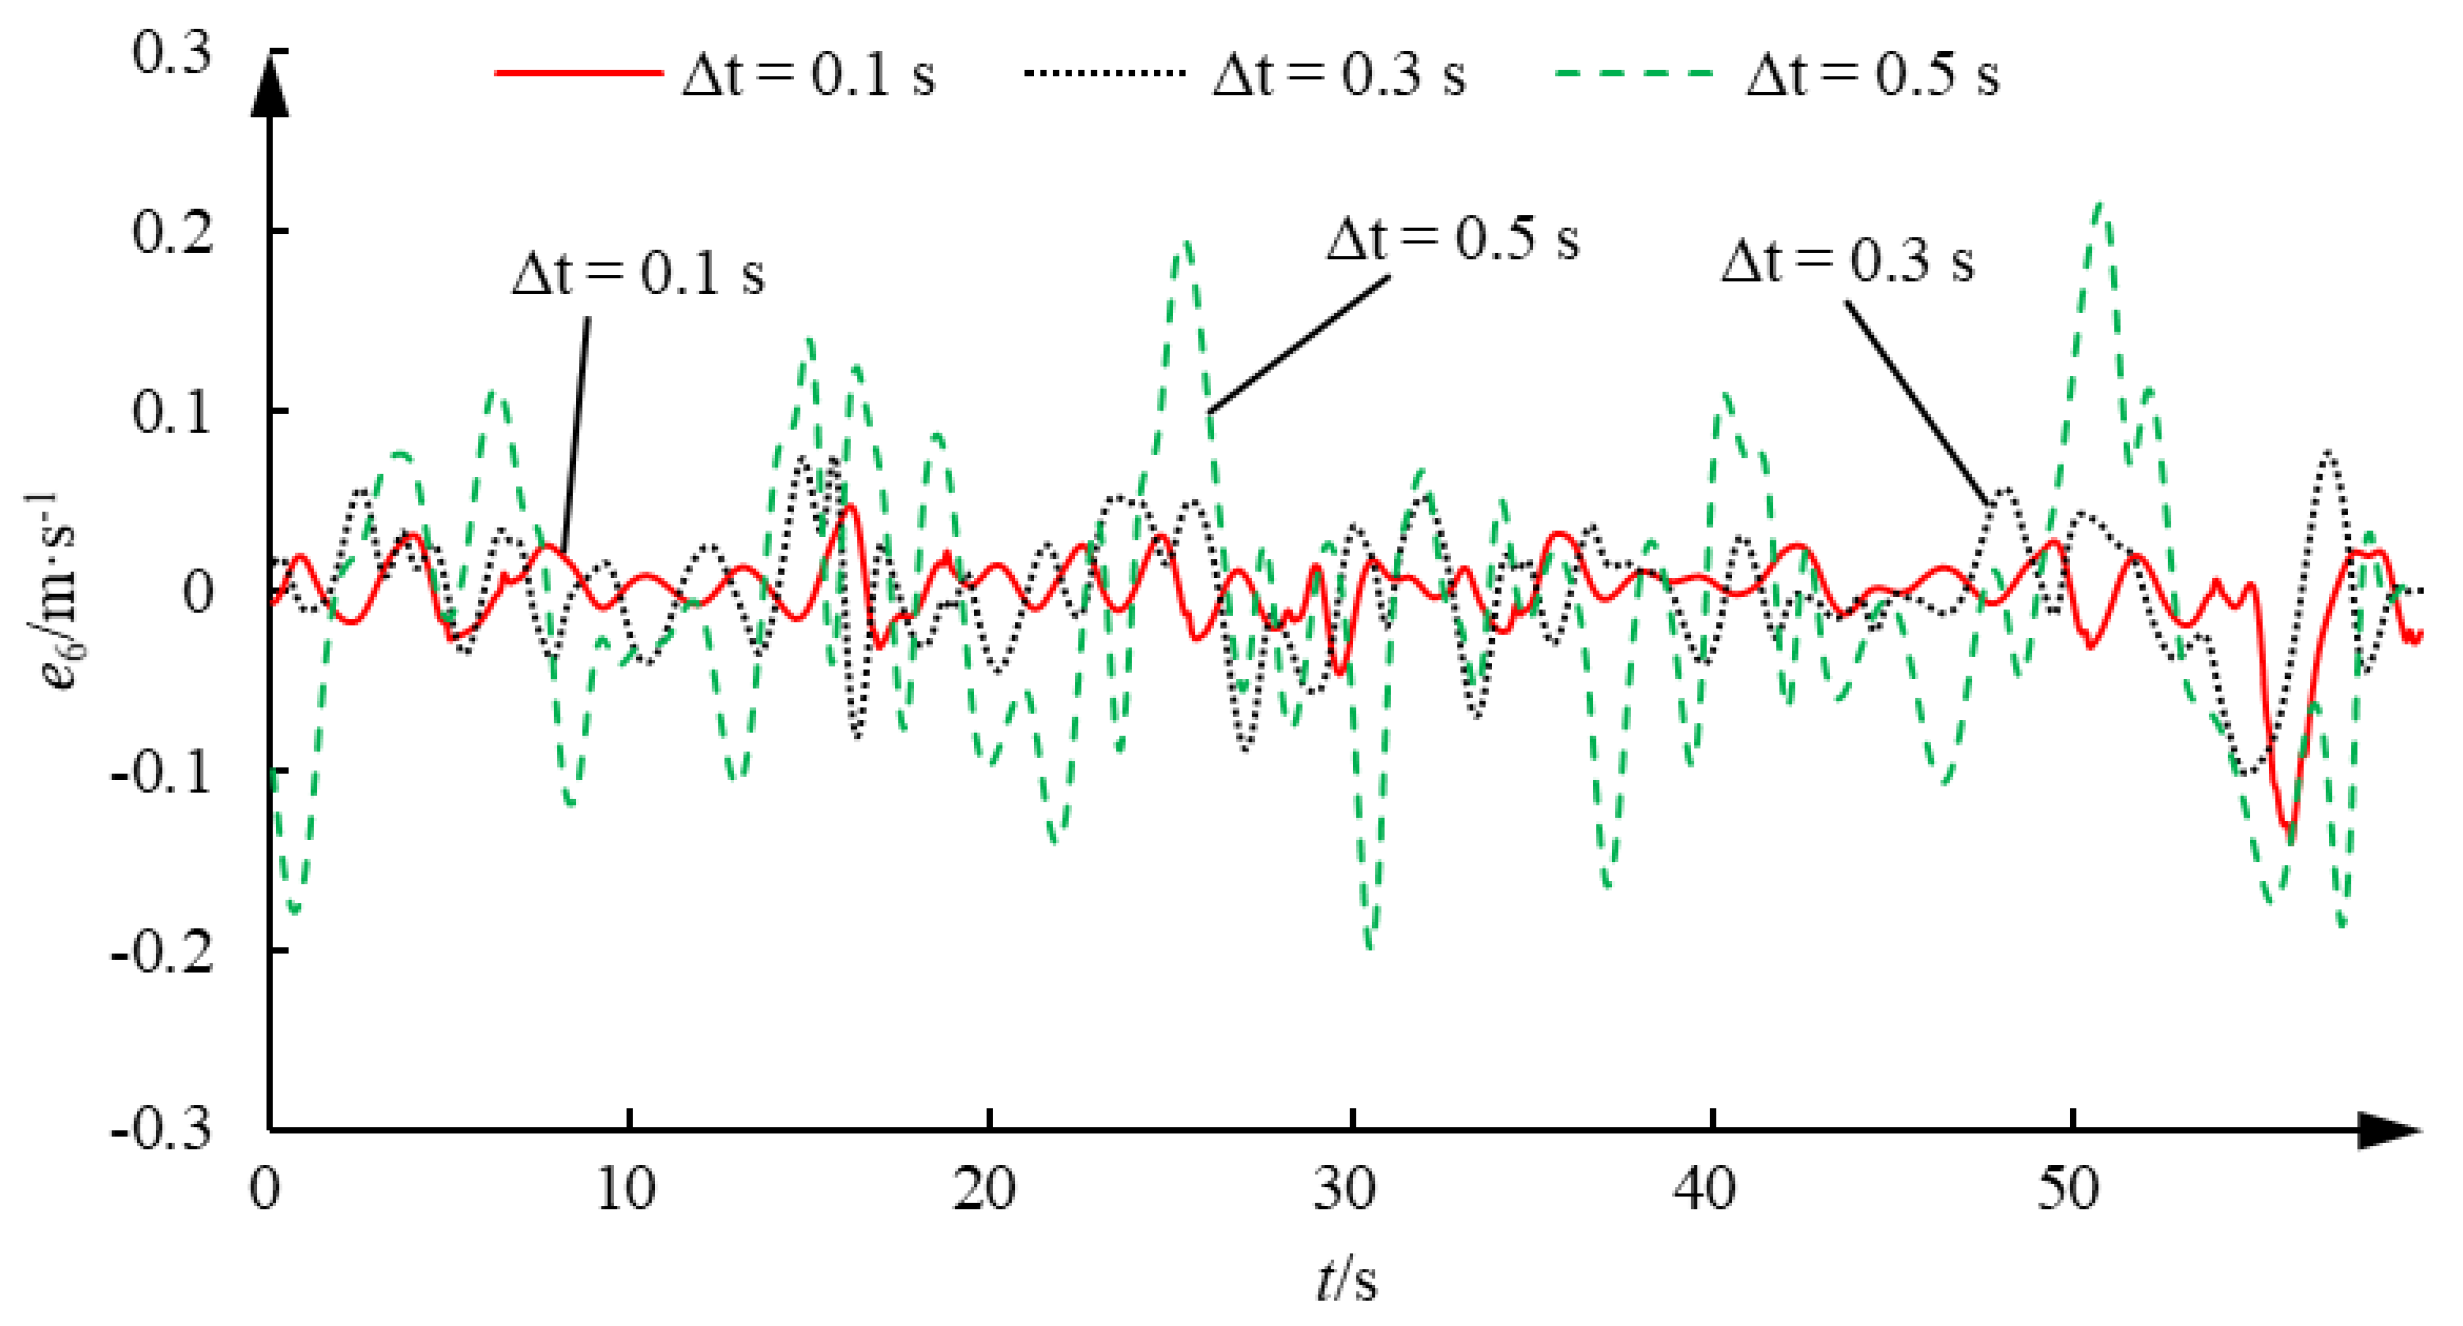
Figure 7, Figure 8 and Figure 9 show the velocity prediction errors for different prediction step sizes under sea conditions of level 5, level 6, and level 7, respectively. As can be seen from the figures, this prediction method is effective for all sea condition levels, and the prediction accuracy is related to the prediction step size. When the prediction step size is 0.1 s, the velocity prediction errors for different sea conditions are generally within ±0.05 m/s; when the prediction step size is 0.5 s, the prediction accuracy decreases, but the errors are still within ±0.2 m/s. It is worth noting that under sea conditions of level 5 and level 6, when the prediction step size is 0.1 s, small peaks in the velocity prediction errors occur at 69 s and 97 s, respectively. Upon analysis, this situation is caused by the small training data set and the limited range of maximum and minimum velocity values within this training data. As a result, the predicted velocities after inverse normalization do not exceed the upper and lower limits of the training data, which leads to increased prediction errors at times when the heave velocity is relatively high. In the actual prediction, increasing the training data set to cover a broader velocity range will effectively reduce the prediction errors.
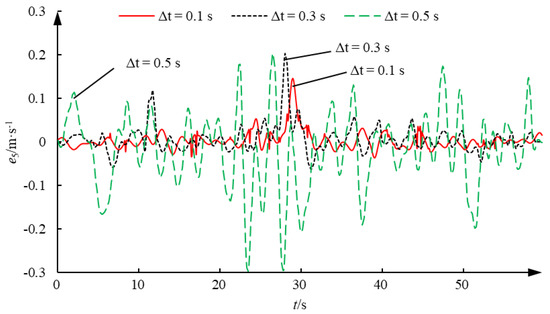
Figure 7.
Velocity prediction error with different prediction step size in sea condition level 5.
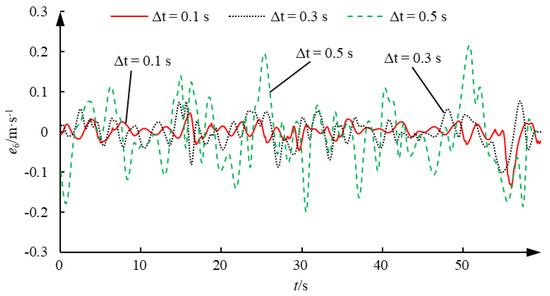
Figure 8.
Velocity prediction error with different prediction step size in sea condition level 6.
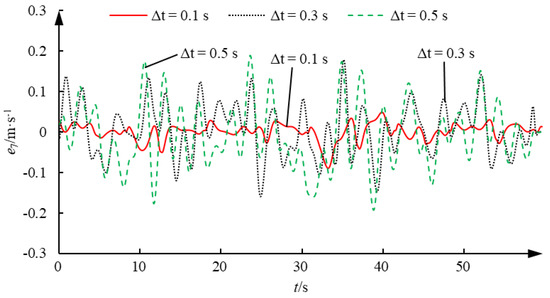
Figure 9.
Velocity prediction error with different prediction step size in sea condition level 7.
2.3. Experimental Analysis of Time-Series-Based Wavelet Neural Network for Velocity Prediction
2.3.1. Hydraulic System Components
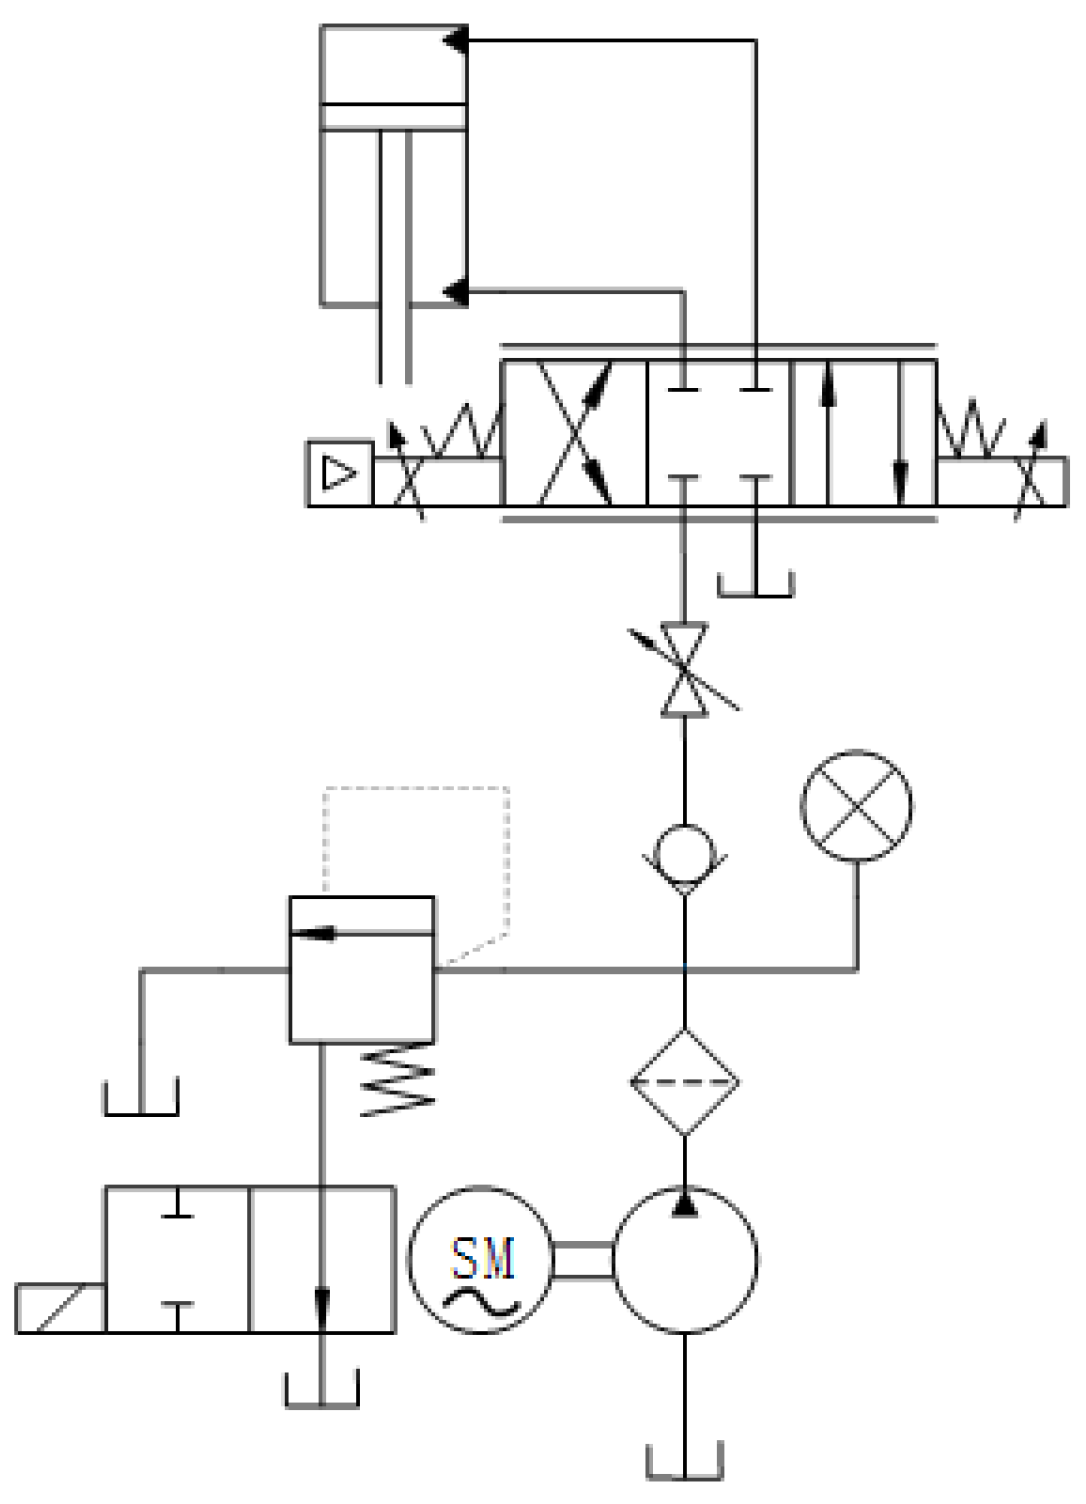
This experiment used a valve-controlled hydraulic cylinder heave motion simulation system to simulate the heave motion of the platform and perform a velocity prediction. The system is relatively simple, and Figure 10 shows the hydraulic schematic of the system. The main hydraulic components include the hydraulic cylinder, proportional directional valve, check valve, relief valve, solenoid valve, etc. The extension and retraction of the piston rod in the hydraulic cylinder are used to simulate the heave motion of the floating platform, with the extension velocity of the piston rod controlled by a proportional directional valve.
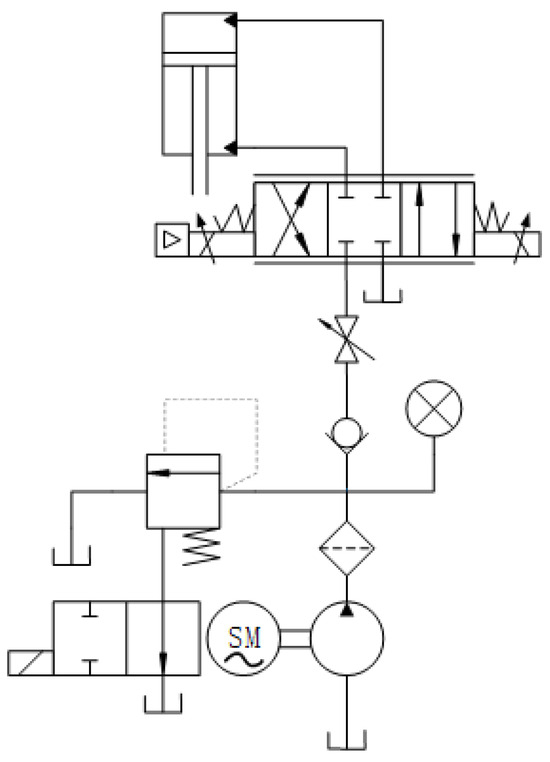
Figure 10.
Schematic diagram of valve-controlled hydraulic cylinder heave motion simulation system.
2.3.2. Hardware System Components
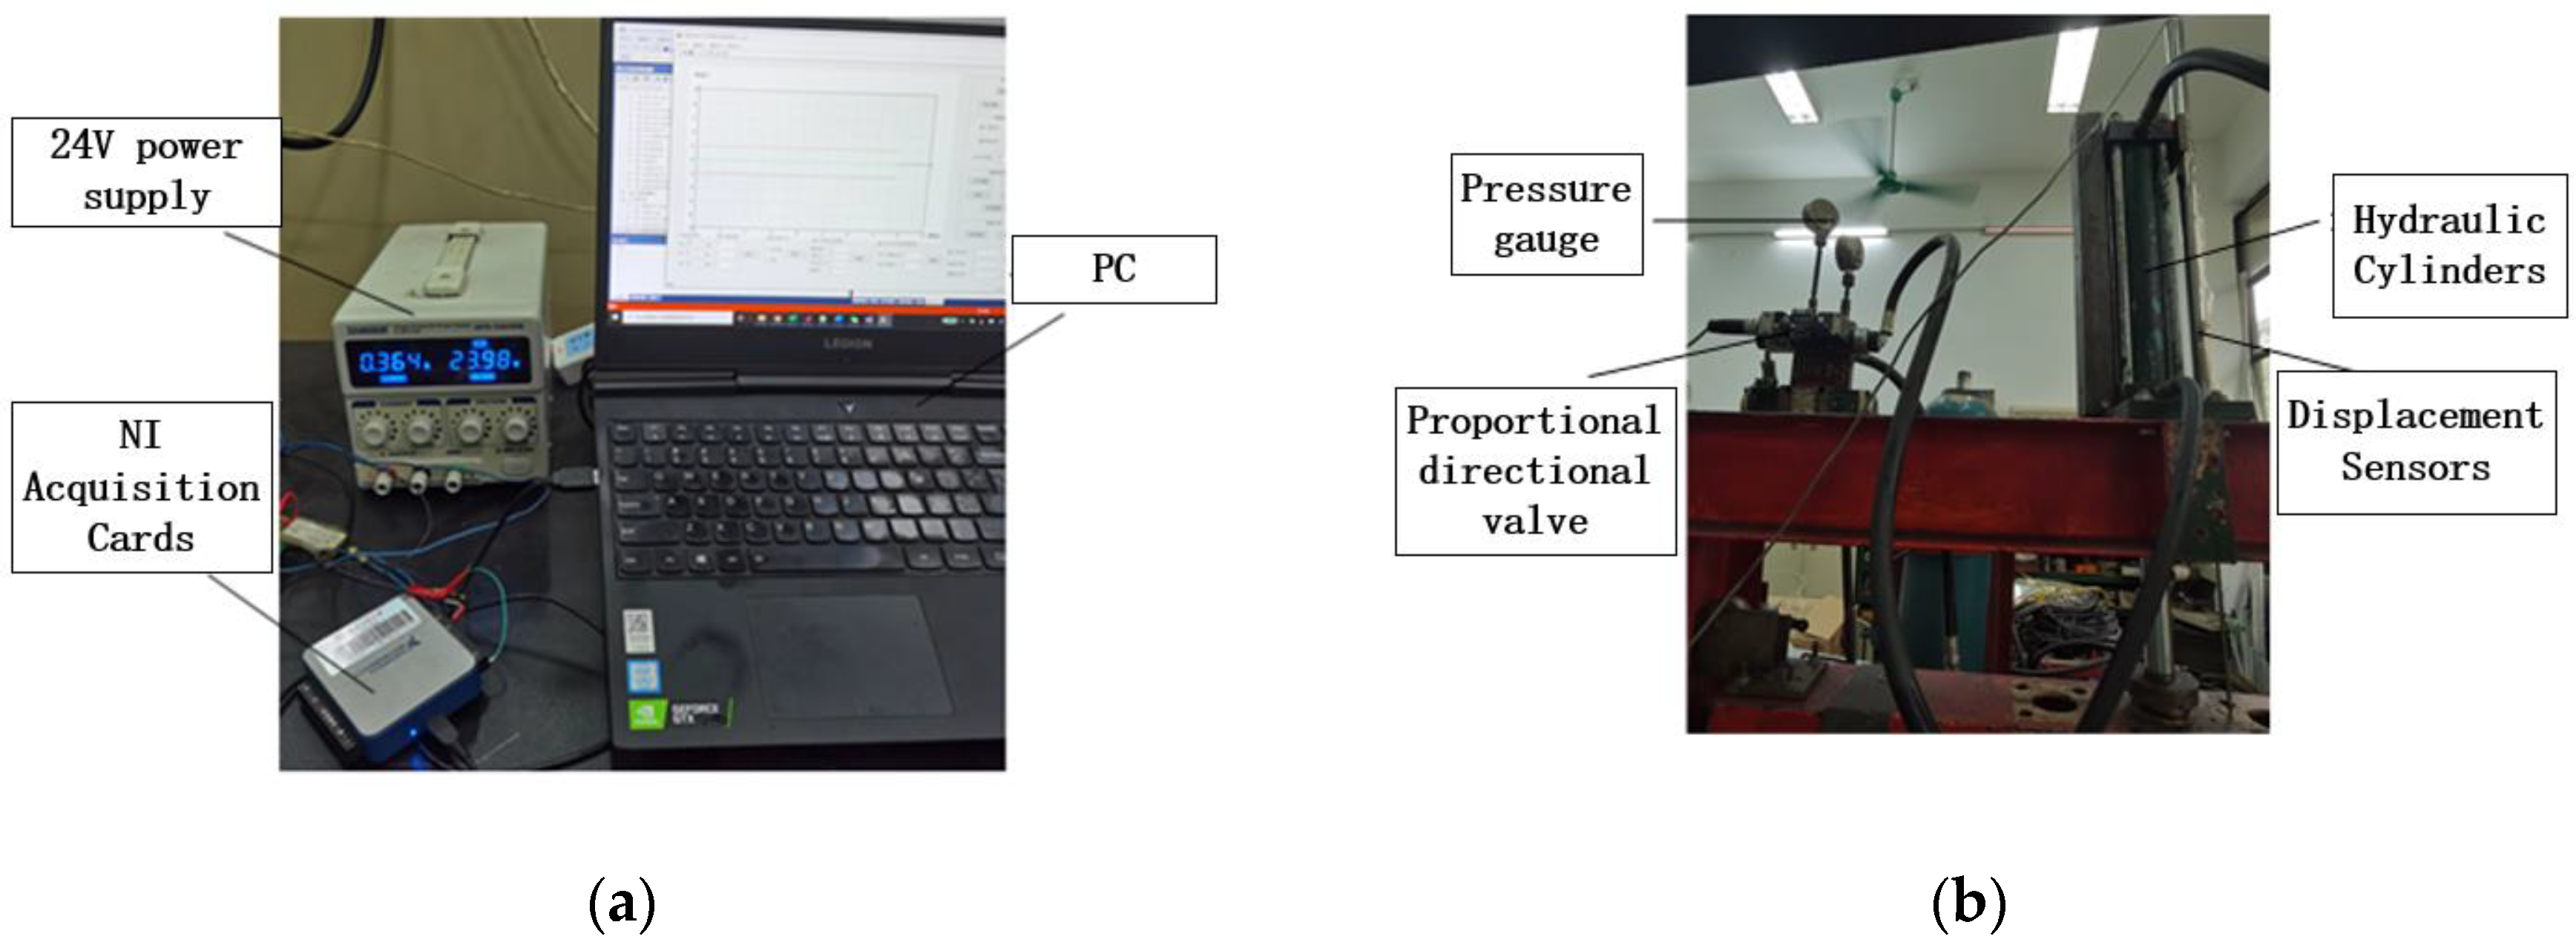
The system requires the collection of one A/D signal, which is the piston rod displacement signal, and one D/A signal output, which is the control signal for the proportional directional valve. Therefore, this experiment uses the existing NI USB-6002 data acquisition (DAQ) device (National Instruments, Austin, Texas, United States of America) in the laboratory for signal collection and output. This NI data acquisition card includes multiple single-ended analog input (AI) channels and analog output (AO) channels, which are sufficient to meet the requirements of this experiment. As shown in Figure 11, the hardware wiring diagram of this experiment is presented. The NI data acquisition card is connected to the personal computer via a high-speed Micro USB cable. A 24 V power supply is used to power the proportional valve, and a ±12 V power supply is used to power the displacement sensor. Figure 12 shows the physical setup of the experimental system.
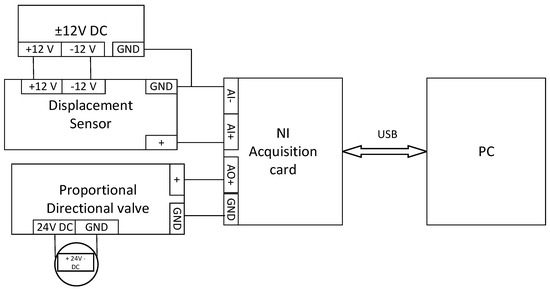
Figure 11.
Hardware diagram of valve-controlled hydraulic cylinder heave motion simulation system.
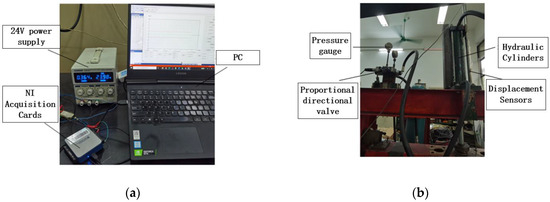
Figure 12.
Physical drawing of valve-controlled hydraulic cylinder heave motion simulation system, it should be listed as: (a) acquisition card, power supply and a PC; (b) hydraulic system.
2.3.3. Control System Components
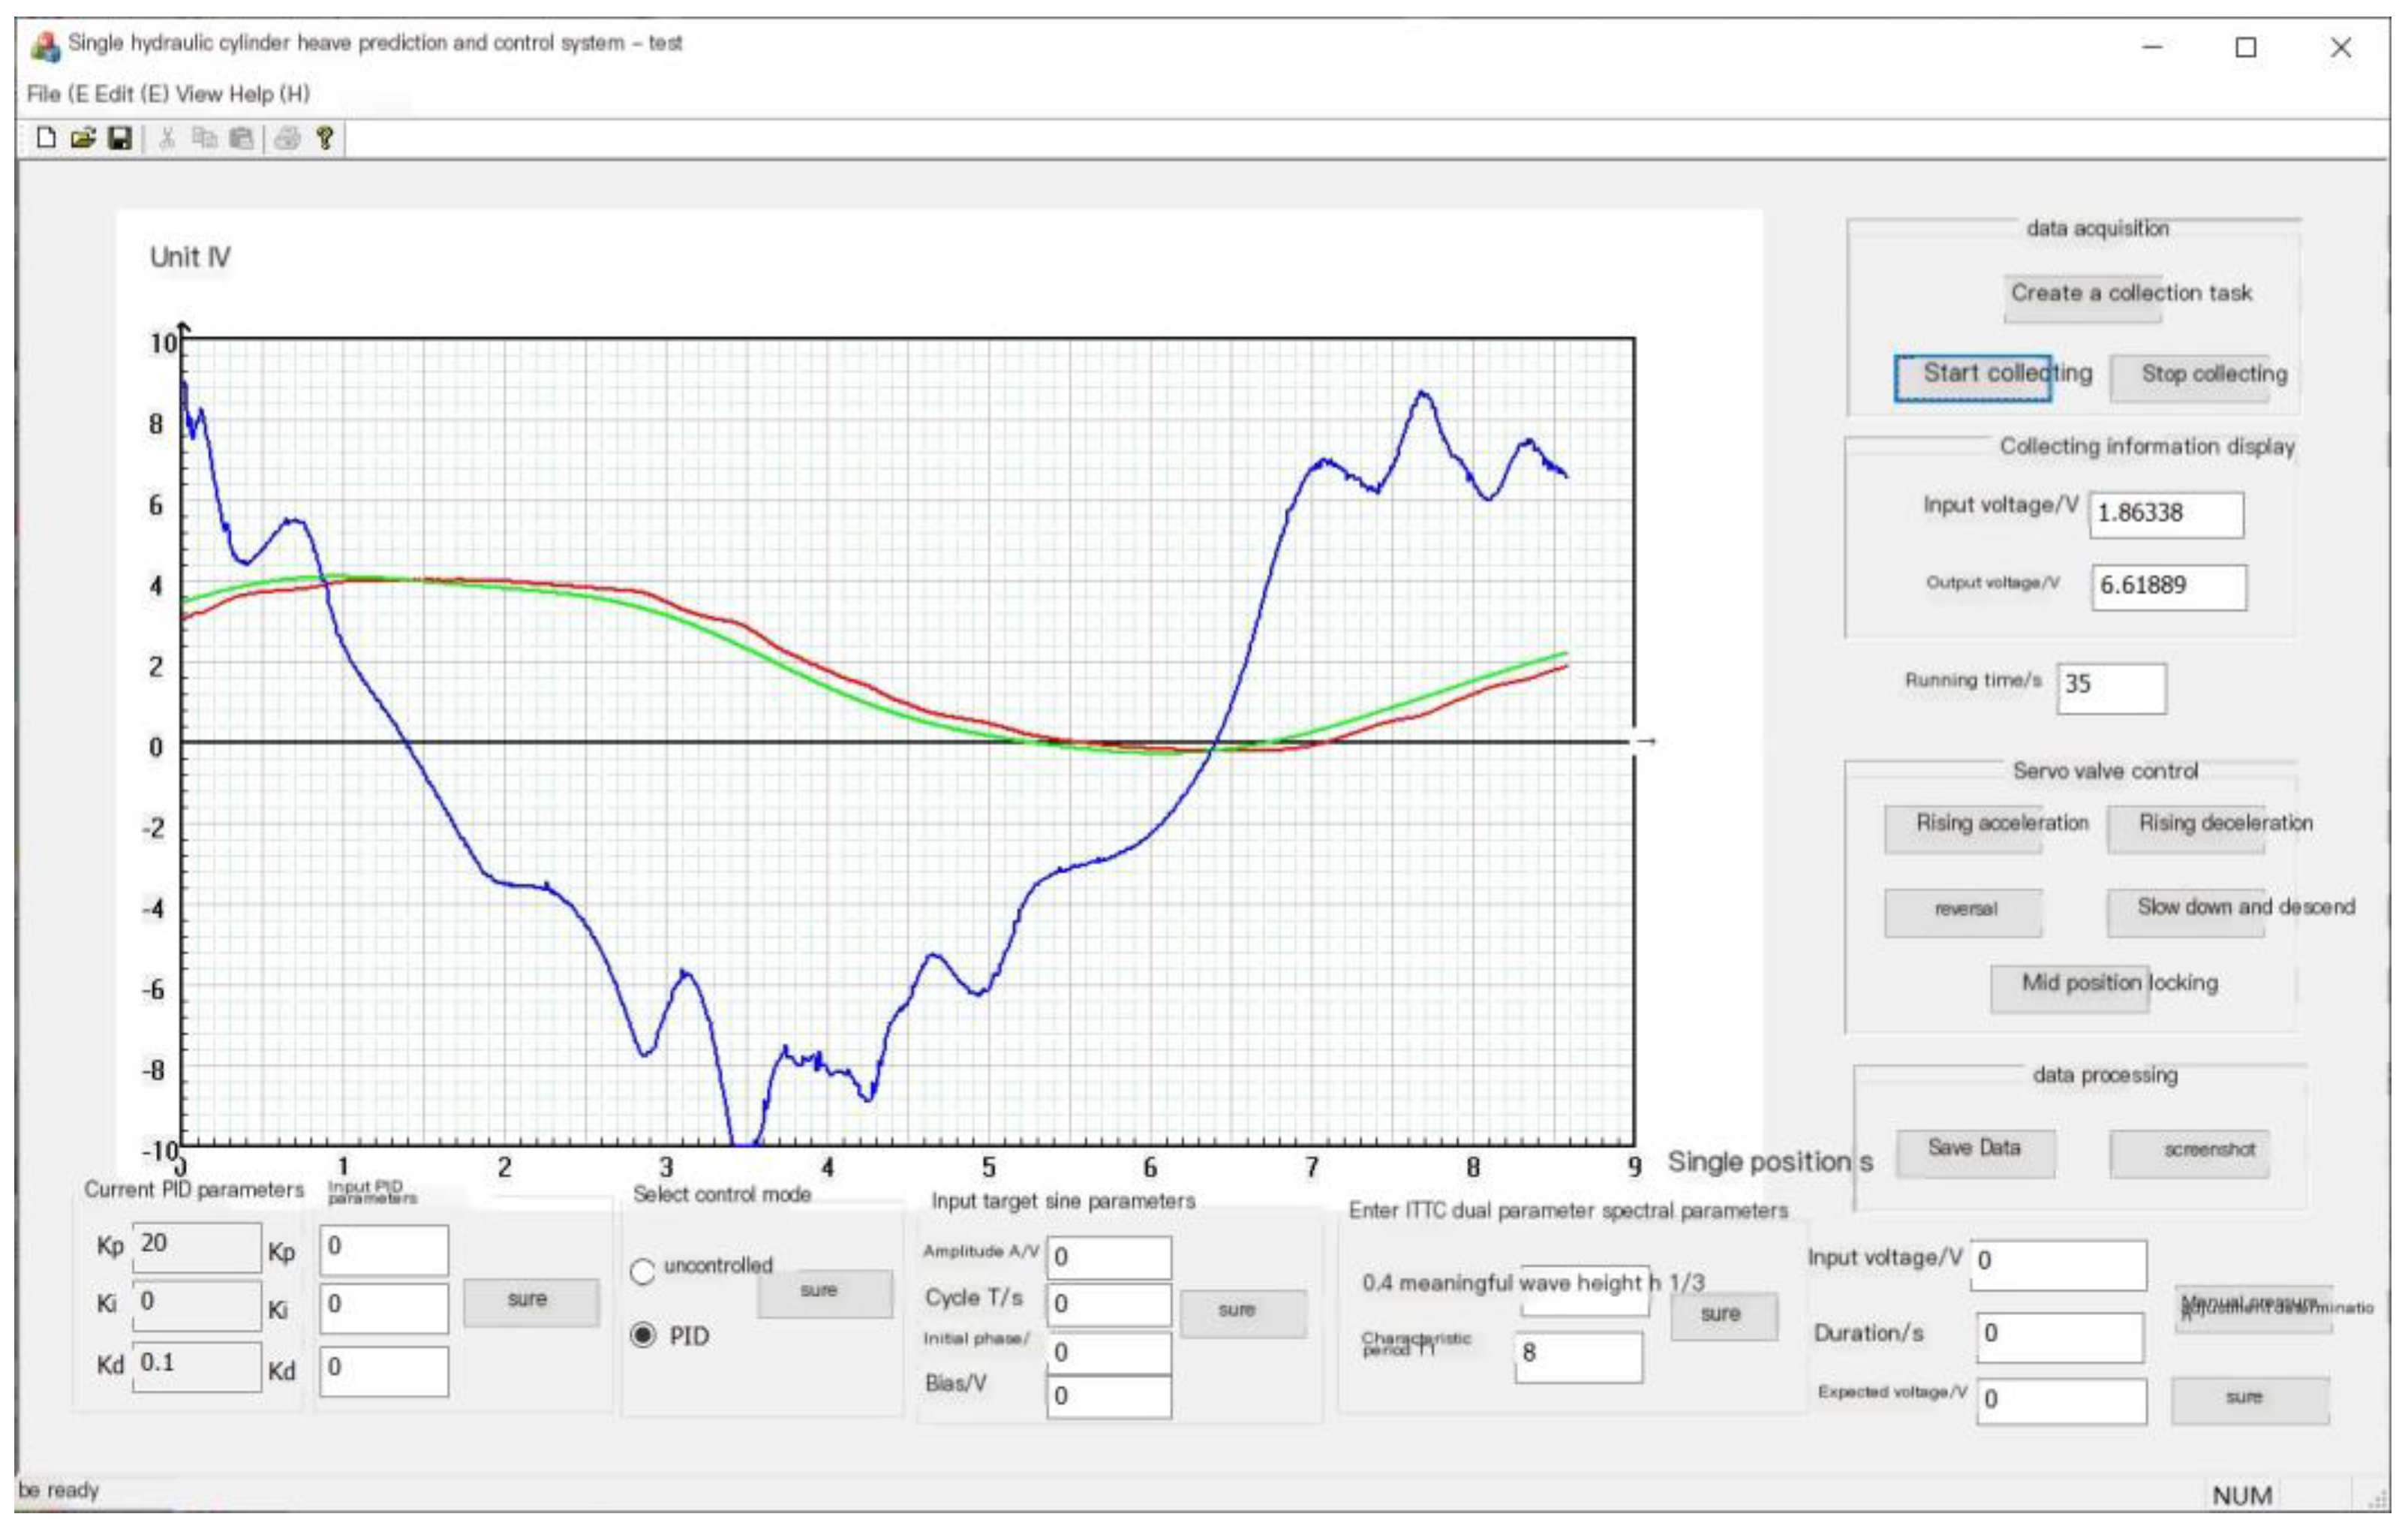
The control software is developed on a personal computer, written using MFC in the Visual Studio 2013 integrated environment on the Windows 10 system. Upon startup, its operation interface is shown in Figure 13. This control software can display the proportional directional valve-control output signal, the piston rod displacement input signal, and the desired signal in real time during the experiment. It provides multiple functional modules, including the adjustment of PID control parameters, generation of sine wave signals, and ITTC two-parameter spectrum random desired signals, and saves related data. Additionally, it can calculate the current velocity in real time based on the collected displacement values and perform predictions. After entering the parameters of the target sinusoidal curve in the software, the parameters of the ITTC dual-parameter spectrum and the PID parameters are entered, and the start acquisition button is clicked. The hydraulic cylinder will be able to track the target curve and display the ideal curve and the actual curve on the program interface.
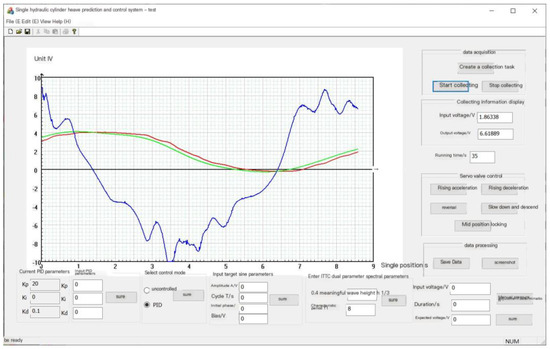
Figure 13.
Control software operation interface.
The control software needs to complete data collection, processing, and output at regular intervals. Theoretically, the smaller the time interval, the better. However, the limitations of the computer running speed and program execution time are also considered. This paper uses the multimedia timer function provided by MFC, namely the timeSetEvent() function, to implement the periodic call of the function in the program. This method can implement the periodic call of the execution function with a minimum of 1 ms. It has a higher timing accuracy and priority than the traditional SetTimer() function, and can better meet the requirements of real-time control. The timer period Ts = 10 ms in this system.
In this system, the velocity sensor is not used to obtain the heave speed. Instead, the heave speed needs to be calculated by the displacement change collected by the displacement sensor. The calculation formula is as follows:
In this formula, y(k) is the piston rod displacement at time k, y(k − 1) is the piston rod displacement at time k − 1, and v(k) is the piston rod velocity at time k. The timer period Ts remains unchanged, but during actual sampling, the acquisition card cannot guarantee that the interval between each displacement sensor input value remains unchanged at one timer period. Therefore, it is necessary to accurately obtain the time interval between each displacement value reading in order to accurately calculate the piston rod extension and retraction speed. The timing function clock() can solve this problem. The return value of this function records the time during which the program occupies the CPU from startup to the function call. Before each displacement value is read, the return value of clock() is obtained, and then the difference is made with the return value obtained last time, that is, the accurate time interval between the two displacement readings is obtained, and the piston rod extension and retraction speed is calculated based on this.
3. Results
Considering the limit telescopic displacement and velocity of the experimental hydraulic cylinder, it is impossible to fully simulate the heave motion of the floating platform under sea conditions of level 5, 6, and 7. Therefore, in this experiment, the ITTC two-parameter spectrum parameters with a significant wave height h1/3 of 0.4 m and a characteristic period T1 of 8 s are taken, as shown in Figure 14, which is the spectrum diagram of the sea wave and the floating platform. During the experiment, the expected heave displacement is generated in real time in the control software, and then the piston rod is made to track the expected heave displacement through PID control. The control software receives the heave displacement signal, obtains the current piston rod telescopic velocity after differentiation and filtering, and performs real-time velocity prediction.
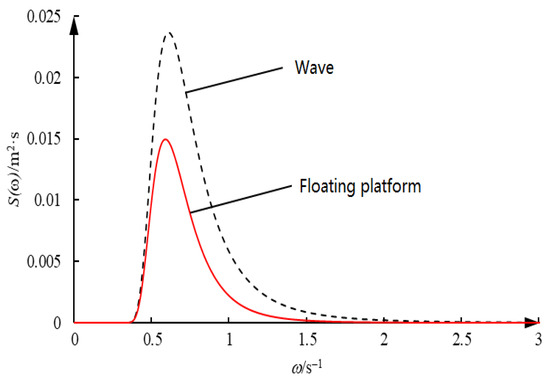
Figure 14.
Spectrum of waves and floating platforms.
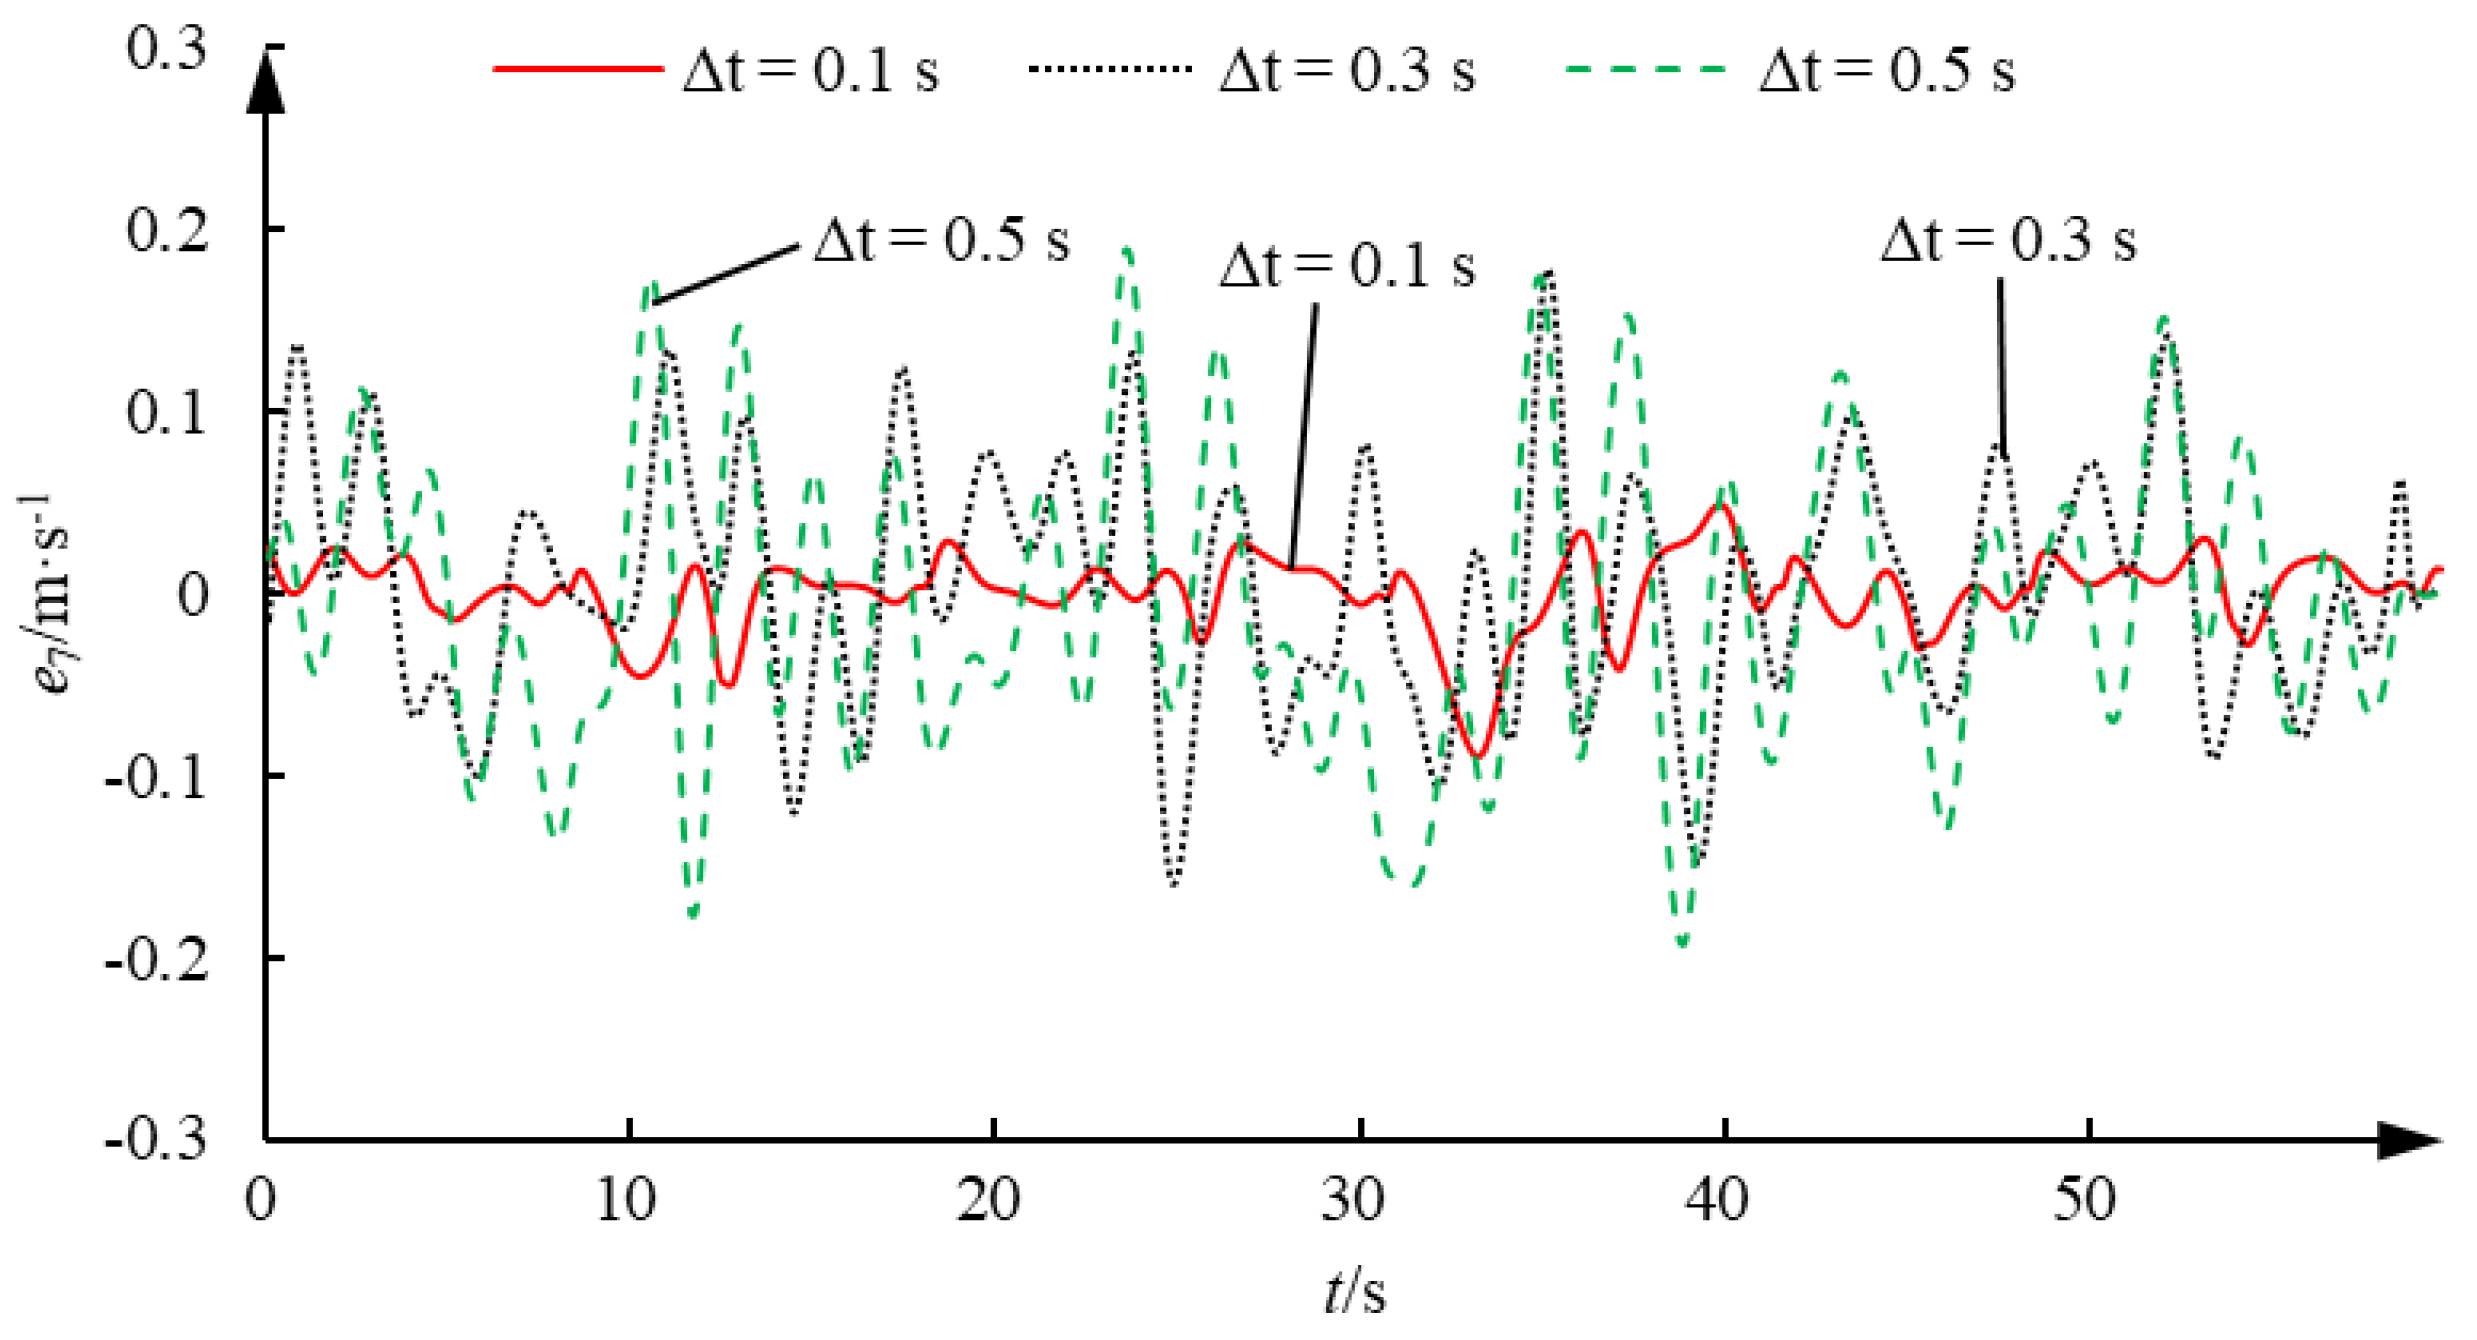
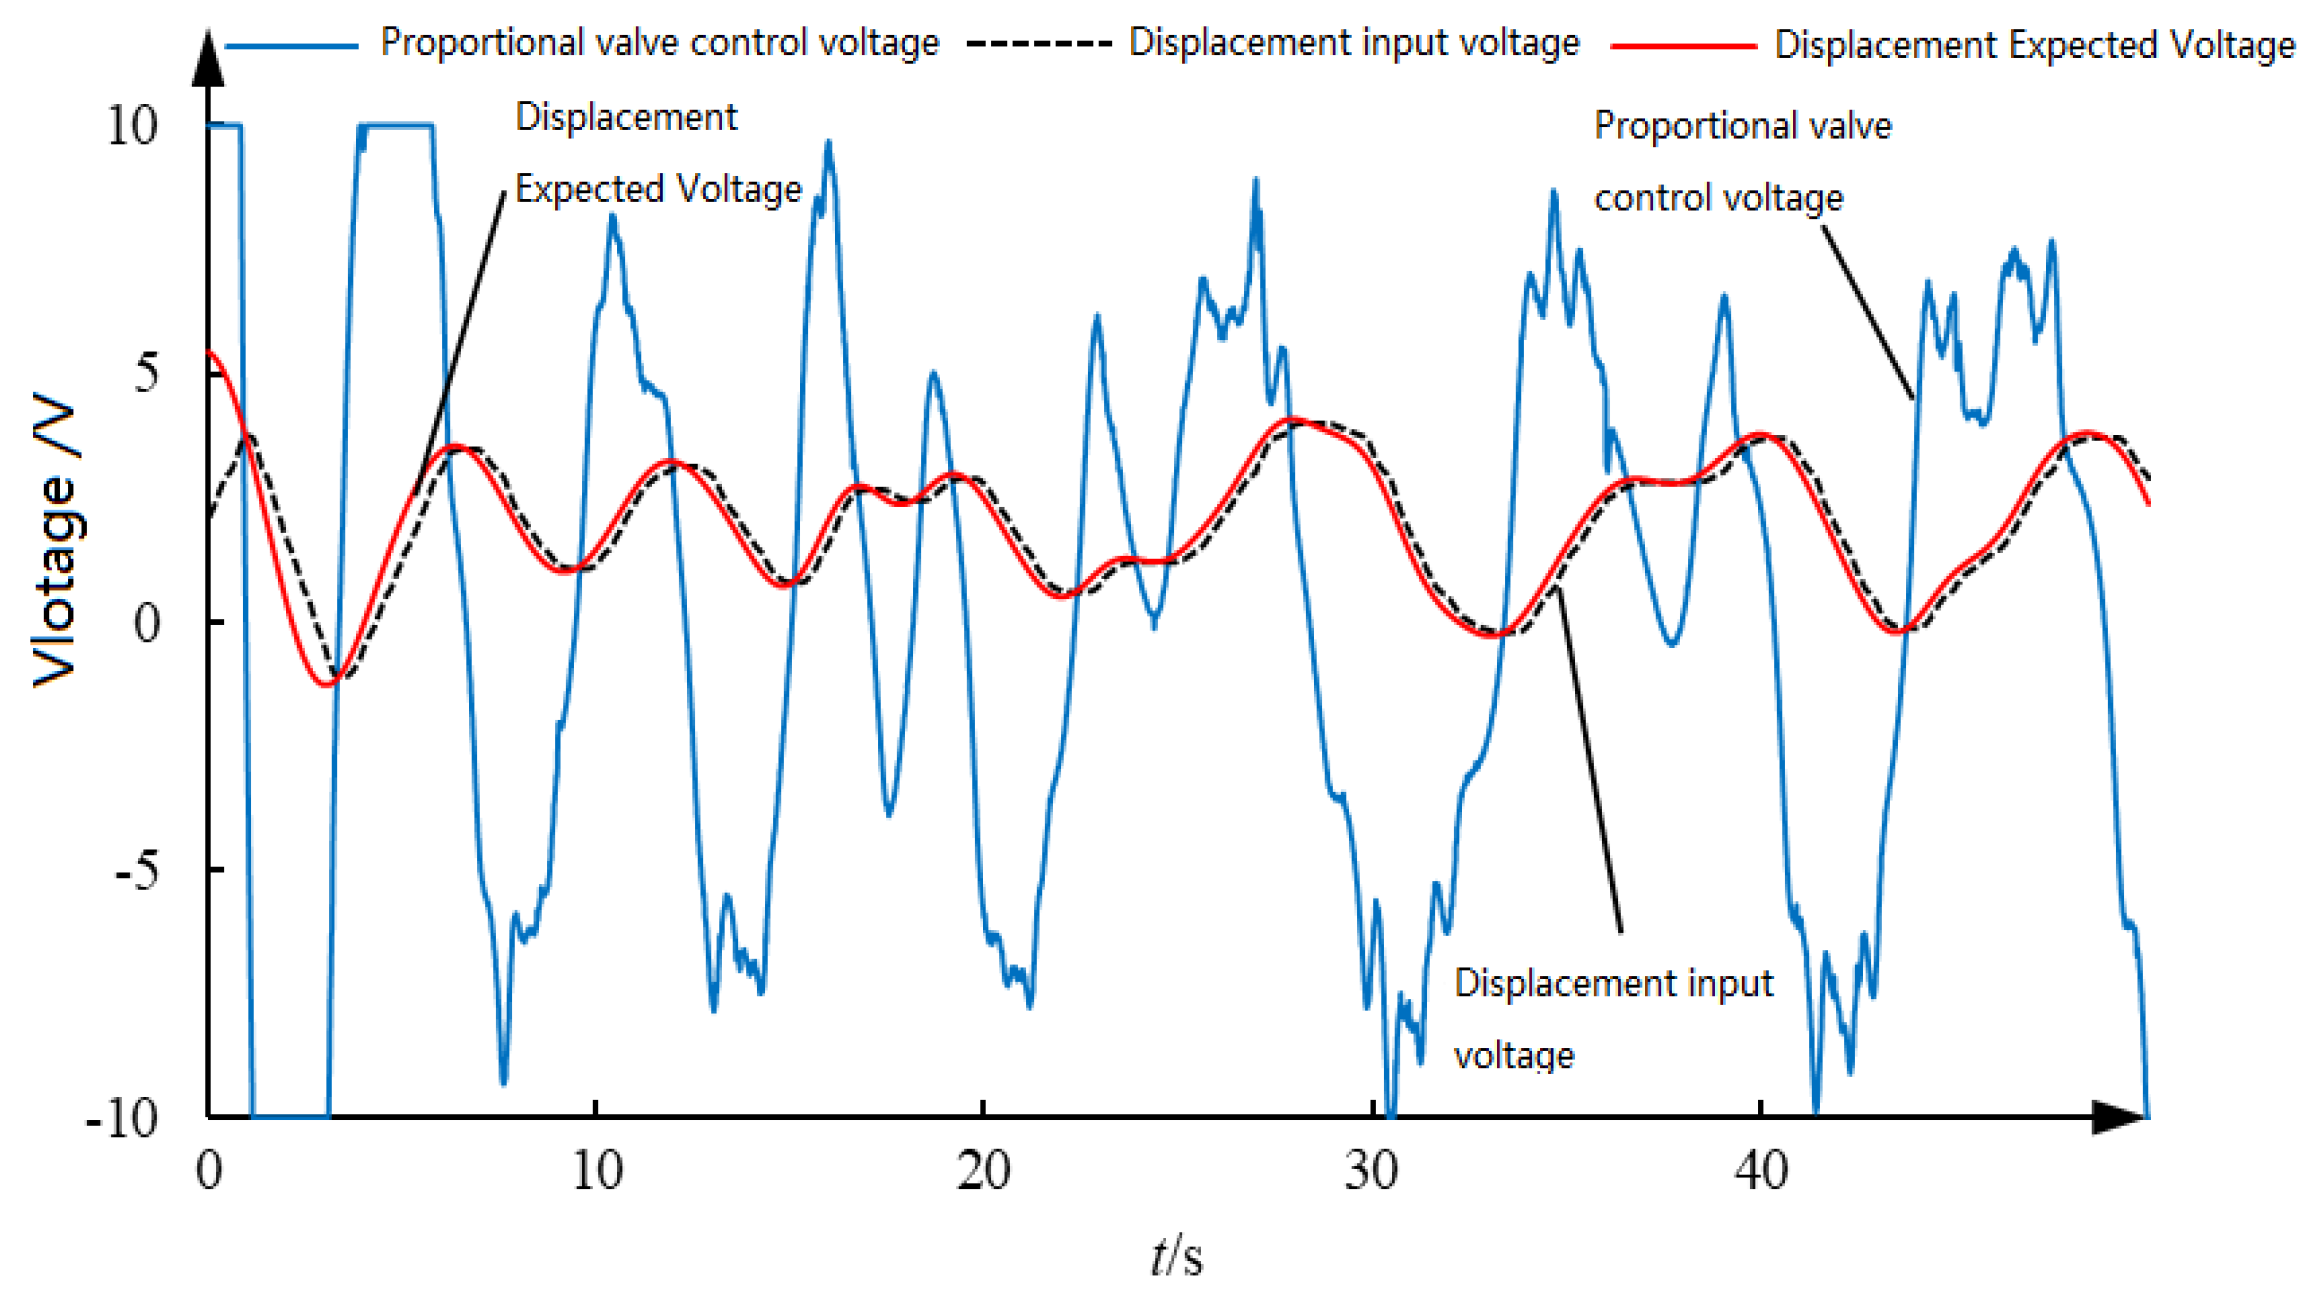
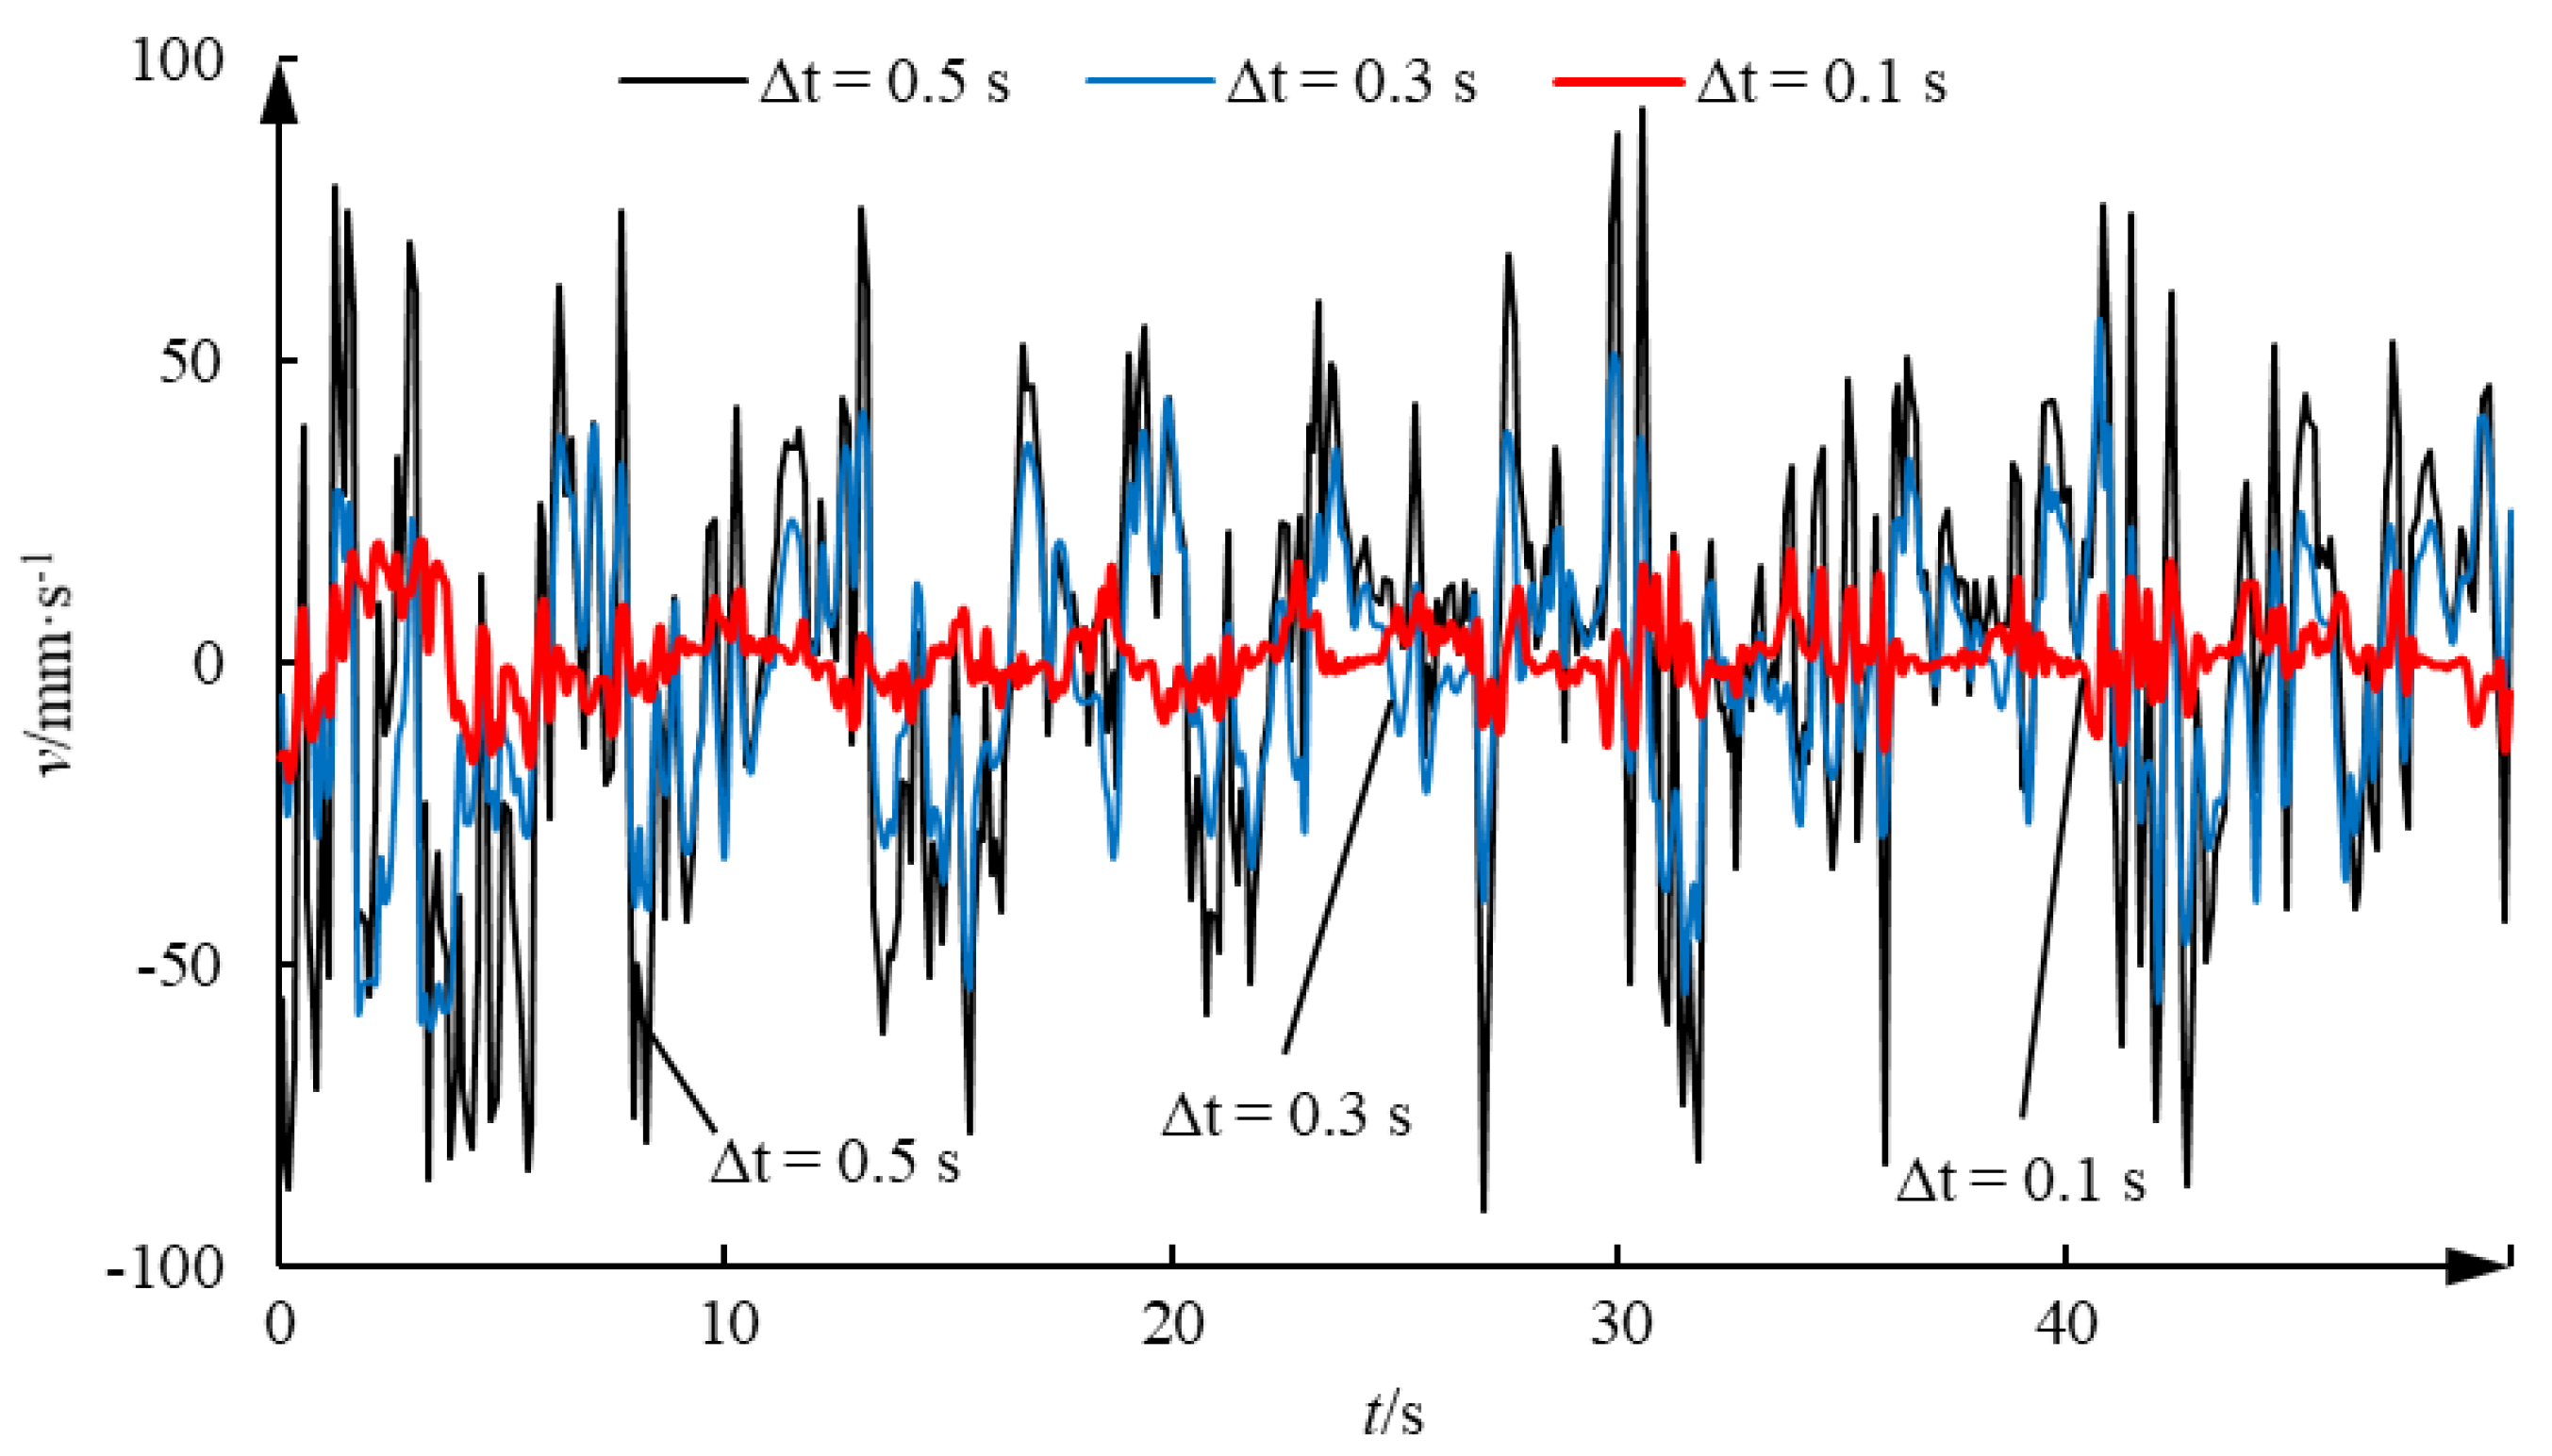
Figure 15 shows the proportional reversing valve-control voltage and displacement voltage signal curves, and Figure 16 shows the velocity prediction error curves of different prediction steps. From the experimental results, it can be seen that, limited by the piston rod’s maximum extension and retraction velocity and displacement, the heave motion of the floating platform can be simulated in the majority of cases, with only a few scenarios unable to track the target curve effectively. Despite performing operations like low-pass filtering, the obtained piston rod extension and retraction velocity still exhibit some jitter, and in some instances, the velocity even exceeds the actual maximum achievable velocity of the piston rod. This could be due to errors and jitter in the displacement sensor input, which significantly affects the stability of the prediction algorithm. As can be seen from the figure, prediction accuracy is related to the prediction step size, which is consistent with the simulation results. When the prediction step size is 0.1 s, the piston rod velocity prediction error remains within ±10 mm/s, with the maximum error not exceeding 20 mm/s. When the prediction step size is 0.3 s, the maximum prediction error for the piston rod velocity does not exceed 50 mm/s. When the prediction step size is 0.5 s, the local maximum prediction error for the piston rod velocity approaches 100 mm/s. Overall, except for some larger local prediction errors, the time-series-based wavelet neural network velocity prediction method can effectively predict the heave motion velocity of the floating platform.
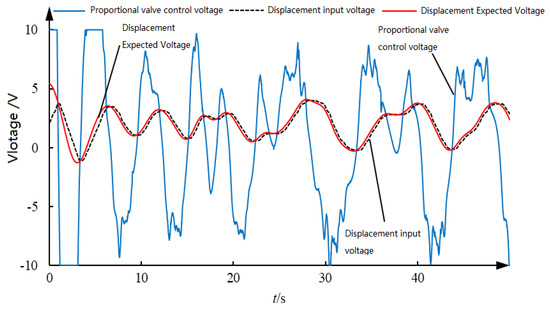
Figure 15.
Proportional valve-control voltage and displacement voltage signal curves.
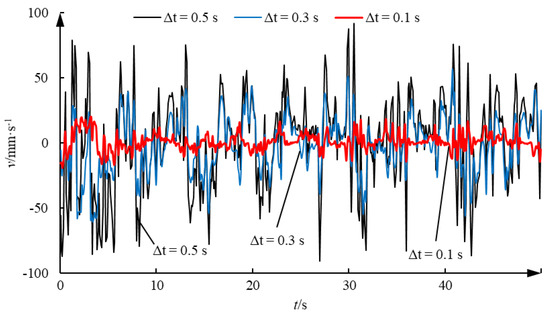
Figure 16.
Velocity prediction error curves with different prediction steps.
After verifying that the wavelet neural network speed prediction method based on time series can effectively predict the heave velocity of the floating platform, the compensation performance of the system is tested and verified using the winch-type heave compensation simulation test bench built by the research team. As shown in Figure 17, the laboratory winch-type heave compensation simulation test bench is used. The lower platform, integrated block, variable pump, and servo motor of the six-degree-of-freedom platform are fixed on the bottom plate, and the hydraulic motor, reducer, winch, etc. are fixed on the upper platform of the six-degree-of-freedom platform and will move with the platform. The necessary components such as the electromagnetic ball valve, hydraulically controlled one-way valve, overflow valve, etc. are integrated on the integrated block. In addition, there are speed encoders, grating displacement sensors, tension sensors, pressure sensors, etc. for detecting the operating status of the equipment.
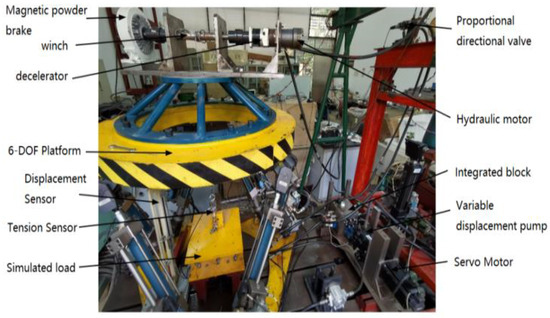
Figure 17.
Laboratory winch type heave compensation simulation test bench.
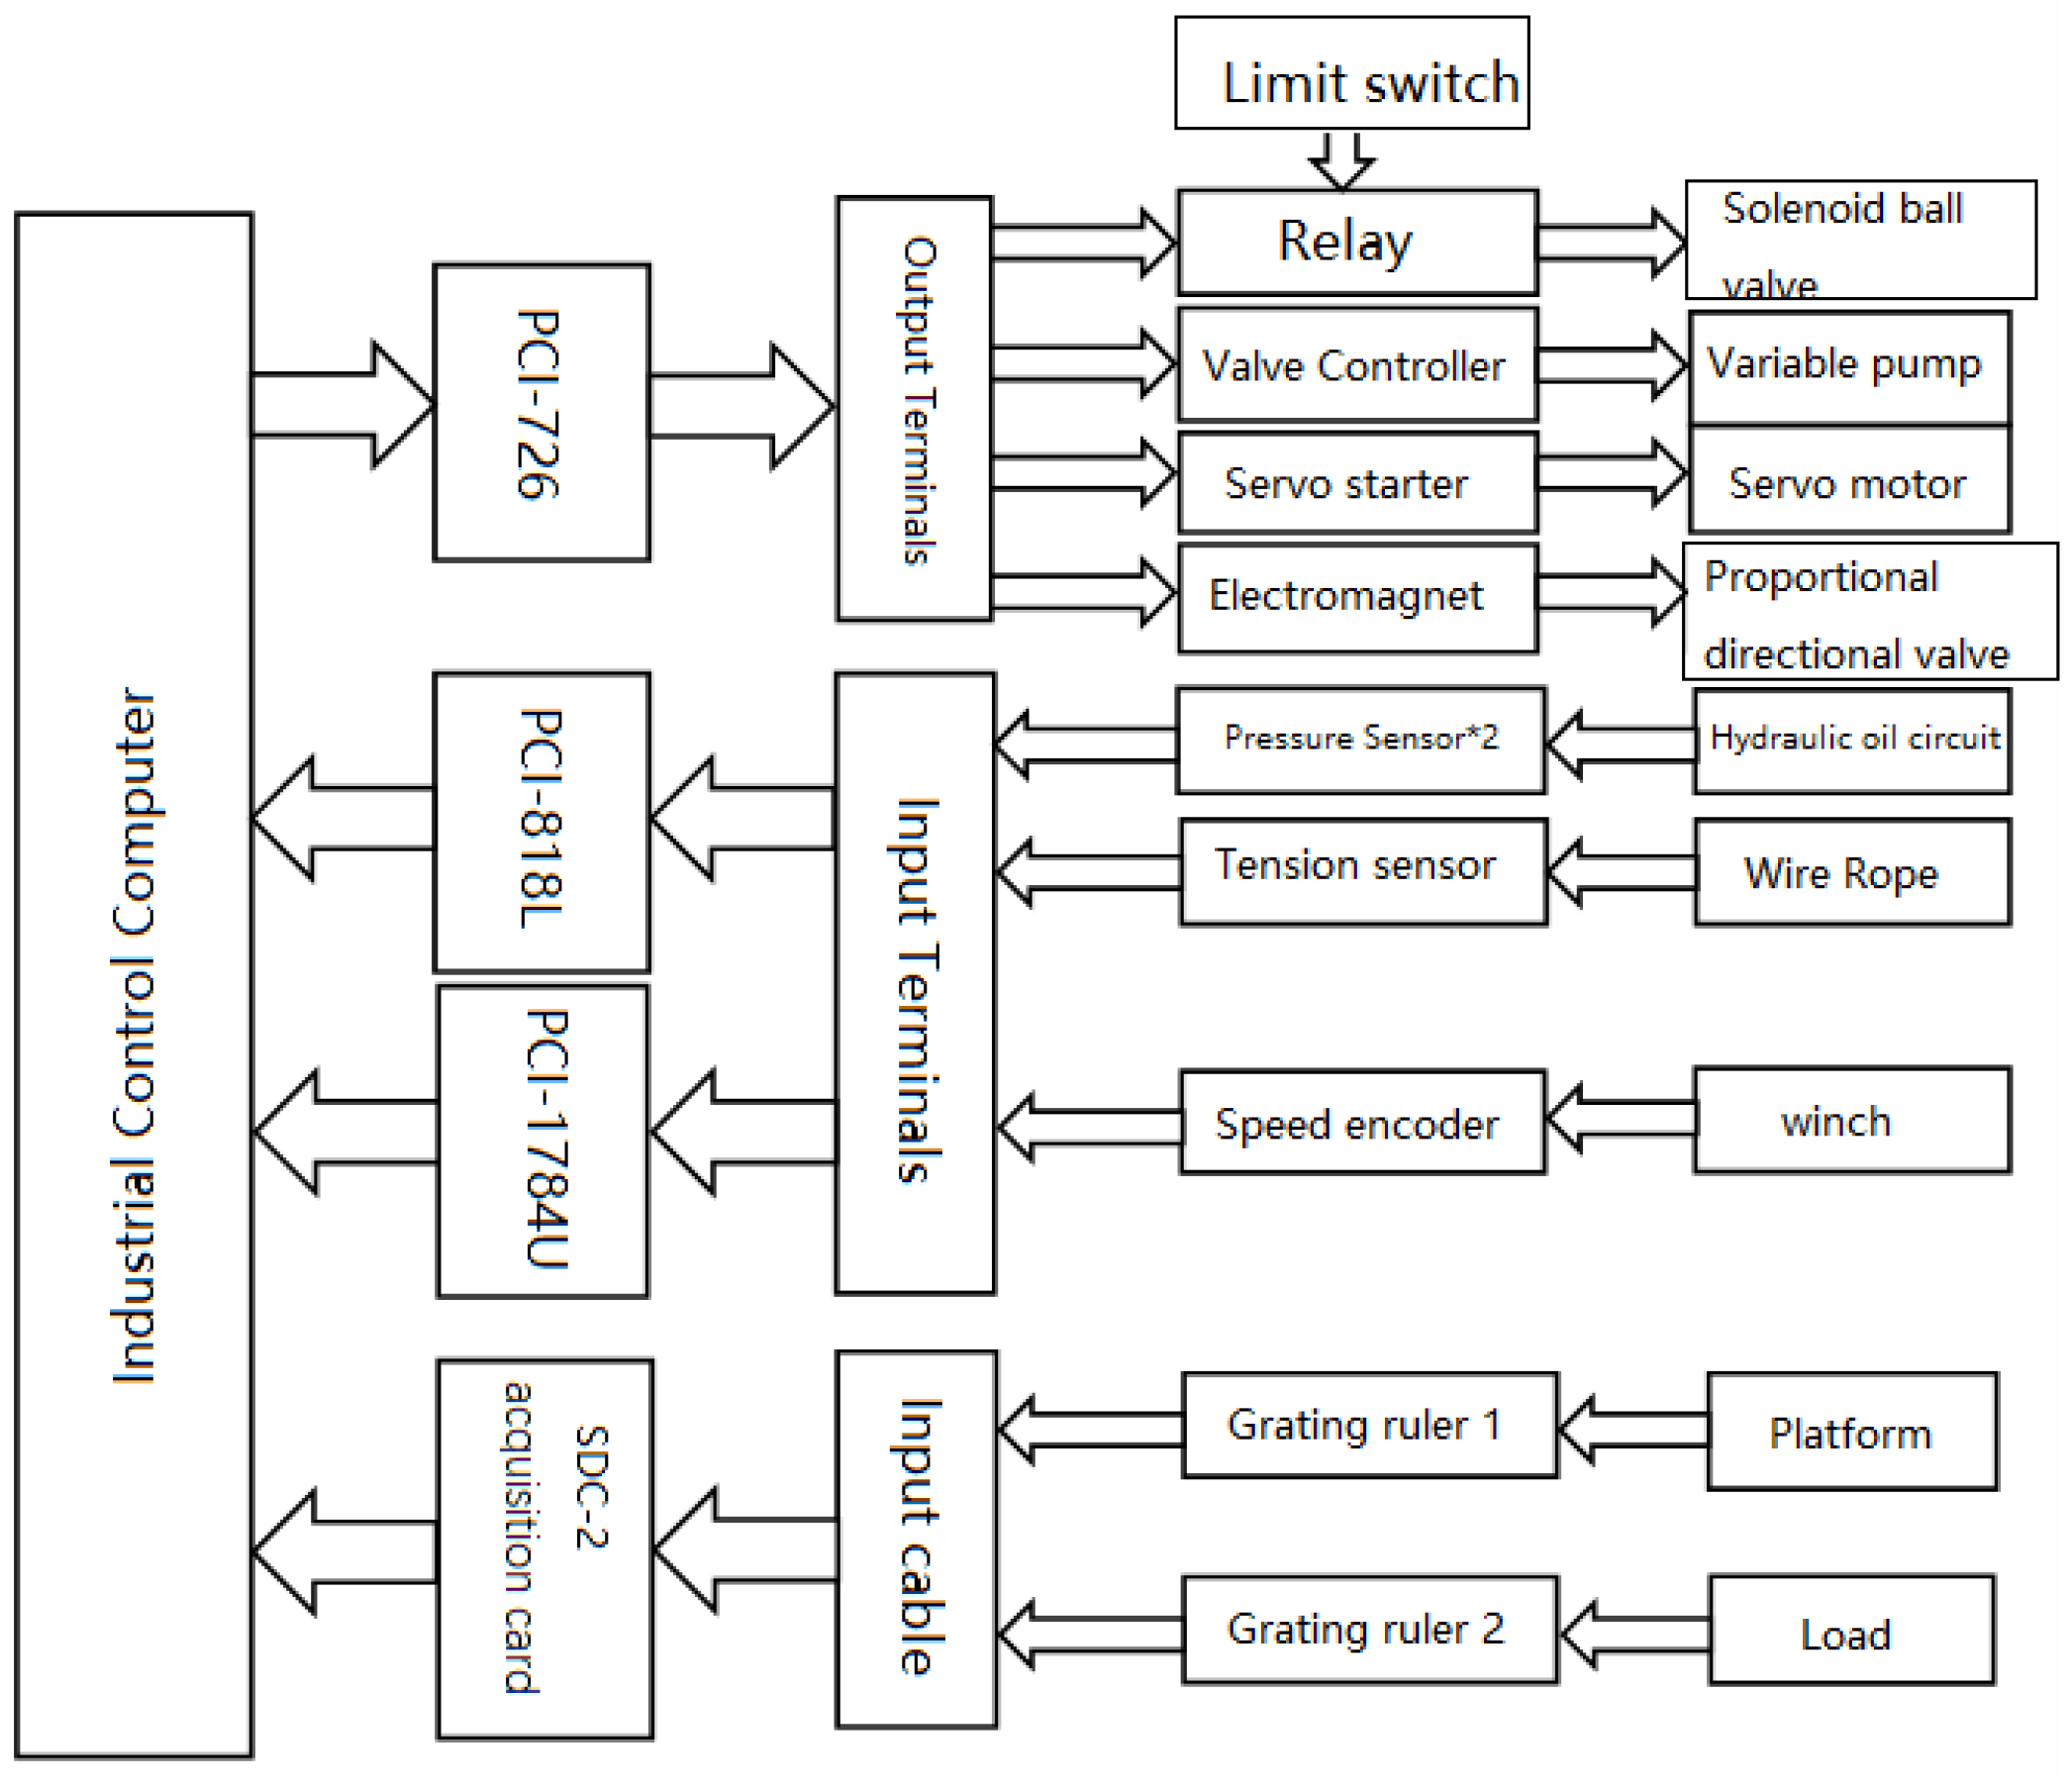
As shown in Figure 18, the hardware system diagram of the heave compensation simulation test bench is shown. The industrial control computer receives a total of six signals, including the platform, load heave displacement, winch speed, oil circuit pressure, and wire rope tension, through the acquisition card and counting card, and outputs a total of four D/A voltage signals, including relay, variable pump displacement, servo motor speed, and proportional reversing valve, in real time. The industrial control computer is the core of the system, and the real-time acquisition, calculation, and output of all signals are completed here. The control software only needs to add the signal acquisition function. The signal acquisition is carried out using the encapsulation function of the acquisition card.
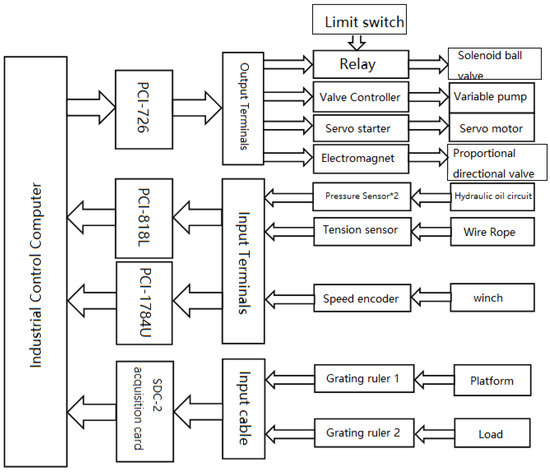
Figure 18.
Heave compensation simulation test bench hardware system.
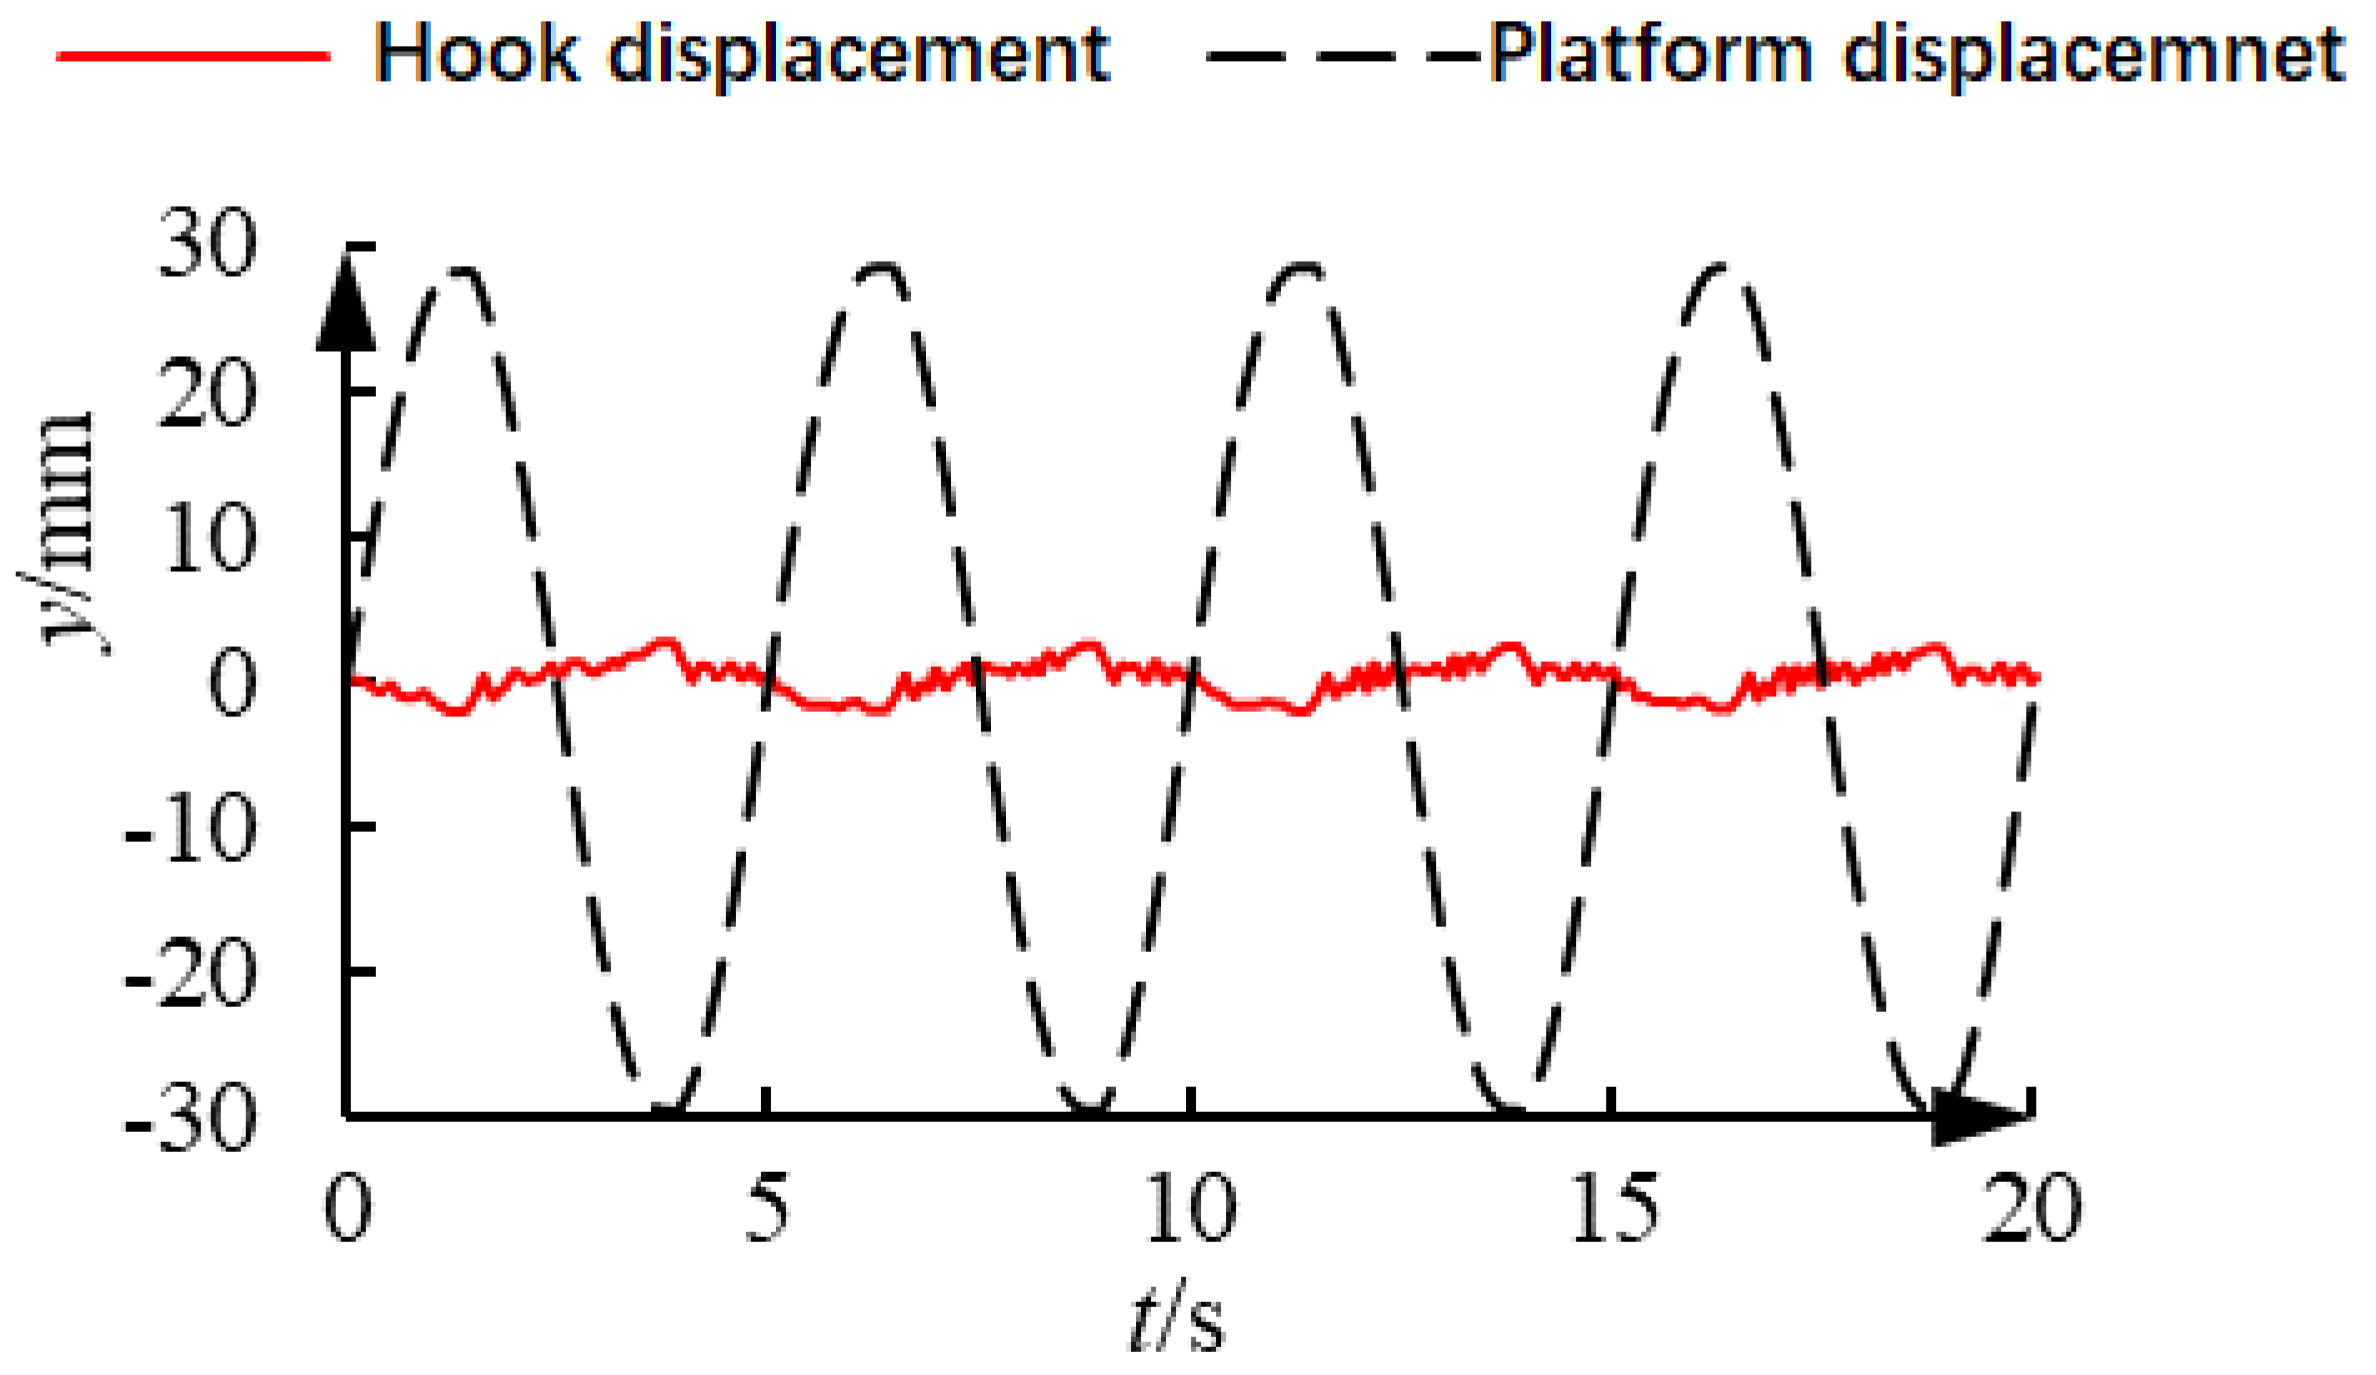
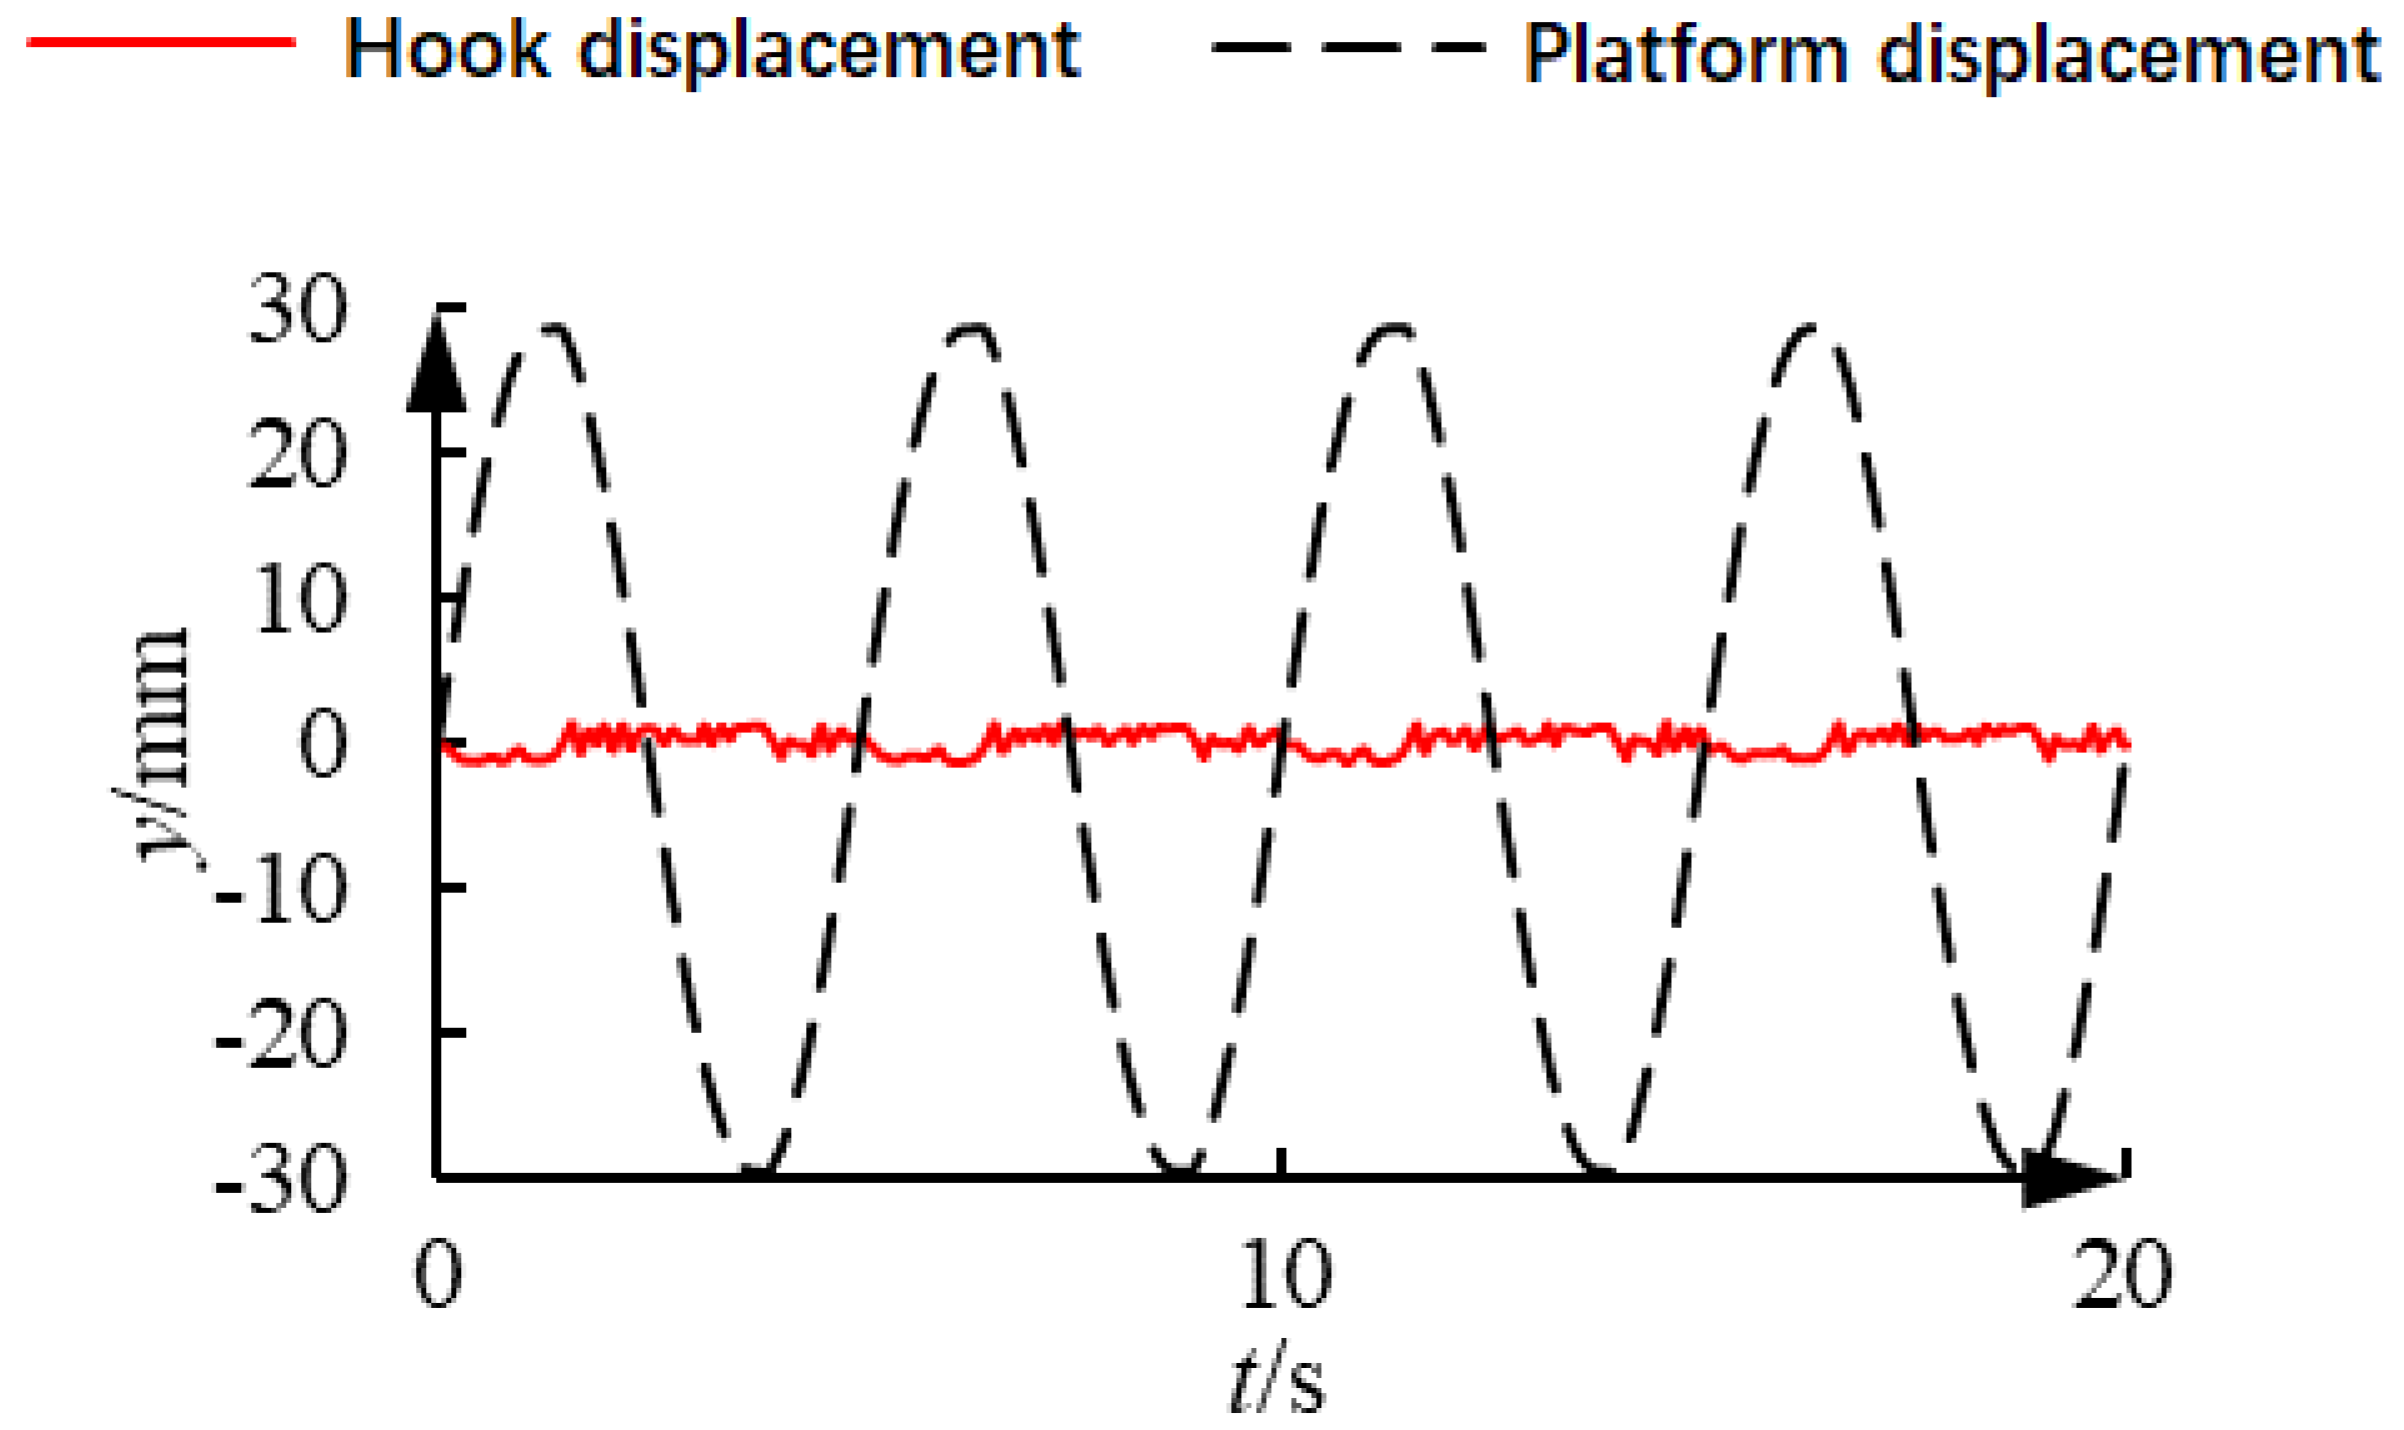
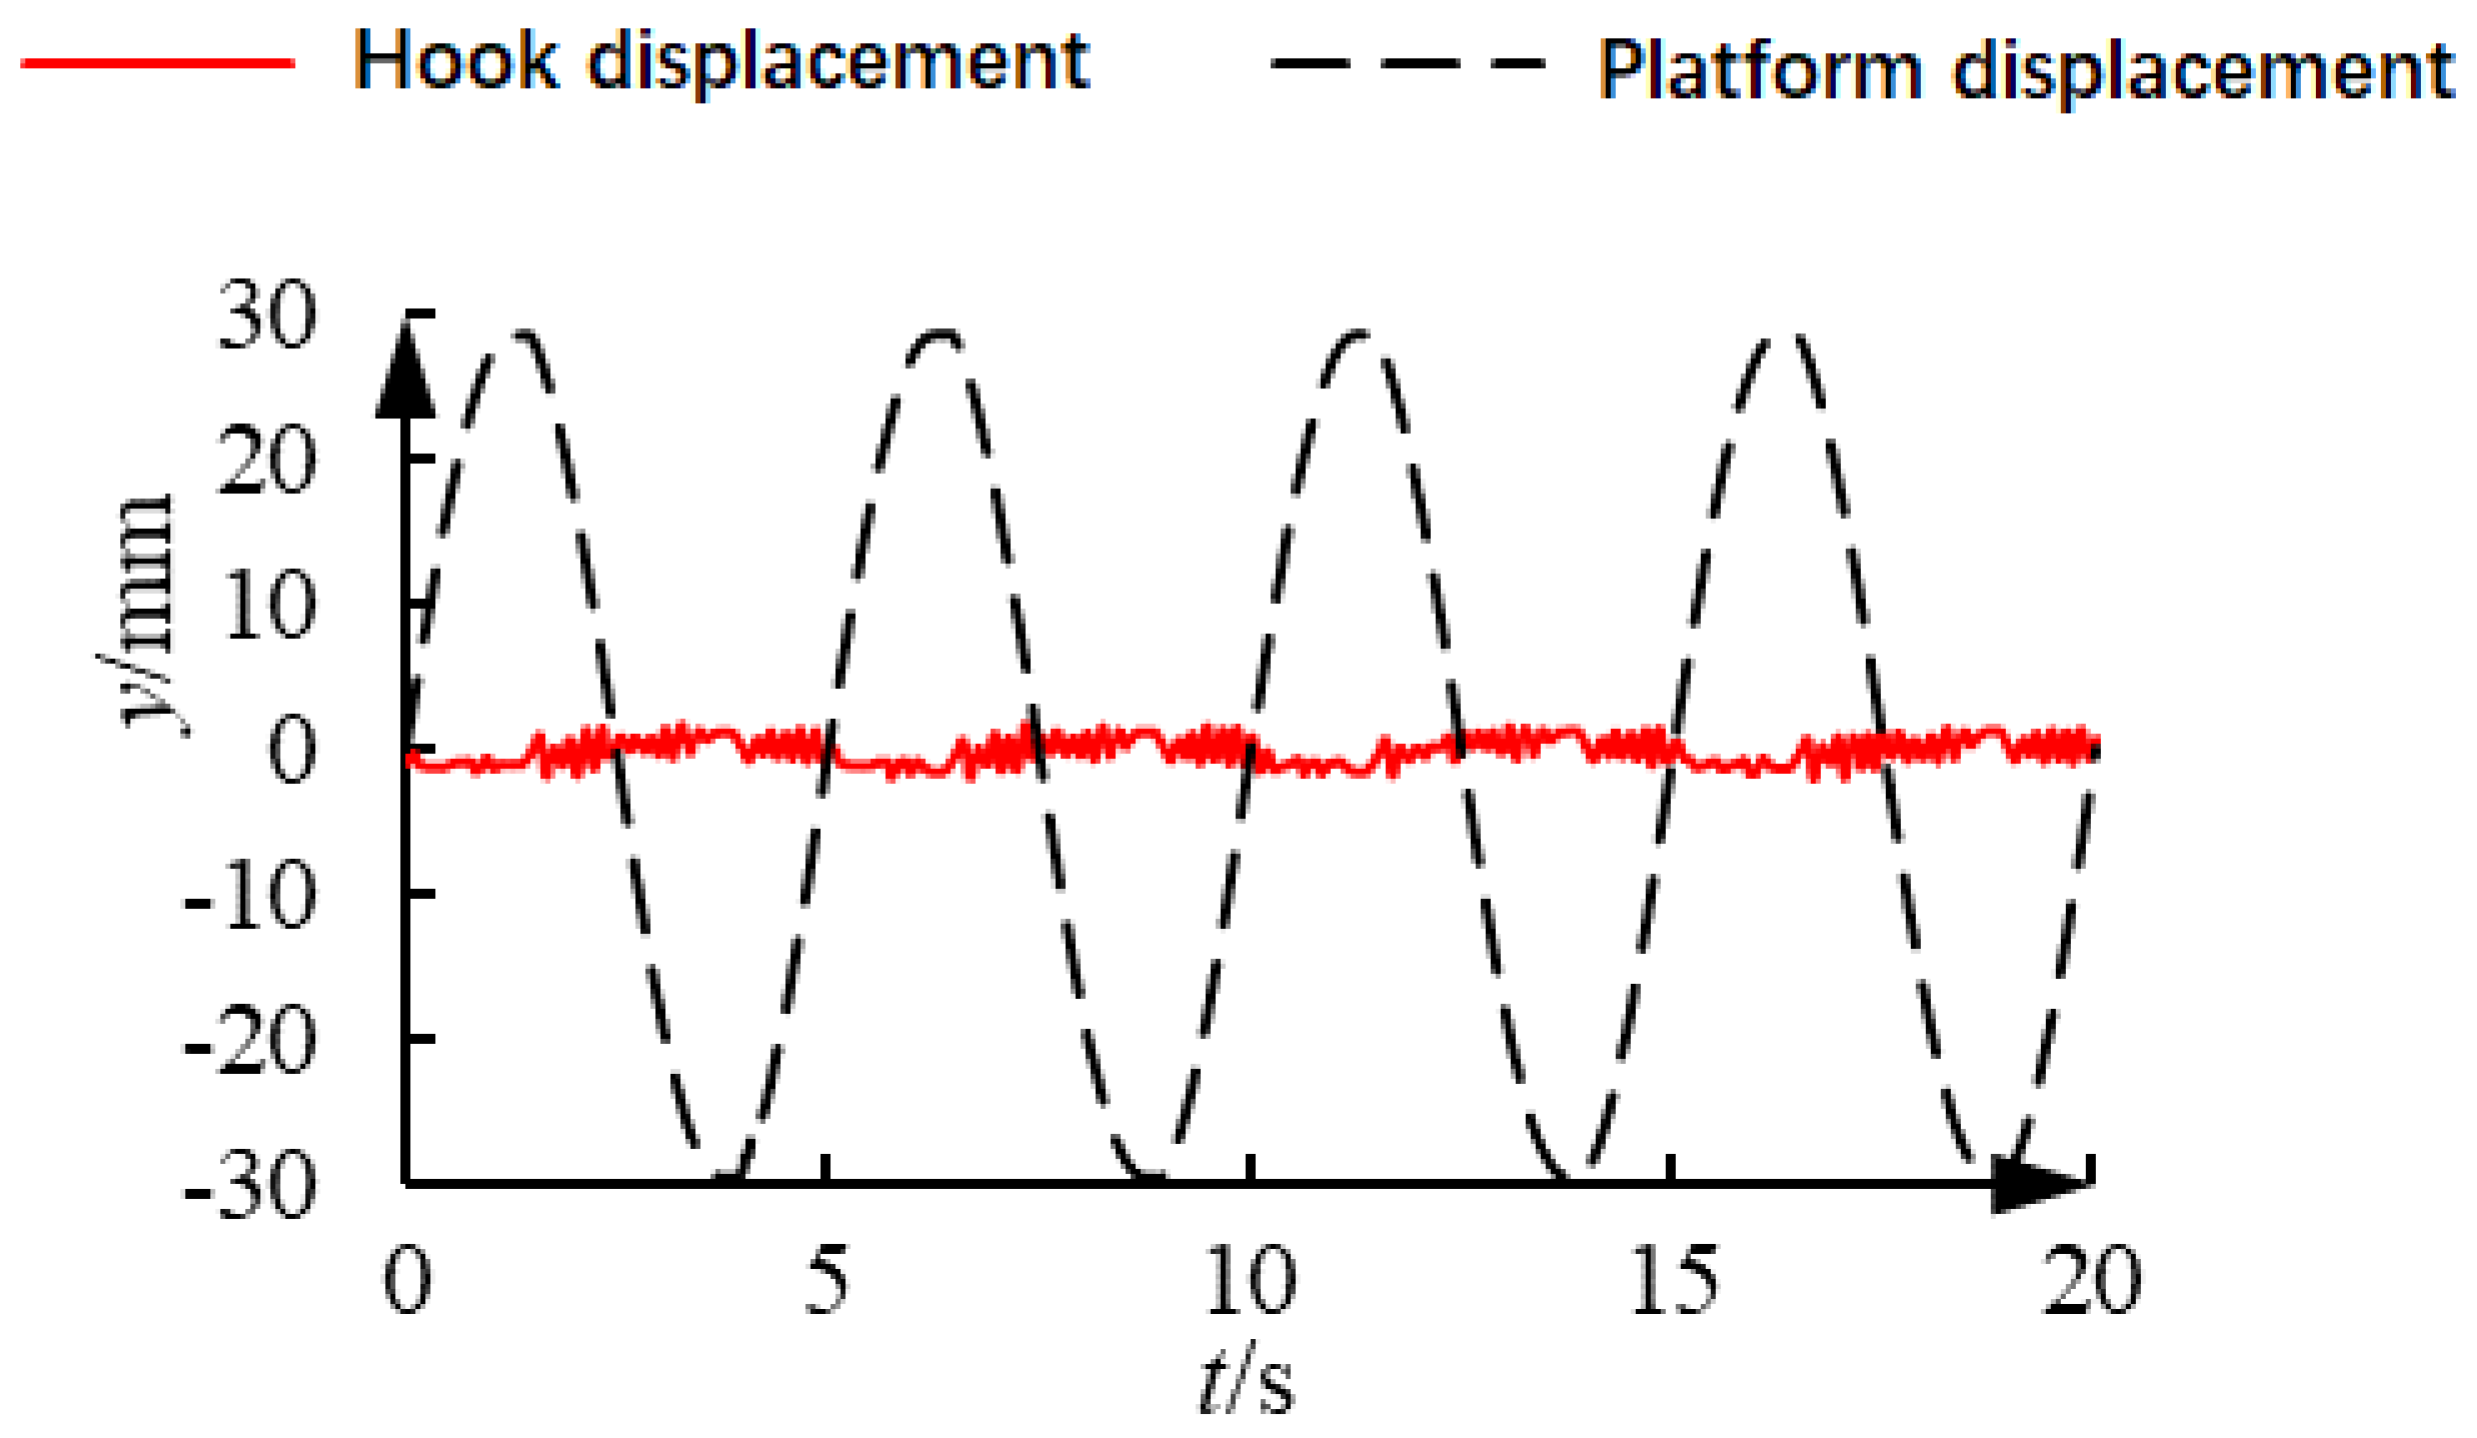
In the heave compensation experiment, the six-degree-of-freedom platform was uniformly subjected to sinusoidal heave motion with an amplitude of 30 mm and a period of 5 s, and multiple groups of experiments were carried out. After the end, the data were sorted and plotted. In Figure 19, the compensation curve of the simulation test bench when there is no prediction is shown. It can be seen from the figure that when there is no prediction, the experimental curve jitters lightly, and the maximum deviation of the approximate position in the experiment is 2.1 mm. In Figure 20, the compensation curve of the simulation test bench when the prediction step is 0.1 s is shown; it can be seen from the figure that the introduction of the prediction method aggravates the jitter of the large hook displacement curve, but the maximum deviation of the large hook position in the experiment is slightly reduced. The maximum deviation of the large hook position in the experiment is 1.7 mm. In Figure 21, the compensation curve of the simulation test bench when the prediction compensation is 0.2 s is shown; as the prediction step increases, the large hook displacement curve in the experiment continues to aggravate the jitter, and the compensation performance becomes worse. The maximum deviation of the large hook position in the experiment is 2.6 mm. When the prediction step is 0.1 s, the compensation accuracy is improved by 19% compared with the case without velocity prediction. After calculation, the RMSE of the load displacement when the prediction is not added is 0.7881, the RMSE of the load displacement when the prediction step is 0.1 s is 0.7702, and the RMSE of the load displacement when the prediction step is 0.2 s is 0.8165. The MAE of load displacement when the prediction is not added is 0.6925, the MAE of load displacement when the prediction step is 0.1 s is 0.6863, and the MAE of load displacement when the prediction step is 0.2 s is 0.7058.
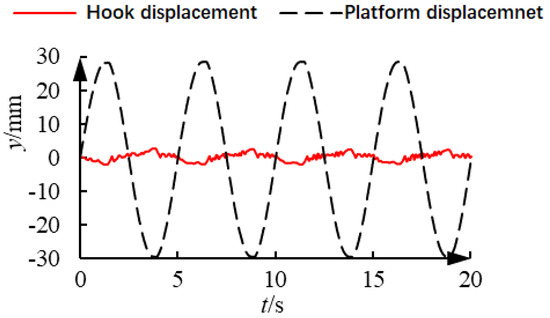
Figure 19.
Compensation curve of the simulation test bench when there is no prediction.
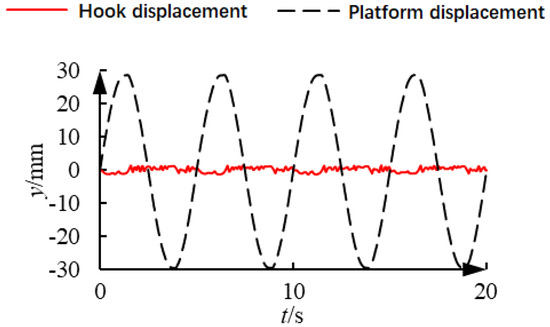
Figure 20.
Compensation curve of the simulation test bench when the prediction step is 0.1 s.

Figure 21.
Compensation curve of the simulation test bench when the prediction step is 0.2 s.
4. Discussion
This paper presents further research on heave compensation winches. First, based on wave spectrum theory and the relationship between sea waves and platform heave motion, offline learning data for sea waves and floating platform heave motion were generated through simulations under sea conditions of level 5, level 6, and level 7 over a period of time. Next, a time-series-based wavelet neural network velocity prediction method was used to predict the heave motion velocity of the platform. Finally, a valve-controlled hydraulic cylinder heave motion simulation system was set up in the laboratory for experimental research. The experimental results show that the hydraulic cylinder can effectively simulate the heave motion of the floating platform, and the time-series-based wavelet neural network prediction method is generally effective. However, as the prediction step size increases, the prediction accuracy decreases.
After verifying that the wavelet neural network velocity prediction method based on time series can effectively predict the speed, the compensation performance of the system was tested and verified using the winch-type heave compensation simulation test bench built in the laboratory. The experiment found that the introduction of the prediction method can improve the compensation performance, but as the prediction step length increases, the compensation performance may deteriorate. However, the movement of the platform in actual sea conditions is also composed of sinusoidal signals with different frequency components. The amplitude and frequency of the sinusoidal signal in this experiment are also consistent with the actual wave conditions; so, we believe that this experiment can represent the actual working conditions under certain circumstances, but the accuracy of the prediction model can be further improved.
The research in this paper further improves the control accuracy of the winch-type heave compensation system. As for the deterioration of compensation performance caused by increasing the prediction step, it is found that when the step size becomes larger, the prediction output of the model will fluctuate. The prediction algorithm needs to be further optimized to improve the accuracy of the prediction model. Compared with the traditional feedback control, which controls after the feedback signal is generated, this paper uses the platform heave velocity of the first four sampling intervals of the prediction time node as the input of the prediction model, and outputs the predicted platform heave velocity, which improves the response time of the control system and avoids the disadvantage of the traditional control method that needs to adjust the control parameters based on experience.
At the same time, further research can be conducted from the following aspects. First, although the method designed in this paper to predict the velocity of the floating platform’s heave motion is effective, its prediction accuracy needs to be further improved, and the prediction algorithm can be further optimized. Secondly, at present, only the laboratory’s hydraulic six-degree-of-freedom motion simulation platform is used to perform the sinusoidal motion of heave to simulate waves. Further research can be conducted to enable it to track any given expected signal, especially to simulate the motion of the offshore floating platform in the heave direction, so as to better verify the effect of this method in actual sea conditions.
Author Contributions
Resources, supervision, project administration, and funding acquisition, T.X.; writing—review and editing, validation, and visualization, Y.Z.; conceptualization, methodology, writing—original draft preparation, Q.Z. All authors have read and agreed to the published version of the manuscript.
Funding
This research was funded by the Guangdong Basic and Applied Basic Research Foundation, China (Grant No. 2022A1515240015) and Guangdong Provincial Key Laboratory of Advanced Manufacturing Technology for Marine Energy Facilities, China (Grant No. 2023B1212010012).
Data Availability Statement
The original contributions presented in this study are included in the article. Further inquiries can be directed to the corresponding authors.
Conflicts of Interest
The authors declare no conflicts of interest.
References
- Xu, C. Research on Active Heave Compensation Control System of Deep-Sea Scientific Research Winch. Master’s Thesis, Dalian Maritime University, Dalian, China, 2024. [Google Scholar]
- Sun, W. Electro-Hydraulic Servo Adaptive Control of Winch Heave Compensation for Scientific Research Work. Master’s Thesis, Qingdao University of Science & Technology, Qingdao, China, 2024. [Google Scholar]
- Qiao, L. Research on Winch-Type Compensation Electro-Hydraulic Control System Based on Secondary Components. Master’s Thesis, Shandong University, Jinan, China, 2023. [Google Scholar]
- Wang, M. Study On Extremely Short-Term Prediction of Ship Sway Motion. Master’s Thesis, Yanshan University, Qinhuangdao, China, 2020. [Google Scholar]
- Dou, Y. Research on Intelligent Prediction of Ship Motion Attitude and Trajectory in High Sea Condition. Master’s Thesis, Harbin Engineering University, Harbin, China, 2024. [Google Scholar]
- Wang, X.; Guo, Z. Research on the application of Calman filtering technique in ship rolling prediction. Ship Sci. Technol. 2017, 39, 13–15. [Google Scholar]
- Guo, W.; Zhao, Z. Reliability prediction and analysis of marine power systems based on wavelet neural networks. Ship Sci. Technol. 2023, 45, 93–96. [Google Scholar]
- Dai, C. Research on Predictive Control of Shipborne Electro-Hydraulic 6-Dof Stable Platform. Master’s Thesis, Yanshan University, Qinhuangdao, China, 2024. [Google Scholar]
- Zhang, W. The Study on the Wavelet Neural Network and Its Application to Ship Motion Control. Ph.D. Thesis, Dalian Maritime University, Dalian, China, 2014. [Google Scholar]
- Shah, K.A.; Li, Y.; Nagamune, R.; Zhou, Y.; Rehman, W.U. Platform motion minimization using model predictive control of a floating offshore wind turbine. Theor. Appl. Mech. Lett. 2021, 11, 100295. [Google Scholar] [CrossRef]
- Liu, Z.; Huang, L.; Sun, Y.; Zhang, Y.; Liu, Z. Ship heave motion prediction method based on wavelet transform and improved time series model. Shandong Sci. 2024, 37, 1–11. [Google Scholar]
- Gao, Z. Research on Design and Control of Wave Compensation Winch for Offshore Crane. Master’s Thesis, China University of Petroleum (East China), Qingdao, China, 2022. [Google Scholar]
- Wu, Z. Research on Prediction of Ship Heave Motion Based on Deep Learning. Master’s Thesis, Harbin Engineering University, Harbin, China, 2024. [Google Scholar]
- Xiao, T.; Luo, D.; Zou, D.; Liu, J. Simulation and Experiment of Heave Compensation Winch Based on Double Variable Direct-drive Volume Control. Chin. Hydraul. Pneum. 2019, 3, 87–91. [Google Scholar]
- Zhou, L. Forecast of Short-term Electricity Price of Construction Engineering Based on Grey Wavelet Neural Network. Value Eng. 2022, 41, 29–33. [Google Scholar]
- Hong, Z. Prediction and Optimization of Ship Hydrodynamics Using CFD Technology. Ph.D. Thesis, Dalian University of Technology, Dalian, China, 2018. [Google Scholar]
- Wei, H. Design and Analysis of Offshore Drilling Heave Compensation Simulation System. Master’s Thesis, Northeast Petroleum University, Daqing, China, 2023. [Google Scholar]
- Wang, W.; Zhou, T.; Yu, X. Analysis of Heave Motion of Floating Drilling Platform. Oil Field Equip. 2011, 40, 3. [Google Scholar]


Disclaimer/Publisher’s Note: The statements, opinions and data contained in all publications are solely those of the individual author(s) and contributor(s) and not of MDPI and/or the editor(s). MDPI and/or the editor(s) disclaim responsibility for any injury to people or property resulting from any ideas, methods, instructions or products referred to in the content. |
© 2025 by the authors. Licensee MDPI, Basel, Switzerland. This article is an open access article distributed under the terms and conditions of the Creative Commons Attribution (CC BY) license (https://creativecommons.org/licenses/by/4.0/).