1. Introduction
In recent years, deep convolutional neural networks have made remarkable progress in the field of computer vision. With the improvement of computing power and the emergence of large-scale datasets, deep learning models are more and more excellent in image recognition, object detection, semantic segmentation, and other tasks. DeepLab network, as a deep convolutional neural network with excellent performance in semantic segmentation tasks, not only shows strong capabilities in the field of medical image processing [
1,
2]; it also has been widely verified in multiple practical application scenarios and has gradually become an indispensable tool in computer vision, automatic driving, medical imaging, and other fields.
In EAST [
3,
4,
5] and future magnetic confinement fusion devices, the divertor region is the primary zone where plasma and wall materials interact most intensively. This narrow, localized region is subjected to substantial steady-state and transient heat fluxes. Localized high heat flux deposition can lead to the erosion and melting of plasma-facing materials, such as divertor target plates, thereby compromising the operational safety of the device [
6]. This also results in the introduction of impurities into the main plasma, negatively impacting plasma performance [
7]. This effect severely limits EAST’s ability to perform long-pulse quasi-steady-state high-parameter operations [
8]. Therefore, during the long-pulse high-parameter plasma operation, the real-time monitoring of the critical components of the first wall can provide pre-warning and data support to help detect potential problems in time, which is essential to ensure the safe operation of EAST and realize the long-pulse discharge with higher parameters.
In recent years, a multi-band and high-speed endoscope diagnostic [
9] has been successfully developed on the EAST. Utilizing this system, a bright spot structure has been observed in the divertor region of the EAST, which serves as an indicator of localized overheating in this area. To ensure the safe operation of the EAST, it is crucial to accurately identify the bright spot structure location and relative amplitude. However, several challenges arise in processing the image data of this structure during experiments:
- (1)
In the high-temperature and strong electromagnetic field environment, significant noise is generated during high-speed camera imaging. Sources of this noise include electronic interference, background radiation, and other factors, which can obscure or distort the bright spot structure, thus complicating its extraction;
- (2)
Conventional neural network models typically involve a large number of parameters, requiring substantial memory and computational resources. This makes them unsuitable for deployment in the experimental environment, hindering the real-time recognition of the bright spot structure.
To address the aforementioned challenges, this paper proposes an image segmentation method for the bright spot structure based on an improved DeepLabv3+ model [
10]. The key advantages of this method, compared to existing deep learning-based approaches for recognizing the bright spot structure in the divertor region [
11], are as follows:
- (1)
It can provide a more accurate dataset. In this study, the algorithm first selects 100 consecutive frames from the original camera images to model the background using the minimum value method. After background modeling, the target frame is differentiated from the background model, and the Prewitt edge detection algorithm is applied to the differentiated image to enhance the signal intensity at the location of the bright spot structure. This approach generates a more accurate dataset for the subsequent training of the neural network model.
- (2)
The number of model parameters is significantly reduced. In this study, the algorithm employs an improved DeepLabv3+ network model, where the classic DeepLabv3+ backbone is replaced with the lightweight MobileNetV2 [
12] network, and the deep downsampling multiplier is reduced from 16 to 8. Evaluation metrics, including the mean intersection over union (mIoU), precision (precision), time per iteration (per iteration), and the number of model parameters (parameters), are used for performance assessment. When comparing the detection results of the improved DeepLabv3+ network with those of common neural network models, the proposed method demonstrates a high average mIoU and precision. Simultaneously, both the time per iteration and the number of model parameters are significantly reduced.
The structure of this paper is organized as follows: The
Section 2 provides a brief overview of the data sources and the methodology used to construct the dataset. The
Section 3 presents the bright spot segmentation algorithm, which is based on an enhanced DeepLabv3+ network, and discusses its application for recognizing bright spot images from the EAST divertor. Finally, the
Section 4 offers a concise conclusion.
2. Materials and Methods
2.1. Datasets
The EAST is equipped with 16 ports dedicated to various diagnostic systems, heating systems, dosing systems, and more. Among these, the multi-band and high-speed endoscope diagnostic for the observation of visible light, which operates based on the pinhole imaging principle [
13], is located in the F port of the EAST. Its spatial layout is depicted in
Figure 1. In order to solve the problem of strong electromagnetic interference and high-intensity radiation of high-energy particles and X-rays in the experimental environment, we did take relevant measures. For example, in terms of hardware, an X-ray detector was used in the F window, the gun barrel was extended into the vacuum chamber, and the detector was wrapped with lead and tungsten plates for shielding. The detector basically worked normally. In terms of the camera light path, the scheme used is to transmit the light from the vacuum chamber of the device to the outside of the device. In the experiment, a certain distance is maintained between the overall camera optical path and the experimental device, and a flange is used in front of the optical path for a certain blocking effect. The above methods can minimize the impact of this complex experimental environment. The diagnostic system utilizes the MEMRECAM ACS-1 M60 camera(Japan’s NAC Image Technology Inc) model, which offers a full resolution of 1280 × 896 pixels and a sampling rate of up to 50 Kfps. This multi-band and high-speed endoscope diagnostic plays a crucial role in monitoring images of different impurities, identifying the positions of plasma boundaries, and providing vital feedback for plasma shape control. The image data used in this study were obtained from the shot #102530 discharge experiment on EAST, captured by this diagnostic system. A dataset comprising 100 consecutive frames (numbered 0–99 for subsequent analysis) was selected for testing.
2.2. Methodology
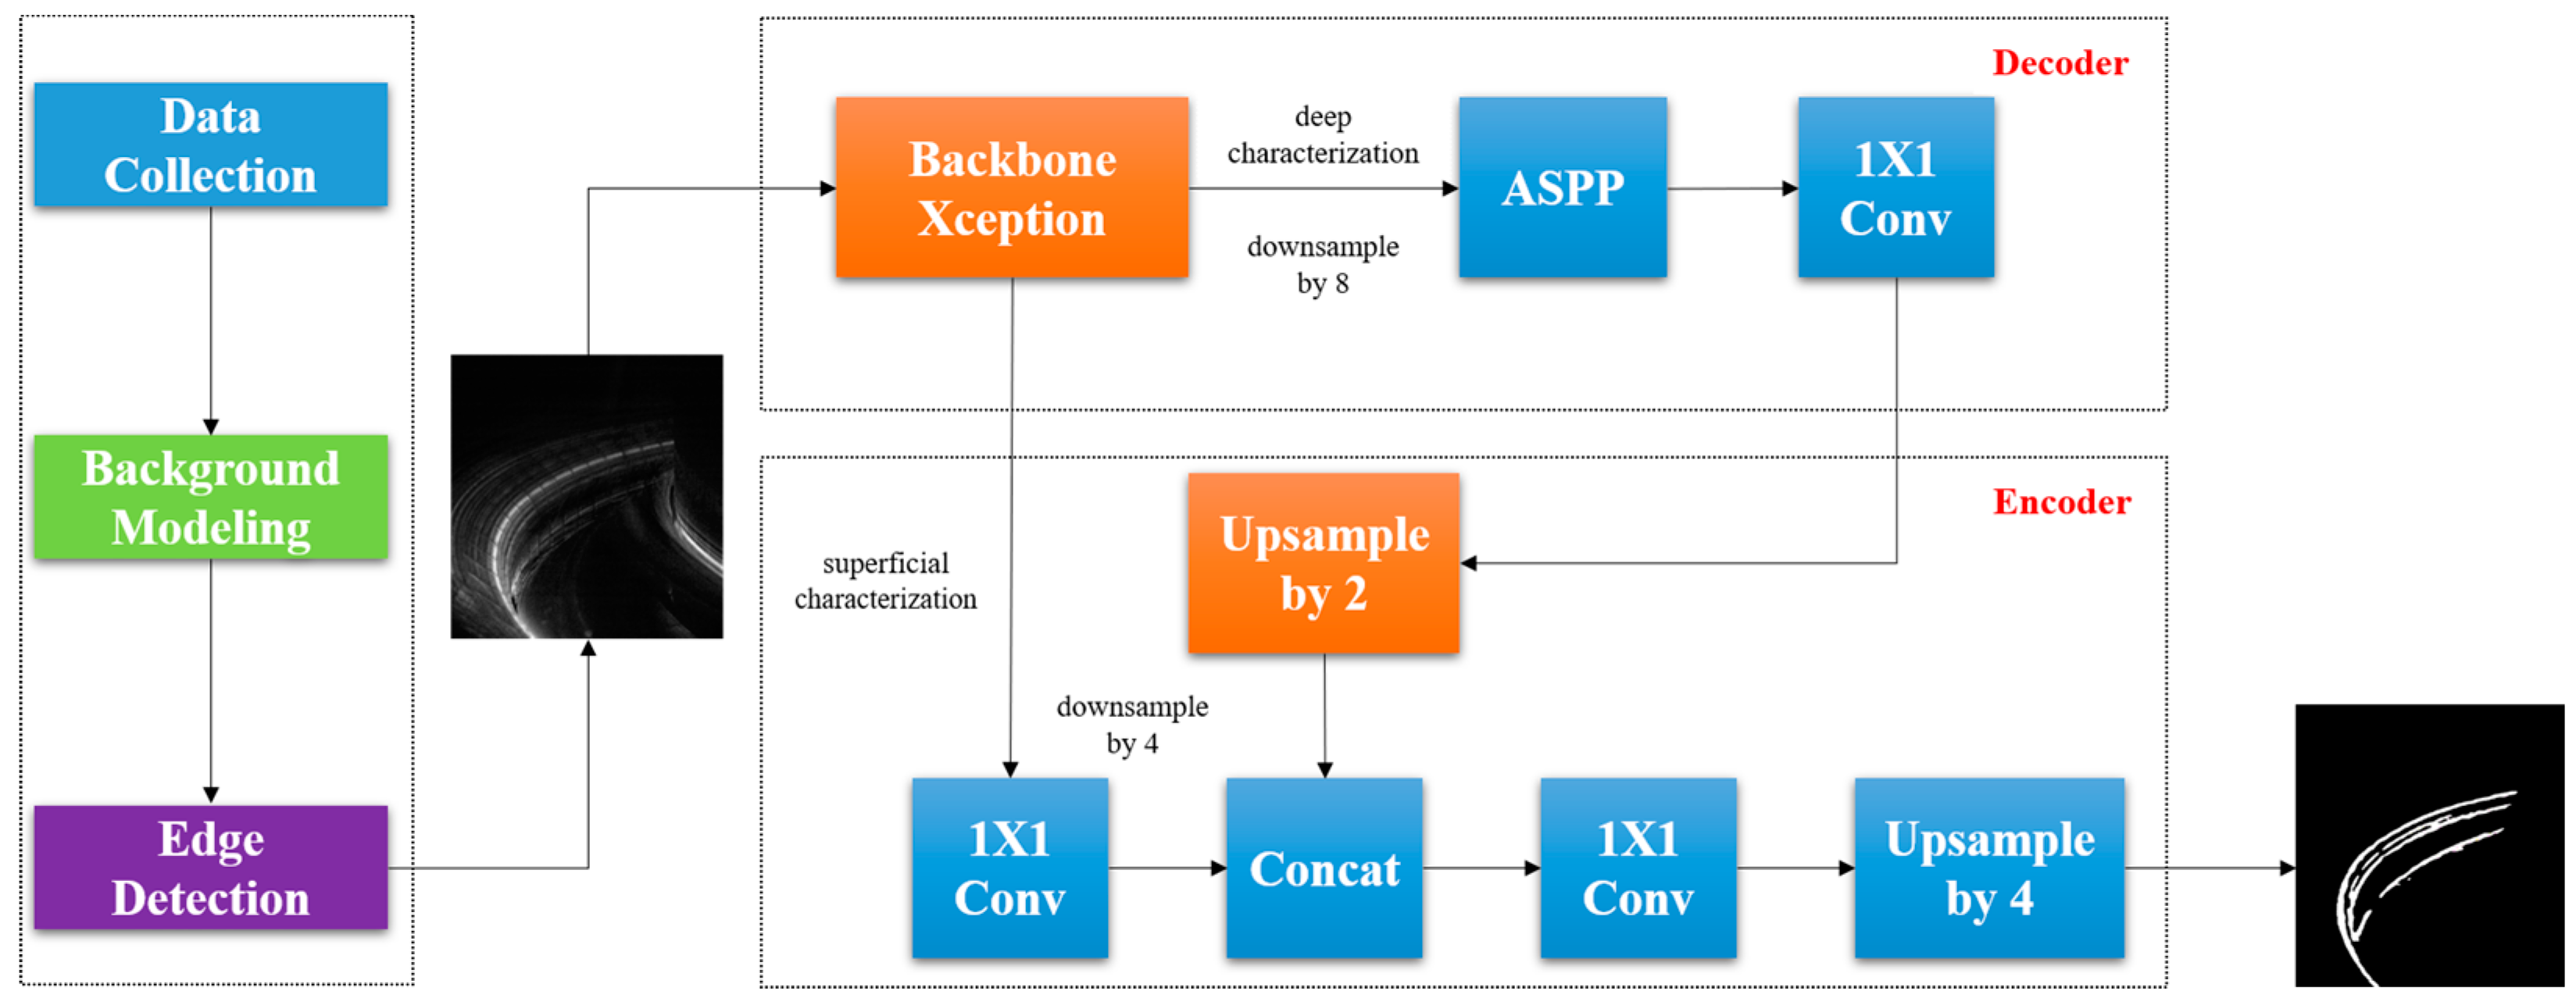
The objective of this study is to develop an image segmentation method for detecting bright spot structures in the divertor region of the EAST fusion device using an enhanced DeepLabv3+ model. This bright spot serves as an indicator of localized overheating in the region, which is crucial for ensuring the operational safety of the device. However, significant challenges arise in accurately identifying the location and relative amplitude of the bright spot, especially due to noise and computational limitations in the high-temperature, strong electromagnetic field environment of the EAST device. The complete network architecture used in this article is shown in
Figure 2.
To address the challenges, the study begins by collecting image data from the EAST diagnostic endoscope. The raw data, taken from high-speed camera images, are subjected to noise interference due to the harsh environment, which includes electronic interference and background radiation. To mitigate this issue, the following preprocessing steps are employed: The algorithm selects 100 consecutive frames from the raw images, using the minimum value method to create a background model. This background modeling helps to differentiate the target frames from the noise. After background subtraction, the Prewitt edge detection algorithm is applied to enhance the signal at the bright spot structure’s location, making the bright spot more distinguishable from the background. This process results in a more accurate dataset for the subsequent neural network training.
The core of the methodology involves the application of an improved DeepLabv3+ network, specifically designed for semantic segmentation tasks. The original DeepLabv3+ network is enhanced by replacing its backbone with the more lightweight MobileNetV2, which significantly reduces the number of model parameters while maintaining high performance. Key modifications include the following: By replacing the standard DeepLabv3+ backbone with MobileNetV2, the model benefits from reduced computational complexity and memory requirements, making it more suitable for real-time operation in the experimental environment. The deep downsampling multiplier is reduced from 16 to 8, optimizing the model for better efficiency without compromising the segmentation accuracy.
The improved DeepLabv3+ model is compared with conventional neural network models to assess its performance. The results demonstrate a significant improvement in both accuracy (mIoU and precision) and efficiency (time per iteration and model parameters). The proposed method successfully reduces the computational burden while maintaining high segmentation performance, making it an ideal choice for real-time bright spot detection in the EAST divertor region.
2.3. Minima Method Background Modeling and Image Differencing
The images of the divertor bright spot structures captured by high-speed camera exhibit the challenges of low feature target brightness and high background noise, making accurate differentiation difficult. Therefore, it is essential to develop a method to effectively separate the bright spot structures from the background, facilitating the initial extraction process. This separation can provide a more accurate dataset for subsequent neural network training. Preprocessing prior to neural network input not only improves training efficiency but also enhances the model’s generalization ability, convergence speed, and overall performance.
Background modeling is an effective preprocessing technique commonly used for foreground target extraction in image or video sequences [
14]. It is widely applied in fields such as target detection, tracking, and scene analysis. The core idea is to model the background of an image sequence and then detect foreground targets by comparing the current frame with the background model. For the EAST, where the brightness of the bright spot structure in the target region tends to decrease, this study adopts the minimum background modeling approach for data preprocessing. In this method, for each pixel location, the minimum value across all images in the sequence is computed to construct the background model. During the experiment, the first image in the input folder is selected as the reference image. Its height and width are extracted, and the minimum value image is generated and saved for background modeling. The algorithm follows the logic outlined below:
where
represents the gray value of the pixel at coordinates
in the background model, and
denotes the number of frames used for minimum modeling. The set
corresponds to the gray values of the pixel at coordinates
across each image frame. The pixel gray value in the target frame after background differencing is given as
, which is the result of subtracting the background model from the target frame. Since the brightness of the bright spot structure is higher than that of the background, regions with a gray value less than 0 in the background-differenced image are set to 0. This adjustment enhances the visibility of the target region, facilitating better display and analysis of the foreground targets.
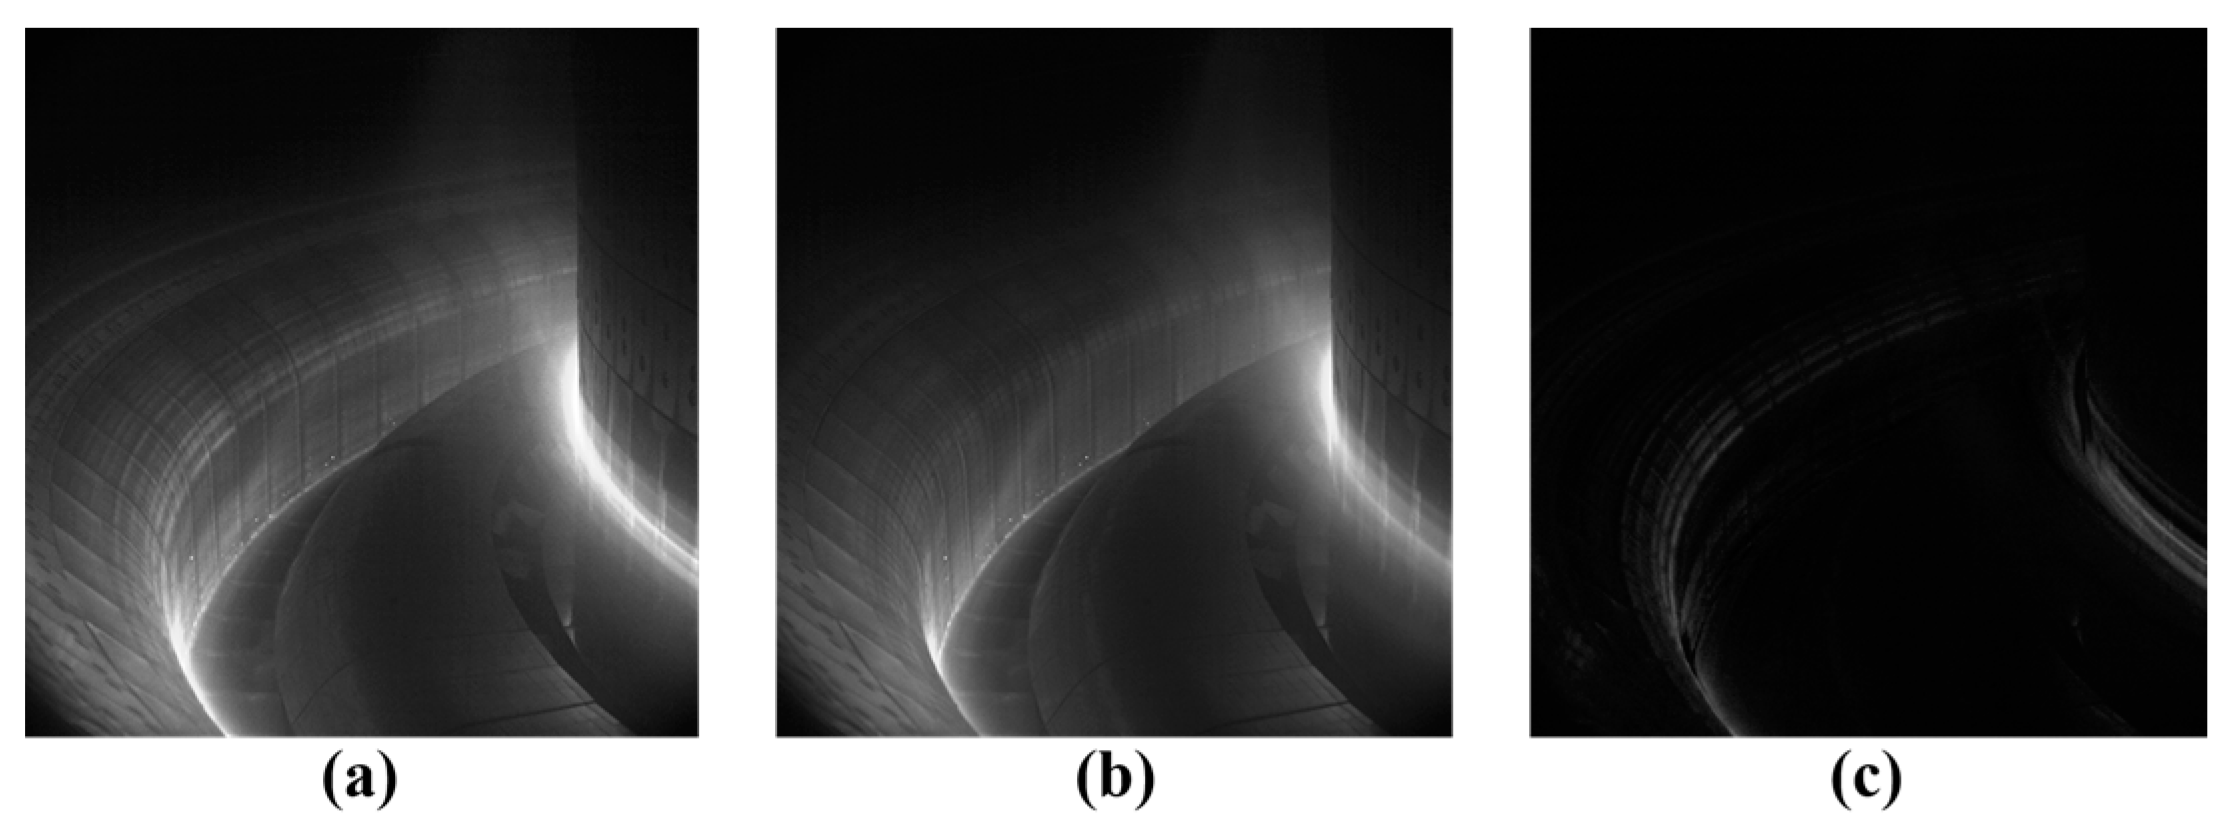
In this paper, minimum value background modeling is applied to a sequence of 100 consecutive frames from the high-speed camera images to construct the background model, as shown in
Figure 3b. The bright spot structure image, depicted in
Figure 3c, is obtained by subtracting the background model (
Figure 3b) from the target frame image (
Figure 3a).
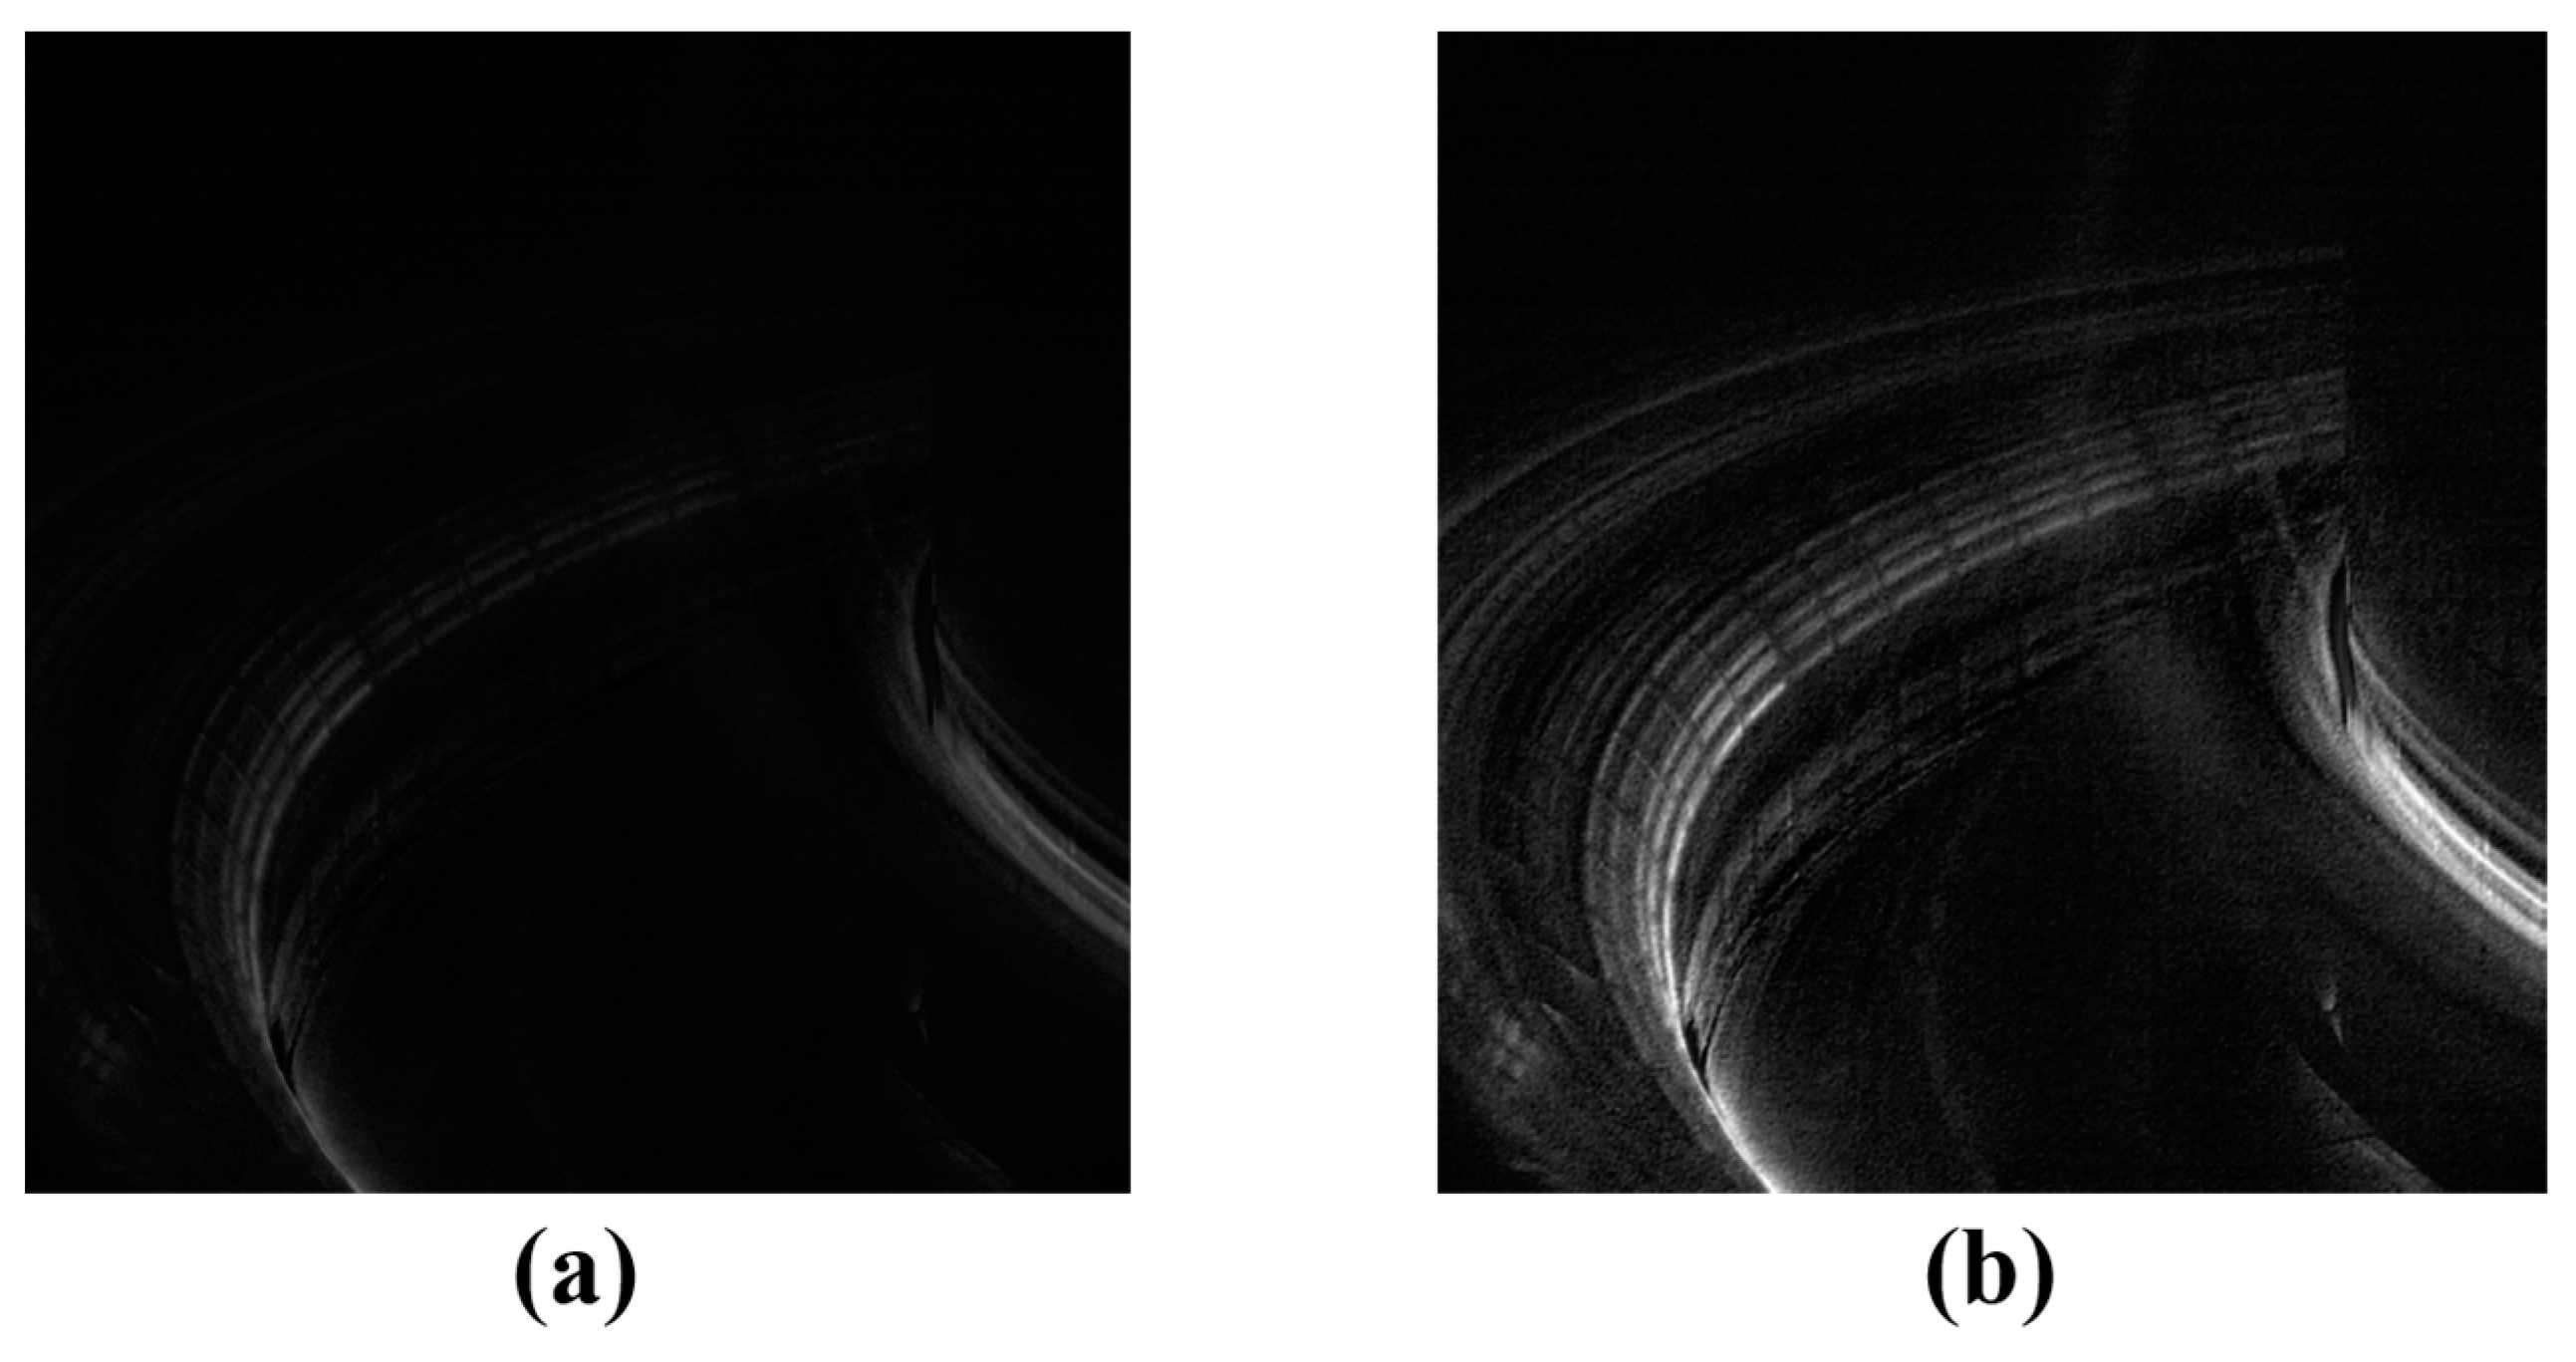
The bright spot structure, located in the foreground of the image, can be clearly extracted using the minimum method of background modeling and image differencing. However, a low brightness remains, which makes it challenging to fully highlight the edge features of the bright spot. To address this issue, a Prewitt operation [
15] is applied to the differenced image to enhance the edge features, resulting in the image shown in
Figure 4b. The Prewitt algorithm is primarily used to detect regions with significant changes in brightness by calculating the gradient of the image, which typically corresponds to the edges. The Prewitt edge detection is based on an operator (kernel) [
16] designed to extract both horizontal and vertical edges. The calculation formula for this operator is as follows:
where
and
are the gray values of the image detected at the horizontal and vertical edges, respectively.
The background modeling using the minimum value method and image differencing effectively enables the initial extraction of the bright spot structure from the high-speed camera images. Additionally, by observing
Figure 5, it can be found that the application of the Prewitt edge detection method enhances the signal strength at the bright spot locations. It is evident that, compared to the original image, the bright spot structure in the divertor region is significantly more distinguishable, leading to the creation of the dataset.
2.4. Bright Spot Structure Image Segmentation Algorithm Based on Improved DeepLabv3+ Network and Recognition Effect in EAST
2.4.1. DeepLab Networks
The DeepLab family of networks [
17,
18,
19] was proposed to address the limitations of traditional methods in semantic segmentation, particularly in terms of segmentation accuracy when dealing with complex scenes and fine object boundaries. By incorporating advanced techniques such as dilated convolution (DC) [
20], multi-scale feature fusion (MSFF) [
21], and atrous spatial pyramid pooling (ASPP) [
22], DeepLab is capable of achieving high-quality pixel-level predictions. As a result, it has become a widely used model in semantic segmentation.
2.4.2. Improved DeepLabv3+
To accurately extract the bright spot structures in the image diagnosis of the EAST divertor region, this paper employs an improved DeepLabv3+ network-based image segmentation approach. Compared to previous models, the enhanced DeepLabv3+ network introduces a novel encoding–decoding architecture, with a loss function that combines cross-entropy loss [
23] and Dice loss [
24]. The semantic segmentation model for bright spot structure, based on MobileNetV2–DeepLabv3+, is constructed, and the logical block diagram of the structure is shown in
Figure 6.
- (1)
Bright spot structure detection was the goal of this study. The classical backbone network, Xception [
25], is replaced by the lightweight MobileNetV2 to better adapt to small datasets, reduce model parameters, and improve operational speed.
- (2)
The algorithm developed in this study reduces the deep downsampling factor from 16 to 8, preserving more detailed and localized information of the bright spot structure.
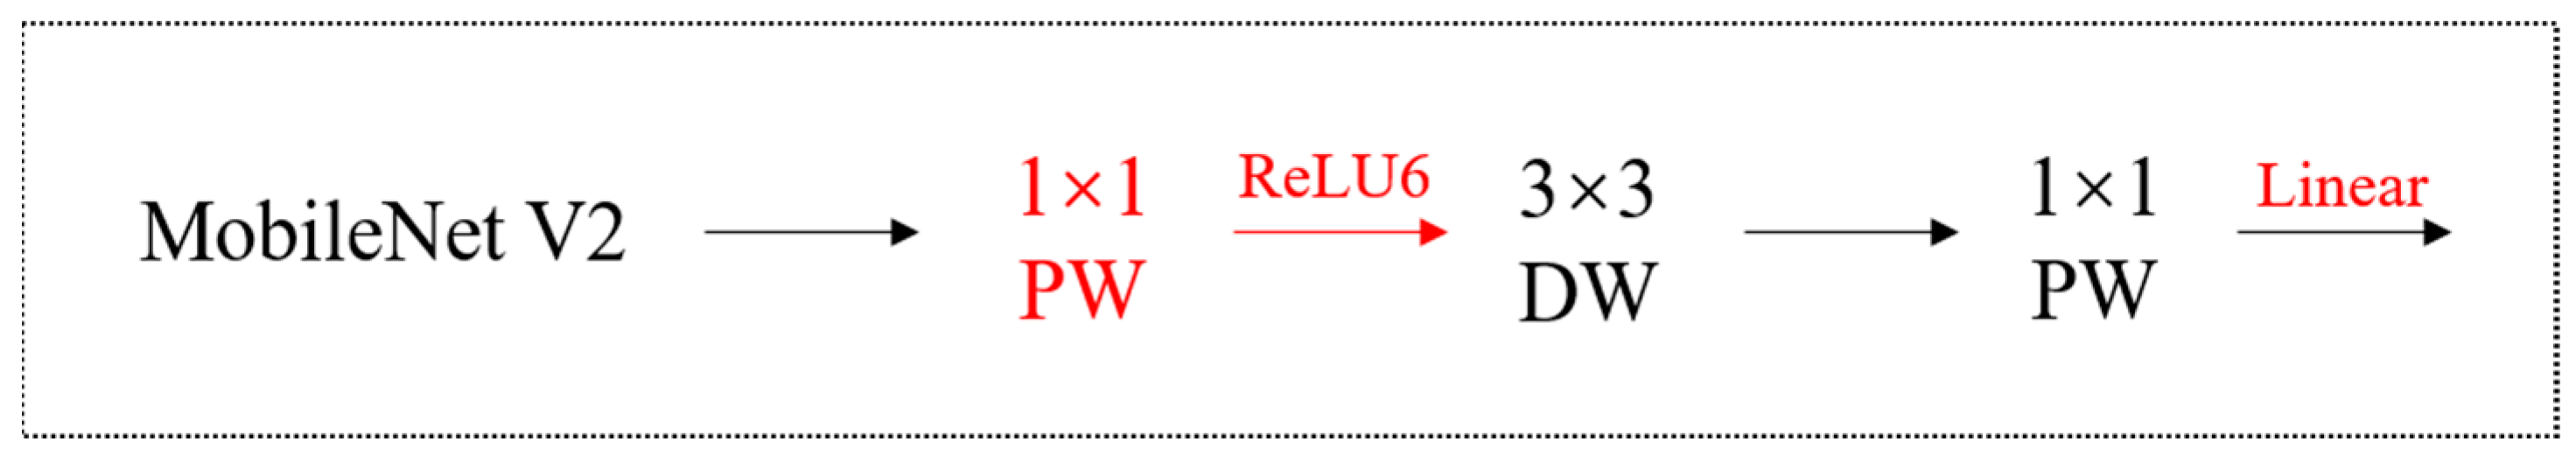
MobileNetV2 is an efficient convolutional neural network architecture proposed by Google that provides an efficient and flexible network architecture through innovative designs, such as inverted residual structure, depth-separable convolution, and linear bottleneck. It can significantly reduce the amount of computation and parameters while guaranteeing high accuracy, making it an important choice for lightweight deep learning models. Its network structure is schematically shown in
Figure 7.
The MobileNetV2 network architecture has two main innovations:
- (1)
Depth-wise convolution has one more 1 × 1 expansion layer than before, aiming at boosting the number of channels and obtaining more features;
- (2)
The last layer of the network does not use Relu, but Linear, in order to prevent Relu from destroying features.
3. Experimental Conditions
3.1. Training Parameters
During the network training process, the bright spot region in the divertor is manually labeled and used as the ground truth for segmentation. The dataset is split, with 80% allocated for training and 20% for validation. Prior to training, the images were re-sized to 512 × 512, the batch size was eight, the learning rate was 0.0005, the number of iterations was set as 300, and the two training categories were set (i.e., bright spot and background). In the process of model training, the following techniques are used to improve the generalization ability of the model:
Data augmentation: By preprocessing input data during the training process, such as background modeling and image differential and edge enhancement techniques mentioned in this paper, the model is more robust, and the generalization ability is improved.
Learning rate scheduling: Dynamically adjusting the learning rate and adopting the strategy of gradually reducing the learning rate can help the model converge more stably in the late training period and avoid overfitting.
Early stopping method: During the training process, the error of the verification set will be monitored (Val_loss), and the training will be stopped when the error of the verification set stops to prevent the model from over-fitting the training data.
The best-performing model during the training process is saved and later evaluated on the test set to assess its generalization capability. The specific training environment is shown in
Table 1.
3.2. Evaluation Index
One of the primary advantages of the improved DeepLabv3+-based algorithm is its significant reduction in the number of model parameters. In order to evaluate the performance of this algorithm, it is compared with several common image-recognition neural network models. The evaluation metrics selected for the bright spot structure segmentation task include
mIoU, precision, per iteration, and parameters. Among them, special emphasis is placed on the
mIoU (average crosslinking) metric, as it is a key criterion for evaluating the accuracy of image segmentation results. The
mIoU is computed as the ratio of the intersection of the predicted pixel points and the ground truth label pixels, relative to their union. The formula for
mIoU is as follows:
where
is the predicted region;
is the true region; and
is the total number of categories and is the of the i-th category.
4. Results and Analysis
In this paper, a comparative test is carried out on the bright spot structure dataset. U-Net, PSPNet, SegNet, DeepLab–Xception before improvement, and DeepLab–MobileNetV2 after improvement are proposed in this paper.
As shown in
Table 2, the bright spot structure segmentation method based on the improved DeepLabv3+ proposed in this paper performs similarly to the U-Net [
26] neural network, which is known for its strong performance on small sample sets in terms of core evaluation metrics, such as mIoU and precision. However, the method presented in this paper reduces the model parameters to approximately 1/7.5 of that of U-Net, while also reducing the per-iteration round by about 0.35 s. In comparison to the classical DeepLab model with the Xception backbone, the proposed method improves mIoU and precision by 7.82% and 6.55%, respectively, while reducing the model parameters by a factor of approximately 9.3 and shortening the iteration time by approximately 2.92 s.
The loss function curve of the online learning experiment is shown in
Figure 8, and it can be observed that with the increase in the number of training iterations, the loss value gradually stabilizes and shows a decreasing trend, which indicates that the constructed network model has successfully achieved convergence. This result again verifies the effectiveness of the model and the stability of the training process.
As shown in
Figure 9, in order to visualize the performance difference between U-Net–ResNet, DeepLab–Xception, and DeepLab–MobileNetV2 in the segmentation task, comparison experiments containing the original image, real labels, U-Net–ResNet segmentation results, DeepLab–Xception segmentation results, and DeepLab–MobileNetV2 segmentation results were conducted.
The proposed image segmentation method based on the improved DeepLabv3+ for bright spot structure segmentation achieves a significant reduction in the number of model parameters, while maintaining high recognition accuracy. This optimization has a substantial impact on computational and memory resource efficiency, as well as on detection real-time performance. Specifically, the reduction in model parameters not only alleviates the computational burden during both training and inference but also effectively minimizes memory usage, allowing the model to operate efficiently on resource-constrained devices. Additionally, this reduction enhances the real-time performance of the detection system, enabling faster data processing and result output. Consequently, the optimization of the method not only broadens the potential application scenarios of the model but also improves the practical deployment efficiency and overall system performance.
5. Discussion
This study proposes an enhanced DeepLabv3+-based algorithm for the rapid identification of bright spot structures in the divertor region of plasma devices, particularly for EAST. The results obtained from the proposed method indicate that significant advancements have been made in the real-time detection of localized overheating in the divertor region, which is crucial for the safe operation of plasma devices.
The model demonstrates a promising performance, with a mean intersection over union (mIoU) of 65.36%, suggesting good segmentation accuracy. Precision values of 78.75% reflect the model’s high effectiveness in correctly identifying positive instances, as such effectiveness is essential for the accurate monitoring of bright spot structures that could impact plasma stability. Additionally, the fast processing time of 0.78 s per iteration and relatively small parameter size of 22.4 MB (compared to traditional models) demonstrate the computational efficiency of the proposed approach. These factors contribute to the feasibility of deploying the model in real-time environments with limited computational resources.
One of the strengths of the proposed method is its ability to optimize both model parameters and processing time. This reduces the computational load, allowing the method to operate efficiently in resource-constrained environments, such as those encountered in fusion devices like EAST. Given the complexity and the need for fast response times in these environments, the ability to reduce both the model size and processing time without sacrificing accuracy is a notable achievement.
However, despite these promising results, some limitations persist. Although the model successfully identifies bright spot structures in real time, it does not yet provide an accurate measurement of the temperature of the first wall material. Temperature monitoring is a critical component of preventing damage to the reactor and ensuring the longevity of the materials used in the divertor. The current approach focuses solely on the identification of the bright spots, leaving a gap in the ability to provide quantitative temperature estimates.
Future work will aim to address this limitation by integrating additional diagnostic methods. Specifically, the calibration of bright spot intensities using high-speed camera images could enable temperature estimation through advanced calibration techniques. Moreover, combining the proposed model with other temperature-sensitive sensors could further enhance diagnostic accuracy, leading to a more comprehensive monitoring system for EAST and other fusion reactors.
6. Conclusions
To address the challenge that traditional image analysis methods struggle to quickly and accurately identify bright spot structures, in turn affecting plasma performance and device safety, this paper presents an improved DeepLabv3+-based algorithm for the rapid identification of bright spot structures in images from the divertor region.
The study evaluates various neural network models based on performance metrics commonly used in image segmentation tasks. The key evaluation metrics include the following:
Mean intersection over union (mIoU),
Precision,
Per-iteration processing time,
Number of model parameters.
These metrics were analyzed to understand the overall efficiency and effectiveness of the models. The results indicate that the proposed method outperforms others in terms of both segmentation accuracy and processing speed.
- 2.
Optimization Achievements
The proposed method successfully reduces both the number of model parameters and the processing time for recognition tasks. These optimizations result in reduced computational and memory resource usage, thereby significantly enhancing real-time detection performance without compromising accuracy. By reducing the model size to 22.4 MB, it demonstrates suitability for resource-constrained environments, enabling faster deployment in real-world scenarios.
- 3.
Specific Results
Segmentation performance: The model achieves an mIoU of 65.36%, reflecting solid segmentation capability.
Accuracy: The precision is 78.75%, confirming high accuracy in detecting bright spot structures.
Efficiency: The per-iteration processing time of 0.78 s indicates efficient real-time processing.
Model size: With a parameter size of 22.4 MB, the model remains lightweight, making it feasible for use in devices with limited computational resources.
- 4.
Implications and Limitations
The proposed method enables the rapid identification of bright spot structures with localized overheating in the divertor region of the EAST. This capability holds significant implications for the safe operation of the EAST.
However, the current work has some limitations. While real-time identification of bright spots was successfully achieved, it does not provide a quantitative measurement of the absolute temperature of the first wall material. Future work will focus on enhancing diagnostic accuracy by comparing additional diagnostic methods and calibrating the intensity of the bright spots in high-speed camera images to estimate the temperature.
Author Contributions
Data curation, J.Y.; Writing—original draft, Y.W.; Writing—review & editing, Y.Y., M.T., F.Z., C.Q., X.W., C.W. and D.K. All authors have read and agreed to the published version of the manuscript.
Funding
This work was supported by the National MCF Energy R&D Program under Grant (No. 2024YFE03130001, No. 2024YFE03130002, and No. 2024YFE03130004), the Institute of Energy, Hefei Comprehensive National Science Center (Nos. 24KZS303 and 21KZS202), the National Natural Science Foundation of China (No. 12305247 and No. 12105088), and the Anhui Province Key Research and Development Program (No. 202304a05020006).
Data Availability Statement
The original contributions presented in this study are included in the article. Further inquiries can be directed to the corresponding authors.
Conflicts of Interest
The authors declare no conflict of interest.
References
- Lin, H. Artificial Intelligence with Great Potential in Medical Informatics: A Brief Review. Medinformatics 2024, 1, 2–9. [Google Scholar] [CrossRef]
- Chattopadhyay, S. Decoding Medical Diagnosis with Machine Learning Classifiers. Medinformatics 2024, 2. [Google Scholar] [CrossRef]
- Gao, X.; the EAST Team. Diagnostics for first plasma study on EAST tokamak. Phys. Lett. A 2008, 372, 2286–2290. [Google Scholar] [CrossRef]
- Wan, B.N.; the EAST and HT-7 Teams; International Collaborators. Recent experiments in the EAST and HT-7 superconducting tokamaks. Nucl. Fusion 2009, 49, 104011. [Google Scholar]
- Li, J.G.; Wan, B.N.; International EAST Team Collaborators. Recent progress in RF heating and long-pulse experiments on EAST. Nucl. Fusion 2011, 51, 094007. [Google Scholar] [CrossRef]
- Brunner, D.; LaBombard, B.; Kuang, A.Q.; Terry, J.L. High-resolution heat flux width measurements at reactor-level magnetic fields and observation of a unified width scaling across confinement regimes in the Alcator C-Mod tokamak. Nucl. Fusion 2018, 58, 094002. [Google Scholar] [CrossRef]
- Fundamenski, W. Power and particle exhaust in tokamaks: Integration of plasma scenarios with plasma facing materials and components. J. Nucl. Mater. 2009, 390, 10–19. [Google Scholar] [CrossRef]
- Song, Y.; Wan, B.; Gong, X.; Li, J.; Wu, X.; Liu, F.; Chen, J.; Hu, J.; Xu, G.; Lu, K.; et al. Recent EAST Experimental Results and Systems Upgrade in Support of Long-Pulse Steady-State Plasma Operation. IEEE Trans. Plasma Sci. 2022, 50, 4330–4334. [Google Scholar] [CrossRef]
- Yang, J.H.; Yang, X.F.; Hu, L.Q.; Zang, Q.; Han, X.F.; Shao, C.Q.; Sun, T.F.; Chen, H.; Wang, T.F.; Li, F.J.; et al. Development of high-speed and wide-angle visible observation diagnostics on Experimental Advanced Superconducting Tokamak using catadioptric optics. Rev. Sci. Instrum. 2013, 84, 182. [Google Scholar] [CrossRef] [PubMed]
- Chen, L.C.; Zhu, Y.; Papandreou, G.; Schroff, F.; Adam, H. Encoder-Decoder with Atrous Separable Convolution for Semantic Image Segmentation. In Proceedings of the Computer Vision—ECCV 2018, Munich, Germany, 8–14 September 2018. [Google Scholar]
- Yan, H.; Han, X.; Yang, J.; Hu, J.; Wang, J. ELMs filaments extraction on divertor visible high-speed camera system of EAST. J. Instrum. 2022, 17, 10016. [Google Scholar] [CrossRef]
- Sandler, M.; Howard, A.; Zhu, M.; Zhmoginov, A.; Chen, L.C. MobileNetV2: Inverted Residuals and Linear Bottlenecks. In Proceedings of the 2018 IEEE/CVF Conference on Computer Vision and Pattern Recognition, Salt Lake City, UT, USA, 18–23 June 2018; IEEE: Piscataway, NJ, USA, 2018. [Google Scholar]
- Li, G.; Sheng, L.; Duan, B.; Li, Y.; Hei, D.; Xing, Q. Unsupervised deep learning method for single image super-resolution of the thick pinhole imaging system using deep image prior. Nucl. Eng. Technol. 2024, 57, 103139. [Google Scholar] [CrossRef]
- Maddalena, L.; Petrosino, A. A Self-Organizing Approach to Background Subtraction for Visual Surveillance Applications. IEEE Trans. Image Process. 2008, 17, 1168–1177. [Google Scholar] [CrossRef] [PubMed]
- Zhou, R.G.; Yu, H.; Cheng, Y.; Li, F.X. Quantum image edge extraction based on improved Prewitt operator. Quantum Inf. Process. 2019, 18, 261. [Google Scholar] [CrossRef]
- Cosmo, L.; Minello, G.; Bicciato, A.; Bronstein, M.M.; Rodolà, E.; Rossi, L.; Torsello, A. Graph Kernel Neural Networks. IEEE Trans. Neural Netw. Learn. Syst. 2024, 10542111. [Google Scholar] [CrossRef] [PubMed]
- Chen, L.C.; Papandreou, G.; Schroff, F.; Adam, H. Rethinking Atrous Convolution for Semantic Image Segmentation. arXiv 2017, arXiv:1706.05587. [Google Scholar]
- Chen, L.C.; Papandreou, G.; Kokkinos, I.; Murphy, K.; Yuille, A.L. Semantic Image Segmentation with Deep Convolutional Nets and Fully Connected CRFs. Comput. Sci. 2014, 357–361. [Google Scholar]
- Chen, L.C.; Papandreou, G.; Kokkinos, I.; Murphy, K.; Yuille, A.L. DeepLab: Semantic image segmentation with deep convolutional nets, atrous convolution, and fully connected CRFs. IEEE Trans. Pattern Anal. Mach. Intell. 2018, 40, 834–848. [Google Scholar] [CrossRef]
- Xu, P.; Xiang, Z.; Qiao, C.; Fu, J.; Zhao, X. Rethinking Cross-Entropy Loss for Stereo Matching Networks. arXiv 2023, arXiv:2306.15612. [Google Scholar]
- Milletari, F.; Navab, N.; Ahmadi, S.A. V-Net: Fully Convolutional Neural Networks for Volumetric Medical Image Segmentation. In Proceedings of the 2016 Fourth International Conference on 3D Vision (3DV), Stanford, CA, USA, 25–28 October 2016; IEEE: Piscataway, NJ, USA, 2016. [Google Scholar]
- Yu, F.; Koltun, V. Multi-Scale Context Aggregation by Dilated Convolutions. In Proceedings of the International Conference on Learning Representations, San Juan, Puerto Rico, 2–4 May 2016. [Google Scholar]
- Prakash, U.M.; Iniyan, S.; Dutta, A.K.; Alsubai, S.; Ramesh, J.V.N.; Mohanty, S.N.; Dudekula, K.V. Multi-scale feature fusion of deep convolutional neural networks on cancerous tumor detection and classification using biomedical images. Sci. Rep. 2025, 15, 1105. [Google Scholar] [CrossRef] [PubMed]
- Wang, J.; Jia, J.; Zhang, Y.; Wang, H.; Zhu, S. RAAWC-UNet: An apple leaf and disease segmentation method based on residual attention and atrous spatial pyramid pooling improved UNet with weight compression loss. Front. Plant Sci. 2024, 15, 1305358. [Google Scholar] [CrossRef] [PubMed]
- Chollet, F. Xception: Deep Learning with Depthwise Separable Convolutions. In Proceedings of the 2017 IEEE Conference on Computer Vision and Pattern Recognition (CVPR), Honolulu, HI, USA, 21–26 July 2017. [Google Scholar]
- Ronneberger, O.; Fischer, P.; Brox, T. U-Net: Convolutional Networks for Biomedical Image Segmentation. In Proceedings of the International Conference on Medical Imaging Computing and Computer-Assisted Intervention, Munich, Germany, 5–9 October 2015. [Google Scholar]
| Disclaimer/Publisher’s Note: The statements, opinions and data contained in all publications are solely those of the individual author(s) and contributor(s) and not of MDPI and/or the editor(s). MDPI and/or the editor(s) disclaim responsibility for any injury to people or property resulting from any ideas, methods, instructions or products referred to in the content. |
© 2025 by the authors. Licensee MDPI, Basel, Switzerland. This article is an open access article distributed under the terms and conditions of the Creative Commons Attribution (CC BY) license (https://creativecommons.org/licenses/by/4.0/).


 ,
, 


