Article

Green Carbonization Pathways for EMI Shielding: Evaluating Heating Technologies for Enhanced Textile Waste Valorization

1
Graduate School of Natural and Applied Sciences, Ege University, Izmir 35040, Turkey
2
Textile Engineering Department, Engineering Faculty, Ege University, Izmir 35040, Turkey
*
Author to whom correspondence should be addressed.
Processes 2025, 13(3), 870; https://doi.org/10.3390/pr13030870
Submission received: 11 February 2025 / Revised: 3 March 2025 / Accepted: 10 March 2025 / Published: 15 March 2025
(This article belongs to the Section Sustainable Processes)

Abstract

:
This study investigates innovative pathways for sustainable carbonization by comparing the performance and environmental impacts of microwave and muffle furnace heating technologies in the production of activated carbon from textile waste. The muffle furnace process demonstrated superior material properties, achieving a higher surface area (538.42 m2/g) and exceptional electromagnetic interference (EMI) shielding effectiveness (47.56 dB at 2 GHz). It also exhibited better electrical conductivity, making it highly suitable for EMI shielding applications. Conversely, the microwave method, while yielding a lower surface area (383.92 m2/g) and EMI shielding (38.60 dB at 1 GHz), showed promising electrical conductivity and remarkable advantages in time and energy efficiency. A novel Green Performance Efficiency (GPE) metric was developed to evaluate the sustainability of these processes holistically, integrating performance parameters such as EMI shielding with energy consumption and process duration. The GPE analysis revealed that the microwave method outperformed the muffle furnace in terms of energy and time efficiency, achieving a significantly higher GPE score. However, the muffle furnace method excelled in material performance metrics, highlighting the trade-offs between sustainability and functionality. The findings not only provide a standardized framework for evaluating and optimizing carbonization technologies but also offer actionable insights into balancing efficiency and performance in sustainable activated carbon production. This research paves the way for advanced applications in EMI shielding, energy storage, and sustainable material development, demonstrating the potential of GPE as a benchmark for green technology innovation.

Graphical Abstract

1. Introduction

The rapid and ongoing accumulation of solid waste presents a critical challenge to environmental sustainability and public health. Among various waste streams, textile waste stands out due to its complex composition, low biodegradability, and significant environmental footprint. The volume of clothing waste was 115 million tons in 2021 and is expected to rise to nearly 150 million tons by 2030 [1]. Globally, millions of tons of textile waste are generated annually, with less than 15% being recycled, while the rest is incinerated or landfilled, contributing to greenhouse gas emissions and resource depletion [2,3]. Addressing this issue requires innovative solutions that align with circular economy principles, emphasizing the valorization of waste into high-value-added products while reducing dependency on virgin resources [1,4,5,6]. Upcycling textile waste into high-value materials, such as activated carbon, represents a promising solution within the framework of circular economy principles. Unlike conventional recycling, which often downcycles materials into products of lower value, upcycling preserves or enhances material functionality, creating sustainable pathways for waste management [1,7,8,9,10].
The valorization of textile waste into multifunctional activated carbon aligns with global sustainability goals. It addresses waste management challenges while enabling applications in energy storage, water purification, EMI shielding, and numerous other advanced material uses. By converting textile waste into such multifunctional materials, activated carbon not only contributes to waste management but also promotes sustainable resource utilization [11,12,13,14,15,16,17,18].
Traditionally, activated carbon is produced through pyrolysis, a high-temperature thermochemical process conducted in an oxygen-free environment. This process often relies on inert gases, such as nitrogen or argon, to create the necessary conditions, which increases both the cost and the energy footprint of the method [19]. To address these challenges, alternative activation methods have been developed, with self-activation techniques utilizing CO2 and water vapor as activating agents [5,18,19,20,21,22]. These methods eliminate the reliance on inert gases, thereby enhancing the environmental friendliness and economic feasibility of the process [5,21]. In addition to these approaches, sulfuric acid (H2SO4) immersion has also been employed due to its well-documented ability to enhance carbon retention and improve carbon yield during the carbonization process. This choice is consistent with our previous research [23,24], where sulfuric acid was shown to play a significant role in facilitating the formation of a stable and conductive carbon structure. The concentration of 8% sulfuric acid was specifically selected for safety reasons, as it ensures optimal activation conditions while maintaining material stability. Additionally, previous studies have demonstrated that this concentration provides the maximum surface area and pore width, which are critical for the performance of the carbonized material. As a result, only the 8% sulfuric acid immersion was used for detailed characterizations in this work, ensuring consistency and the best possible outcomes for the desired properties of the material.
Building on these advancements, various heating technologies, including conventional resistance heating and microwave-assisted heating, have been explored to optimize the production of activated carbon. For instance, conventional resistance heating is widely used but is associated with high energy consumption and extended processing times [25,26,27,28,29,30,31]. Microwave-assisted pyrolysis has emerged as a promising alternative due to its rapid and uniform heating capabilities, which reduce energy consumption and production time while maintaining or enhancing the material’s functional properties [32,33,34].
However, the choice of heating technology can significantly influence the structural and functional properties of carbon materials. For instance, microwave-assisted activation has been shown to produce carbons with enhanced mesoporous structures and larger average pore sizes compared to conventional methods, resulting in superior performance for energy storage applications [35]. These findings emphasize the importance of further investigation to understand how heating technologies shape material properties and determine their suitability for specific applications, all while advancing sustainability objectives.
Beyond performance metrics such as EMI shielding effectiveness, the sustainability of carbonization methods depends on factors like energy consumption, processing time, and the elimination of inert gases. Microwave-assisted pyrolysis demonstrates notable operational advantages; however, a comprehensive evaluation requires tools that holistically assess environmental impacts. It is where green metrics become invaluable, providing a structured framework to quantify and compare the sustainability of competing processes. In this context, the Green Performance Efficiency (GPE) metric introduced in this study builds upon this foundation, offering a novel approach to integrate performance, energy efficiency, and sustainability considerations into a unified evaluation.
Sustainability is a fundamental pillar of modern material science, underpinned by the principles of green chemistry and engineering. These disciplines advocate minimizing waste, reducing energy consumption, and maximizing resource efficiency throughout the production process. To evaluate and optimize the sustainability of such processes, researchers have developed metrics such as [36,37,38]:
  • E-factor (Environmental factor): Quantifies the waste generated per unit of product.
  • Atom Economy: Measures the efficiency of reactant atoms incorporated into the desired product.
  • PMI: Measures the total mass of all materials used in a process relative to the mass of the desired product. A lower PMI indicates a more efficient and sustainable process, minimizing waste and resource consumption.
  • Carbon Efficiency: Evaluates the carbon utilization in a reaction or process.
  • Energy Efficiency: Focuses on minimizing energy input while maximizing output.
  • Life Cycle Assessment (LCA): Analyzes the overall environmental impact of a product from cradle to grave.
These metrics provide quantitative tools for assessing the environmental impact of material production methods and identifying the most sustainable pathways. While these metrics have proven valuable in evaluating the sustainability of chemical processes, they often fail to account for time and energy consumption factors critical to the scalability and sustainability of laboratory-scale processes. To address these gaps, this study introduces the Green Performance Efficiency (GPE) metric, a comprehensive approach that combines process yield, product performance, energy efficiency, process duration, and waste output into a unified framework for evaluating process sustainability. Unlike traditional metrics, GPE directly correlates performance outputs, such as EMI shielding, with energy and time inputs. By integrating GPE with established frameworks like PMI and E-Factor, this work aims to provide a comprehensive tool for evaluating and optimizing the sustainability of material production processes.
This study addresses the pressing issue of textile waste by transforming discarded materials into advanced activated carbon, thereby reducing environmental impact and contributing to sustainable innovation in material science. By evaluating and comparing the effects of microwave (MW) and muffle furnace (MF) heating technologies on the structural and functional properties of activated carbon, this research offers valuable insights into the optimization of green carbonization techniques. Through the integration of the GPE metric, it not only underscores the environmental and technological advancements achieved but also provides a framework for assessing sustainability in material science. Ultimately, this study bridges the gap between waste management and cutting-edge material innovation, paving the way for more sustainable practices in future research and applications.

2. Materials and Methods

2.1. Materials

Sulphuric acid (95–97%) was purchased from Merck, and all solutions were prepared using distilled water.
The nonwoven production was conducted at the Ege University Textile Engineering Department using the needle punching method. Needle punching is an environmentally friendly technique that relies on the mechanical entanglement of fibers without the need for chemical additives.
The fibers were processed into nonwovens using a Dilo needling machine equipped with an automatic feeding system. Initially, single-layered nonwovens were produced by blending jute and cotton wastes in a 25% to 75% ratio, respectively, and processing them through needle punching. These single-layered nonwovens were then combined with woven fabric to enhance the dimensional stability of the final composite structure. This combination was also achieved using the needle punching method, ensuring that no chemicals were introduced during the production process.
Figure 1 provides a schematic representation of the resulting composite textile structure. The final composite consisted of five layers: two nonwoven layers made from blended fibers and a woven cotton fabric sandwiched between them, with a total average thickness of approximately 2.5 mm.

2.2. Carbonization Systems
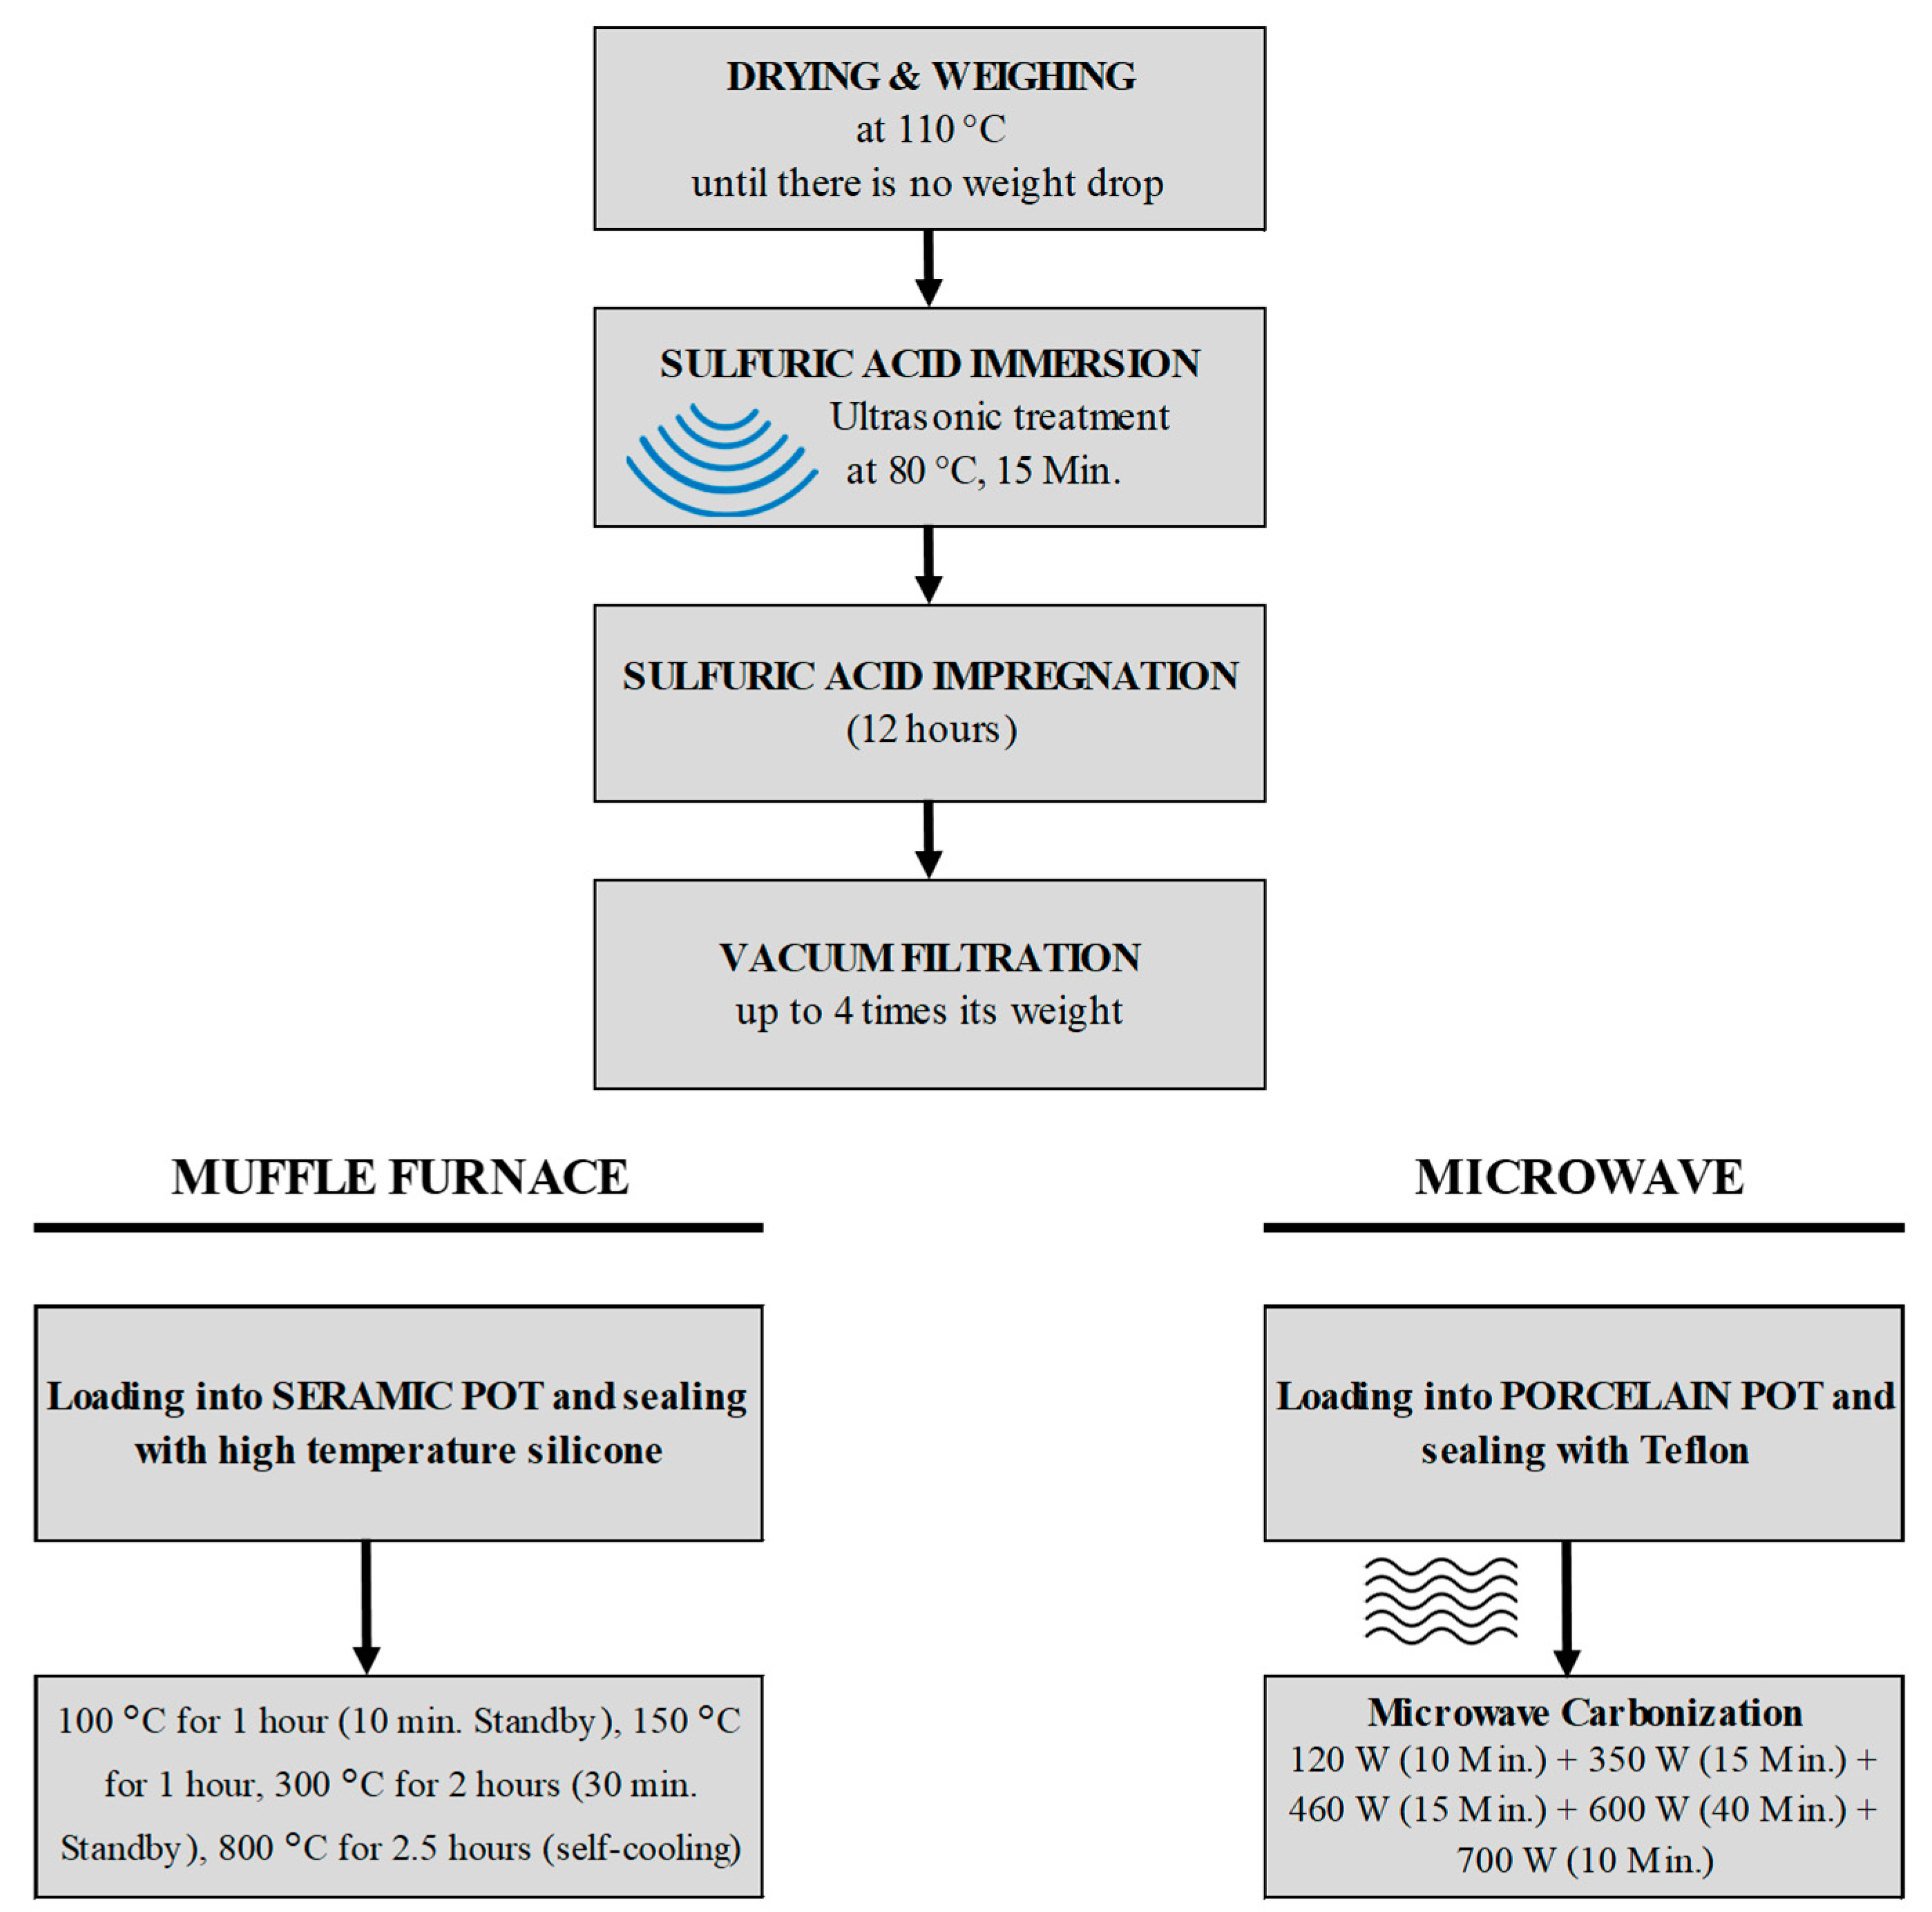
Two different heating technologies were employed for carbonization and activation: a muffle furnace and a microwave oven. For the muffle furnace experiments, a household-type ceramic pot with a diameter of 12 cm and a height of 6 cm was used as the reactor.
For microwave-assisted carbonization, a 700 W microwave oven (Arçelik MD 674) operating at a frequency of 2.45 GHz was utilized. While quartz reactors are commonly used in microwave pyrolysis research due to their transparency to microwaves, they are costly (approximately 25 times more expensive than porcelain) and challenging to fabricate in larger sizes. Hence, a porcelain reactor was chosen, with dimensions of 5 cm in height, 7 cm in inner diameter, and 5 mm in wall thickness. Porcelain, a microwave-transparent material composed of quartz, feldspar, and clay, is known for its excellent resistance to high temperatures (up to 1400 °C) and chemicals.
To seal the reactor, high-temperature PTFE was used as a soft-flexible sealing material, replacing hard and brittle alternatives such as silicone sealants and casting plaster. The PTFE sealing also served as a relief valve, enhancing both safety and performance during the carbonization process.

2.3. Methods

The muffle furnace heating process was conducted at a maximum temperature of 800 °C. The textile composites were placed inside a ceramic pot, which was sealed using a high-temperature silicone sealant capable of withstanding temperatures up to 1500 °C. The temperature program used for the experiments was as follows:
  • 100 °C for 1 h (10 min. Standby)
  • 150 °C for 1 h
  • 300 °C for 2 h (30 min. Standby)
  • 800 °C for 2.5 h (self-cooling)
The microwave heating experiments were conducted under controlled power levels to prevent thermal shocks to the porcelain reactor and simulate slow pyrolysis. The heating procedure involved gradually increasing microwave power as follows: 120 W for 10 min, 350 W for 15 min, 460 W for 15 min, 600 W for 40 min, and 700 W for 10 min. The total duration of the process was 1.5 h.
It should be noted that a microwave-treated dry sample was not included in this study. Since dry textiles lack the polar molecules necessary for effective microwave absorption, uniform heating could not be achieved (Figure S1). As a result, microwave-assisted carbonization was only applied to acid-treated samples, where H2SO4 facilitated energy absorption and thermal decomposition.

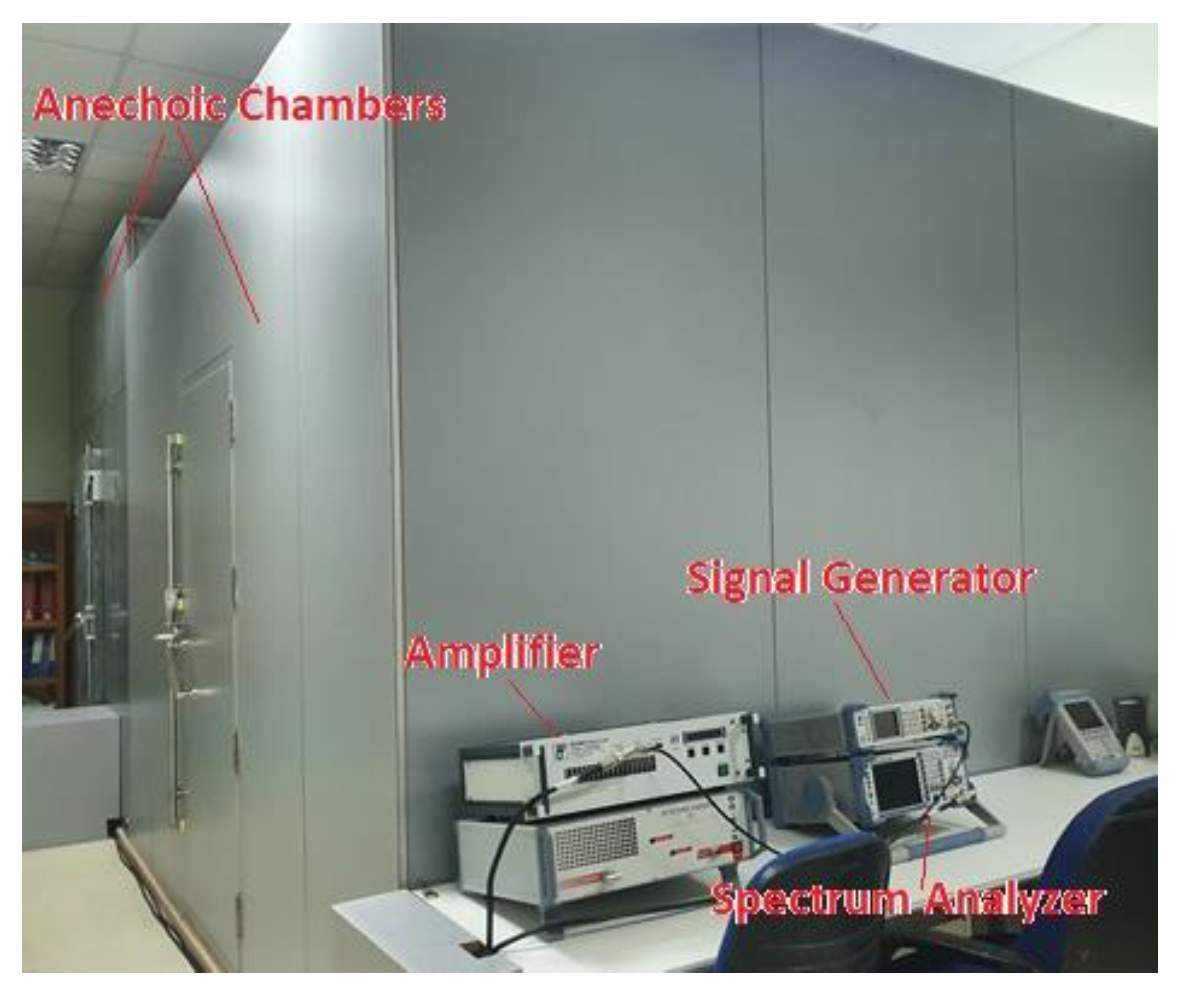
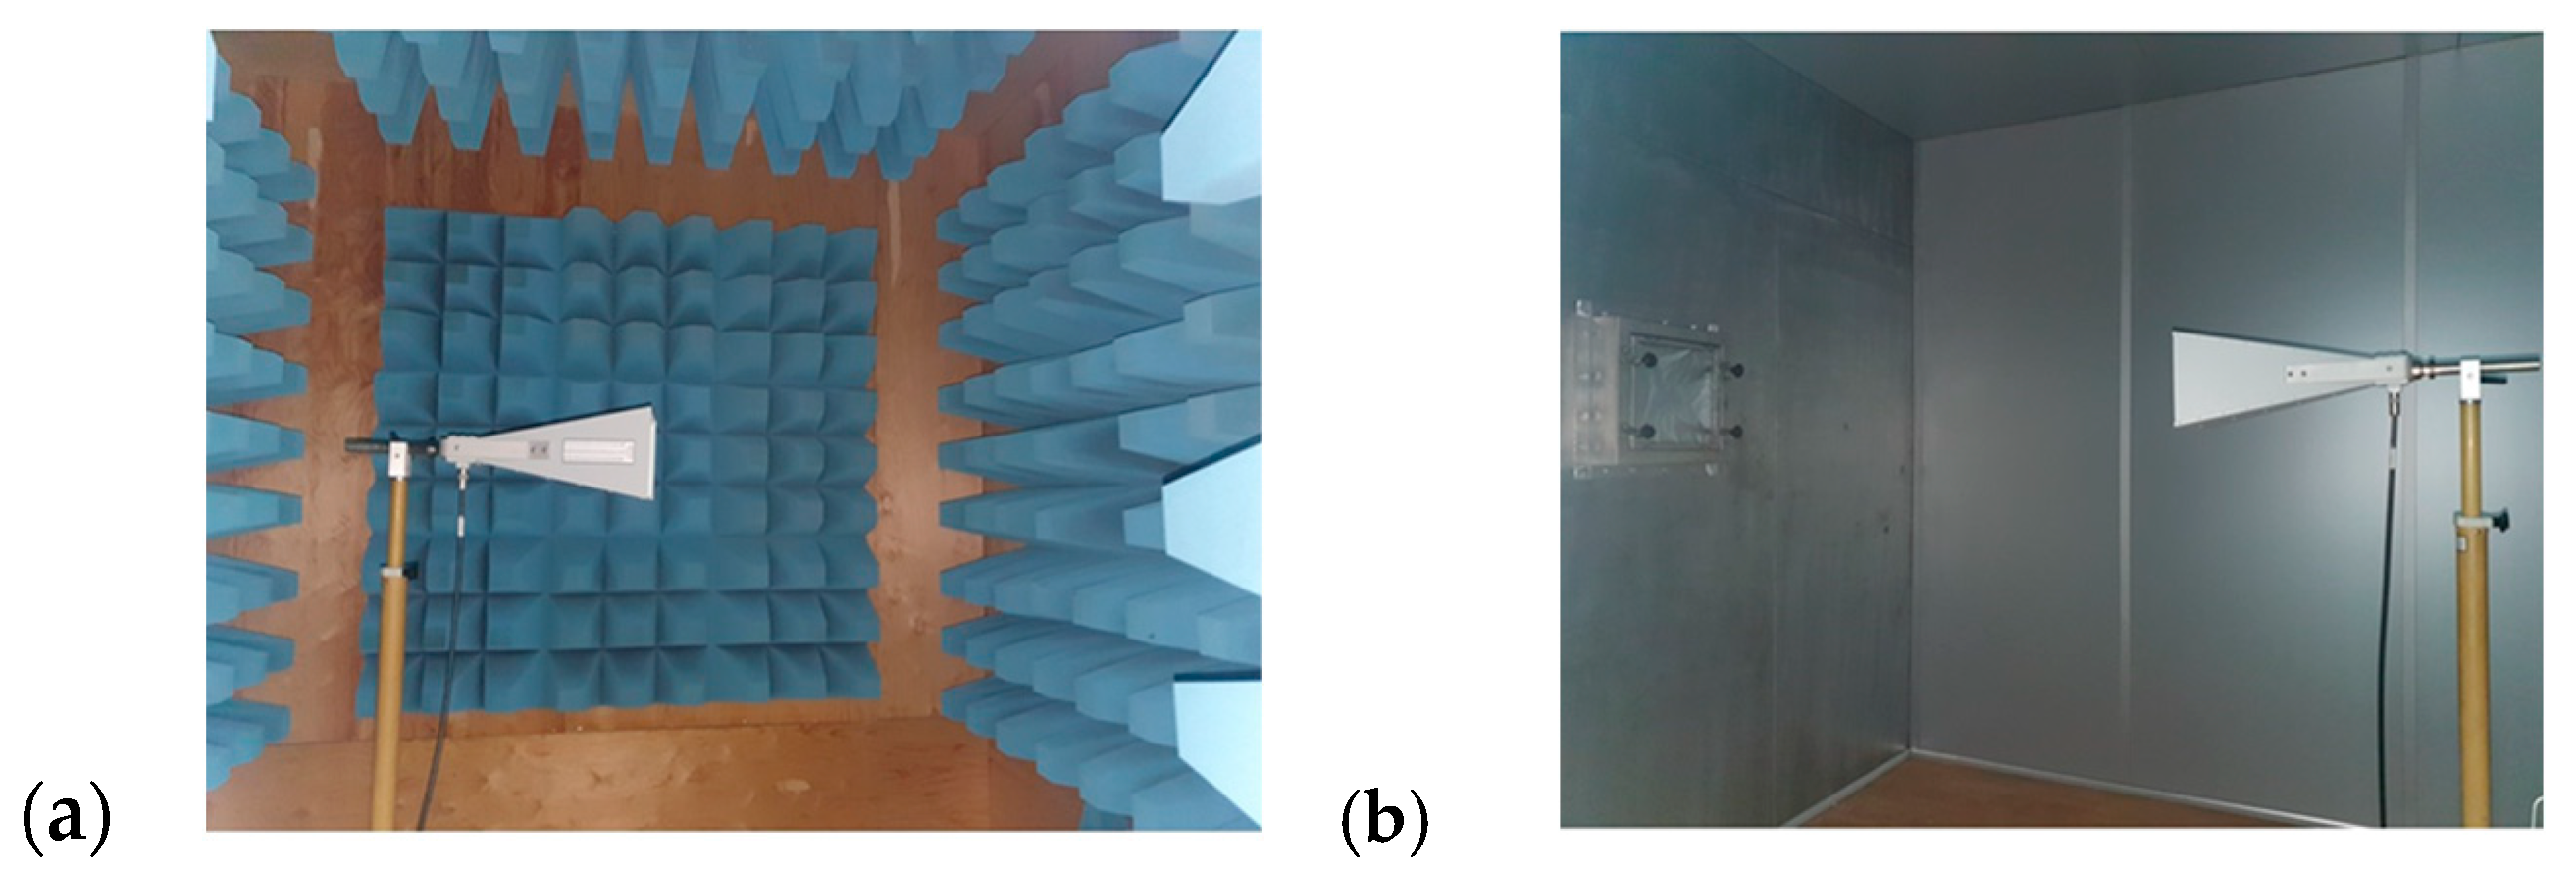
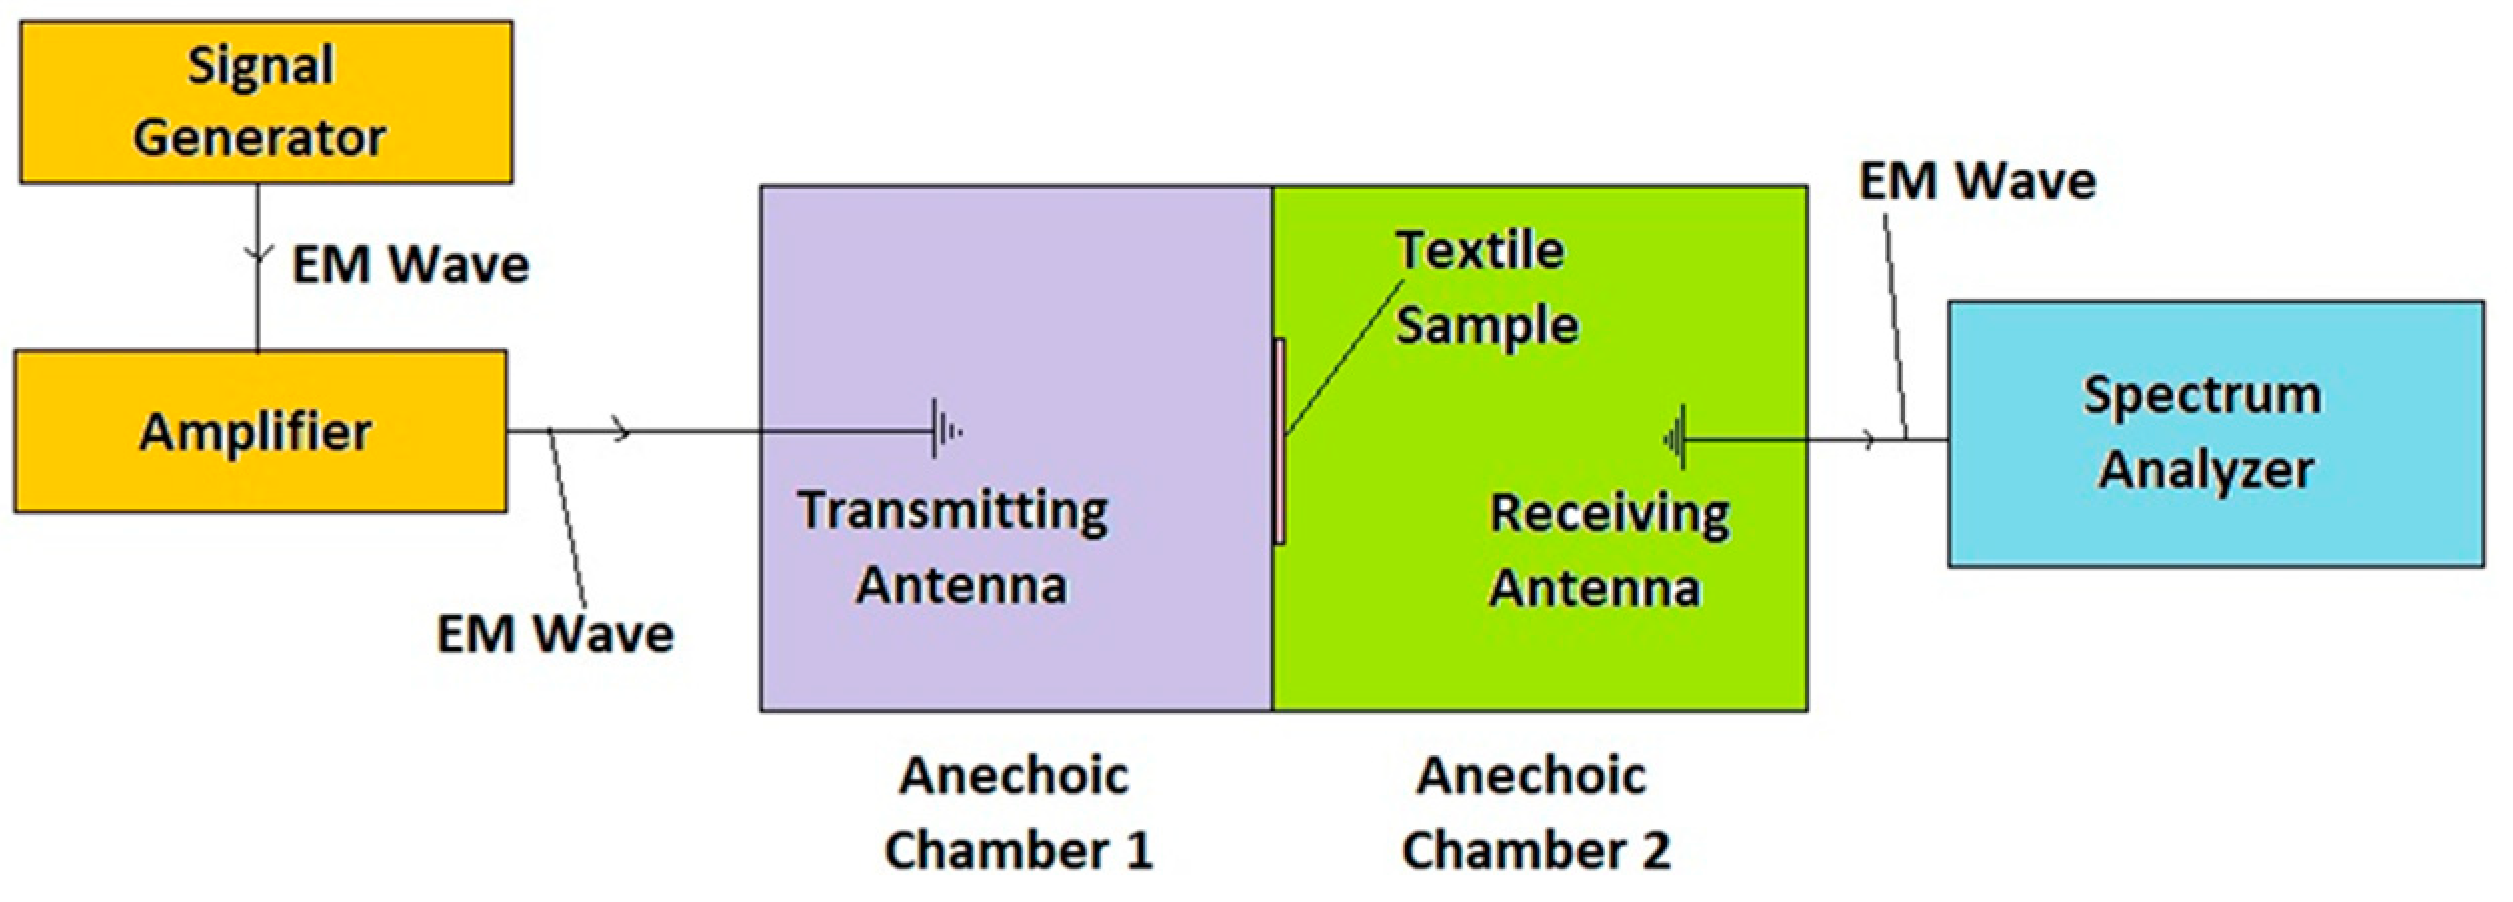
2.4. Experimental System

Figure 2 presents the flowchart of the experimental system. Sulfuric acid functioned as both a dehydration and activation agent, effectively minimizing the release of volatile organic compounds and preventing greenhouse gas emissions, as demonstrated in our previous studies [23,24]. An 8% concentration was safe, as it provides the best conditions for activation while keeping the material stable.

2.5. Characterizations and Methods

X-ray Diffraction (XRD): XRD analysis was performed using a Rigaku Ultima IV X-Ray Diffractometer. Diffraction patterns were collected at room temperature across a 2θ range of 10° to 70°, employing CuKα radiation.
Brunauer-Emmett-Teller (BET) and Pore Size Analysis: The pore structure was characterized using BET analysis on a Micromeritics Instrument Corporation Gemini VII (Version 5.03). Pore size distribution was evaluated using the Barrett-Joyner-Halenda (BJH) method. The analyses were conducted under N2 adsorption-desorption isotherms at 78.39 K, with a relative pressure range (P/P0) from 0.01 to 1. Prior to analysis, the samples were degassed at 300 °C for 5 h in a nitrogen atmosphere.
Scanning Electron Microscopy (SEM): Morphological analysis was conducted using a Carl Zeiss 300 VP Scanning Electron Microscope (SEM) (Zeiss, Jena, Germany). To enhance image quality, the sample surfaces were gold-coated before imaging.
All carbonized samples were cut into a 3 × 3 cm dimension before testing for resistivity and EMSE to maintain measurement consistency.
Electrical Resistivity: The electrical resistivity measurements were conducted using the four-probe method with a Lucas Signatone Pro4 system. The process was computer-controlled via a Keithley source meter, and the reported values represent the average of five independent measurements to ensure accuracy and reliability.
Electromagnetic Interference (EMI) Shielding: The effectiveness of EMI shielding was measured using a system consisting of transmitting and receiving antennas, a signal generator, an amplifier, two anechoic chambers, and a spectrum analyzer. Measurements were carried out over a frequency range of 1 to 6 GHz, following the TS EN50147-1 standard. Figure 3, Figure 4 and Figure 5 present schematic illustrations of the test system and antennas used.
During the measurement, the sample was placed between a transmitting and a receiving antenna, each in one shielded room, the shielded rooms being adjacent to each other. According to the measurement principle of the electromagnetic shielding effectiveness test system, the EM wave generated in the signal generator was sent to the textile sample through the transmitting antenna after being amplified by the amplifier. The sample blocked a part of the radiation, and the remaining was transmitted through the sample to the receiving antenna. Electromagnetic shielding effectiveness was then calculated as the EM field blocked by the sample after the number of transmitted signals was measured by the spectrum analyzer [39].
Statistical Analysis: All reported values in this study are based on multiple measurements. For electrical resistivity, five measurements (n = 5) were taken, whereas for EMSE analysis, three independent samples (n = 3) were measured across the 1–6 GHz frequency range. Due to the small sample size, sample standard deviation (s) was used instead of population standard deviation (σ), following the Bessel correction method (n − 1 denominator) to improve accuracy. Error bars in graphs represent standard deviation unless stated otherwise.

3. Results and Discussion
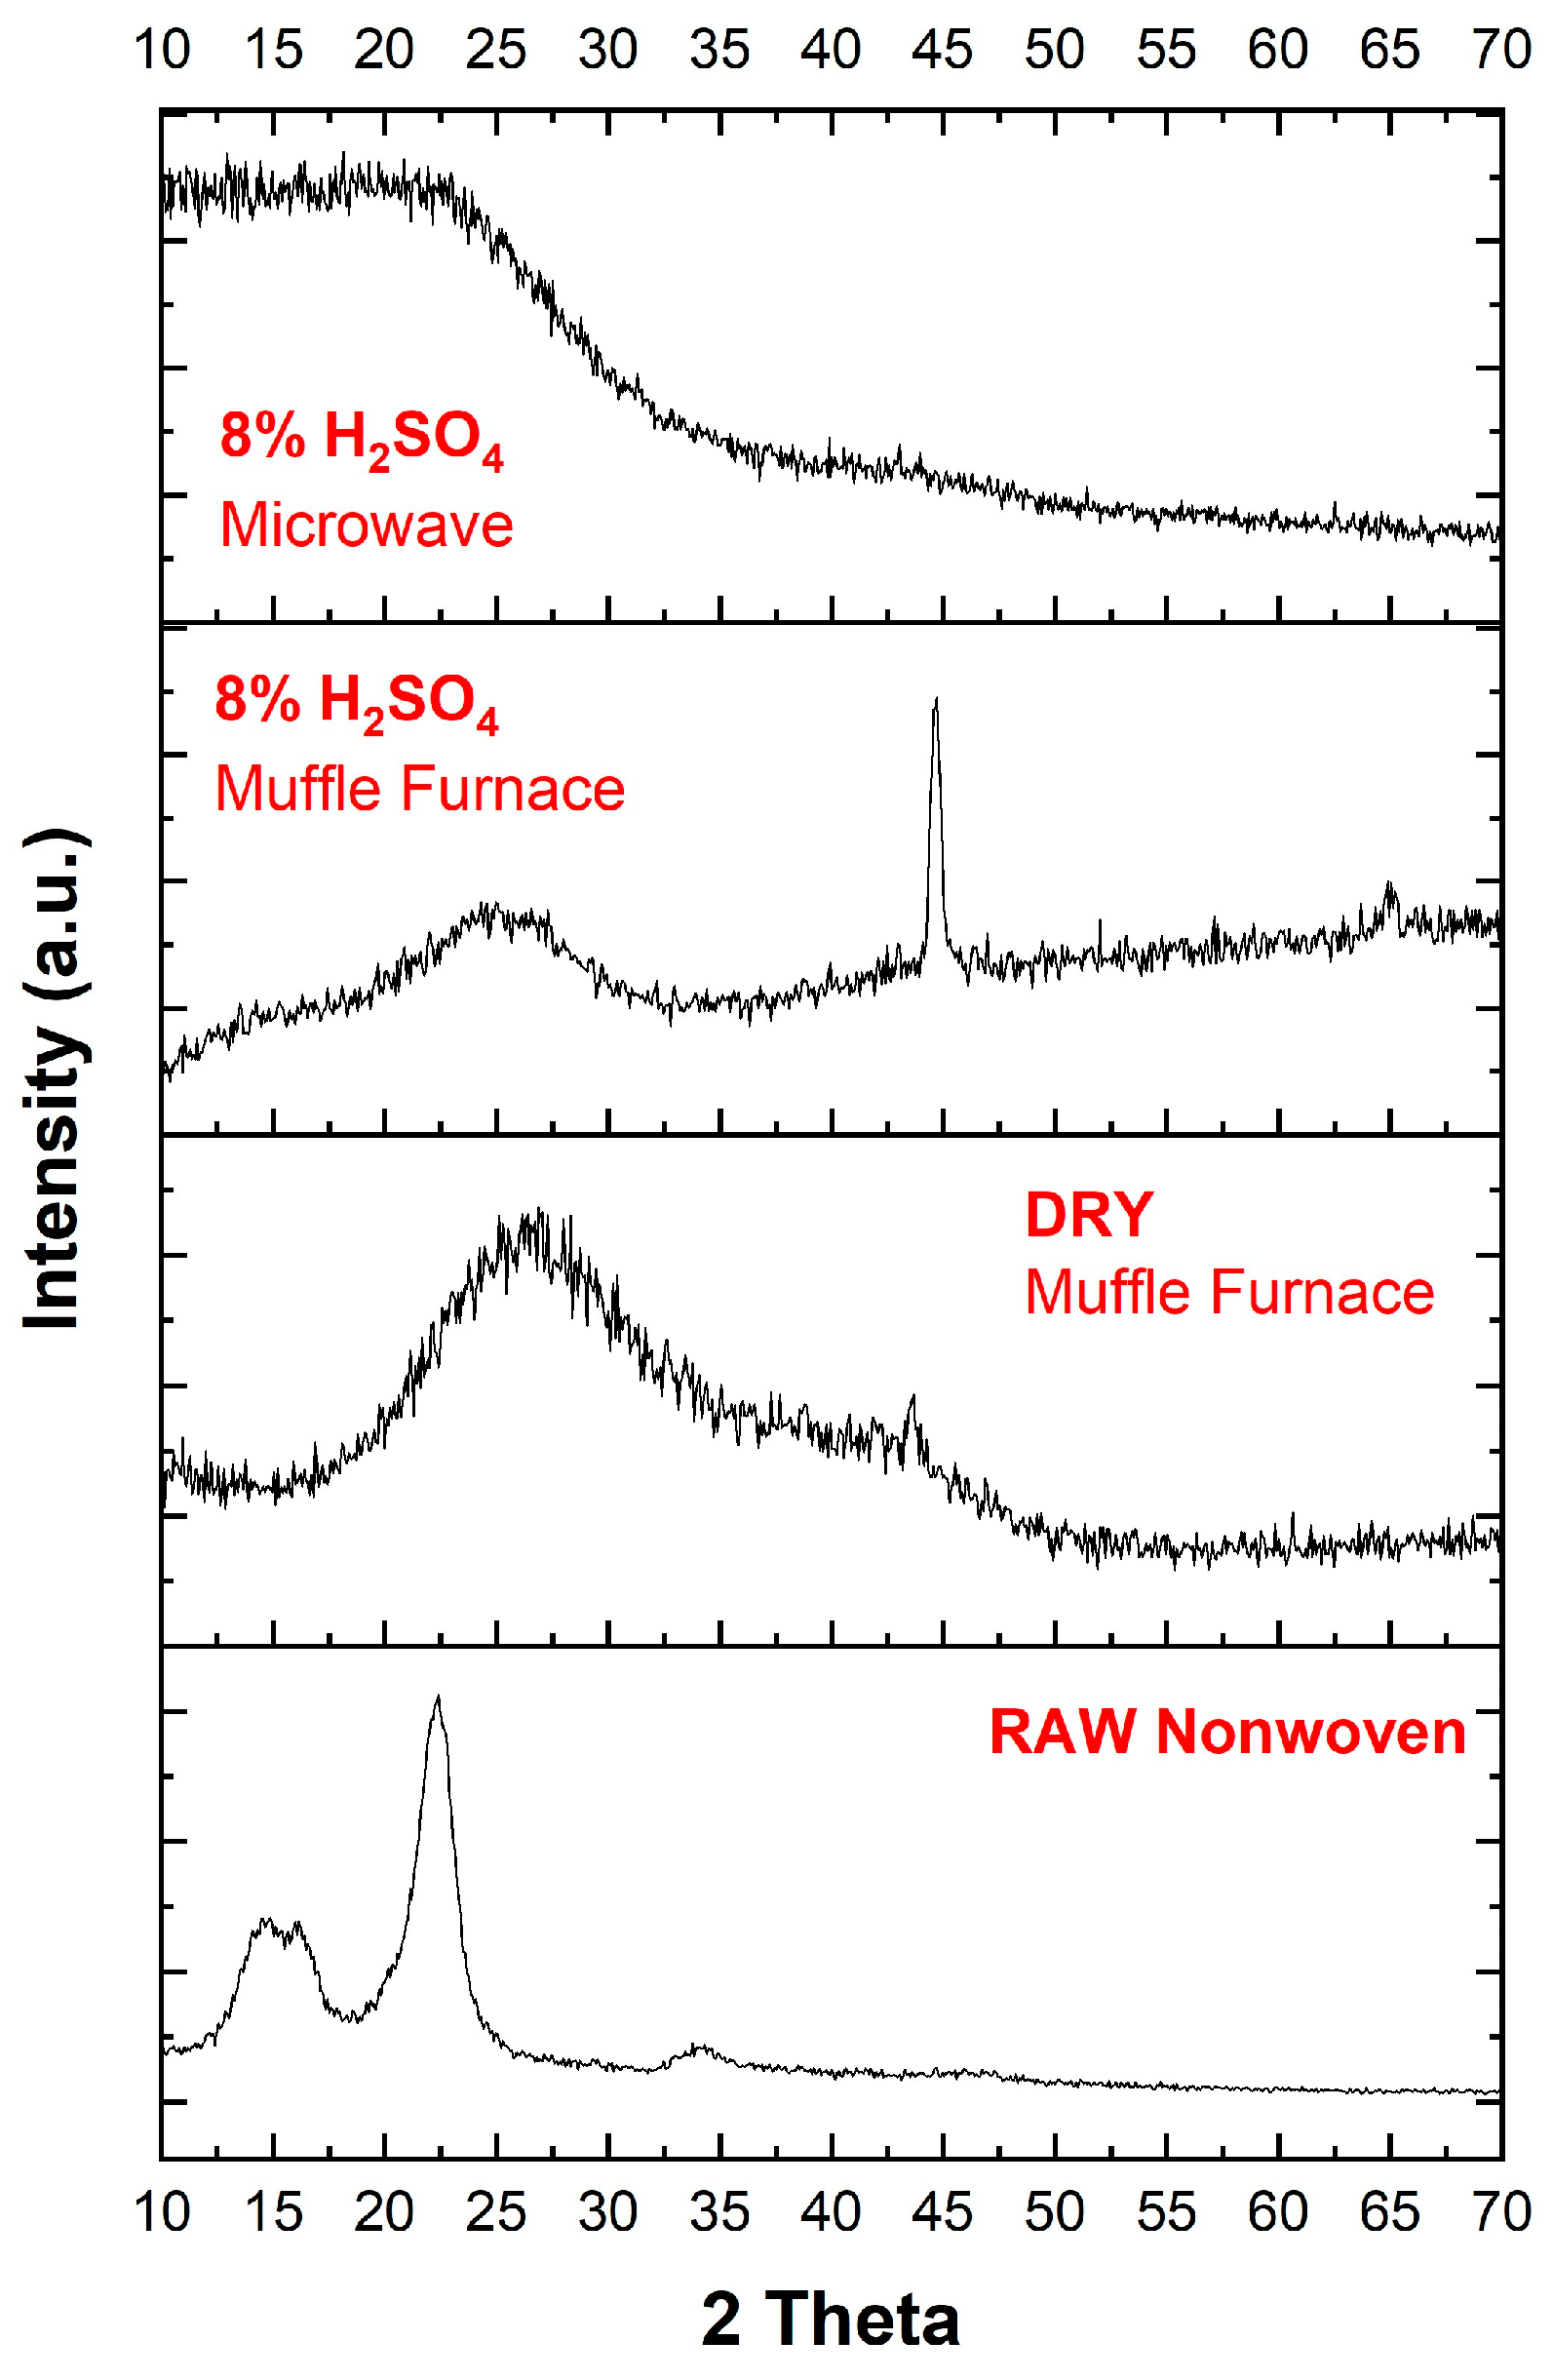
3.1. XRD Analysis

Figure 6 and Table 1 present the XRD patterns of raw textile and activated carbon textiles produced using different carbonization processes. The diffraction peaks observed at approximately 20°, 25°, and 44° correspond to the (002) and (100) planes of amorphous carbon, respectively. These findings are consistent with literature reports, confirming the amorphous nature of the carbon produced [16,40].
The raw nonwoven material exhibits sharp peaks indicative of crystalline phases, potentially originating from textile additives or inherent crystalline regions in the raw material. After the activation and carbonization processes, these sharp peaks diminish, and broader peaks emerge, reflecting the transition to an amorphous carbon structure.
Effect of Processing Methods:
Microwave Process with 8% H2SO4
Samples treated with acid and subjected to microwave processing show broader (002) peaks and a noticeable shift of the 2θ value to lower angles. It indicates an increase in interlayer spacing, calculated to be approximately 0.43 nm using Bragg’s Law. The broader nature of the peaks highlights the greater degree of amorphization and structural disorder introduced by microwave energy. The rapid and localized heating mechanism of microwaves likely facilitates the penetration of the activation agent, effectively disrupting the carbon structure and increasing porosity.
Muffle Furnace with 8% H2SO4
Acid-treated samples processed in the muffle furnace exhibit sharper (002) peaks compared to the microwave samples. The 2θ peak position is closer to graphite, suggesting lower interlayer spacing and a more crystalline structure. The slower, uniform heating in the muffle furnace results in a more controlled carbonization process, leading to less structural disorder.
DRY Muffle Furnace:
Samples processed without acid (DRY-Muffle Furnace) demonstrate relatively narrower peaks compared to the raw textile but are still sharper than those processed with acid. The absence of an activation agent limits structural disruption, resulting in less amorphization and a more compact carbon structure.
Comparative Analysis:
The interlayer spacing (d-spacing) and degree of amorphization are highest in the microwave-assisted samples treated with H2SO4, emphasizing the effectiveness of the microwave process in producing highly porous and disordered carbon structures. Conversely, the muffle furnace process, particularly in the absence of acid, yields less porous and more crystalline materials.
These observations underscore the significant impact of the carbonization environment (microwave vs. muffle furnace) and chemical activation (acid treatment) on the structural evolution of the carbonized textiles.

3.2. Material Dimensional Change Before-After Carbonization and Product Yield Assessment

The dimensional changes and product yield after carbonization are summarized in Table 2, highlighting the influence of different processing conditions. The microwave-assisted carbonization with 8% H2SO4 (MW 8% H2SO4) resulted in the highest yield (46.73%), while the muffle furnace dry process (MF-DRY) exhibited the lowest yield (22.98%). The presence of H2SO4 appears to enhance carbon retention by stabilizing the structure during thermal decomposition.
In terms of dimensional changes, the MF-DRY method led to the highest shrinkage, with a thickness reduction of ~72% and a diameter reduction of ~51%. In contrast, MW 8% H2SO4 exhibited the least shrinkage, with 64% thickness reduction and only 31% diameter reduction, indicating better structural retention. It suggests that microwave-assisted carbonization results in a more uniform heating process, reducing excessive shrinkage while maximizing carbon yield.
Figure 7 further illustrates the trends observed in product yield across different carbonization methods. This graph clearly compares how process conditions influence carbon retention, supporting the findings discussed above. Notably, the impact of acid treatment and microwave-assisted heating on yield efficiency becomes more evident in the visual representation.
Overall, the results indicate a strong correlation between higher yield and reduced dimensional shrinkage, emphasizing the importance of carbonization method selection in optimizing the final material properties.
The product yield of the samples processed using different activation methods and conditions was calculated by using Equation (1).
Y i e l d % = W e i g h t   o f   A c t i v a t e d   C a r b o n W e i g h t   o f   d r i e d   s t a r t i n g   m a t e r i a l × 100
The inclusion of sulfuric acid (8% H2SO4) in the activation process significantly enhanced the product yield compared to the dry sample treated in a muffle furnace. This improvement is particularly evident in the microwave-processed sample, which achieved the highest yield (46.73%). However, it is important to note that direct temperature measurement was not possible in the microwave system, making a direct comparison with the muffle furnace challenging.

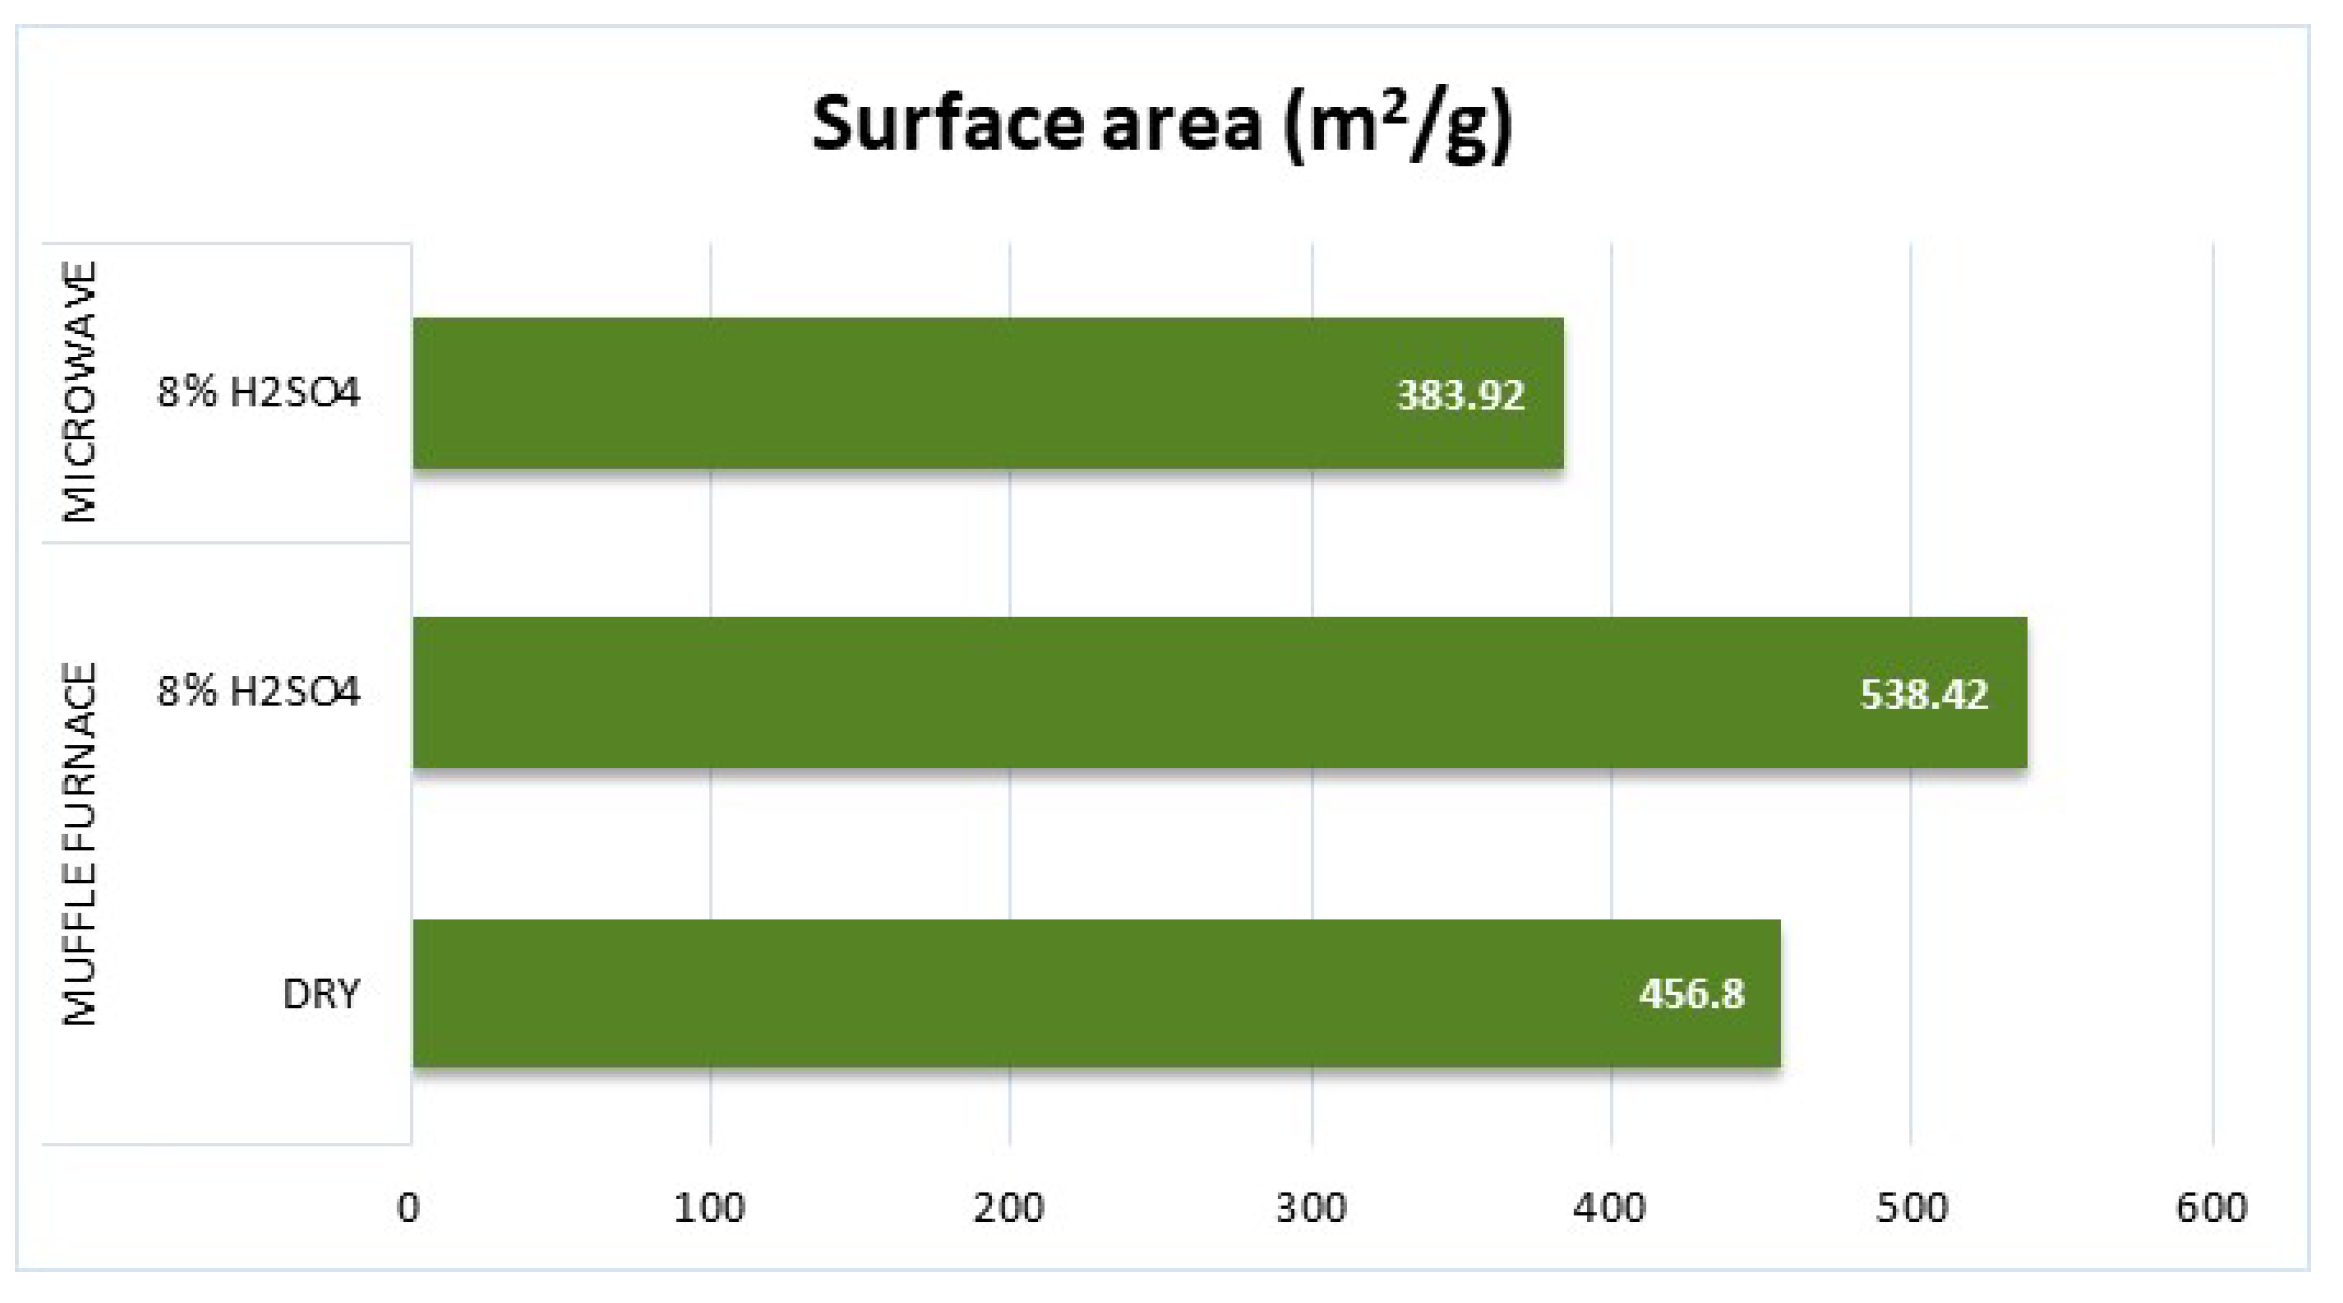
3.3. Surface Area Measurements

The surface area results of the samples obtained by BET measurements are presented in Figure 8.
The BET surface area measurements collaborate with the product yield and electrical resistivity observations. The muffle furnace with 8% H2SO4 achieved the highest BET surface area (538.42 m2/g), indicating more effective activation and pore development compared to the microwave-processed sample (383.92 m2/g). This difference suggests that the microwave process may require optimization of temperature control and heating uniformity to enhance activation efficiency. These findings highlight the trade-offs between the microwave and muffle furnace activation processes, emphasizing the importance of precise thermal control and post-processing conditions in achieving optimal product properties.

3.4. Electrical Resistivity Measurements
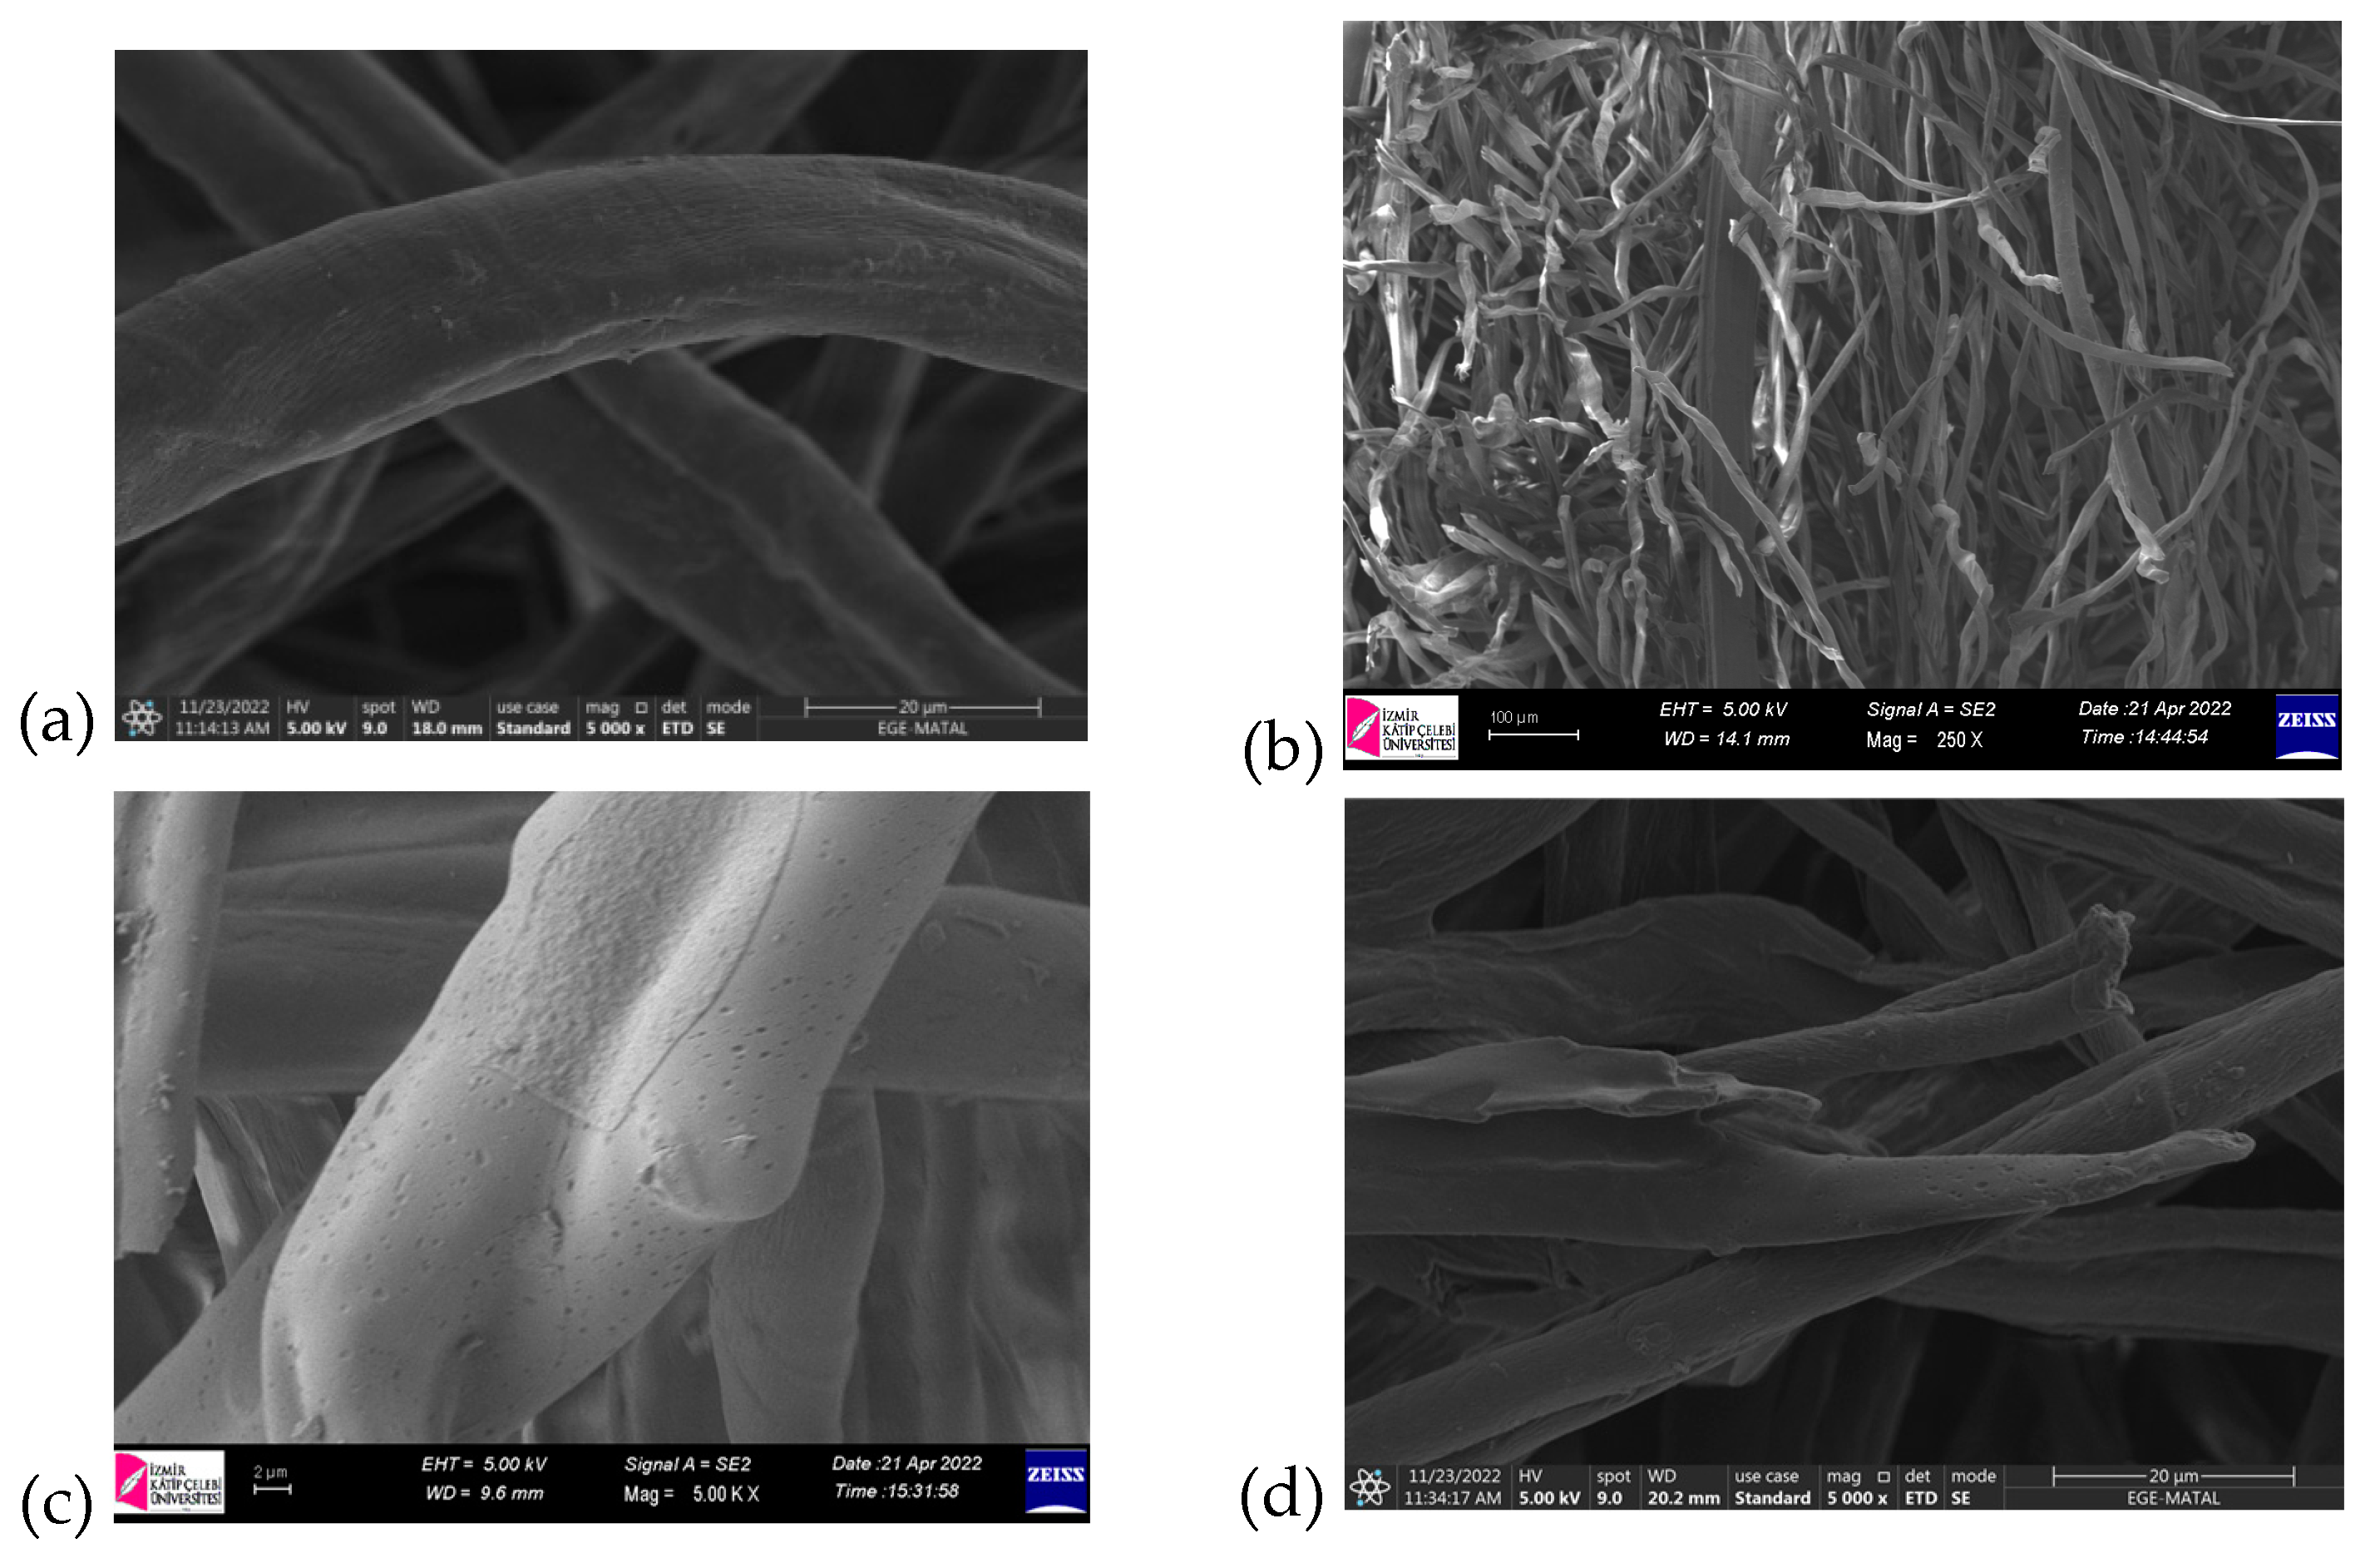
Table 3 summarizes the results of electrical resistivity measurements applied to the samples.
The electrical resistivity analysis revealed that samples treated in the muffle furnace exhibited considerably lower resistivity values, particularly in the 8% H2SO4-treated sample (8.28 Ω·cm), compared to the microwave-processed sample (2.23 × 10⁶ Ω·cm). This substantial difference suggests that the peak temperature in the microwave system did not reach the levels achieved in the muffle furnace (~800 °C). One plausible explanation is the transformation of the initially microwave-transparent porcelain crucible into a microwave-absorbent material beyond a critical temperature threshold, limiting efficient heat transfer during the process.
The significantly higher resistivity observed in microwave-derived carbon can be attributed to its lower crystallinity, as confirmed by XRD analysis. The rapid heating nature of microwave carbonization leads to a more disordered structure with reduced graphitic domains, increasing electron scattering. Additionally, residual tar deposits, which could not be efficiently removed in the microwave system, further obstruct conductive pathways. In contrast, muffle furnace treatment, which allows for gradual and uniform heating, results in improved graphitic ordering, enhancing electrical conductivity.

3.5. SEM Analysis

Figure 9a–c illustrates the scanning electron microscopy (SEM) images obtained for the samples at different stages of processing. SEM was utilized to investigate the morphological changes and the formation of the porous structure induced by carbonization. The micrographs reveal that the textile’s fibrous structure was preserved throughout the carbonization process, demonstrating the thermal stability of the base material.
Notably, significant surface roughness was observed, accompanied by the development of a porous network. This transformation can be attributed to the decomposition of organic components and the release of volatiles during carbonization, which likely contributed to pore formation and enhanced the overall surface area. Such changes are critical for improving material properties, particularly for applications requiring high surface reactivity or adsorption capacity.
Further examination of the SEM images shows a uniform distribution of pores across the surface, suggesting that the carbonization process was consistent and effective. The structural integrity of the fibers, combined with the increased porosity, indicates that the material retains its mechanical robustness while achieving the desired morphological modifications. These findings align with the BET surface area results, corroborating the material’s suitability for applications in energy storage, filtration, or catalysis, where a porous structure is advantageous.

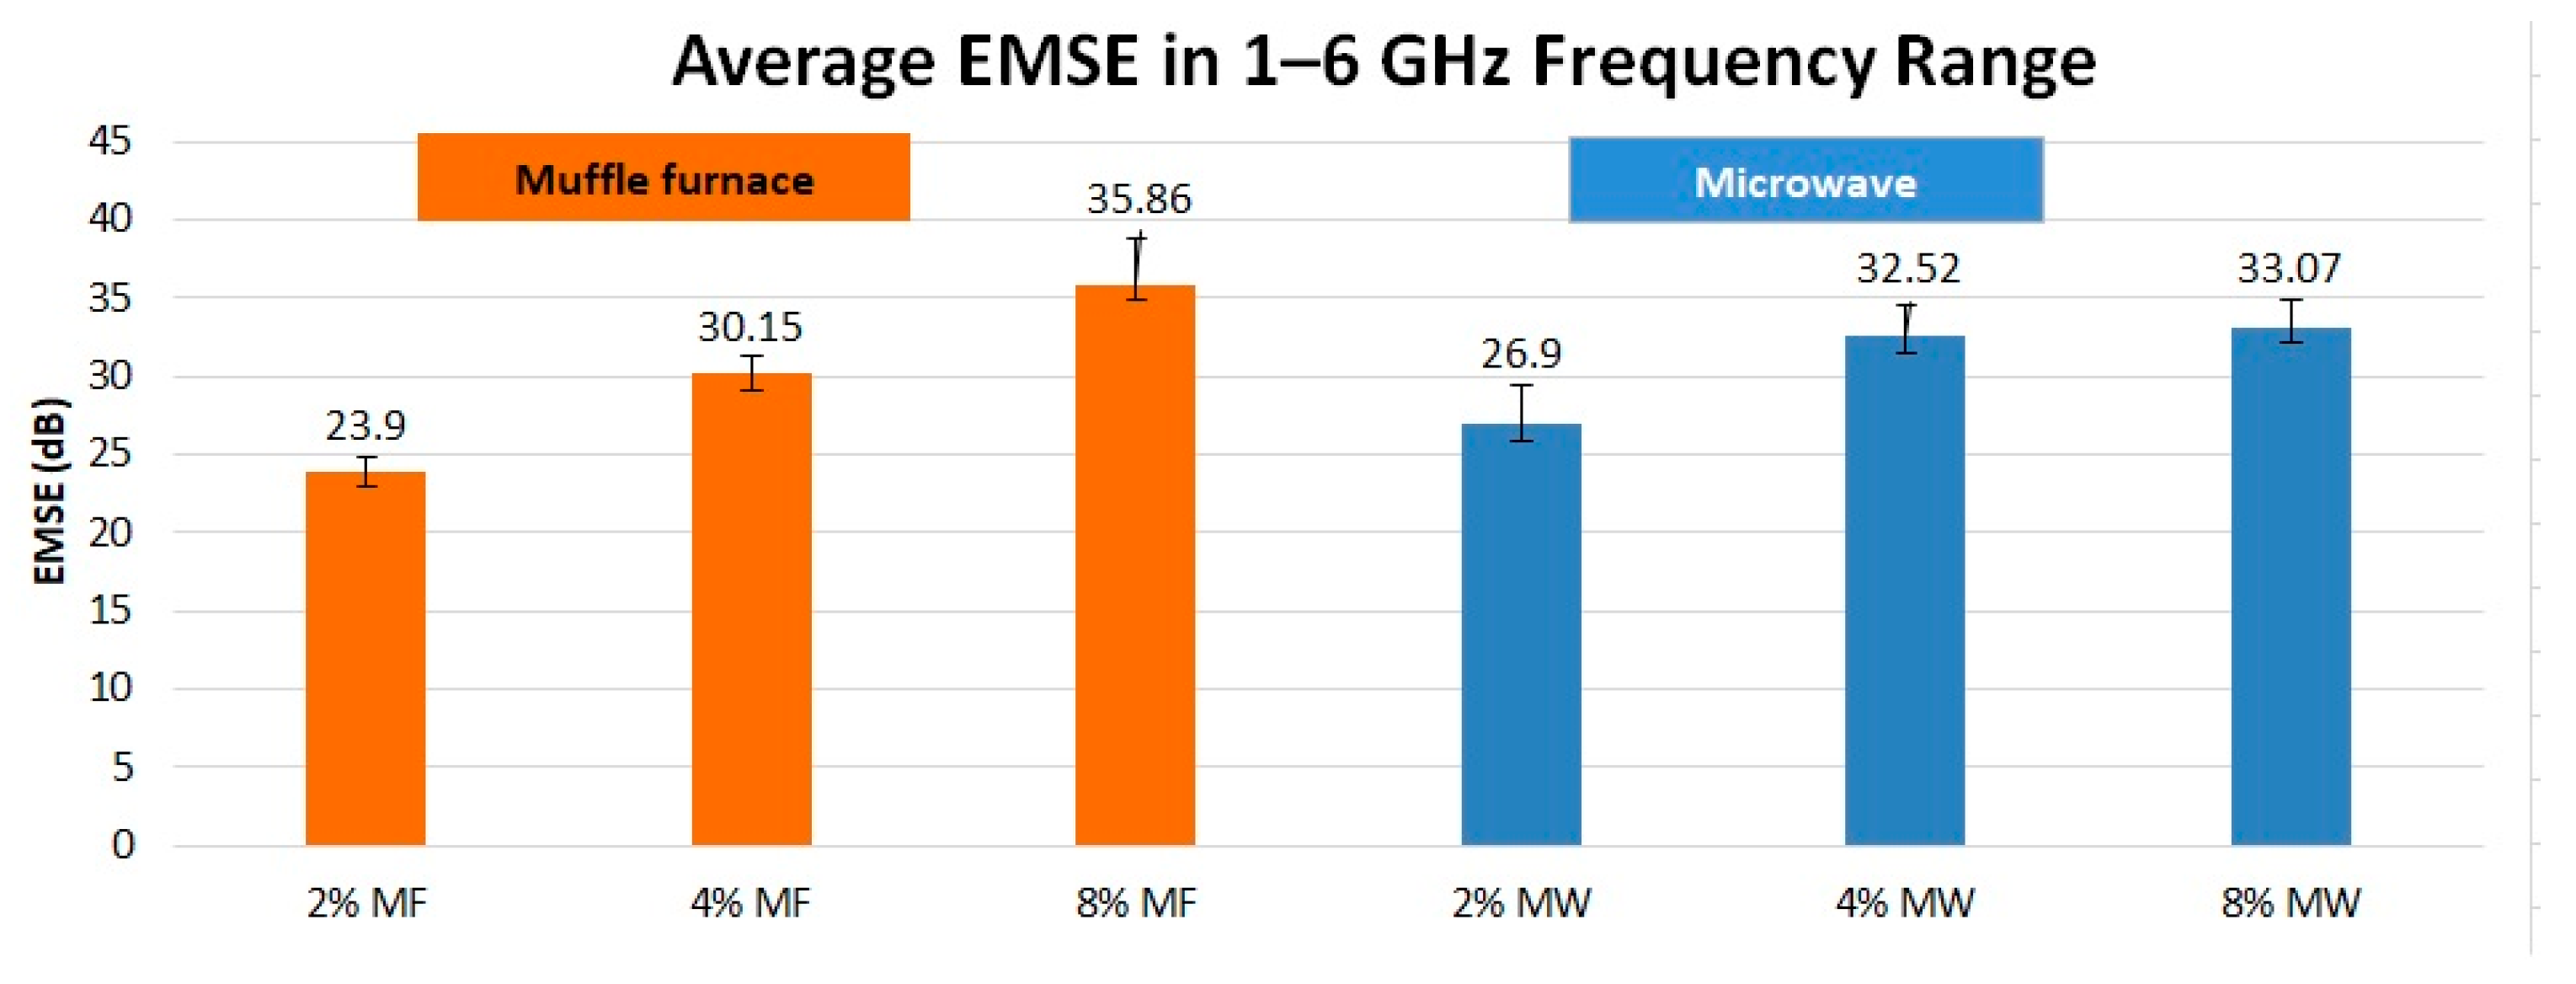
3.6. Electromagnetic Shielding Effectiveness

Electromagnetic shielding effectiveness (EMSE) measurements were conducted using a vector network analyzer (VNA) in the frequency range of 1–6 GHz, following the TS EN 50147-1 standard. The samples were prepared in a standardized 3 × 3 cm size to ensure consistent testing conditions. The shielding performance was evaluated by placing the samples in a waveguide fixture and measuring the attenuation of the transmitted signal.
Figure 10, Figure 11 and Figure 12 illustrate the results of electromagnetic shielding effectiveness (EMSE) measurements for materials produced via the muffle furnace and microwave processes.
The error bars in Figure 10 represent standard error (SE) based on n = 3 measurements for each sample. Given the limited sample size, standard deviation (s) was used as the statistical metric rather than population-based calculations. The variations observed align with structural inhomogeneities and material processing differences. The full dataset is presented in the Supplementary Document (Table S1).
The maximum EMSE values were recorded as 47.56 dB at 2 GHz for the muffle furnace process and 38.60 dB at 1 GHz for the microwave process. These values correspond to a moderate performance level suitable for commercial and industrial applications, with both processes exceeding the threshold of 20 dB (99.99% attenuation) required for effective electromagnetic interference (EMI) shielding.
The superior shielding performance observed for the muffle furnace sample is attributed to the higher conductivity and well-developed porous structure, which promotes multiple internal reflections of electromagnetic waves. The muffle furnace process reaches higher temperatures (approximately 800 °C), enabling a more complete carbonization process and reducing surface residues such as tar and oils. It leads to improved charge carrier mobility, which is critical for enhancing the material’s shielding effectiveness.
In contrast, the microwave process, although achieving moderate EMSE values, shows comparatively lower performance due to several factors. The limited ability to measure and control temperature during microwave processing may result in incomplete carbonization and the presence of surface residues that impair conductivity. Additionally, the rapid cooling inherent in the microwave process may limit the formation of uniform and interconnected pores, which are crucial for increasing internal reflections and enhancing EMSE.
As the acid concentration increases during the activation process, both processes exhibit an increase in porosity and surface roughness. These structural changes facilitate the scattering and absorption of incident electromagnetic waves, improving the shielding mechanism. The higher pore density creates additional pathways for multiple reflections, while the increased surface roughness enhances wave attenuation through absorption.
The results suggest that while both methods achieve EMSE values suitable for EMI shielding applications, the muffle furnace process demonstrates superior effectiveness due to its ability to produce a more conductive and porous structure. These findings underscore the importance of optimizing processing conditions to achieve the desired balance between conductivity, porosity, and structural integrity for advanced EMI shielding materials.
To contextualize our findings within the existing body of research, Table 4 presents a comparison of EMI shielding studies using various fabrication techniques and materials. This comparison highlights the strengths and limitations of different approaches, emphasizing the trade-offs between material properties, processing methods, and shielding effectiveness. Our study demonstrates comparable or enhanced performance while maintaining a focus on sustainability, as discussed in Section 3.7.

3.7. Green Performance Efficiency (GPE): A Novel Process-Oriented Metric

Sustainable development in material science requires a comprehensive evaluation of production processes that balances environmental impact and operational efficiency. Metrics are fundamental tools for comparing processes, particularly when multiple economically viable options are available to achieve the same product. The key question these metrics aim to answer is: “Which option causes the least environmental harm and is therefore the greenest?” Current metrics for evaluating sustainability in chemical processes can be broadly classified into two categories: mass-based metrics and impact-based metrics [38,50].
Mass-Based Metrics: Mass-based metrics, such as Atom Economy, E-factor, Yield, Reaction Mass Efficiency (RME), and Effective Mass Efficiency (EME), focus on the ratio of desired product mass to waste mass. While these metrics provide a straightforward way to measure resource efficiency, they fail to differentiate between harmful and less harmful wastes. For instance, a process that generates a smaller quantity of waste may appear greener according to these metrics but could still be less sustainable if the waste generated has severe environmental impacts. Despite this limitation, mass-based metrics are widely used due to their simplicity and reliance on readily available data, making them practical tools for monitoring company-wide reductions in environmental harm [37].
Impact-Based Metrics: In contrast, impact-based metrics, such as those employed in Life-Cycle Assessment (LCA), evaluate both mass and environmental impact. LCA analyzes the overall environmental impact of a product from cradle to grave. These metrics are particularly useful for determining the greenest option among multiple synthetic pathways. However, they often require detailed emissions data, making them more complex and less accessible, especially for laboratory-scale processes.
The Role of GPE in Addressing These Gaps: This study positions the Green Performance Efficiency (GPE) metric as a novel and complementary approach that bridges the gap between mass-based and impact-based metrics. By integrating parameters such as energy consumption, process time, and performance metrics like EMSE, GPE provides a process-oriented framework that evaluates both operational and environmental efficiencies. Unlike traditional mass-based metrics, GPE incorporates operational complexity and performance outcomes, offering a more nuanced and comprehensive assessment.
To address these limitations, this study introduces the GPE metric, a framework that integrates process yield, product performance, specific energy consumption, active time, PMI, and process complexity into a unified evaluation tool. By providing a holistic assessment, the GPE metric enables researchers to identify trade-offs and optimize processes for both material performance and environmental sustainability.
The proposed formula for the GPE metric is as follows:
G P E = Y i e l d × P e r f o r m a n c e S p e c i f i c   E n e r g y × T i m e × P M I × P r o c e s s   S t e p s   ( N )
S p e c i f i c   E n e r g y = T o t a l   E n e r g y   I n p u t k W h M a s s   o f   A c t i v e   C a r b o n   P r o d u c e d   ( g )
Yield (%): Represents the efficiency of material conversion into the desired product, a fundamental indicator of process success.
Performance: Quantifies the functional effectiveness of the product, such as electromagnetic shielding effectiveness (EMSE).
Energy Input (kWh): Accounts for the total energy consumed during the process, reflecting energy efficiency.
Time (h): This parameter represents the active time required for the process, emphasizing the importance of time efficiency. Active time is defined as the total duration during which energy is consumed to perform the process. This parameter ensures that only the energy-utilizing phases of the process are accounted for, providing a more accurate evaluation of energy efficiency.
PMI (Process Mass Intensity): Provides a comprehensive measure of material utilization, encompassing waste generation and process efficiency.
Process Steps (N): It captures the complexity and operational simplicity of the process, with fewer steps indicating higher efficiency and reduced risks.
As shown in Table 5, the GPE metric integrates multiple dimensions of sustainability, distinguishing it from traditional green metrics that primarily focus on mass or impact-based evaluations.

3.7.1. GPE Components and Their Interplay

  • Yield and PMI: Balancing Material Efficiency: While Yield and Process Mass Intensity (PMI) are distinct metrics, they are inherently connected in evaluating the efficiency and sustainability of a process. Yield focuses on the conversion efficiency of the primary material—in this case, the textile material—into the desired product, such as activated carbon. It represents the direct outcome of the carbonization process, emphasizing how effectively the core material is utilized. On the other hand, PMI considers the total material input, including auxiliary materials, activation agents, and any additional substances used during the process. It provides a broader perspective on resource efficiency by accounting for all inputs, not just the primary feedstock. The relationship between these two metrics becomes evident when examining processes with high PMI but low Yield, as this indicates significant material inefficiencies. Conversely, a low PMI combined with a high Yield reflects a highly optimized process where material usage and conversion are both efficient. For example, in processes where large amounts of activation agents or auxiliary materials are required, PMI will increase, even if the Yield of the primary material is high. A process with high Yield but poor auxiliary material management may still result in inefficiencies, which PMI can capture. Thus, integrating both metrics into a comprehensive evaluation framework, such as the Green Performance Efficiency (GPE) metric, allows for a more holistic assessment of process sustainability. By balancing Yield and PMI, researchers can identify trade-offs and optimize processes for both material conversion and resource utilization.
  • Energy and Time: Critical Drivers of Sustainability: Energy consumption and process duration directly impact environmental and operational sustainability. Processes that minimize these parameters are inherently more scalable and eco-friendly.
  • Process Steps: Complexity and Scalability: The number of process steps reflects a method’s operational complexity. Simpler processes with fewer steps reduce resource consumption, enhance reproducibility, and minimize error risks.
  • Multiplicative Approach: The denominator of the GPE formula uses a multiplicative framework to capture the compounded impact of inefficiencies. It ensures that a single parameter’s inefficiency cannot be offset by improvements in other areas, making the metric rigorous and realistic.

3.7.2. Significance of GPE in Green Chemistry and Engineering

The GPE metric bridges the gap between traditional sustainability metrics and modern engineering needs by integrating both operational and environmental parameters. This versatility makes GPE a valuable tool across multiple domains:
  • Laboratory-Scale Evaluation: Enables direct comparison of different material processing techniques under controlled conditions.
  • Industrial Relevance: Helps assess process scalability and optimization for large-scale production.
  • Sustainability Assessment: Balances material efficiency, energy consumption, and environmental impact to support green manufacturing decisions.

3.7.3. Industrial Adaptation of GPE

While GPE provides a robust evaluation framework for laboratory-scale processes, scaling it for industrial applications requires additional considerations. Large-scale manufacturing introduces process variability, energy infrastructure constraints, automation levels, and economic factors that must be integrated into the GPE framework for broader applicability.
Key modifications for industrial adaptation include:
  • Industrial Yield Efficiency: Bridging Laboratory and Industrial Scales
Unlike laboratory conditions, where material losses are minimal, industrial-scale production involves significant material inefficiencies due to factors such as:
  • Material Handling Losses: Degradation or waste of raw materials during transportation, storage, or pre-processing.
  • Process Losses: Heat dissipation, incomplete reactions, or side-product formation in large-scale thermal and chemical processes.
  • Post-Processing Losses: Additional purification or shaping steps leading to further material waste.
To ensure that GPE remains a realistic tool for assessing sustainability at an industrial scale, yield efficiency should account for these losses rather than just the final product output [41].
2.
Economic Feasibility & Cost-Based Weighting
Industrial decision-making heavily depends on cost-effectiveness. A modified GPE framework could incorporate:
  • Operational Costs (e.g., energy, labor, maintenance).
  • Raw Material Expenses (e.g., sourcing, transportation).
  • Process Economics (e.g., production rate, market viability).
A cost-adjusted GPE model would provide a more comprehensive assessment of process sustainability from an industrial perspective [51].
3.
Life Cycle Assessment (LCA) Integration
While current GPE calculations focus on energy and resource efficiency, an LCA-integrated approach would allow for a more holistic environmental impact assessment [51]. Future iterations of GPE could incorporate following:
  • Carbon Footprint
  • Water Consumption
  • Waste Disposal & Recycling Metrics
It would align GPE with globally recognized sustainability evaluation frameworks.
4.
Automation & Process Control Considerations
Automation plays a crucial role in optimizing industrial energy consumption, waste reduction, and overall efficiency [52]. Future iterations of GPE could:
  • Account for automated process control systems that enhance efficiency.
  • Differentiate between manual vs. automated production lines.
  • Factor in real-time energy optimization systems.

3.7.4. Expanding GPE to Other Green Manufacturing Sectors

Although originally developed for carbonization processes, GPE can be adapted to evaluate sustainability across various industries by integrating sector-specific parameters.
  • In battery manufacturing, GPE can incorporate: Specific capacity (mAh/g), cycle stability, and power density to assess performance in energy storage applications.
  • In solar cell production, GPE can factor in: Power conversion efficiency (PCE%) and long-term stability to evaluate sustainability.
By tailoring GPE to these parameters, it can serve as a standardized framework for comparing sustainability across multiple green manufacturing sectors. It ensures that industries seeking to balance material efficiency, environmental impact, and functional performance have a reliable tool for decision-making.

3.7.5. Sustainability Assessment of Carbonization Processes Using the GPE Metric

The GPE metric was applied to two commonly used carbonization technologies—muffle furnace and microwave heating—to compare their performance in terms of material efficiency and sustainability. Table 6 presents a comparative analysis of microwave and muffle furnace carbonization processes, highlighting their key advantages, limitations, and sustainability metrics.
Table 7 summarizes the experimental data, providing a detailed comparison based on key parameters such as yield, energy consumption, EMSE, active time, PMI, and Process steps.
The GPE results highlight the inherent trade-offs in each carbonization process. Microwave heating achieves a higher GPE score due to its lower energy consumption and shorter active time, making it a more sustainable option. However, the muffle furnace produces superior material properties, particularly in terms of electrical conductivity and EMI shielding effectiveness (EMSE), but at the cost of higher energy consumption and longer processing times.
These differences arise from the two methods’ fundamentally distinct heating mechanisms. In the muffle furnace, heat is transferred via conduction, convection, and radiation, requiring extended heating times and significant energy input to maintain high temperatures. In contrast, microwave heating is volumetric, where electromagnetic waves penetrate the material directly, leading to rapid heating and improved energy efficiency.
These findings underscore the importance of tailoring process parameters to balance material performance with environmental sustainability. The GPE metric serves as a valuable tool for comparing technologies and optimizing processes for large-scale, sustainable applications.
Previous findings from our earlier study [23] highlighted the operational advantages of microwave heating, particularly its energy efficiency and reduced processing times, demonstrating its potential as a sustainable alternative to carbonization. However, that study was limited to evaluating the microwave process in isolation, without comparing its broader sustainability implications, such as material efficiency and environmental impact, against conventional methods. In this work, the integration of the GPE metric provides a holistic framework to address these gaps. The results reveal that while microwave heating excels in energy and time efficiency, achieving a higher GPE score, the muffle furnace process offers superior material properties, including enhanced EMSE and surface area. These findings underscore an iterative journey in identifying the most environmentally friendly approach, with microwave heating emerging as a highly sustainable option when evaluated comprehensively through the lens of GPE.

4. Limitations of the Study and Future Directions

Despite this study’s valuable insights, several limitations must be acknowledged to guide future improvements in process optimization and material performance.

4.1. Experimental Limitations and System Constraints

  • Use of a Household Microwave: The microwave system used in this study was a household-type oven, which lacks precise temperature control, real-time monitoring, and tailored power distribution mechanisms. Industrial-grade microwave systems with adjustable frequency and controlled gas environments could improve heating uniformity and material consistency.
  • Lack of Inert Gas Atmosphere: Unlike conventional activation methods that use inert gases (e.g., nitrogen or argon) to prevent unwanted side reactions, this study employed a closed system without an inert atmosphere. It could lead to partial oxidation, influencing the final carbon structure. Future studies should investigate controlled gas environments to optimize material properties.
  • Tar Deposition and Pore Blockage: A major challenge observed in the microwave process was the formation of tar, which condensed on the carbonized material and partially blocked pore structures, reducing surface area and electrical conductivity. This issue arose due to rapid heating and the closed reactor design, which restricted tar removal.

4.2. Trade-Offs Between Energy Efficiency and Material Performance

While microwave heating demonstrated superior energy efficiency and faster processing times compared to the muffle furnace, the resulting materials exhibited lower EMI shielding effectiveness (EMSE) and electrical conductivity. It highlights a fundamental trade-off between energy efficiency and material performance.
However, one drawback of the microwave process is that tar residues, byproducts of carbonization, can condense on the surface of the material, leading to pore blockage and reduced conductivity and shielding effectiveness. This issue arises because household-type microwaves lack an integrated gas flow or exhaust system to remove these byproducts efficiently.

4.3. Mechanical Stability and Composite Approaches

One of the key considerations for the practical application of carbonized textile materials is their mechanical integrity. While the carbonized samples produced in this study exhibited structural stability, their mechanical properties varied depending on the carbonization method. The muffle furnace process resulted in higher graphitization, which may contribute to increased brittleness. In contrast, microwave-assisted carbonization maintained a more flexible structure (Figure 13) due to the rapid heating mechanism and possible residual functional groups. However, since the exact temperature in the microwave process could not be measured, further investigation is needed to establish a direct correlation between processing conditions and mechanical performance.
Future studies could explore composite approaches by embedding carbonized materials into polymer matrices to address potential limitations in mechanical strength. In particular, bio-based and environmentally friendly polymers such as polylactic acid (PLA), polyhydroxyalkanoates (PHA), lignin-derived resins, or soy protein-based binders could enhance the mechanical durability of carbonized materials while maintaining sustainability. Additionally, silicone-based polymers such as polydimethylsiloxane (PDMS) could be investigated for applications requiring flexibility and structural resilience.
Furthermore, post-treatment strategies such as UV-ozone exposure, mild thermal oxidation (300–400 °C), or controlled re-annealing in an inert atmosphere may help optimize the structural integrity and surface properties of the carbonized material, reducing brittleness while preserving the high surface area and porosity.
By implementing these strategies, future research can further tailor carbonized textile materials for real-world applications, ensuring an optimal balance between mechanical stability, energy efficiency, and environmental sustainability.

4.4. Opportunities for Process Optimization

Based on the findings, several modifications could enhance the material flexibility, electrical conductivity, pore structure, EMI shielding efficiency, and sustainability of the carbonization process:
  • Microwave Reactor Optimization: Developing a specialized microwave reactor with controlled gas flow and an integrated tar removal mechanism could enhance material properties while maintaining energy efficiency.
  • Post-Treatment Strategies: UV-ozone exposure or mild thermal oxidation at 300–400 °C in an inert atmosphere could further optimize pore structure and improve surface properties.
  • Hybrid Heating Approach (Microwave Pre-Treatment + Controlled Muffle Furnace Processing): A promising optimization strategy is to use microwave-assisted pre-carbonization to rapidly initiate the process, followed by a short-duration, lower-temperature muffle furnace treatment. This hybrid approach can:
    • Prevent excessive tar deposition by gradually removing volatile compounds.
    • Enhance material conductivity and EMSE values while maintaining the benefits of microwave heating.
    • Reduce overall energy consumption, as the muffle furnace is only used briefly at controlled temperatures rather than for the entire process.
  • Industrial Scaling Considerations: The current study was conducted under laboratory conditions. Future research should assess the feasibility of scaling up the process, considering factors such as automation, material throughput, and life cycle assessment (LCA) to evaluate the broader environmental impact.

5. Conclusions

In this study, we have developed and implemented a novel Green Process Efficiency (GPE) metric to evaluate and compare the sustainability of different carbonization processes, specifically muffle furnace and microwave heating methods. The GPE metric not only integrates critical parameters such as energy consumption, process yield, and material performance but also provides a systematic framework for assessing the trade-offs inherent in laboratory-scale processes. By extending this analysis, we aim to bridge the gap between efficiency and environmental impact in carbon-based material production.
The results reveal that microwave heating excels in sustainability, achieving a significantly higher GPE score (3.04) due to its reduced energy consumption (0.46 kWh/g) and shorter active time (4.5 h). However, this method faces limitations in material performance, with lower average EMSE values (33.07 dB) and reduced surface area (383.92 m2/g).
In contrast, the muffle furnace process delivers superior product quality, including higher EMSE values (35.86 dB) and surface area (538.42 m2/g), making it suitable for applications requiring enhanced material properties. However, its lower GPE score (0.03) reflects its higher energy demands (8.42 kWh/g) and longer processing times (10 h).
These findings demonstrate the versatility of the GPE metric as a decision-making tool, offering researchers a transparent method to balance environmental sustainability with material performance. While microwave heating emerges as a more sustainable option in this study, the muffle furnace process may be preferred for specific applications where material properties are critical.
This study highlights the need for comprehensive evaluation metrics in carbon material production, especially as the field progresses toward industrial-scale applications. To enhance its relevance in sustainable manufacturing, future research should focus on adapting the GPE metric by integrating factors such as process automation, yield efficiency, and life cycle assessment. Additionally, GPE can be extended beyond carbonization processes to other green manufacturing sectors, such as battery and solar cell production, by incorporating performance-specific parameters like energy storage capacity, power conversion efficiency, and long-term stability. These refinements will strengthen GPE’s role as a versatile and scalable tool for assessing sustainability across diverse industries.
This study aims to inspire further research into green process optimization and sustainable material production by presenting a transparent and scientifically rigorous framework. The methodology and results detailed here not only contribute to advancing carbonization technologies but also encourage researchers and practitioners to prioritize environmentally conscious approaches in material science.
In conclusion, this work paves the way for the development of greener and more efficient processes in activated carbon production, aligning material innovation with global sustainability goals. This study pioneers the integration of performance metrics with environmental factors, setting a benchmark for future material science evaluations.

Supplementary Materials

The following supporting information can be downloaded at: https://www.mdpi.com/article/10.3390/pr13030870/s1, Figure S1: Insufficient carbonization for dry samples without polar molecules (e.g. water, acid) [53]; Table S1: Summary of mean EMSE values (dB) for each frequency (1–6 GHz) along with standard deviation (SD), standard error (SE), and 95% confidence interval (CI) for each sample; Table S2: Electrical resistivity values of carbonized samples produced via microwave and dry and with 8% H2SO4 muffle furnace methods.

Author Contributions

Conceptualization, S.S.; methodology, S.S., D.D.K. and A.K.; validation, S.S., D.D.K. and A.K.; formal analysis, S.S., D.D.K. and A.K.; investigation, S.S.; resources, S.S., D.D.K. and A.K.; data curation, S.S., D.D.K. and A.K.; writing—original draft preparation, S.S.; writing—review and editing, S.S., D.D.K. and A.K.; visualization, S.S., D.D.K. and A.K.; supervision, A.K. and D.D.K.; project administration, A.K.; funding acquisition, A.K. All authors have read and agreed to the published version of the manuscript.

Funding

This research was funded by Ege University Office of Scientific Research Projects (Grant No. FDK-2019-20740).

Data Availability Statement

The original contributions presented in this study are included in the article. Further inquiries can be directed to the corresponding author.

Conflicts of Interest

The authors declare no conflicts of interest.

Abbreviations

The following abbreviations are used in this manuscript:
BETBrunauer-Emmett-Teller
EMIElectromagnetic Interference
EMSEElectromagnetic Shielding Effectiveness
GPEGreen Performance Efficiency
MFMuffle Furnace
MWMicrowave
PDMSpolydimethylsiloxane
PHAPolyhydroxyalkanoates
PLAPolylactic acid
SEMScanning Electron Microscopy
XRDX-ray Diffraction

References

  1. Jin, D.; Yong Choi, J.; Nam, J.; Yuk, H.; Kim, S. Innovative Building Materials by Upcycling Clothing Waste into Thermal Energy Storage Matrix with Phase Change Materials. Waste Manag. 2024, 175, 328–338. [Google Scholar] [CrossRef]
  2. Herrmann, S. Technical Report: A New Textiles Economy: Redesigning Fashion’s Future; Ellen MacArthur Foundation: Cowes, UK, 2017. [Google Scholar]
  3. Christis, M.; Vercalsteren, A.; Mortensen, L.F.; Coscieme, L. Textiles and the Environment in a Circular Economy; ETC/WMGE: Copenhagen, Denmark, 2019. [Google Scholar]
  4. Lapkin, A.; Constable, D. Green Chemistry Metrics: Measuring and Monitoring Sustainable Processes; John Wiley and Sons, Ltd.: Hoboken, NJ, USA, 2009; ISBN 978-3-319-10499-7. [Google Scholar]
  5. Xia, C.; Shi, S.Q. Self-Activation for Activated Carbon from Biomass: Theory and Parameters. Green Chem. 2016, 18, 2063–2071. [Google Scholar] [CrossRef]
  6. Sandin, G.; Peters, G.M. Environmental Impact of Textile Reuse and Recycling—A Review. J. Clean. Prod. 2018, 184, 353–365. [Google Scholar] [CrossRef]
  7. Kamble, Z.; Behera, B.K. Mechanical Properties and Water Absorption Characteristics of Composites Reinforced with Cotton Fibres Recovered from Textile Waste. J. Eng. Fiber. Fabr. 2020, 15, 1558925020901530. [Google Scholar] [CrossRef]
  8. Nasri-Nasrabadi, B.; Byrne, N. Converting Waste Textiles into Highly Effective Sorbent Materials. RSC Adv. 2020, 10, 37596–37599. [Google Scholar] [CrossRef]
  9. Xia, M.; Shao, X.; Sun, Z.; Xu, Z. Conversion of Cotton Textile Wastes into Porous Carbons by Chemical Activation with ZnCl2, H3PO4, and FeCl3. Environ. Sci. Pollut. Res. 2020, 27, 25186–25196. [Google Scholar] [CrossRef] [PubMed]
  10. Chen, W.; Zhang, Y.; Zhang, S.; Lu, W.; Xu, H. Pyrolysis Behavior and Pore-Forming Mechanism During Reuse of Textile Waste Flax by Activation. Waste Biomass Valorization 2020, 11, 4259–4268. [Google Scholar] [CrossRef]
  11. Balcik-Canbolat, C.; Ozbey, B.; Dizge, N.; Keskinler, B. Pyrolysis of Commingled Waste Textile Fibers in a Batch Reactor: Analysis of the Pyrolysis Gases and Solid Product. Int. J. Green Energy 2017, 14, 289–294. [Google Scholar] [CrossRef]
  12. Xu, Z.; Zhang, T.; Yuan, Z.; Zhang, D.; Sun, Z. Fabrication of Cotton Textile Waste-Based Magnetic Activated Carbon Using FeCl3 Activation by the Box—Behnken Design: Optimization and Characteristics. RSC Adv. 2018, 8, 38081–38090. [Google Scholar] [CrossRef]
  13. Sayed Jamaludin, S.I.; Zaini, M.A.A.; Sadikin, A.N.; Abdol Jani, W.N.F. Textile Waste Valorization as Potential Activated Carbon Precursor for the Removal of Water Contaminants: Commentary. Mater. Today Proc. 2024, 96, 110–115. [Google Scholar] [CrossRef]
  14. Chen, W.; He, F.; Zhang, S.; Xv, H.; Xv, Z. Development of Porosity and Surface Chemistry of Textile Waste Jute-Based Activated Carbon by Physical Activation. Environ. Sci. Pollut. Res. 2018, 25, 9840–9848. [Google Scholar] [CrossRef]
  15. Naeem, S.; Baheti, V.; Militky, J.; Tunakova, V.; Gilani, Q.Z.; Javed, S.; Behera, P. Impact of Carbonization Temperature on Activated Carbon Web for EMI Shielding and Ohmic Heating. Fibres Text. 2018, 3, 57–62. [Google Scholar]
  16. Naeem, S.; Baheti, V.; Tunakova, V.; Militky, J.; Karthik, D.; Tomkova, B. Development of Porous and Electrically Conductive Activated Carbon Web for Effective EMI Shielding Applications. Carbon 2017, 111, 439–447. [Google Scholar] [CrossRef]
  17. Parmakoğlu, E.Ü.; Çay, A.; Yanık, J. Valorization of Solid Wastes from Textile Industry as an Adsorbent Through Activated Carbon Production. AATCC J. Res. 2023, 10, 133–143. [Google Scholar] [CrossRef]
  18. Karthik, D.; Baheti, V.; Militky, J.; Naeem, M.S.; Tunakova, V.; Ali, A. Activated Carbon Derived from Carbonization of Kevlar Waste Materials: A Novel Single Stage Method. Materials 2021, 14, 6433. [Google Scholar] [CrossRef]
  19. Intani, K.; Latif, S.; Kabir, A.K.M.R.; Müller, J. Effect of Self-Purging Pyrolysis on Yield of Biochar from Maize Cobs, Husks and Leaves. Bioresour. Technol. 2016, 218, 541–551. [Google Scholar] [CrossRef]
  20. Intani, K.; Latif, S.; Cao, Z.; Müller, J. Characterisation of Biochar from Maize Residues Produced in a Self-Purging Pyrolysis Reactor. Bioresour. Technol. 2018, 265, 224–235. [Google Scholar] [CrossRef] [PubMed]
  21. Kong, S.H.; Lam, S.S.; Yek, P.N.Y.; Liew, R.K.; Ma, N.L.; Osman, M.S.; Wong, C.C. Self-Purging Microwave Pyrolysis: An Innovative Approach to Convert Oil Palm Shell into Carbon-Rich Biochar for Methylene Blue Adsorption. J. Chem. Technol. Biotechnol. 2019, 94, 1397–1405. [Google Scholar] [CrossRef]
  22. Christian, J.; Quillope, C.; Carpio, R.B.; Gatdula, K.M.; Concepcion, M.; Detras, M.; Doliente, S.S. Optimization of Process Parameters of Self-Purging Microwave Pyrolysis of Corn Cob for Biochar Production. Heliyon 2021, 7, e08417. [Google Scholar] [CrossRef]
  23. Sert, S.; Duran Kaya, D.; Körlü, A. Development of Activated Carbon Textiles Produced from Jute and Cotton Wastes for Electromagnetic Shielding Applications. Fibers 2023, 11, 110. [Google Scholar] [CrossRef]
  24. Sert, S.; Gültekin, Ş.S.; Kaya, D.D.; Körlü, A. Development of Activated Carbon from Hemp Hurd for EMI Shielding and Supercapacitors via One-Step Microwave Pyrolysis without Inert Gas. Biomass Convers. Biorefinery 2024, 1–20. [Google Scholar] [CrossRef]
  25. Prathiba, R.; Shruthi, M.; Miranda, L.R. Pyrolysis of Polystyrene Waste in the Presence of Activated Carbon in Conventional and Microwave Heating Using Modified Thermocouple. Waste Manag. 2018, 76, 528–536. [Google Scholar] [CrossRef]
  26. Ioannidou, O.; Zabaniotou, A. Agricultural Residues as Precursors for Activated Carbon Production—A Review. Renew. Sustain. Energy Rev. 2007, 11, 1966–2005. [Google Scholar] [CrossRef]
  27. Wang, H.; Xu, Z.; Kohandehghan, A.; Li, Z.; Cui, K.; Tan, X.; Stephenson, T.J.; King’Ondu, C.K.; Holt, C.M.B.; Olsen, B.C.; et al. Interconnected Carbon Nanosheets Derived from Hemp for Ultrafast Supercapacitors with High Energy. ACS Nano 2013, 7, 5131–5141. [Google Scholar] [CrossRef] [PubMed]
  28. Um, J.H.; Ahn, C.Y.; Kim, J.; Jeong, M.; Sung, Y.E.; Cho, Y.H.; Kim, S.S.; Yoon, W.S. From Grass to Battery Anode: Agricultural Biomass Hemp-Derived Carbon for Lithium Storage. RSC Adv. 2018, 8, 32231–32240. [Google Scholar] [CrossRef] [PubMed]
  29. Xiong, W.; Hu, X.; Wu, X.; Zeng, Y.; Wang, B.; He, G.; Zhu, Z. A Flexible Fiber-Shaped Supercapacitor Utilizing Hierarchical NiCo2O4@polypyrrole Core-Shell Nanowires on Hemp-Derived Carbon. J. Mater. Chem. A 2015, 3, 17209–17216. [Google Scholar] [CrossRef]
  30. Wang, Y.; Yang, R.; Li, M.; Zhao, Z. Hydrothermal Preparation of Highly Porous Carbon Spheres from Hemp (Cannabis sativa L.) Stem Hemicellulose for Use in Energy-Related Applications. Ind. Crops Prod. 2015, 65, 216–226. [Google Scholar] [CrossRef]
  31. Sun, W.; Lipka, S.M.; Swartz, C.; Williams, D.; Yang, F. Hemp-Derived Activated Carbons for Supercapacitors. Carbon 2016, 103, 181–192. [Google Scholar] [CrossRef]
  32. Wu, C.; Budarin, V.L.; Gronnow, M.J.; De Bruyn, M.; Onwudili, J.A.; Clark, J.H.; Williams, P.T. Conventional and Microwave-Assisted Pyrolysis of Biomass under Different Heating Rates. J. Anal. Appl. Pyrolysis 2014, 107, 276–283. [Google Scholar] [CrossRef]
  33. Arpia, A.A.; Chen, W.; Lam, S.S.; Rousset, P.; Luna, D.G. De Sustainable Biofuel and Bioenergy Production from Biomass Waste Residues Using Microwave-Assisted Heating: A Comprehensive Review. Chem. Eng. J. 2020, 403, 126233. [Google Scholar] [CrossRef]
  34. Lam, S.S.; Chase, H.A. A Review on Waste to Energy Processes Using Microwave Pyrolysis. Energies 2012, 5, 4209–4232. [Google Scholar] [CrossRef]
  35. He, X.; Ling, P.; Qiu, J.; Yu, M.; Zhang, X.; Yu, C.; Zheng, M. Efficient Preparation of Biomass-Based Mesoporous Carbons for Supercapacitors with Both High Energy Density and High Power Density. J. Power Sources 2013, 240, 109–113. [Google Scholar] [CrossRef]
  36. Jimenez-Gonzalez, C.; Ponder, C.S.; Broxterman, Q.B.; Manley, J.B. Using the Right Green Yardstick: Why Process Mass Intensity Is Used in the Pharmaceutical Industry To Drive More Sustainable Processes. Org. Process Res. Dev. 2011, 15, 912–917. [Google Scholar] [CrossRef]
  37. Sheldon, R.A.; Bode, M.L.; Akakios, S.G. Metrics of Green Chemistry: Waste Minimization. Curr. Opin. Green Sustain. Chem. 2022, 33, 100569. [Google Scholar] [CrossRef]
  38. Dicks, A.P.; Hent, A. Green Chemistry Metrics: A Guide to Determining and Evaluating Process Greenness; Springer International Publishing: Berlin/Heidelberg, Germany, 2015; ISBN 9783319104997. [Google Scholar]
  39. TS EN 50147-12005-04; Slovenian Institute for Standardization Anechoic Chambers—Part 1: Shield Attenuation Measurement. SIST—Slovenian Institute for Standardization: Ljubljana, Slovenia, 2005.
  40. Farma, R.; Fatjrin, D.; Awitdrus; Deraman, M. Physical Properties of Activated Carbon from Fibers of Oil Palm Empty Fruit Bunches by Microwave Assisted Potassium Hydroxide Activation. In AIP Conference Proceedings; AIP Publishing: Melville, NY, USA, 2017; Volume 1801, pp. 1–4. [Google Scholar] [CrossRef]
  41. Zhou, Y.J.; Wu, X.B.; Cai, X.D.; Xu, H.X.; Li, Q.Y.; Xiong, W.; Xiao, S.Y.; Cui, T.J. Smart Meta-Device Powered by Stray Microwave Energies: A Green Approach to Shielding External Interference and Detection. Appl. Energy 2025, 378, 124770. [Google Scholar] [CrossRef]
  42. Guan, Y.; Yang, L.; Chen, C.; Wan, R.; Guo, C.; Wang, P. Regulable Crack Patterns for the Fabrication of High-Performance Transparent EMI Shielding Windows. iScience 2025, 28, 111543. [Google Scholar] [CrossRef] [PubMed]
  43. Zhao, Y.; Xing, S.; Jin, Q.; Yang, N.; He, Y.; Zhang, J. Excellent Angular and Electrical Performance Damage Tolerance of Wave-Absorbing Laminate via Gradient A-T-A Design. Compos. Commun. 2024, 46, 101838. [Google Scholar] [CrossRef]
  44. Zhang, Y.; Lu, J.; Yu, J.; Wang, W.; Zhai, S.; Yu, Y.; Qi, D. A Controllable and Fast Carbonization Strategy under Air Conditions and Its Application in Electromagnetic Interference (EMI) Shielding. Compos. Part A Appl. Sci. Manuf. 2025, 192, 108764. [Google Scholar] [CrossRef]
  45. Singh, K.; Baheti, V. Optimum Carbonization of Kevlar Fabric for Electromagnetic Interference Shielding Applications. J. Text. Inst. 2024, 115, 1683–1693. [Google Scholar] [CrossRef]
  46. He, M.; Qian, W.; Li, H.; Li, Z.; Chen, H.; Zhou, Y.; Bu, X.; Wang, Y. Ultrathin and Flexible Carbonized MXene@PAN/Ni Films with Alternating Multilayered Structure for Superior EMI Shielding, Joule Heating and Mechanical Performance. Chem. Eng. J. 2025, 506, 159777. [Google Scholar] [CrossRef]
  47. Ai, Y.; Xing, R.; Huang, R.; Kong, J.; Su, R. Biomass-Derived Fire-Retardant Porous Carbon towards Efficient Electromagnetic Wave Absorption and Shielding. Carbon 2024, 227, 119268. [Google Scholar] [CrossRef]
  48. Su, J.; Li, Q.; Tan, W.; Jiang, Q.; Li, L.; Ju, J. Hierarchical Porous Carbon Nanofibers for Green Electromagnetic Interference Shielding. Appl. Mater. Today 2025, 42, 102565. [Google Scholar] [CrossRef]
  49. Pan, H.; Qing, S.; Lyu, P.; Ren, J.; Ran, Q.; Hou, J.; Wang, Z.; Xia, L.; Zhang, X.; Liu, X.; et al. Multifunctional Porous Carbon Fibers-Based Porous Stacking for Electromagnetic Interference Shielding. Carbon 2025, 233, 119907. [Google Scholar] [CrossRef]
  50. Tabone, M.D.; Cregg, J.J.; Beckman, E.J.; Landis, A.E. Sustainability Metrics: Life Cycle Assessment and Green Design in Polymers. Environ. Sci. Technol. 2010, 44, 8264–8269. [Google Scholar] [CrossRef]
  51. Piccinno, F.; Hischier, R.; Seeger, S.; Som, C. From Laboratory to Industrial Scale: A Scale-up Framework for Chemical Processes in Life Cycle Assessment Studies. J. Clean. Prod. 2016, 135, 1085–1097. [Google Scholar] [CrossRef]
  52. Li, J.; Morrison, J.R.; Zhang, M.T.; Nakano, M.; Biller, S.; Lennartson, B. Editorial: Automation in Green Manufacturing. IEEE Trans. Autom. Sci. Eng. 2013, 10, 1–4. [Google Scholar] [CrossRef]
  53. Sert, S.; Gultekin, Ş.S.; Gültekin, B.; Duran Kaya, D.; Körlü, A. A Facile Approach to Produce Activated Carbon from Waste Textiles via Self-Purging Microwave Pyrolysis and FeCl3 Activation for Electromagnetic Shielding Applications. Polymers 2024, 16, 915. [Google Scholar] [CrossRef]
Figure 1. (a) Schematic representation of the textile composite structure. (b) Ceramic pot sealed with high-temperature silicone, used in muffle furnace experiments. (c) Porcelain pot with PTFE (Polytetrafluoroethylene, Teflon) sealing, used in microwave experiments.
Processes 13 00870 g001
Figure 2. Flow chart of experimental system for muffle furnace and microwave.
Processes 13 00870 g002
Figure 3. Schematic illustration of the electromagnetic effectiveness test system.
Processes 13 00870 g003
Figure 4. Schematic illustration of (a) transmitting and (b) receiving antennas.
Processes 13 00870 g004
Figure 5. Schematic illustration of the measurement principle.
Processes 13 00870 g005
Figure 6. XRD patterns of raw nonwoven textile and activated carbon textile structures produced using different carbonization processes, illustrating structural differences and phase changes induced by the treatments.
Processes 13 00870 g006
Figure 7. Results of product yield assessment of the samples.
Processes 13 00870 g007
Figure 8. Results of surface area measurements of the samples.
Processes 13 00870 g008
Figure 9. SEM images of (a) raw textile (5000× magnification), (b) cross-section of raw textile (250× magnification), (c) sample treated with microwave (5000× magnification), and (d) sample treated with muffle furnace (5000× magnification).
Processes 13 00870 g009
Figure 10. Average electromagnetic shielding effectiveness (EMSE) of the samples treated with varying acid concentrations and subjected to different heating technologies, measured across the frequency range of 1–6 GHz.
Processes 13 00870 g010
Figure 11. Electromagnetic shielding effectiveness (EMSE) of the samples treated with muffle furnace 1–6 GHz frequency range.
Processes 13 00870 g011
Figure 12. Electromagnetic shielding effectiveness (EMSE) of the samples treated with microwave 1–6 GHz frequency range.
Processes 13 00870 g012
Figure 13. Flexible structure of the carbonized composite (The video is also added to Supplementary Document).
Processes 13 00870 g013
Table 1. XRD analysis of the activated carbon textile structures produced with different processes.
(100) (002) Crystal Size
2 Theta FWHM 2 Theta FWHM La (nm) Lc (nm) d (002)
DRY-Muffle Furnace--26.698.020-1.0630.334
8% H2SO4-Muffle Furnace44.660.5125.106.83034.4281.2450.355
8% H2SO4-Microwave--20.7614.550-0.5800.428
Table 2. Dimensional changes in thickness and diameter of textile samples before and after carbonization under different processing conditions.
Before
Carbonization
After Carbonization
MF-DRY MF 8% H2SO4 MW 8% H2SO4
Thickness~2.5 mm~0.7 mm~0.85 mm~0.90 mm
Diameter10 cm4.9 cm5.4 cm6.9 cm
Table 3. Electrical resistivity measurement results. Each value represents the mean resistivity obtained from five independent measurements (n = 5). Standard deviation (SD) and standard error (SE) are provided to indicate the variability and reliability of the measurements (Table S2).
MUFFLE FURNACEMICROWAVE
DRY8% H2SO48% H2SO4
Electrical Resistivity (Ohm-cm)50.648.282.23 × 106
Table 4. Comparative Overview of EMI Shielding Performance in Recent Studies.
Shielding MaterialProduction MethodFrequency
Range
EMI Shielding Ref.
Smart meta-device which consists of five sub-arrays on two dielectric substratesIntegration of reconfigurable meta-atom arrays and sensing-powering modules into a sensing-powering-feedback closed loop6–6.7 GHz~80% transmittance[41]
Metal-grid transparent
optical windows
Dry cracking phenomena using a model
system with adjustable crack precursors
(spin coating + crack formation + metal deposition)
1–18 GHz33.6 dB[42]
Wave-absorbing laminated structureA-T-A (absorbtion-transmission-absorbtion) structural design strategy with gradient electromagnetic
parameters
6–18 GHzReflection loss less than 10 dB at an incidence angle of 0–40° in TE mode.[43]
Carbonized cottonIntumescent flame retardant (IFR) coating on the surface of cotton fabric and carbonization in muffle furnace at air atmosphere8.2–12.4 GHz26.33 dB[44]
Carbonized Kevlar woven fabricCarbonization of Kevlar woven fabric by single-stage carbonization and physical activation method using barbeque charcoal and nitrogen gas at high temperature furnace(30 MHz–1.5 GHz) and (8–12 GHz)21.65 dB 30 MHz−1.5 GHz

17.84 dB at 8–12 GHz
[45]
Alternating layers of carbonized MXene@polyacrylonitrile nanofibers and Ni nanochainsSuccessive electrospinning and spray-coating techniques, followed by low-temperature carbonization8–18 GHz51 dB[46]
Biomass-derived fire-retardant porous carbon materialphosphorylation and alkali etching of natural balsa wood followed by carbonization8.2–12.4 GHz52 dB[47]
Hierarchical porous carbon nanofibers (HPCNFs)Electrospinning blowing (EBS) and carbonization0–18 GHz24.99 dB[48]
Multi-layer carbon filmsPreparation of porous carbon fibers from PVA/PVB blend via a centrifugal spinning methodology combined with pyrolysis treatment., and stacking into multi-layer carbon films8.2–12.4 GHz90 dB[49]
Activated carbon from textile waste (Jute-Cotton)Carbonization by using microwave and muffle furnace1–6 GHzMF: 47.56 dB
MW: 38.60 dB
Our Study
Table 5. Comparative analysis of common green metrics and the positioning of the proposed Green Performance Efficiency (GPE) metric as a comprehensive tool for evaluating process sustainability.
Metric TypeExamplesFocusLimitationsGPE’s Contribution
Mass-Based MetricsAtom Economy, E-factor, YieldMaterial utilization and waste reductionIgnores environmental toxicity and operational factorsIntegrates operational parameters like energy and time
Impact-Based MetricsLCA (e.g., acidification, eco-toxicity)Environmental impact and resource depletionRequires extensive data and complex calculationsSimplifies assessment for laboratory-scale processes
Performance MetricsEnergy Efficiency, Carbon EfficiencySpecific aspects like energy or carbon useDoes not evaluate overall process sustainabilityCombines material, energy, and performance indicators
Table 6. Comparison of Microwave and Muffle Furnace Carbonization Processes.
FeatureMicrowave HeatingMuffle Furnace Heating
Energy EfficiencyHigh: Specific energy consumption is lower (0.46 kWh/g).Low: Higher energy demands (8.42 kWh/g).
Processing TimeShorter active time (4.5 h).Longer active time (10 h).
Performance (EMSE)Moderate: Average EMSE (33.07 dB).High: Average EMSE (35.86 dB).
Surface Area (BET)Lower (383.92 m2/g).Higher (538.42 m2/g).
Yield (%)Higher (46.73%).Lower (29.65%).
Process ComplexityModerate: 5 process steps.Moderate: 5 process steps.
ScalabilityLimited by reactor size and uniform heating.Better scalability for larger batch sizes.
Environmental SustainabilityHigh: Higher GPE score (3.04).Moderate: Lower GPE score (0.03).
Cost EfficiencyPotentially lower operational costs due to energy savings.Higher operational costs due to energy intensity.
LimitationsRapid cooling leads to incomplete activation and tar deposition.Prolonged processing increases time and energy demands.
Table 7. Key experimental data utilized in the calculation of Green Performance Efficiency (GPE).
GPE ComponentMuffle FurnaceMicrowave
Yield %29.6546.73
Performance (Average EMSE-dB)35.8633.07
Specific Energy (kWh/g)8.420.46
Active Time
(including pre-drying and Ultrasound Treatment)
104.5
PMI87.4449.13
Process Steps (N)55
GPE0.033.04
Disclaimer/Publisher’s Note: The statements, opinions and data contained in all publications are solely those of the individual author(s) and contributor(s) and not of MDPI and/or the editor(s). MDPI and/or the editor(s) disclaim responsibility for any injury to people or property resulting from any ideas, methods, instructions or products referred to in the content.

