Article

Evaluation of the Complex Impact of Major Factors and Derivation of Important Priorities in the Wastewater Treatment Process for Nutrient Removal Using Multiple Regression Analysis

1
Department of Environmental Engineering, Konkuk University, 120 Neungdong-ro, Seoul 05029, Republic of Korea
2
Department of Civil and Environmental Engineering, Konkuk University, 120 Neungdong-ro, Seoul 05029, Republic of Korea
*
Author to whom correspondence should be addressed.
Processes 2025, 13(3), 833; https://doi.org/10.3390/pr13030833
Submission received: 27 January 2025 / Revised: 22 February 2025 / Accepted: 7 March 2025 / Published: 12 March 2025
(This article belongs to the Section Biological Processes and Systems)

Abstract

:
The purpose of this study was to evaluate the important priorities of the major environmental and operating factors that affect the removal of nitrogen and phosphorus in the biological nutrients removal (BNR) process with phase separation by multiple regression analysis using the Excel program. Multiple correlation coefficients and coefficients of determination were calculated using the multiple regression analysis function on the Excel program and statistical significance was reviewed through variance analysis. The degree of influence of each independent variable was also determined using the coefficient for each parameter and the p-value of the regression equation. The effect of mixed-liquor temperature on nitrogen removal in the process was found to be the most significant, followed by cycle time, hydraulic retention time (HRT), solids retention time (SRT), and influent carbon-to-nitrogen ratio. The temperature was also the most influential factor affecting phosphorus removal in the process, followed by the cycle time, SRT, HRT, and influent carbon-to-phosphorus ratio. Evaluation of the complex impact of major environmental and operating factors on nutrient removal in the phase-separated BNR process could be performed successfully. It is expected that operators of treatment facilities will be able to easily derive the important priorities of major factors using multiple regression analysis in Excel based on field data without specialized statistical training, and will thereby contribute to the optimal operation of wastewater treatment

1. Introduction

In general, phosphates are key contributors to eutrophication, while excessive nitrates can pollute groundwater and surface water, posing risks to human and animal health. Therefore, removing these ionic components in the wastewater treatment process is essential. The treatment performance of most biological wastewater treatment processes can be influenced by various environmental factors, such as temperature and influent characteristics, particularly in the case of biological nutrient removal (BNR) processes [1,2,3,4,5]. Meanwhile, in order to maximize the simultaneous removal of nutrients such as nitrogen and phosphorus, not only environmental factors of the process but also optimal operating conditions are very important [6,7]. This is because the growth conditions and characteristics of microorganisms related to nitrogen and phosphorus removal in the BNR process are different. For example, there is a possibility that various operating conditions such as hydraulic retention time (HRT) and solids retention time (SRT) may conflict with each other [8,9,10].
The simultaneous removal of organics and nutrients in biological wastewater treatment can be accomplished through a combination of various phases, such as anoxic, anaerobic, and aerobic conditions [11,12,13]. BNR processes can be classified into spatial phase separation, such as the A2O process, or temporal phase separation, such as the sequencing batch reactor (SBR) process, according to the method of separating phases [3,13]. Therefore, the HRT, SRT, and cycle time in each HRT can be important operating factors in phase-separated processes [14,15]. As such, the removal performance can be significantly influenced by the operating conditions in the BNR process. In addition, it is also very difficult to ensure higher removal efficiencies of nitrogen and phosphorus due to the combined influence of environmental factors. Therefore, to solve these problems and optimize the process, it is necessary to analyze the sensitivity of major environmental and operating factors to the removal performance through multivariate analytical methods such as factor analysis.
The multiple regression is very useful for data analysis and process diagnosis, which can analyze the relationship between multidimensional variables in a wastewater treatment plant (WWTP) and effectively analyze the impact of each variable [16,17]. In general, multiple regression is a statistical method that can be used to analyze the relationship between a single dependent variable and several independent variables. The purpose of multiple regression analysis is to use independent variables whose values are known to predict the value of a single dependent value [18,19]. The regression model can be linear or curved. For a linear function, the results are generally expressed in the form Y = a + b1X1 + b2X2 + … + bnXn. In this study, Y represents the estimated value of the dependent variable when the independent variables are X1, X2, …, Xn, and the regression coefficients are a, b1, b2, …, bn. In the case of a nonlinear function, it can be expressed in the form of an explicit function or power function [20].
Previous studies have primarily focused on predicting effluent water quality or energy consumption based on operational parameters using multiple regression models. These studies aimed to develop predictive models to ensure compliance with discharge regulations or improve energy efficiency.
Our study, however, differentiates itself by focusing on the identification and prioritization of key influencing factors in biological nitrogen and phosphorus removal within wastewater treatment processes. In this study, we conducted multiple regression analysis using Microsoft Excel to determine the extent to which major environmental and operating factors—such as temperature, cycle time, HRT, SRT, and influent carbon-to-nitrogen and carbon-to-phosphate ratios—affect nitrogen and phosphorus removal. This analysis was based on the performance characteristics of the phase-separated BNR process observed through long-term field experiments. Using the multiple regression analysis function in Excel, we calculated multiple correlation coefficients and coefficients of determination. Statistical significance was assessed through variance analysis. Additionally, the influence of each independent variable was determined using the coefficient for each parameter and the p-value of the regression equation. Through this, it was intended to suggest a way to easily identify the environment and operating factors that are most influential for operation during wastewater treatment and contribute to the optimal operation of temporal and spatial phase-separated BNR processes.

2. Materials and Methods

2.1. Phase-Separated BNR Process for Biological Nutrient Removal

The pilot-scale phase-separated BNR process consisted of two ditch-type unit reactors, and an intra-clarifier was installed in each reactor. The process had a total liquid volume of 16 m3, including an intra-clarifier volume of 2 m3. The individual reactor (total liquid volume of 8 m3) has a width of 1.3 m and length of 5.7 m with a height of 1.8 m. The effective water depth was 1.5 m, and the channel width in the ditch-type reactor was 0.6 m. The process also consists of a four-way valve for changing the flow path, an ejector for mixing and aeration, and a monitoring and automatic control system.
The process was operated according to four operational steps as illustrated in Figure 1. The operational sequence comprised four steps of A, B, C, and D in series during one complete cycle of operation. At the end of step D, the operating cycle was completed and repeated, beginning with step A. It also consisted of two main steps A and C, and two intermediate steps B and D. The time ratio for main step to time for intermediate step was three. Steps C and D remained in the same operating state, with only the flow path and the phase in the reactor shifted from steps A and B. Removals of organics and nutrients in the process were accomplished by rotating aerobic, anoxic, and anaerobic phases during four operational steps. Reactions of denitrification and phosphorus release occurred during anoxic and temporally subsequent anaerobic phases, and organics in the influent wastewater were supplied as a carbon source for both reactions. During the aerobic phases, the reactions of nitrification and phosphorus uptake occurred, and the remaining organics were removed.
The influent was introduced from a wastewater treatment plant located in Sungnam, Korea. The pilot-scale process was operated at a wide range of mixed-liquor temperatures of 5–31 °C without temperature control. The process was also operated at HRTs of 10–21 h, SRTs of 16–36 d, and cycle times in the range of 2–8 h. All analyses including BOD (5210 B.), COD (5220 C.), MLSS (2540 D.), MLVSS (2540 E.), TN (calculated by summation of TKN and nitrate), TKN (4500-Norg B.), TP (4500-P B., E.), and ortho-phosphate (4500-P E.) were conducted in accordance with the procedures of the American Public Health Association Standard Methods [21]. Ammonia and nitrate were measured using a titrimetric method (4500-NH3 C.) and cadmium reduction method (4500-NO3 E.), respectively. The SRT was also calculated by dividing the total amount of MLSS in the oxidation ditch reactors per unit time by the amount of sludge wasted daily. The removal efficiency was calculated based on the concentration of influent wastewater and effluent concentration at the end of the aerobic condition (Steps A and C in Figure 1).

2.2. Statistical Analysis

In this study, major operating factors such as HRT, SRT, and cycle time were adjusted under various conditions to optimize the process performance. However, it is very difficult to easily identify the influence of each factor when interpreting the results because the environmental factors that change seasonally and the operating factors of the process are operated under a wide variety of conditions at the same time. Therefore, a multiple regression analysis was conducted to determine the degree of the complex influence of various environmental and operating factors on the performance, and to identify the factors most influential in the process operation for nutrient removal.
Microsoft Excel offers the advantage of being able to solve complex statistical or engineering analysis developments easily using the analysis tools built into the program [22]. The regression capabilities of the Excel program, particularly the Data Analysis ToolPak, are based on the same basic ordinary least squares (OLS) method used in R, SPSS, and Python (e.g., scikit-learn, statsmodels). Thus, the use of the Excel program will make it easier for operators who do not have access to professional statistical software and improve the reproducibility of research considering field situations. In this study, for these reasons, multiple correlation coefficients and coefficients of determination were calculated using the multiple regression analysis function in Microsoft Excel, and statistical significance was reviewed through variance analysis. The degree of influence of each independent variable was also determined using the coefficient for each parameter and the p-value of the regression equation. The relationship between the dependent and independent variables was linear. The residuals also followed a normal distribution. For the assessment of multicollinearity, the correlation matrix and the Variance Inflation Factor (VIF) were examined. A VIF value above 10 would indicate a potential issue; however, all independent variables in our study exhibited acceptable VIF values.

3. Results and Discussion

3.1. Overall Performances and Complex Influence of Various Environmental and Operating Factors

The performance of temporal and spatial phase-separated BNR processes for biological treatment of municipal wastewater was evaluated throughout a two-year experimental period. The overall performance of the process at mixed-liquor temperatures above 10 °C is shown in Table 1. In the case of a BNR process that removes nitrogen and phosphorus using phase separation, it is particularly important to maintain an appropriate DO for nitrification, denitrification, and phosphorus uptake and release compared to a multistage BNR process with general internal circulation. Therefore, in this study, MLDO was maintained at 2 mg/L or less under aerobic conditions and 0.5 mg/L or less under anoxic and anaerobic conditions.
A stable BOD (Biochemical Oxygen Demand) removal efficiency of higher than 90% in the process was maintained, regardless of the changes in environmental and operating conditions. The pilot-scale process also exhibited average suspended solids removal above 87.6% without additional final clarifiers. However, the removal characteristics of nitrogen and phosphorus were significantly influenced by environmental factors such as temperature and influent wastewater characteristics, and operating conditions such as HRT, SRT, cycle time, or a combination thereof.
In particular, the effect of temperature on nitrification was clearly observed, whereas the denitrification efficiency was mainly influenced by operating conditions such as HRT, SRT, and cycle time rather than the temperature effect. Figure 2 shows the effect of temperature on nitrification in the mixed-liquor temperature range of 5–30 °C. The combined influence of temperature on the autotrophic microbes and SRT was observed precisely. Under the conditions of mixed-liquor temperature above 10 °C, the nitrification efficiency above 84% could be maintained. However, it decreased below 75% under the conditions of temperatures lower than 10 °C and significantly decreased to 31% at SRTs shorter than 18 d. On the other hand, when the SRT was longer than 27 d, the nitrification efficiency was more than 66%, even at temperatures below 10 °C. Temperature is an important factor affecting the activity and microbial community structure of activated sludge [23,24,25]. It has been extensively investigated, particularly for nitrification processes [26,27]. It is reasonable to compensate for the decreased specific growth rates under low temperatures with the enrichment of biomass; therefore, methods such as extending the SRT are frequently applied [28,29].
At the influent BOD-to-TKN (Total Kjeldahl Nitrogen) ratio (hereinafter referred to as C/N ratio) range of 2.3–5.5, the process could produce an effluent TN (Total Nitrogen) concentration below 10 mg/L. When the mixed-liquor temperature was less than 10 °C, the influent C/N ratio within the application range could not be regarded as a major influencing parameter for nitrogen removal. That is, it was confirmed that the effect of the mixed-liquor temperature was more decisive for nitrogen removal than the C/N ratio. In contrast, at a mixed-liquor temperature above 10 °C, the TN removal increased slightly as the C/N ratio increased. In the influent BOD-to-TP (Total Phosphorus) ratio (hereinafter referred to as C/P ratio) range of 15–59, there was no clear tendency in TP removal according to the ratio. The phosphorus removal in the process was more influenced by other operating factors such as the HRT and SRT than by the C/P ratio.
In general, HRT also plays a very important role in BNR processes [9,10]. A longer HRT enables the process to tolerate variable loads with minimal operator attention. It should be recognized, however, that designs with longer HRT represent custom rather than process constraints. Considering the complex influence of influent characteristics, mixed-liquor temperature, and SRTs, the TP removal at HRTs of 10 h and 14 h was similar. However, at a longer HRT of 21 h, increasing the actual HRT in the anaerobic phase unnecessarily decreased the degree of TP removal. When the process was operated at an HRT of 14 h, the effect of the SRT on nitrogen and phosphorus removal was observed, showing that the optimal operating conditions contradicted each other. As the SRT increased, the effluent TN gradually decreased, while the effluent TP increased. However, when the process was operated at HRTs of 10 h and 21 h, the effect of the SRT on nitrogen and phosphorus removal was not identified. In previous research [30], the effect of cycle time on the performance of process was also shown in an inverted manner compared to that of the SRT. As the cycle time increased, the effluent TP decreased significantly, whereas the effluent TN increased.

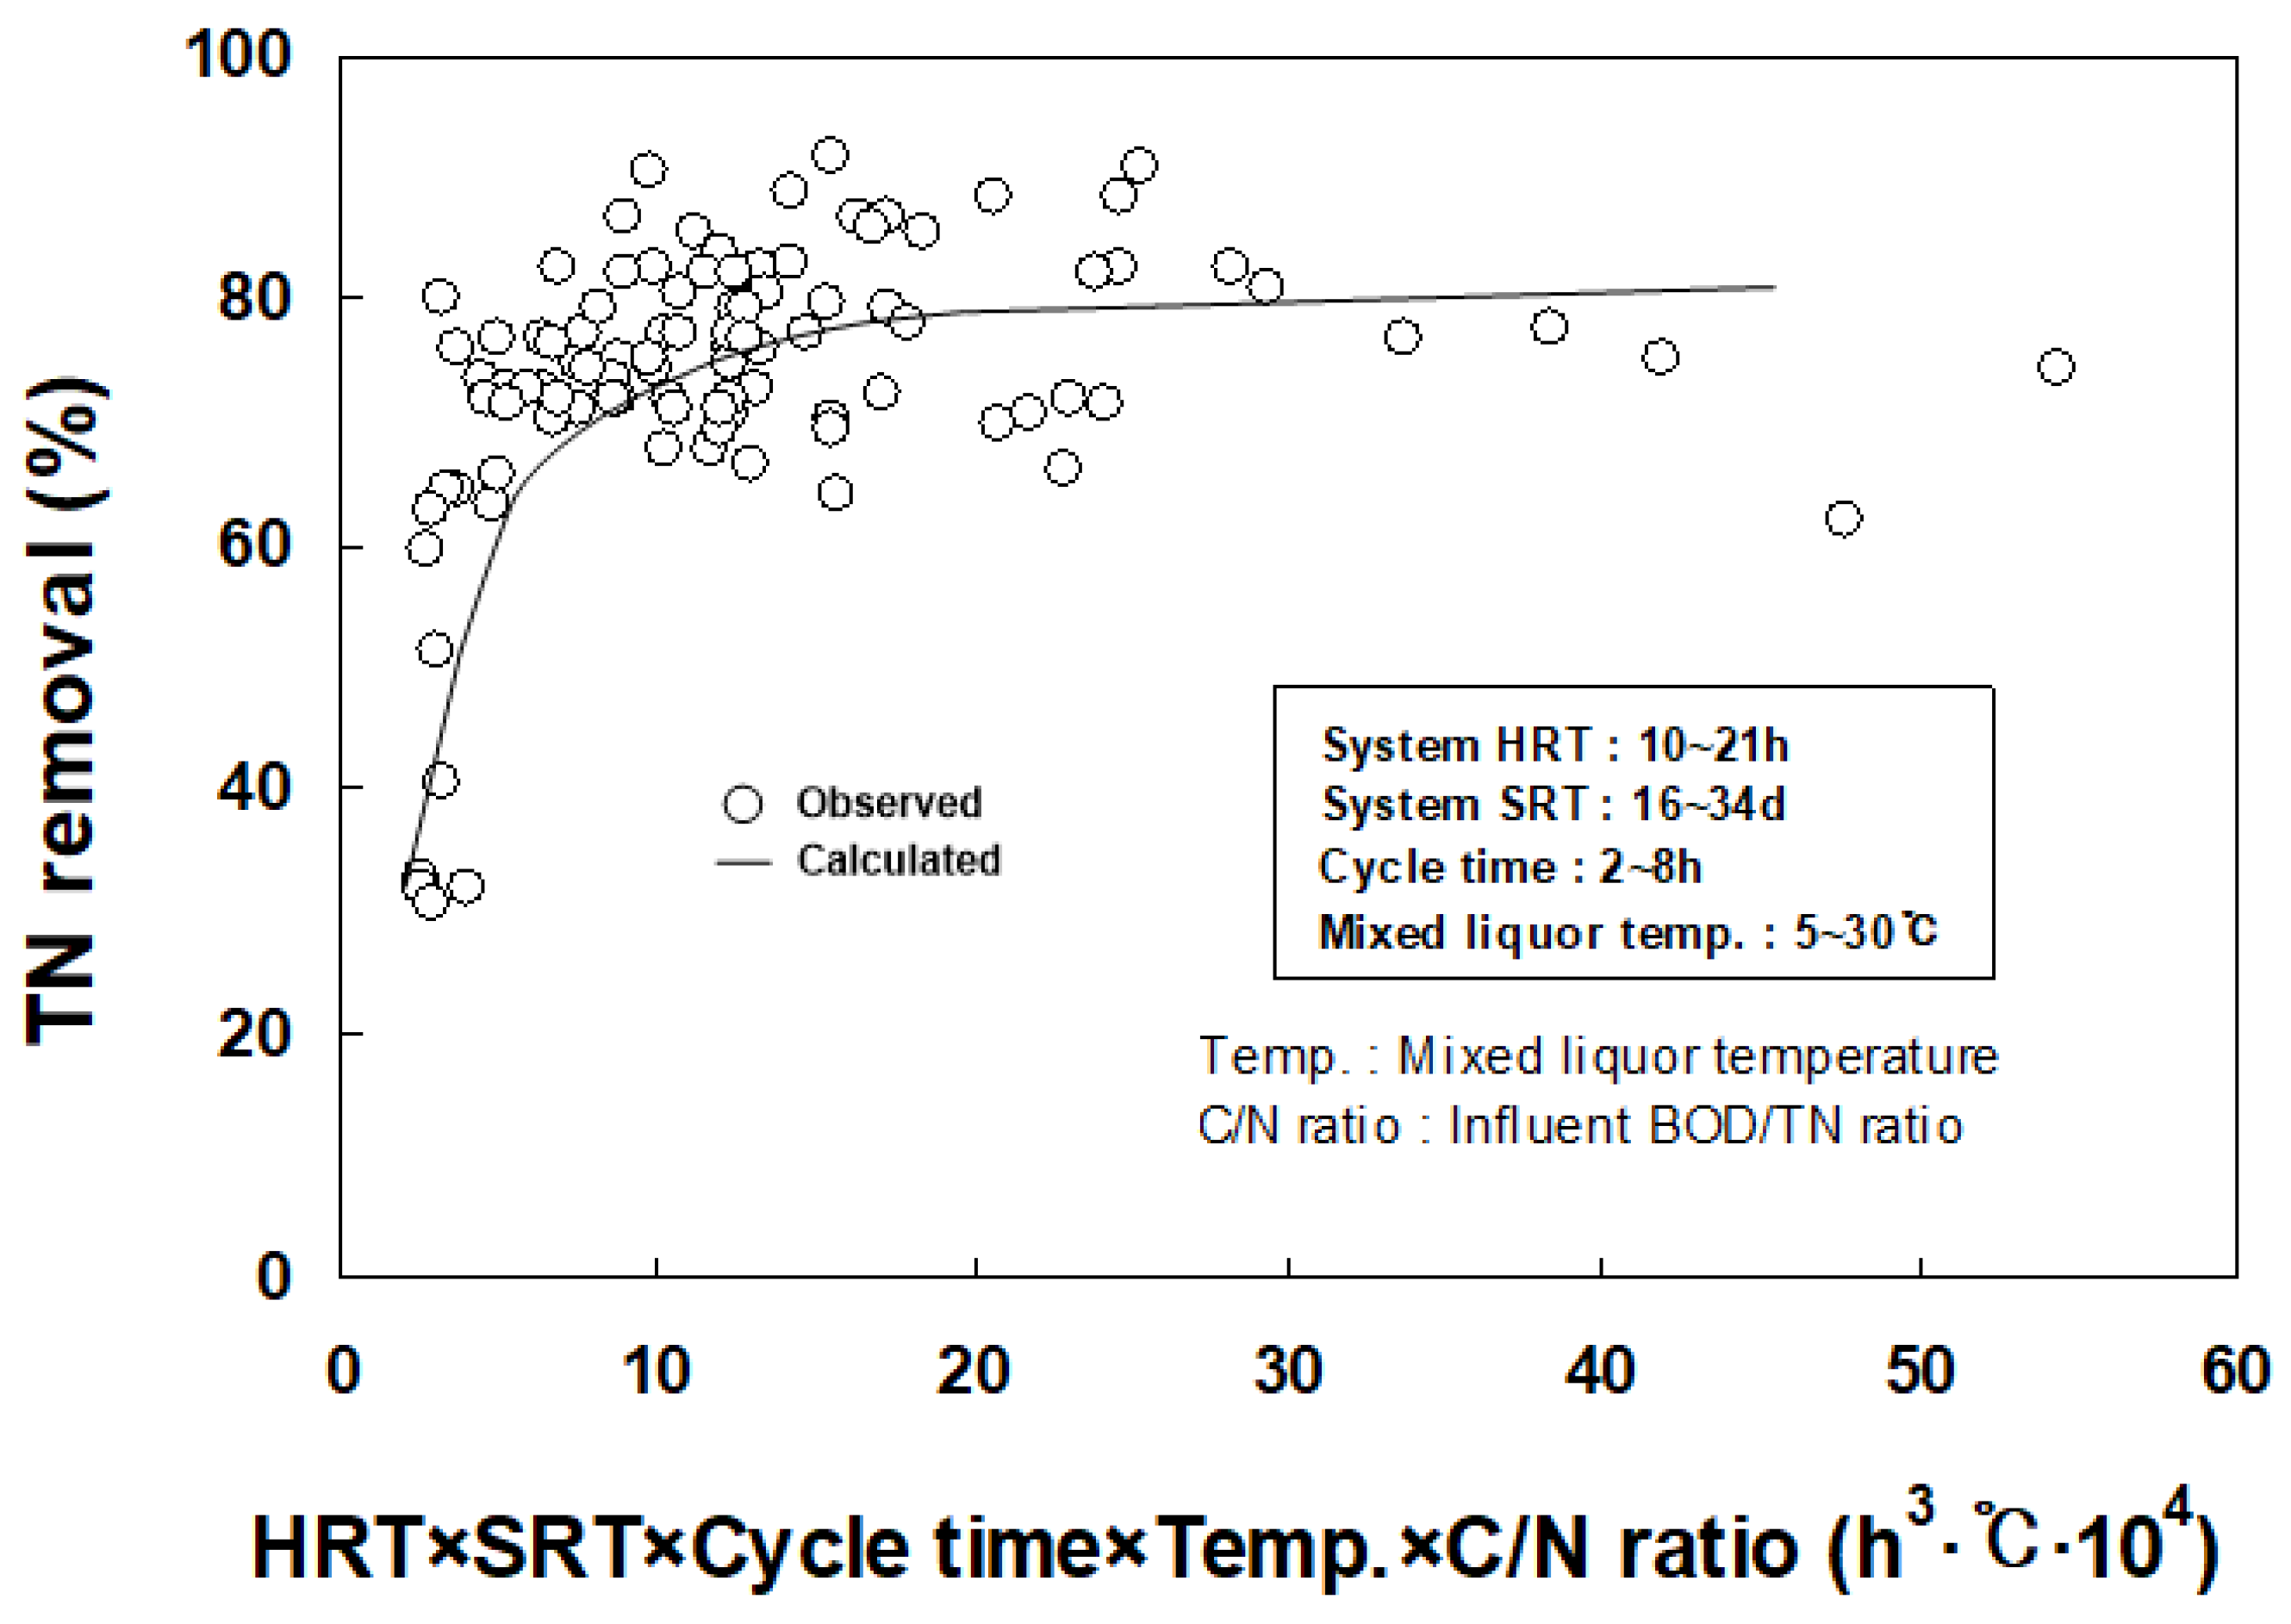
3.2. Multiple Regression Analysis for Deriving Major Influencing Factors on Nitrogen Removal

As the above-presented results suggest, the performance of process was complexly influenced by HRT, SRT, cycle time, mixed-liquor temperature, and influent wastewater characteristics such as C/N and C/P ratios. However, diverse and detailed analysis of the effect of the factors on the performance of the process is limited due to the characteristics of the field pilot study. Therefore, in this study, multiple regression analysis using Microsoft Excel was conducted to determine the degree of the complex influence of various environmental and operating factors on the performance and to determine the most influential parameters in the process operation for nutrient removal.
In biological nutrient removal processes, the effects of operational parameters are not always independent; certain variables interact to influence removal efficiency. For example, lower temperatures generally reduce microbial activity, but sufficient DO can compensate for this effect, stabilizing nitrification. Additionally, a high C/N ratio alone does not enhance phosphorus removal unless anaerobic conditions are also present. An imbalance between these rates may lead to excess nitrate accumulation in treated effluent.
Figure 3 shows the combined influence of major environmental factors and operating conditions on nitrogen removal in the pilot-scale phase-separated BNR process. Because the performance of the process was complexly influenced by each environmental and operating factor or a combination thereof, an error could occur in the analysis of individual factors. Therefore, the X-axis of the graph was set in the form of multiplication of each factor to minimize the errors and quantitatively evaluate the complex influence of various factors in this study. The errors that may occur when analyzing the effects of individual factors on nitrogen removal could be reduced by multiplying various factors such as HRT, SRT, cycle time, mixed-liquor temperature, and influent C/N ratio. Because nitrogen removal is more closely related to the C/N ratio than to the C/P ratio, only the C/N ratio was considered in this analysis. As the multiplication value of the major factors increased, the removal efficiency of total nitrogen tended to gradually increase. Most importantly, the process could produce an effluent TN below 10 mg/L within a multiplication of factors range above 7 × 10⁴ h3·℃, except at temperatures below 10 °C.
In general, a multiple regression equation has several explanatory variables on the right-hand side, each with its slope coefficient [31]. As shown in Figure 3, a considerable relationship between TN removal and the multiplication of HRT, SRT, cycle time, mixed-liquor temperature, and influent C/N ratio was observed. Based on the results in Figure 3, before applying of multiple regressions, the relationship with the power function can be expressed as follows:
R = A · [HRT]a · [SRT]b · [Cycle time]c · [Temp.]d · [C/N ratio]e
where R: TN removal;
A: intercept coefficient;
Temp.: mixed-liquor temperature (°C);
C/N ratio: influent BOD to TKN ratio;
a–e: coefficients of variables.
Equation (1) can be transformed as follows.
ln[R] = ln[A] + a·ln[HRT] + b·ln[SRT] + c·ln[Cycle time] + d·ln[Temp.] + e·ln[C/N ratio]
When the process was operated under the conditions of HRTs of 10–21 h, SRTs of 12–36 d, and cycle times of 2–8 h, the multiple regression results for TN removal in the mixed-liquor temperature range of 5–30 °C are presented in Table 2.
The multiple correlation coefficient is a measure of how well a given variable can be predicted using a linear function of a set of other variables in the statistical results. The correlation between the variable’s values and the best predictions can be computed linearly from the predictive variables [32]. Typically, the multiple correlation coefficient has values between 0 and 1. Higher values indicate higher predictability of the dependent variable from the independent variables, with a value of 1 indicating that the prediction is correct, and a value of 0 indicating that the linear combination of the independent variables is not a better predictor than the fixed mean of the dependent variable [33,34]. In statistics, the determination coefficient (R2) is also the proportion of variation in the dependent variable that can be predicted from the independent variables, and the determination coefficient normally ranges from 0 to 1. It provides a measure of how well-observed outcomes are replicated by the model, based on the proportion of the total variation of outcomes explained by the model [35,36]. In this study, a multiple correlation coefficient of 0.78 and a determination coefficient of 0.64 were observed, respectively. Lower multiple correlations between independent and dependent variables occurred more than expected because of the many populations and examples.
However, the F-ratio and signal F-ratio shown in the analysis of variance (ANOVA) were found to be statistically very significant, 15.4 and 4.73 × 10⁻¹¹, respectively. The F-ratio used in the statistics is related to the variance of the independent sample. The F-ratio is the ratio of the variance between groups to the variance within a group. A large F-ratio means that the variance between groups is greater than the variance within a group, which can be interpreted to mean that there is a statistically significant difference in the group mean [37,38].
The p-value (significant probability) is also widely used in the fields of science and engineering to quantify the statistical significance of the observed results. The p-value indicates the probability that a statistical summary will be equal to or more extreme than the actual observed result when the null hypothesis is true. Because the p-value is the result of a statistical test, many researchers think that the p-value is the most important summary of statistical analysis [39]. The lower the p-value, the greater the statistical significance of the observed differences. A p-value of 0.05 or lower is generally considered statistically significant [40]. In this study, the p-values capable of determining the degree of influence on each independent variable were 0.0046, 0.0243, 0.0722, 2.3634 × 10⁻⁸, and 0.0823 for ln[HRT], ln[SRT], ln[Cycle Time], ln[Temp.], and ln[C/N ratio], respectively. Therefore, the effects of the factors on TN removal can be summarized as follows:
Mixed-liquor temperature > HRT > SRT > Cycle time−1 > C/N ratio
The effect of the mixed-liquor temperature on the TN removal in the process was found to be the most significant, followed by HRT, SRT, cycle time, and influent C/N ratio. As mentioned above, the effect of the mixed-liquor temperature on nitrogen removal from the experimental results was much greater than the influent C/N ratio under low-temperature conditions below 10 °C, which was consistent the result of the regression analysis. In previous studies, it has been reported that an increase in temperature improves nitrogen removal efficiency and alters the composition of microbial communities [41]. Although the optimal removal efficiency was observed at temperatures above 18 °C, it was reported that nitrogen removal efficiency significantly decreased when the temperature fell below 13 °C [42]. These findings indicate that the results of this study are consistent with those of prior research.
In addition, in the case of cycle time, the degree of influence was larger than the influent C/N ratio; however, it showed an inversely proportional tendency to the TN removal efficiency, consistent with the experimental results presented above.
The values of A (intercept coefficient) and a–e (coefficients of variables) were obtained from Table 2, substituted into Equation (1), and the calculated values for HRT, SRT, cycle time, mixed-liquor temperature, and influent C/N ratio for each experimental condition were obtained. The calculated results were compared with the data obtained from the field pilot experiments. Figure 4 presents a comparison between the calculated and observed results. The overall tendencies of the observed and calculated results were similar. Therefore, a sensitivity analysis of the complex influence of major environmental and operating factors on nitrogen removal could be successfully accomplished by multiplication and regression of factors.

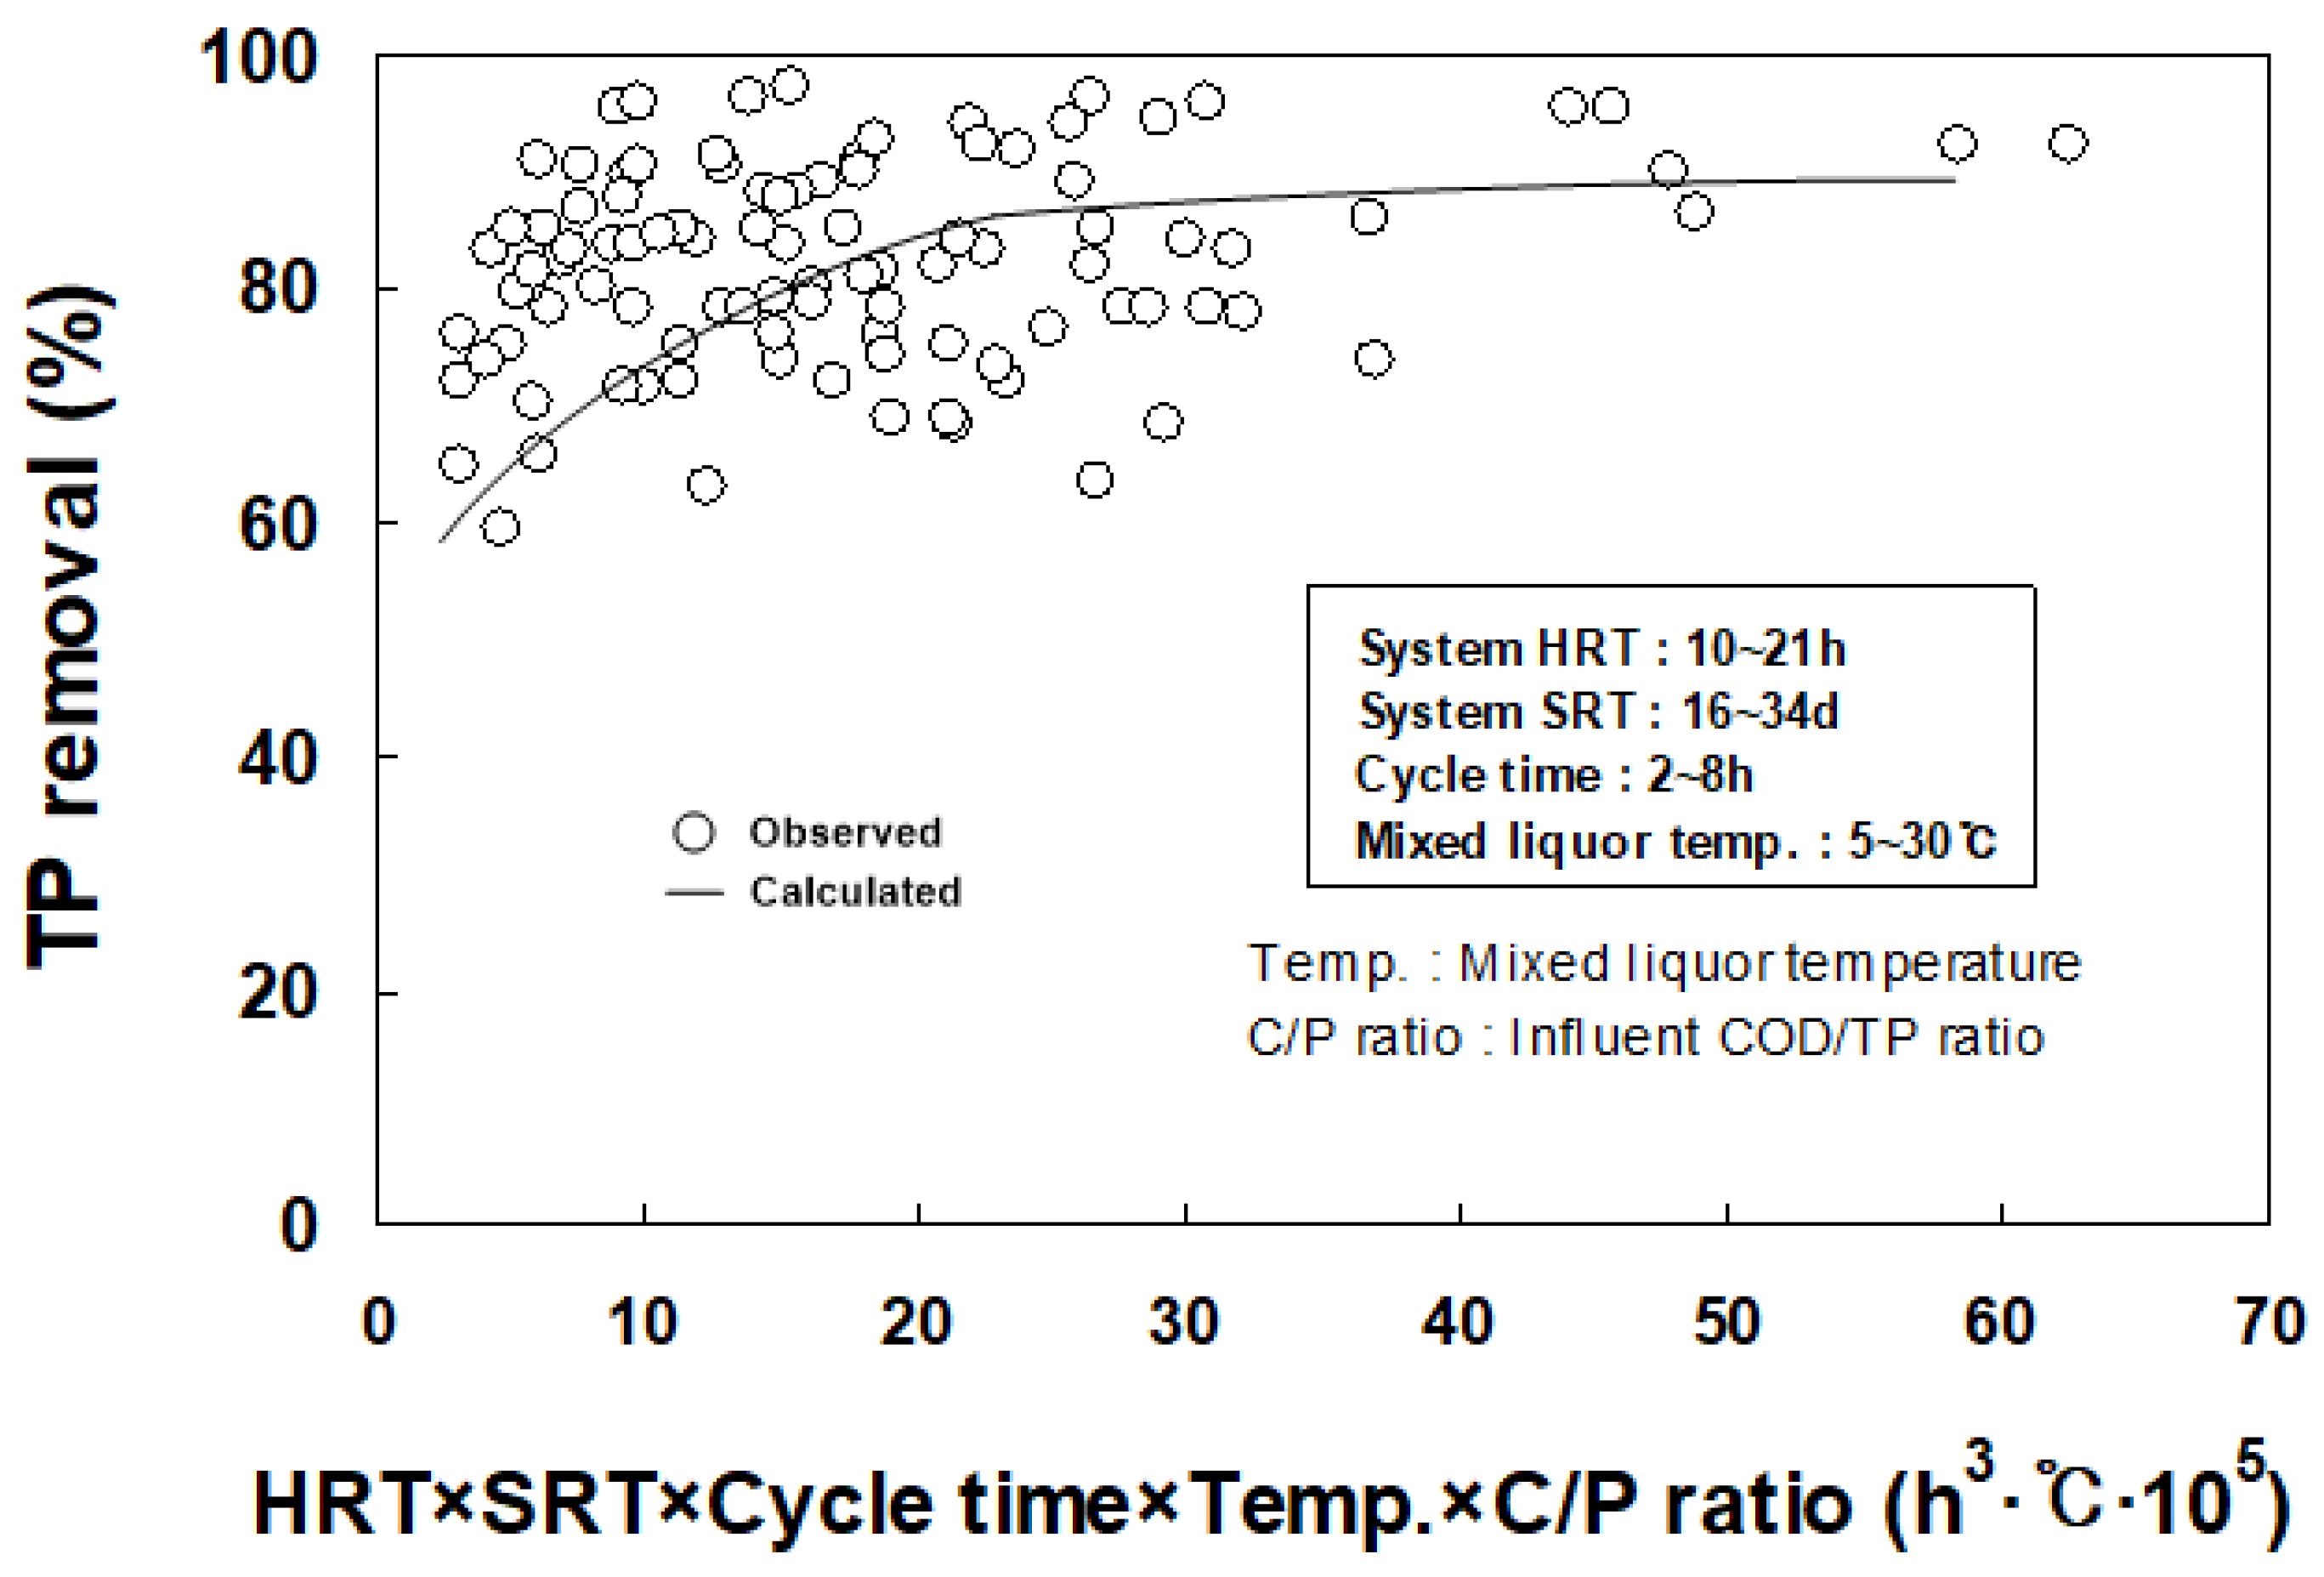
3.3. Multiple Regression Analysis for Deriving Major Influencing Factors on Phosphorus Removal

Because the pilot-scale temporal and spatial phase-separated BNR process is a simultaneous removal process of nitrogen and phosphorus, the impact of various environmental and operational factors on phosphorus removal efficiency should also be considered. Therefore, a sensitivity analysis of the combined influence of major environmental and operating factors on phosphorus removal was also performed by multiple regression on various factors, as shown in Figure 5. As the multiplication of the factors increased, TP removal gradually increased, like that of TN. The error could also be minimized by multiplying various factors such as HRT, SRT, cycle time, mixed-liquor temperature, and influent C/P ratio. Because phosphorus removal is more closely related to the C/P ratio than to the C/N ratio, only the C/P ratio was considered. As presented in Figure 5, a considerable relationship between TP removal and the multiplication of various factors was estimated.
The relationship can be given by Equation (3) before regression is applied.
R = A · [HRT]a · [SRT]b · [Cycle time]c · [Temp.]d · [C/P ratio]e
where R: TP removal
A: intercept coefficient;
Temp.: mixed-liquor temperature (°C);
C/P ratio: influent BOD to TP ratio;
a–e: coefficients of variables.
Equation (3) can be transformed as follows.
ln[R] = ln[A] + a·ln[HRT] + b·ln[SRT] + c·ln[Cycle time] + d·ln[Temp.] + e·ln[C/P ratio]
When the process was operated under the conditions of HRTs of 10–21 h, SRTs of 12–36 d, and cycle times of 2–8 h, the multiple regression results for TP removal in the mixed-liquor temperature range of 5–30 °C are summarized in Table 3.
A multiple correlation coefficient of 0.75 and a determination coefficient of 0.62 were calculated. The values of the multiple correlation and determination coefficients were lower than those for the total nitrogen. However, the result with an F-value below 4.19 × 10⁻¹⁰ was included in the significance level. In particular, the p-values for the independent variables were 0.0281, 0.0027, 0.0014, 1.7517 × 10⁻¹⁰, and 0.0328 for ln[HRT], ln[SRT], ln[Cycle Time], ln[Temp.] and ln[C/P ratio], respectively. Therefore, the effect of the factors on TP removal can be summarized as follows:
Mixed-liquor temperature > Cycle time > SRT−1 > HRT−1 > C/P ratio
As mentioned in the case of nitrogen, the mixed-liquor temperature was the most important factor influencing the TP removal characteristics of the process, followed by the cycle time, SRT, HRT, and influent C/P ratio. In addition, the SRT and HRT showed an inversely proportional relationship with the TP removal efficiency, which was consistent with the actual experimental results, where phosphorus removal efficiency decreased as the SRT and HRT increased.
The values of A (intercept coefficient) and a–e (coefficients of variables) were calculated by substituting the regression results for Equation (3), and the calculated results were compared with the observed data. Figure 6 shows a comparison between the calculated and observed results. The overall tendencies of the observed and calculated results were similar. Therefore, as in the case of nitrogen, a sensitivity analysis of the complex influence of major environmental and operating factors on phosphorus removal could be successfully achieved by multiple regression analysis on various factors. Although this study mainly focused on key process parameters, it did not explicitly consider external factors such as seasonal fluctuations, long-term operational changes, and regulatory impacts. It is expected that future studies will incorporate these aspects to provide a more comprehensive understanding of nutrient removal efficiency.

4. Conclusions

The performance of the phase-separated BNR process, with both temporal and spatial phase separation characteristics, was evaluated through long-term pilot experiments. When the process was operated at mixed-liquor temperatures in the range of 10–30 °C, HRTs of 10–21 h, SRTs of 16–36 d, and a cycle time of 2–8 h, the removal of BOD, TN, and TP in the range of 90–99%, 64–93%, and 63–98% could be accomplished, respectively. The performance of the process was influenced by the HRT, SRT, cycle time, mixed-liquor temperature, and influent characteristics. Therefore, a multiple regression analysis using Microsoft Excel was conducted to determine the degree to which major environmental and operating factors influence nitrogen and phosphorus removals. The influence of mixed-liquor temperature on TN removal was found to be the most significant, followed by HRT, SRT, cycle time, and influent C/N ratio. The temperature was also the most important factor affecting TP removal in the process, followed by the cycle time, SRT, HRT, and influent C/P ratio, respectively. Thus, the evaluation of the complex influence of major environmental and operating factors on nutrient removal could be performed successfully, and it is expected that the method of easily deriving the important priorities of major factors using multiple regression analysis in Excel could contribute to the optimal operation of many wastewater treatment processes. Using Excel for regression analysis allows for the proactive determination of optimal operational parameters to improve removal efficiency in WWTP and the development of adaptive control strategies. Sensitivity analysis, based on regression results, can also help identify the most cost-effective process adjustments. This approach is expected to enable operational optimization based on data-driven decision-making in WWTPs.

Author Contributions

Conceptualization, K.-H.H.; methodology, M.-S.K.; software, Y.-J.C.; validation, K.-H.H.; formal analysis, Y.-J.C.; investigation, M.-S.K.; resources, Y.-J.C.; data curation, M.-S.K.; writing—original draft preparation, M.-S.K.; writing—review and editing, K.-H.H.; visualization, M.-S.K.; supervision, K.-H.H.; project administration, K.-H.H.; funding acquisition, K.-H.H. All authors have read and agreed to the published version of the manuscript.

Funding

This work is financially supported by Korea Ministry of Environment (MOE) Graduate School specialized in Integrated Pollution Prevention and Control Project.

Data Availability Statement

The original contributions presented in this study are included in the article. Further inquiries can be directed to the corresponding author.

Conflicts of Interest

The author declares no conflicts of interest.

References

  1. Patel, J.; Nakhla, G. Interaction of denitrification and P removal in anoxic P removal system. Desalination 2006, 201, 82–99. [Google Scholar] [CrossRef]
  2. Guerrero, J.; Tayà, C.; Guisasola, A.; Baeza, J.A. Understanding the detrimental effect of nitrate presence on EBPR systems: Effect of the plant configuration. J. Chem. Technol. Biotechnol. 2012, 87, 1508–1511. [Google Scholar] [CrossRef]
  3. Tchobanoglous, G.; Stensel, H.D.; Tsuchihashi, R.; Burton, F. Wastewater Engineering: Treatment and Resource Recovery, 5th ed.; McGraw-Hill Press: New York, NY, USA, 2014. [Google Scholar]
  4. Wang, X.; Wang, S.; Xue, T.; Li, B.; Dai, X.; Peng, Y. Treating low carbon/nitrogen (C/N) wastewater in simultaneous nitrification-endogenous denitrification and phosphorus removal (SNDPR) systems by strengthening anaerobic intracellular carbon storage. Water Res. 2015, 77, 191–200. [Google Scholar] [CrossRef]
  5. Alisawi, H.A.O. Performance of wastewater treatment during variable temperature. Appl. Water Sci. 2020, 10, 89. [Google Scholar] [CrossRef]
  6. Ruano, M.V.; Ribes, J.; Seco, A.; Ferrer, J. An advanced control strategy for biological nutrient removal in continuous systems based on pH and ORP sensors. Chem. Eng. J. 2012, 185, 212–221. [Google Scholar] [CrossRef]
  7. Ostace, G.S.; Baeza, J.A.; Guerrer, J.; Guisasola, A.; Cristea, V.M.; Agachi, P.S.; Lafuente, J. Development and economic assessment of different WWTP control strategies for optimal simultaneous removal of carbon, nitrogen, and phosphorus. Comput. Chem. Eng. 2013, 53, 164–177. [Google Scholar] [CrossRef]
  8. Scheumann, R.; Kraume, M. Influence of hydraulic retention time on the operation of a submerged membrane sequencing batch reactor (SM-SBR) for the treatment of greywater. Desalination 2009, 246, 444–451. [Google Scholar] [CrossRef]
  9. Xu, M.; Li, P.; Tang, T.; Hu, Z. Roles of SRT and HRT of an algal membrane bioreactor system with a tanks-in-series configuration for secondary wastewater effluent polishing. Ecol. Eng. 2015, 85, 257–264. [Google Scholar] [CrossRef]
  10. Xu, S.; Wu, D.; Hu, Z. Impact of hydraulic retention time on organic and nutrient removal in a membrane coupled sequencing batch reactor. Water Res. 2014, 55, 12–20. [Google Scholar] [CrossRef]
  11. Daigger, G.T.; Littleton, H.X. Characterization of simultaneous nutrient removal in staged, closed-loop bioreactors. Water Environ. Res. 2000, 72, 330–339. [Google Scholar] [CrossRef]
  12. Yilmaz, G.; Lemaire, R.; Keller, J.; Yuan, Z. Effectiveness of an alternating aerobic, anoxic/anaerobic strategy for maintaining biomass activity of BNR sludge during long-term starvation. Water Res. 2007, 41, 2590–2598. [Google Scholar] [CrossRef] [PubMed]
  13. Tayà, C.; Guisasola, A.; Baeza, J.A. Assessment of a bioaugmentation strategy with polyphosphate accumulating organisms in a nitrification/denitrification sequencing batch reactor. Bioresour. Technol. 2011, 102, 7678–7684. [Google Scholar] [CrossRef]
  14. Dey, A.; Truax, D.D.; Magbanua, B.S. Optimization of operating parameters of intermittent aeration-type activated sludge process for nitrogen removal: A simulation-based approach. Water Environ. Res. 2011, 83, 636–642. [Google Scholar] [CrossRef] [PubMed]
  15. Izadi, P.; Izadi, P.; Eldyasti, A. Enhancement of simultaneous nitrogen and phosphorus removal using intermittent aeration mechanism. J. Environ. Sci. 2021, 109, 1–14. [Google Scholar] [CrossRef] [PubMed]
  16. Lee, S.P.; Min, S.Y.; Kim, J.S.; Park, J.U.; Kim, M.S. A study on the influence of a sewage treatment plant’s operational parameters using the multiple regression analysis model. Environ. Eng. Res. 2014, 19, 31–36. [Google Scholar] [CrossRef]
  17. Rahmat, S.; Altowayti, W.A.H.; Othman, N.; Asharuddin, S.M.; Saeed, F.; Basurra, S.; Eisa, T.A.E.; Shahir, S. Prediction of wastewater treatment plant performance using multivariate statistical analysis: A case study of a regional sewage treatment plant in Melaka, Malaysia. Water 2022, 14, 3297. [Google Scholar] [CrossRef]
  18. Krzywinski, M.; Altman, N. Multiple linear regression. Nat. Methods. 2015, 12, 1103–1104. [Google Scholar] [CrossRef]
  19. Larsen, D.R.; Speckman, P.L. Multivariate regression trees for analysis of abundance data. Biometrics 2004, 60, 543–549. [Google Scholar] [CrossRef]
  20. Hakanen, J.; Sahlstedt, K.; Miettinen, K. Wastewater treatment plant design and operation under multiple conflicting objective functions. Environ. Model Softw. 2013, 46, 240–249. [Google Scholar] [CrossRef]
  21. APHA; AWWA; WEF. Standard Methods for the Examination of Water and Wastewater, 23rd ed.; APHA: Washington, DC, USA, 2017. [Google Scholar]
  22. Carlberg, C. Regression Analysis Microsoft Excel, 1st ed.; Que Publishing: Seattle, WA, USA, 2016. [Google Scholar]
  23. Dong, W.; Lu, G.; Yan, L.; Zhang, Z.; Zhang, Y. Characteristics of pellets with immobilized activated sludge and its performance in increasing nitrification in sequencing batch reactors at low temperatures. J. Environ. Sci. 2016, 42, 202–209. [Google Scholar] [CrossRef]
  24. Ju, F.; Guo, F.; Ye, L.; Xia, Y.; Zhang, T. Metagenomic analysis on seasonal microbial variations of activated sludge from a full-scale wastewater treatment plant over 4 years. Environ. Microbiol. Rep. 2014, 6, 80–89. [Google Scholar] [CrossRef] [PubMed]
  25. Li, Z.; Hang, Z.; Zhang, Q.; Zhang, S.; Zhang, T.; Yu, H. Tuning of activated sludge in winter based on respirogram profiles under standard and site temperatures. J. Environ. Sci. 2019, 79, 330–338. [Google Scholar] [CrossRef]
  26. Chen, M.; Chen, Y.; Dong, S.; Lan, S.; Zhou, H.; Tan, Z.; Li, X. Mixed nitrifying bacteria culture under different temperature dropping strategies: Nitrification performance, activity, and community. Chemosphere 2018, 195, 800–809. [Google Scholar] [CrossRef] [PubMed]
  27. Zhang, S.; Wang, Y.; He, W.; Wu, M.; Xing, M.; Yang, J.; Gao, N.; Pan, M. Impacts of temperature and nitrifying community on nitrification kinetics in a moving-bed biofilm reactor treating polluted raw water. Chem. Eng. J. 2014, 236, 242–250. [Google Scholar] [CrossRef]
  28. Head, M.A.; Oleszkiewicz, J.A. Bioaugmentation for nitrification at cold temperatures. Water Res. 2004, 38, 523–530. [Google Scholar] [CrossRef] [PubMed]
  29. Pei, L.; Peng, D.; Wei, J.; Wang, B.; Zhang, X.; Yu, L. Nitrogen removal from an AAO pilot plant with nitrifier bioaugmentation after seasonal deterioration. Desalin. Water Treat. 2014, 52, 5136–5143. [Google Scholar] [CrossRef]
  30. Hong, K.H.; Chang, D.; Kang, S.W.; Hur, J.M.; Han, S.B.; Sunwoo, Y. Effect of cycle length and phase fraction on biological nutrients removal in temporal and spatial phase separated process. J. Ind. Eng. Chem. 2008, 14, 520–525. [Google Scholar] [CrossRef]
  31. Freedman, D.A. Statistical Models: Theory and Practice, 2nd ed.; Cambridge University Press: Cambridge, UK, 2009. [Google Scholar]
  32. Kvam, P.; Vidakovic, B.; Kim, S. Nonparametric Statistics with Applications to Science and Engineering with R, 2nd ed.; John Wiley & Sons: Hoboken, NJ, USA, 2022. [Google Scholar]
  33. Cohen, J.; Cohen, P.; West, S.G.; Aiken, L.S. Applied Multiple Regression: Correlation Analysis for the Behavioral Sciences; Routledge: New York, NY, USA, 2002. [Google Scholar]
  34. Timothy, Z.K. Multiple Regression and Beyond: An Introduction to Multiple Regression and Structural Equation Modeling, 2nd ed.; Routledge: New York, NY, USA, 2015. [Google Scholar]
  35. Meeker, W.; Escobar, L.; Pascual, F. Statistical Methods for Reliability Data, 2nd ed.; John Wiley & Sons: Hoboken, NJ, USA, 2022. [Google Scholar]
  36. Sharma, P.; Sood, S.; Mishra, S. Development of multiple linear regression model for biochemical oxygen demand (BOD) removal efficiency of different sewage treatment technologies in Delhi, India. Sustain. Water Resour. Manag. 2020, 6, 29–42. [Google Scholar] [CrossRef]
  37. Hahs-Vaughn, D.L.; Lomax, R.G. Statistical Concepts: A Second Course; Routledge: New York, NY, USA, 2020. [Google Scholar]
  38. Salkind, N.; Frey, B. Statistics for People Who (Think They) Hate Statistics: Using Microsoft Excel, 5th ed.; SAGE Publications: Thousand Oaks, CA, USA, 2021. [Google Scholar]
  39. Wassersteina, R.L.; Lazara, N.A. The ASA Statement on p-Values: Context, Process, and Purpose. Am. Stat. 2016, 78, 129–133. [Google Scholar] [CrossRef]
  40. Thiese, M.S.; Ronna, B.; Ott, U. p value interpretations and considerations. J. Thorac. Dis. 2016, 8, E928–E931. [Google Scholar] [CrossRef]
  41. Luo, H.; Song, Y.; Zhou, Y. Effects of rapid temperature rising on nitrogen removal and microbial community variation of an-oxic/aerobic process for ABS resin wastewater treatment. Environ. Sci. Pollut. Res. 2017, 24, 5509–5520. [Google Scholar] [CrossRef] [PubMed]
  42. Zhang, Q.; Chen, X.; Luo, W.; Wu, H.; Liu, X.; Chen, W.; Tang, J.; Zhang, L. Effects of temperature on the characteristics of nitrogen removal and microbial community in post solid-phase denitrification biofilter process. Int. J. Environ. Res. Public Health. 2019, 16, 4466. [Google Scholar] [CrossRef] [PubMed]
Figure 1. Operational steps of phase-separated BNR process.
Processes 13 00833 g001
Figure 2. Effect of mixed-liquor temperature on nitrification in the pilot-scale process.
Processes 13 00833 g002
Figure 3. Complex influence of major environmental and operating factors on nitrogen removal.
Processes 13 00833 g003
Figure 4. Comparison of calculated and observed results on the complex influence of major factors on nitrogen removal.
Processes 13 00833 g004
Figure 5. Complex influence of major environmental and operating factors on phosphorus removal.
Processes 13 00833 g005
Figure 6. Comparison of calculated and observed results on the complex influence of major factors on phosphorus removal.
Processes 13 00833 g006
Table 1. Overall performances of the pilot-scale phase-separated BNR process.
ParametersHRT (Based on the Volume Excluding the Intrachannel Clarifier)
10 h14 h21 h
Flowrate: 76.8 m3/dFlowrate: 54.9 m3/dFlowrate: 36.6 m3/d
InfluentEffluentRemovals (%)InfluentEffluentRemovals (%)InfluentEffluentRemovals (%)
Water temperature (°C)18–29
(24)
22–30
(25)
-15–28
(21)
10–30
(19)
-18–23
(20)
20–24
(22)
-
pH6.9–7.4
(7.2)
6.7–7.2
(7.0)
-6.9–8.2
(7.2)
6.9–7.7
(7.2)
-6.8–7.8
(7.4)
6.8–7.4
(7.2)
-
CODCr (mg/L)165–315
(250)
10–35
(20)
81.8–96.8
(93.8)
135–430
(285)
15–65
(28)
80.0–95.5
(89.9)
240–270
(250)
20–35
(30)
86.0–92.0
(88.1)
BOD (mg/L)130–150
(140)
5–10
(8)
92.3–96.6
(94.6)
96–250
(150)
2–15
(8)
89.6–98.7
(94.7)
100–150
(120)
4–10
(6)
90.0–97.3
(94.7)
TN (mg/L)24.2–37.9
(31.5)
4.3–12.2
(9.6)
67.8–83.2
(76.7)
31.7–54.0
(38.6)
2.7–10.2
(8.4)
64.5–93.2
(77.5)
32.3–36.0
(33.9)
9.9–12.9
(10.9)
64.1–71.3
(67.9)
TP (mg/L)4.38–6.15
(4.89)
0.36–1.20
(0.59)
89.7–97.2
(91.3)
2.80–6.84
(4.84)
0.14–1.56
(0.9)
65.4–97.6
(82.3)
3.54–4.72
(4.15)
0.98–1.50
(1.15)
63.4–78.5
(72.2)
TSS (mg/L)80–250
(135)
5–20
(10)
83.3–96.4
(88.2)
85–280
(155)
3–27
(16)
81.7–94.3
(89.1)
100–170
(130)
12–23
(16)
83.8–92.9
(87.6)
VSS (mg/L)35–230
(120)
5–15
(7)
82.4–97.8
(91.9)
70–245
(120)
3–25
(11)
81.0–97.8
(90.7)
88–135
(115)
8–18
(12)
86.7–93.6
(89.3)
SRT (d)29–32 (31)16–34 (25)23–36 (27)
MLSS (mg/L)1830–4580 (3390)2280–4070 (3140)2640–3880 (3390)
minimum–maximum (average).
Table 2. Multiple regression results showing the complex influence of major environmental and operating factors on nitrogen removal.
Regression statistic
Multiple correlation coefficient0.778690051
Coefficient of determination(R2)0.637146384
Adjusted R20.618048826
Standard error0.156201799
Number101
Variance analysis
Degree of freedomDegree of squaresMean squareF-ratioSignificant F-ratio
Regress51.8747149230.37494298515.367144334.72567 × 10−11
Residuals952.3179051860.024399002
Total1004.192620109
CoefficientStandard errort-statisticp-valueLower 95%
ln[A]2.532857080.3604099217.0277118653.16736 × 10−101.817353434
ln[HRT]0.3013565610.1038340282.9022909670.0046046930.095220101
ln[SRT]0.1482899190.0647807292.2891054260.0242881290.019684003
ln[Cycle time]−0.1260209240.071734981−1.7567569150.072181346−0.268432765
ln[Temp.]0.2391407070.039253716.0921809752.36338 × 10−80.161212295
ln[C/N ratio]0.0262789690.0738009530.3560789940.0822570950.172792281
Table 3. Multiple regression results in the complex influence of major environmental and operating factors on phosphorus removal.
Regression statistic
Multiple correlation coefficient0.748108769
Coefficient of determination (R2)0.620044976
Adjusted R20.609521027
Standard error0.085134199
Number101
Variance analysis
Degree of freedomDegree of squaresMean squareF-ratioSignificant
F-ratio
Regress50.4986929040.09973858113.761161154.19653 × 10−10
Residuals950.6885440170.007247832
Total1001.187236922
CoefficientStandard errort-statisticp-valueLower 95%
ln[A]4.7303441020.22430378421.089007141.30583 × 10−374.285045109
ln[HRT]−0.1841319110.055983305−3.2890504070.0281−0.295272744
ln[SRT]−0.0572203870.037278173−1.5349568360.0027−0.131226866
ln[Cycle time]0.1195849950.0388454723.0784796820.00140.042467039
ln[Temp.]0.1508644040.0210907887.1530945951.75175 × 10−100.108993925
ln[C/P ratio]0.0652722860.0282113882.3136857390.03280.121278932
Disclaimer/Publisher’s Note: The statements, opinions and data contained in all publications are solely those of the individual author(s) and contributor(s) and not of MDPI and/or the editor(s). MDPI and/or the editor(s) disclaim responsibility for any injury to people or property resulting from any ideas, methods, instructions or products referred to in the content.

