Article

Green Synthesis, Characterization, and Optimization of Chitosan Nanoparticles Using Blumea balsamifera Extract

by
Johann Dominic A. Villarta
,
Fernan Joseph C. Paylago
,
Janne Camille H. Poldo
,
Jalen Stephen R. Santos
,
Tricia Anne Marie M. Escordial
and
Charlimagne M. Montealegre
*
Biochemical Engineering Laboratory, Department of Chemical Engineering, University of the Philippines Diliman, Quezon City 1101, Philippines
*
Author to whom correspondence should be addressed.
Processes 2025, 13(3), 804; https://doi.org/10.3390/pr13030804
Submission received: 31 January 2025 / Revised: 5 March 2025 / Accepted: 7 March 2025 / Published: 10 March 2025

Abstract

:
Chitosan nanoparticles are nontoxic polymers with diverse biomedical applications. Traditional nanoparticle synthesis often involves harmful chemicals or results in reduced desirable properties, sparking interest in green synthesis methods for nanoparticle production. Utilizing plant-based phytochemicals as reducing and capping agents offers advantages like biocompatibility, sustainability, and safety. This study explored Blumea balsamifera leaf extract for chitosan nanoparticle (CNP) synthesis. CNPs were synthesized using pH-induced gelation and characterized by DLS and SEM. B. balsamifera extract, prepared using ethanol, achieved a total phenolic content of 19.37 ± 6.35 mg GAE/g dry weight. DLS characterization revealed a broad size distribution, with an average particle diameter of 908.9 ± 93.6 nm and peaks at 11.11 ± 0.97 nm, 164.45 ± 6.13 nm, and 1672.04 ± 338.75 nm. SEM measurements showed spherical particles with a diameter of 56.8–63.0 nm. UV-Vis analysis, with an absorption peak at 286.5 ± 0.5 nm, was used to optimize CNP biosynthesis through a Face-Centered Central Composite Design (FCCCD). Higher concentrations of B. balsamifera extract (0.05 g/mL) and chitosan (19.1 mg/mL) maximized nanoparticle yield with a mass of 100 μg/mL. Antibacterial testing against E. coli demonstrated a minimum inhibitory concentration of 25 μg/mL. B. balsamifera extract effectively synthesized nanochitosan particles, showing potential for antibacterial applications.

1. Introduction

Chitosan Nanoparticles (CNPs) are natural polysaccharides with extensive biomedical applications, attributed to their antibacterial properties, biocompatibility, biodegradability, hydrophilicity, and nontoxic and cationic nature [1]. Efforts have been made to develop environmentally friendly methods for synthesizing biocompatible nanoparticles, as biologically or green synthesized nanomaterials were said to be beneficial in many endemic diseases, and, more importantly, to have fewer complications [2]. While there are other methods for synthesizing CNPs [3], such as emulsification and cross-linking, precipitation, and the ionic gelation method, issues involving toxicity or challenges in the entrapment of high-molecular-weight medications [3,4] are frequently encountered. Moreover, since the resulting products would also be bioresorbable, biodegradable, and self-renewable in biological and ecological systems, green synthesis methods—which are generally more economical and environmentally friendly—have become a key area of research in bio-nanoengineering [2].
Multiple in vitro and in vivo studies have demonstrated the antioxidant, cytotoxic, antimicrobial, antifungal, anti-inflammatory, and hypolipidemic activities of Blumea balsamifera owing to its rich phytochemical profile [5]. Notably, two of its key components, L-Borneol and Blumea balsamiferae oleum, are widely used in Chinese medicines such as Yinlishuang pills, Yankang tablets, Jinhoujian Spray, and Xinwei Zhitong Capsules. Recent studies have also explored its incorporation into various pharmaceutical formulations. Ma et al. (2024) developed a silver nanoparticle-loaded nanoemulsion using B. balsamifera oil and tea saponin, resulting in a stable formulation with strong antimicrobial activity against Staphylococcus aureus, Escherichia coli, and Pseudomonas aeruginosa [6]. Similarly, Liu et al. (2023) found that B. balsamifera essential oil nanoformulations significantly enhanced skin absorption and promoted wound healing [7]. The presence of phytochemicals such as flavonoids and terpenoids in B. balsamifera leaf extracts enables their function as bioreductants and stabilizing agents in the synthesis of nanoparticles. Ginting et al. (2020) demonstrated this by successfully synthesizing copper nanoparticles using B. balsamifera leaf extract, highlighting its potential applications in biomedical, antibacterial, and nano-drug delivery systems [8]. Silver nanoparticles synthesized from B. balsamifera leaf extract also exhibited antioxidant properties as well as antibacterial activity against E. coli and S. aureus [9].
This study investigates the green synthesis of CNPs from Blumea balsamifera leaf extract, with further optimization using a Face-Centered Central Composite Design. The size distribution and morphology of the CNPs are analyzed by DLS and SEM, while their antibacterial activity against E. coli is assessed through its minimum inhibitory concentration.

2. Materials and Methods

2.1. Preparation of B. balsamifera Extract

The method for preparing B. balsamifera extract was adapted from Mohamed et al. [10], with modifications. B. balsamifera leaves were collected from locally grown specimens (14°38′53.6″ N 121°04′02.1″ E), washed, and the petioles and midribs were removed by cutting. The cut and washed leaves were then dried for 8 h at 65 °C before weighing. For the phenolic extraction process, a 1:2 water-to-ethanol solvent was added at a ratio of 20 mL solvent per gram of dried leaves. This mixture was continuously stirred at 120 rpm and maintained at 50 °C for 2 h, then filtered through grade 1 Watman filter paper and centrifuged at 10,000× g for 10 min. The liquid was decanted, and the volume was adjusted to 20 mL to maintain the extract concentration at 0.05× g dried B. balsamifera leaves per mL, before being stored at −4 °C. The supernatants were used for a Total Phenolic Content Assay as well as for CNPs synthesis.

2.2. Total Phenolic Content Assay of B. balsamifera Extract

The method for the determination of the total phenolic content assay of B. balsamifera extract was derived from Burapan et al. [11], with modifications. To prepare the standard curve, gallic acid stock was initially created by diluting 0.5 g of gallic acid in 10 mL ethanol and then further diluting to 100 mL using distilled water. Working standards were prepared with concentrations of 0.05, 0.1, 0.25, and 0.5 mg/mL. For each setup, 200 μL of Folin–Ciocalteu reagent was added to 600 μL of 7.5% sodium bicarbonate solution, and 40 μL of the gallic acid working standard. This protocol was performed in triplicate. The mixtures were kept in the dark at ambient conditions for 2 h to complete the reaction. To determine the TPC of the B. balsamifera extract, the same protocol was followed, replacing the gallic acid with a two-fold diluted sample of the B. balsamifera extract. After 30 min, the absorbance, at 765 nm, was measured using a UV-Vis spectrophotometer (BIOBASE BK-UV1000G, Biobase, Shandong, China). Total phenolic content was expressed as mg GAE/g sample. The calibration curve of the standard gallic acid solution was obtained as y = 1.4322x + 0.001 (R2 = 0.9621).

2.3. Preparation of Chitosan Nanoparticles

The method for the preparation of CNPs was adapted from El-Naggar et al. [12,13], with modifications. Chitosan was dissolved at 1% (w/v) with 1% (v/v) acetic acid and pH was adjusted to 4.8 ± 0.02 with 1 N NaOH at 25 °C. To ensure that the chitosan is entirely dissolved in the solution, it was manually stirred until it appears homogeneous before being shaken at 210 rpm overnight at 25 °C.
Ten mL of B. balsamifera leaves extract was subsequently added to 10 mL of the chitosan solution (1:1 v/v). The resulting solution was shaken at 110 rpm for 60 min at 50 °C, resulting in the formation of CNPs. The suspension was centrifuged at 4000× g for twenty minutes before being decanted. The supernatant was again centrifuged, this time at 10,000× g for ten min before fully disposing of the supernatant.
The pellet was washed with 1% (v/v) acetic acid solution to remove unreacted chitosan from the synthesized CNPs. The resulting solution was centrifuged at 10,000× g for ten min. This washing procedure was performed twice before redissolving the synthesized CNPs in 10 mL 1 percent (v/v) acetic acid solution for optimization.

2.4. Characterization of Optimized CNPs

The size of synthesized B. balsamifera CNPs was measured using Particulate Systems NanoPlus Dynamic Light Scattering (Microtrac, York, PA, USA), and JEOL 7100 Scanning Electron Microscope (SEM) (JEOL, Tokyo, Japan). Shimadzu UV-1700 UV-Vis Spectrophotometer (Shimadzu, Kyoto, Japan) was used to determine the peak absorbance of the synthesized CNPs and the wavelength at which it occurs.

2.5. Optimization of the Green Synthesized Chitosan Nanoparticles

For the optimization of the green synthesized CNPs, the Face-Centered Central Composite experimental design was utilized. The independent variables, including Initial Chitosan Concentration (C) and Leaf Extract Concentrations (E), were coded in three levels (−1, 0, 1). Nine (9) experimental runs were carried out, with each of the runs being performed in triplicate. The actual and coded levels, and the full matrix of the experimental design for variable levels were formulated. The response values (Y) for green synthesis of CNPs, which correspond to the absorbance at the peak wavelength, were determined. The second-degree polynomial equation (in Equation (1)) was used to determine the correlation between the selected independent variables and the response:
Y = β 0 + i β i X i + i i β i i X i 2 + i j β i j X i X j
in which Y is the absorbance, X i is the coded value of the independent factors, β i is the linear coefficient, β 0 represents the regression coefficients, and β i j and β i i refer to the interaction coefficients and quadratic coefficients, respectively. Regression was performed to determine the approximate surface response equation, and the optimal values are determined from 3-dimensional surface plots.

2.6. Statistical Analysis

For both the design of the experiments and the carrying out of the statistical analysis, the program Stat-Ease® Design-Expert® v.13 for Windows was employed (https://www.statease.com/software/design-expert/ accessed on 16 September 2024).

2.7. Antibacterial Activity Against E. coli

E. coli ATCC 11,303 was grown in Tryptic Soy Broth (TSB) and incubated at 37 °C with shaking at 200 rpm for 12–18 h. After synthesis, CNPs were washed twice with 1% (v/v) acetic acid solution, and once with sterile distilled water before resuspension in sterile water to a concentration of 100 μg/mL. Sterile TSB was mixed with CNPs and serially diluted. The TSB-CNP mixture was then combined with equal volumes of E. coli in TSB, resulting in a CNP concentration range of 25 μg/mL in the first dilution to 0.0488 μg/mL in the tenth dilution. The prepared tubes were covered and incubated at 37 °C with shaking at 200 rpm for 12–18 h. Spectrophotometric analysis was conducted to measure the optical density at 625 nm using BIOBASE BK-UV1000G UV-Vis spectrophotometer. Blank samples consisted of TSB only, the control contained TSB with E. coli but no CNPs, and the positive control contains doxycycline at 100 μg/mL to 0.195 μg/mL from the first to the tenth dilution, respectively. All experimental setups were prepared in triplicate.

3. Results

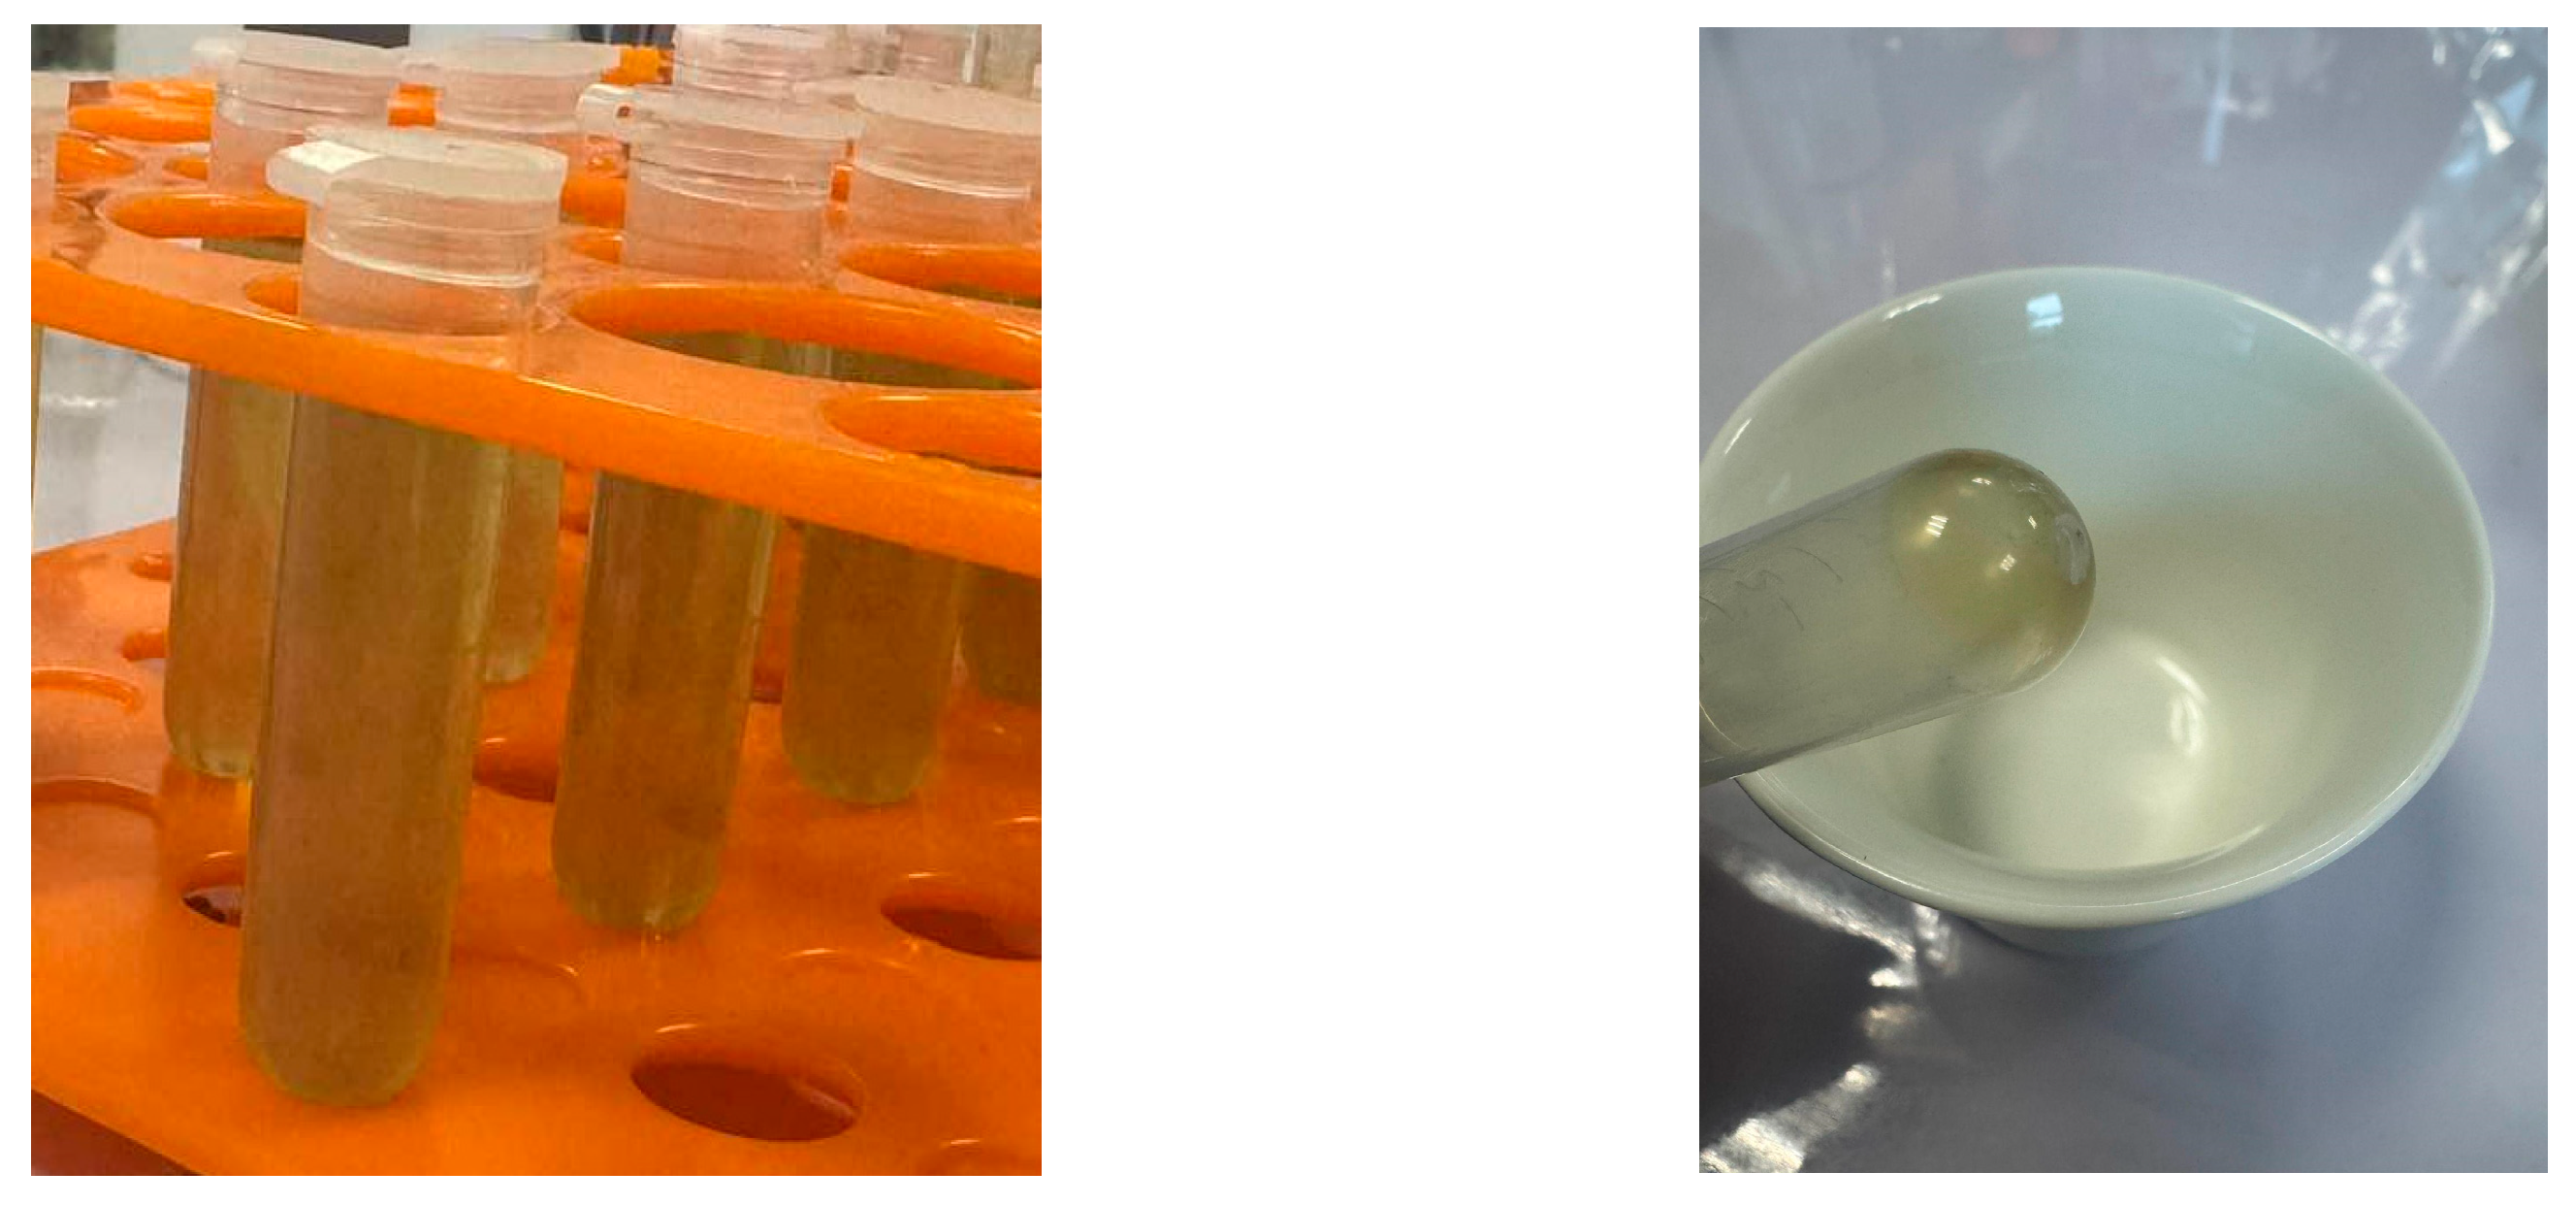
3.1. B. balsamifera Extract Preparation

During the phenolic extraction, the solvent mixed with the dried B. balsamifera leaves initially exhibited a dark green color. However, as the mixture was filtered and centrifuged, the intense color noticeably faded, suggesting the removal of particulate matter, including excess plant material and impurities. The total phenolic content was measured to be 19.37 ± 6.35 mg GAE/g of the dry B. balsamifera sample.

3.2. Green Synthesis of Chitosan Nanoparticles (CNPs)

Upon mixing and shaking the chitosan solution and B. balsamifera leaves extract, a stable light-yellow colloidal mixture was produced. The turbidity of the solution indicates the presence of particles, as shown in Figure 1.

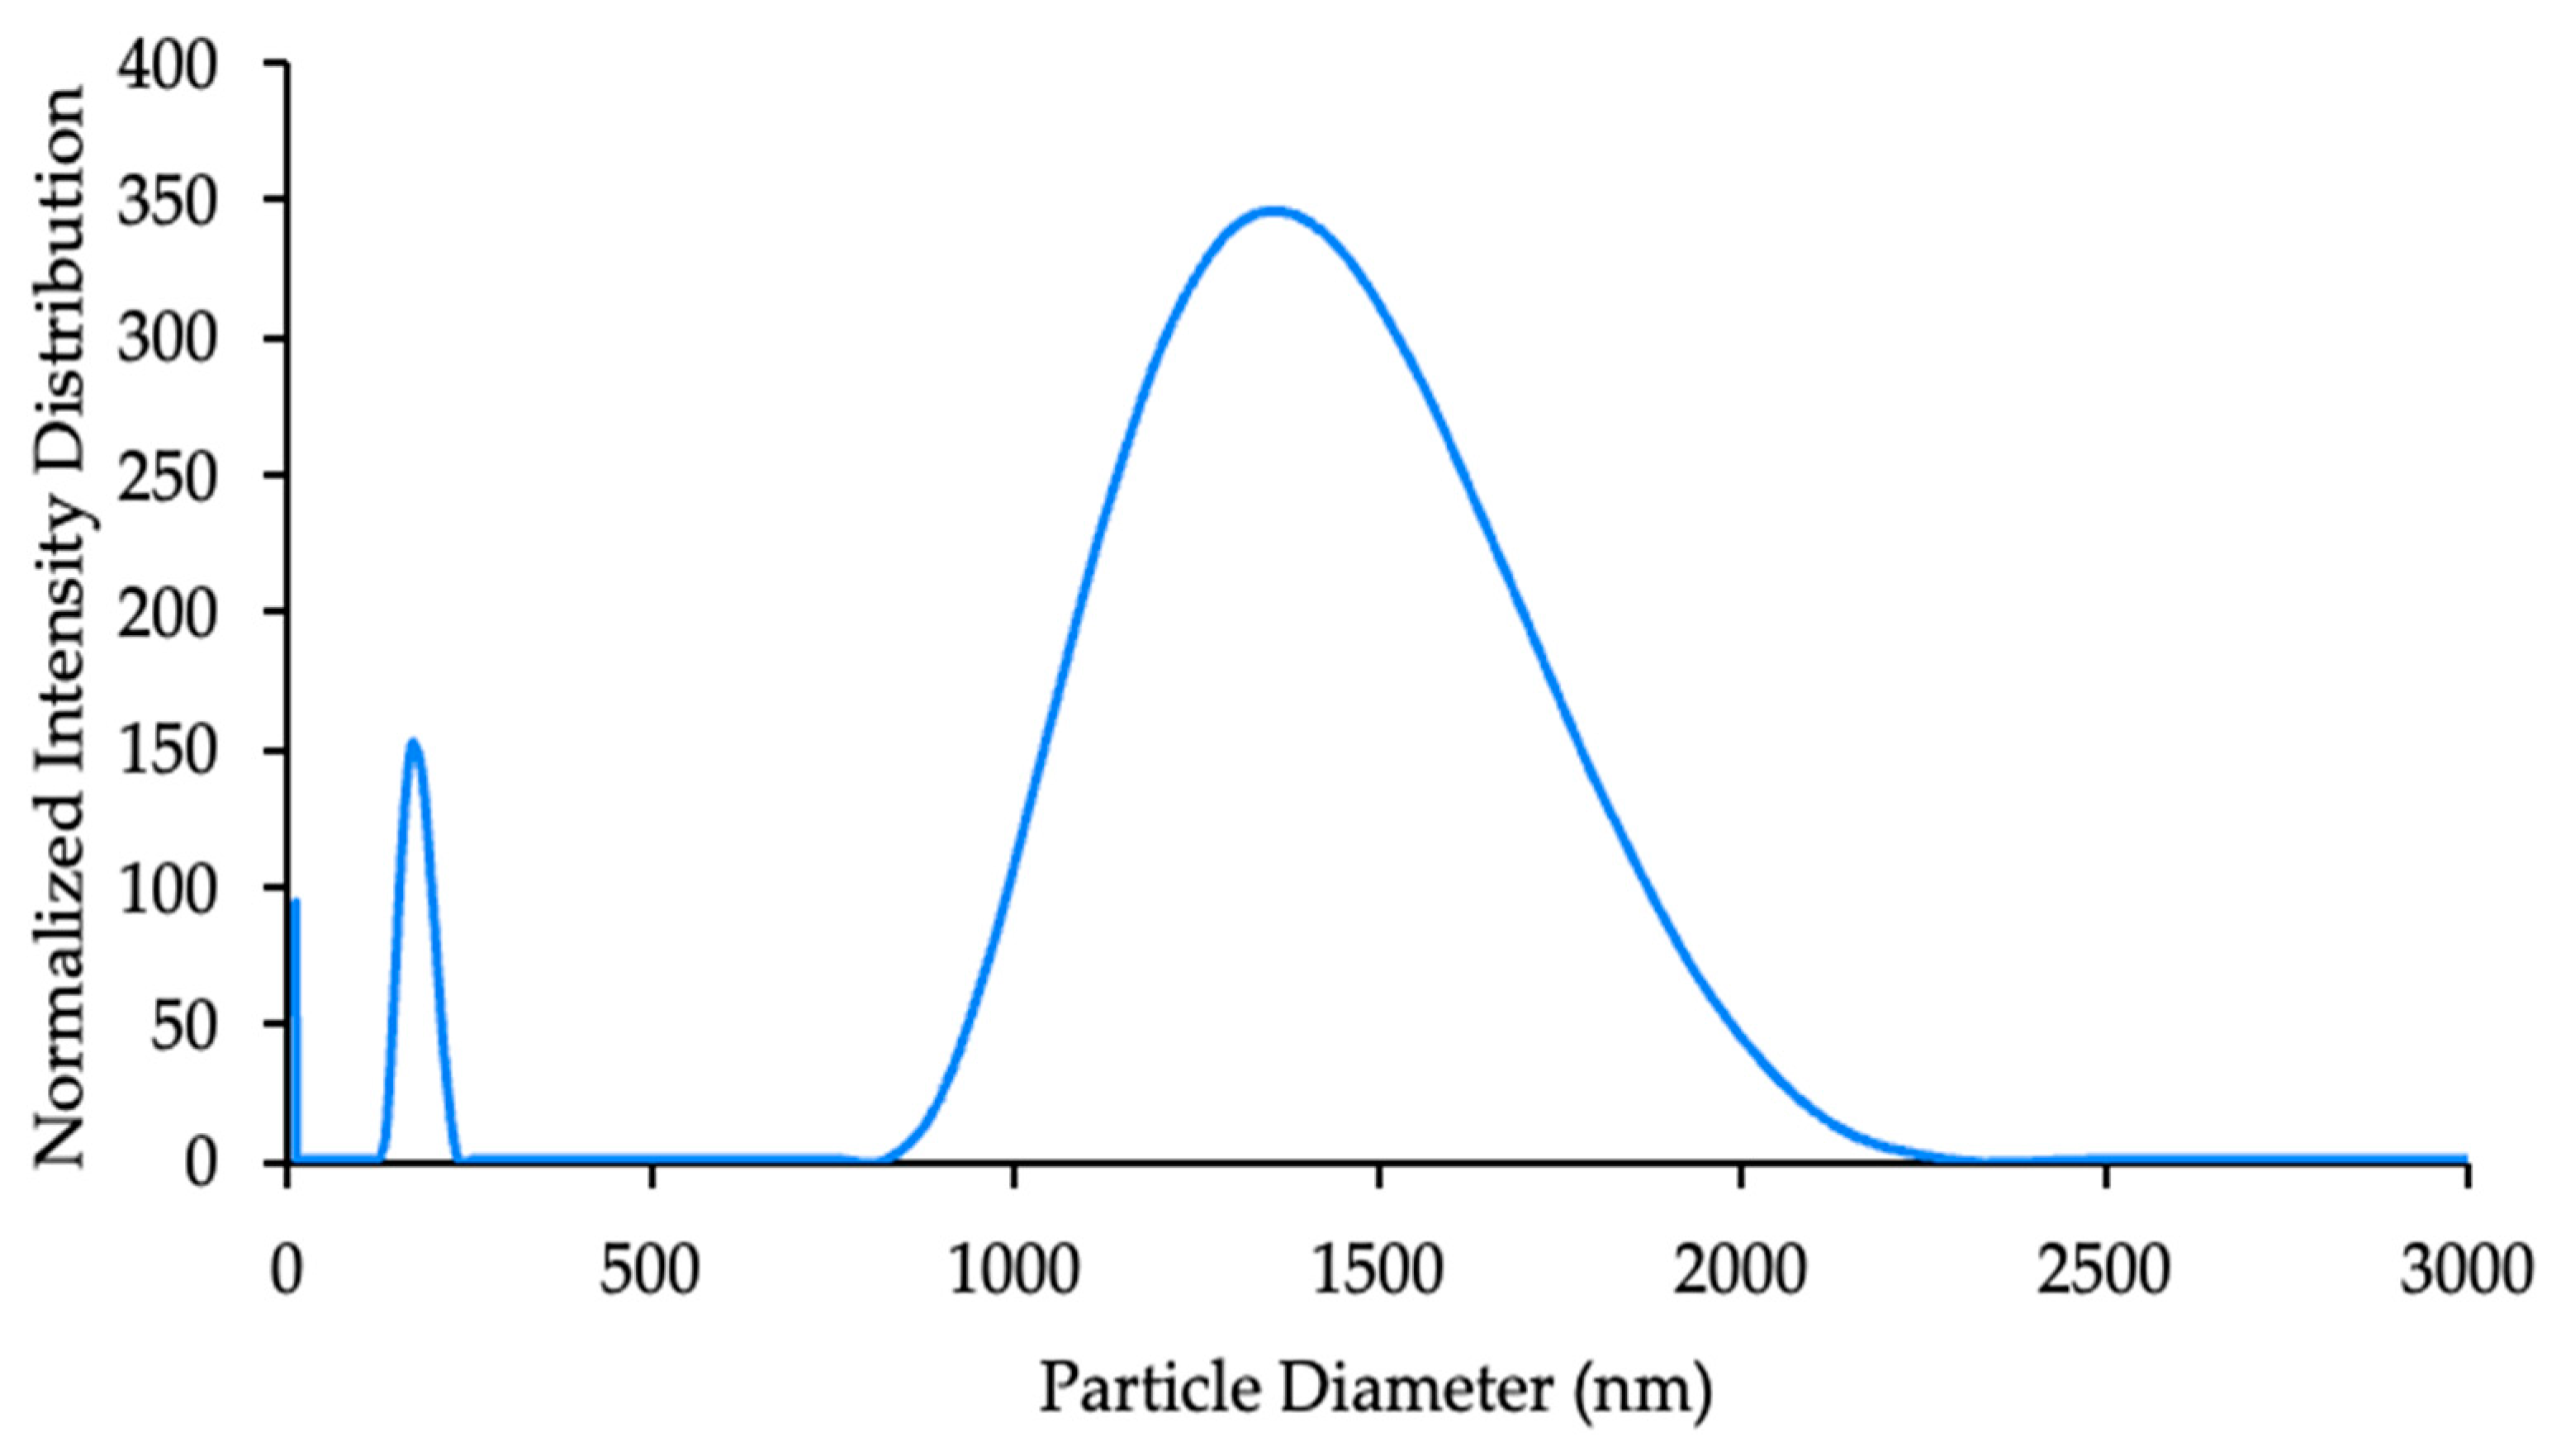
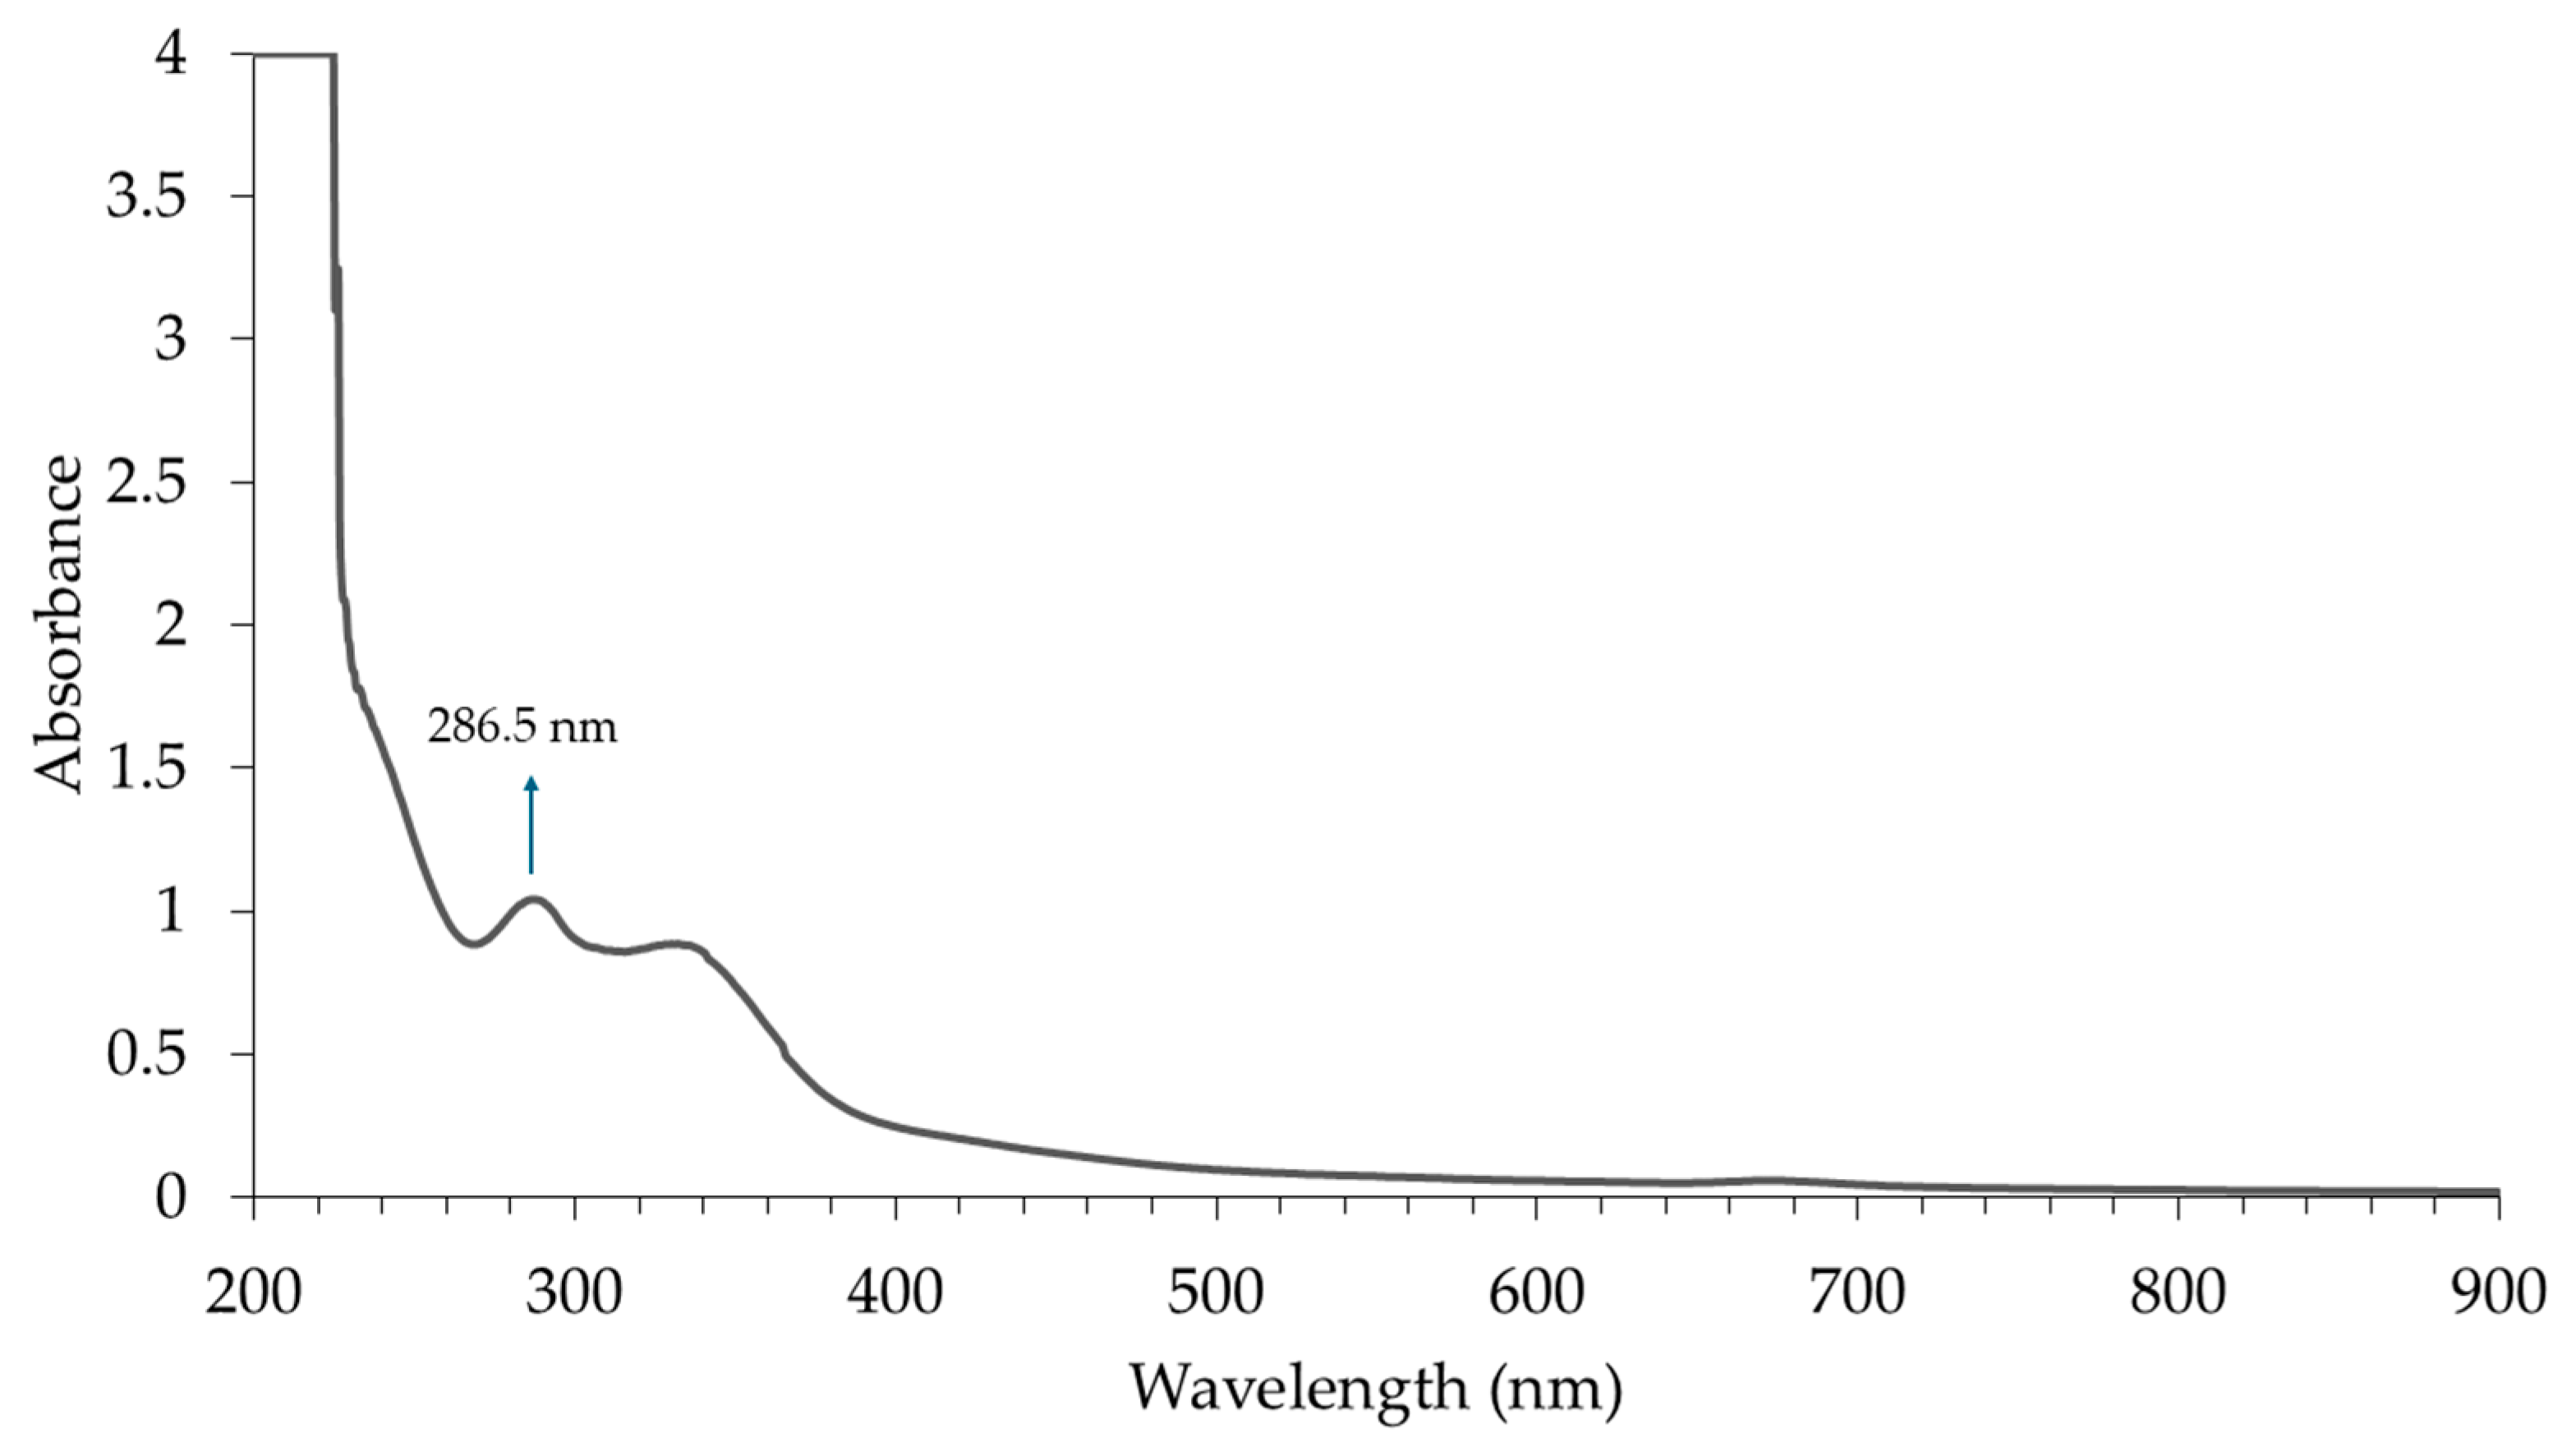
3.3. Characterization of CNPs

Figure 2 shows the particle size of the synthesized CNPs using DLS. The results revealed a polydisperse population with varying particle sizes. The average particle diameter of the CNP samples was reported to be 908.9 ± 93.6 nm, with a polydispersity index (PI) of 0.455 ± 0.008. Additionally, peaks at 11.11 ± 0.97 nm, 164.45 ± 6.13 nm, and 1672.04 ± 338.75 nm were observed from the graph. The cumulative distribution diameters of 10%, 50%, and 90% provide further insights into the size distribution, showing that 10% of the particles had a diameter below 149.8 ± 5.2 nm, 50% had a diameter below 1425.4 ± 215.2 nm, and 90% had a diameter below 2651.4 ± 915.7 nm.
Figure 3 shows the scanning electron micrograph of the synthesized B. balsamifera-CNPs. The particles appear to have agglomerates with individual nanoparticles appearing spherical or slightly irregular in shape. Additionally, measured particle sizes range from approximately 56.8 nm to 63.0 nm, confirming that the nanoparticles were indeed formed.
UV-Vis spectroscopy was used to detect and quantify B. balsamifera-CNPs. As shown in Figure 4, an absorption peak for CNPs at 286.5 ± 0.5 nm was observed.

3.4. Optimization of CNPs Synthesis

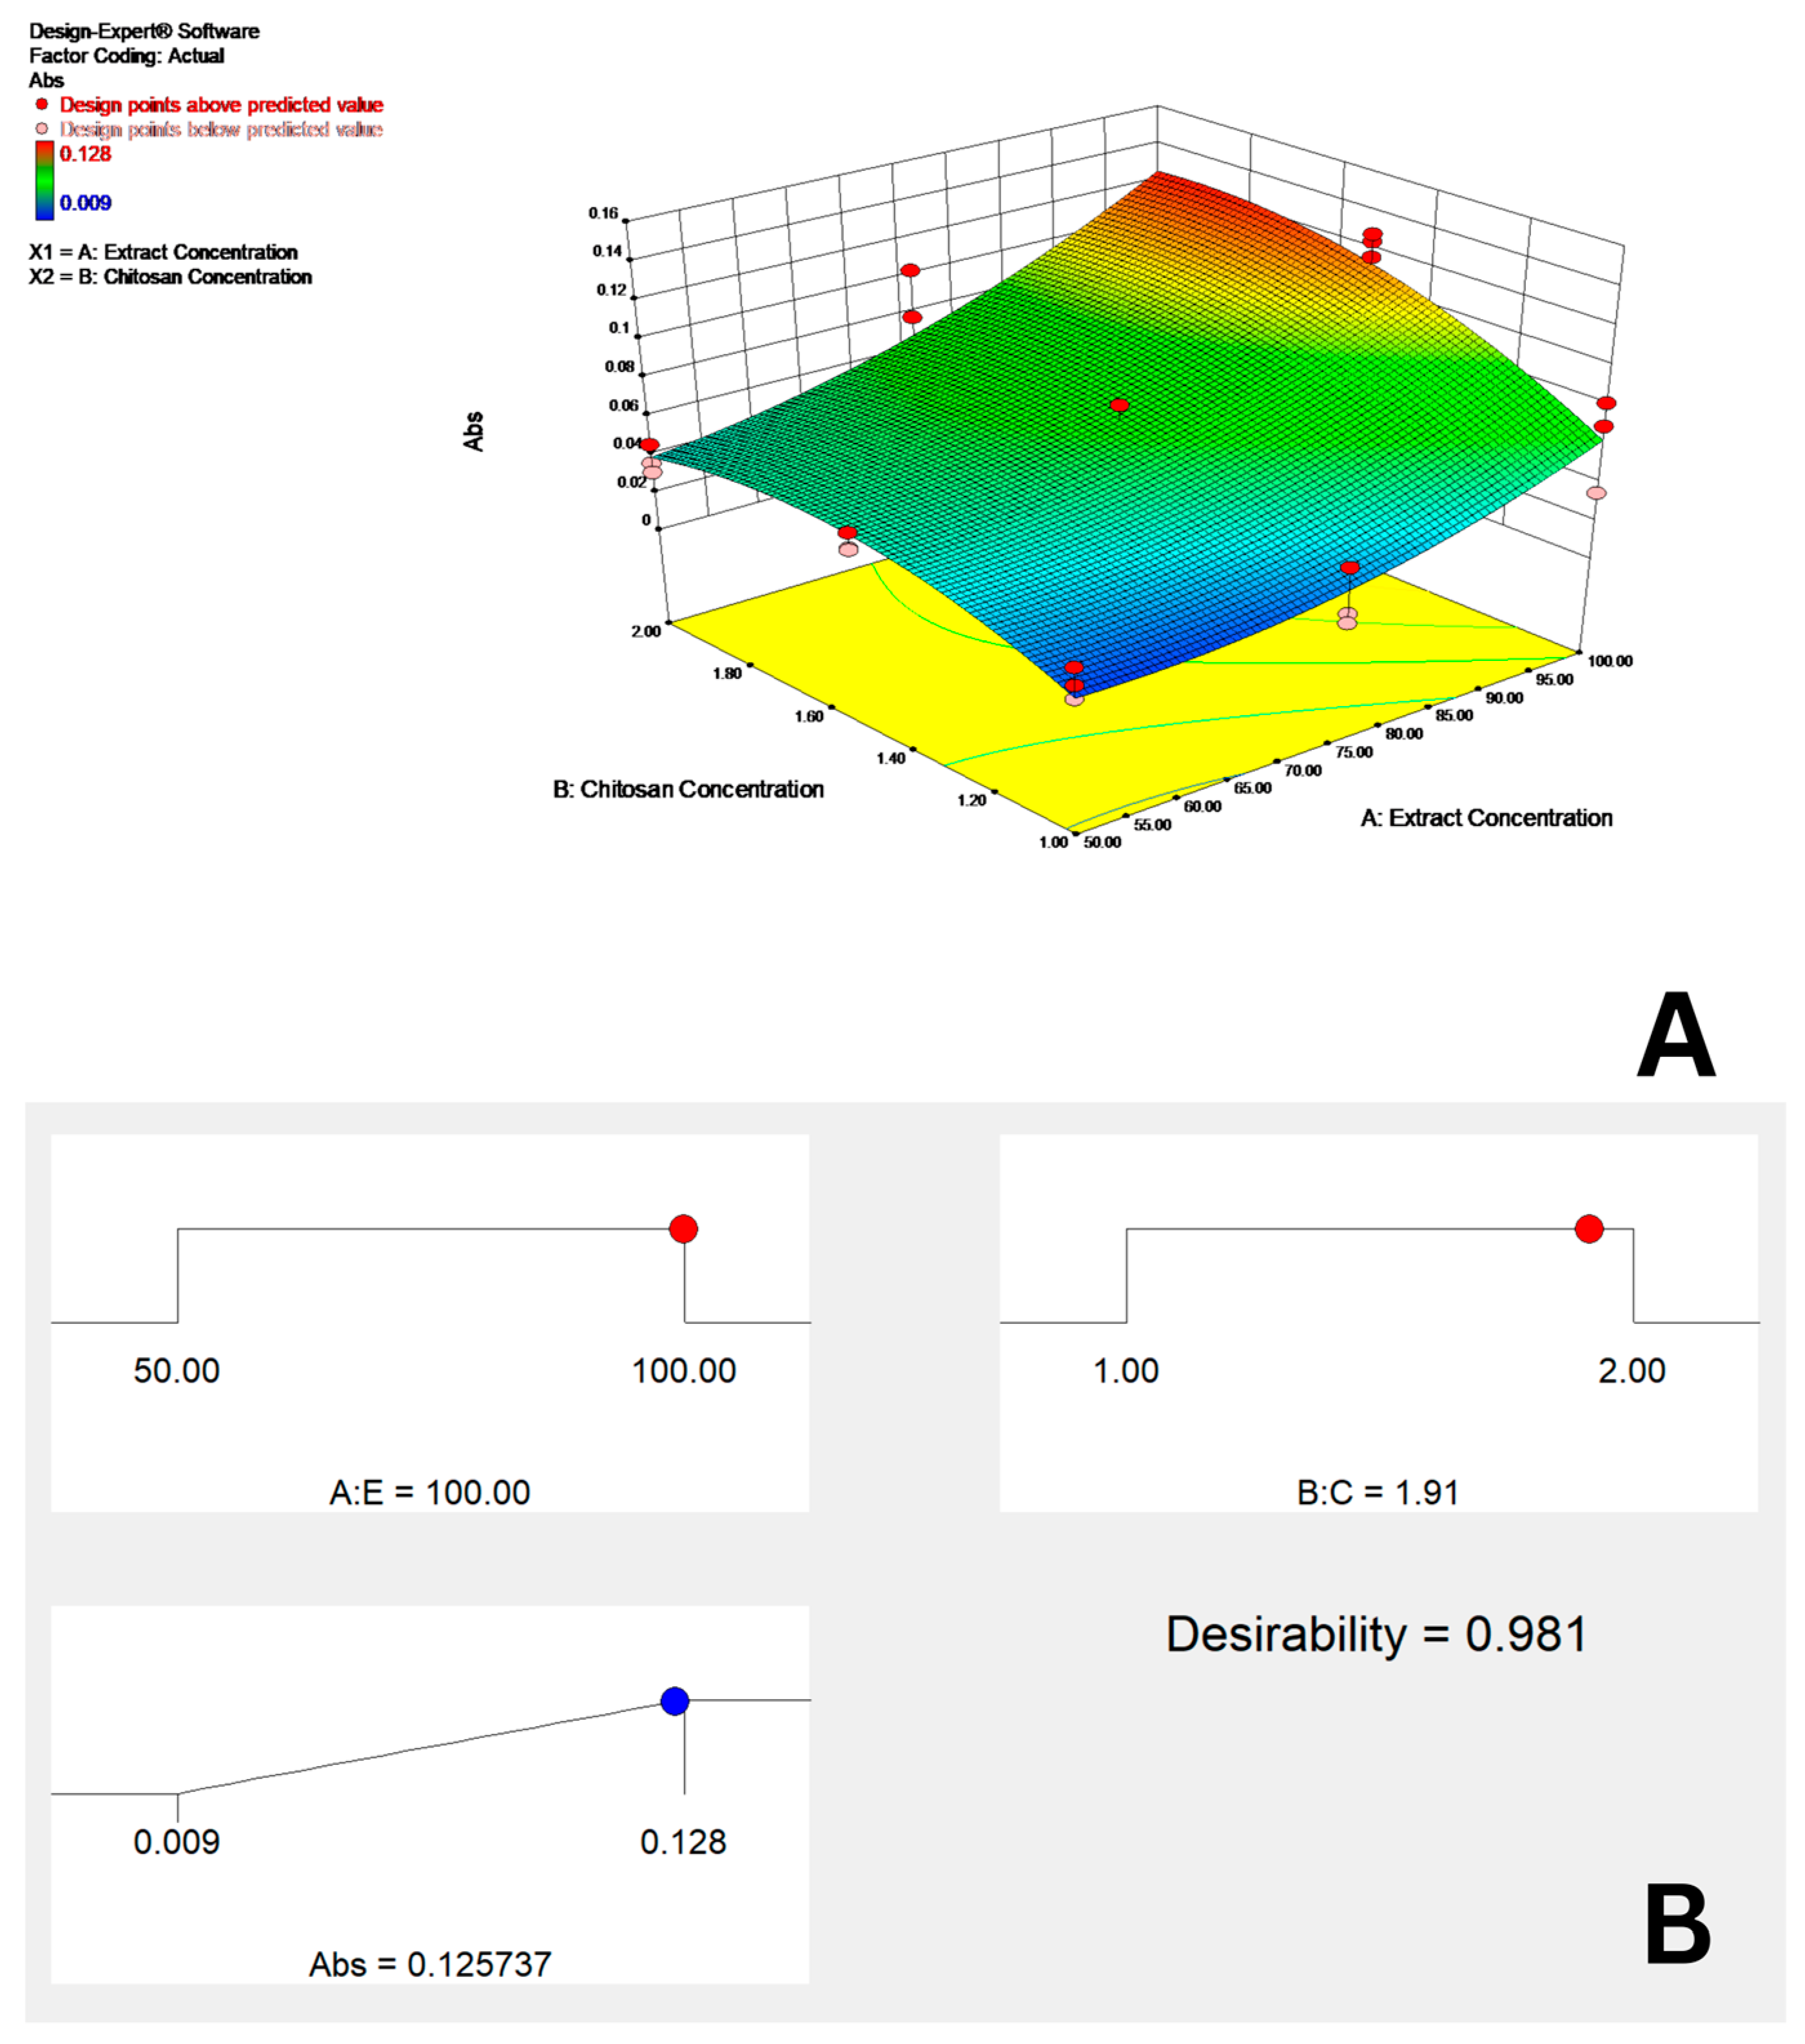
3.4.1. Response Surface Approach for Optimization of CNP Synthesis

To optimize the biosynthesis of CNPs (chitosan-NPs), a total of nine trials were conducted using a factorial design with three levels (−1, 0, 1) for two variables: Leaf Extract Concentration (coded as E) and Initial Chitosan Concentration (coded as C). Each trial was performed in triplicate, and the results are presented in Table 1.
The highest biosynthesis of chitosan nanoparticles was recorded in Run 14, achieving a maximum absorbance of 0.128 under conditions of 100% (v/v) B. balsamifera Leaf Extract Concentration and 1.5% (m/v) Initial Chitosan Concentration. Conversely, the lowest biosynthesis value, with an absorbance of 0.009, occurred in Run 25 under conditions of 75% (v/v) Leaf Extract Concentration and 1% (m/v) Initial Chitosan Concentration.
Experimental runs for the Face-Centered CCD (including triplicates) were generated and randomized using Design-Expert® v.13, as shown in Column 1. Each run featured varying levels of coded factors (−1, 0, 1), corresponding to the minimum, midpoint, and maximum extract and chitosan concentrations, as detailed in columns 2 and 3. The experiments were conducted in the specified order, with each run yielding a response measured as absorbance at 287 nm. The predicted and experimental values for the trials are summarized in Table 1. Following optimization using the Face-Centered Central Composite Design (FCCD), an absorbance of 0.126 was achieved, which is slightly lower than the experimentally observed maximum absorbance of 0.128.

3.4.2. Multiple Regression Analysis

Sequential Model Sum of Squares analysis was performed to determine the most appropriate mathematical model for the obtained experimental data. Table 2 summarizes the obtained p-values for each model.
To further evaluate the suitability of the models, a lack of fit test was conducted to assess the statistical significance of each model. Table 3 summarizes the obtained lack-of-fit p-values for each model.
A summary of model statistics was also provided, including the Predicted Residual Error Sum of Squares (PRESS) and R-squared values for each model, as shown in Table 4.

3.4.3. Impact of Variable Levels (Analysis of Variance)

Analysis of Variance (ANOVA) was performed to determine the statistical significance of each term from the best model. Table 5 shows the summary of the ANOVA.
Based on this analysis, Equation (2) best describes the experimental data.
A b s o r b a n c e = 0.066 + 0.33 C + 0.021 E + 0.01 C E + 0.014 C 2 0.019 E 2

3.4.4. Model Validation

The model’s adequacy was further checked to verify the appropriateness of the model. The normal probability plot of the externally studentized residuals (Figure 5A) displays that data points are distributed thoroughly along a straight line. In addition, the depiction of the Box–Cox plot of the power transformation (Figure 5B) shows that the current lambda (λ) value is equal to one. However, the best λ value of 0.85 (green line) was located between the confidence intervals (two red lines).
Similarly, a plot of the externally studentized residuals against the predicted values generated by the model was created (Figure 5C). The scatter plot demonstrates an even distribution of residuals above and below the 0-axis. Additionally, the predicted values were plotted against the experimental values to further assess the model’s accuracy and reliability (Figure 5D).
To further validate the generated model from ANOVA, 3D-surface plots with two independent factors, chitosan concentration and extract concentration as the X and Y axis, were used, with the Z axis being the measured absorbance of the CNP biosynthesis (Figure 6).
Equation (2), which was generated from statistical analyses, was used to determine the optimal conditions for CNP biosynthesis through analytical methods. The highest theoretical value of CNP biosynthesis was calculated to be an absorbance of 0.126, which occurs at a B. balsamifera concentration of 0.05 g/mL and a chitosan concentration of 19.1 mg/mL. These optimum points of the tested levels recorded a satisfactory desirability value of 0.981.

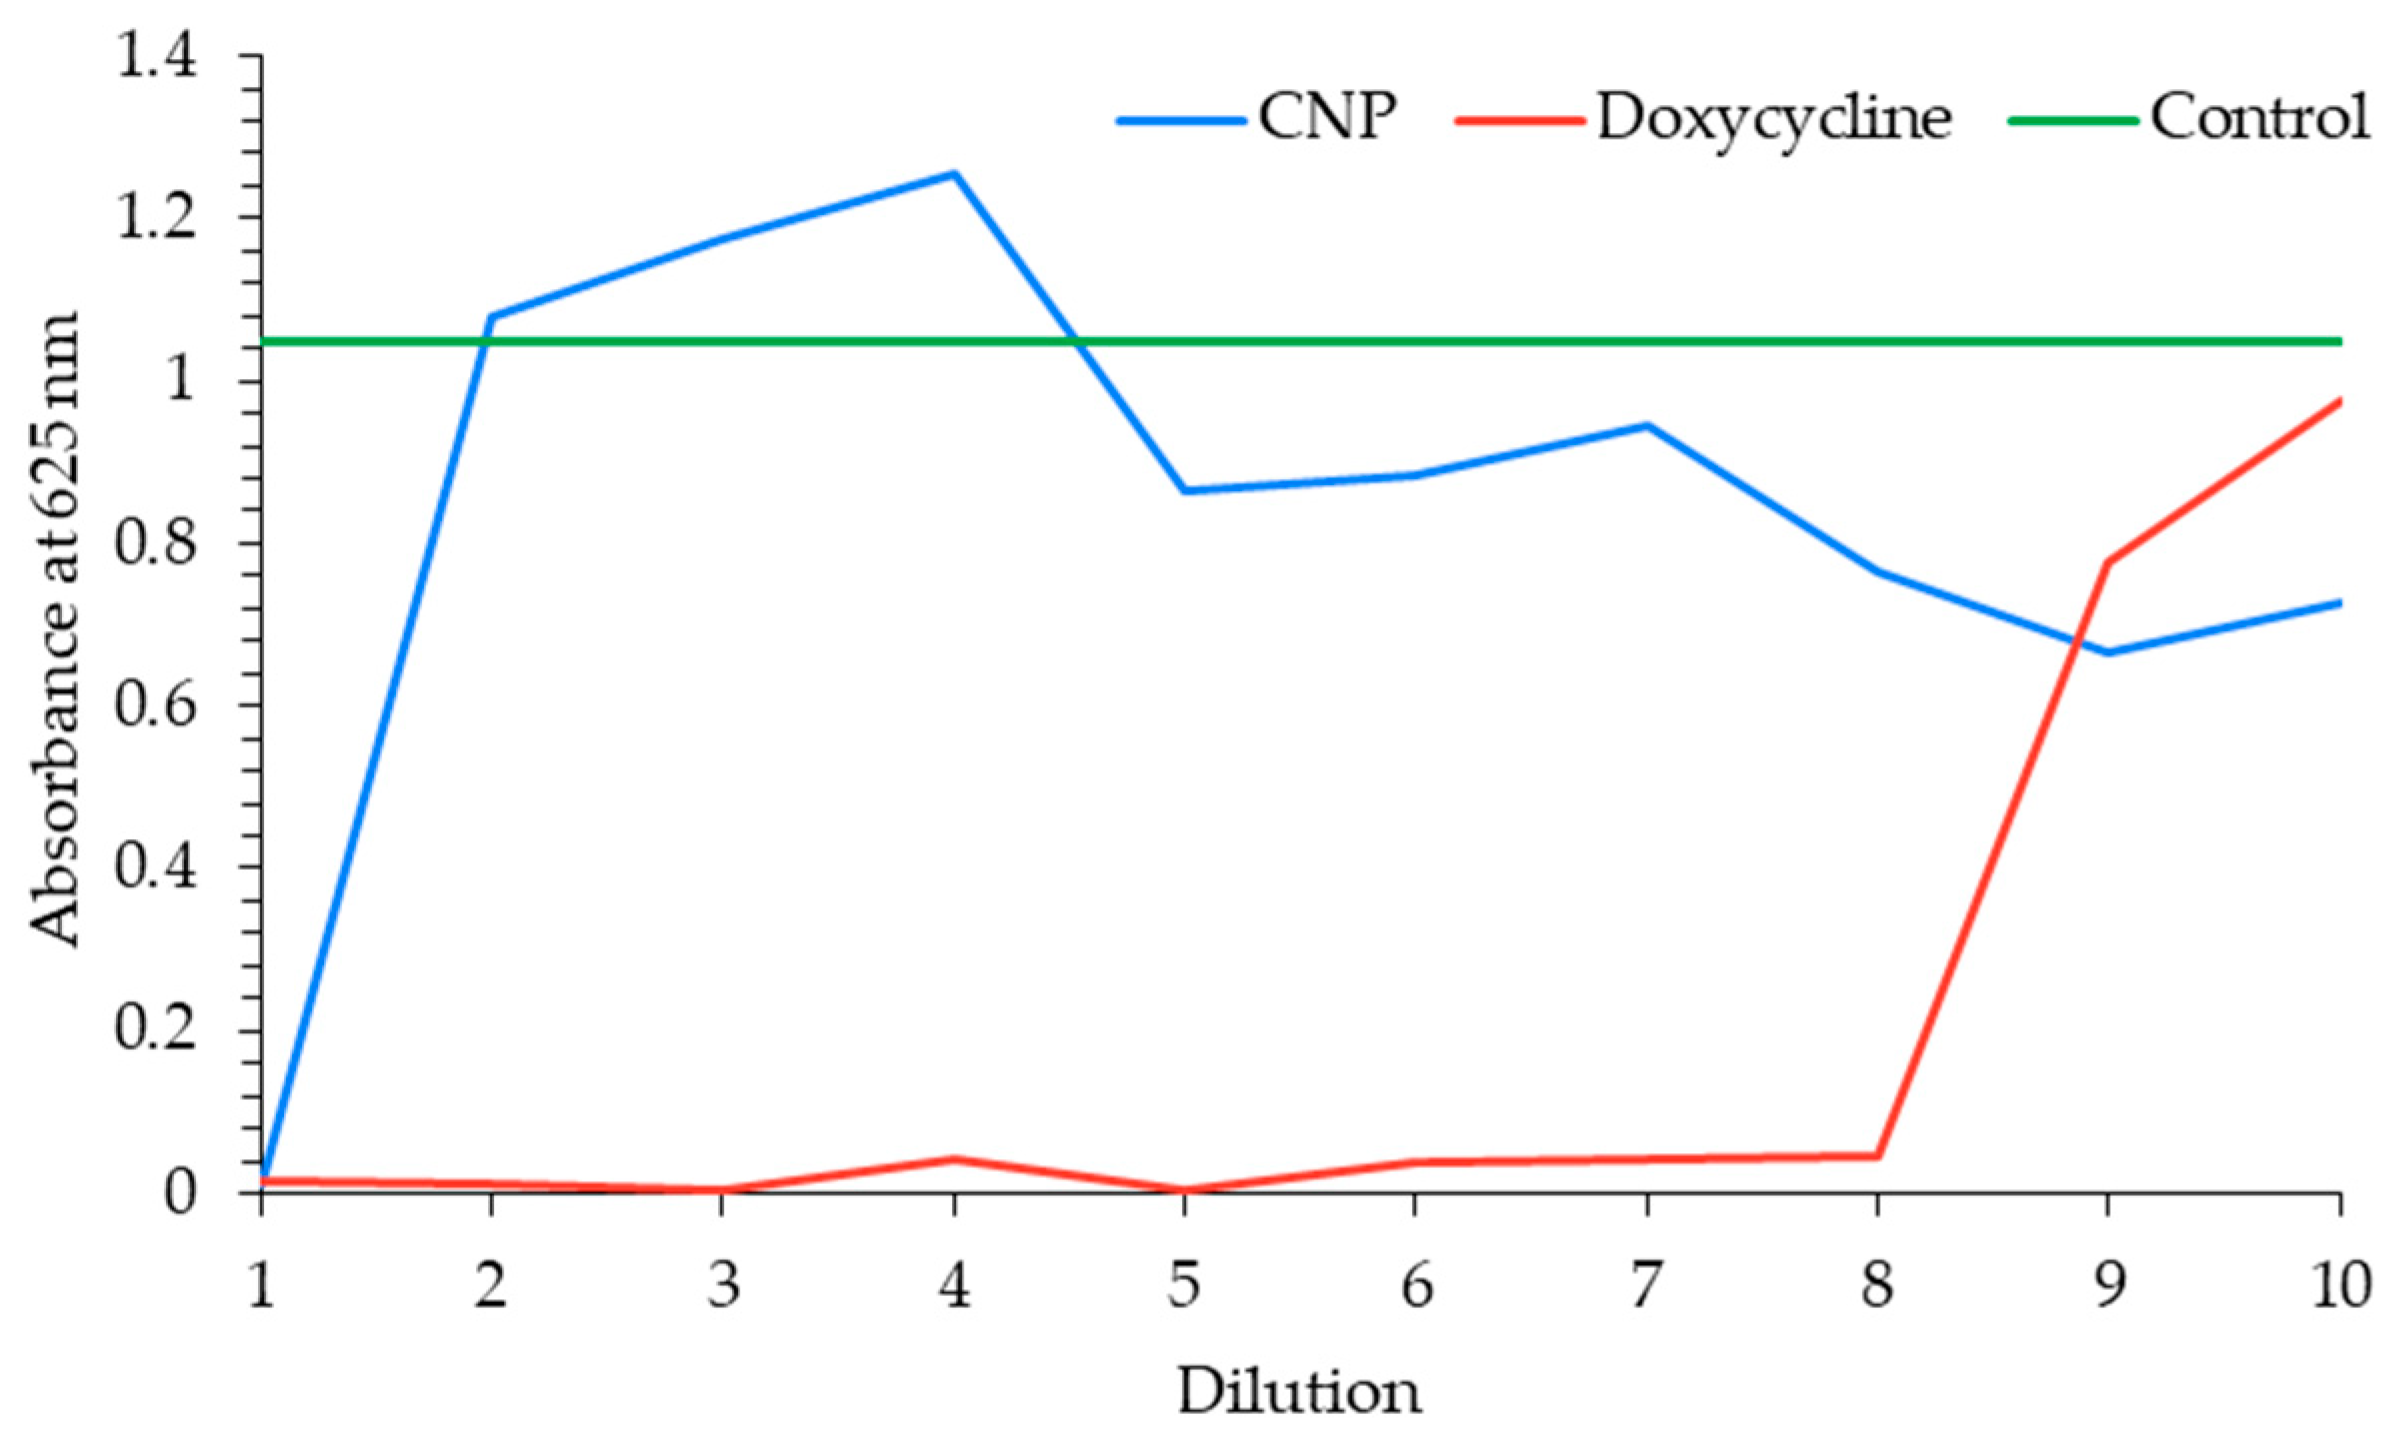
3.5. Antibacterial Activity of B. balsamifera CNPs Against E. coli

The initial concentration of the B. balsamifera-CNPs was 25 μg/mL, which was serially diluted to determine the minimum inhibitory concentration (MIC). Figure 7 shows that the MIC of B. balsamifera CNPs is at the first dilution, or 25 μg/mL. The positive control, using Doxycycline, shows the MIC at the eighth dilution, corresponding to a concentration of 0.781 μg/mL.

4. Discussion

4.1. B. balsamifera Extract

The total phenolic content obtained is comparable with the results reported using 95% ethanol [14] with a TPC value of 17.02 mg GAE/g B. balsamifera. This high phenolic content [15] is indicative of the viability of the B. balsamifera extract sample for CNP synthesis.

4.2. Green Synthesis of Chitosan Nanoparticles (CNPs)

Chitosan, which is abundant in functional amino and hydroxyl groups [16], undergoes a complexation reaction with the polyphenols found in plant extracts. Under acidic conditions, these functional groups in chitosan are oxidized, leading to the replacement of hydrogen (H) atoms by phenolic groups from polyphenols [17]. Maintaining the solution at a lower pH keeps chitosan soluble in water, ensuring the chitosan remains dissolved and the mixture remains stable [18]. This stability is evident in the colloidal mixture resulting from the interaction between the polyphenols in B. balsamifera extract and chitosan, confirming the presence of particles.

4.3. Characterization of CNPs

DLS results indicate that B. balsamifera CNPs have a polydisperse population, revealing a broad size distribution and suggesting a heterogeneous population of nanoparticles with lower uniformity. Peaks at 11.11 ± 0.97 nm and 164.45 ± 6.13 nm indicate the presence of nanoparticles. SEM results confirmed the presence of nanoparticles with agglomerates, which explains the polydispersity of the CNPs. Agglomeration is a common phenomenon in nanoparticle synthesis driven by interparticle forces [19]. These forces tend to draw nanoparticles together, leading to the formation of clusters or aggregation, which can affect the properties of the nanoparticles, including the surface area, dispersibility, and reactivity [20].
Further affirming the presence of synthesized B. balsamifera CNPs, UV-vis spectroscopy reported an absorption peak aligning with the 285 nm peak reported in the spectrum of CNPs biosynthesized using Lavendula angustifolia leaves extract [21]. This also supports the range (200–322 nm) reported for UV–visible spectrum of CNPs due to the presence of the CO group, attributed to the findings of Duraisamy et al. [22].
Previous studies have demonstrated the synthesis of nanoparticles using B. balsamifera. Aryasa and Artini successfully synthesized silver nanoparticles from a decoction of B. balsamifera leaves, resulting in particles measuring 40.5 nm and 59.6 nm when using 1 mM and 2 mM AgNO3 solutions, respectively [9]. Similarly, Ginting et al. synthesized copper nanoparticles ranging from 30 to 55 nm using B. balsamifera leaf extract as a bioreductant. They attribute this nanoparticle synthesis to the presence of phytochemicals in the extract [8]. Although the mechanisms of metal reduction and polymerization differ, this demonstrates the adaptability of phytochemicals in nanoparticle synthesis.

4.4. Optimization of CNPs Synthesis

4.4.1. Multiple Regression Analysis

In the Sequential Model Sum of Squares analysis from Table 2, the quadratic model exhibited a significant p-value (0.0041), indicating that the inclusion of quadratic terms significantly improved the model’s fit compared to the previous lower-order models. Higher-order models, such as the cubic model, showed a p-value of 0.0715, which, while close to being significant, was aliased, suggesting potential issues like multicollinearity or redundancy in the model terms. This lack of clarity in the cubic model undermined its reliability.
Additionally, the Lack of Fit Tests from Table 3 further supported the quadratic model. While the linear and 2FI models displayed significant lack-of-fit p-values (0.0034 and 0.0061, respectively), the quadratic model had an insignificant lack-of-fit p-value (0.1167), suggesting that it adequately captured the variability in the data without overfitting. An insignificant lack-of-fit indicates that the model aligns well with the observed data, which is desirable in regression analysis.
The Model Summary Statistics from Table 4 also favored the quadratic model, as it achieved the highest Adjusted R-Squared (0.8379) and Predicted R-Squared (0.7842) values among all tested models. These metrics indicate that the quadratic model explained a substantial proportion of the variance in the response variable and demonstrated strong predictive performance on unseen data. Moreover, the quadratic model had the lowest PRESS (Prediction Error Sum of Squares) value (7.87 × 10⁻³), further affirming its robust predictive accuracy.
Taken together, the statistical evidence demonstrates that the quadratic model strikes the right balance between complexity and performance, making it the most appropriate choice for the data.

4.4.2. Impact of Variable Levels (Analysis of Variance)

The Analysis of Variance (ANOVA) results from Table 5 reveal the significant impact of the variables on the quadratic model for predicting absorbance. The model itself is highly robust, with a notable F-value of 27.88 and a p-value of less than 0.0001, underscoring its ability to explain the variation in absorbance beyond random noise. Among the variables, extract concentration (E) emerges as the most influential, with a strong positive effect on absorbance. This significance is reflected in its high F-value and low p-value, indicating that increasing extract concentration directly enhances the response. Similarly, chitosan concentration (C) is also important, positively influencing absorbance with a high degree of statistical significance. The interaction between extract and chitosan concentrations is also noteworthy, demonstrating that their combined effects create a positive impact on absorbance beyond their individual contributions.
The quadratic terms for both extract and chitosan concentrations further highlight the nuanced relationships in the model. The squared term for extract concentration has a significant positive contribution, suggesting a nonlinear upward trend in absorbance as the variable increases. Conversely, the squared term for chitosan concentration has a significant negative coefficient, indicating a diminishing return or saturation effect at higher levels.

4.4.3. Model Validation

The distribution of data points along the straight line in Figure 5A indicates normal distribution with slight deviations at the tails and one notable outlier at the upper end. This normal distribution represents the variability in the response on top of the variability explained by the model. The Box–Cox Analysis from Figure 5B also suggests that the obtained residuals follow a normal distribution. Even though an optimal lambda of 0.85 was suggested in order to transform the residuals into a more normal distribution, the current lambda of 1 (which refers to no data transformation) still falls within the 95% confidence interval for estimating the lambda for data transformation.
The plot of the externally studentized residuals (Figure 5C) displays that data points are distributed thoroughly along the horizontal straight line indicating a desirable pattern that supports the suitability of the FCCD model as it is not skewed to overestimate or underestimate the observed data. This observation aligns with the plot of predicted vs. actual values as shown in Figure 5D, where the data points are situated around the straight line, further demonstrating sufficient agreement between the actual and predicted values.
Figure 6 underscores that increases in chitosan and extract concentration have a positive relationship with absorbance, resulting in a maximum biosynthesis of CNP at higher concentrations of both extract and chitosan in the higher extremes of the independent variables. The actual highest laboratory value of the green synthesis of CNP using B. balsamifera extract (0.128) was found to be comparable to that of the absorbance of the highest theoretical value of CNP biosynthesis calculated (0.126), thus verifying a high degree of model precision and accuracy as well as confirming the validation of the model.

4.5. Antibacterial Activity of B. balsamifera -CNPs Against E. coli

The experimentally determined MIC of 25 μg/mL for B. balsamifera CNPs is comparable with the reported MIC of CNPs synthesized by ionotropic gelation with an alginate core at 78.1 μg/mL [23]. Although various synthesis methods have been employed for CNPs, direct comparisons of antibacterial activity are constrained due to the use of different target organisms across studies. A key limitation of this study is that the MIC was determined exclusively against E. coli. Nonetheless, in comparison to other studies and their respective target microbes, B. balsamifera-CNPs demonstrated the lowest MIC.
El-naggar et al. investigated CNP synthesis using extracts from Eucalyptus globulus Labill, Pelargonium graveolens, Lavandula angustifolia, Olea europaea, and Cymbopogon citratus. E. globulus Labill CNPs inhibited A. baumanii at 12.5 mg/mL with a 12 mm zone of inhibition [12]. P. graveolens CNPs reduced phytopathogenic Botrytis cinerea infection to 3% at a concentration of 25 mg/mL [13]. At a concentration of 1500 μg/mL, L. angustifolia CNPs suppressed P. aeruginosa, S. aureus, and C. albicans biofilm formation by 91.83 ± 1.71%, 55.47 ± 2.12% and 66.4 ± 1.76%, respectively [21]. Meanwhile, O. europaea CNPs suppressed P. aeruginosa, and S. aureus biofilm formation by 75.96  ±  1.6 and 35.81  ±  1.19%, respectively [24]. Finally, 20 mg/mL of C. citratus CNPs inhibited Fusarium culmorum growth by 100% [25].
Phytochemical compounds in B. balsamifera extract have been widely recognized for their antibacterial properties. The reported MICs in the literature are >10 mg/mL against E. coli, K. pneumoniae, A. baumanii, P. aeruginosa, and E. cloacae [26]. This relatively high MIC supports the conclusion that the antibacterial activity of B. balsamifera-CNPs is primarily due to the CNPs rather than the extract itself. While the mechanisms for this antibacterial activity remain to be confirmed, potential modes of action include membrane disruption through interactions with the bacterial cell wall leading to membrane destabilization, and the generation of reactive oxygen species (ROS) leading to oxidative stress.

5. Conclusions

CNPs were successfully synthesized using Blumea balsamifera leaf extract. DLS analysis shows that the synthesized CNPs exhibited a broad size distribution due to nanoparticle agglomeration. SEM results further support these observations, with spherical nanoparticles and aggregates being observed, ranging from 56.8 nm to 63.0 nm. Optimization of CNP synthesis was achieved using a factorial design with three levels (−1, 0, 1) for two variables using the obtained UV-Vis Peak for detecting and quantifying B. balsamifera-CNPs. Results indicate that higher extract and chitosan concentrations positively influenced nanoparticle yield of 100 μg/mL, with a maximum absorbance of 0.126 observed for 0.05 g/mL plant extract concentration and 19.1 mg/mL chitosan concentration. The MIC of B. balsamifera-CNPs against E. coli was found to be 25 μg/mL, comparable to and slightly better than other CNPs. There is potential to improve CNP yield through further optimization of factors like temperature, mixing speed, and solvent ratios, leading to higher yields while ensuring a more cost-effective and environmentally friendly process.

Author Contributions

Conceptualization, J.C.H.P., F.J.C.P., J.S.R.S., T.A.M.M.E. and C.M.M.; methodology, J.D.A.V., J.S.R.S. and T.A.M.M.E.; software, F.J.C.P.; validation, J.C.H.P., F.J.C.P. and J.D.A.V.; formal analysis, J.D.A.V.; investigation, J.C.H.P.; resources, F.J.C.P. and C.M.M.; data curation, J.D.A.V.; writing—original draft preparation, J.C.H.P.; writing—review and editing, F.J.C.P. and C.M.M.; visualization, J.C.H.P.; supervision, C.M.M.; project administration, C.M.M.; funding acquisition, J.D.A.V. and C.M.M. All authors have read and agreed to the published version of the manuscript.

Funding

This research was funded by The Department of Science and Technology.

Data Availability Statement

The raw data supporting the conclusions of this article will be made available by the authors on request.

Acknowledgments

The materials for the experiment were provided by the Biochemical Engineering Laboratory. Verification of the B. balsamifera plant was performed by the Institute of Biology. The DLS result was provided by the Department of Mining, Metallurgical, and Materials Engineering. The UV-vis results were provided by the Analytical Services Laboratory from the Institute of Chemistry. All of these are within the campus of University of Philippines Diliman.

Conflicts of Interest

The authors declare no conflicts of interest.

Abbreviations

The following abbreviations are used in this manuscript:
TPCTotal Phenolic Content
SEMScanning Electron Microscopy
UV-visUltraviolet-visible Spectroscopy
CNPChitosan Nanoparticles
DLSDynamic Light Scattering
FCCCDFace-Centered Central Composite Design
MICMinimum Inhibitory Concentration
SRMSurface Response Methodology

References

  1. Jha, R.; Mayanovic, R.A. A Review of the Preparation, Characterization, and Applications of Chitosan Nanoparticles in Nanomedicine. Nanomaterials 2023, 13, 1302. [Google Scholar] [CrossRef]
  2. Rahman, A.; Kafi, A.; Beak, G.; Saha, S.K.; Roy, K.J.; Habib, A.; Faruqe, T.; Siddique, M.P.; Islam, S.; Hossain, K.S.; et al. Green Synthesized Chitosan Nanoparticles for Controlling Multidrug-Resistant mecA- and blaZ-Positive Staphylococcus aureus and aadA1-Positive Escherichia coli. Int. J. Mol. Sci. 2024, 25, 4746. [Google Scholar] [CrossRef]
  3. Yanat, M.; Schroën, K. Preparation methods and applications of chitosan nanoparticles; with an outlook toward reinforcement of biodegradable packaging. React. Funct. Polym. 2021, 161, 104849. [Google Scholar] [CrossRef]
  4. Gonçalves, I.C.; Henriques, P.C.; Seabra, C.L.; Martins, M.C.L. The potential utility of chitosan micro/nanoparticles in the treatment of gastric infection. Expert Rev. Anti-infective Ther. 2014, 12, 981–992. [Google Scholar] [CrossRef]
  5. Widhiantara, I.G.; Jawi, I.M. Phytochemical composition and health properties of Sembung plant (Blumea balsamifera): A review. Veter- World 2021, 14, 1185–1196. [Google Scholar] [CrossRef]
  6. Ma, C.; Liu, B.; Du, L.; Liu, W.; Zhu, Y.; Chen, T.; Wang, Z.; Chen, H.; Pang, Y. Green Preparation and Antibacterial Activity Evaluation of AgNPs-Blumea balsamifera Oil Nanoemulsion. Molecules 2024, 29, 2009. [Google Scholar] [CrossRef]
  7. Liu, G.; Wang, J.; Zheng, W.; Han, L.; Huang, J.; He, Z.; Kang, J. Nanoemulsion of the Essential Oil from Blumea balsamifera (L.) DC. and Its Effect on Trauma Repair. J. Oleo Sci. 2023, 72, 869–879. [Google Scholar] [CrossRef]
  8. Ginting, B.; Maulana, I.; Karnila, I. Biosynthesis Copper Nanoparticles using Blumea balsamifera Leaf Extracts: Characterization of its Antioxidant and Cytotoxicity Activities. Surfaces Interfaces 2020, 21, 100799. [Google Scholar] [CrossRef]
  9. Aryasa, I.W.T.; Artini, N.P.R. Green Synthesis Silver Nanoparticles Using Sembung (Blumea balsamifera) Leaf Extract as an Antibacterial and Antioxidant. J. Penelit. Pendidik. IPA 2023, 9, 11877–11886. [Google Scholar] [CrossRef]
  10. Mohamed, R.M.; Ali, M.R.; Smuda, S.S.; Abedelmaksoud, T.G. Utilization of sugarcane bagasse aqueous extract as a natural preservative to extend the shelf life of refrigerated fresh meat. Braz. J. Food Technol. 2021, 24, e2020167. [Google Scholar] [CrossRef]
  11. Burapan, S.; Kim, M.; Paisooksantivatana, Y.; Eser, B.E.; Han, J. Thai Curcuma Species: Antioxidant and Bioactive Compounds. Foods 2020, 9, 1219. [Google Scholar] [CrossRef] [PubMed]
  12. El-Naggar, N.E.-A.; Shiha, A.M.; Mahrous, H.; Mohammed, A.B.A. Green synthesis of chitosan nanoparticles, optimization, characterization and antibacterial efficacy against multi drug resistant biofilm-forming Acinetobacter baumannii. Sci. Rep. 2022, 12, 1–19. [Google Scholar] [CrossRef]
  13. El-Naggar, N.E.-A.; Saber, W.I.A.; Zweil, A.M.; Bashir, S.I. An innovative green synthesis approach of chitosan nanoparticles and their inhibitory activity against phytopathogenic Botrytis cinerea on strawberry leaves. Sci. Rep. 2022, 12, 3515. [Google Scholar] [CrossRef] [PubMed]
  14. Jirakitticharoen, S.; Wisuitiprot, W.; Jitareerat, P.; Wongs-Aree, C. Phenolics, Antioxidant and Antibacterial Activities of Immature and Mature Blumea balsamifera Leaf Extracts Eluted with Different Solvents. J. Trop. Med. 2022, 2022, 7794227. [Google Scholar] [CrossRef] [PubMed]
  15. Khoddami, A.; Wilkes, M.A.; Roberts, T.H. Techniques for Analysis of Plant Phenolic Compounds. Molecules 2013, 18, 2328–2375. [Google Scholar] [CrossRef]
  16. Prabaharan, M. Review Paper: Chitosan Derivatives as Promising Materials for Controlled Drug Delivery. J. Biomater. Appl. 2008, 23, 5–36. [Google Scholar] [CrossRef]
  17. Popa, M.-I.; Aelenei, N.; Popa, V.I.; Andrei, D. Study of the interactions between polyphenolic compounds and chitosan. React. Funct. Polym. 2000, 45, 35–43. [Google Scholar] [CrossRef]
  18. Kim, H.-S.; Lee, S.-H.; Eun, C.-J.; Yoo, J.; Seo, Y.-S. Dispersion of chitosan nanoparticles stable over a wide pH range by adsorption of polyglycerol monostearate. Nanomater. Nanotechnol. 2020, 10, 184798042091726. [Google Scholar] [CrossRef]
  19. Shrestha, S.; Wang, B.; Dutta, P. Nanoparticle processing: Understanding and controlling aggregation. Adv. Colloid Interface Sci. 2020, 279, 102162. [Google Scholar] [CrossRef]
  20. Luo, D.; Yan, C.; Wang, T. Interparticle Forces Underlying Nanoparticle Self-Assemblies. Small 2015, 11, 5984–6008. [Google Scholar] [CrossRef]
  21. El-Naggar, N.E.-A.; Eltarahony, M.; Hafez, E.E.; Bashir, S.I. Green fabrication of chitosan nanoparticles using Lavendula angustifolia, optimization, characterization and in-vitro antibiofilm activity. Sci. Rep. 2023, 13, 11127. [Google Scholar] [CrossRef] [PubMed]
  22. Duraisamy, N.; Dhayalan, S.; Shaik, M.R.; Shaik, A.H.; Shaik, J.P.; Shaik, B. Green Synthesis of Chitosan Nanoparticles Using of Martynia annua L. Ethanol Leaf Extract and Their Antibacterial Activity. Crystals 2022, 12, 1550. [Google Scholar] [CrossRef]
  23. El-Shafei, H.A.; Asaad, G.F.; Elkhateeb, Y.A.M.; El-Dakroury, W.A.; Hamed, H.A.; Hassan, A.; Nomier, Y.A. Antimicrobial and Hepatoprotective Effect of Chitosan Nanoparticles: In-vitro and In-vivo Study. J. Pharm. Res. Int. 2021, 33, 244–264. [Google Scholar] [CrossRef]
  24. El-Naggar, N.E.-A.; Dalal, S.R.; Zweil, A.M.; Eltarahony, M. Artificial intelligence-based optimization for chitosan nanoparticles biosynthesis, characterization and in-vitro assessment of its anti-biofilm potentiality. Sci. Rep. 2023, 13, 4401. [Google Scholar] [CrossRef] [PubMed]
  25. El-Naggar, N.E.-A.; Shiha, A.M.; Mahrous, H.; Mohammed, A.B.A. A sustainable green-approach for biofabrication of chitosan nanoparticles, optimization, characterization, its antifungal activity against phytopathogenic Fusarium culmorum and antitumor activity. Sci. Rep. 2024, 14, 11336. [Google Scholar] [CrossRef]
  26. Rasonabe, Z.M.P.; Cruz, J.D.; Tiausas, C.G.; Areza, F. Chemical composition and antimicrobial activity of the extracts and essential oil of Blumea balsamifera from the Philippines. Int. J. Herb. Med. 2023, 11, 6–14. [Google Scholar] [CrossRef]
Figure 1. Synthesized B. balsamifera-chitosan CNP suspension (left) and dried (right).
Processes 13 00804 g001
Figure 2. Size distribution of CNPs through DLS.
Processes 13 00804 g002
Figure 3. B. balsamifera-CNPs view from SEM.
Processes 13 00804 g003
Figure 4. UV-Vis Spectra of CNPs showed a broad peak at 286.5 ± 0.5 nm.
Processes 13 00804 g004
Figure 5. Normal probability plot of residuals (A), Box–Cox plot for power transformation (B), and residual versus predicted (C) and the predicted versus actual (D) values of chitosan nanoparticle biosynthesis using Blumea balsamifera leaf extract.
Processes 13 00804 g005
Figure 6. Three-dimensional surface plot of absorbance as a function of chitosan and extract concentrations. (A) Optimization plot displaying the desirability function at the optimum predicted values (B).
Processes 13 00804 g006
Figure 7. The minimum inhibitory concentration for CNPs and Doxycycline was observed at the first dilution and eighth dilution, respectively.
Processes 13 00804 g007
Table 1. Face-Centered Central Composite design representing chitosan nanoparticle biosynthesis by Blumea balsamifera as influenced Initial Chitosan Concentration (m/v) % and Leaf Extract Concentration (v/v) %.
RunExtract ConcentrationChitosan ConcentrationExperimentalPredictedResidual
75010.0170.018−0.001
155010.0240.0180.006
245010.0330.0180.015
1910010.0820.0630.019
2610010.070.0630.007
810010.0350.063−0.028
105020.0360.041−0.005
55020.0310.041−0.010
215020.0460.0410.005
310020.1160.127−0.011
2310020.1190.127−0.008
1310020.1130.127−0.014
27501.50.0480.0480.000
12501.50.040.048−0.008
2501.50.0390.048−0.009
171001.50.1240.1140.010
91001.50.1160.1140.002
141001.50.1280.1140.014
207510.0140.027−0.013
257510.0090.027−0.018
67510.0380.0270.011
187520.1030.0700.033
17520.0570.070−0.013
167520.0780.0700.008
22751.50.0480.067−0.019
4751.50.0630.067−0.004
11751.50.0740.0670.007
Experimental runs for the Face-Centered CCD were randomized using Design-Expert. Each run had varied coded factors (low, mid, high) and yielded absorbance at 287 nm. A quadratic model (Equation (2)) best described the factors’ effects on the response. Predicted values from Equation (2) were compared with experiments to determine residuals.
Table 2. Sequential Model Sum of Squares [Type I].
Sum of SourceMean SquaresF dfp-Value
Square
ValueProb > F
Mean vs. Total0.1110.11
Linear vs. Mean0.02720.01435.09* <0.0001
2FI vs. Linear1.24 × 10−311.24 × 10−33.540.0725
Quadratic vs. 2FI3.28 × 10−321.64 × 10−37.21* 0.0041Suggested
Cubic vs. Quadratic1.16 × 10−325.79 × 10−43.040.0715Aliased
Residual3.62 × 10−3191.90 × 10−4
Total0.14275.32 × 10−3
The Sum of Squares Model evaluates the significance of the addition of other factors in the model, The Sequential Sum of Squares (Type I) evaluates the significance of each factor as they are added to the model. It evaluates how many deviations each additional term explains in the presence of previously included terms. * A low Prob > F value (<0.05) indicates that the newly added term remains statistically significant in improving the model’s ability to describe the experimental data.
Table 3. Lack of Fit Tests.
Sum of SourceMean SquaresF
df
p-Value
Square
ValueProb f
Linear5.82 × 10−369.70 × 10−45.030.0034
2FI4.58 × 10−359.16 × 10−44.750.0061
Quadratic1.31 × 10−334.35 × 10−42.26* 0.1167Suggested
Pure Error3.47 × 10−3181.93 × 10−4
The Lack of Fit test evaluates how well a statistical model represents the experimental data. It assesses whether the model sufficiently captures the relationship between factors and the response, including systematic variations. * A high p-value in the Lack of Fit test (>0.05) indicates that there is insufficient evidence to suggest the model inadequately represents the data, meaning it likely provides a reasonable fit.
Table 4. Model Summary Statistics.
Std.AdjustedPredicted
SourceDev.R-SquaredR-SquaredR-SquaredPRESS
Linear0.020.74520.7240.67750.012
2FI0.0190.77920.75040.70760.011
Quadratic0.015* 0.8691* 0.8379* 0.7842a 7.87 × 10⁻³Suggested
* Higher R2 values indicate that the model accounts for more variabilities between the factors and the response. a Lower PRESS (Predicted Residual Error Sum of Squares) indicates that the model can better explain the data.
Table 5. Analysis of variance for chitosan nanoparticle biosynthesis using Blumea balsamifera leaf extract as affected by extract concentration and Chitosan concentration.
Source of VarianceSum of SquaresdfMean SquareF
Value
p-Value
Prob > F
Coefficient Factor
Model0.03256.34 × 10−327.88* <0.00010.066
E-Extract Concentration0.01910.01984.78* <0.00010.033
C-Chitosan Concentration7.90 × 10−317.90 × 10−334.73* <0.00010.021
E * C1.24 × 10−311.24 × 10−35.46* 0.02950.01
E21.15 × 10−311.15 × 10−35.05* 0.03550.014
C22.13 × 10−312.13 × 10−39.36* 0.006−0.019
Residual4.77 × 10−3212.27 × 10−4
Lack of Fit1.31 × 10−334.35 × 10−42.260.1167
Pure Error3.47 × 10−3181.93 × 10−4
CorTotal0.03626
Source of VarianceSum of SquaresdfMean SquareF
Value
p-value
Prob > F
Coefficient Factor
Model0.03256.34 × 10−327.88* <0.00010.066
*A lower p value (<0.05) in ANOVA indicates that the terms are statistically significant.
Disclaimer/Publisher’s Note: The statements, opinions and data contained in all publications are solely those of the individual author(s) and contributor(s) and not of MDPI and/or the editor(s). MDPI and/or the editor(s) disclaim responsibility for any injury to people or property resulting from any ideas, methods, instructions or products referred to in the content.

