Abstract
This research addresses the challenge of load management in electricity distribution networks, focusing on the optimal placement of telecommunication load breaker switches in the presence of distributed generation units. By integrating two key objectives—preserving critical loads and minimizing energy not supplied—a strategy is proposed to enhance the performance of the power distribution grid during peak load conditions. The study utilizes a search algorithm designed around a dual-objective function to simultaneously prioritize high-importance loads and reduce energy not supplied by optimizing the placement of telecommunication load breaker switches while considering distributed generation. The effectiveness of the proposed model has been evaluated on a 33-bus test network as well as a feeder from the Iranian distribution network, with detailed analysis and interpretation of the results. Simulation findings reveal that as the priority of critical loads increases, the optimal placement of switches adapts accordingly, leading to significant improvements in the reliability and efficiency of the power distribution network under peak load scenarios.
1. Introduction
1.1. Motivation
Load management in power distribution networks is one of the most critical and challenging issues that significantly impacts network efficiency, security, and reliability. Currently, the rising energy consumption during summer, coupled with increasing temperatures and thermal loads, leads to a surge in power grid demand. To address this challenge, the optimal placement of Telecommunication Load Breaker Switches (TCLBSs) has been recognized as a primary solution for summer load management due to the high efficiency and effectiveness of these switches. However, existing optimization methods often focus solely on either reducing Energy Not Supplied (ENS) or neglect the prioritization of critical loads. These limitations prevent the network from simultaneously achieving both objectives during peak load conditions. Optimal placement of these switches can profoundly influence the preservation of critical loads and load management during summer peaks. Therefore, this study bridges the gap in single-criterion approaches by proposing a flexible dual-objective optimization framework, enabling a dynamic balance between competing goals. In addition to optimal load management, network security and reliability are equally vital. Given the technical constraints and challenges in power grids, striking a balance between load reduction, preventing sudden outages, and enhancing network reliability is imperative.
1.2. Literature Review
In the following, articles on load shedding and reliability have been reviewed:
In today’s world, with the increase in population and industrial development, the demand for electrical energy is steadily increasing. This issue is seen more in the summer seasons, when the use of cooling devices is maximized. This increase in load in the summer season can lead to serious challenges in electricity distribution networks, including increasing the risk of power outages and reducing power quality. One of the main methods for managing energy imbalance challenges is using load shedding techniques as a mechanism to reinforce frequency and voltage stability [1,2,3]. In [4], a hybrid approach for load shedding based on Particle Swarm Optimization (PSO) and the Genetic Algorithm (GA) is presented. The proposed algorithm can be used to determine the optimal load shedding value for tolerant smart grid systems. The proposed technique first determines which stations in the system are weak by using the Fast Voltage Stability Index (FVSI) and then determines how much load shedding is appropriate to restore a collapsing system. In [5], an optimal load shedding technique for radial distribution systems in the presence of distributed generation (DG) units is presented. The load shedding cost is usually seen as a fixed value when optimizing emergency control, but in fact, it varies depending on the external conditions. Reference [6] uses the reinforcement learning method to learn past performance data and adapt to the unpredictability of load shedding cost to determine the optimal options based on investigating the effect of environmental conditions on load shedding cost. In [7], a unique approach to automatic demand response in a smart distribution system has been proposed. This method generates calculations based on the behaviors of devices and priority levels defined by the consumer. The proposed approach utilizes data from extensive device controllers capable of directly controlling load, monitoring power, and facilitating bidirectional communication. The optimization process, which involves allocating available power supply to a large number of devices while considering the priority levels defined by the consumer, is performed through a Genetic Algorithm (GA). Based on sensitivity analysis, an optimized coordinated strategy for demand response is presented in [8]. This initiative begins with optimizing the demand response control method when loading multiple feeder lines simultaneously. The sensitivity relationship between node load changes and total line currents is calculated based on the node voltage equation and the incidence matrix. Reference [9] introduces a novel optimal demand response technique based on the Grasshopper Optimization Algorithm (GOA) to maintain stability in Islanded Distributed Energy Resources (DERs) distribution systems. Production constraints, allowable demand response adjustments, and load priority are multi-objective demand response constraints managed by the GOA along with the Voltage Stability Margin (VSM) technique. To achieve higher efficiency, reference [10] provides an ideal demand response strategy using the Cuckoo Search Metaheuristic Algorithm (CSMA) with a sinusoidal map. To complete the assessment, a constrained function with the static Voltage Stability Margin (VSM) index and total remaining load after demand response is utilized. In contrast to conventional demand response methods, reference [11] introduces an Under-Frequency Load Shedding (UFLS) system, which is identified for its higher efficiency in major disturbances and reduced power loss in case of minor and moderate disturbances. These benefits are achieved by replacing the active system thresholds based on fuzzy logic computations for idle thresholds that are independent of system status and by substituting the sequential load shedding mechanism with the simultaneous load shedding mechanism. Many households experience power loss during demand response, which is undesirable and inconvenient for them. In [12], diverse optimization strategies emphasizing pairwise and group fairness have been elucidated, ensuring that households or agents are allocated electricity in an equitable manner. Household satisfaction level and the frequency of power outages are two metrics used in this study to evaluate loops against traditional fairness criteria. General power outages or demand response, a common method for demand–supply equilibrium, can lead to significant financial losses. A method called Soft Load Shedding (SLS), which fairly allocates power demand and supply to each household, is proposed in [13] to address the demand–supply gap issue. In this study, a function is defined for household satisfaction level to quantify the fairness of SLS. The Fair Load Shedding Problem (FLSP) in [14] is addressed by developing methods that align households with electricity supply in accordance with specific fairness standards. Firstly, several heuristic load shedding schemes for households satisfying initial requirements are discussed. Secondly, proper programming issues of multi-knapsack problems based on mixed-integer programming are utilized to define the FLSP as a resource allocation problem. Reference [15] focuses on the optimal placement of switches in the distribution network using a genetic algorithm to enhance network reliability indices aimed at minimizing unmet energy. To enhance reliability, the power supply of distribution networks and reduce power consumption losses, the Firefly Algorithm (FA) is proposed for optimizing the position and quantity of switching devices in [16]. The proposed Firefly Algorithm is practical and efficient, providing necessary applications in calculating relay protection adjustment values and controlling automation in distribution networks with its global search capability and satisfactory convergence speed. In reference [17], the Ant Colony Optimization (ACO) algorithm for distribution automation based on the installation and relocation of sectionalizers is presented, which includes two objectives: minimizing switch costs and improving system reliability indices. Placing switches using the ACO algorithm during fault occurrences reduces outage costs for customers. Additionally, the Benefit-to-Cost Ratio (BCR) analysis is employed to demonstrate the profitability of investing in switch implementation and utilization. Furthermore, a hybrid method based on the Improved Particle Swarm Optimization (IPSO) algorithm and Monte Carlo simulation for sectionalizer and recloser placement, with the objective of minimizing distribution system reliability costs, is proposed in reference [18]. In [19], the NSGA-II genetic algorithm is employed to find the optimal number, type, and location of protective devices as a multi-objective problem, including minimizing network reliability indices (SAIDI and SAIFI), the Distributed Generation Unavailability Index (DGUI), and equipment costs. To solve this multi-objective problem, the NSGA-II genetic algorithm is applied with two different approaches. The first approach considers three objective functions: the cost of protective equipment, the Distributed Generation Unavailability Index (DGUI), and the network reliability indices (SAIDI and SAIFI, each considered at the same time). The second approach proposes a combined reliability index where the unavailability of distributed generation units is integrated into the two reliability indices (SAIDI and SAIFI). In this combined reliability index, each distributed generation unit is represented by a certain number of consumers connected to a load point. A Mixed-Integer Linear Programming (MILP) model is presented in [20] to simultaneously place reclosers, sectionalizers, and circuit breakers (including remote and manual control switches). The objective of the proposed model is to find the optimal locations of protective devices in a way that minimizes customer outage costs related to permanent and temporary faults and that minimizes investment, maintenance, and relocation costs of protective equipment. In [21], the distribution system is represented as a directed graph, and a mixed-integer linear programming (MILP) model is used to place protection devices in the distribution network. A mixed-integer linear programming (MILP) model for simultaneous optimal allocation of fault indicators (FIs) and sectionalizing switches (SSs) in a wide distribution network is developed based on reliability and cost–benefit analyses in [22]. In [23], a mixed-integer nonlinear programming (MINLP) model and a differential evolution (DE) method is used to optimize the placement of switches and reclosers in a distribution system, which aims to maximize system reliability. At the same time, it is now used to minimize the investment and the costs of load interruption by taking into account the uncertainty in the load data, the system failure, and the repair rate. The new MILP model for finding the optimal numbers and locations of fault indicators in distribution networks is presented in [24], along with the optimal location of the recloser with power transmission limitations at the maneuvering points and the possibility of failure of the reclosers with the Markov model in [25]. In recent years, the development of optimization methods for distribution networks has significantly accelerated, focusing on resilience and intelligent load management. In this context, study [26] proposes a novel framework for the simultaneous restoration of electricity, gas, and heat networks under uncertainties in generation and consumption. Utilizing two-stage stochastic programming, this study analyzes the optimal network configuration and resource allocation under various failure scenarios. Compared with this research, the proposed method in the current study, while limited to a single-energy (electricity) scope, distinguishes itself in two key aspects: Unlike [26], which focuses on network restoration after failures, this study takes a preventive approach by mitigating overloads and failures through optimal preemptive load shedding of non-critical loads. Additionally, it introduces a weighted objective function that enables automatic adjustment of load shedding priorities based on the criticality of loads—a feature absent in [26]. Study [27] proposes a nonlinear controller based on differential game theory and an extended Kalman filter to maintain frequency stability during hardware failures and communication disruptions. The key differences between this study and [27] include the divergence in primary objectives, as [27] focuses on real-time frequency regulation during disturbances, whereas this study reduces the likelihood of frequency instability by proactively managing loads through optimal TCLBS placement. The proposed method also explicitly models distributed generation (DG) output fluctuations in load shedding decisions, while [27] does not consider DG impacts. Moreover, the sensitivity-based search algorithm in this study offers higher computational speed compared with metaheuristic methods like PSO and the GA used in [27], enabling real-world implementation in large-scale networks.
Unlike previous studies that often address these aspects separately, this research establishes a unified framework to simultaneously optimize Energy Not Supplied (ENS) reduction and critical load preservation. Compared with stochastic programming [26] or complex nonlinear controllers [27], the proposed algorithm enables real-time adjustments of TCLBS locations based on dynamic load variations. Additionally, testing the model on an operational feeder in Iran’s distribution network demonstrates its feasibility under real-world conditions with practical constraints—an aspect not considered in [26,27]. Table 1 compares past studies with this work, summarizing key details such as the proposed method, publication year, optimal switch placement, presence of DG units, and objective functions (e.g., ENS and load shedding). Items are marked green (Yes) or red (No) to indicate their presence or absence.

Table 1.
Comparison of the past works with this study.
1.3. Contributions
Providing a dual-objective model for locating TCLBSs in the distribution network in the presence of DG units, combining load shedding functions and reliability to preserve important load points.
Presenting a mathematical model based on graphs for calculating the objective function of Energy Not Supplied (ENS).
Introducing an iterative and search-based method within the network lines aimed at finding the optimal location of TCLBSs.
In the following, the second part introduces the formulation of the problem; in the third and fourth parts, the proposed method and simulation results are presented; in the fifth part, the conclusion is introduced and expressed; and, in the sixth part, the future research directions are discussed.
2. Formulation of the Problem
The first objective function is calculated using forward–backward load flow analysis and graph theory-based relationships [28]. It represents the weighted load vector disconnected by placing the selected switch on the least important lines, as determined by the following equation:
L: Number of branches
N: Number of buses
[Ujn]: BIBC matrix (Bus Injection to Branch Current)
The BIBC matrix represents the relationship between the injected currents at the network buses and the flowing currents in its branches [28].
This matrix is defined in such a way that if row j is connected to node n, its value is 1; otherwise, it is 0.
[Wn]L×1: Load vector with weight priority
This vector assigns weights to loads based on their importance. For example, if the government prioritizes household consumers, the corresponding coefficient is assigned a higher value than other consumers. In this study, different scenarios are examined based on such considerations.
[Pn]N×1: Active power of each node
This vector represents the average active power values at each node.
[Vj]L×1: Location of the TCLBS
This vector indicates the placement of the Telecommunication Load Breaker Switch (TCLBS) within the network.
This vector specifies the locations of all the switches placed on the lines, aiming to identify the particular switch that disconnects the least important load. If the TCLBS is open, its value is 1; if closed, its value is 0. The amount of load shed, PShed, determined based on the priority of maintaining critical loads, is calculated using the following formula:
It represents the amount of load that must be shed due to the imbalance between production and consumption, particularly during summer peak periods. This value can be defined as a percentage of the total network load and is analyzed under different scenarios.
The second objective function, which represents the amount of Energy Not Supplied (ENS) in the network, is calculated using the following formula. By optimally placing the selected switch, this function aims to enhance network reliability.
The service unavailability time of load point n over a specific period (one year) is determined using the following equation, where rj represents the repair time of line j and λj denotes the failure rate of line j.
The final objective function is a dual-objective function that combines two optimization criteria. To achieve a balanced solution between these two objectives, weighting coefficients K1 and K2 are used, where their sum equals one (K2 = 1 − K1). These weighting factors allow for controlling the significance of each objective function in the optimization process. The total objective function is defined as follows:
This equation consists of two main parts. The first term, related to K1, considers the impact of critical loads in the optimization process. The weighting factor Wn and the importance coefficient Ujn indicate the significance of each load. This part aims to minimize the impact of critical loads on network performance. The second term, related to K2, accounts for Energy Not Supplied (ENS) and seeks to minimize its value in the network. The parameters rj and λj represent failure rates and their influence on loads, respectively.
The weighting coefficients K1 and K2 play a crucial role in determining the optimization direction, allowing network operators to balance critical load preservation and ENS minimization. The proposed method introduces a flexible mechanism for adjusting this balance through dynamic weighting, a capability often missing in single-objective optimization approaches.
The selection of these coefficients depends on network operating conditions and load management policies. Under normal conditions, where network stability is a priority, a higher K1 value ensures that critical loads receive priority. In emergency situations, such as widespread outages, a higher K2 value is preferred to focus on reducing ENS. A dynamic approach enables updating K1 and K2 based on the severity of the crisis or operational priorities.
Limitations
Load Shedding Constraint
In the load management process, the amount of load removed must be controlled to avoid excessive or insufficient removal. This is achieved by applying a penalty in the objective function. Two possible situations may arise that require adjustments to the objective function:
Excessive removal: If the amount of load removed exceeds the required amount, removing extra load can lead to a decrease in network efficiency and an increase in unnecessary costs. Therefore, in this case, a penalty is applied in the objective function to bring the load removal closer to the optimal level.
Insufficient removal: If the amount of load removed is less than the required amount, the balance between production and consumption will not be maintained, and the network may face instability. In this case, a penalty is applied to the objective function to increase the amount of load removal and meet the required value.
This method ensures that the load removal remains optimal and prevents unnecessary fluctuations in the operation of the network.
Load Flow Constraint
In the power flow program, the following equations must be valid for bus voltage convergence; otherwise, the power flow calculations will be repeated forward and backward.
DG Unit Constraint
The constraint ensures that the output of DG units remains within their minimum and maximum generation limits [29].
The active power generated by the DG unit is represented by . Moreover, The Minimum and Maximum generation limit of the unit are represented by and , respectively.
3. Proposed Method
In this algorithm, we are trying to optimally cut the less important loads so that the high priority (vital) loads are maintained and, at the same time, have the least amount of undistributed energy. According to the government’s view on the importance of the household, agricultural, or industrial loads of consumers, as based on the indicators considered by the government, these loads are classified into three levels: low importance, ordinary, and high importance. The method we proposed in this study, a method based on repetition, determines the location of the TCLBS randomly in each step of the search, and in different states, the switch is considered active and inactive. For each combination, the vector V indicates the active or inactive state of the TCLBS, and Pshed is the amount of load that is interrupted by activating the specified TCLBS in the V and is calculated at each step of the search. The value of the objective function (OF), which is the sum of the two main objectives of this research, is calculated for each combination. In fact, if K1 and K2 = 1 − K1 are the coefficients of these two objectives, this objective function is designed to prioritize preserving high-priority loads with greater value and practically preventing their disconnection while also aiming to minimize the amount of energy not supplied in the network. Therefore, our goal in this study is to minimize the objective function, and by using this method, we have achieved very good speed in computations and finding optimal points. If K1 = 1, it means we consider the importance of the first objective, which is load shedding, as 100%, and the importance of the second objective, which is reliability, as 0%, and we expect the critical location where the switch is placed to exclude low-importance load points from the circuit without considering the minimum unsupplied energy. Also, if K1 = 0, it means that the importance of the first goal, which is load shedding, is 0%, and the importance of the second goal, which is reliability, is 100%, and we expect the TCLBS location to be located at the end of the network or branches, regardless of the important loads, so that the least amount of energy is lost. Also, based on the and values, a penalty is added to the objective function to ensure that the shed load is less than the required shutdown value and to exclude excessive shed load values from the search with a penalty. The calculations of this research are based on the BIBC matrix and the PL and Wn vectors, which play an important role in understanding the load distribution and its priorities in the network. We highlight the advantages of our search-based approach, which leverages graph theory, compared with metaheuristic algorithms such as the Genetic Algorithm (GA) and Particle Swarm Optimization (PSO), particularly in terms of computational efficiency and solution quality. The proposed method systematically explores the solution space by gradually determining the optimal location of TCLBSs using search techniques in different states and the key status within the network while also utilizing the concepts of graph theory. This ensures that high-priority loads are preserved while minimizing Energy Not Supplied (ENS). One of the key advantages of this graph-based approach is its significantly reduced computational complexity compared with population-based methods like the GA and PSO. While the GA and PSO require multiple iterations and population updates, leading to increased computational overhead, our method directly evaluates candidate solutions based on the topology and load priorities in the network, enabling faster convergence and minimal computational cost. This makes the method highly suitable for real-time applications in large-scale distribution networks.
Furthermore, the use of dynamic weighting coefficients K1 and K2 in this method provides greater flexibility in balancing load shedding and ENS optimization. Unlike conventional metaheuristic approaches, which often require extensive fine-tuning of parameters and may struggle to maintain feasibility in highly constrained distribution networks, our method, through searching different network states and determining the optimal placement of TCLBSs, effectively ensures that excessive shedding is avoided while prioritizing critical loads.
Additionally, by leveraging the BIBC matrix and the PL and Wn vectors, our method provides a structured understanding of load distribution and prioritization, improving the decision-making process. This approach, by combining these analytical tools, achieves a balance between computational efficiency and optimization accuracy, addressing the main limitations of metaheuristic methods—such as excessive computational time and difficulty in maintaining feasibility—and providing a practical and scalable solution. The flowchart of the proposed method is shown in Figure 1.
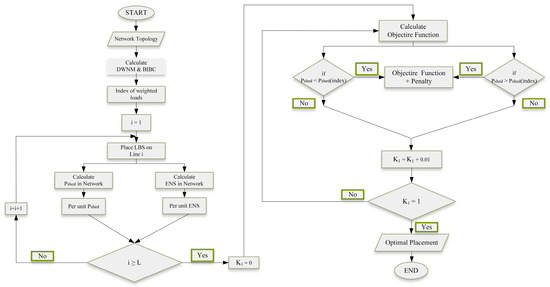
Figure 1.
Flowchart of the proposed method.
4. Simulation Results
In this study, the proposed method to solve the desired optimization problem has been evaluated on the test network of 33 standard buses and a 20 kV distribution feeder from Iran Electrical Network. The simulation results are described in Section 4.1 and Section 4.2.
4.1. 33-Bus Test Network
Figure 2 and Table 2 illustrate the single-line diagram of the 33-bus test network and the importance ranking of the network loads, respectively. In the 33-bus test network [30], the simulation results are presented with and without the presence of distributed generation (DG) units in two scenarios.
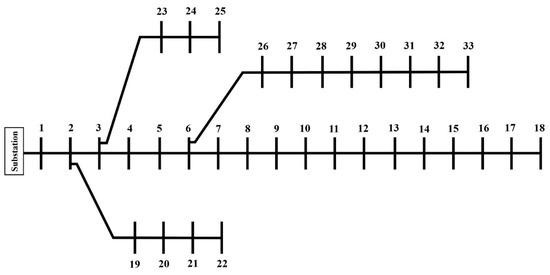
Figure 2.
Single-line diagram of the standard 33-bus test network.

Table 2.
Importance levels of loads in each bus.
4.1.1. Scenario 1
The optimization problem in this scenario has been addressed using the proposed method in the absence of distributed generation units. In this section, a load shedding amount of 10% of the total network load is considered. Figure 3 and Table 3 display the switch locations within the network along with the corresponding values of the objective functions based on variations in the coefficient K1. Meanwhile, Figure 4 illustrates the switch placement in relation to changes in the coefficient K1 throughout the network.
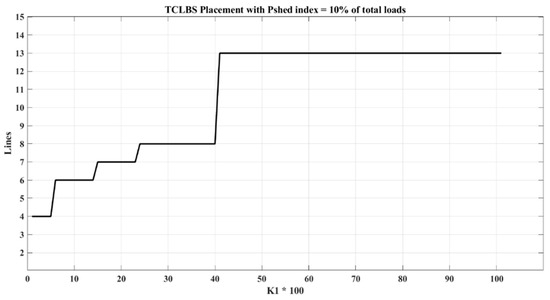
Figure 3.
Locations of TCLBSs in each range of K1 considering:

Table 3.
Locations of TCLBSs in each range of K1 considering: and amount of each O.F.
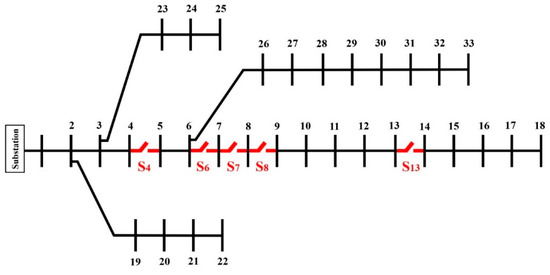
Figure 4.
Optimal placement of TCLBSs in the 33-bus test network.
Additionally, it is assumed that the load shedding amount increases to 20% of the total network load. In this context, Figure 5 and Table 4 present the switch locations and the objective function values in relation to the variations of the coefficient K1. Furthermore, Figure 6 depicts the switch placement as it pertains to changes in the coefficient K1 within the network.
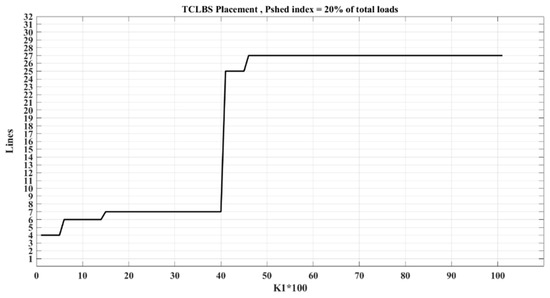
Figure 5.
Locations of TCLBSs in each range of K1 considering:

Table 4.
Locations of TCLBSs in each range of K1 considering: and amount of each O.F.
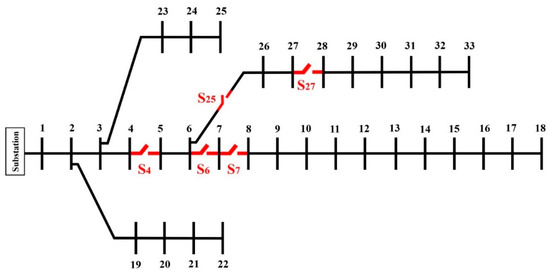
Figure 6.
Optimal placement of TCLBSs in the 33-bus test network.
According to Table 3, it is clear that, with the increase of K1, the importance of the first objective function, i.e., load shedding, is higher and that the importance of the second objective function, i.e., reliability, decreases. Furthermore, with the increase of K1, it is clear that the value of the load shedding index decreases and that the value of the ENS index increases.
According to the changes in the amount of load required to remove the overload during the peak time from 10% of the total system load to 20%, the results under the new conditions will be as follows:
Based on the results from Table 3 and Table 4, it is clear that as the load shedding amount increases from 10% to 20% of the total network load, the switch location for load shedding shifts to lines with lower importance coefficients, resulting in an increase in the load shedding objective function value and a decrease in energy not supplied. For example, with the increase in the coefficient K1, the significance of the load shedding objective function increases, while the impact of energy not supplied on the overall objective function diminishes. The results in Table 4 indicate that with the rise in the load shedding amount, the total objective function value has worsened.
Figure 7 shows a comparison of the two objective functions when a switch is placed in each line of the 33-bus test network and represents the value of that target at the point where each TCLBS is placed. Based on the importance of each goal, at the points where the TCLBSs are located, the value of the objective function can be compared with the value of another objective function.
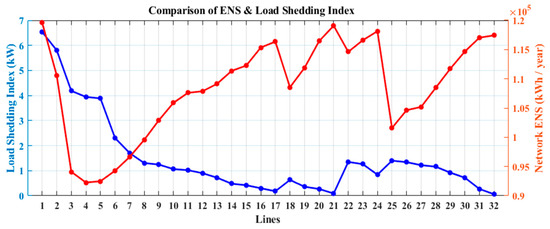
Figure 7.
Comparison of the ENS index and the load shedding index.
4.1.2. Scenario 2
In this scenario, the optimization problem has been solved using the proposed method with the presence of DG units located at buses 4 and 7. The load shedding amount in this case is set at 20% of the total load of the network. Figure 8 and Table 5 illustrate the switch locations in the network and the corresponding values of the objective functions based on variations in the coefficient K1. Meanwhile, Figure 9 depicts the placement of the switches and the DG units concerning the changes in the coefficient K1 within the network.
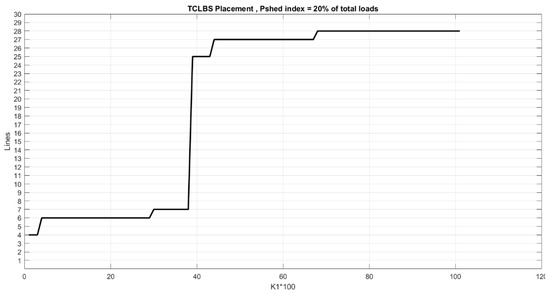
Figure 8.
Locations of TCLBSs in each range of K1.

Table 5.
Locations of TCLBSs in each range of K1.
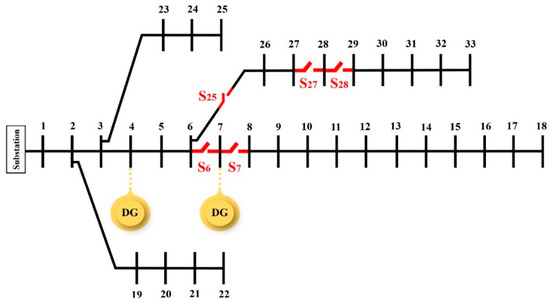
Figure 9.
Optimal placement of TCLBSs and DG units in the 33-bus test network.
The comparison of results from Scenarios 1 and 2, based on the outcomes of Table 4 and Table 5, indicates that the presence of DG units has led to a reduction in the objective functions for energy not supplied and load shedding. For instance, in Scenario 1, with the lowest value of the load shedding objective function coefficient, these objective values are 92,263 kWh per year and 3.945 kW, respectively. In Scenario 2, these values decrease to 87,533 kWh per year and 3.60 kW.
According to Figure 10, it is clear that changes in the objective function coefficients directly affect the improvement or deterioration of the objective functions. For example, increasing the coefficient K1 improves the load shedding objective function while worsening the energy not supplied objective function, whereas decreasing K1 improves the energy not supplied objective function but worsens the load shedding objective function.
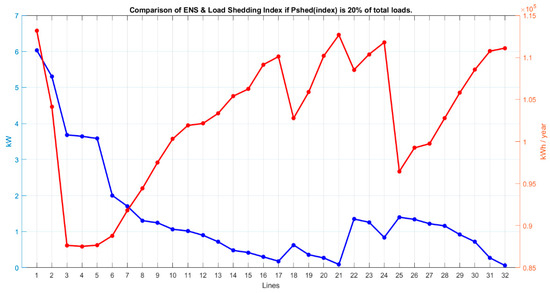
Figure 10.
Comparison of the ENS index and the load shedding index.
4.2. Real Distribution Network
Figure 11 and Table 6 present the single-line diagram of a feeder from the Iranian distribution network and the importance ranking of its loads, respectively. This network is a part of a 20 kV feeder, consisting of 98 buses and 97 lines, where the prioritization of loads is based on their importance in operation and load management programs. The results of the study are checked and analyzed within this under-study feeder network in order to assess the effectiveness of the proposed method.
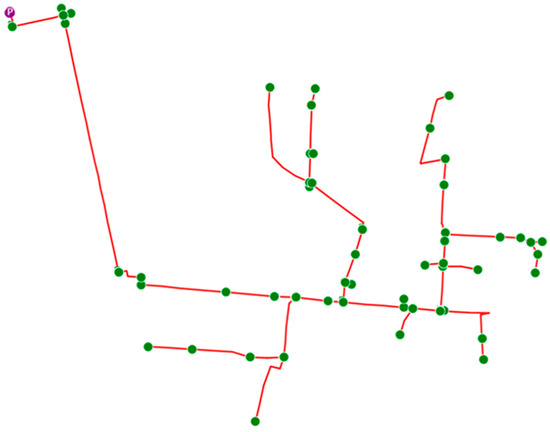
Figure 11.
Single-line diagram of the under-study feeder network.

Table 6.
Importance levels of loads in each bus of the under-study feeder network.
Industrial loads have the highest priority, as maintaining stability and continuous power supply for industries is critical. Power outages in industrial loads can lead to serious economic disruptions, reduced production, and significant financial losses. Therefore, in the proposed method, these loads are preserved as much as possible and are considered the last option for load shedding in critical conditions.
Residential loads include general consumers and households, where a stable power supply is essential but has a lower priority compared with industrial loads. In emergency conditions, a portion of residential loads can be shed, provided that widespread and prolonged outages are avoided. In the proposed method, residential loads are assigned medium importance, and their shedding level can be controlled based on the adjustment of the weighting coefficients K1 and K2.
Agricultural loads consist of water wells, irrigation pumps, and agricultural facilities. Since temporary outages do not have an immediate impact on daily life and industrial processes, they are prioritized for load shedding in load management programs. In the proposed method, agricultural loads are shed first to minimize Energy Not Supplied (ENS) in the network.
This network serves as a suitable testbed for evaluating the proposed method under real operational conditions. Given the network structure, load classification, and impact analysis of load shedding, the results confirm that the proposed method optimally determines the locations of TCLBSs, leading to enhanced network performance under load reduction scenarios. This demonstrates the practical applicability of the method in real-world power distribution networks, making it valuable for load management programs and distribution network operations.
Figure 12 and Table 7 present the switch locations based on variations in the objective function coefficients and the objective function values, assuming a load shedding of 10% of the total network load.
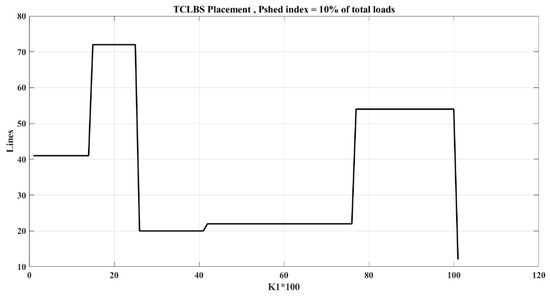
Figure 12.
Locations of TCLBSs in each range of K1 considering:

Table 7.
Locations of TCLBSs in each range of K1 considering: and amount of each O.F.
Figure 13 and Table 8 illustrate the switch locations according to changes in the objective function coefficients and the corresponding objective function values, assuming a load shedding of 20% of the total network load.
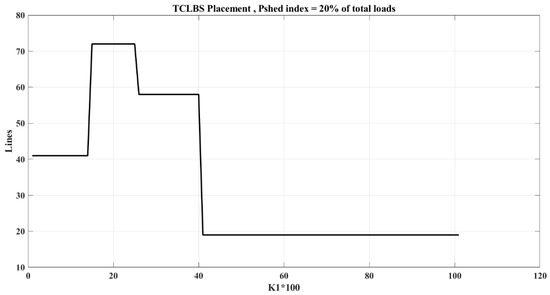
Figure 13.
Locations of TCLBSs in each range of K1 considering:

Table 8.
Locations of TCLBSs in each range of K1 considering: and amount of each O.F.
In both cases, it is observed that, with the increase of K1, the importance of the first objective function, i.e., load shedding, is higher and that the importance of the second objective function, i.e., the ENS, decreases; it is also observed that, with the increase of K1, the value of the load shedding index decreases and that the value of the ENS index increases.
Figure 14 illustrates a comparison of the two objective functions when the switch is positioned in each line of a real feeder from the Iran distribution network and represents the value of the objective at the point where the switch is placed. Based on the importance of each objective, one can compare the value of the intended objective function with that of the other objective function at the points where the switch is placed.

Figure 14.
Comparison of the ENS index and the load shedding index.
5. Conclusions
This study presents a dual-objective method to improve load management and enhance the reliability of power distribution networks, focusing on the optimal placement of Telecommunication Load Breaker Switches (TCLBSs) in the presence of Distributed Generation (DG) units across two separate scenarios. The overall objective function is the sum of two functions: energy not supplied and load shedding. The proposed method in this study is based on an iterative search through network lines. The model was tested on a 33-bus test network and a real feeder from the Iran distribution network, demonstrating that optimal TCLBS placement, through adjustments in objective function coefficients, can significantly enhance network performance during peak load periods. The main findings of this study are as follows:
With an increase in load shedding from 10% to 20% of the total network load, the reduction in the load shedding objective function becomes less pronounced. For example, when load shedding was 10%, the load shedding objective function was 0.72 kW; with an increase to 20%, this objective function reached 1.22 kW.
In the presence of DG units, the values of the ENS and load shedding objective functions decreased. For example, these functions reduced from 94,279 kWh/year and 2.305 kW in Scenario 1 to 88,799 kWh/year and 2.005 kW in Scenario 2.
As the coefficient of the load shedding objective function increases, the optimal switch location shifts toward the end lines of the network to eliminate lower priority load points. For instance, in Scenario 1, with 20% load shedding, the switch location shifted from line 4 to line 27 as the load shedding objective coefficient increased. Another switch observation from this study is the worsening of the energy not supplied objective function with an increase in the weighting coefficient of the load shedding objective function.
6. Future Research Directions
To improve load management during peak hours and enhance distribution network efficiency, the following suggestions are proposed:
Improving the objective function with network reconfiguration and switch placement: Network reconfiguration, combined with optimal switch placement, improves energy distribution, reducing losses and increasing system stability during peak hours.
Using metaheuristic algorithms: Metaheuristic algorithms, like the genetic algorithm and PSO, can solve complex optimization problems and find the best solutions for switch placement and network design.
Considering dynamic 24 h load profiles: Modeling network load dynamically over 24 h allows better peak load forecasting and resource optimization, enhancing grid efficiency.
Robust optimization against uncertainty: Employing robust optimization techniques addresses uncertainties in distributed energy generation (e.g., variable renewable sources) and demand fluctuations, ensuring effective system operation in varying conditions.
Demand response policies: Developing demand response policies encourages consumers to reduce load during peak hours or to use distributed energy generation sources, easing grid pressure and improving network performance.
These approaches can be integrated into an optimized framework for peak load management, enhancing the efficiency and resilience of power distribution networks while utilizing renewable and distributed energy generation sources effectively.
Author Contributions
Methodology, H.P.; Software, H.P.; Investigation, H.L. and M.E.H.; Supervision, H.L. and M.E.H. All authors have read and agreed to the published version of the manuscript.
Funding
This research received no external funding.
Data Availability Statement
The data presented in this study are available upon request from the corresponding author.
Conflicts of Interest
The authors declare no conflicts of interest.
References
- Sapari, N.M.; Mokhlis, H.; Laghari, J.A.; Bakar, A.H.A.; Dahalan, M.R.M. Application of load shedding schemes for distribution network connected with distributed generation: A review. Renew. Sustain. Energy Rev. 2018, 82, 858–867. [Google Scholar] [CrossRef]
- Hajiabadi, M.E.; Samadi, M.; Lotfi, H.; Nikkhah, M.H.; Kaveh, K.; Zarif, M. Optimal Placement of Protection Switches in a Real Distribution Network Based on Reliability Importance Using an Improved Gravitational Search Method. In Proceedings of the 2023 27th International Electrical Power Distribution Networks Conference (EPDC), Mashhad, Iran, 2–4 May 2023; pp. 16–24. [Google Scholar]
- Lotfi, H.; Nikkhah, M.H.; Hajiabadi, M.E.; Samadi, M. Presenting an IPSO Method Aimed at Energy Management in the Distribution Network considering DG units and BSs. In Proceedings of the 2023 27th International Electrical Power Distribution Networks Conference (EPDC), Mashhad, Iran, 2–4 May 2023; pp. 29–36. [Google Scholar]
- Larik, R.M.; Mustafa, M.W.; Aman, M.N.; Jumani, T.A.; Sajid, S.; Panjwani, M.K. An improved algorithm for optimal load shedding in power systems. Energies 2018, 11, 1808. [Google Scholar] [CrossRef]
- Khamis, A.; Shareef, H.; Mohamed, A. Islanding detection and load shedding scheme for radial distribution systems integrated with dispersed generations. IET Gener. Transm. Distrib. 2015, 9, 2261–2275. [Google Scholar] [CrossRef]
- Chen, Y.; Liao, S.; Xu, J. Emergency load-shedding optimization control method based on reinforcement learning assistance. Energy Rep. 2022, 8, 1051–1061. [Google Scholar] [CrossRef]
- Jabian, M.E.; Funaki, R.; Murata, J. Load shedding optimization considering consumer appliance prioritization using genetic algorithm for real-time application. IFAC-PapersOnLine 2018, 51, 486–491. [Google Scholar] [CrossRef]
- Zhang, D.; Li, W.; Jiang, Z.; Wu, N.; Hou, Y. Load shedding strategy coordinate optimization based on sensitivity analysis. In Proceedings of the 2016 IEEE PES Asia-Pacific Power and Energy Engineering Conference (APPEEC), Xi’an, China, 25–28 October 2016; pp. 1893–1897. [Google Scholar]
- Ahmadipour, M.; Othman, M.M.; Salam, Z.; Alrifaey, M.; Ridha, H.M.; Veerasamy, V. Optimal load shedding scheme using grasshopper optimization algorithm for islanded power system with distributed energy resources. Ain Shams Eng. J. 2023, 14, 101835. [Google Scholar] [CrossRef]
- Abid, M.S.; Apon, H.J.; Ahmed, A.; Morshed, K.A. Chaotic slime mould optimization algorithm for optimal load-shedding in distribution system. Ain Shams Eng. J. 2022, 13, 101659. [Google Scholar] [CrossRef]
- Małkowski, R.; Nieznański, J. Underfrequency load shedding: An innovative algorithm based on fuzzy logic. Energies 2020, 13, 1456. [Google Scholar] [CrossRef]
- Oluwasuji, O.; Malik, O.; Zhang, J.; Ramchurn, S. Algorithms for fair load shedding in developing countries. In Proceedings of the Twenty-Seventh International Joint Conference on Artificial Intelligence (IJCAI-18), Stockholm, Sweden, 13–19 July 2018. [Google Scholar]
- Ali, S.; Mansoor, H.; Khan, I.; Arshad, N.; Faizullah, S.; Khan, M.A. Fair allocation based soft load shedding. In Intelligent Systems and Applications: Proceedings of the 2020 Intelligent Systems Conference (IntelliSys); Springer International Publishing: Cham, Switzerland, 2021; Volume 2, pp. 407–424. [Google Scholar]
- Oluwasuji, O.I.; Malik, O.; Zhang, J.; Ramchurn, S.D. Solving the fair electric load shedding problem in developing countries. Auton. Agents Multi-Agent Syst. 2020, 34, 12. [Google Scholar] [CrossRef]
- Karimi, H.; Niknam, T.; Aghaei, J.; Ghasemi Garpachi, M.; Dehghani, M. Switches optimal placement of automated distribution networks with probability customer interruption cost model: A case study. Int. J. Electr. Power Energy Syst. 2021, 127, 106708. [Google Scholar] [CrossRef]
- Tan, Y.; Chen, H.; Liu, W.; Zhang, M.; Li, Y.; Li, X.; Lin, H. Repulsive firefly algorithm-based optimal switching device placement in power distribution systems. Glob. Energy Interconnect. 2019, 2, 489–495. [Google Scholar] [CrossRef]
- Zhang, B.; Crossley, P. Reliability improvement using ant colony optimization applied to placement of sectionalizing switches. Energy Procedia 2017, 142, 2604–2610. [Google Scholar] [CrossRef]
- Abdi, S.; Afshar, K.; Ahmadi, S.; Bigdeli, N.; Abdi, M. Optimal recloser and autosectionalizer allocation in distribution networks using IPSO–Monte Carlo approach. Int. J. Electr. Power Energy Syst. 2014, 55, 602–611. [Google Scholar] [CrossRef]
- Pombo, A.V.; Murta-Pina, J.; Pires, V.F. A multiobjective placement of switching devices in distribution networks incorporating distributed energy resources. Electr. Power Syst. Res. 2016, 130, 34–45. [Google Scholar] [CrossRef]
- Azarhazin, S.; Farzin, H.; Mashhour, E. An MILP model for reliability-based placement of recloser, sectionalizer, and disconnect switch considering device relocation. Sustain. Energy Grids Netw. 2023, 35, 101127. [Google Scholar] [CrossRef]
- Lwin, M.; Guo, J.; Dimitrov, N.; Santoso, S. Protective device and switch allocation for reliability optimization with distributed generators. IEEE Trans. Sustain. Energy 2018, 10, 449–458. [Google Scholar] [CrossRef]
- Wang, L.; Lin, J.; Liu, G.; Wang, G.; Zhong, Q.; Zhao, Y. An MIP-based model for the deployment of fault indicators and sectionalizing switches in distribution networks. Electr. Power Syst. Res. 2020, 179, 106076. [Google Scholar] [CrossRef]
- Alam, A.; Pant, V.; Das, B. Switch and recloser placement in distribution system considering uncertainties in loads, failure rates and repair rates. Electr. Power Syst. Res. 2016, 140, 619–630. [Google Scholar] [CrossRef]
- Derakhshandeh, S.Y.; Nikbakht, M. A new mixed-integer linear formulation for optimal placement of fault indicators in distribution systems. Int. Trans. Electr. Energy Syst. 2018, 28, e2631. [Google Scholar] [CrossRef]
- Ghorbani-Juybari, M.Z.; Gholizade-Narm, H.; Damchi, Y. Optimal recloser placement in distribution system considering maneuver points, practical limitations, and Recloser malfunction. Int. Trans. Electr. Energy Syst. 2022, 2022, 5062350. [Google Scholar] [CrossRef]
- Noruzi Azghandi, M.; Shojaei, A.A.; Toosi, S.; Lotfi, H. Optimal reconfiguration of distribution network feeders considering electrical vehicles and distributed generators. Evol. Intell. 2023, 16, 49–66. [Google Scholar]
- Hu, Z.; Su, R.; Veerasamy, V.; Huang, L.; Ma, R. Resilient frequency regulation for microgrids under phasor measurement unit faults and communication intermittency. IEEE Trans. Ind. Inform. 2024, 21, 1941–1949. [Google Scholar] [CrossRef]
- Parsadust, H.; Hajiabadi, M.E.; Lotfi, H.; Yazdi, S.B.; Baghishani, V. Locating Switches in Distribution Networks in order to Eliminate Peak load in Energy Management Program. In Proceedings of the 2024 28th International Electrical Power Distribution Conference (EPDC), Zanjan, Iran, 30 April–2 May 2024; pp. 1–7. [Google Scholar]
- Lotfi, H. Optimal sizing of distributed generation units and shunt capacitors in the distribution system considering uncertainty resources by the modified evolutionary algorithm. J. Ambient. Intell. Humaniz. Comput. 2022, 13, 4739–4758. [Google Scholar] [CrossRef]
- Azizivahed, A.; Lotfi, H.; Ghadi, M.J.; Ghavidel, S.; Li, L.; Zhang, J. Dynamic feeder reconfiguration in automated distribution network integrated with renewable energy sources with respect to the economic aspect. In Proceedings of the 2019 IEEE Innovative Smart Grid Technologies-Asia (ISGT Asia), Chengdu, China, 21–24 May 2019; pp. 2666–2671. [Google Scholar]
Disclaimer/Publisher’s Note: The statements, opinions and data contained in all publications are solely those of the individual author(s) and contributor(s) and not of MDPI and/or the editor(s). MDPI and/or the editor(s) disclaim responsibility for any injury to people or property resulting from any ideas, methods, instructions or products referred to in the content. |
© 2025 by the authors. Licensee MDPI, Basel, Switzerland. This article is an open access article distributed under the terms and conditions of the Creative Commons Attribution (CC BY) license (https://creativecommons.org/licenses/by/4.0/).