Abstract
This study introduces a Textile Image Processing Algorithm (TIPA) designed to detect defects in conductive textiles, a crucial element of wearable technology. TIPAs employ image preprocessing, filtering, and classification to identify issues like uneven distribution of conductive particles. When applied to fabrics produced via dip-coating, our TIPA was optimized using a threshold ratio, achieving over 85% accuracy, with a maximum of 100% under ideal conditions. However, detection challenges were noted in fabrics with large, diffuse stains, particularly at extreme threshold ratios. This TIPA proves to be a valuable tool for improving quality control in smart textiles, with potential for further optimization.
1. Introduction
Conductive textiles, which have gained attention as soft smart materials [1,2], are fusion materials used in various wearable products due to their ability to measure a range of biometric data [3,4], including heart rate [5], respiration [6,7], movement [6], voice [8], and pulse [9]. The mechanical properties of conductive textiles maintain the physical characteristics of traditional textiles, making them flexible [10], lightweight [11], and stretchable [12]. Conductive particles that are processed in textiles determine their electrical properties [10]. When they mechanically deform under external forces, their electrical properties are changed by changes in the distribution of conductive particles and the structure of the circuits. This property enables the measurement of parameters such as pressure and strain, facilitating the acquisition of diverse biometric information in the wearable technology field.
The manufacturing process of conductive textiles typically involves two main approaches. The first involves treating fibers with conductive particles at the fiber scale to produce the textile, or imparting conductivity by treating a textile with suitable mechanical properties using conductive particles [13]. The second approach, particularly the dip-coating method, which involves using a solution with dispersed conductive particles, is advantageous as it allows for the use of textiles with appropriate physical properties and can be applied in continuous processes such as roll-to-roll manufacturing [3,14]. However, textiles produced through this method may suffer from defects similar to those observed in dyeing processes, where uneven distribution of particles can result in blemishes or streaks (Figure 1).
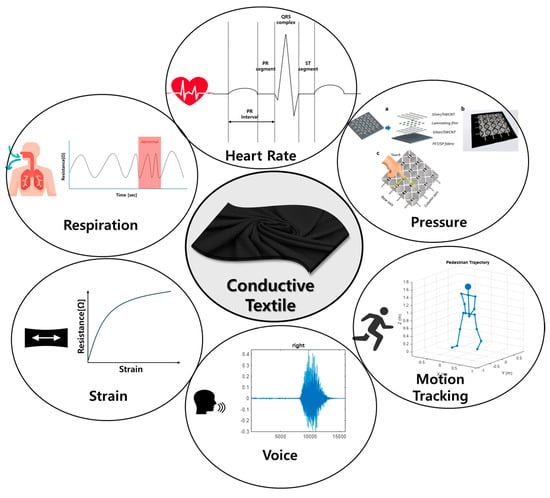
Figure 1.
Conductive textile in wearable sensor.
The defects of dip-coated conductive textiles are particularly evident with common conductive particles such as carbon nanotubes (CNT) and Mxene, both of which are carbon-based and impart a black color to the textile [15,16,17,18]. One of the primary concerns of defects is the uneven distribution of conductive particles, which can lead to localized variations in electrical resistance. Such inconsistencies may result in signal distortions, reduced conductivity, and, in extreme cases, circuit discontinuities that impair the textile’s sensing and actuation capabilities. Therefore, in the field of wearable technology, where precise signal transmission and control are essential, defects in conductive textiles directly lead to product malfunctions. To address this issue, this study aims to develop an image processing algorithm specifically tailored for detecting defects in conductive textiles, ensuring their reliability and functionality in wearable applications.
Due to recent advancements in computational capabilities, the development of machine learning (ML) [19], particularly in the area of image processing algorithms (IPA) using two-dimensional and three-dimensional images [20,21], has made it possible to replace humans in many fields. Specifically, in the quality inspection sector of textile manufacturing [22,23,24,25], cameras and various algorithms can now replace the human eye and brain to detect and classify defects.
However, textile materials, due to their diverse weaving methods, patterns, and colors, present significant challenges for feature extraction in images [15,26,27]. There are various types of defects in conductive textiles, including missing yarn, broken ends, needle lines, spots, stains, holes, press-off, mixed yarn, and gouts [28]. Of these, this study focuses specifically on stains defects. While other types of defects often occur during the textile manufacturing process or result from physical damage during use, changes in electrical properties that hinder resistance measurement typically manifest as stains or irregular patterns. Therefore, stain defects are particularly critical for assessing the functional integrity of conductive textiles [29,30].
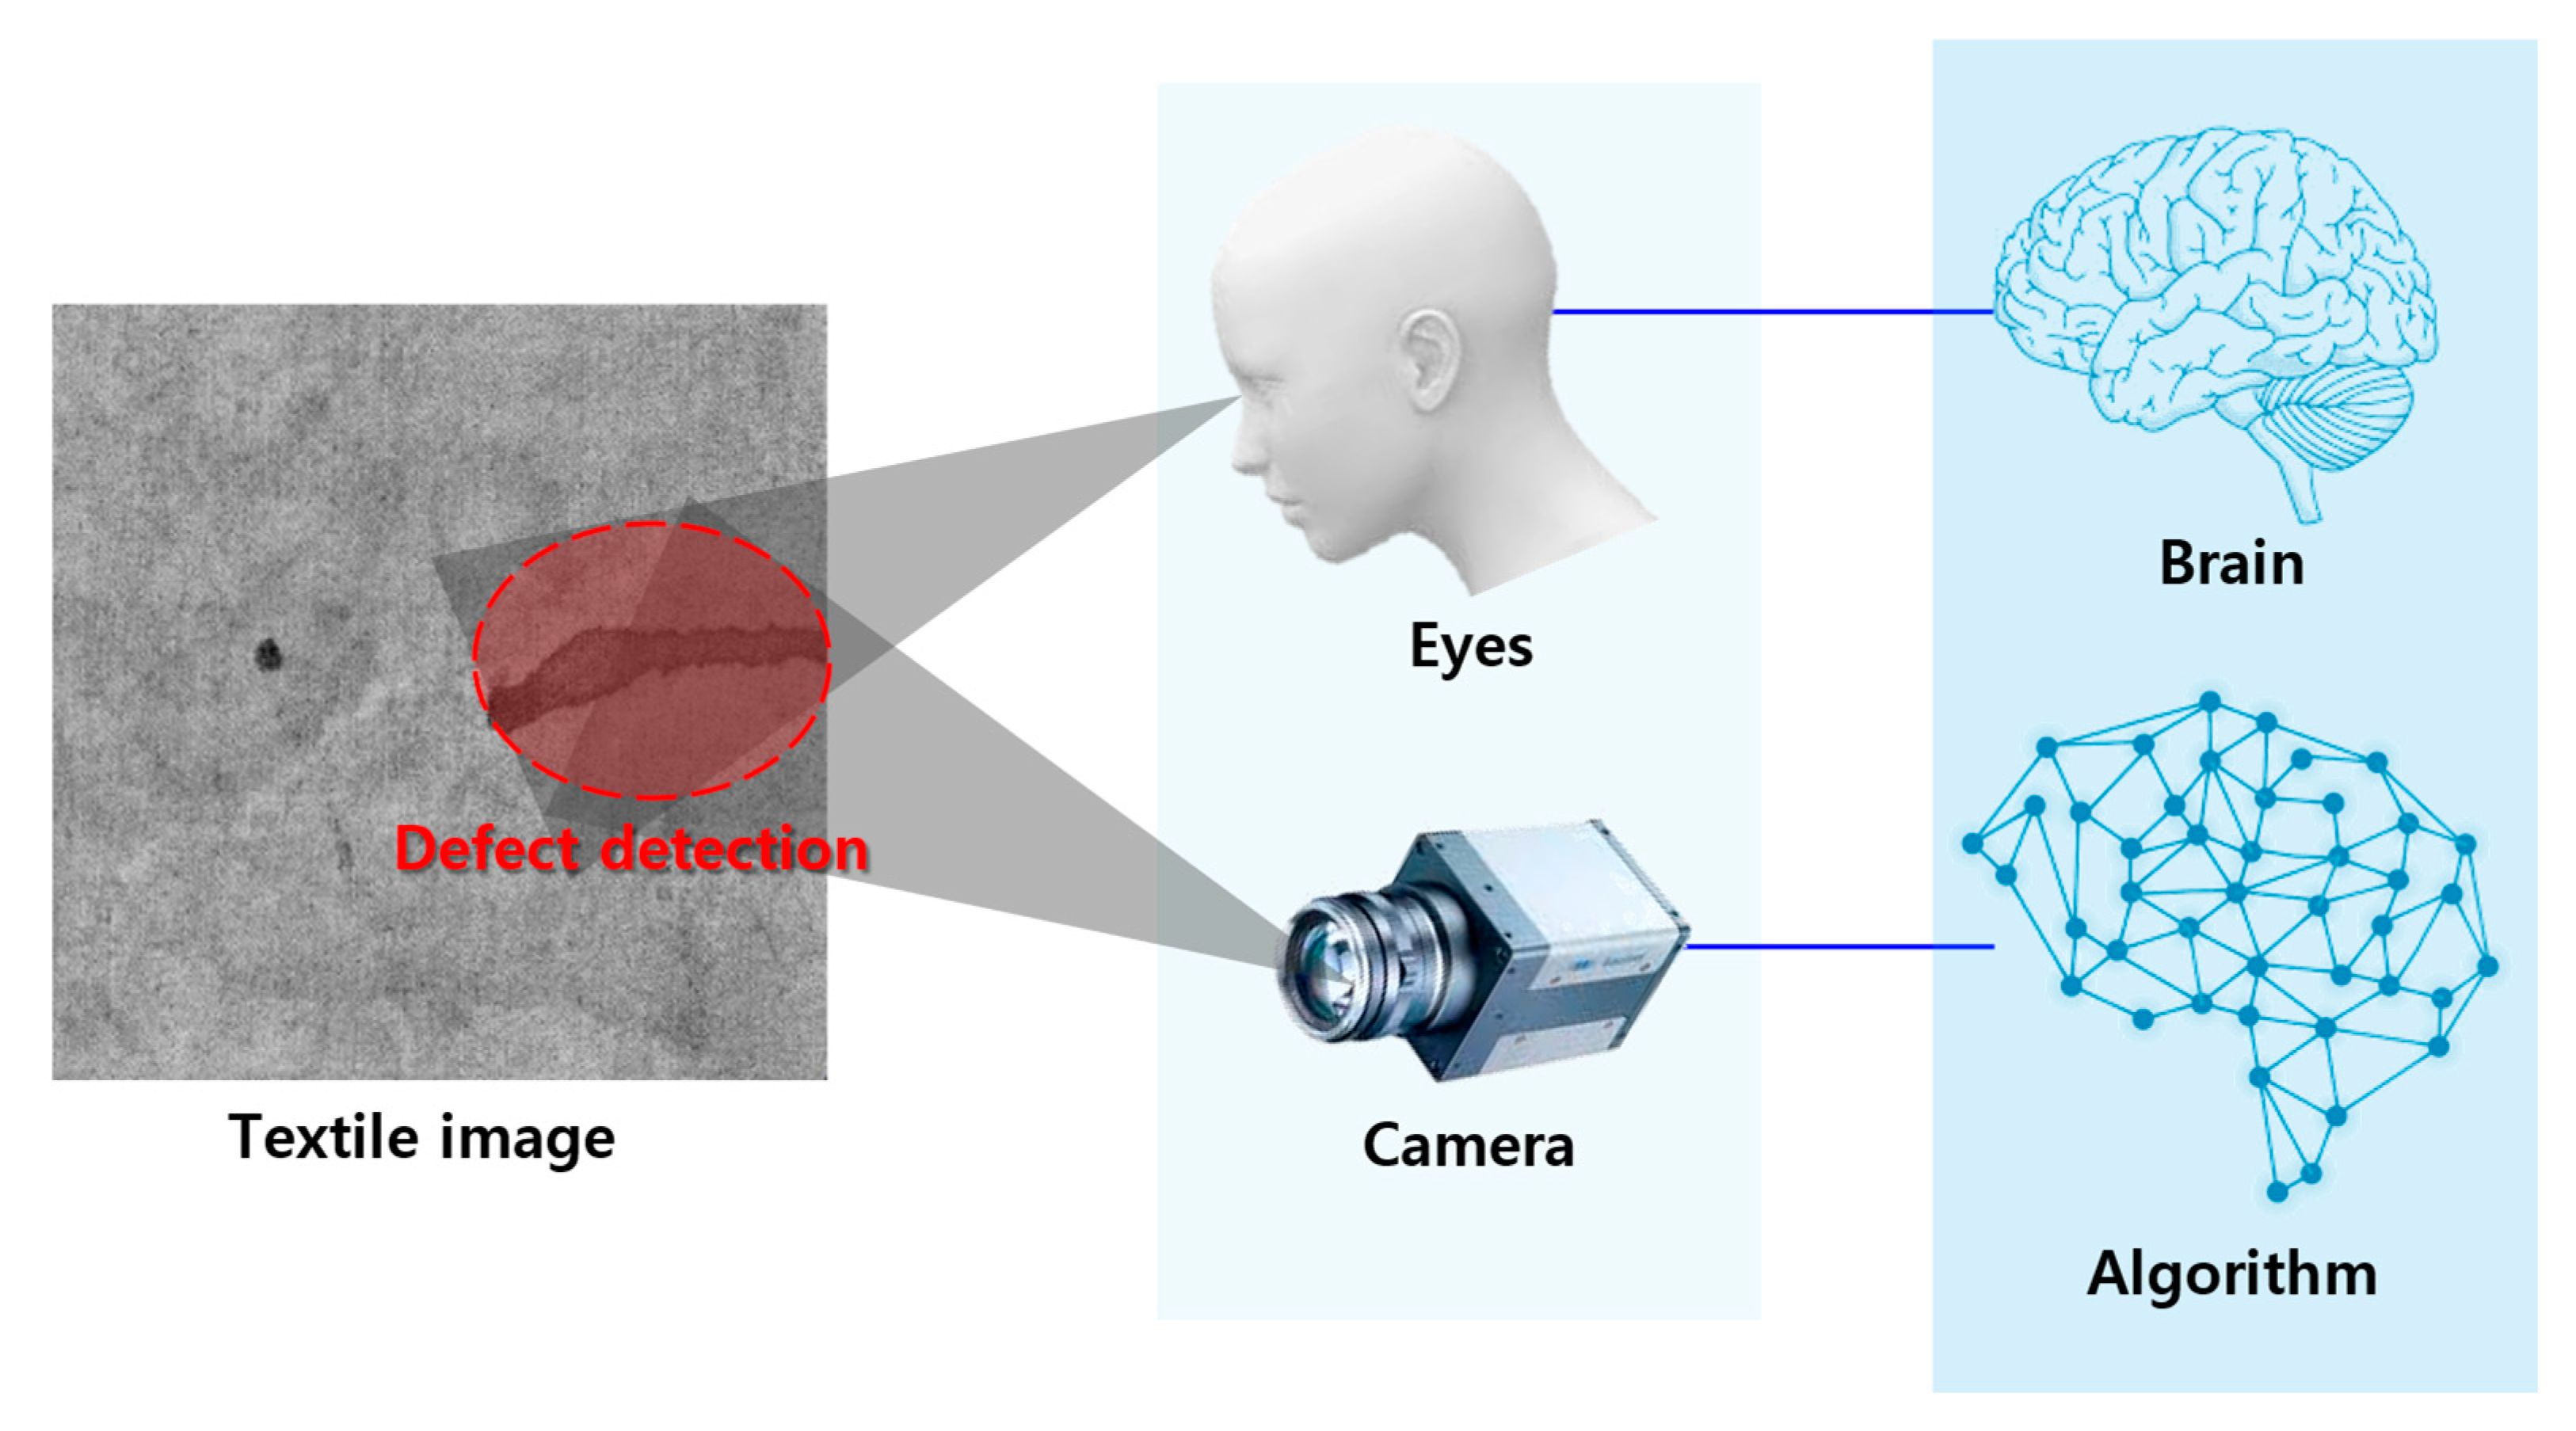
Since the detection of stains through textile image processing algorithms (TIPAs) requires a precise definition of defects, threshold-based methods serve as a fundamental approach in defect detection [31,32]. Moreover, these thresholds act as a critical variable that directly influences the overall accuracy of TIPAs. Setting a standardized reference value in image data is inherently challenging, necessitating various preprocessing techniques and adaptive thresholding methods [33]. For instance, in the case of the textiles produced through the dip-coating process during this study, the degree of darkness varies depending on the penetration level of conductive particles. As a result, simply classifying areas as stains based solely on brightness or darkness could lead to misjudging the entire conductive fabric as defective (Figure 2).
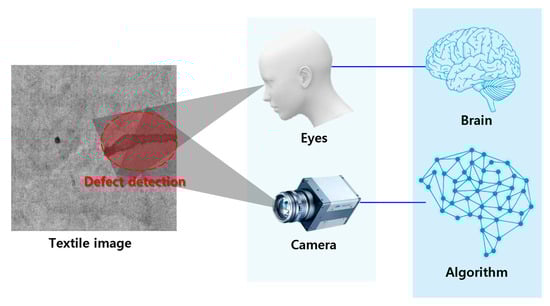
Figure 2.
Defect detection through humans and through Textile Image Processing Algorithms.
One study proposed a TIPA that uses an encoder–decoder structure to detect defects in textiles, employing image preprocessing techniques such as dilation, median filtering, and edge detection to identify defects [34]. Another study utilized wavelet functions to improve detection performance by identifying coefficients from defect-free textiles and optimizing them through a subset selection using a genetic algorithm [35]. Additionally, another study demonstrated superior detection performance by addressing low performance in detecting defects of various shapes and sizes using histogram and threshold-setting techniques [36,37,38]. These examples underscore the importance of strategic structuring and optimization in TIPAs for effective image processing.
Overall, the objective of this study is to develop a Textile Image Processing Algorithm (TIPA) capable of detecting stain defects, which are caused by the agglomeration of conductive particles during the manufacturing process of conductive textiles, that lead to non-uniformity resistance. To achieve this, histogram equalization is employed as a preprocessing step to enhance contrast, enabling defect detection across various brightness conditions of conductive textiles. The algorithm’s structure includes a multi-step detection process based on defect size, which is optimized by fine-tuning the threshold ratio. The first filtering step is designed to classify whether an image belongs to the normal or defective category by analyzing the spatial distribution of defect-suspect pixels. The second filtering step, on the other hand, specifically aims to detect and isolate abnormal regions within defective images, ensuring that only significant defect areas are identified while minimizing false positives from minor variations or noise. The final evaluation is conducted on 22 conductive textile samples fabricated through the dip-coating process.
2. Materials and Methods
2.1. Fabrication of Conductive Textile by Dip-Coating Process
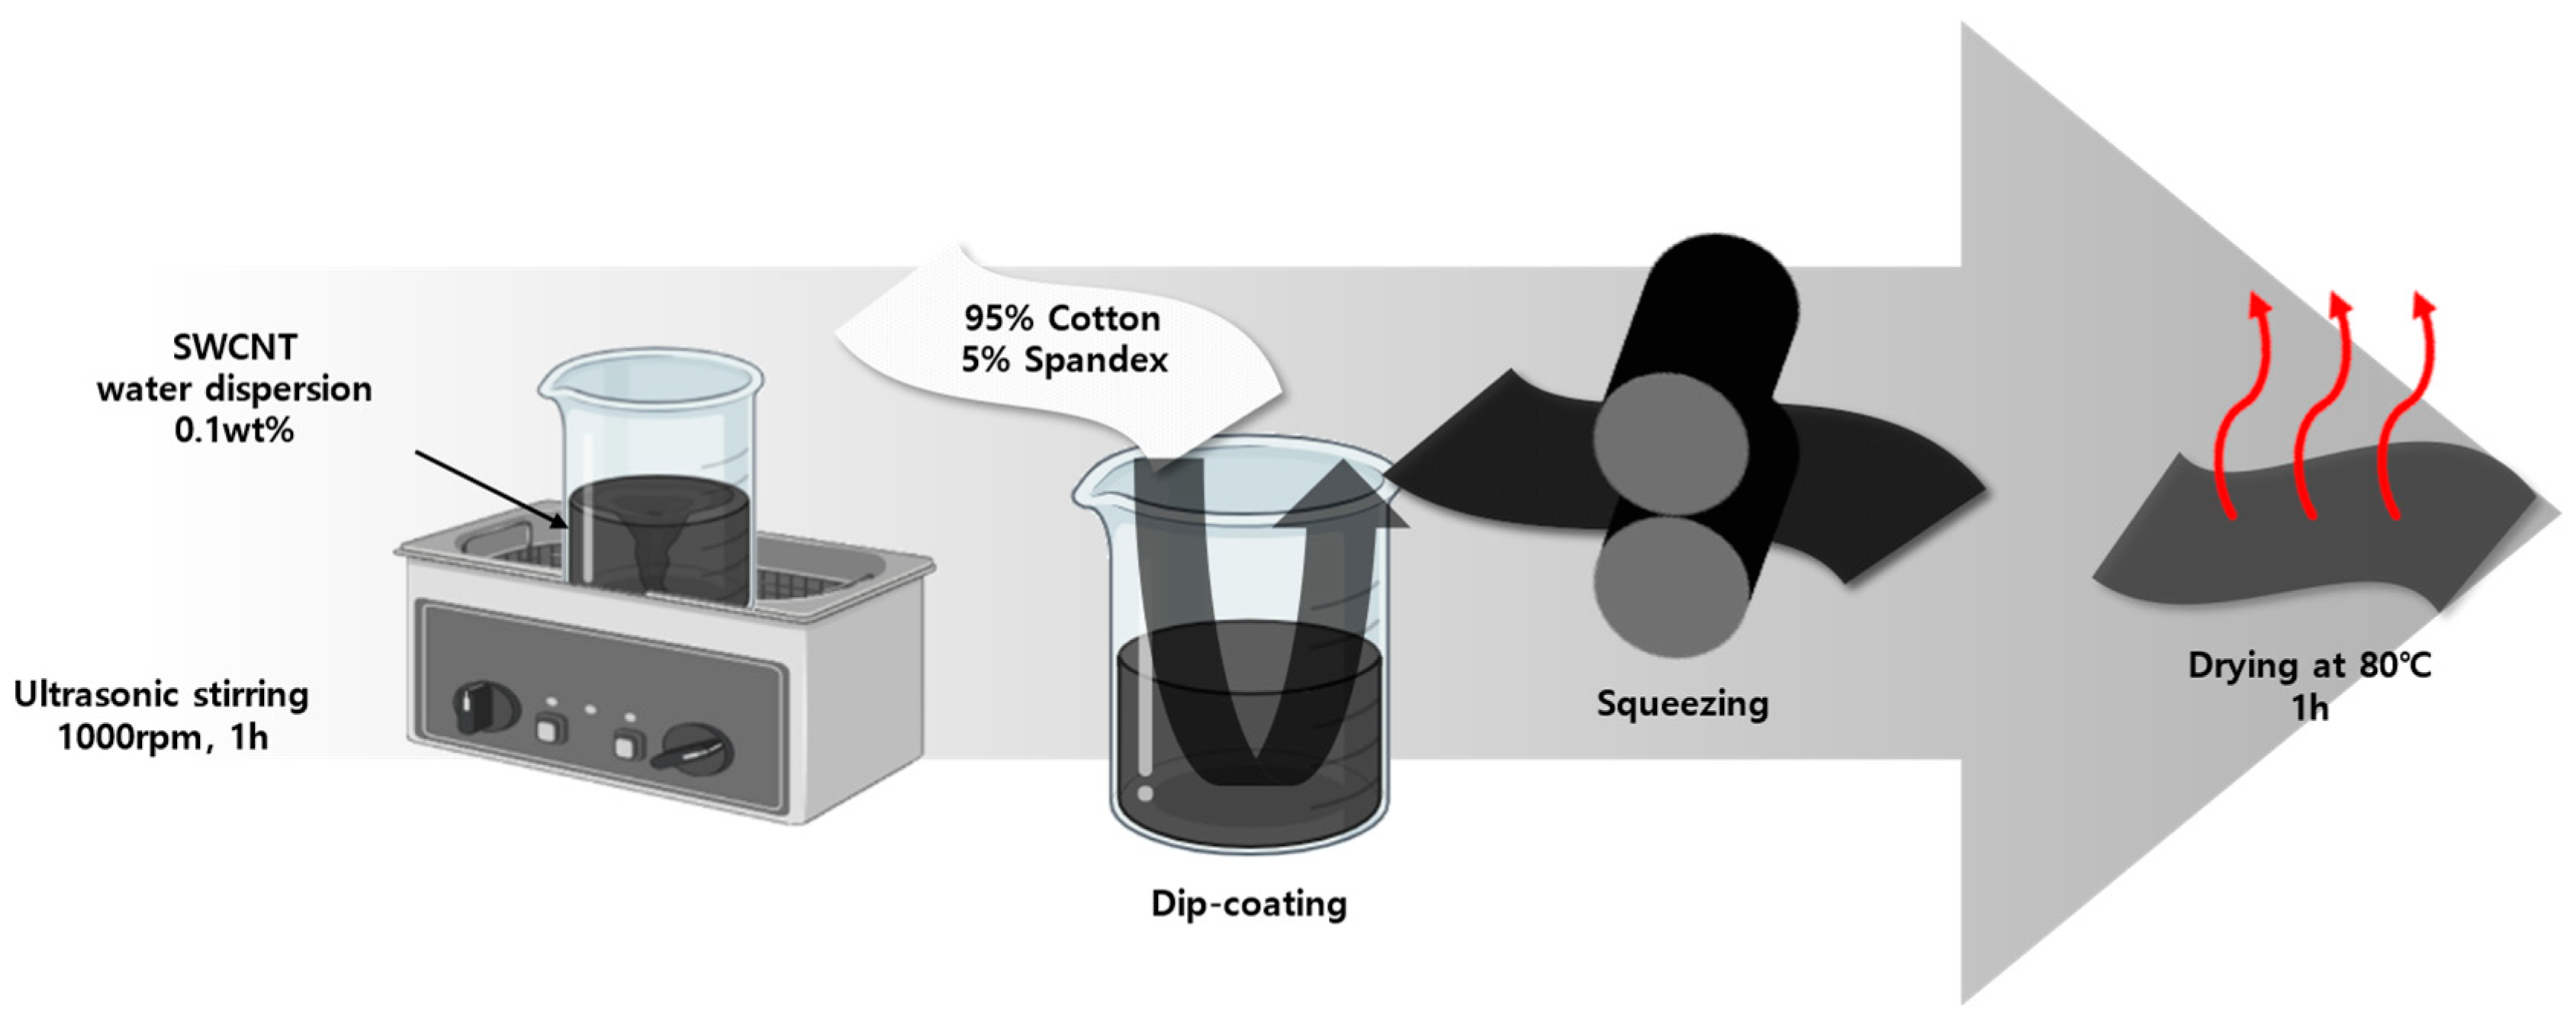
The dip-coating process for manufacturing conductive textiles was conducted based on the fabrication procedures referenced in studies utilizing conductive fabrics. As illustrated in Figure 3, this process was implemented accordingly [15]. A 0.1 wt% aqueous dispersion of Single-Walled Carbon Nanotubes (SWCNT) (WART1200, KORBON Co., Ltd., Gangneung, Republic of Korea) was prepared by ultrasonically dispersing the solution at 1000 rpm for 1 h. The fabric used for dip-coating was a stretchable fabric consisting of 95% cotton and 5% spandex, with dimensions of 300 cm × 300 cm. This fabric was immersed in the 0.1 wt% SWCNT aqueous dispersion, followed by squeezing with a padding machine to ensure uniform coating. The coated fabric was then dried in an oven at 80 °C for 10 min to evaporate the water solvent, taking care to avoid boiling.
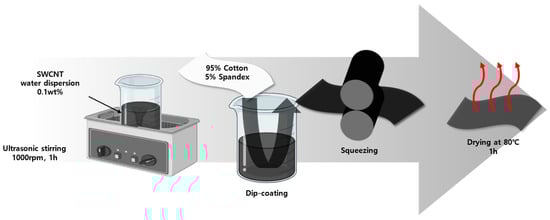
Figure 3.
Dip-coating process of conductive textile fabrication.
The image files of conductive fabrics for the TIPA to be used on were produced using a consistent light source to prevent distortions caused by factors such as lighting, shadows, and lens effects. This was achieved by utilizing the scanner of a printer (LaserJet Pro MFP M428fdw, HP Korea Inc., Seoul, Republic of Korea.), which features an optical resolution of up to 1200 × 1200 dpi and a fixed focal distance optimized for contact image sensor (CIS) technology. The scanning process was performed with a maximum scan size of 216 × 297 mm (flatbed) and 216 × 356 mm (ADF), ensuring precise image acquisition for defect detection. To clearly distinguish between defect pixels and non-defect pixels, the images were saved in PNG format, which allows for minimal image loss due to its low compression ratio. The final image files were secured at a resolution of 1440 × 1440 pixels. A total of 22 conductive fabric image files were obtained, consisting of 15 normal images without defects and 7 images with defects. Figure 4 presents two representative normal images and two defect images from this collection.
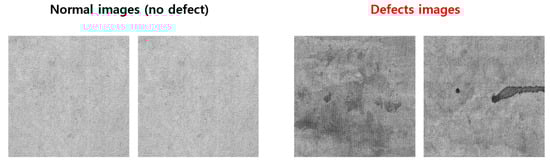
Figure 4.
Images of normal conductive textile and textile with defects.
2.2. Textile Image Processing Algorithm (TIPA) for Defect Detection
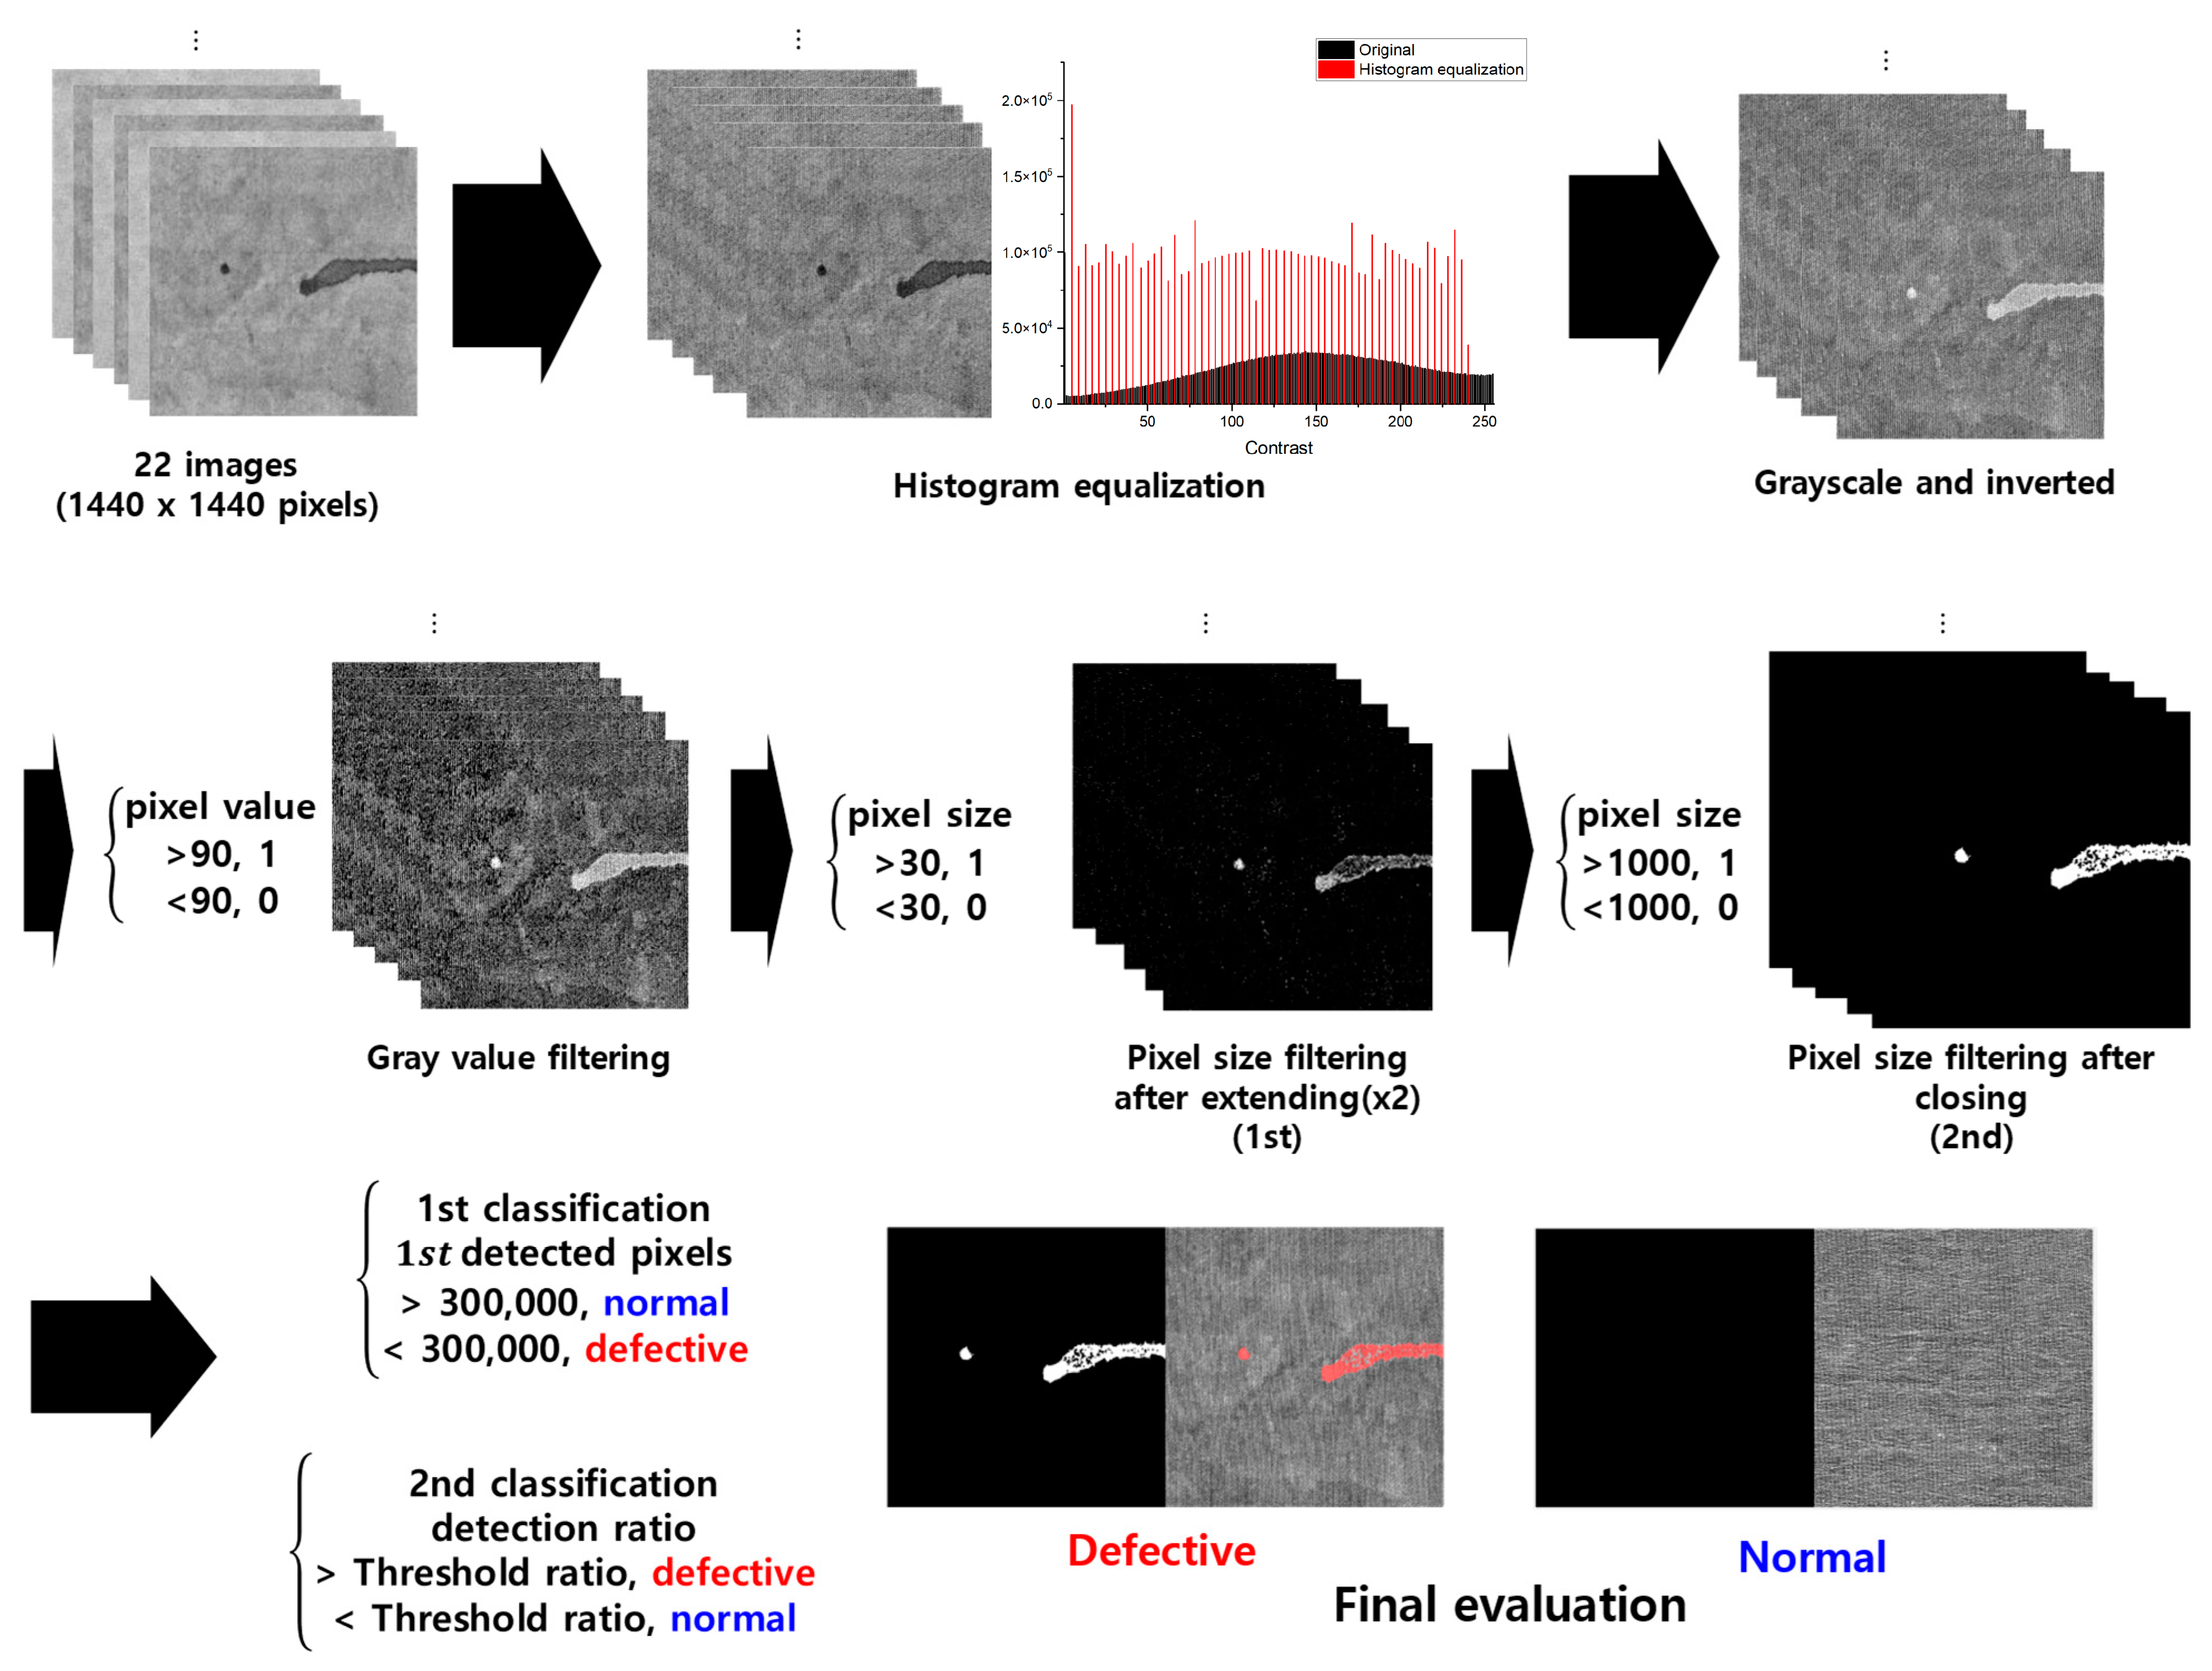
To detect defects in the conductive fabric produced via the dip-coating process, a TIPA was designed, as illustrated in Figure 5. All steps of the TIPA were implemented using MATLAB 2023a to preprocess images and detect defects in each conductive textile image. The first step involved preprocessing the images, where histogram equalization was applied to smooth out the contrast. The histogram equalization involves calculating the cumulative distribution function (CDF) of the input image and using it to remap the pixel values to improve the contrast of the image. The mathematical equation of histogram equalization can be expressed as follows:
where the r is original pixel value, L is the 256 of the 8-bit images in this study, is the frequency of pixel value k, and N is the total number of pixels. In our TIPA, histogram equalization was performed using a MATLAB function. Histogram equalization was employed to enhance the contrast of the image by normalizing the histogram of pixel intensity values. This process involved measuring the occurrence frequency k of each pixel intensity, standardizing the histogram, and replacing each pixel value with its corresponding relative proportion. Subsequently, the cumulative distribution function (CDF) was utilized to compute and map the pixel values to new intensity levels, ensuring a more uniform distribution across the image.

Figure 5.
TIPA process using conductive textile images.
Grayscale conversion was performed using a MATLAB function, and the coefficients used for calculating the grayscale value were rounded to three decimal places. These values correspond to those specified in Rec. ITU-R BT.601-7 for computing luminance (gray value), which are as follows:
These coefficients are widely adopted for grayscale conversion in image processing to ensure accurate luminance representation, particularly in video and image standardization processes.
The grayscale values, which range from 0 to 255, were binarized with a threshold set at 90. This threshold was chosen to represent approximately one-third of the full grayscale range, effectively excluding the most definitive background values while ensuring the detection of all potential defect areas. However, since the binarized values alone are not sufficient to accurately define defects, the pixels were expanded by doubling their width and height to enhance defect visibility and improve detection accuracy.
Primary size filtering was conducted with a threshold set at 30 after the pixel expansion step. This threshold was chosen based on the observation that, in defect images with high grayscale contrast, defect-suspect pixels tend to be spatially clustered, whereas in normal images, pixels are more evenly distributed. Upon expansion, defect pixels are more likely to connect, whereas isolated pixels remain sparse. Therefore, if the number of connected pixels is three or fewer, they are considered part of the background and filtered out. This step effectively reduces false positives by removing small, non-defect-related variations. Subsequently, gaps between defective regions were filled to enhance connectivity before secondary size filtering was performed with a threshold set at 1000 pixels. This threshold serves as a criterion to distinguish actual stains from random small spots, ensuring that only sufficiently large defect regions are classified as stains while filtering out minor noise or non-significant small defects.
The purpose of this TIPA, which is to detect defect areas and evaluate quality, was first approached by classifying images as normal or defective based on the number of pixels detected after primary size filtering. Specifically, the number of 1st detected pixels was compared to the threshold, which is 300,000 pixels, which comprised about 15% of the total pixel count of the image. This classification leverages the observation that more uniform fabrics tend to have a higher count of 1st detected pixels. Subsequently, the ratio of the number of 1st detected pixels to the number of 2nd detected pixels (obtained after secondary size filtering) was calculated as follows:
This ratio was then used to perform a second classification based on a threshold ratio. The threshold ratio in this TIPA was optimized to distinguish between defective and normal images, and the detected white defects were compared with actual defects in the images to verify accuracy, with discrepancies highlighted in red.
3. Results
3.1. Preprocessing Images in TIPA
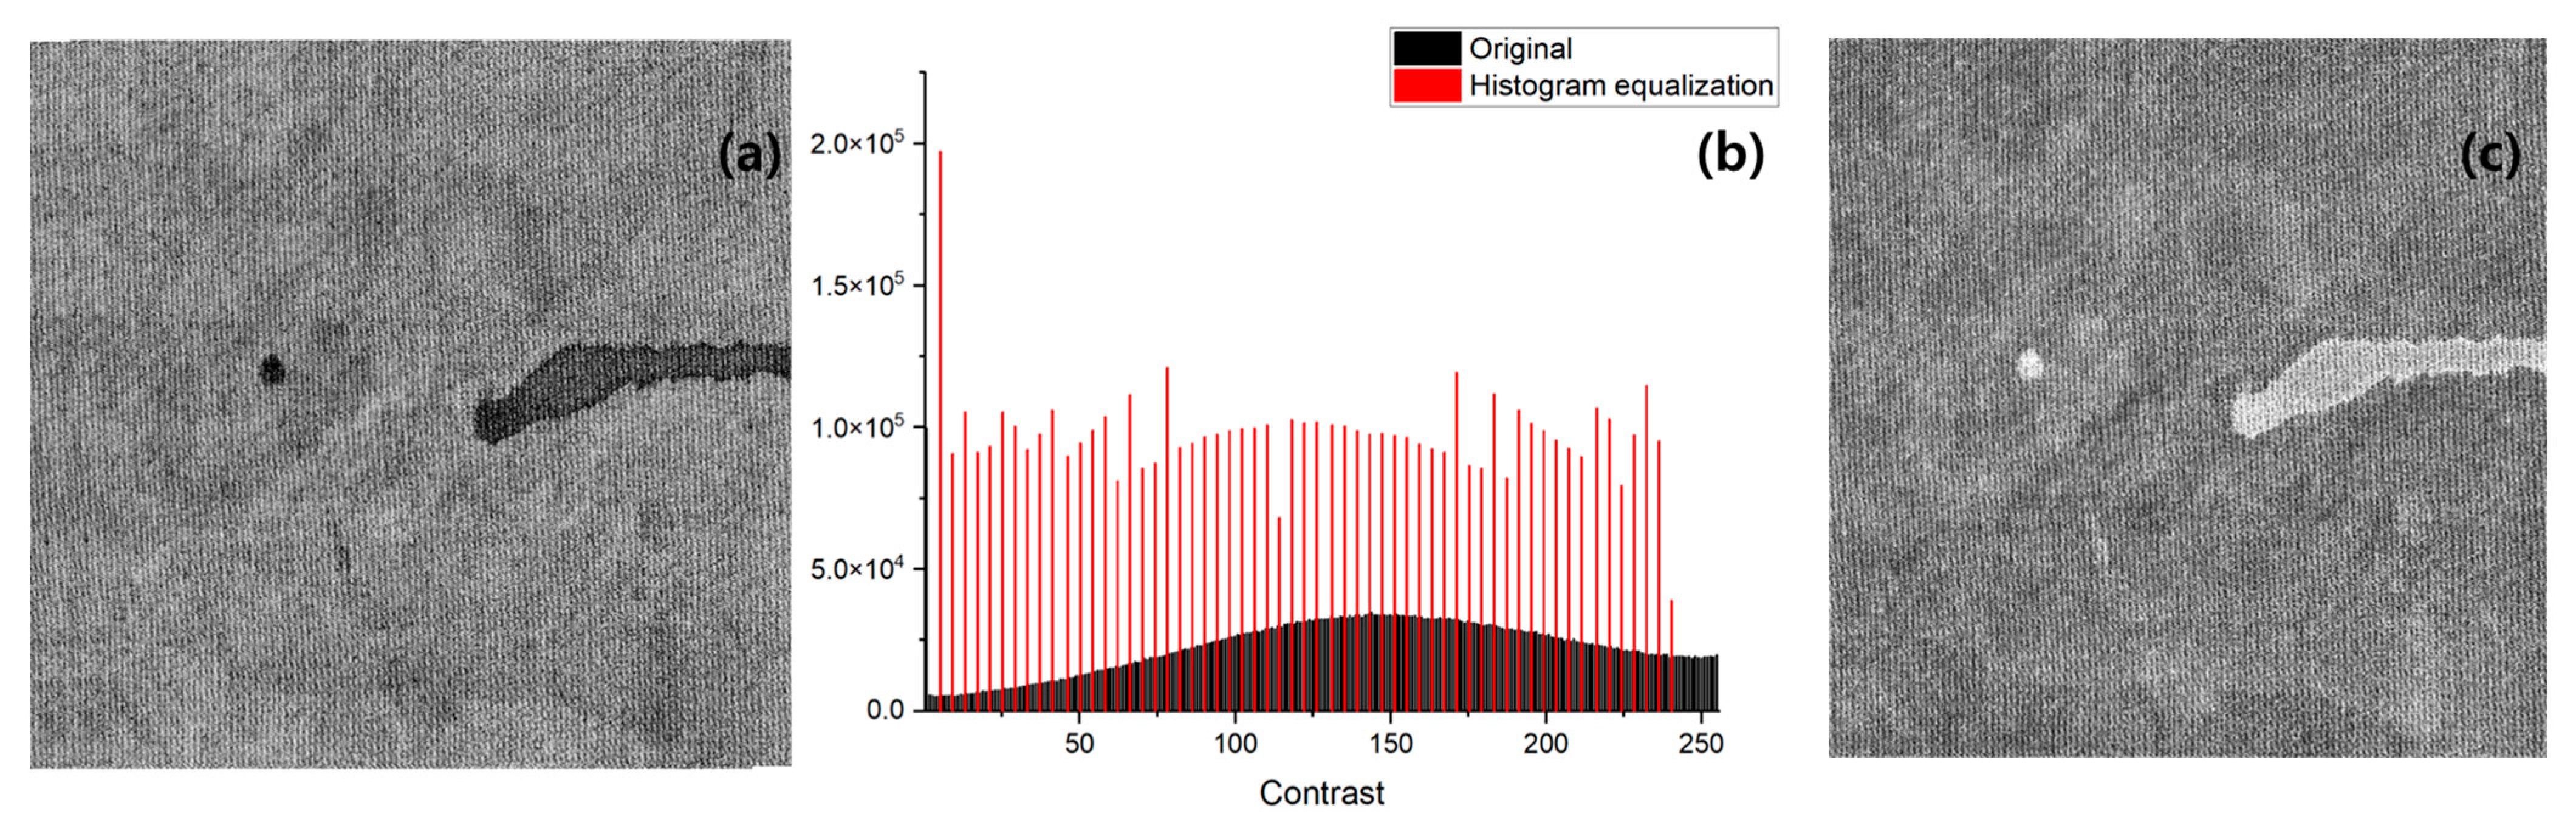
The purpose of the preprocessing step is to maximize the continuous tonal values to improve the accuracy of defect detection. Figure 6a,b illustrate the preprocessing process of our TIPA before it was applied to a representative conductive fabric containing defects, showing a comparison between the histogram-equalized image and the original image. By examining the contrast values and the histogram after equalization, it is possible to observe a peak value in the dark contrast areas where the defects are detected. This indicates that the subsequent filtering step, which is based on pixel values and size, can be effectively performed.
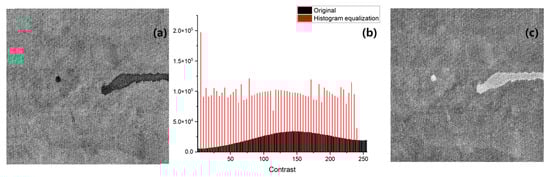
Figure 6.
Images of preprocessing results for defective conductive textile: (a) histogram equalization image; (b) comparison of original and histogram equalization results; (c) grayscale image with inverted pixel values.
Based on this analysis, Figure 6c presents the grayscale conversion, where the RGB values have been removed, followed by an inversion of the image to facilitate easier defect detection.
3.2. Filtering Images in TIPA
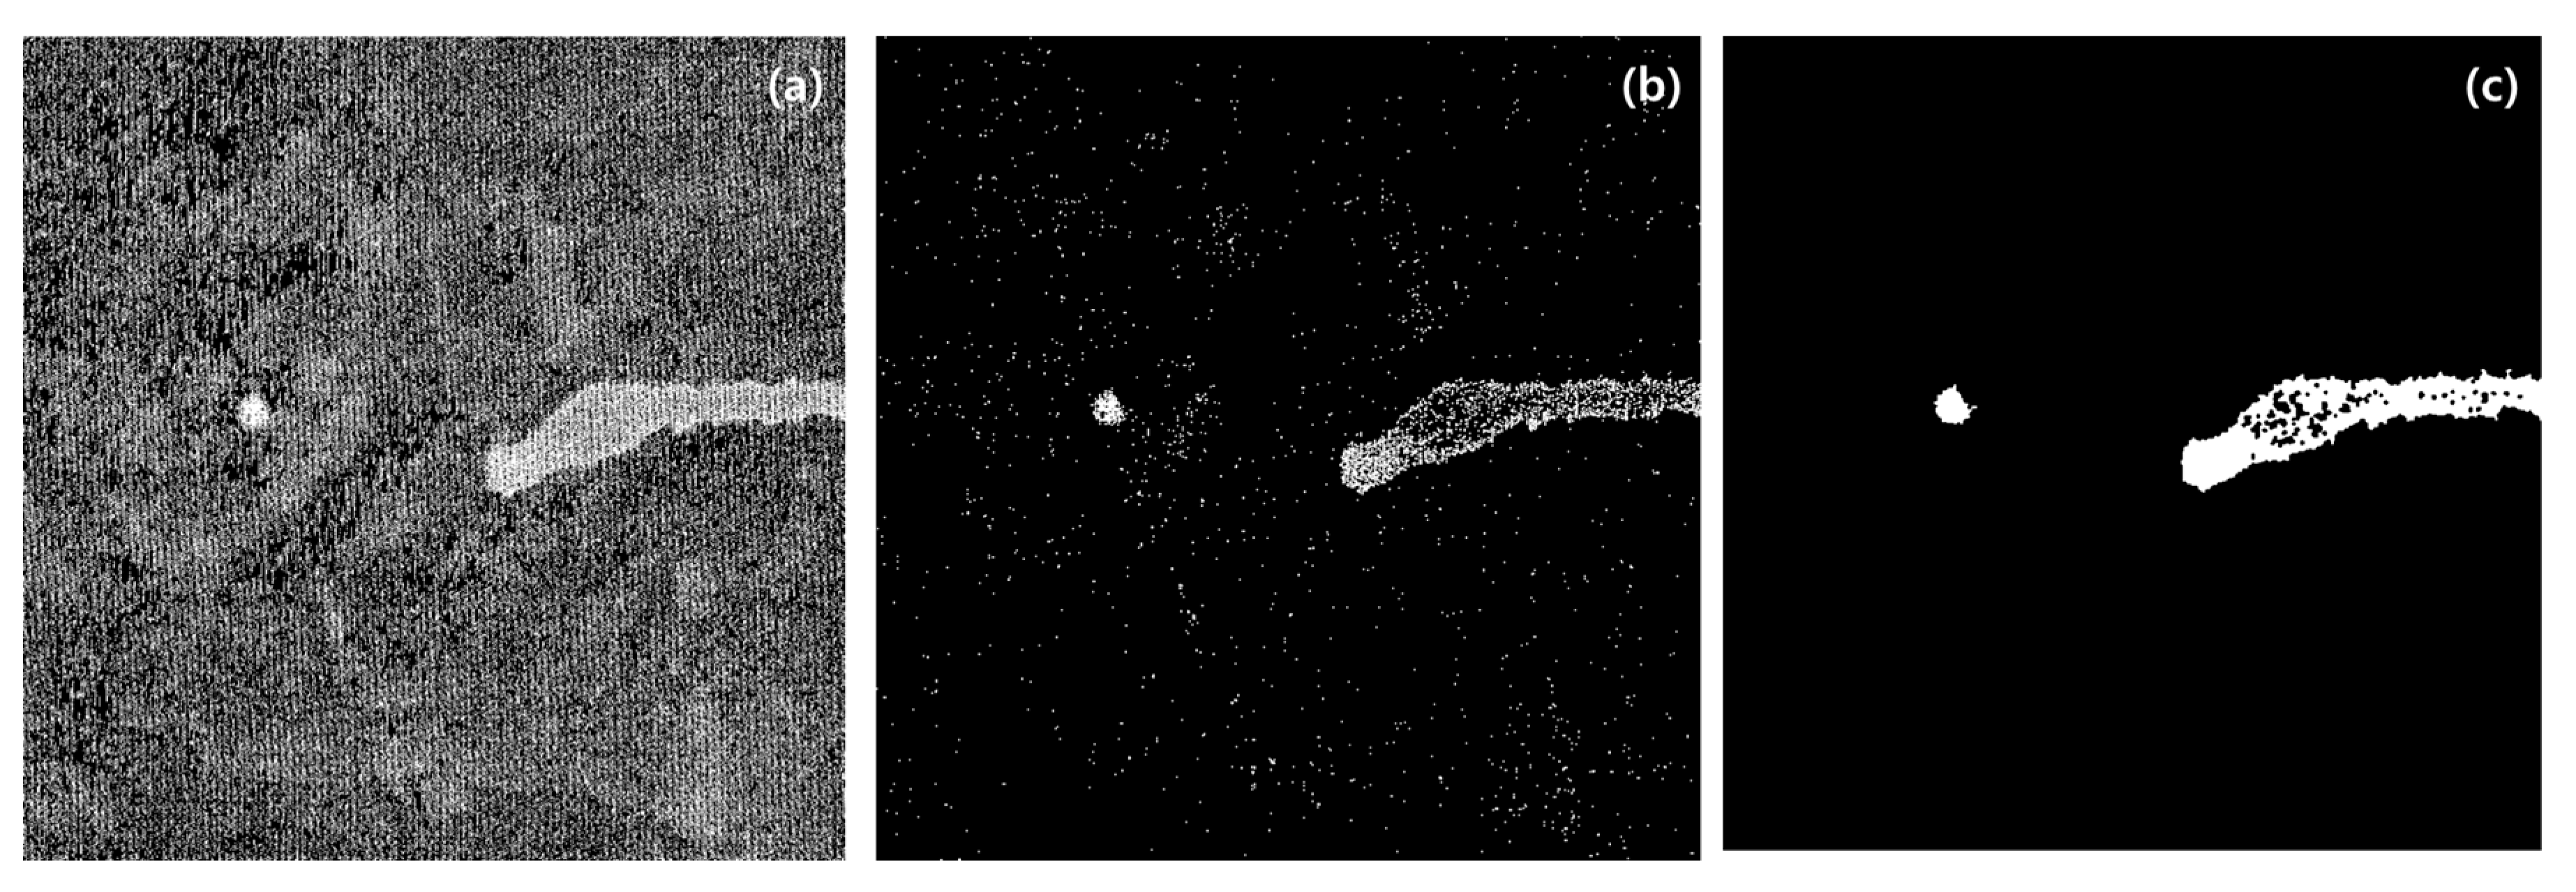
Figure 7 illustrates the filtering results and the process of defect detection in our TIPA. Figure 7a shows the binarization filtering, where pixels are divided based on a threshold of 90 within the grayscale range of 0 to 255. The white areas represent pixels that are potential defects. While stains defined as defects in the conductive fabric are visible, many uniform fabric pixels also appear white, indicating that the binarization alone is insufficient for accurate defect detection. Figure 7b presents the results after expanding the filtered pixels by doubling their width and height, followed by size filtering based on a size threshold of 30. This process effectively filters out a significant number of pixels, leaving behind most of the stained areas. However, some of the stained pixels are still filtered out, indicating the need for additional processing. Figure 7c shows the results after a secondary size filtering process, where the edge pixels have been expanded into a circular shape with a radius of four pixels, followed by size-based filtering with a threshold of 1000 pixels. Ultimately, all non-defective pixels are removed, and the defect areas are largely filled, confirming the effectiveness of the filtering process.

Figure 7.
Images of filtering results for defective conductive textile: (a) pixel value filtering; (b) 1st pixel size filtering; (c) 2nd pixel size filtering.
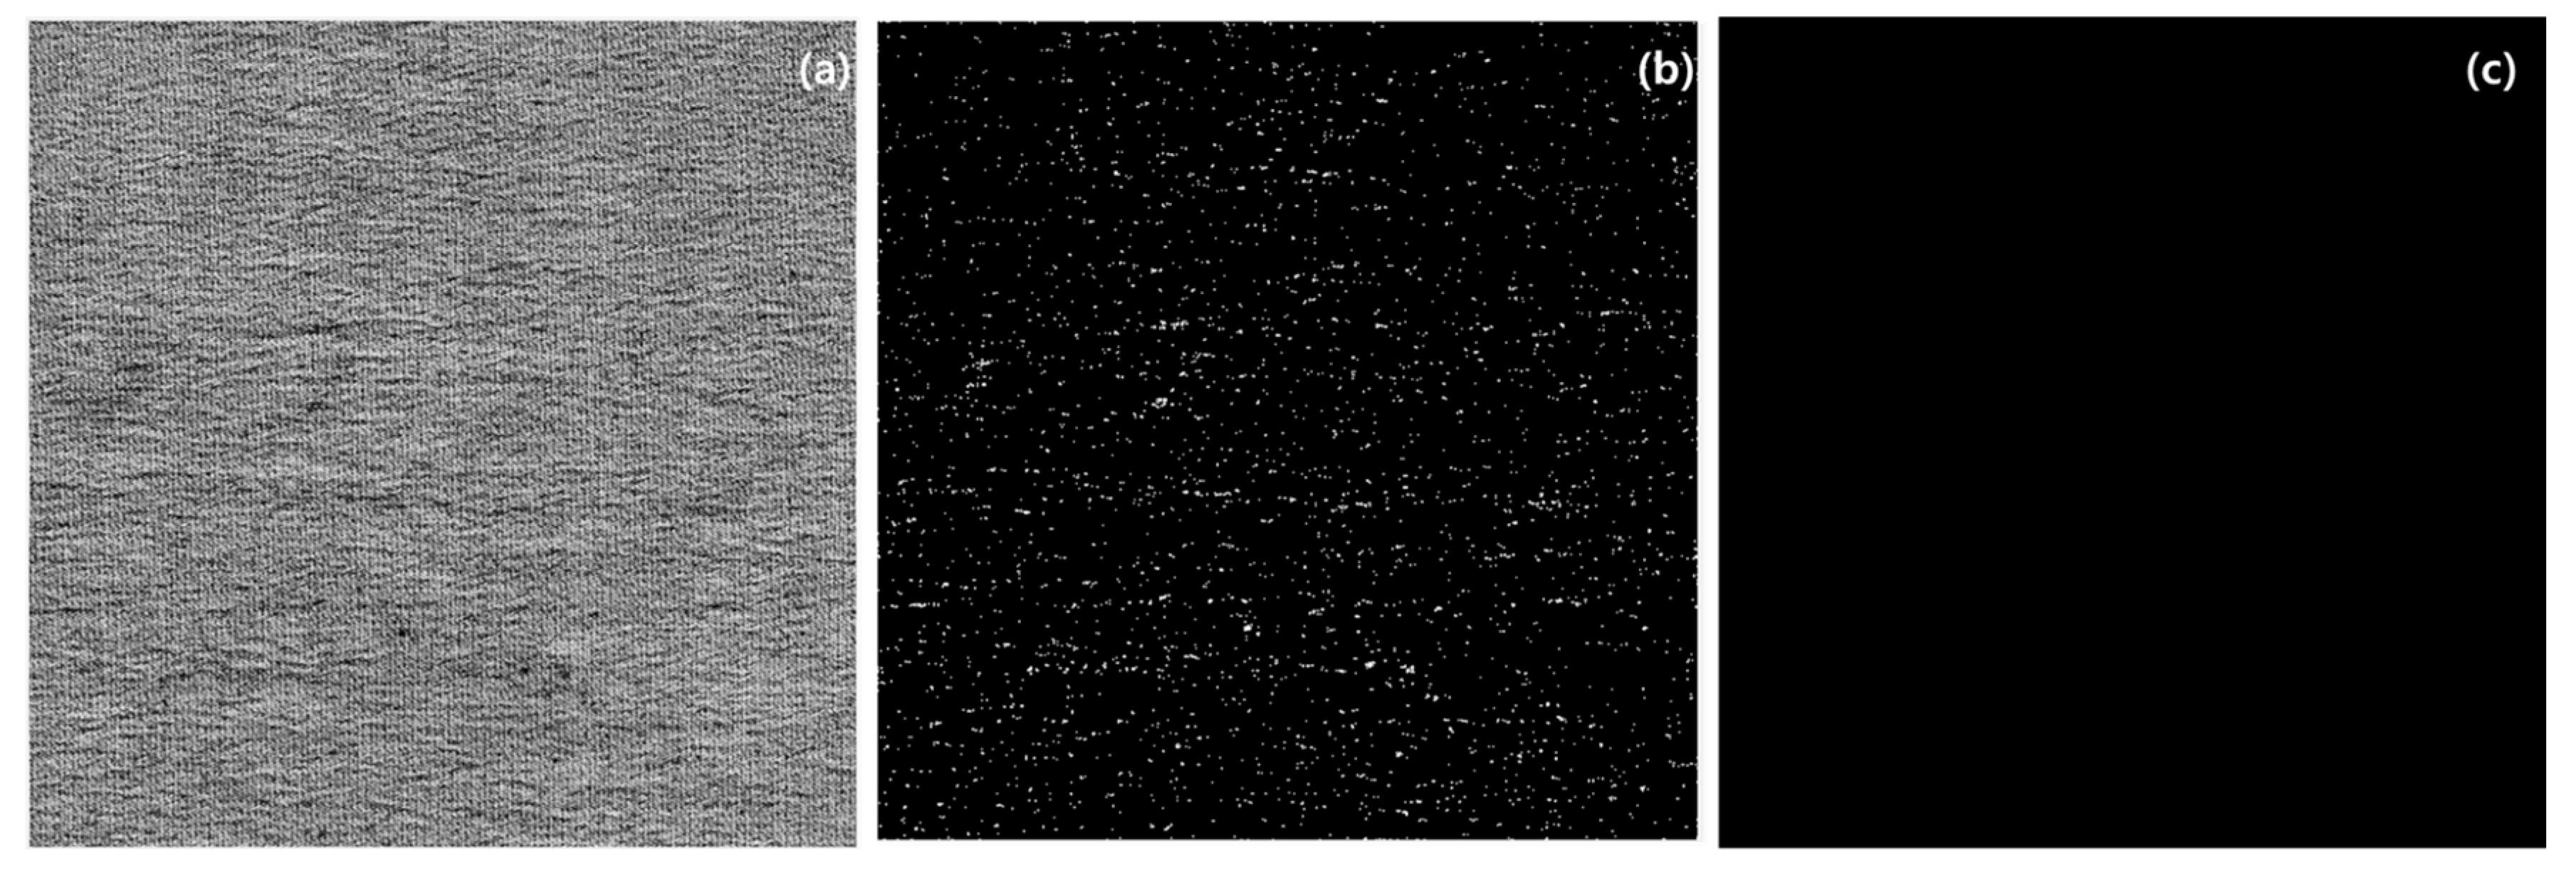
Figure 8a shows the original image of a normal conductive textile with uniformly distributed conductive particles. Figure 8b presents the result after the first filtering stage of the TIPA. At this stage, numerous isolated pixels are detected, but they do not form any discernible pattern of stains and are uniformly distributed. After the second filtering stage, shown in Figure 8c, no pixels are detected, indicating that the fabric is defect-free and classified as normal.
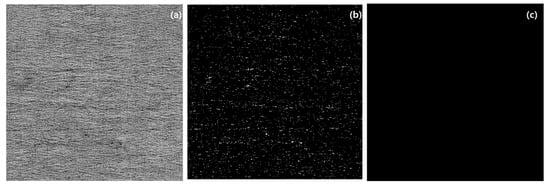
Figure 8.
Images of TIPA results for normal conductive textile: (a) original image; (b) 1st pixel size filtering; (c) 2nd pixel size filtering.
3.3. Evaluation and Optimization of Conductive Textile Using TIPA
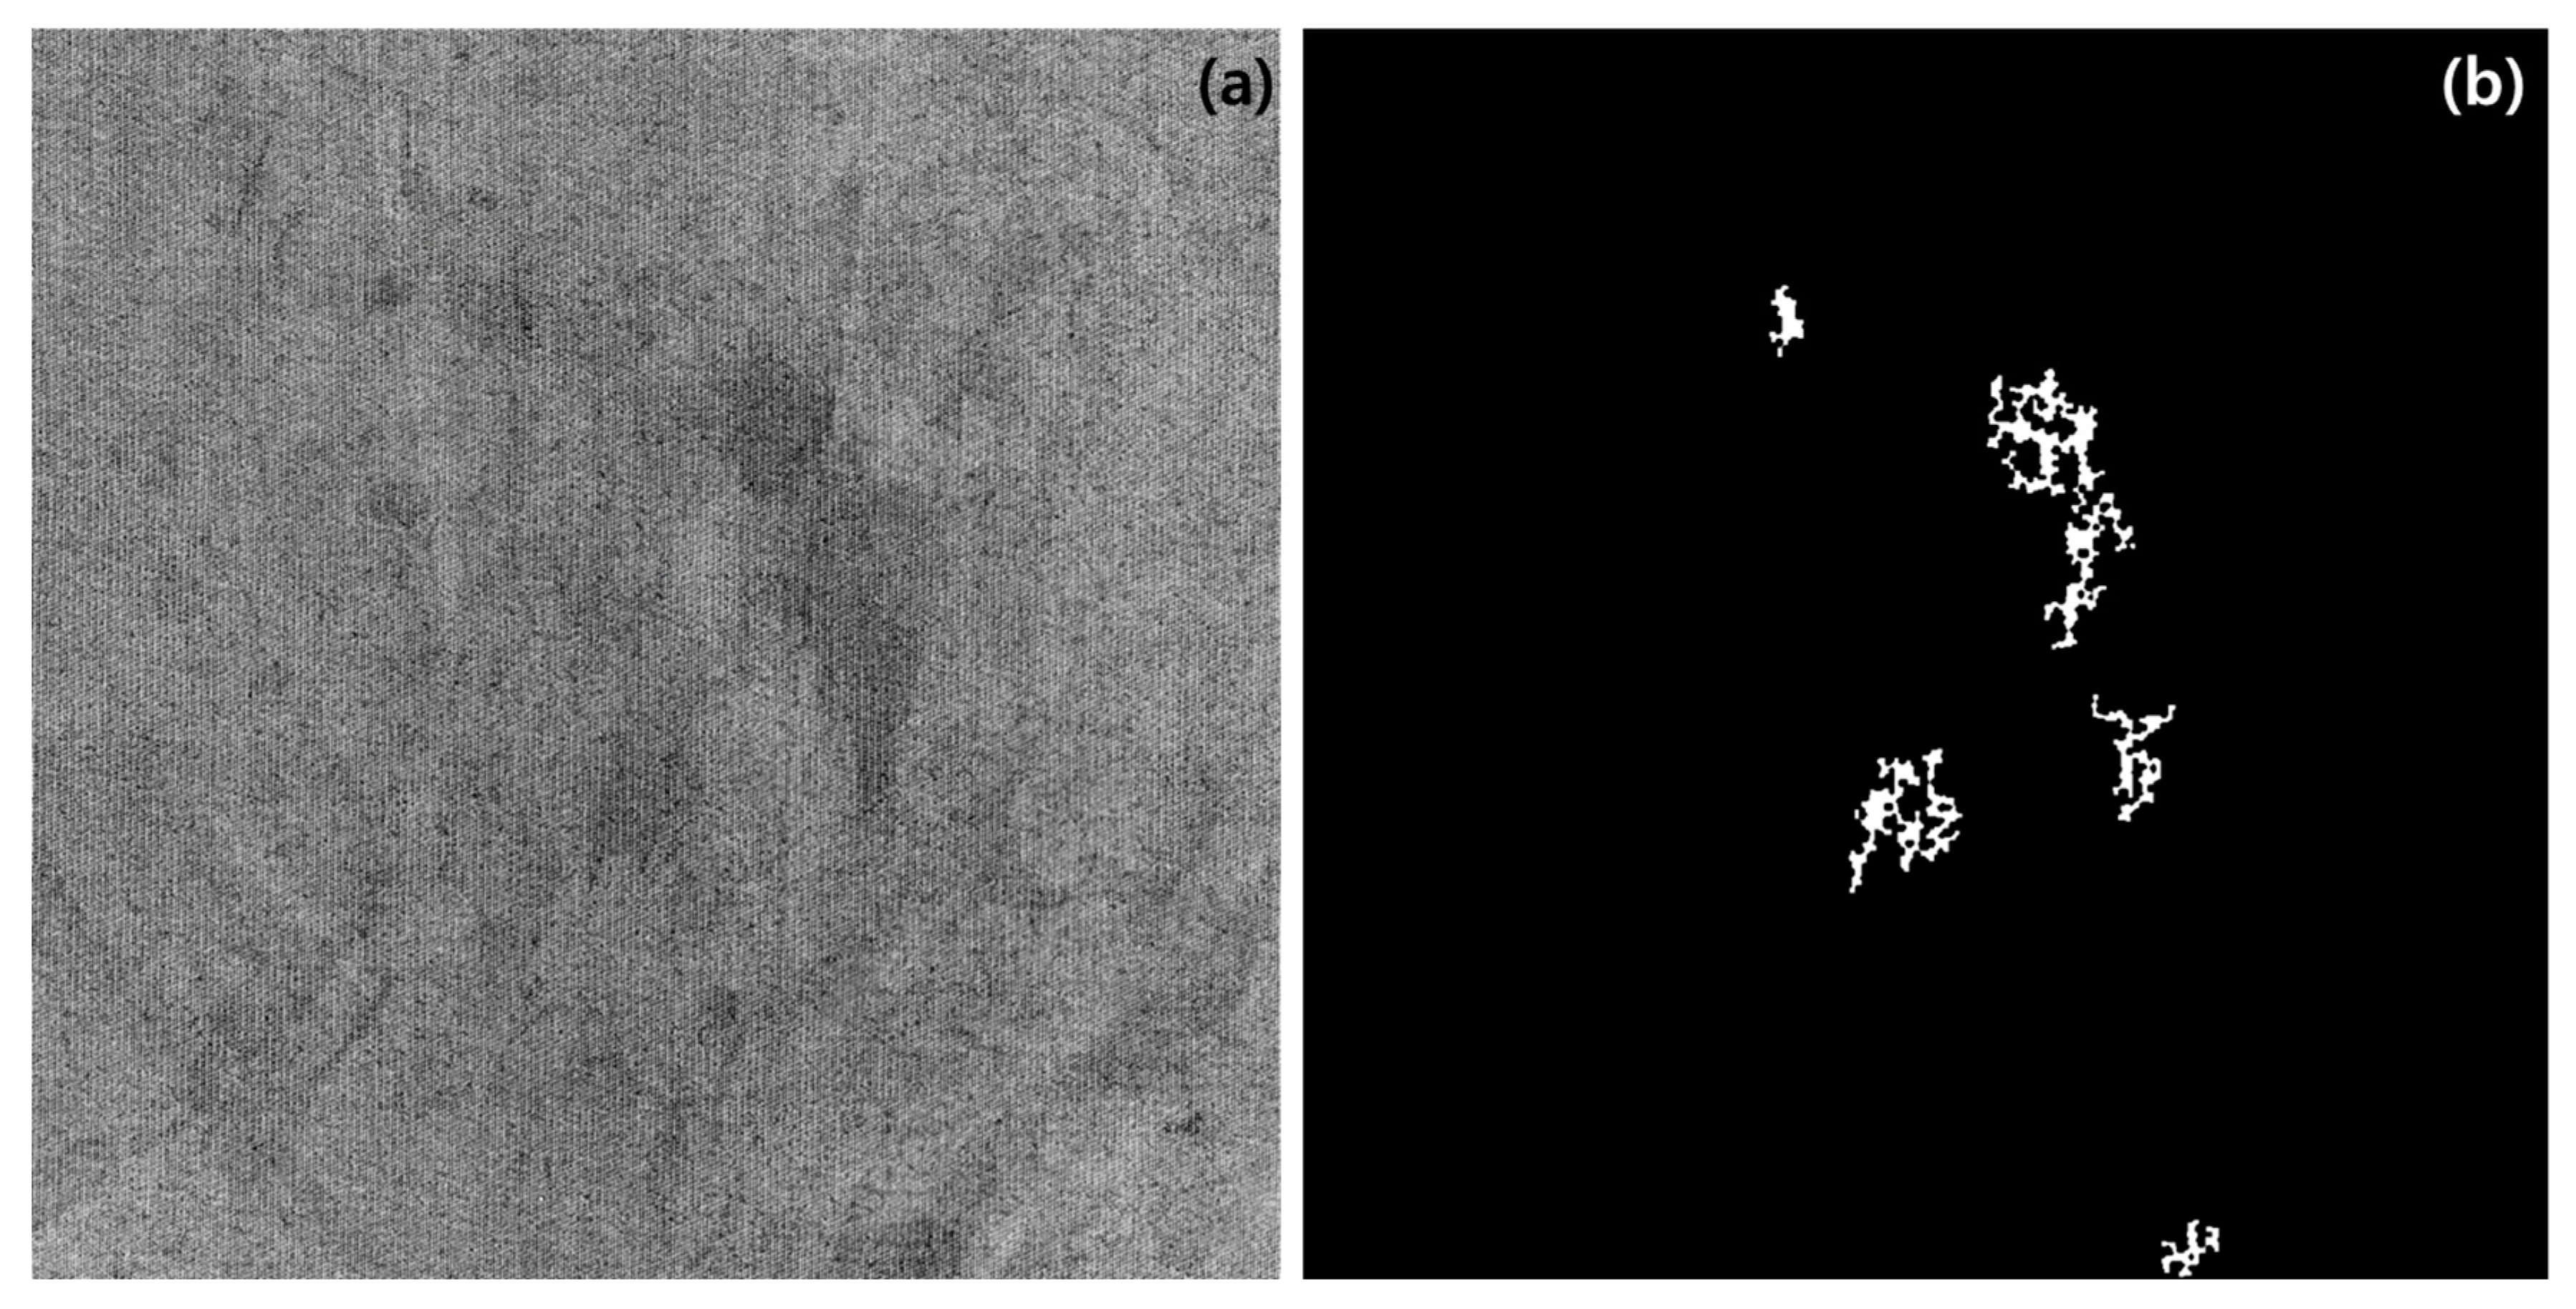
The detection results and accuracy based on the threshold ratio, a key parameter in TIPAs, are summarized in Table 1. The results indicate that at lower threshold ratios, conductive fabrics that are normal were incorrectly detected as defective, while at higher threshold ratios, defective conductive fabrics were incorrectly classified as normal. The difficulty in detection is particularly evident in conductive fabrics like those shown in Figure 9, where the distribution of stains is large and diffuse, making it challenging to accurately classify the stains as defects. However, the overall accuracy remained above 85%, and through optimization, a maximum accuracy level of 100% was achieved. The analysis of our TIPA’s precision, recall, and F1-score reveals that precision remained at 1 for threshold ratios above 15%, while for lower thresholds, it was measured at approximately 0.7 and 0.78. Conversely, the recall was highest for thresholds below 15% and decreased to a minimum of 0.57 at the highest threshold. The final F1-score ranged from a minimum of 0.73 to an average of approximately 0.86, with the 15% threshold achieving the highest F1-score of 1.0. Ultimately, while 15% yielded the best overall performance in this study, it was determined that threshold ratios in the range of 10% to 20% could be applicable for stain detection, depending on stain size and classification requirements.

Table 1.
The results of all images processed by our TIPA, according to threshold ratio.
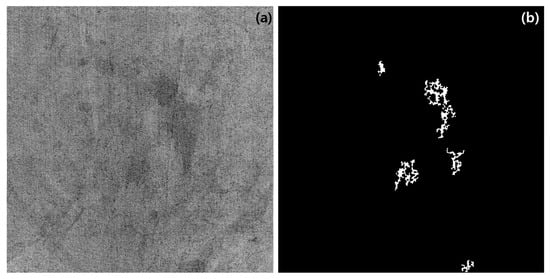
Figure 9.
Blurred images of defective conductive textile: (a) original image; (b) TIPA result.
4. Discussion
This study presents a Textile Image Processing Algorithm (TIPA) specifically designed for the detection of defects in conductive textiles manufactured through the dip-coating process. The proposed algorithm demonstrates significant efficacy, achieving overall accuracy exceeding 85%, with a maximum performance of 100% under optimized conditions. These findings underscore the algorithm’s potential to address critical quality control challenges in the domain of conductive textiles, a pivotal component in wearable technology applications. Table 2 presents a comparison between the results of this study and those obtained using various artificial intelligence models trained specifically for detecting stains or spot defects in actual textile fabrics. Except for the basic shallow CNN model, which achieved an accuracy level of 62.67%, other models demonstrated high accuracy, exceeding approximately 90%. The differences between the studies in terms of the image collection methods and training datasets used must be considered. However, this study optimized threshold criteria, achieving a remarkably high accuracy level of 100%, demonstrating the superiority of the proposed model.
Table 2.
The comparative accuracy of various TIPAs.
The primary contribution of this research lies in the multi-step processing framework encompassing preprocessing, filtering, and threshold optimization. By employing techniques such as histogram equalization and size-based filtering, our TIPA effectively identified and classified defect regions characterized by the uneven distribution of conductive particles. This approach builds upon existing studies, emphasizing the necessity of tailored image processing methodologies for detecting defects in textiles with intricate patterns and material heterogeneity. Moreover, this TIPA advances prior methodologies by optimizing threshold ratios to adapt to various defect types, thereby enhancing its robustness and applicability. A notable aspect of this study is the role of threshold ratios in controlling defect detection sensitivity. Adjusting the threshold ratio within the range of 5% to 30% allowed the algorithm to effectively adapt to diverse defect characteristics. This adaptability underscores our TIPA’s flexibility and utility for a wide range of textile applications. While certain challenges persist in detecting large and diffuse stains, these cases were minimal and did not significantly impact the overall performance of the algorithm.
The limitations of this study lie in the classification criteria for grayscale-converted pixel values, which are influenced by various parameters. The filtering thresholds determined by the primary and secondary pixel sizes, as well as the classification of defective and normal images based on the first detected pixels and threshold ratio, are dependent on several factors. These include the base fabric color, the type of conductive particles, and the overall image resolution. As these factors can vary, it is essential to establish appropriate classification and filtering criteria tailored to specific conditions. This study aimed to propose a fundamental framework for the preprocessing and detection principles of a new TIPA, which is designed specifically to detect stain defects caused by the aggregation of conductive particles—one of the critical defects that can occur in conductive textiles.
Future research will focus on several key areas to further enhance the applicability and effectiveness of this TIPA. Expanding the dataset to include a broader variety of textiles and defect types will ensure greater generalizability across diverse manufacturing scenarios. Incorporating advanced machine learning techniques, such as convolutional neural networks (CNNs), could complement the current framework by enhancing its ability to detect complex defect patterns. Additionally, the development of real-time implementation strategies for industrial environments will be a critical step in validating the algorithm’s practical utility. Further exploration of adaptive thresholding methods that respond dynamically to varying defect characteristics will also refine the algorithm’s precision and robustness.
5. Conclusions
The findings of this study underscore TIPAs as transformative tools in the domain of textile quality control, particularly for conductive textiles employed in wearable technology. Our algorithm’s high accuracy and adaptability render it highly effective for detecting defects in textiles with varied patterns and compositions. Beyond mere defect detection, the successful application of TIPAs promises numerous benefits, including enhanced production efficiency, reduced material wastage, and improved reliability of wearable devices that depend on conductive textiles.
In practical applications, TIPAs prove invaluable in identifying defects that occur when conductive textiles function as electronic circuits. For instance, these algorithms can detect anomalies such as stains that compromise both aesthetic and functional properties, or areas with abnormally high or low surface resistance that impede electrical performance. These capabilities are critical in contexts where consistent electrical properties are essential, such as wearable biosensors, flexible displays, or energy-harvesting electronic fabrics. By detecting such defects during the early stages of production, TIPAs significantly enhance the reliability and performance of the final products. The optimization and industrial deployment of TIPAs have the potential to set new benchmarks for quality control in smart textile manufacturing. Addressing current challenges and expanding our algorithm’s functionality will establish TIPAs as a cornerstone for the integration of intelligent technologies in the textile sector, paving the way for innovative and dependable smart textile solutions.
Author Contributions
As a corresponding author, J.-Y.K. was responsible for the whole structure’s construction, while S.-U.K. was responsible for reviewing, supervision, experiment design, and modeling. S.-U.K. was responsible for data collection, processing, and material selection. S.-U.K. and J.-Y.K. drafted the manuscript. All authors have read and agreed to the published version of the manuscript.
Funding
This research was partly funded by the Technology Innovation Program (or Industrial Strategic Technology Development Program—Materials/Parts Package Type) (20016038, for the development of textile–IT converged digital sensor modules for smart wear to monitor bio and activity signals during exercise, and KS standard), funded by the Ministry of Trade, Industry & Energy (MOTIE, Korea) and the Korea Institute for Advancement of Technology (KIAT) grant, funded by the Korean Government (MOTIE) (P0012770).
Data Availability Statement
All data are contained within the article.
Conflicts of Interest
The authors declare no conflicts of interest.
References
- Shah, M.A.; Pirzada, B.M.; Price, G.; Shibiru, A.L.; Qurashi, A. Applications of nanotechnology in smart textile industry: A critical review. J. Adv. Res. 2022, 38, 55–75. [Google Scholar] [CrossRef] [PubMed]
- Libanori, A.; Chen, G.; Zhao, X.; Zhou, Y.; Chen, J. Smart textiles for personalized healthcare. Nat. Electron. 2022, 5, 142–156. [Google Scholar] [CrossRef]
- Nawawi, M.M.M.; Sidek, K.A.; Dafhalla, A.K.; Azman, A.W. Review on data acquisition of electrocardiogram biometric recognition in wearable smart textile shirts. J. Phys.: Conf. Ser. 2021, 1900, 012019. [Google Scholar] [CrossRef]
- Nawawi, M.M.M.; Sidek, K.A.; Azman, A.W. Biometric Analysis on Smart Textile Garment in Real Life Scenario. J. Adv. Res. Appl. Sci. Eng. Technol. 2024, 34, 372–386. [Google Scholar] [CrossRef]
- Shen, S.; Xiao, X.; Chen, J. Wearable triboelectric nanogenerators for heart rate monitoring. Chem. Commun. 2021, 57, 5871–5879. [Google Scholar] [CrossRef]
- Kim, J.-S.; Truong, T.; Kim, J. Development of embroidery-type sensor capable of detecting respiration using the capacitive method. Polymers 2023, 15, 503. [Google Scholar] [CrossRef] [PubMed]
- Min, S.D.; Yun, Y.; Shin, H. Simplified structural textile respiration sensor based on capacitive pressure sensing method. IEEE Sens. J. 2014, 14, 3245–3251. [Google Scholar]
- Tang, C.; Xu, M.; Yi, W.; Zhang, Z.; Occhipinti, E.; Dong, C.; Ravenscroft, D.; Jung, S.-M.; Lee, S.; Gao, S. Ultrasensitive textile strain sensors redefine wearable silent speech interfaces with high machine learning efficiency. NPJ Flex. Electron. 2024, 8, 27. [Google Scholar] [CrossRef]
- Lou, M.; Abdalla, I.; Zhu, M.; Wei, X.; Yu, J.; Li, Z.; Ding, B. Highly wearable, breathable, and washable sensing textile for human motion and pulse monitoring. ACS Appl. Mater. Interfaces 2020, 12, 19965–19973. [Google Scholar] [CrossRef]
- Zhang, J.-w.; Zhang, Y.; Li, Y.-y.; Wang, P. Textile-based flexible pressure sensors: A review. Polym. Rev. 2022, 62, 65–94. [Google Scholar] [CrossRef]
- Takamatsu, S.; Yamashita, T.; Imai, T.; Itoh, T. Lightweight flexible keyboard with a conductive polymer-based touch sensor fabric. Sens. Actuators A Phys. 2014, 220, 153–158. [Google Scholar] [CrossRef]
- Büscher, G.H.; Kõiva, R.; Schürmann, C.; Haschke, R.; Ritter, H.J. Flexible and stretchable fabric-based tactile sensor. Robot. Auton. Syst. 2015, 63, 244–252. [Google Scholar] [CrossRef]
- Su, M.; Li, P.; Liu, X.; Wei, D.; Yang, J. Textile-based flexible capacitive pressure sensors: A review. Nanomaterials 2022, 12, 1495. [Google Scholar] [CrossRef] [PubMed]
- Alhashmi Alamer, F.; Almalki, G.A. Fabrication of conductive fabrics based on SWCNTs, MWCNTs and graphene and their applications: A review. Polymers 2022, 14, 5376. [Google Scholar] [CrossRef] [PubMed]
- Kim, E.; Kim, S.; Chun, S.; Kim, J. Measurement of conductive fabrics electrical resistance by combining of image processing and convolutional neural network methods. J. Ind. Text. 2024, 54, 15280837241252182. [Google Scholar] [CrossRef]
- Ojstršek, A.; Jug, L.; Plohl, O. A review of electro conductive textiles utilizing the dip-coating technique: Their functionality, durability and sustainability. Polymers 2022, 14, 4713. [Google Scholar] [CrossRef] [PubMed]
- Cui, J.; Zhou, S. Highly conductive and ultra-durable electronic textiles via covalent immobilization of carbon nanomaterials on cotton fabric. J. Mater. Chem. C 2018, 6, 12273–12282. [Google Scholar] [CrossRef]
- Khair, N.; Islam, R.; Shahariar, H. Carbon-based electronic textiles: Materials, fabrication processes and applications. J. Mater. Sci. 2019, 54, 10079–10101. [Google Scholar] [CrossRef]
- Kahraman, Y.; Durmuşoğlu, A. Deep learning-based fabric defect detection: A review. Text. Res. J. 2023, 93, 1485–1503. [Google Scholar] [CrossRef]
- Mahesh, B. Machine learning algorithms-a review. Int. J. Sci. Res. (IJSR). [Internet] 2020, 9, 381–386. [Google Scholar] [CrossRef]
- Monga, V.; Li, Y.; Eldar, Y.C. Algorithm unrolling: Interpretable, efficient deep learning for signal and image processing. IEEE Signal Process. Mag. 2021, 38, 18–44. [Google Scholar] [CrossRef]
- Li, C.; Li, J.; Li, Y.; He, L.; Fu, X.; Chen, J. Fabric defect detection in textile manufacturing: A survey of the state of the art. Secur. Commun. Netw. 2021, 2021, 9948808. [Google Scholar] [CrossRef]
- Sikka, M.P.; Sarkar, A.; Garg, S. Artificial intelligence (AI) in textile industry operational modernization. Res. J. Text. Appar. 2024, 28, 67–83. [Google Scholar] [CrossRef]
- Behera, B. Image-processing in textiles. Text. Prog. 2004, 35, 1–193. [Google Scholar] [CrossRef]
- Conci, A.; Proença, C. A comparison between image-processing approaches to textile inspection. J. Text. Inst. 2000, 91, 317–323. [Google Scholar] [CrossRef]
- Mohanty, A.K.; Bag, A. Detection and classification of fabric defects in textile using image mining and association rule miner. Int. J. Electr. Electron. Comput. 2017, 2, 28–33. [Google Scholar]
- Nazir, M.K.; Ghani, M.A.N.U.; Ashraf, A.; Alam, S.M.; Farooq, R.U.; Latif, Z. A textile image classification based on texture and shape features. In Proceedings of the 2021 International Conference on Innovative Computing (ICIC), Online, 15–16 September 2021; pp. 1–6. [Google Scholar]
- Shahrabadi, S.; Castilla, Y.; Guevara, M.; Magalhães, L.G.; Gonzalez, D.; Adão, T. Defect detection in the textile industry using image-based machine learning methods: A brief review. J. Phys. Conf. Ser. 2022, 2224, 012010. [Google Scholar] [CrossRef]
- Wang, H.; Luo, H.; Zhang, X.; Zhao, Z.; Wang, J.; Li, Y. Automatic defect detection of carbon fiber woven fabrics using machine vision. Mech. Adv. Mater. Struct. 2024, 31, 10921–10934. [Google Scholar] [CrossRef]
- Chen, M.; Yu, L.; Zhi, C.; Sun, R.; Zhu, S.; Gao, Z.; Ke, Z.; Zhu, M.; Zhang, Y. Improved faster R-CNN for fabric defect detection based on Gabor filter with Genetic Algorithm optimization. Comput. Ind. 2022, 134, 103551. [Google Scholar] [CrossRef]
- Suryarasmi, A.; Chang, C.-C.; Akhmalia, R.; Marshallia, M.; Wang, W.-J.; Liang, D. FN-Net: A lightweight CNN-based architecture for fabric defect detection with adaptive threshold-based class determination. Displays 2022, 73, 102241. [Google Scholar] [CrossRef]
- Shang, H.; Li, P.; Zhang, X.; Peng, X. Overview of fabric defect detection techniques based on computer vision. In Proceedings of the Third International Conference on Computer Graphics, Image, and Virtualization (ICCGIV 2023), Nanjing, China, 16–18 June 2023; pp. 108–115. [Google Scholar]
- Guan, S. Fabric defect detection using an integrated model of bottom-up and top-down visual attention. J. Text. Inst. 2016, 107, 215–224. [Google Scholar] [CrossRef]
- Wang, D.; Yu, W.; Lian, P.; Zhang, M. Textile Defect Detection Algorithm Based on Unsupervised Learning. In Proceedings of the 2022 7th International Conference on Image, Vision and Computing (ICIVC), Xi’an, China, 26–28 July 2022; pp. 81–86. [Google Scholar]
- Heidari, N.; Azmi, R.; Pishgoo, B. Fabric textile defect detection, by selecting a suitable subset of wavelet coefficients, through genetic algorithm. Int. J. Image Process. (IJIP) 2011, 5, 25. [Google Scholar]
- Aminzadeh, M.; Kurfess, T. Automatic thresholding for defect detection by background histogram mode extents. J. Manuf. Syst. 2015, 37, 83–92. [Google Scholar] [CrossRef]
- Zhou, J.; Wang, J. Fabric defect detection using adaptive dictionaries. Text. Res. J. 2013, 83, 1846–1859. [Google Scholar] [CrossRef]
- Kang, X.; Zhang, E. A universal and adaptive fabric defect detection algorithm based on sparse dictionary learning. IEEE Access 2020, 8, 221808–221830. [Google Scholar] [CrossRef]
- Karegowda, A.G.; Pooja, R.; Rani, A.L.; Devika, G. Detection of Stain Defects in Textile Industry using State-of-Art Transfer Learning Models. In Proceedings of the 2024 International Conference on Smart Systems for applications in Electrical Sciences (ICSSES), Tumakuru, India, 3–4 May 2024; pp. 1–6. [Google Scholar]


Disclaimer/Publisher’s Note: The statements, opinions and data contained in all publications are solely those of the individual author(s) and contributor(s) and not of MDPI and/or the editor(s). MDPI and/or the editor(s) disclaim responsibility for any injury to people or property resulting from any ideas, methods, instructions or products referred to in the content. |
© 2025 by the authors. Licensee MDPI, Basel, Switzerland. This article is an open access article distributed under the terms and conditions of the Creative Commons Attribution (CC BY) license (https://creativecommons.org/licenses/by/4.0/).