Article

Flow and Corrosion Analysis of CO2 Injection Wells: A Case Study of the Changqing Oilfield CCUS Project

1
Institute of Oil and Gas Technology, PetroChina Changqing Oilfield Co., Xi’an 710018, China
2
State Key Laboratory of Petroleum Resources and Engineering, China University of Petroleum (Beijing), Beijing 102249, China
3
China National Oil and Gas Exploration and Development Company Ltd., Beijing 100034, China
*
Author to whom correspondence should be addressed.
Processes 2025, 13(2), 439; https://doi.org/10.3390/pr13020439
Submission received: 29 December 2024 / Revised: 2 February 2025 / Accepted: 3 February 2025 / Published: 6 February 2025

Abstract

:
In carbon dioxide capture, utilization and storage (CCUS) technology, CO2 flooding and storage is currently the most effective geological storage method and the flow law of the gas injection wellbore is the key to achieving safe and efficient CO2 injection. The existing wellbore flow model lacks research on the corrosion law. To this end, this paper established a gas injection wellbore flow-heat transfer-corrosion coupling model based on the actual situation of Huang 3 District of the CCUS Demonstration Base of Changqing Oilfield. The field measured data verification showed that the relative average error of the model in predicting pressure and temperature was less than 7.5% and the R2 of the predicted value and the measured value was greater than 0.99. The model was used for sensitivity analysis to evaluate the effects of different gas injection temperatures (15–55 °C), pressures (15–55 MPa), displacements (10–500 t/d) and CO2 contents (50–100%) on wellbore temperature, pressure and corrosion rate, and the wellbore flow law under different gas injection conditions was clarified. The results show that the wellbore temperature, pressure and corrosion rate are significantly affected by gas injection parameters. The wellbore temperature increases with the increase of gas injection temperature and decreases with the increase of gas injection displacement. The wellbore pressure is positively correlated with the gas injection pressure and CO2 content and the gas injection temperature and displacement have little effect on the pressure. The corrosion rate increases with the increase of gas injection temperature and displacement and decreases with the increase of gas injection pressure. In the wellbore, it shows a trend of first increasing and then decreasing with depth. The wellbore corrosion rate is affected by many factors. Reasonable adjustment of gas injection parameters (lowering temperature, increasing pressure, controlling displacement and CO2 content) can effectively slow down the wellbore corrosion loss. The research results can provide a theoretical basis for the optimization of gas injection system.

1. Introduction

As the economy and society transform towards a green and low-carbon era, CO2 capture, utilization and storage technology (CCUS) is being vigorously developed by the international community because it can achieve a win-win situation of carbon emission reduction and oil production increase [1]. CO2 is a colorless, odorless gas with a density greater than that of air at room temperature and pressure and has high solubility and diffusivity. When the temperature is higher than 31.04 °C and the pressure exceeds 7.38 MPa, CO2 enters a supercritical state. Supercritical CO2 has the characteristics of low viscosity and easy diffusion of gas, high density and solubility of liquid, has super fluidity, permeability and thermal conductivity and its surface tension is almost zero. Therefore, it can quickly penetrate into the tiny pore structure of shale and dissolve non-polar and weakly polar substances in shale. CO2 is often used in drilling or fracturing [2,3]. In CCUS technology, CO2 flooding and storage is currently the most cost-effective CO2 geological storage method [4]. After CO₂ is injected into the reservoir, on the one hand, it can reduce the viscosity of crude oil and improve the fluidity of crude oil through miscible displacement, thereby increasing the crude oil recovery rate; on the other hand, the storage of CO₂ in the reservoir can effectively reduce greenhouse gas emissions and achieve a win-win situation for environmental protection and resource development. In addition, CO₂ can also be used to improve the reservoir permeability of the reservoir. By injecting high-pressure CO₂, the reservoir rock can be fractured to form a complex fracture network, increase the seepage channel of the fluid and improve the development effect of the reservoir. Although CCUS-EOR technology has been well applied in many large domestic oil fields such as Changqing, Shengli and Daqing, the corrosion problem of gas injection wellbore has not been effectively solved. Clarifying the flow law of gas injection wellbore is the key to achieving safe and efficient CO2 oil recovery and storage, which helps to guide the optimization of CO2 injection system, ensure wellbore integrity and ensure gas injection safety.
At present, researchers have established a prediction model for wellbore temperature and pressure (abbreviated as “temperature and pressure”) during the CO2 injection process [5,6,7]. It takes into account injection conditions such as liquid or supercritical CO2 and analyzes the effects of phase change, friction effect between fluid and tubing, and radial heat transfer in the wellbore on wellbore temperature and pressure. Since the thermophysical properties of CO2 are greatly affected by temperature and pressure, it is necessary to determine the temperature and pressure in advance when analyzing the flow and heat transfer process of CO2. Therefore, most of these models are solved using an iterative method. Most scholars choose the Peng–Robinson state equation with relatively simple parameters to determine the thermophysical properties of CO2 [8,9], while some scholars use the Span–Wagner state equation with higher accuracy for calculation [10,11]. In addition, there are also research works that have conducted special analyses on natural convection in the annulus of oil casing [12], periodic injection and other issues. Using the wellbore temperature and pressure prediction model, domestic and foreign scholars have conducted a lot of research on the stress distribution of CO2 injection wellbore, such as the impact of different injection conditions [13], wellbore structural material degradation, micro-annulus and fluid migration caused by thermal stress at the cement/casing/rock interface [14] and temperature and pressure changes on wellbore integrity [15,16].
For wellbore corrosion, most of the existing research focuses on corrosion mechanisms and anti-corrosion measures, but lacks prediction of wellbore corrosion rate and sensitivity analysis. The corrosion mechanism and influencing factors of low CO2 partial pressure (usually below 0.21 MPa) have been fully studied and the influence of temperature, CO2 partial pressure, water content, etc. on the mechanism of CO2 corrosion is relatively clear [17,18,19,20,21,22,23,24]. In the downhole environment with high CO2 partial pressure, its corrosion behavior and mechanism will be different; the injection gas source, injection pressure, temperature and pressure differences at different locations and differences in corrosive media of different CO2 injection wells will affect the corrosion behavior of pipes.
The existing CCUS wellbore flow model only considers two or three characteristics in pressure drop and heat transfer, but does not consider corrosion factors. However, corrosion is an inevitable situation for CO2 injection wellbores. Therefore, it is necessary to establish a CCUS wellbore flow model that includes corrosion factors. Based on the actual situation of Huang 3 District of CCUS Demonstration Base in Changqing Oilfield, this paper establishes an injection wellbore pressure drop-heat transfer-corrosion coupled flow model, studies the effects of different injection temperatures, injection pressures, injection displacements and injection components on wellbore pressure, temperature and corrosion rate, clarifies the flow law in the wellbore and provides a theoretical basis for the optimization design of process parameters of CO2 injection wells.

2. Mathematical Model

In order to study the changes in heat transfer, pressure drop and corrosion rate in the wellbore during CO2 injection, this paper established a wellbore pressure drop-heat transfer-corrosion coupled flow model that takes into account the changes in fluid physical properties. The physical parameters such as density, viscosity and thermal conductivity of the injected gas are calculated using the Peng–Robinson state equation to accurately describe the changes in physical properties of CO2 under high temperature and high pressure conditions [25]. Combining the physical processes of wellbore fluid flow and heat transfer, the corresponding steady-state equations are derived to simulate the temperature, pressure distribution and corrosion rate of the fluid in the wellbore.

2.1. Fluid Property Model

The physical properties of the injected fluid have a crucial impact on the calculation of the temperature, pressure and corrosion rate of the wellbore. Parameters such as the density, viscosity, thermal conductivity, specific heat capacity and compressibility factor of the fluid directly determine the heat transfer and flow characteristics of the fluid in the wellbore. During the CO2 fluid injection process, friction mainly comes from the friction between the fluid and the wellbore wall, the fluid inside, the fluid and the formation, the fluid and the tubing and the fluid and the corrosion products. These frictions will cause the fluid to lose kinetic energy, which is manifested as a pressure drop. Under high temperature and high pressure conditions, changes in fluid density and viscosity will affect the flow resistance and pressure drop, thereby significantly affecting the pressure distribution in the wellbore. Lower CO2 viscosity may bring certain hazards during the injection process, such as increasing flow instability, reducing the carrying capacity of the fluid, affecting heat transfer efficiency, increasing corrosion risk and affecting injection effect. In addition, the thermal conductivity and specific heat capacity of the fluid determine its heat transfer efficiency, which in turn affects the temperature gradient at different depths in the wellbore. Changes in temperature and pressure further affect the corrosion rate, especially in the presence of gases such as CO2, where temperature increases accelerate the corrosion reaction [7]. Therefore, accurately calculating the physical properties of the injected fluid is a key step in predicting changes in wellbore temperature, pressure and corrosion rate.
The Peng–Robinson equation of state can accurately predict the physical properties of CO2 over a wide range of temperature and pressure and is particularly suitable for supercritical CO2. The injected fluid in this study is mainly CO2, so this paper calculates the physical properties of the injected fluid components based on the PR equation [26].
P = R T V m b a V m 2 + 2 b V m b 2
where P is pressure, Pa; T is temperature, K; R is gas constant, 8.314 J/(mol·K); Vm is molar volume, m3/mol; and a and b are constants related to fluid properties, which are related to critical temperature and pressure.
(1)
Density equation
The density of the injection components in the wellbore is calculated using the following equation:
ρ = M V m
where ρ is the density of the component, kg/m3; and M is the molar mass of the component, kg/mol.
(2)
Viscosity equation
Previous empirical formulas have limitations in describing the viscosity of CO2 under high temperature and high pressure, especially in the supercritical state, where the error is large. This paper uses the Chapman–Enskog equation to calculate the dynamic viscosity of CO2. The equation defines viscosity as the result of the interaction between gas molecules and introduces nonlinear terms of temperature and pressure [27]. The dynamic viscosity formula is:
μ = 26.69 × 10 8 × M × T σ 2 × Ω
where μ is viscosity, Pa·s; σ is the collision diameter, m; and Ω is viscosity collision integral, dimensionless.
(3)
Thermal conductivity equation
The Chapman–Enskog equation can also be used to calculate the thermal conductivity of a gas, which describes the ability of a gas to transfer heat through molecular collisions. The formula for thermal conductivity is:
λ = 25 32 k B σ 2 k B T π m 1 Ω λ T
where λ is the thermal conductivity, W/(m·K); kB is the Boltzmann constant, with a value of 1.380649 × 10⁻²³ J/K; m is the molecular mass, kg; and Ωλ(T*) is the collision integral of the thermal conductivity, dimensionless.
(4)
Heat capacity equation
For ideal gases, heat capacity can be expressed as a polynomial function of temperature, typically using empirical formulas. Therefore, the specific heat capacity at constant pressure Cp of the injected gas can be described using the following empirical formula:
C p i d e a l = A + B T + C T 2 + D T 3
where C p i d e a l is the constant pressure heat capacity of an ideal gas, J/(mol·K); and A, B, C and D are empirical coefficients that depend on the type of gas.
In practical engineering, non-ideal gas models are typically used to accurately describe the heat capacity of fluids:
C p = C p i d e a l + C p r e s i d u a l
where Cp is the heat capacity under non-ideal gas conditions, J/(mol·K); and C p r e s i d u a l is the residual heat capacity, which is used to correct the non-ideality of the gas and is calculated based on the PR state equation.
(5)
Compression factor equation
The compression factor of the gas components is calculated using the following equation:
Z = P V m R T
where Z is the compression factor, dimensionless.

2.2. Wellbore Pressure Drop Model

Wellbore pressure drop directly affects the flow characteristics of the fluid and is an important parameter in describing the CO2 injection process. Fluid density, velocity, friction coefficient and wellbore geometry parameters will affect the pressure change in the wellbore. By establishing the pressure gradient equation, the pressure distribution in the wellbore can be accurately predicted and then the flow behavior of the fluid in the wellbore can be analyzed.
The steady-state pressure gradient of the single-phase section is given by the following formula:
d p d L = ρ g sin θ f ρ υ 2 2 D ρ υ d υ d L
where g is the gravity acceleration, m/s2; θ is the angle between the wellbore and the horizontal plane, °; f is the friction coefficient, dimensionless; v is the fluid velocity, m/s; D is the wellbore diameter, m; and L is the wellbore depth, m.
There are various methods for calculating the friction factor, which typically depend on the Reynolds number:
R e = ρ v D μ
where Re is the Reynolds number, dimensionless.
The friction factor of the fluid has different calculation formulas for laminar flow, turbulent flow and transitional flow, as shown below:
f L a m = 64 R e , R e < 2000 1 f T u r b 1 2 = a ln c q + δ , R e > 4000 f = R e R e m i n f T u r b f L a m R e m a x R e m i n + f L a m , 2000 R e 4000
a = 2 ln 10 , b = ε D 3.7 , c = R e ln 10 5.02 s = b c + ln c , q = s s s + 1 , g = b c + ln c q z = ln q g , δ = z g g + 1
where Remin and Remax are the minimum Reynolds number and the maximum Reynolds number, dimensionless; and ε is the pipe roughness, dimensionless.

2.3. Wellbore Heat Transfer Model

The heat transfer process in the wellbore is determined by the energy exchange between the wellbore and the surrounding formation. The heat transfer rate of the fluid in the wellbore directly affects the temperature distribution and corrosion rate of the wellbore. Based on the first law of thermodynamics, the heat transfer model needs to take into account the steady-state and transient heat conduction process between the wellbore and the formation, as well as the convective heat transfer effect of the fluid in the wellbore. In order to describe this complex heat transfer process, this paper simulates the heat transfer inside and outside the wellbore by establishing an energy equation.
According to the first law of thermodynamics, that is, the total energy change of the system is equal to the sum of the heat added to the system and the work carried out by the system, the energy equation of the steady-state flowing fluid is established as shown below:
Δ H + 1 2 υ m 2 + g z d m = δ Q δ W s
where H is enthalpy, kJ/kg; vm is the fluid mixing velocity, m/s; z is the well depth, m; ∑δQ is all the heat transferred to the pipe section, kJ; and δWs represents the shaft work, kJ.
The amount of heat transfer can be expressed as follows:
Q = U A T b T a
where Q is the amount of heat transferred, W; U is the total heat transfer coefficient, W/(m²·K); A is the heat loss area, A = π D L , m2; and Ta and Tb are the ambient temperature and the overall fluid temperature, K.
The heat transfer between the wellbore and the surrounding environment varies with time: the wellbore exchanges energy with the formation, heating or cooling the formation until the formation and the wellbore are at the same temperature. The heat transfer within the wellbore is steady-state, while the heat transfer to the formation is by transient radial conduction. In combination with the transient heat transfer model, the wellbore temperature curve under different operating conditions can be accurately predicted [28,29]. The wellbore heat transfer coefficient is:
h g = 2 k g D f t
where hg is the wellbore heat transfer coefficient, W/(m²·K); kg is the ground thermal resistance, m²·K/W; f(t) is the time function, f t = 1 2 E 1 D 2 4 α T D 2 4 α T ; α is the ground thermal diffusion coefficient, m2/s; and T is time, s.

2.4. Wellbore Corrosion Model

Corrosion is an inevitable phenomenon during CO2 injection, especially under high temperature and high pressure conditions. The chemical reaction between CO2 and wellbore materials will increase the corrosion rate. In order to accurately predict the wellbore corrosion, this paper introduces a corrosion rate model, combined with the physical and chemical properties of the fluid, to calculate the corrosion rate in the wellbore.
Based on the electrochemical corrosion theory, the corrosion rate of carbon steel in the presence of water and carbon dioxide is calculated. The corrosion rate is limited by the reaction rate and mass transfer rate [30]. The corrosion rate expression is as follows:
V c o r = C c F s F g 1 V r + 1 V m
log V r = 4.93 1119 T + 0.58 log f C O 2 0.34 p H a c t p H C O 2 V m = 2.45 U L 0.8 d 0.2 f C O 2 p C O 2 = m o l % C O 2 P t o t a l 100 log f C O 2 = log p C O 2 + 0.0031 1.4 t + 273 P t o t a l T s = 2400 6.7 + 0.44 log f C O 2
where Vcor is the corrosion rate, mm/year; Vr is the reaction rate, mol/L·s; Vm is the mass transfer rate, kg/(mm2·s); Cc is the multiplier used to correct the inhibitor efficiency or match with the field data, and the default is 1; Fs is the temperature influence factor, if T > Ts, log F s = 240 1 T 1 T s , otherwise Fs = 1; Fug is the ethylene glycol reduction influence factor, log F g = 1.6 log W % 2 ; W% is the weight percentage of water in the water-ethylene glycol mixture; UL is the liquid flow rate, m/s; d is the pipe diameter, m; fCO2 is the carbon dioxide fugacity, Pa; pCO2 is the carbon dioxide partial pressure, Pa; pHact and pHCO2 are the actual pH value of the system and the pH value of carbon dioxide dissolved in pure water, respectively; Ptotal is the total pressure, Pa; and t, T, Ts are the carbon dioxide temperature, reaction temperature, and transition temperature, respectively, in units of °C, K, and K.

3. Model Solution

After establishing the wellbore pressure drop-heat transfer-corrosion coupled flow model, the finite difference method is used to discretize the equations in order to solve for the pressure, temperature and corrosion rate within the wellbore. The solution is then performed by incorporating the initial and boundary conditions of the actual wellbore.

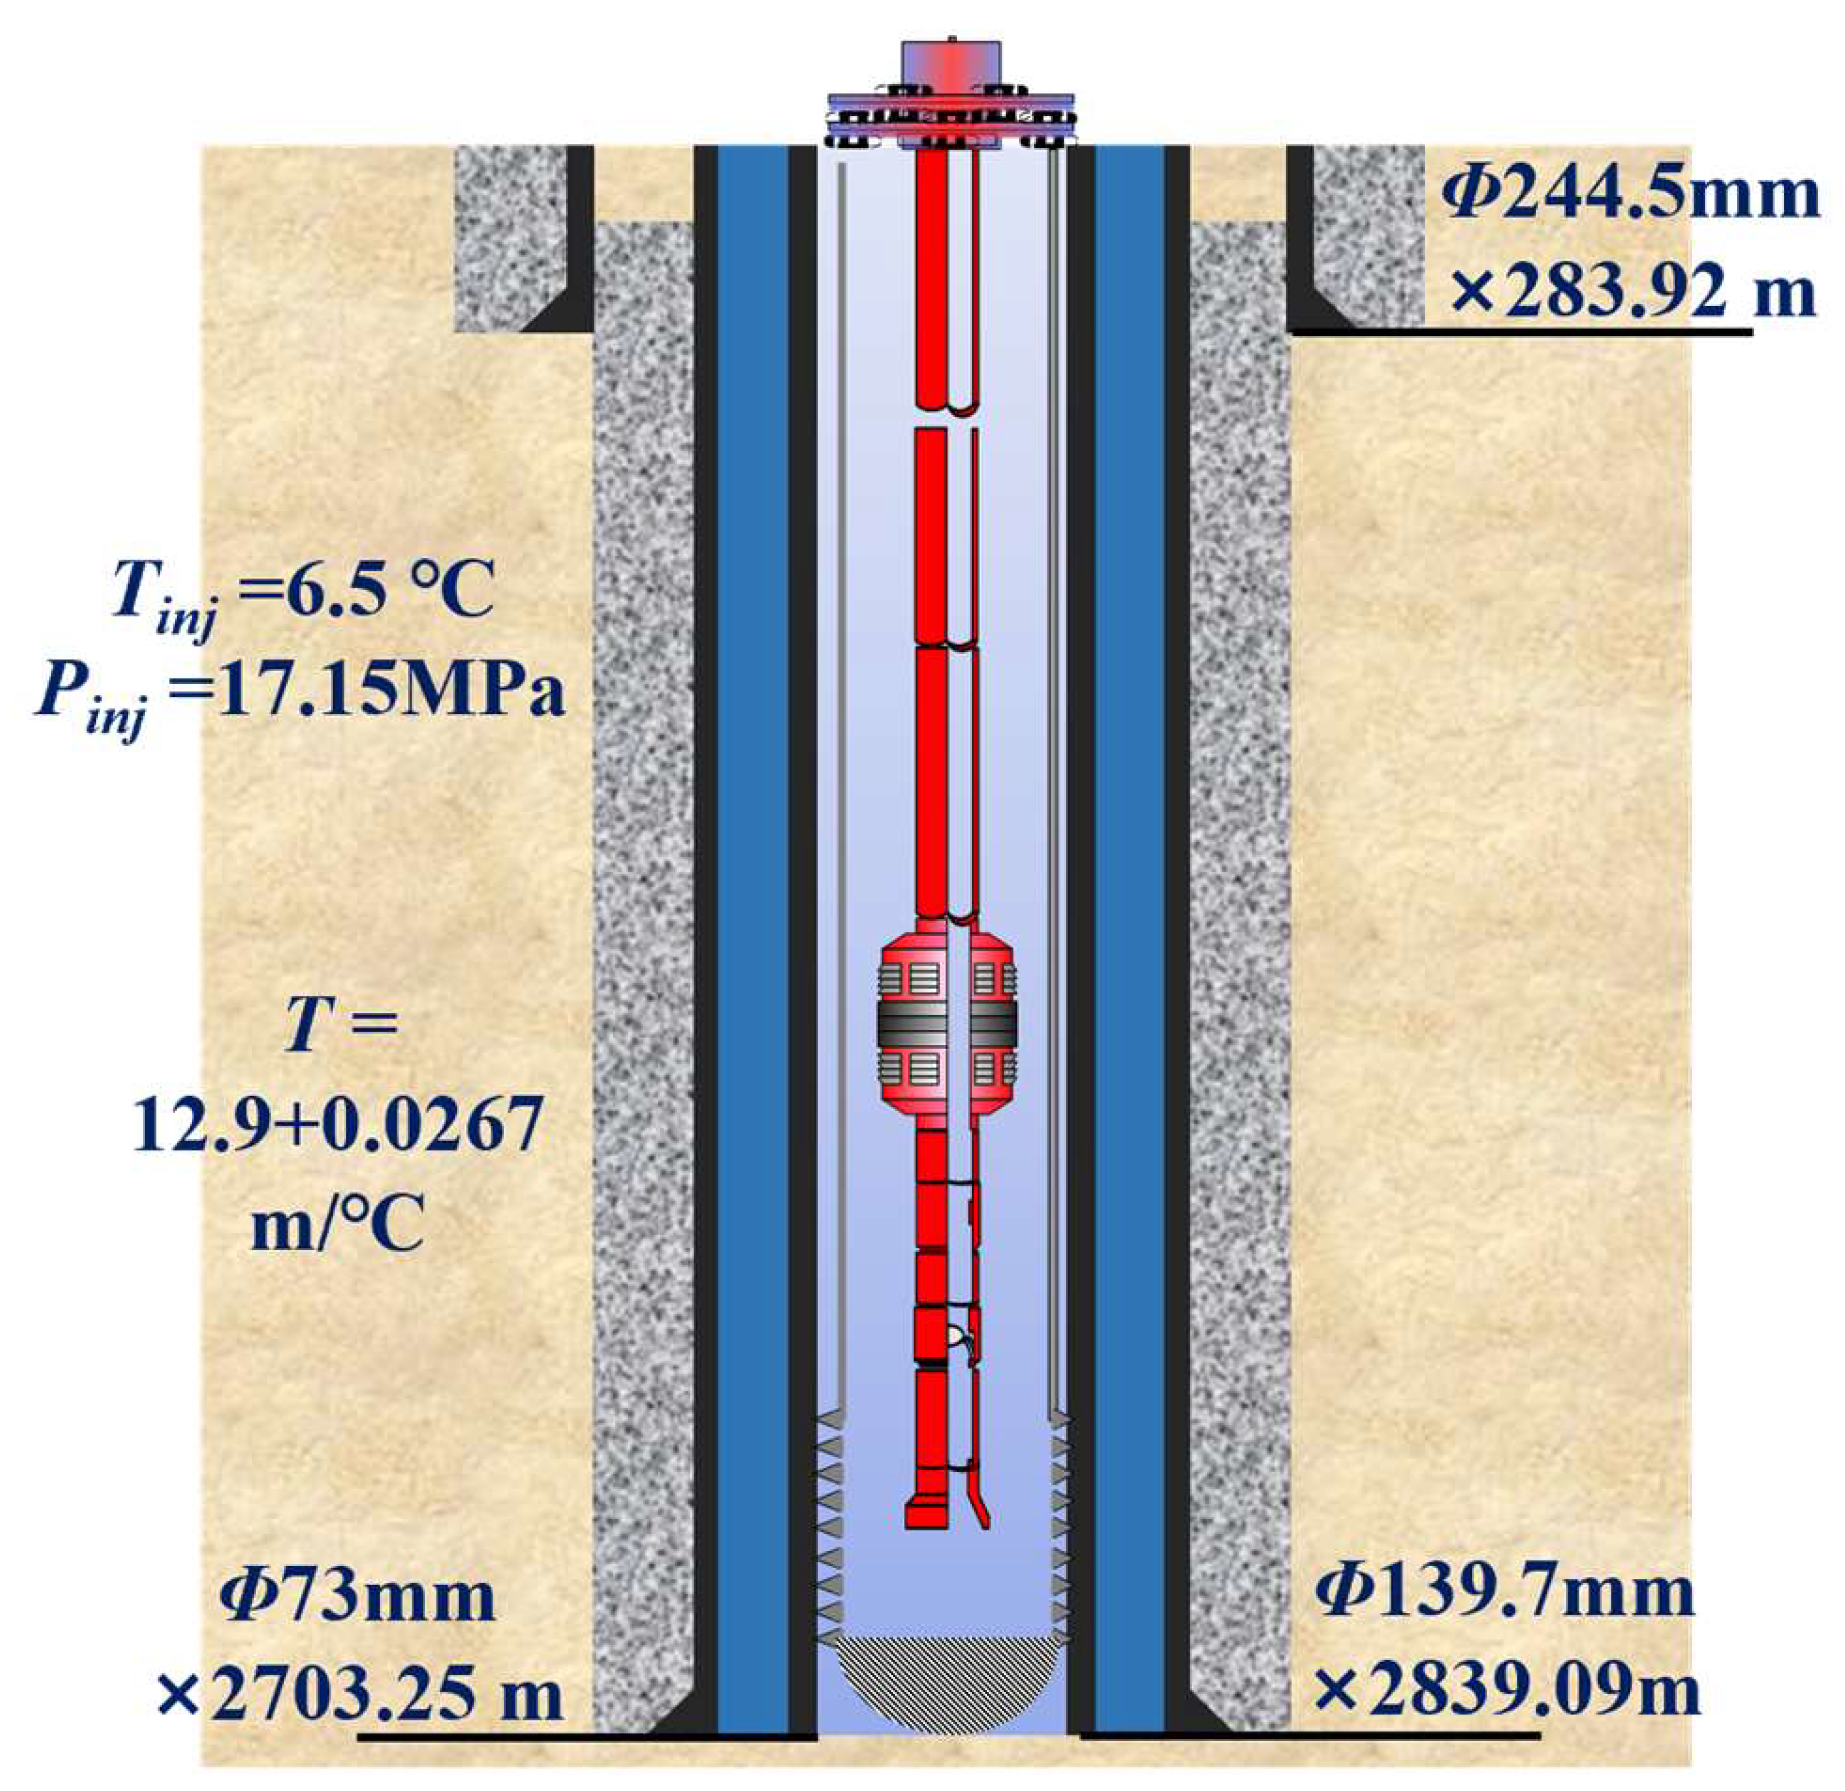
3.1. Initial Conditions

To ensure the accuracy of the model solution, the initial settings for wellbore and formation temperature, pressure and other parameters are first defined. The selection of initial conditions is based on the actual data from the Huang 3 area injection well in the Changqing Oilfield. The initial temperature distribution within the wellbore is set to the formation temperature, while the initial pressure distribution in the wellbore is set to the steady-state pressure before CO2 injection, as follows:
T z , 0 = T s + T g z P z , 0 = P 0 z
where Ts is the formation temperature, K; Tg is the formation temperature gradient, K/m; z is the well depth, m; and P0(z) is the initial steady-state pressure distribution function.

3.2. Boundary Conditions

The boundary conditions must ensure that the parameters at the wellbore inlet and outlet are consistent with the actual injection operations. Therefore, the wellhead pressure is set to the known injection pressure and the wellhead temperature is set to the injection temperature, serving as the inlet boundary conditions. The bottom-hole pressure is set to the formation pressure at the well’s bottom and the bottom-hole temperature is set to the formation temperature at the well’s bottom, serving as the outlet boundary conditions. The specific conditions are as follows:
P 0 , t = P i n j P L , t = P b o t T 0 , t = T i n j T L , t = T b o t
where Pinj and Pbot are the injection pressure and bottom hole formation pressure, Pa; and Tinj and Tbot are the injection temperature and bottom hole formation temperature, K.

3.3. Solution Method

The model is solved by programming in Python 3.9.13, the finite difference method is used to discretize the model and the coupled pressure drop, heat transfer and corrosion models are iteratively solved to obtain a more accurate multi-physical field distribution in the wellbore. The detailed solution process is shown in Figure 1.

4. Model Verification

The Jiyuan Oilfield is located in the northwest of the Ordos Basin. It spans the Tianhuan Depression and the northern Shaanxi slope in terms of regional structure. It is one of the main oilfields of the Changqing Oilfield. Jiyuan Oilfield was put into production in 1992, with an oil-bearing area of 2991.18 km2 and geological reserves of 13.38 × 10⁸ t. The main oil-bearing strata are Yan 9, Yan 10, Chang 4 + 5, Chang 6 and Chang 8. In order to solve the main development contradictions of Chang 8 ultra-low permeability reservoir in the Jiyuan Oilfield, such as high under-injection ratio, great difficulty in management and prominent water drive contradictions, CCUS-EOR industrial application was carried out in Huang 3 block according to the reservoir scale and source-sink matching conditions, combined with industrial test organization and management.
The reservoir of Block Huang 3 is 81 layers deep and 2700 m deep, with a reservoir temperature of 85 °C, a geothermal gradient of 2.67 °C/100 m, a ground temperature of 12.91 °C, an original formation pressure of 19.74 MPa, a reservoir thickness of 12.6 m and a formation crude oil density of 0.733 g/cm3. Figure 2 shows the location of the demonstration area.
According to the injection well data of the current Huang 3 area CO2 pilot test area, combined with the wellbore corrosion of the injection wells in the test area, a CO2 gas injection well was selected as the target well and the downhole temperature and pressure of the well were tested using a CO2 hanging instrument. The well is located in Liyao Village, Hongliugou, Dingbian County, Shaanxi Province; the structural location is on the west side of the Jiyuan-Mahuangshan paleo-uplift of the Yishan slope in the Ordos Basin. The well is a water injection well and the purpose of drilling is to improve the injection and production well network. Figure 3 is a schematic diagram of the wellbore structure of the test well.
In order to verify the accuracy of the pressure drop-heat transfer-corrosion coupled flow model in the injection wellbore, the model was used to predict the wellbore temperature and pressure of a CO2 injection well in the Changqing Jiyuan Oilfield and the predicted results were compared with the field measured temperature and pressure data of the well, as shown in Figure 4. The wellbore temperature error is 7.43%, the wellbore pressure error is 1.78% and the overall error does not exceed 7.50%; the temperature prediction value R2 is 0.9958, the pressure prediction value R2 is 0.9994, the temperature measured value R2 is 0.9908 and the pressure measured value R2 is 0.9997. The predicted value is consistent with the measured value. This shows that the wellbore pressure drop-heat transfer-corrosion coupled flow model established in this paper has good accuracy in predicting wellbore temperature and pressure.

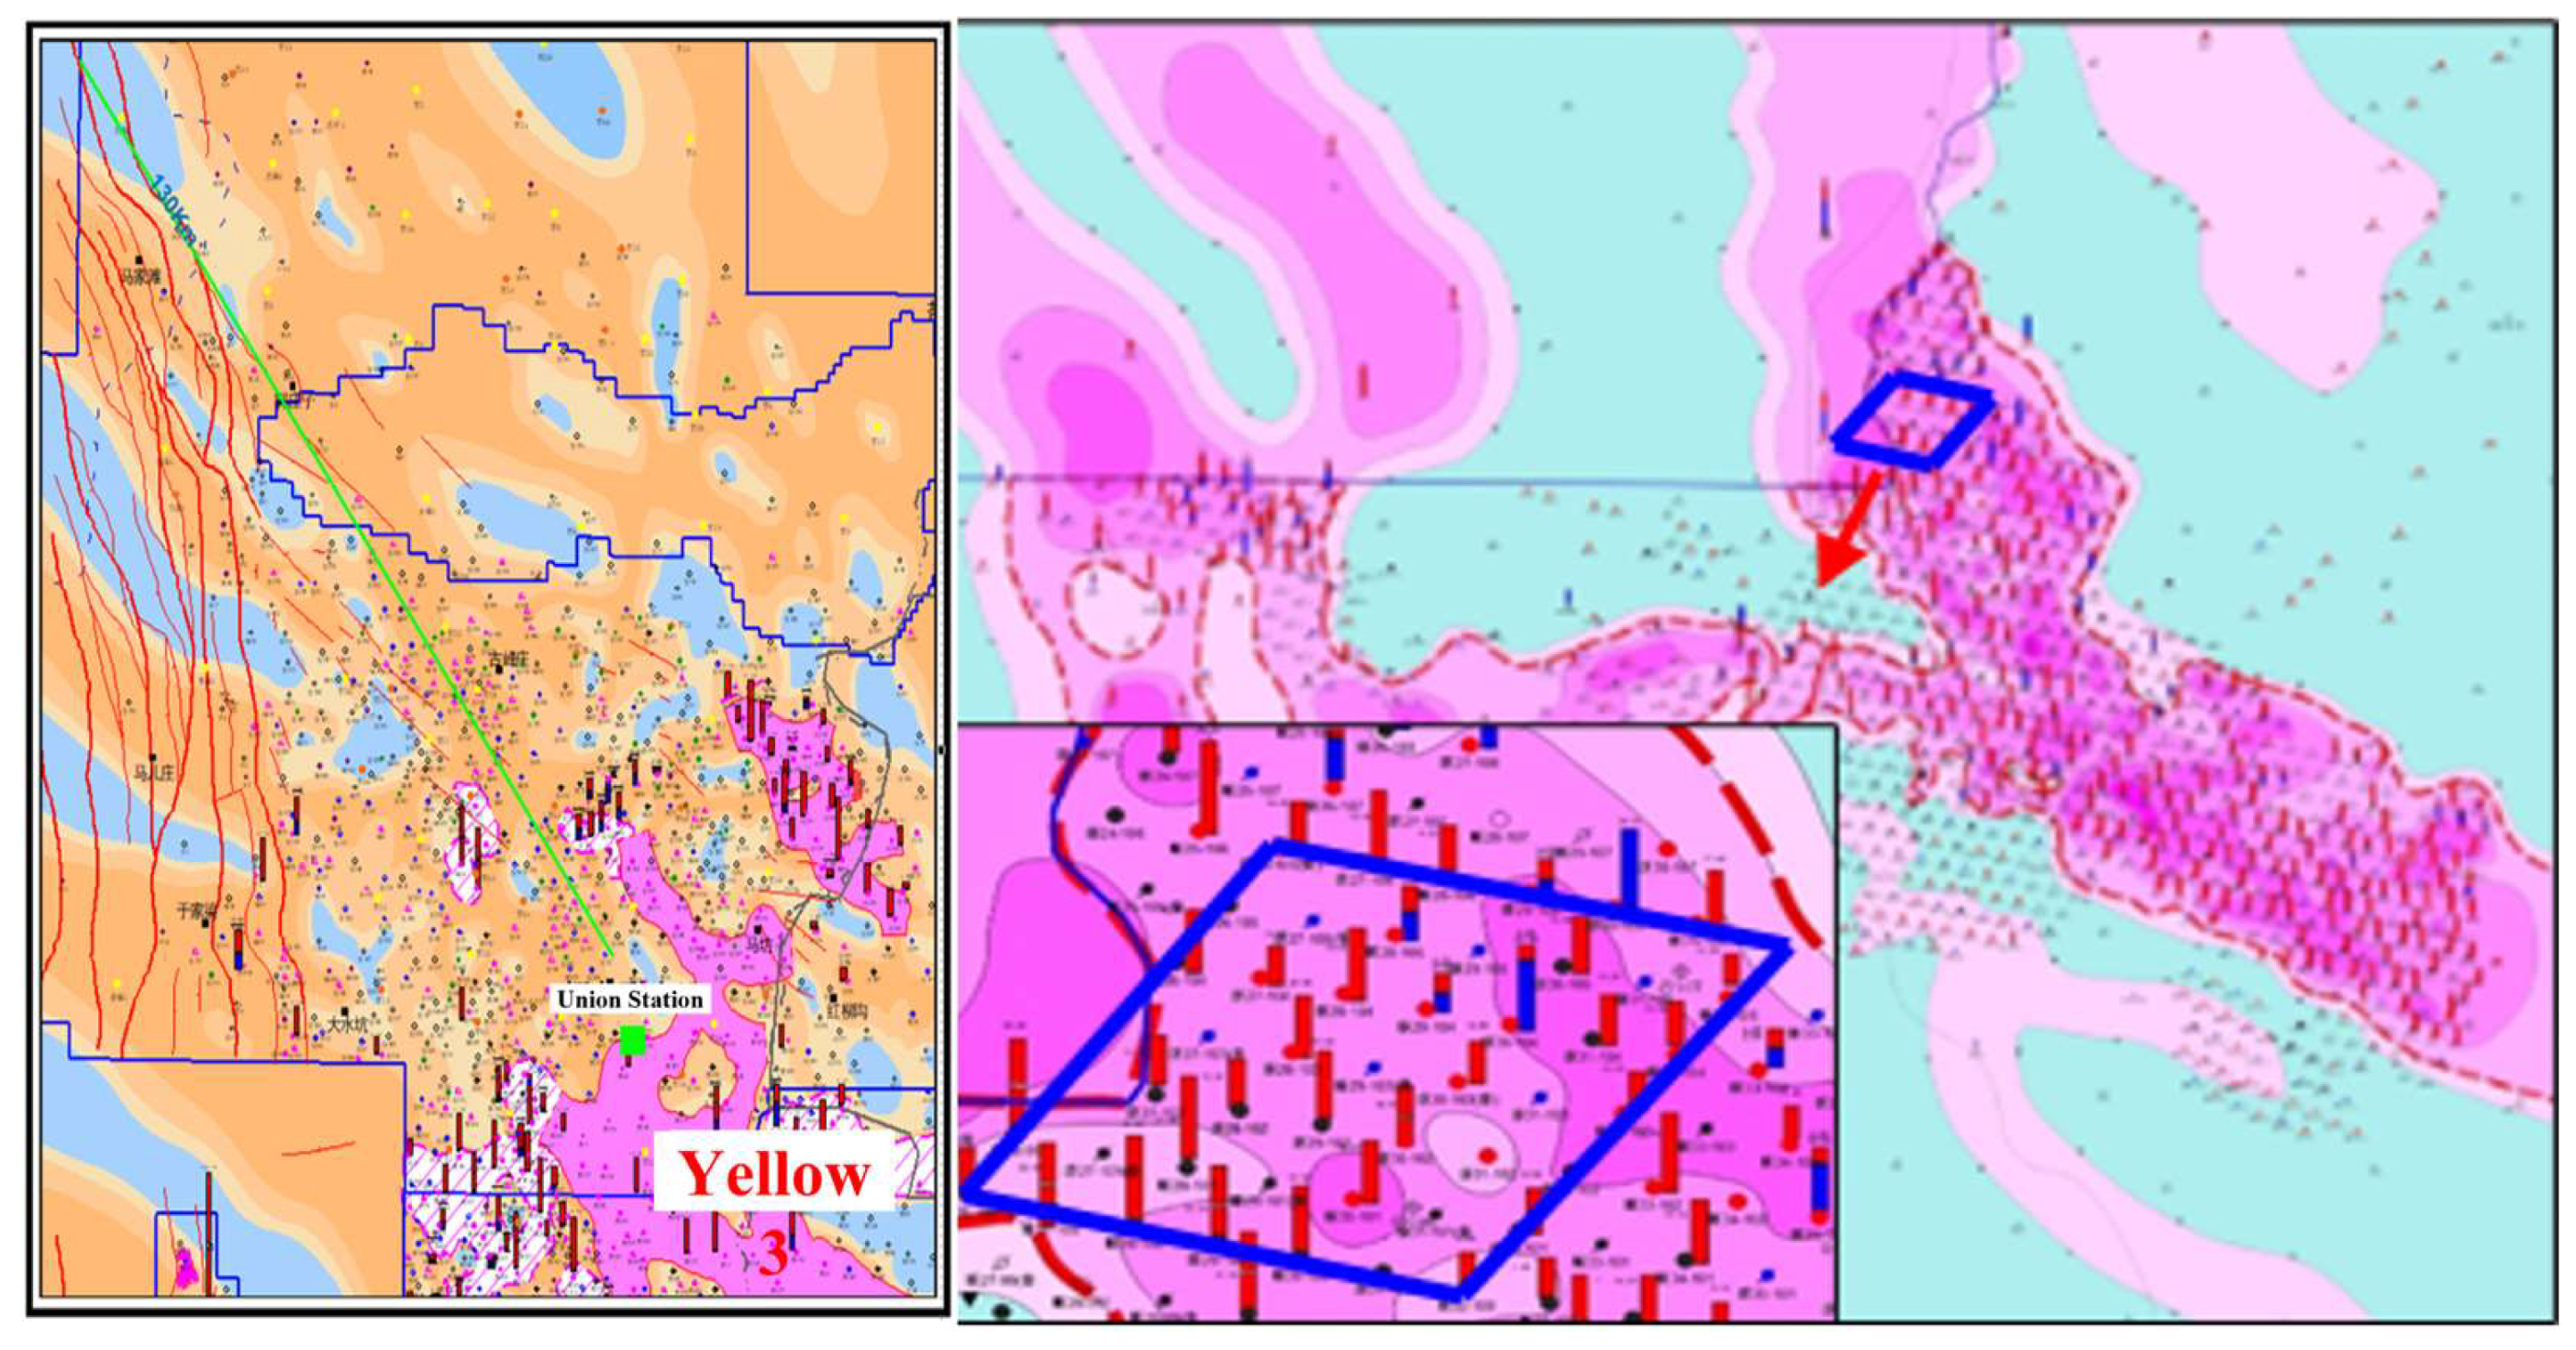
5. Model Applications

Based on the established coupled flow model of CCUS gas injection wellbore pressure drop, heat transfer and corrosion, combined with the actual gas injection situation in the CCUS Huang 3 area of the Changqing Oilfield, this paper discusses the effects of different injection temperatures, injection pressures, injection displacements and CO2 injection contents on wellbore temperature, pressure and corrosion rate. By analyzing the simulation results, optimization suggestions for gas injection process parameters are proposed to guide on-site gas injection. Combined with the gas injection well data in the Huang 3 area, the basic parameters used in the simulation calculation are determined as shown in Table 1, Table 2 and Table 3 [31].

5.1. Effect of Injection Temperature

Injection temperatures of 15 °C, 25 °C, 35 °C, 45 °C and 55 °C were selected to calculate the variation of fluid temperature, pressure and corrosion rate with well depth inside the tubing. The results are shown in Figure 5. As the injection temperature increases, the fluid temperature inside the tubing rises significantly, with the temperature change near the wellhead being particularly notable. As depth increases, the fluid temperature gradually rises toward the formation temperature. Below 1800 m, the temperature difference between the deep formation fluid and the formation itself becomes smaller, leading to a lower heat conduction efficiency, which slows the rate of temperature change and the temperature variation becomes less pronounced. The effect of injection temperature on tubing pressure is relatively minor but the overall trend shows a slight decrease in pressure as temperature increases. As the injection temperature rises, the corrosion rate significantly increases within the depth range from the wellhead to 1800 m, as the higher temperature accelerates the corrosion process. Beyond 1800 m, the corrosion rate stabilizes with respect to injection temperature and gradually decreases with increasing depth. Therefore, the corrosion rate inside the tubing first increases and then decreases with depth, exhibiting a clear inflection point. The higher the injection temperature at the wellhead, the sooner the fluid inside the tubing reaches the temperature corresponding to the maximum corrosion rate at shallower depths, thus causing the inflection point to shift upwards with increasing injection temperature.

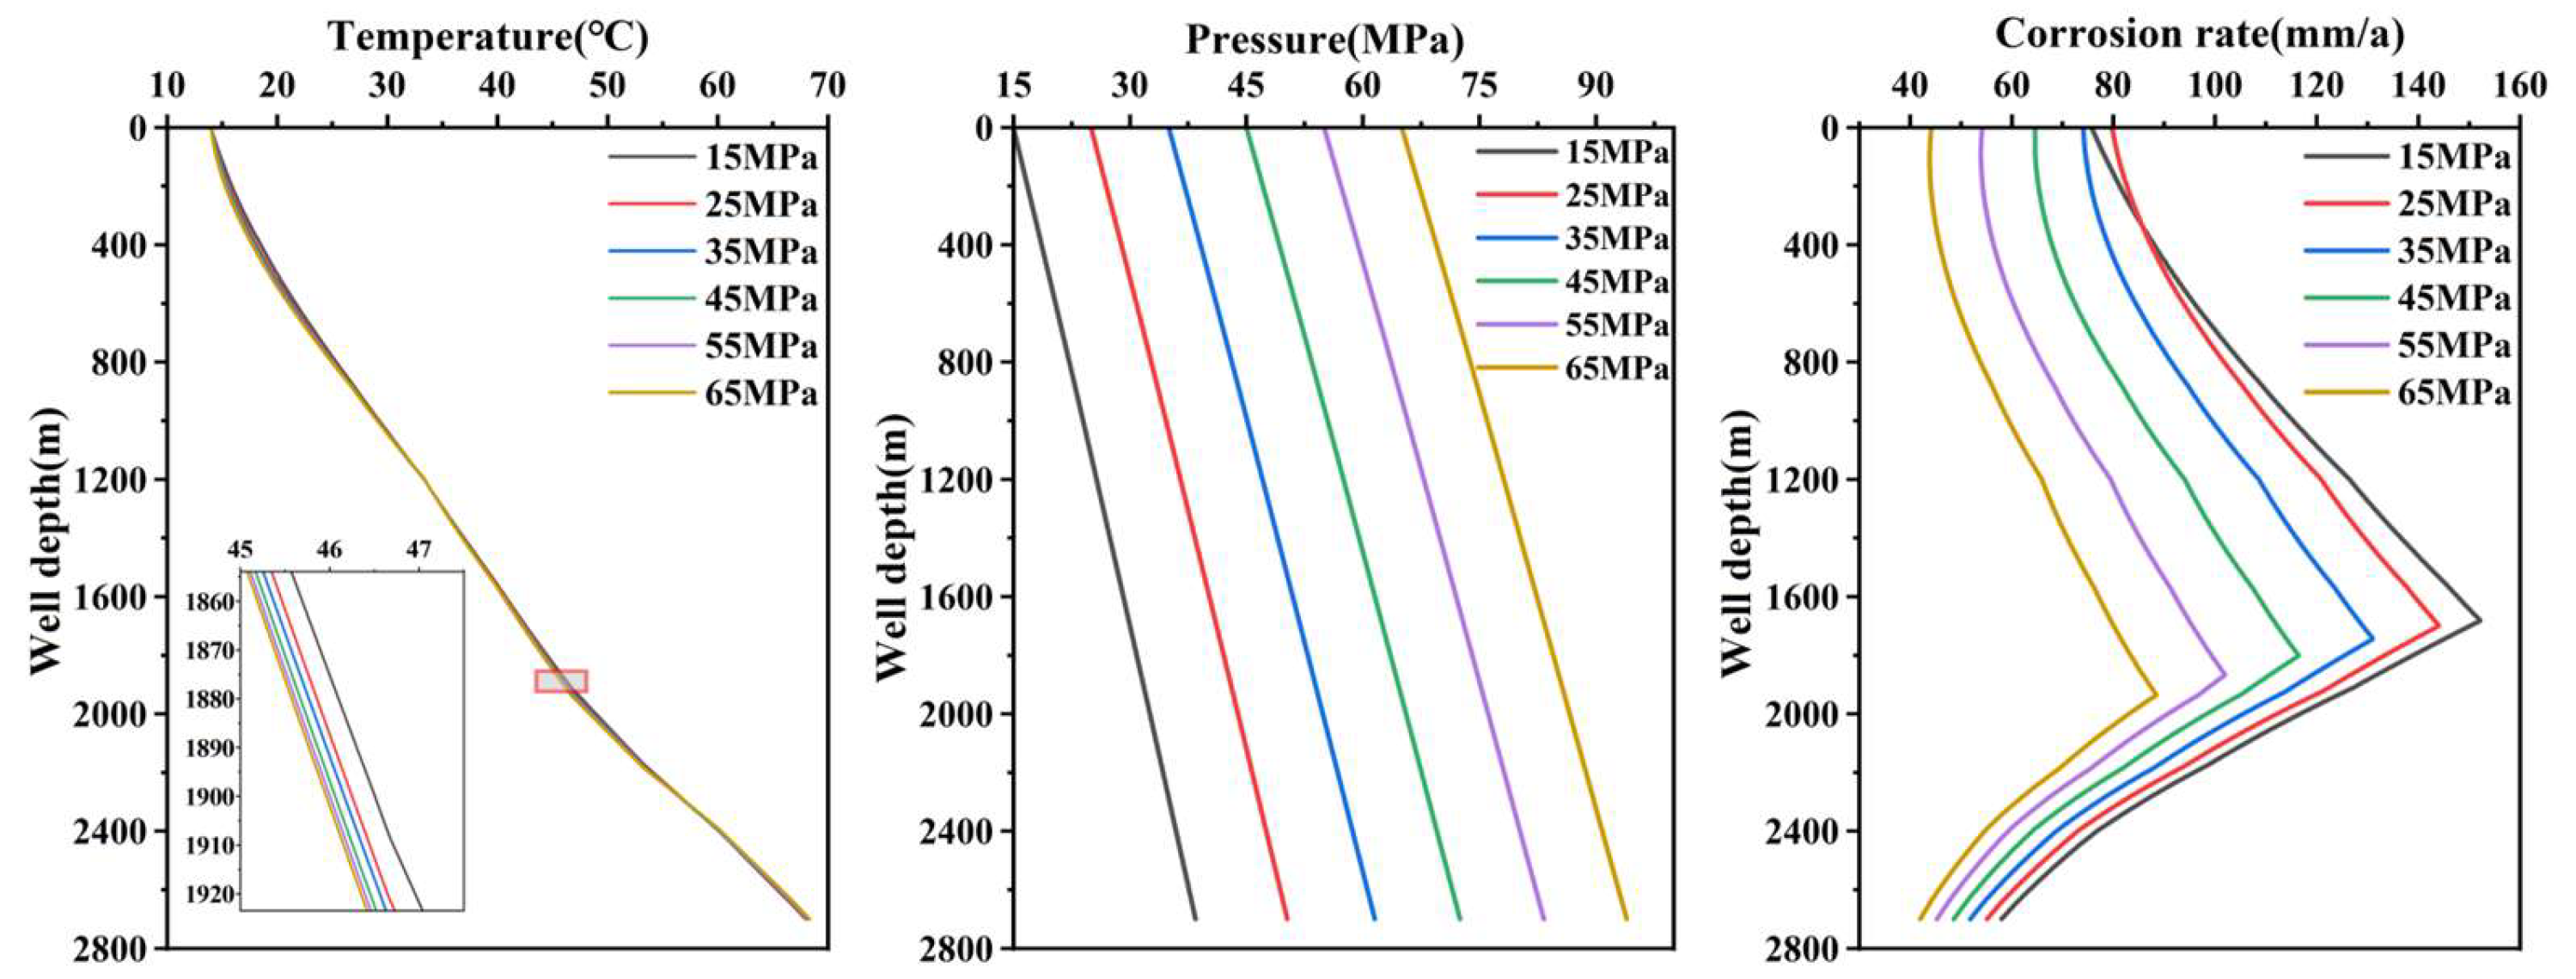
5.2. Effects of Injection Pressure

Injection pressures of 15, 25, 35, 45 and 55 MPa were selected to calculate the changes in fluid temperature, pressure and corrosion rate along the wellbore with depth. The results are shown in Figure 6. As seen from the figure, the variation in injection pressure has a minimal effect on the temperature distribution within the wellbore, with temperature curves remaining relatively consistent. As the injection pressure increases, the overall wellbore pressure increases significantly, showing a linear trend. With higher injection pressures, the corrosion rate in the wellbore noticeably decreases, following a trend of initially increasing and then decreasing with depth. The horizontal shift of each pressure curve indicates that lower injection pressures lead to a significant increase in the corrosion rate throughout the entire wellbore. In the upper section of the wellbore, the corrosion rate gradually increases with depth, showing a pronounced rise. In the middle section of the wellbore, the corrosion rate increases rapidly, reaching its peak. In the lower section of the wellbore, the corrosion rate gradually decreases.

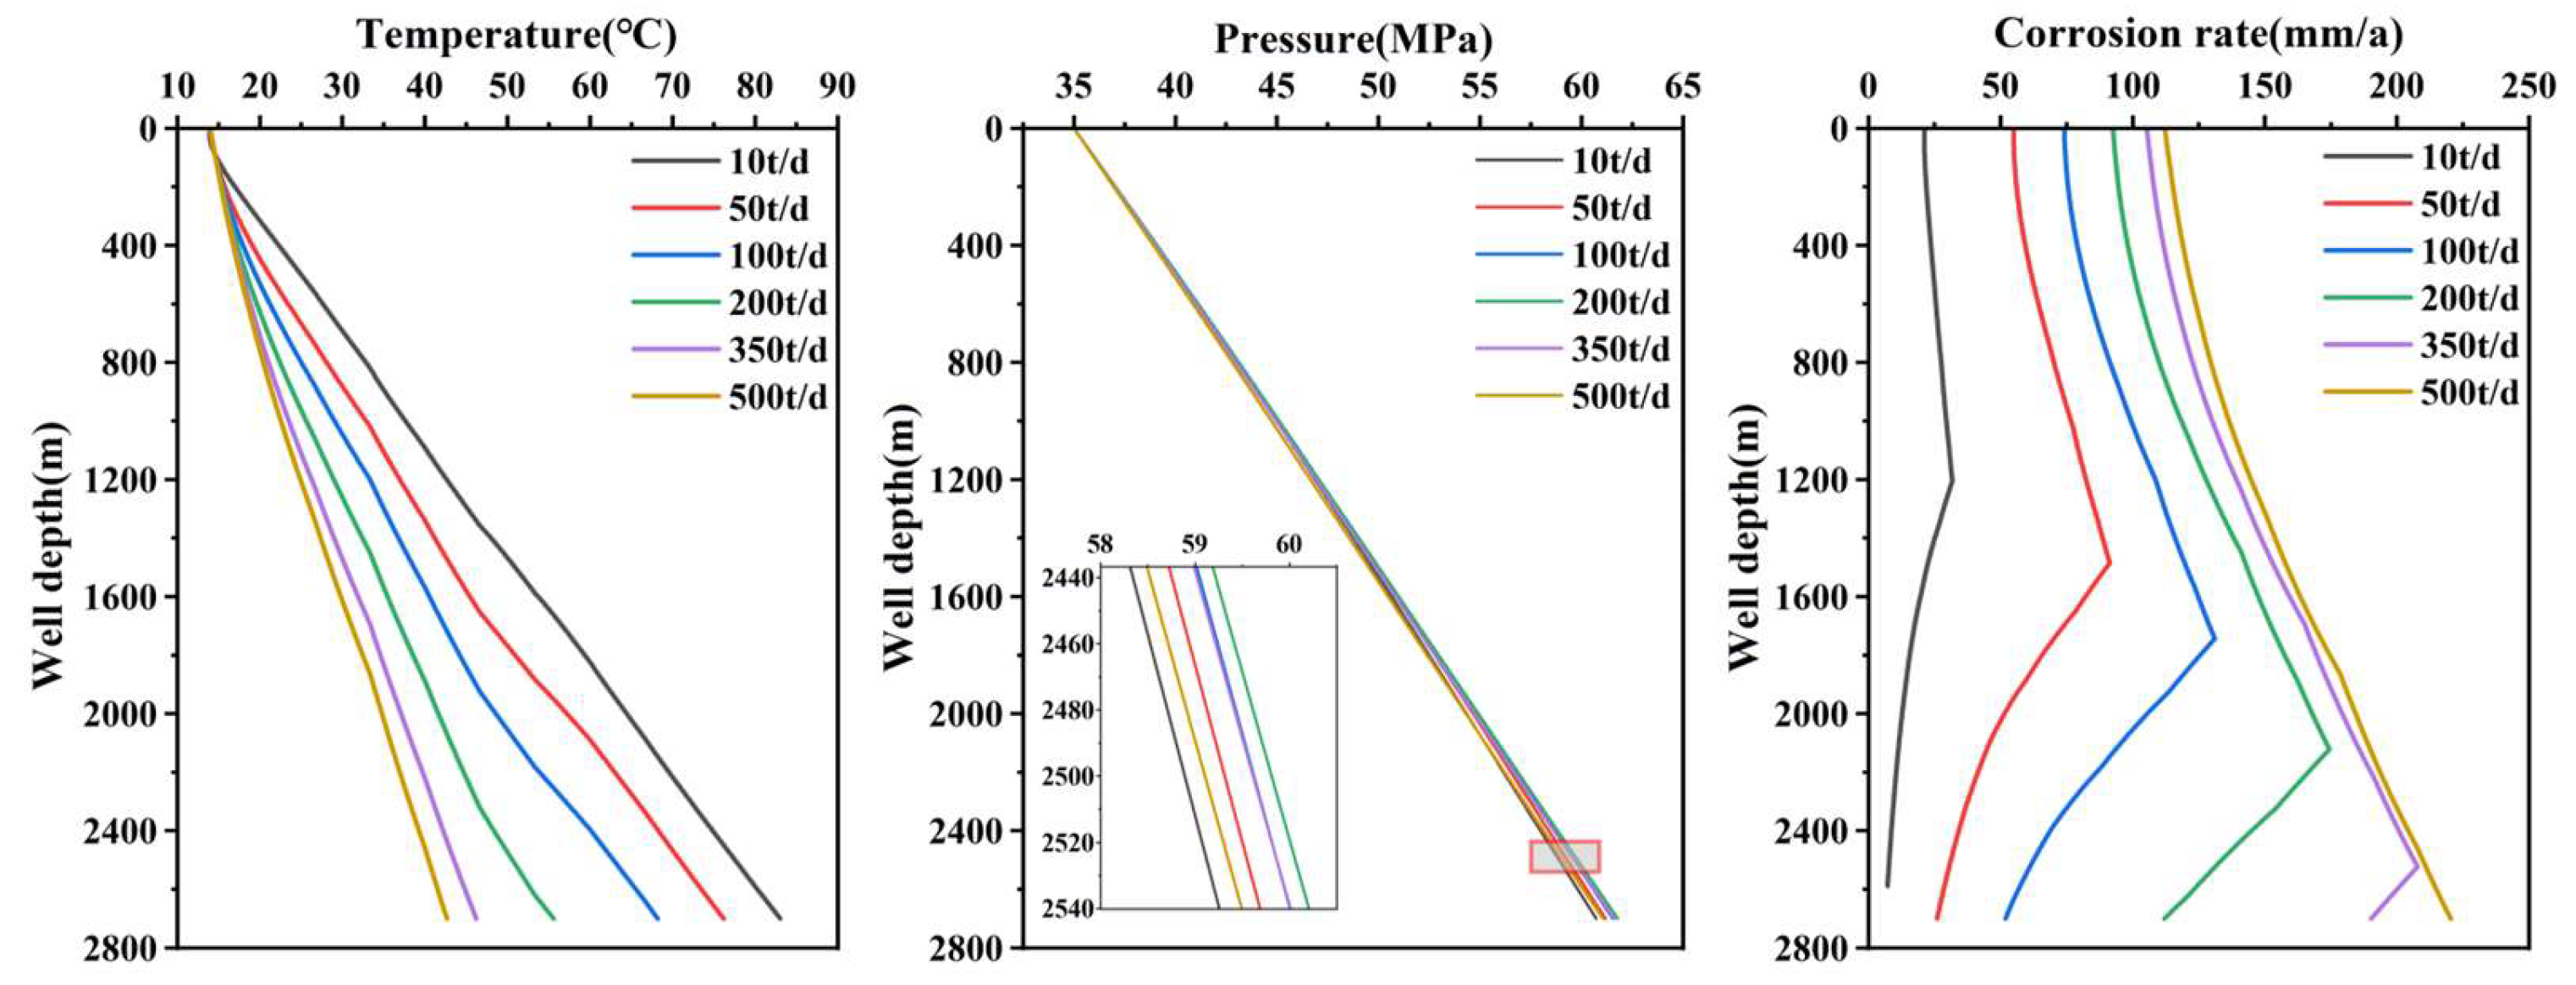
5.3. Effect of Injection Volume

The injection volume was chosen at 10, 50, 100, 200, 350 and 500 t/d to calculate the variations in fluid temperature, pressure and corrosion rate along the wellbore depth. The results are shown in Figure 7. As the injection volume increases, the flow velocity of the fluid in the wellbore increases and the heat exchange between the wellbore fluid and the surrounding formation decreases, leading to a reduction in wellbore temperature. The pressure curves for different injection volumes are very similar, with the pressure curve for a higher injection volume (e.g., 500 t/d) essentially overlapping with that for a lower injection volume (e.g., 10 t/d). Within this range, the impact of injection volume on the wellbore pressure is minimal. As the injection volume increases, the corrosion rate in the wellbore significantly increases and the point of maximum corrosion rate moves toward the well bottom. The corrosion effect is weaker at low injection volumes. Higher injection volumes lead to higher corrosion rates in the shallow section, but as the depth increases, the flow conditions, chemical reaction equilibrium and the formation of corrosion products gradually suppress the corrosion rate, ultimately leading to a trend where the corrosion rate first increases and then decreases. Additionally, the corrosion rates for different injection volumes gradually converge as the injection volume increases, with the rate of increase in corrosion rate diminishing.

5.4. Effect of CO2 Injection Concentration

The CO2 injection concentrations of 50%, 65%, 75%, 85%, 95% and 100% were selected and the variations of fluid temperature, pressure and corrosion rate along the well depth were calculated. The results are shown in Figure 8. As seen from the figure, the effect of CO2 injection concentration on the wellbore temperature is minimal. The wellbore pressure significantly increases with the increase in CO2 injection concentration. In cases where the field pumping capacity is limited, increasing the CO2 concentration in the injected fluid helps to increase the bottom-hole injection pressure. In the upper section of the wellbore, a higher CO2 concentration results in a rise in corrosion rate, but this effect is not as noticeable in the deeper sections of the wellbore.
In summary, the wellbore temperature is significantly influenced by the injection temperature and flow rate; the wellbore pressure is notably affected by the injection pressure and CO2 concentration; and the corrosion rate is strongly influenced by the injection temperature, pressure and flow rate.
Therefore, when optimizing the CO2 injection process parameters in the field, it is recommended to select a lower injection temperature and a higher injection pressure to reduce the corrosion rate in the upper part of the wellbore. Considering the limitations of the field pumping capacity and the impact of flow rate on corrosion, a moderate increase in CO2 concentration should be considered to maintain wellbore pressure while effectively controlling the corrosion rate.

6. Discussion and Conclusions

A coupled model for wellbore pressure drop, heat transfer and corrosion was developed for CCUS injection wells, considering the interactions between fluid properties, wellbore pressure drop, heat transfer and corrosion rate. The model was used to study the sensitivity of wellbore temperature, pressure and corrosion rate to injection temperature, injection pressure, injection flow rate and CO2 injection concentration, thereby clarifying the flow behavior in CO2 injection wells. The main research conclusions are as follows:
(1)
Wellbore temperature is highly sensitive to injection temperature and injection flow rate. It increases with higher injection temperature and decreases with larger injection flow rates. Wellbore pressure is more sensitive to injection pressure and CO2 injection concentration, increasing linearly with higher injection pressure and rising with increased CO2 injection concentration. Wellbore corrosion rate is highly sensitive to injection temperature, injection pressure and injection flow rate. It increases with higher injection temperature, decreases with higher injection pressure and increases with higher injection flow rate.
(2)
The wellbore corrosion rate curve exhibits a turning point, where it initially increases and then decreases with increasing well depth. In the upper and middle sections of the wellbore, the corrosion rate increases due to factors such as elevated temperature, increased CO2 solubility and higher flow velocity. However, in the lower section of the wellbore, the corrosion rate decreases.
(3)
The coupled model proposed in this study can be used to optimize injection parameters and develop an appropriate injection strategy. Special attention should be given to the changes in corrosion rate in the upper and middle sections of the wellbore at the site, with timely corrosion control measures implemented to ensure the safety of CO2 injection.
(4)
The simulation results in this study are based on specific injection parameters; however, in actual field conditions, wellbore flow may be influenced by factors such as multiphase flow and heterogeneous formations. These factors were not considered in this study, which may limit the applicability of the findings. It is recommended that future research take these factors into account to enhance the model’s applicability.

Author Contributions

All eight authors contributed to the completion of the study. W.L. was the primary author and conducted the main data analysis and manuscript drafting; T.L. supported data analysis and the interpretation of findings; C.L. assisted in reviewing and organizing the relevant literature and refining the research design; M.L. and P.Z. contributed to reviewing the manuscript and revising the results and conclusions; X.Y. helped in editing and providing feedback on the manuscript structure and clarity; B.W. served as the corresponding author, overseeing the revision and submission processes on behalf of the team; and H.W. contributed to the revision of the statistical analyses and overall coherence of the results. All authors have read and agreed to the published version of the manuscript.

Funding

Science Foundation of China University of Petroleum, Beijing (Grant Nos. 2462024YJRC019 and 2462022BJRC002).

Data Availability Statement

The original contributions presented in this study are included in the article. Further inquiries can be directed to the corresponding author.

Conflicts of Interest

Authors Wei Lv, Mingxing Li and Pei Zhou were employed by the (PetroChina Changqing Oilfield Co., and Cheng Lu was employed by the China National Oil and Gas Exploration and Development Company Ltd. The remaining authors declare that the research was conducted in the absence of any commercial or financial relationships that could be construed as a potential conflict of interest.

References

  1. International Energy Agency Paris. Transforming Industry Through CCUS; OECD: Paris, France, 2019. [Google Scholar]
  2. Li, Q.; Li, Q.; Wang, F.; Wu, J.; Wang, Y. The carrying behavior of water-based fracturing fluid in shale reservoir fractures and molecular dynamics of sand-carrying mechanism. Processes 2024, 12, 2051. [Google Scholar] [CrossRef]
  3. Li, Q.; Li, Q.; Han, Y. A numerical investigation on kick control with the displacement kill method during a well test in a deep-water gas reservoir: A case study. Processes 2024, 12, 2090. [Google Scholar] [CrossRef]
  4. Gasda, S.E.; Bachu, S.; Celia, M.A. Spatial characterization of the location of potentially leaky wells penetrating a deep saline aquifer in a mature sedimentary basin. Environ. Geol. 2004, 46, 707–720. [Google Scholar] [CrossRef]
  5. Pan, L.; Oldenburg, C.M.; Wu, Y.-S.; Pruess, K. Wellbore flow model for carbon dioxide and brine. Energy Procedia 2009, 1, 71–78. [Google Scholar] [CrossRef]
  6. Ahmadi, M.A.; Pouladi, B.; Barghi, T. Numerical modeling of CO2 injection scenarios in petroleum reservoirs: Application to CO2 sequestration and EOR. J. Nat. Gas Sci. Eng. 2016, 30, 38–49. [Google Scholar] [CrossRef]
  7. Lu, M.; Connell, L.D. Transient, thermal wellbore flow of multispecies carbon dioxide mixtures with phase transition during geological storage. Int. J. Multiph. Flow 2014, 63, 82–92. [Google Scholar] [CrossRef]
  8. Lu, M.; Connell, L.D. Non-isothermal flow of carbon dioxide in injection wells during geological storage. Int. J. Greenh. Gas Control. 2008, 2, 248–258. [Google Scholar] [CrossRef]
  9. Peng, D.Y.; Robinson, D.B. A new two-constant equation of state. Ind. Eng. Chem. Fundam. 1976, 15, 59–64. [Google Scholar] [CrossRef]
  10. Span, R.; Wagner, W. A new equation of state for carbon dioxide covering the fluid region from the triple-point temperature to 1100 K at pressures up to 800 MPa. J. Phys. Chem. Ref. Data 1996, 25, 1509–1596. [Google Scholar] [CrossRef]
  11. Al-Adwani, F.; Langlinais, J.; Hughes, R. Modeling of an underbalanced-drilling operation using supercritical carbon dioxide. SPE Drill. Complet. 2009, 24, 599–610. [Google Scholar] [CrossRef]
  12. Ruan, B.; Xu, R.; Wei, L.; Ouyang, X.; Luo, F.; Jiang, P. Flow and thermal modeling of CO2 in injection well during geological sequestration. Int. J. Greenh. Gas Control. 2013, 19, 271–280. [Google Scholar] [CrossRef]
  13. Aursand, P.; Hammer, M.; Lavrov, A.; Lund, H.; Munkejord, S.T.; Torsæter, M. Well integrity for CO2 injection from ships: Simulation of the effect of flow and material parameters on thermal stresses. Int. J. Greenh. Gas Control. 2017, 62, 130–141. [Google Scholar] [CrossRef]
  14. Shingo, A.; Emmanuel, H.; Olivier, P. Well integrity: Modeling of thermo-mechanical behavior and gas migration along wells-application to ketzin injection well. Energy Procedia 2012, 23, 462–471. [Google Scholar]
  15. Roy, P.; Morris, J.P.; Walsh, S.D.; Iyer, J.; Carroll, S. Effect of thermal stress on wellbore integrity during CO2 injection. Int. J. Greenh. Gas Control. 2018, 77, 14–26. [Google Scholar] [CrossRef]
  16. Dong, X.; Duan, Z.; Gao, D. Assessment on the cement integrity of CO2 injection wells through a wellbore flow model and stress analysis. J. Nat. Gas Sci. Eng. 2020, 74, 103097. [Google Scholar] [CrossRef]
  17. Zhang, Z.; Li, Y.J.; Zhang, C.; Huang, Y.; Guo, Y.; Luo, L.; Shi, T. Wellbore integrity design of high-temperature gas wells containing CO2. Nat. Gas Ind. 2013, 33, 79–86. [Google Scholar]
  18. De Waard, C.; Milliams, D.E. Carbonic acid corrosion of steel. Corrosion 1975, 31, 177–181. [Google Scholar] [CrossRef]
  19. De Waard, C.; Lotz, U.; Milliams, D.E. Predictive model for CO2 corrosion engineering in wet natural gas pipelines. Corrosion 1991, 47, 976–985. [Google Scholar] [CrossRef]
  20. Xiao, G.; Tan, S.; Yu, Z.; Dong, B.; Yi, Y.; Tian, G.; Yu, H.; Shi, S. CO2 corrosion behaviors of 13Cr steel in the high-temperature steam environment. Petroleum 2020, 6, 106–113. [Google Scholar] [CrossRef]
  21. Yin, Z.F.; Feng, Y.R.; Zhao, W.Z.; Bai, Z.Q.; Lin, G.F. Effect of temperature on CO2 corrosion of carbon steel. Surf. Interface Anal. 2009, 41, 517–523. [Google Scholar] [CrossRef]
  22. Moreira, R.; Franco, C.; Joia, C.; Giordana, S.; Mattos, O. The effects of temperature and hydrodynamics on the CO2 corrosion of 13Cr and 13Cr5Ni2Mo stainless steels in the presence of free acetic acid. Corros. Sci. 2004, 46, 2987–3003. [Google Scholar] [CrossRef]
  23. Nazari, M.H.; Allahkaram, S.R.; Kermani, M.B. The effects of temperature and pH on the characteristics of corrosion product in CO2 corrosion of grade X70 steel. Mater. Des. 2010, 31, 3559–3563. [Google Scholar] [CrossRef]
  24. Li, D.; Han, D.; Zhang, L.; Ma, W.; Lu, M.; Wang, L. Effects of temperature on CO2 corrosion of tubing and casing steel. Corrosion 2013, 2013, 85. [Google Scholar]
  25. Weiqiang, S.O.; Hongjian, N.I.; Yinghua, J.I. Study on wellbore flow field of supercritical carbon dioxide drilling. J. China Univ. Pet. 2017, 41, 101–107. [Google Scholar]
  26. Lu, J.; Hu, Q.; Zhang, D.; Yan, F.; Li, Y.; Nie, C. Numerical simulation of impurity-containing supercritical CO2 pipeline transport in CCUS. Int. J. Greenh. Gas Control. 2024, 138, 104236. [Google Scholar] [CrossRef]
  27. Chapman, S.; Cowling, T.G. The Mathematical Theory of Non-Uniform Gases. An Account of the Kinetic Theory of Viscosity, Thermal Conduction and Diffusion in Gases; Cambridge University Press: Cambridge, UK, 1970. [Google Scholar]
  28. Fang, T.; Liu, Y.; Bai, J.; Chen, H.; Zhao, S.; Li, Y.; Pang, M.; Wang, Y.; Dong, P. Transient heat transfer model for wellbore and formation of shut-in offshore oil wells. In Proceedings of the SPE Asia Pacific Oil and Gas Conference and Exhibition, Virtual, 17–19 November 2020, D022S006R008.
  29. Zhang, S.; Fu, J.; Peng, C.; Su, Y.; Zhang, H.; Yang, M. The Analysis of Transient Temperature in the Wellbore of a Deep Shale Gas Horizontal Well. Processes 2024, 12, 1402. [Google Scholar] [CrossRef]
  30. Papavinasam, S. Corrosion Control in the Oil and Gas Industry; Elsevier: Amsterdam, The Netherlands, 2013. [Google Scholar]
  31. Ahmadi, S.; Khormali, A. Development of an RSM-based predictive model for evaluation of corrosion efficiency of ATMP in one molar HCl for carbon steel samples. Pet. Sci. Technol. 2023, 42, 4537–4555. [Google Scholar] [CrossRef]
Figure 1. Flowchart of the model solution.
Processes 13 00439 g001
Figure 2. Demonstration area location map.
Processes 13 00439 g002
Figure 3. Schematic diagram of the wellbore structure.
Processes 13 00439 g003
Figure 4. Comparison of predicted downhole temperature and pressure with field-measured data.
Processes 13 00439 g004
Figure 5. Profiles of tubing temperature, pressure and corrosion rate at different injection temperatures.
Processes 13 00439 g005
Figure 6. Profiles of wellbore temperature, pressure and corrosion rate under different injection pressures.
Processes 13 00439 g006
Figure 7. The wellbore temperature, pressure and corrosion rate profiles under different injection volumes.
Processes 13 00439 g007
Figure 8. The wellbore temperature, pressure and corrosion rate profiles under different CO2 injection concentrations.
Processes 13 00439 g008
Table 1. Injected fluid parameters.
ParameterValue
Fluid componentImpure CO2
Injection temperature14 °C
Injection pressure35 MPa
Injection rate100 t/d
Table 2. Wellbore parameters.
ParameterValue
Depth of surface casing283.92 m
Depth of oil sleeve2660 m
Depth of tubing2703.25 m
Cement return height87.6 m
Perforated interval2698–2703 m
Packer2660 m
Casing gradeJ55
Tubing materialP110
Table 3. Formation parameters.
ParameterValue
Ground temperature12.91 °C
Geothermal gradient2.67 °C/100 m
Formation pressure19.74 MPa
Reservoir depth2700 m
Reservoir temperature85 °C
Reservoir thickness5.3 m
Permeability0.34 mD
Disclaimer/Publisher’s Note: The statements, opinions and data contained in all publications are solely those of the individual author(s) and contributor(s) and not of MDPI and/or the editor(s). MDPI and/or the editor(s) disclaim responsibility for any injury to people or property resulting from any ideas, methods, instructions or products referred to in the content.

