Abstract
This study evaluated the efficiency of methylene blue (MB) removal by using activated carbon produced from olive pits. The activated carbon (OPAC) was characterized by scanning electron microscopy (SEM), Fourier-transform infrared spectroscopy (FTIR), and Brunauer–Emmett–Teller (BET). The adsorption process was optimized in two stages using factorial design. Based on the existing literature, the first stage selected the most influential variables (reaction time, dosage, pH, and dye concentration). Response surface methodology (RSM) and artificial neural network (ANN) approaches have been combined to optimize and model the adsorption of MB. To assess the optimal conditions for MB adsorption, RSM was initially applied using four controllable operating parameters. Throughout the optimization process, various independent variables were employed, including initial dye concentrations ranging from 25 to 125 mg/L, adsorbent dosages ranging from 0.1 to 0.9 g/L, pH values spanning from 1 to 9, and contact times ranging from 15 to 75 min. Moreover, the R2 value (R2 = 0.9804) indicates that regression can effectively forecast the response of the adsorption process within the examined range. Thermodynamic studies were performed for three different temperatures between 293 and 303 K. Isothermal analysis parameters and negative Gibbs free energy indicate that the process is spontaneous and favorable. The data best fit the Langmuir model. This research showcases the effectiveness of optimizing and predicting the color removal process through the combined RSM-ANN approach. It highlights the effectiveness of adsorption using OPAC as a viable primary treatment method for the removal of color from wastewater-containing dyes.
1. Introduction
Pollution from industrial waste, which contains toxic and harmful chemicals, poses a significant threat to the environment and life on our planet [1]. Key contributors to this pollution include heavy metals from the metal industry, the petroleum industry, and waste from the paint industry [2,3]. These pollutants significantly affect water resources, which are essential for sustaining life. One of these dyes, methylene blue (MB), is an organic chloride salt (commonly used in the wood, silk, and linen processing industries) [4]. Despite its significance, it can also be highly toxic, potentially causing severe skin irritation, burns, respiratory failure, and even cancer [4,5]. Due to the aromatic rings of its chemical structure, MB exhibits high stability and resistance to both photodegradation and thermal degradation. Therefore, many studies have been aiming to find ways of removing it from industrial wastewater [6,7]. The key is identifying reliable techniques for effectively removing these organic dyes from contaminated surface waters [8]. For this purpose, different physical, chemical, and bioremediation methods have been developed, including ultrafiltration [9], coagulation [10], adsorption [11], photocatalytic degradation [12], and biodegradation [13]. Among these methods, the adsorption procedure has been presented as a particularly cost-effective and efficient approach for treating organic dyes. Unlike adsorption, many current treatment strategies are expensive and generate by-products [14]. Recently, a growing emphasis has been on utilizing low-cost and readily available materials as adsorbents for removing dyes from industrial effluents [15,16]. Agricultural by-products, produced in abundance, have been explored as raw materials and sources for producing activated carbons. These activated carbons possess desirable characteristics such as a high specific surface area, well-developed microporosity, and abundant functional groups, all enhancing their efficacy in removing dyes and other organic and inorganic pollutants from aqueous solutions [16]. The sustainable management of these wastes, therefore, represents a significant challenge. Various management options for these by-products have been tested and applied on a laboratory scale. The properties of activated carbon derived from olive pomace (OP) agricultural waste vary depending on the activating agent used, its concentration, combustion temperature, and residence time [17]. ZnCl2 represents one of the best-activating agents in terms of ensuring the attractiveness of the physicochemical properties of the derived activated carbon [16]. Zinc chloride activation initiates an electrolytic effect on the molecular structure of cellulose called swelling [15]. Swelling causes the disintegration of cellulose molecules and increases voids with different internal and intermediate coatings, resulting in a higher surface area in the activated carbon [11]. The movement of volatile substances in the cellulosic structure through pores saturated with zinc chloride is not impaired. During activation, volatile substances are released from the activated carbon surface [17]. Then, nitrogen absorption on the activated carbon increases, and the surface area and adsorption capacity increase with the rise in porous structure. Zinc chloride acts as a Lewis acid and enhances condensed aromatic reactions by facilitating molecular hydrogen deformation from the hydro-aromatic structure of the precursors. Thus, polymerization reactions occur and are affected by excluding some active sites from adjacent molecules [16].
Various chemical conditions and environmental parameters significantly influence the adsorption process, primarily at the surface [17]. The interaction between the adsorbent and the adsorbate has been extensively investigated in the literature using classical methods and analyzed using kinetic and isotherm model equations [18].
Conventional optimization studies provide limited information about the process under investigation, even allowing many experiments to be considered [19]. When the optimal conditions are changed, the efficiency of the removal process can only be determined through new experiments [20]. In recent years, instead of classical optimization, experimental design methods have been intensively employed and can be used to create a mathematical model to determine the effects of variables on color removal and to identify the most suitable variable values. The interaction between the investigated independent variables can also be elucidated through statistical analysis of the obtained model equation [21]. Over the past two decades, Response Surface Methodology (RSM) has gained significant attention within multivariate experimental design methods, particularly in designing, modeling, and optimizing environmental and chemical experiments. Numerous researchers have employed RSM to investigate and enhance processes related to the treatment of water and wastewater [22]. RSM is a statistical modeling technique that finds practical applications for optimizing experimental parameters, particularly within chemical processes. By evaluating the interplay among independent variables, it devises an experimental framework to ascertain the most favorable conditions [23]. Incorporating RSM for treatment optimization yields information on more precise conditions and diminishes the requisite number of experiments compared to conventional approaches [19]. This reduction in experimental workload translates to significant savings in both time and costs. RSM is particularly substantial in designing, modeling, and optimizing environmental and chemical experiments. Numerous researchers have harnessed RSM to investigate and refine processes related to the treatment of water and wastewater [21]. As a statistical modeling tool, RSM is notably efficacious in chemical processes, facilitating the optimization of experimental parameters. Evaluating the interplay among independent variables tailors an experimental setup in such a way as to discern the most optimal conditions [24]. Thus, the adoption of RSM ensures the derivation of more precise treatment conditions and streamlines the experimental process, effectively curtailing the expenditure of time and resources. In recent studies, ANNs have been widely employed as robust tools capable of addressing a broad range of problems, such as non-linear mathematical relationships between input and output relating to a particular network. An ANN is an information-processing paradigm inspired by the workings of the human brain, consisting of many interconnected neurons [25]. A neuron is a processing element that takes a set of inputs, determines their weights, sums them up, adds a bias, and uses the result to argue for a single-valued function (transfer function), leading to the neuron’s output [26]. In the literature, many researchers have investigated and compared the predictive capabilities of RSM and ANN modeling techniques [20,26,27]. Many authors have shown that ANNs outperform RSM in predicting system responses. One drawback of RSM is its inability to account for uncontrollable variables. Conversely, an ANN is a soft computing method that scrutinizes the process by adjusting network weights to produce the desired response. However, it does not require precise knowledge of the physical/chemical processes affecting the system. As a result, it can be used to develop a strong non-parametric simulation model [28,29,30]. In the literature, many researchers have applied this method to remove various pollutants through adsorption [21,27,31,32]. Combining the soft computing capabilities of ANNs with RSM is crucial for overcoming the limitations inherent in RSM and accurately predicting real-world outcomes under given conditions. The primary objective of employing the RSM-ANN approach is to address the constraints of RSM, particularly its inability to accommodate uncontrollable parameters in the modeling process.
The literature often states that a single modeling method is generally insufficient for dye removal from wastewater. The combination of ANNs and RSM is a practical approach as it improves modeling accuracy, efficiency, and optimization in non-linear and complex processes such as dye removal [33,34]. Consequently, this integrated approach, which requires fewer experiments and considers the underlying dynamics of post-process parameters, holds the potential to yield more realistic solutions. Using the RSM-ANN approach makes it feasible to explore the practical relationships between independent parameters (inputs) and the response parameters of a process based on empirical data, thereby enhancing our understanding of complex systems and facilitating more informed decision-making.
The main objective of this study is to determine and optimize the removal of MB dye using the OPAC adsorbent, taking into account dynamic interactions among process variables. For this purpose, a central composite design (CCD)-based RSM and the ANN technique were employed simultaneously. The four experimental parameters investigated were reaction time, initial pH, initial dye concentration, and adsorbent dosage. All these parameters were applied simultaneously, and their relative effects were calculated. RSM and ANN methods were used to optimize the MB removal conditions.
Additionally, the affinities between activated carbon and MB and the maximum adsorption capacity were investigated through isothermal experiments by fitting the data to the Langmuir and Freundlich models. Information on the spontaneity of the process was obtained through the calculation of the Gibbs free energy variation (ΔG°). Our findings enhance the understanding of the adsorption process and provide valuable insights for experimental optimization, paving the way for future industrial-scale applications.
2. Materials and Methods
2.1. Chemicals
In this study, MB, a cationic dye commonly used in the textile industry, was utilized. The compound C16H18ClN3S, widely known as methylene blue, with a molecular weight of 319.85 g/mol, was procured from the Merck (Germany) company. A 1000 mg/L concentrated solution of MB was prepared for the adsorption experiments and then appropriately diluted as needed for the experiments.
2.2. Preparation and Characterization of Adsorbent
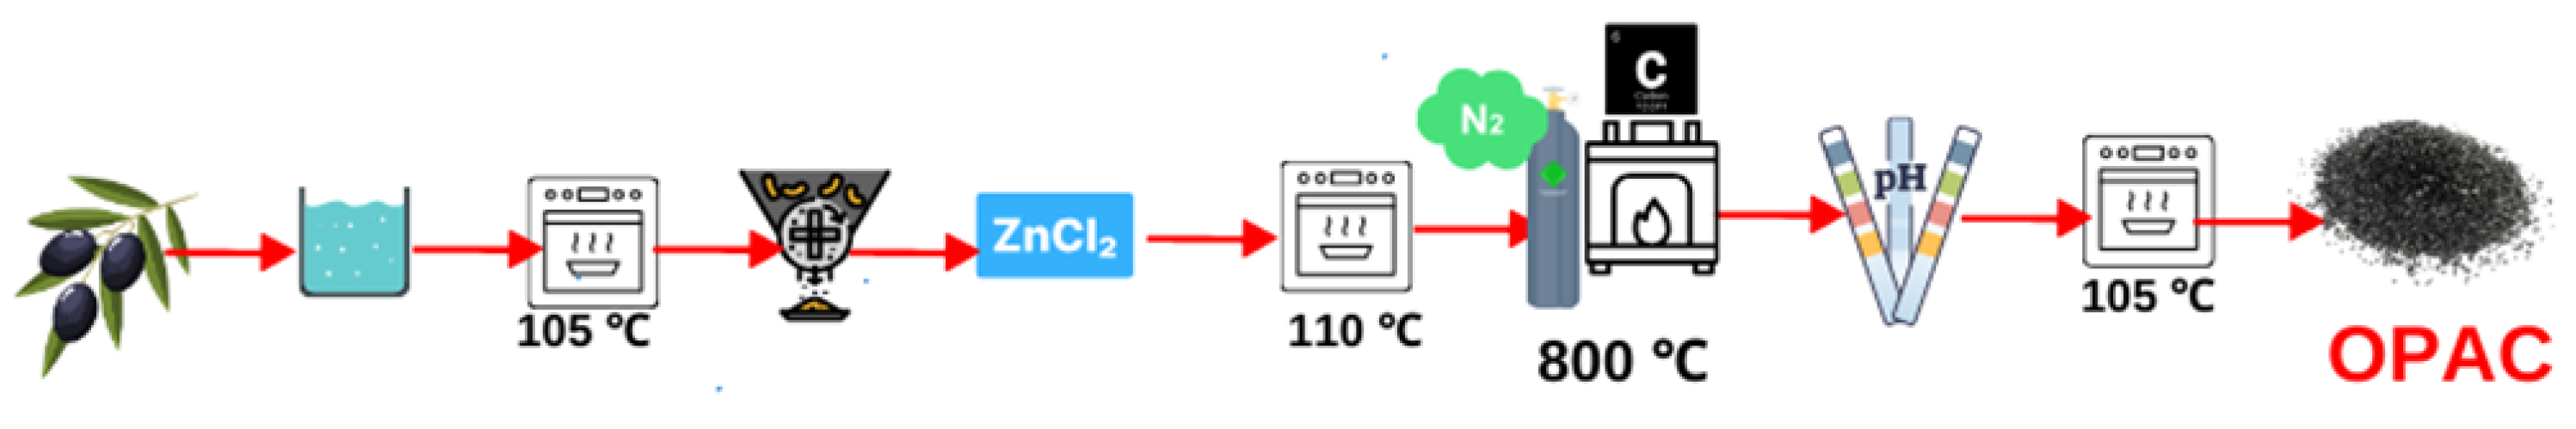
The olive pits collected from the Geyve/TURKEY district underwent meticulous preparation. Initially, the samples underwent a comprehensive rinsing process using distilled water (Minipure Destup), after which they were dried in an oven (JSR, JSOF-100) at a temperature of 105 °C. Once completely dried, the pits were finely ground using a hammer mill, and various particle sizes were achieved by sifting them through sieves. In this study, ZnCl2 was chosen as the chemical reagent. Olive pits were subjected to an impregnation (soaking) process at a mass ratio of 1:1 (ZnCl2/OP). After 24 h of impregnation, the samples were dried at room temperature and then in an oven at 110 °C with occasional stirring. Once completely dried, the samples underwent a carbonization process in a muffle furnace (Protherm PTF 12 brand tube furnace) at a temperature of 800 °C with a heating rate of 10 °C/min for one hour. After the carbonization stage, the samples were washed with distilled water until the pH reached 6–7 and then dried in an oven at 110 °C (Figure 1). The Brunauer–Emmett–Teller (BET) surface area and the pore measurements of the activated carbon (OPAC) were determined using the MICROMERITIC ASAP 2020 surface area meter, a product of MICROMERITIC based in Norcross, GO, USA. To analyze the functional groups of the olive pits, activated carbon from the olive pits, and activated carbon before and after adsorption, a SHIMADZU IR Prestige Fourier-transform infrared (FTIR) spectrometer (model 21) from Kyoto, Japan, employing the attenuated total reflectance (ATR) method, was utilized. Absorbance values of functional groups within the 4000–400 cm−1 wavelength range were determined to elucidate the structural changes. Scanning electron microscopy (SEM) analyses were carried out for pre- and post-adsorption states of the activated carbon using a Jeol JSM-6060 LV device. The studies were conducted under high vacuum conditions at 20 kV. The gold coating was applied to ensure the conductivity of the powdered activated carbon, and subsequent SEM imaging was performed at magnifications ranging from 1000× to 300,000×, within a resolution range of 50 μm to 200 nm
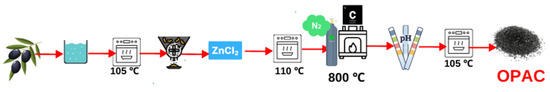
Figure 1.
Schematic diagram of the OPAC preparation.
2.3. Adsorption Studies
Adsorption studies were conducted using a 100 mL MB solution with initial concentrations ranging from 25 to 125 mg/L and 0.1 g of activated carbon. Samples were taken from the methylene blue solutions at specific time intervals, and absorbance measurements at a wavelength of 664 nm were performed using a UV-VIS spectrophotometer. Concentrations were determined using the prepared calibration curve. Equation (1) was used to measure the adsorption capacity. The percentage removal efficiencies were calculated using Equation (2). Subsequently, these values were employed in the optimization process of the RSM.
The parameter qe (mg/g) signifies the adsorption capacity of the MB, where C0 (mg/L) stands for the starting concentration of the MB, Ce (mg/L) denotes the equilibrium concentration of the adsorbate, V represents the volume of the solution (L), and m signifies the mass of the adsorbent (g).
2.4. Response Surface Method
Achieving a practical design and meticulous control of the adsorption process entails optimizing diverse operational parameters centered around removing dyes. RSM integrates statistical techniques and tools to establish the correlation between the dependent and independent variables. Consequently, RSM represents a precise and time-efficient alternative to conventional optimization approaches [35].
The main objective of RSM is to increase the response surface generated by process parameters. RSM offers a methodology for elucidating the response variable through an expression derived from several independent variables. This approach proves beneficial when identifying numerous independent input variables with actual values using intricate mathematical equations, which becomes challenging or unfeasible, a scenario encountered across various fields.
When the system’s independent variables display autonomy, the response function adopts a linear structure. However, when non-linearity is present, higher-order polynomials are utilized. Equation (3) illustrates a quadratic model.
Here, Y is the response variable; and are arguments; are regression coefficients; and represents the stochastic error term.
The study followed a two-stage experimental approach. The first stage involved Plackett–Burman (PB) screening experiments, then identifying influential parameters and their effects during the second stage. Table 1 shows the independent variables alongside their respective observed values.

Table 1.
Design of experiments for OSAC and the results obtained.
Table 2 presents the design matrix containing 30 experiments alongside the obtained results.
Table 2.
Experimental design of OPAC and obtained results.
2.5. Artificial Neural Network
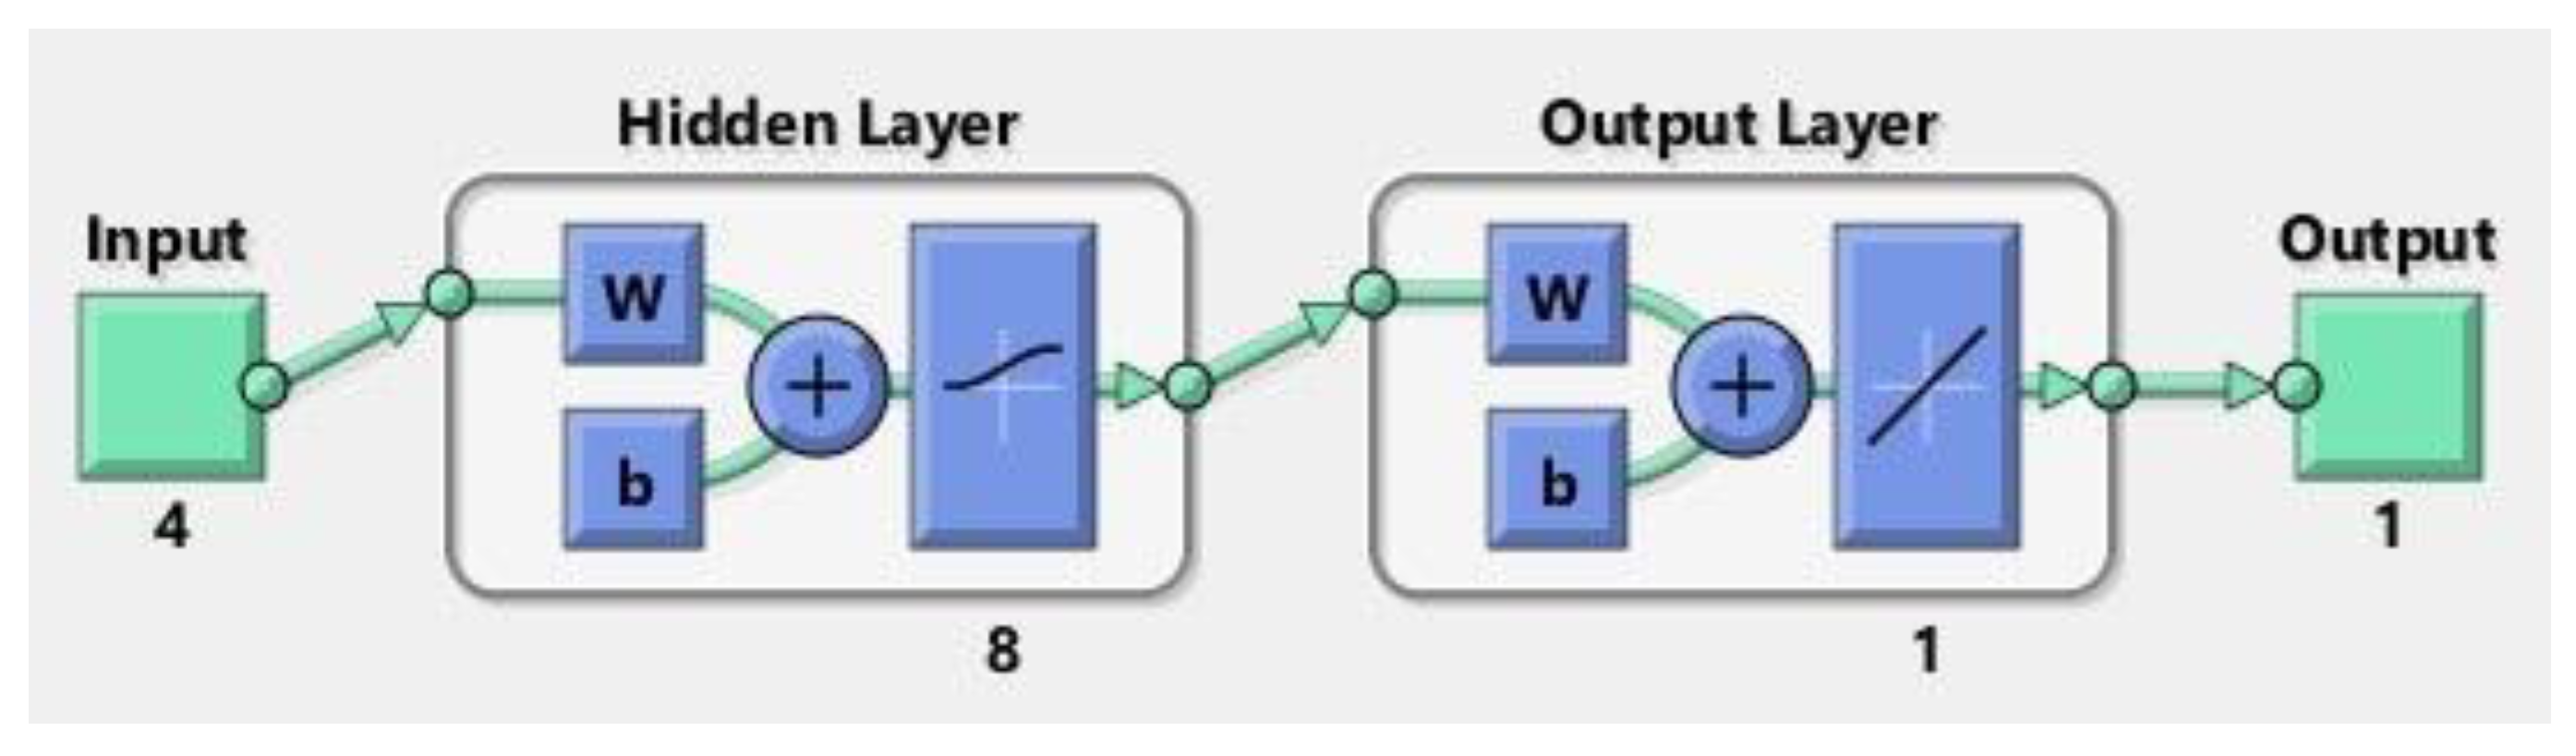
An ANN is a mathematical framework extracted from interdependent process variables, constituting a pivotal modeling instrument in domains such as predictive analytics, regression analysis, and pattern recognition. Moreover, it exhibits distinctive benefits encompassing reliability, resilience, and adeptness in grasping intricate and non-linear phenomena [36]. In this study, an ANN method was employed to remove MB dye. This research aims to forecast the proportion of dye removed from wastewater based on various parameters. To this end, initial solution pH, quantity, contact time, and initial solution concentration were utilized as inputs, while the percentage removal parameter was determined as the output. The ANN model is built upon three separate concealed layers, constituting the core structure. In contrast, the output layers are denoted as neurons, as illustrated in Figure 2. Inputs and outputs were employed to approximate the connections between these layers.
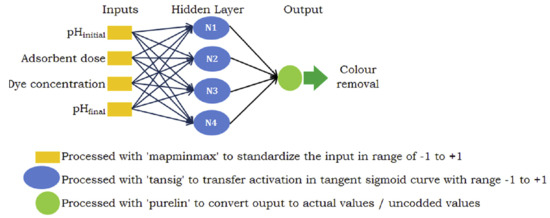
Figure 2.
Schematic diagram of the ANN model.
The ANN model was developed using Matlab (R2020a) software. ANNs are advanced computational tools capable of modeling complex relationships in data, making them highly effective for solving environmental problems in contaminant removal [1]. ANNs are not directly used to remove contaminants but rather to optimize or simulate the processes involved in their removal. For example, in this application/to remove MB dye using ANNs, this approach can be used for data collection, training the ANN, optimization, and validation. ANNs can be employed to model the efficiency of contaminant removal systems (e.g., adsorption, chemical treatments, or biological processes). They analyze input variables, such as pH, temperature, contaminant concentration, and removal material properties, to predict the output, such as removal efficiency or final contaminant concentration. ANNs help optimize the parameters of the contaminant removal process. For example, in the removal of MB, ANNs can determine the ideal conditions (e.g., adsorbent dosage, contact time, and pH) for maximum removal efficiency by analyzing experimental or historical data. In short, ANN models, with their predictive and optimization capabilities, provide decision-making support by identifying the best treatment methods, materials, and conditions for specific contaminants while enhancing the efficiency and sustainability of contaminant removal processes and minimizing trial and error in experimental studies [37]. The model incorporates input factors such as pH, adsorbent dosage, MB concentration, and contact duration, with the output being the percentage removal value. After experimentation, it was determined to employ an intermediate layer comprising 8 neurons utilizing the log-sigmoid transfer function. All data were normalized within the range of [−1, 1]. The Levenberg–Marquardt algorithm, commonly used for optimizing the loss function in small-scale problems, was chosen to minimize the mean squared error. Of the 30 data points obtained from the central composite experimental design, 70% was assigned for training, while 15% each was allocated for validation and testing purposes. Following the training phase, robust correlation coefficients were observed across all datasets: training, validation, and testing. The data were normalized within the range of 0–1 and underwent this normalization process for processing in the Matlab program. Hence, the data (Xi) were transformed into normalized values (Xnormal) as follows [38]:
In this equation,
Xnormal = the normalized data;
xi = the input value;
xmin = the minimum input value;
xmax = the maximum input value.
3. Results and Discussion
3.1. Characterization
Surface area, porosity, and pore size distribution are the most crucial parameters for assessing the adsorption capacity of porous carbon materials. To determine the adsorption capacity of OPAC, various parameters of OP and OPAC, such as micropore or average pore, surface area, and others, were identified through BET analysis and are presented in Table 3.
Table 3.
Textural properties of OP and OPAC.
As can be seen in Table 3, the BET surface area of OP increased from 113.0270 m2/g to 796.5884 m2/g after activation with ZnCl2. The t-plot micropore volume increased from 0.180297 cm3/g to 0.307852 cm3/g. Additionally, the average pore size narrowed from 2.687 nm to 2.489 nm.
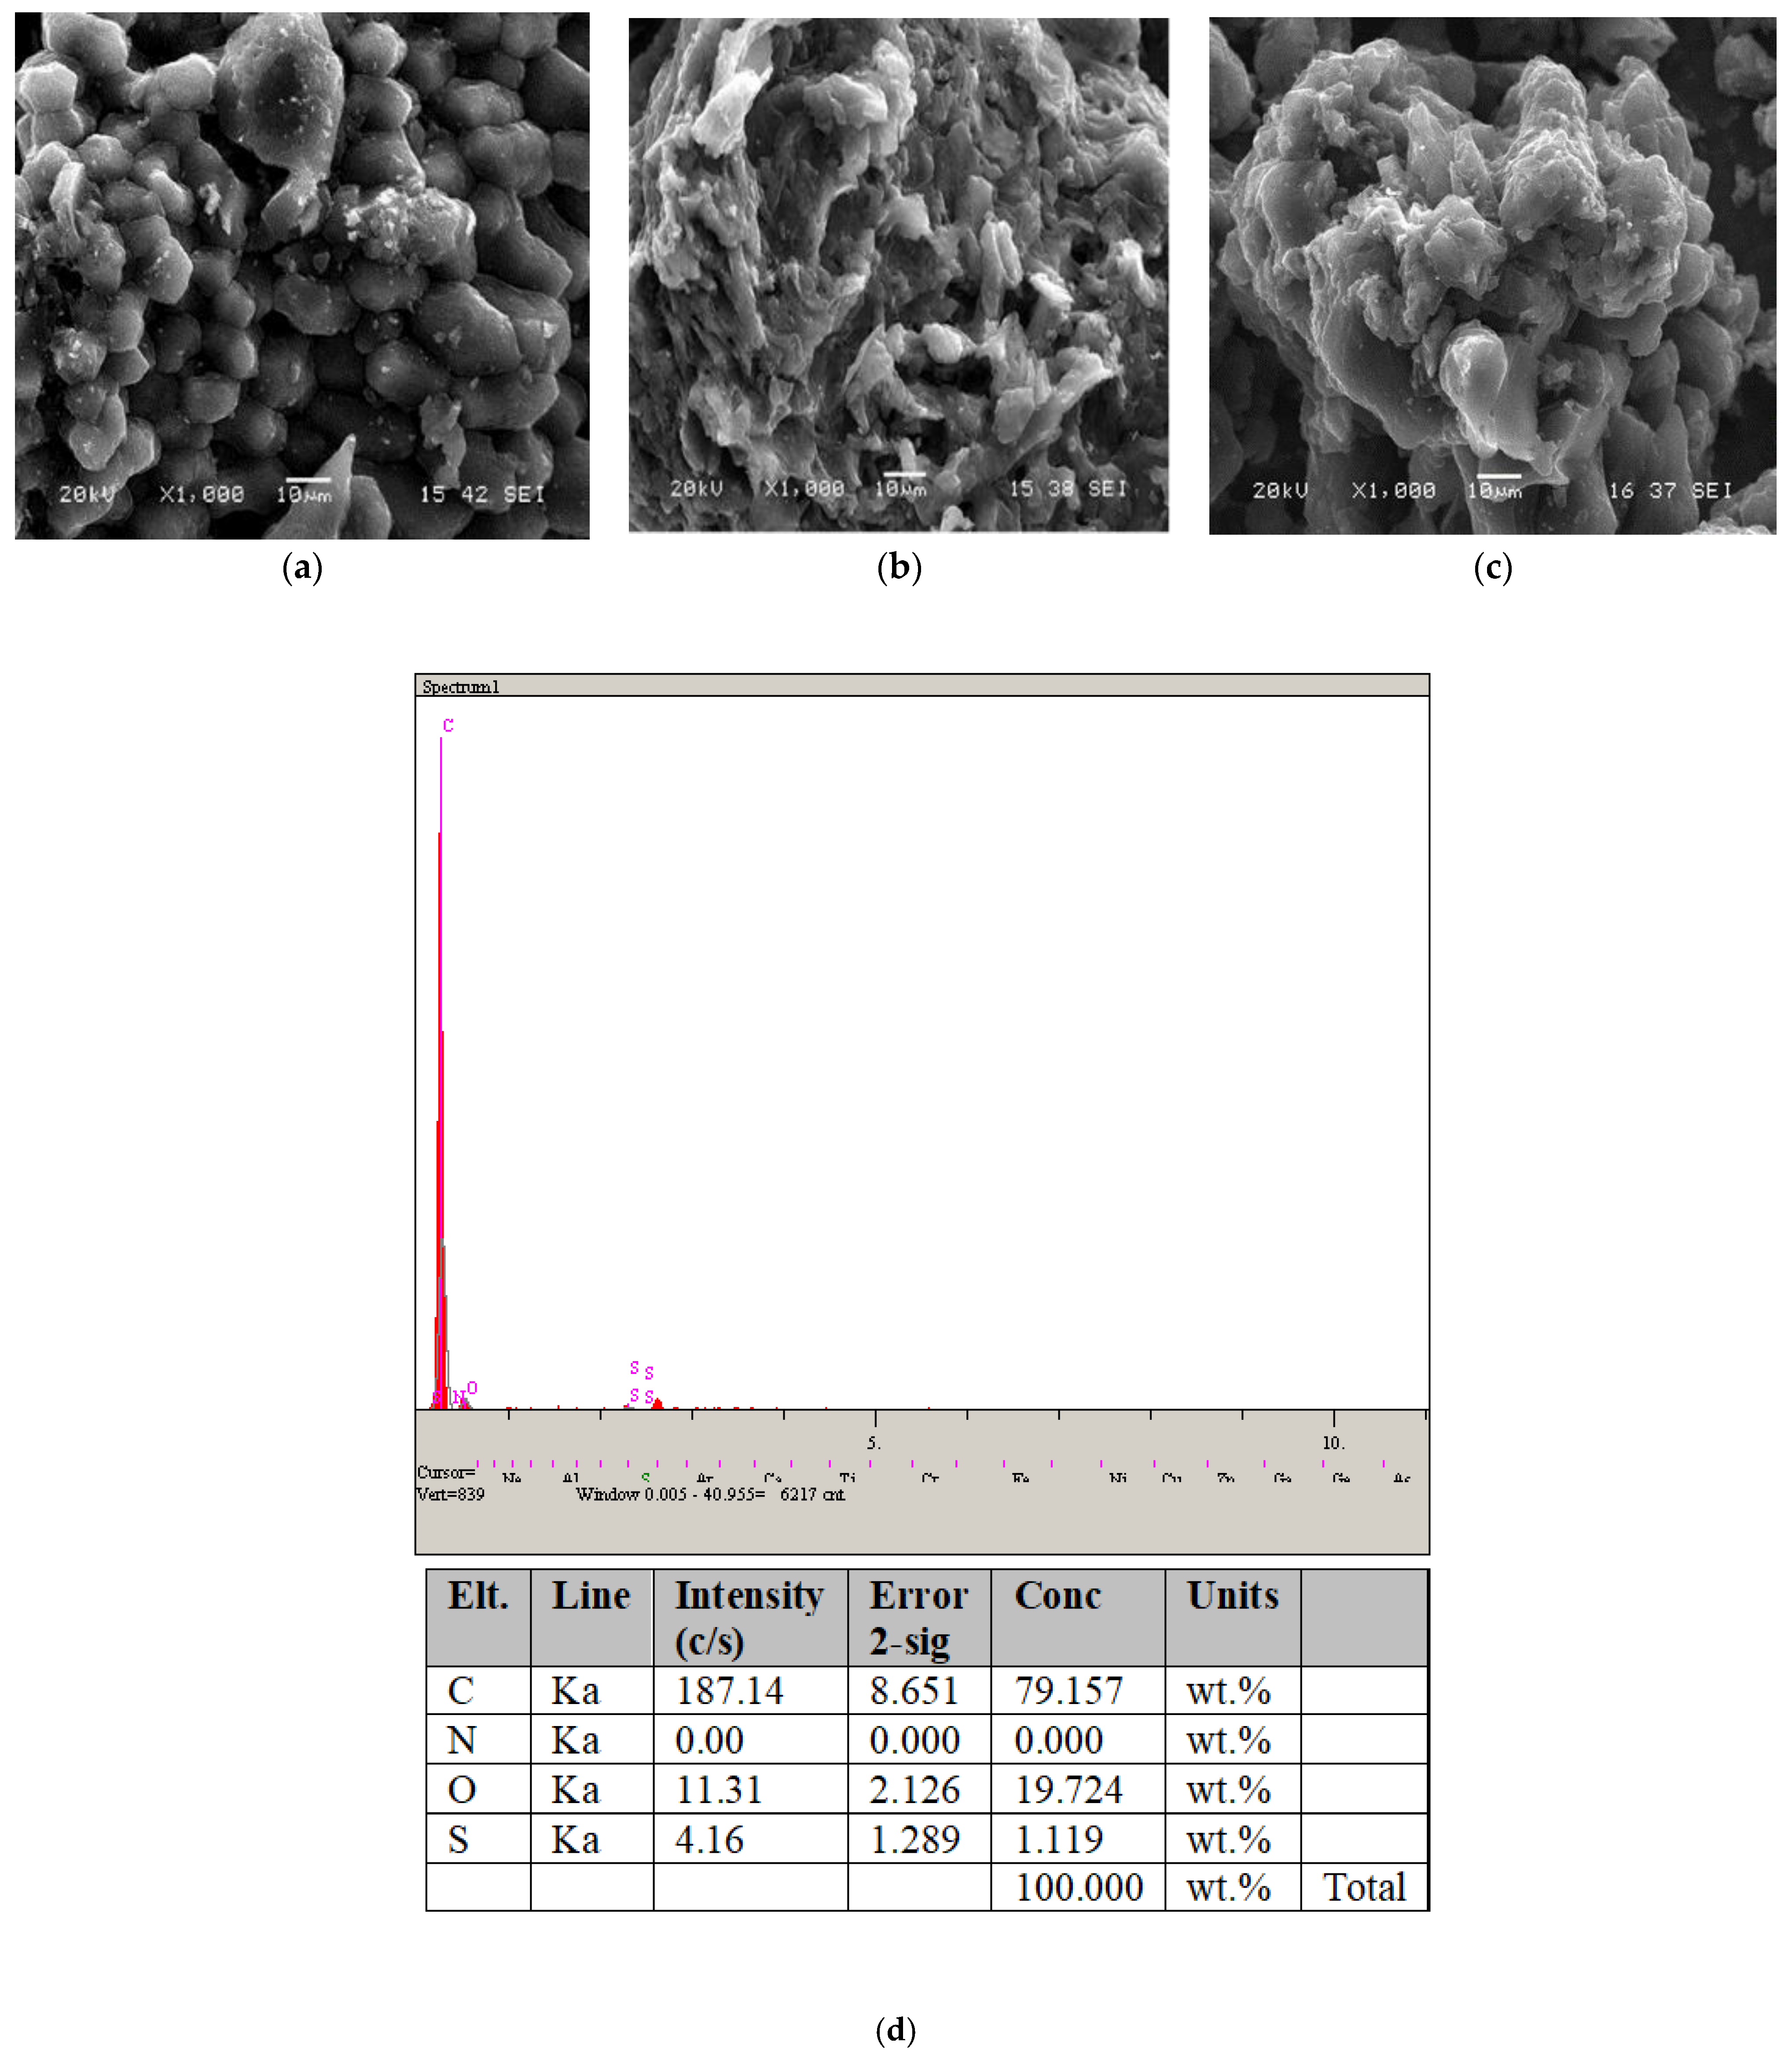
Regarding the raw olive pit, the surface morphology of the activated carbon before and after adsorption was examined using scanning electron microscopy (SEM). Figure 3a–c display the SEM images at a magnification of 1000×. According to the SEM images of OPAC, surface morphology, particle shape, particle size, and elemental analysis information based on EDS are provided in Figure 3d.
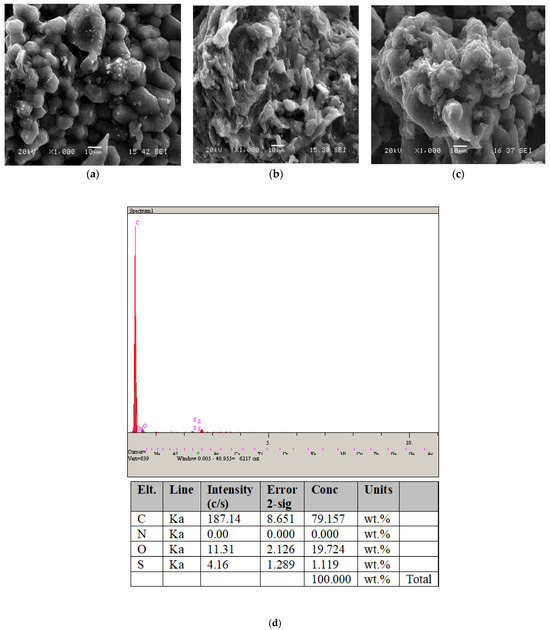
Figure 3.
SEM micrographs of (a) OP, (b) adsorption before OPAC, and (c) adsorption after OPAC; (d) EDS point scan analysis area for the OPAC.
The unprocessed adsorbent (OPAC) depicted in Figure 3 exhibits a notably porous and diverse morphology. This suggests that the OPAC adsorbent possesses a strong capacity for adsorbing dye molecules onto its surface. As indicated in the EDS graph shown in Figure 3d, the surface of the OPAC sorbent consists of C and O elements, indicating the presence of activated carbon.
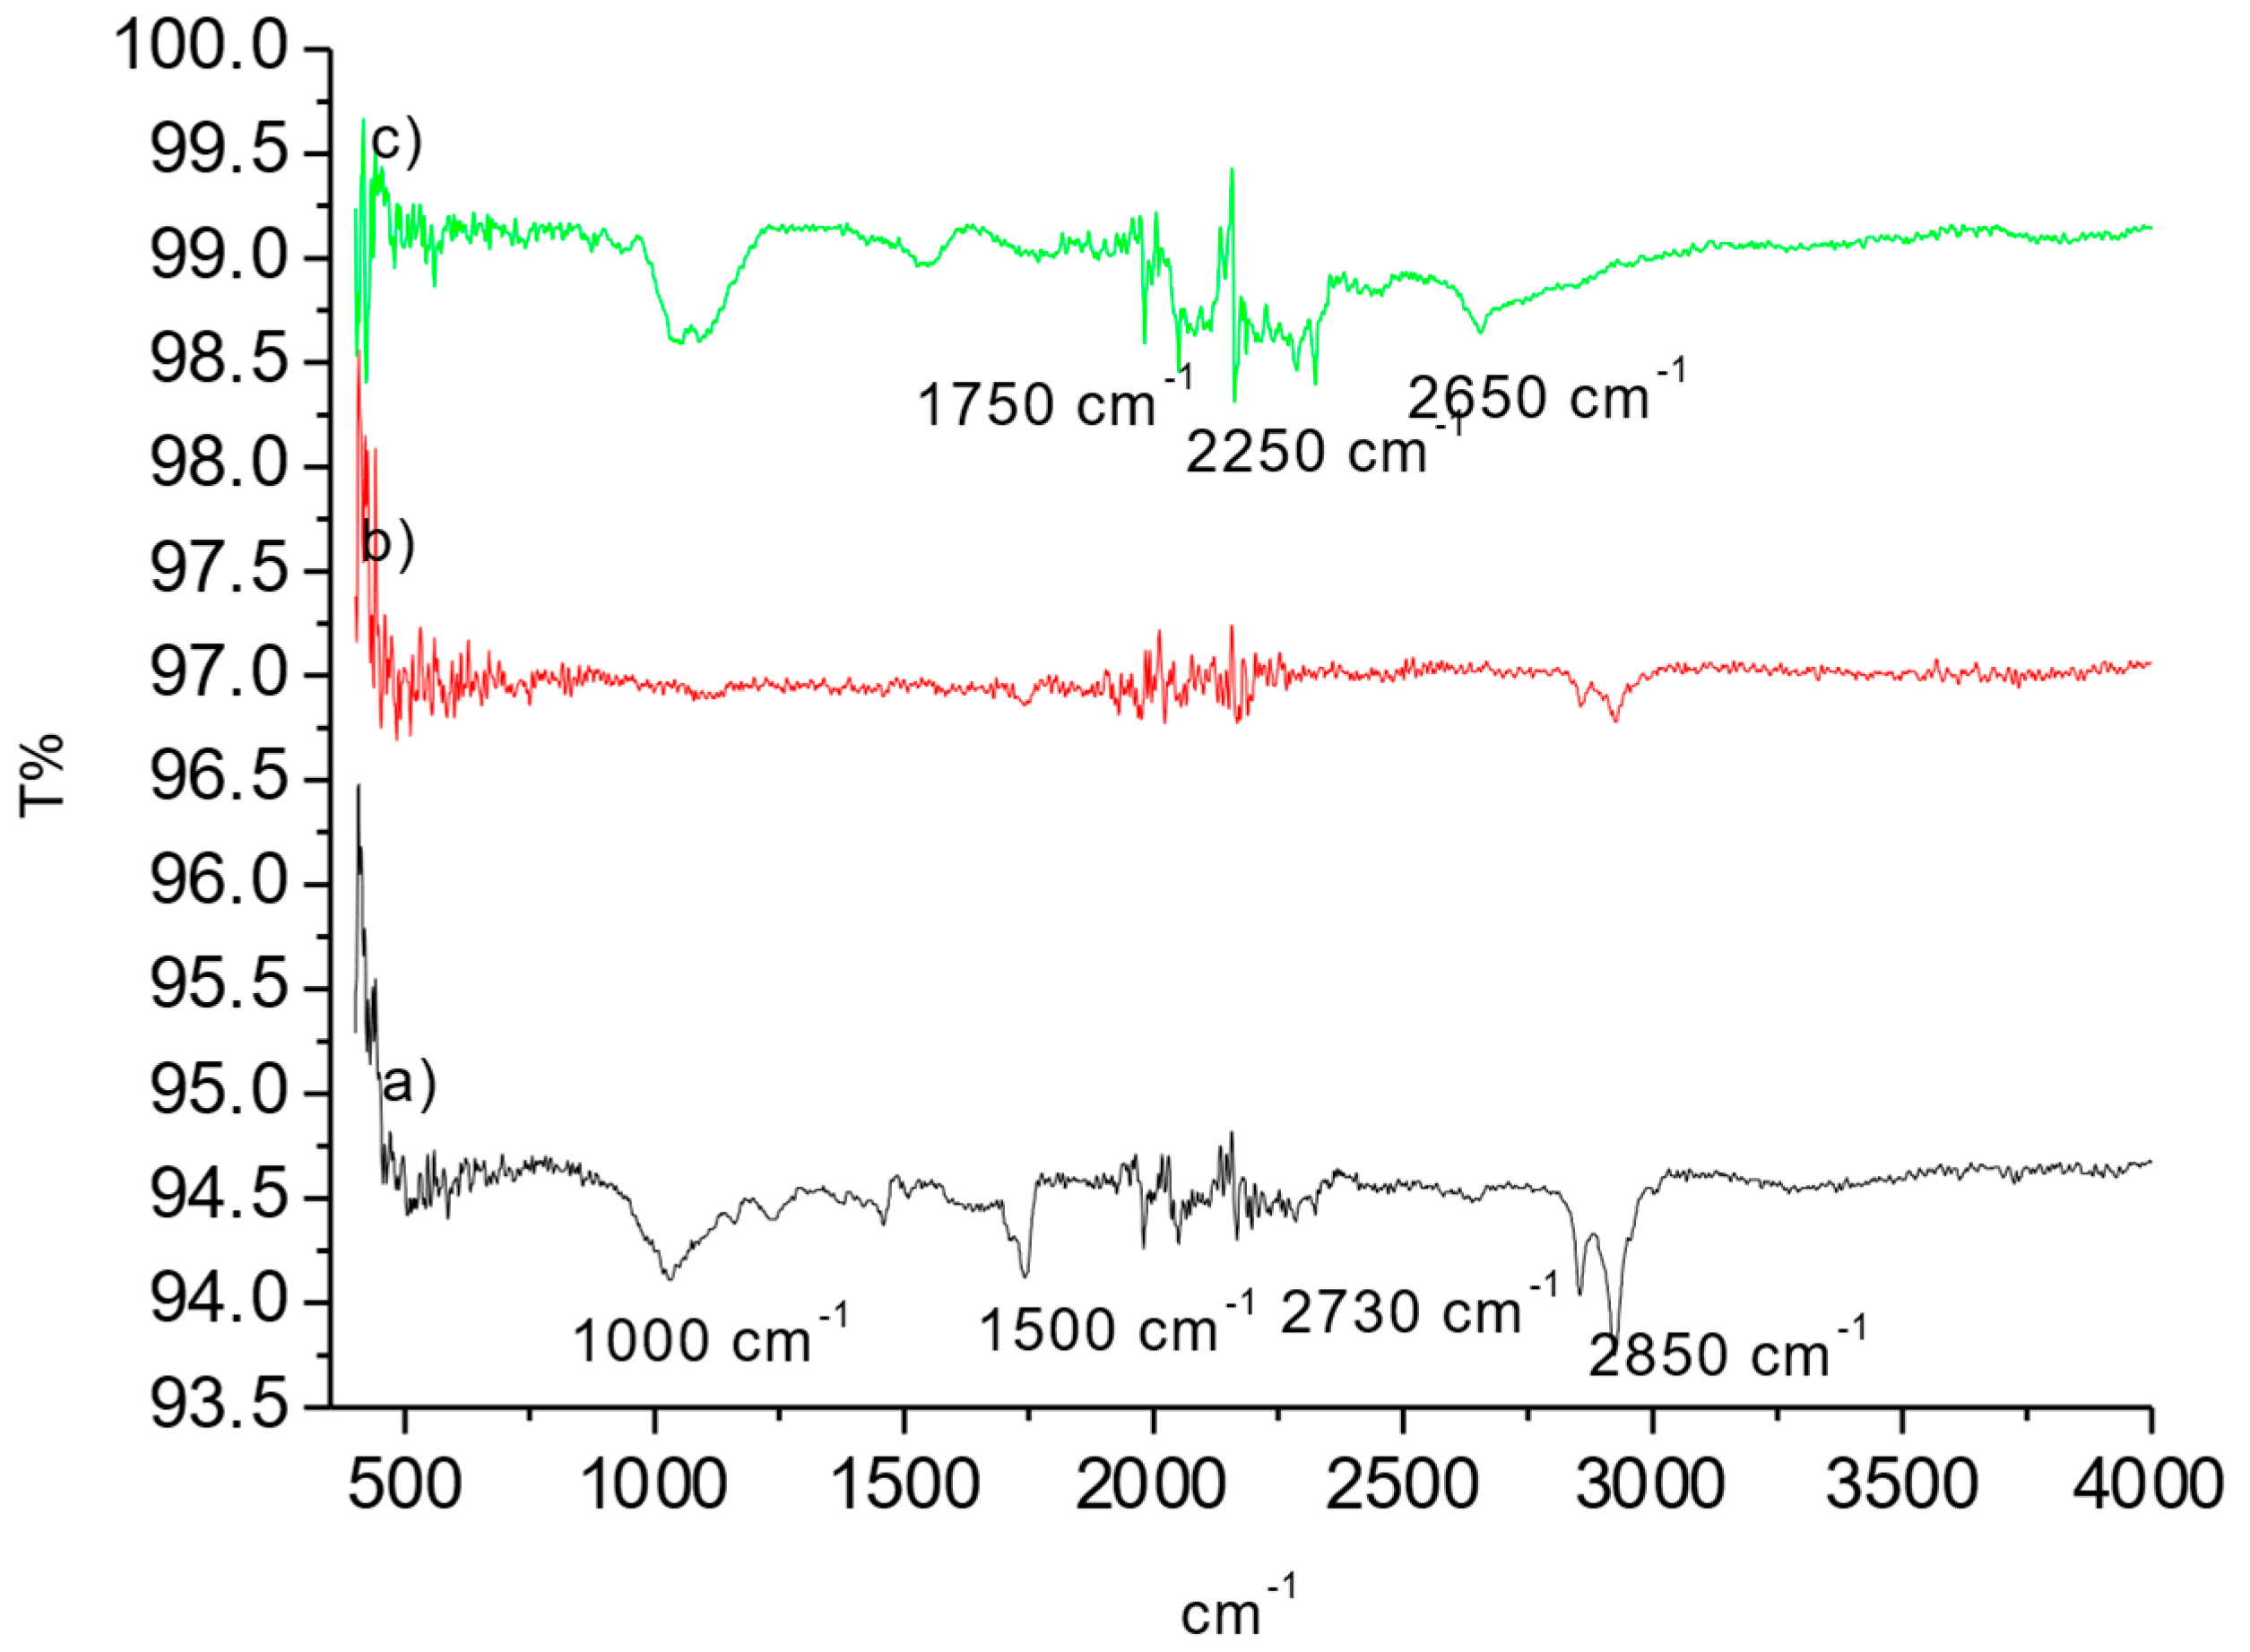
The OP raw material, OPAC, and samples after MB adsorption were analyzed using FTIR to determine their surface chemistry. The results are represented in Figure 4a–c.
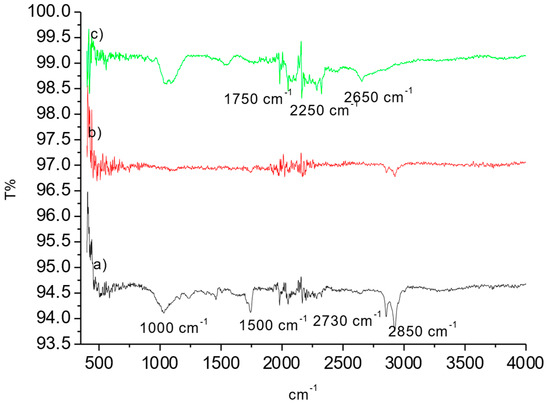
Figure 4.
FT-IR of spectrums of (a) OP, (b) OPAC, and (c) OPAC-MB.
Figure 4 shows the peak observed around 2730 cm−1, which can be attributed to the C-H group (Figure 4). Peaks around 1500 cm−1 indicate the stretching vibration of aromatic C=C bonds, while peaks around 1000 cm−1 are associated with the stretching vibration of C-O groups present in acids, alcohols, phenols, ethers, and esters. Changes in the structure were observed after the activation process. Following dye adsorption, small peaks related to the dye were observed. Similar studies can be found in the literature [36,37]. O-H stretching is generally a broad and intense signal vibration. However, especially in solid materials, strong hydrogen bonding causes this signal to weaken and shift to lower energy. In the case of a powerful hydrogen bond, the wavenumber can change to values of up to 1000 cm−1 [36]. The presence of an OH or NH group near the post-activation group often reduces the stretching frequency to 500–800 cm−1 due to hydrogen bonding [35]. The broad band around 1100 cm−1 was attributed to asymmetric stretching due to the interaction between OPAC and MB.
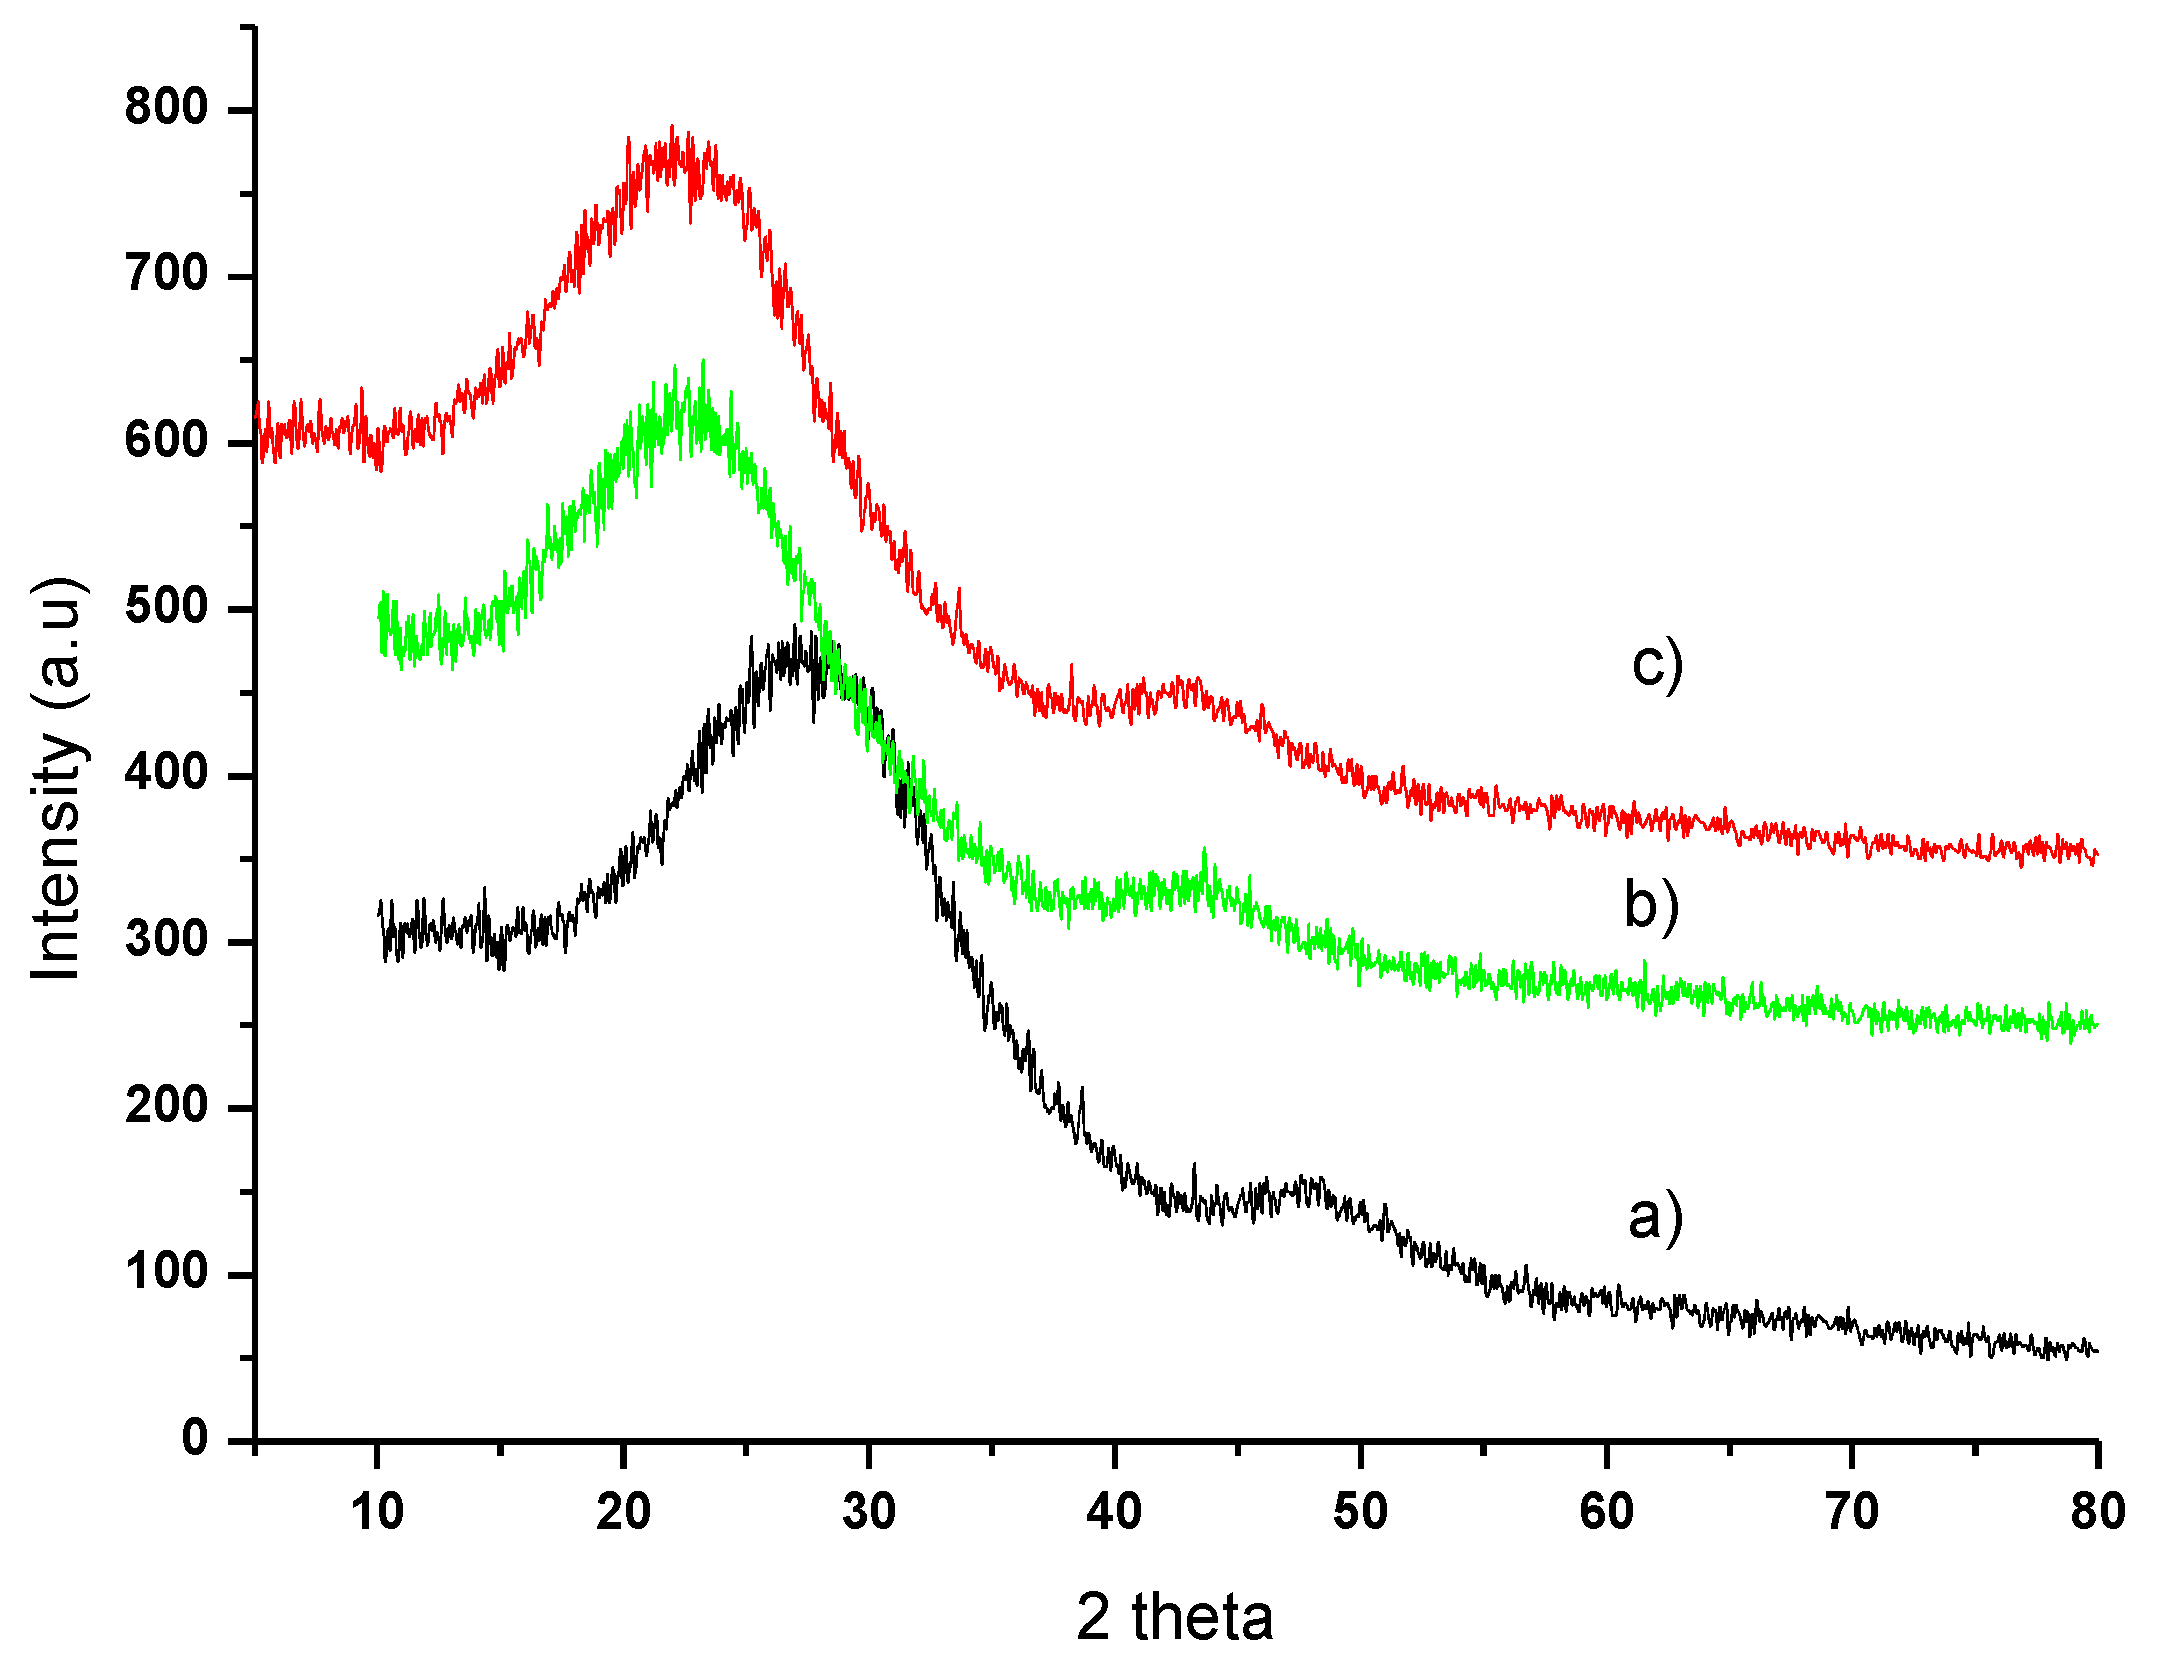
Figure 5 shows the XRD patterns of the profiles of (a) OP, (b) OPAC, and (c) OPAC after adsorption.
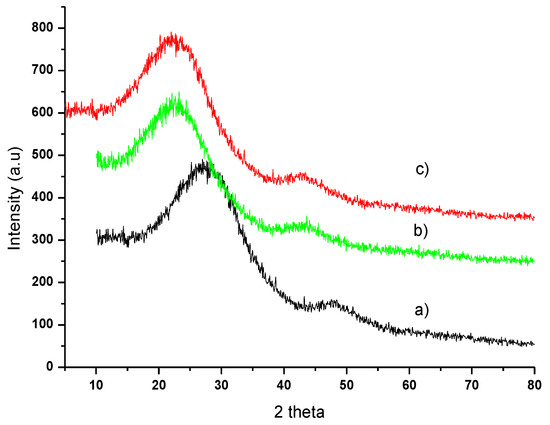
Figure 5.
XRD patterns of (a) OP, (b) OPAC, and (c) OPAC-MB.
The XRD patterns of the profiles of (a) OP, (b) OPAC, and (c) OPAC-MB are shown in Figure 5. The X-ray diffraction patterns of untreated OP, as well as OPAC before and after MB adsorption, are shown in Figure 5. For all three samples, the diffraction pattern does not exhibit a horizontal baseline. This indicates that a significant portion of the material in OPAC, both before and after adsorption, is amorphous. From the XRD pattern, only two broad diffraction peaks remain, located approximately at 23.58° and 43°, which can be attributed to carbon and graphite.
3.2. Adsorption Isotherms
Adsorption isotherms are critical in the adsorption process design as they illustrate the interactions between the adsorbate and the adsorbent. Generally, Langmuir [38] and Freundlich isotherm models are commonly used to model experimental data in adsorption processes. Equation (5) can be linearized to the following form:
In this equation, qe (mg/g) stands for the quantity of dye absorbed per unit mass of the adsorbent, qm (mg/g) represents the maximum adsorption capacity, Ce (mg/L) denotes the equilibrium dye concentration, and KL (L/mg) is the Langmuir constant. The Langmuir model’s non-linear isotherm for MB adsorption onto the adsorbent is depicted in Figure 6a. The Freundlich model, applicable to various adsorption processes, can be expressed linearly, as indicated in Equation (6).
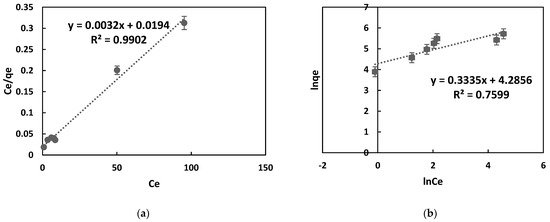
Figure 6.
Langmuir and Freundlich isotherm plots were obtained for the adsorption of MB onto OPAC. In (a). the Langmuir plot is shown, and in (b), the Freundlich plot is displayed. The values calculated from the graph are shown in Table 4.
In this equation, Kf represents the Freundlich constant, and n represents the constant indicating adsorption intensity. As seen in Figure 6b, these parameters were obtained from the plot of ln(qe) versus ln(Ce).
When Table 4 is evaluated, it can be observed that the correlation coefficient (R2) for the Langmuir isotherm is 0.99, and for the Freundlich isotherm, it is 0.75. The maximum adsorption capacity was determined as 312.05 mg/g. Table 4 indicates that the Freundlich intensity constant for MB is n > 1, indicating favorable adsorption of MB by OPAC. According to these results, the Langmuir model is more compatible with the adsorption of MB onto OPAC. Additionally, it can be confirmed that the adsorption occurred as a single layer due to its compatibility with the Langmuir model.
Table 4.
Langmuir and Freundlich isotherm constants were obtained for MB adsorption on OPAC.
3.3. Kinetic Studies
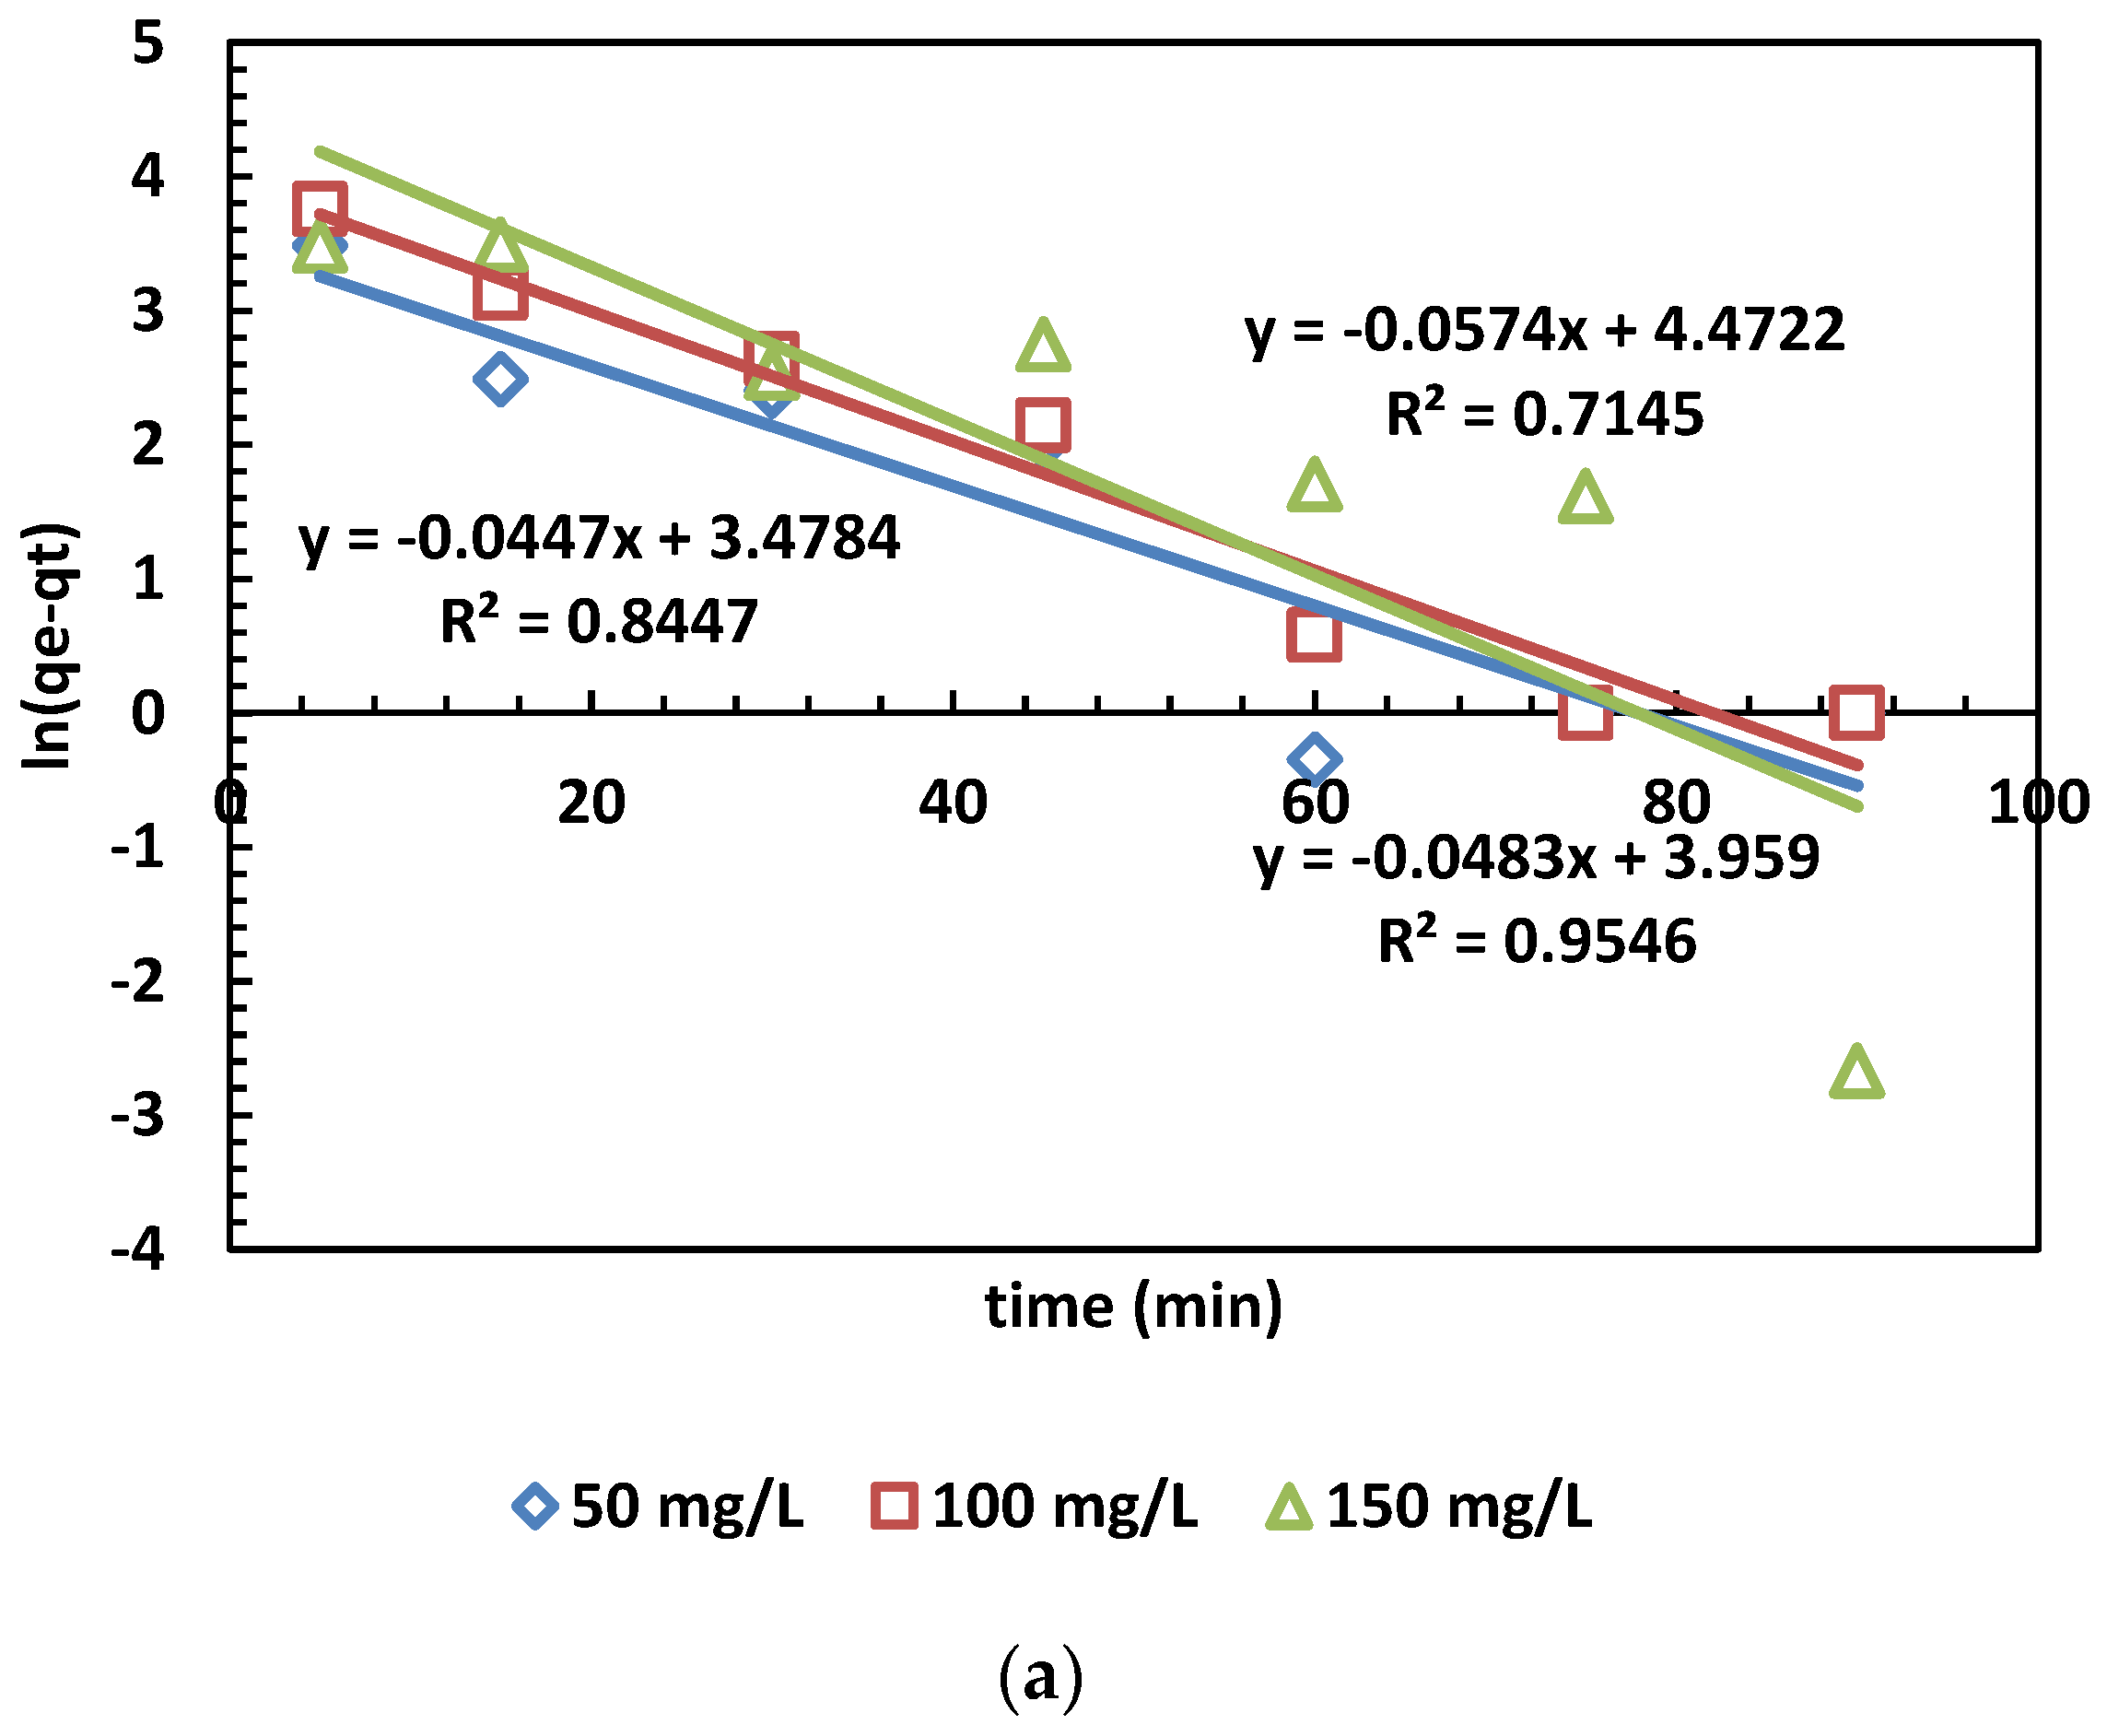
The adsorption kinetic model was employed to forecast the adsorption process of activated carbon. Implementing this model can aid in optimizing parameters within the adsorption process, such as adsorption rate and capacity, as well as optimizing the size and structure of the adsorbent in such a way as to enhance adsorption capacity. The adsorption rate mechanism was elucidated using pseudo-first-order (PFO) and pseudo-second-order (PSO) kinetic models [39]. The following is the definition of the PFO model:
The equivalence of pseudo-first-order Equation (7) is as follows:
The equivalence of pseudo-second-order Equation (8) is as follows:
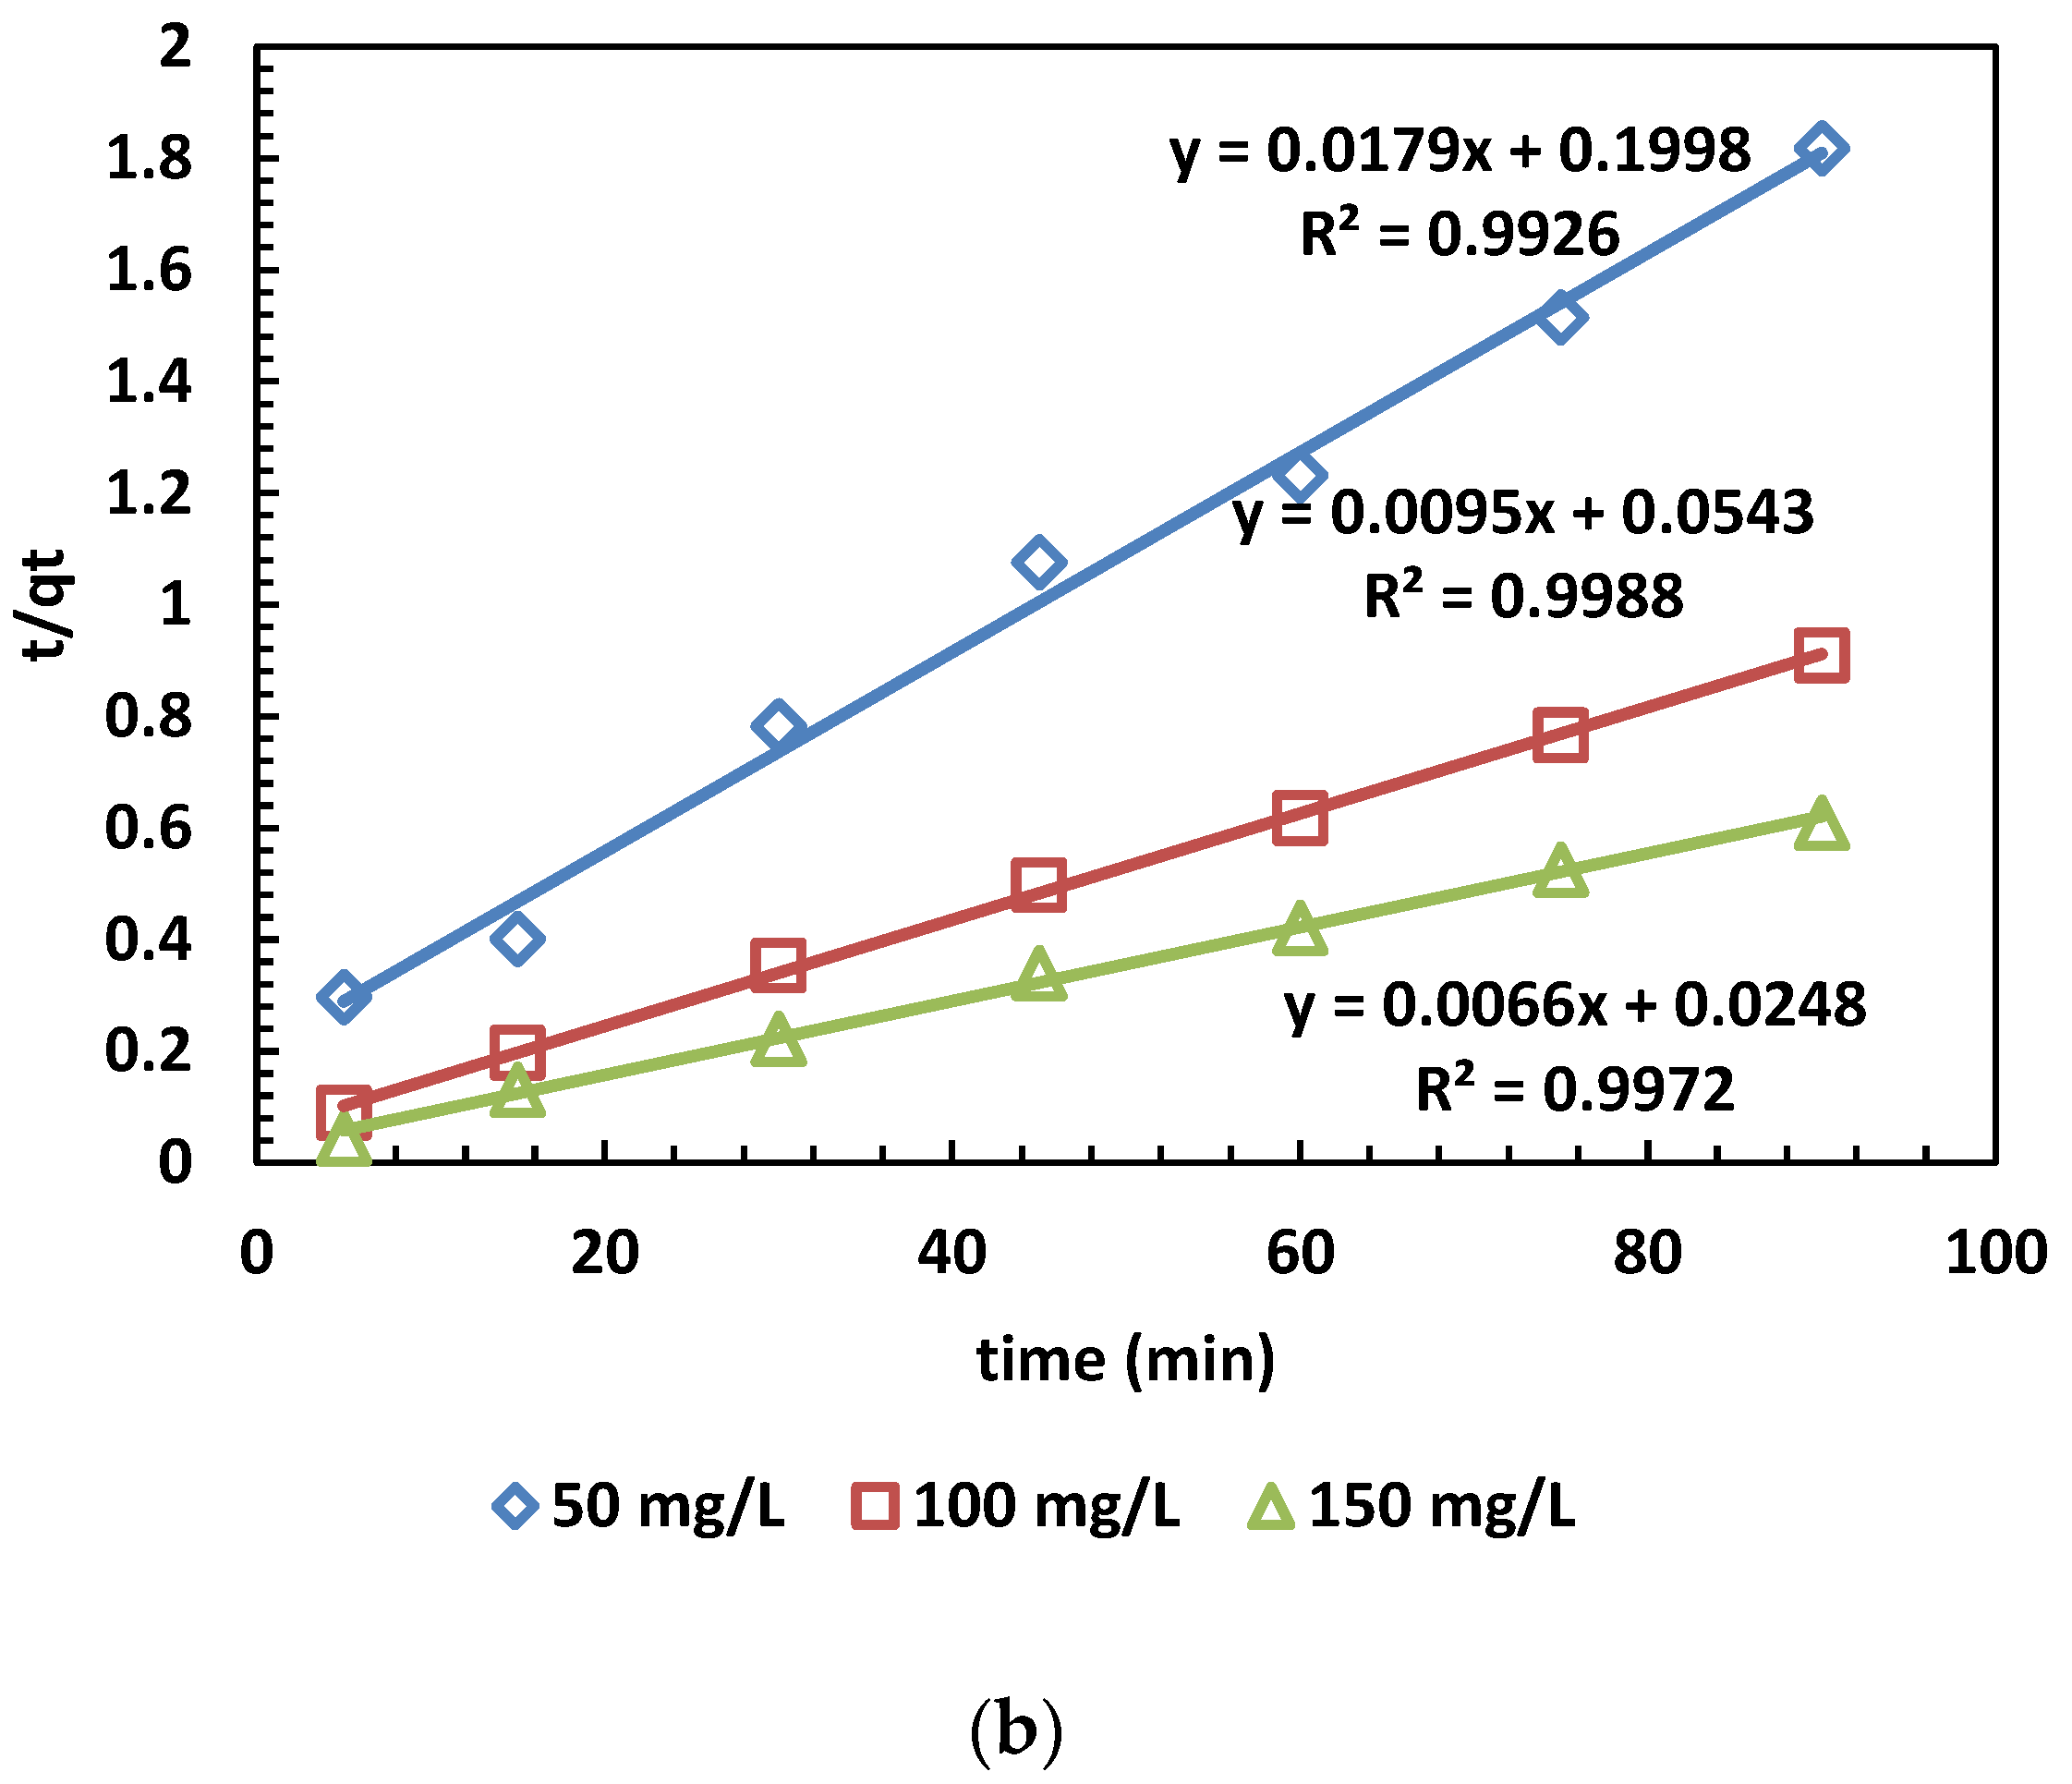
The adsorption capacity at time t (min) is denoted as qt (mg/g), while qe (mg/g) represents the adsorption capacity at equilibrium. Additionally, k1 (min−1) stands for the rate constant of the pseudo-first-order kinetic model. Furthermore, the linear form of the pseudo-second-order kinetic model is given by plotting qt against t. The rate constant k2 (g/mg·min) and the calculated equilibrium adsorption capacity qe.cal are then determined [39,40]. The results of the kinetic models for MB adsorption are depicted in Figure 7. The values calculated from the PFO and PSO kinetic models are also presented in Table 5.
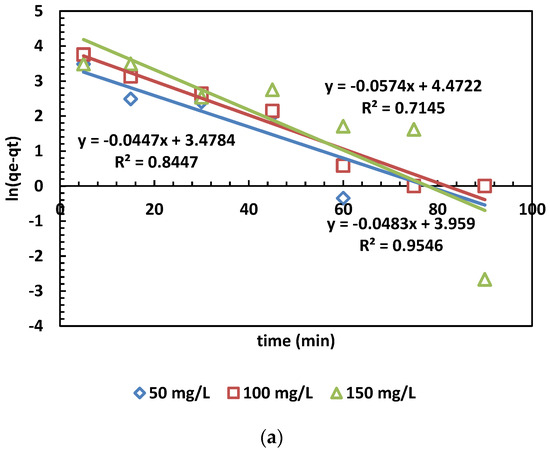
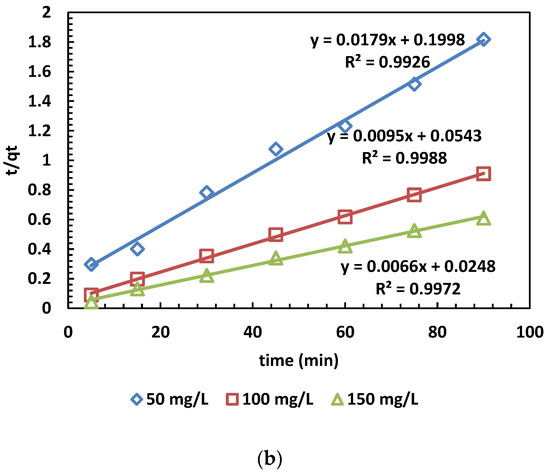
Figure 7.
(a,b) The PFO (a) and PSO (b) kinetic models for the adsorption of MB dye.
Table 5.
Constants and parameters of the adsorption kinetics.
In Figure 6a,b, the adsorption kinetics are depicted, and the obtained parameters are presented in Table 5. The pseudo-second-order kinetic model’s determination coefficients (R2) were higher than those of the pseudo-first-order model across three different concentrations. This outcome indicates that the pseudo-second-order model is more appropriate than the pseudo-first-order model. This suggests chemical control and electron exchange between OPAC and dye cations [31].
3.4. Thermodynamic Studies
Temperature is one of the most important parameters that affect the interaction and kinetics between the adsorption agent and the colorant. Adsorption is analyzed thermodynamically by ascertaining enthalpy change, entropy change, free enthalpy change, and equilibrium constants [41].
The thermodynamic characteristics, including (Gibbs free energy change) ΔG°, (enthalpy change) ΔH°, and (entropy change) ΔS°, of the adsorption system were determined by employing Equations (9)–(11).
Here, R represents the gas constant (8.314 J mol−1 K−1), T denotes the temperature (K), and KL is the distribution coefficient. The equilibrium constant (KL) was approximated as follows:
Based on the Van ’t Hoff equation, the following is obtained:
Equation (9) is used to determine the relationship between thermodynamic parameters for the adsorption of MB dye on the adsorbent surface. The negative value of ΔHS° between the adsorbate (dye molecule) and the adsorbent (OPAC) indicates an exothermic process [41].
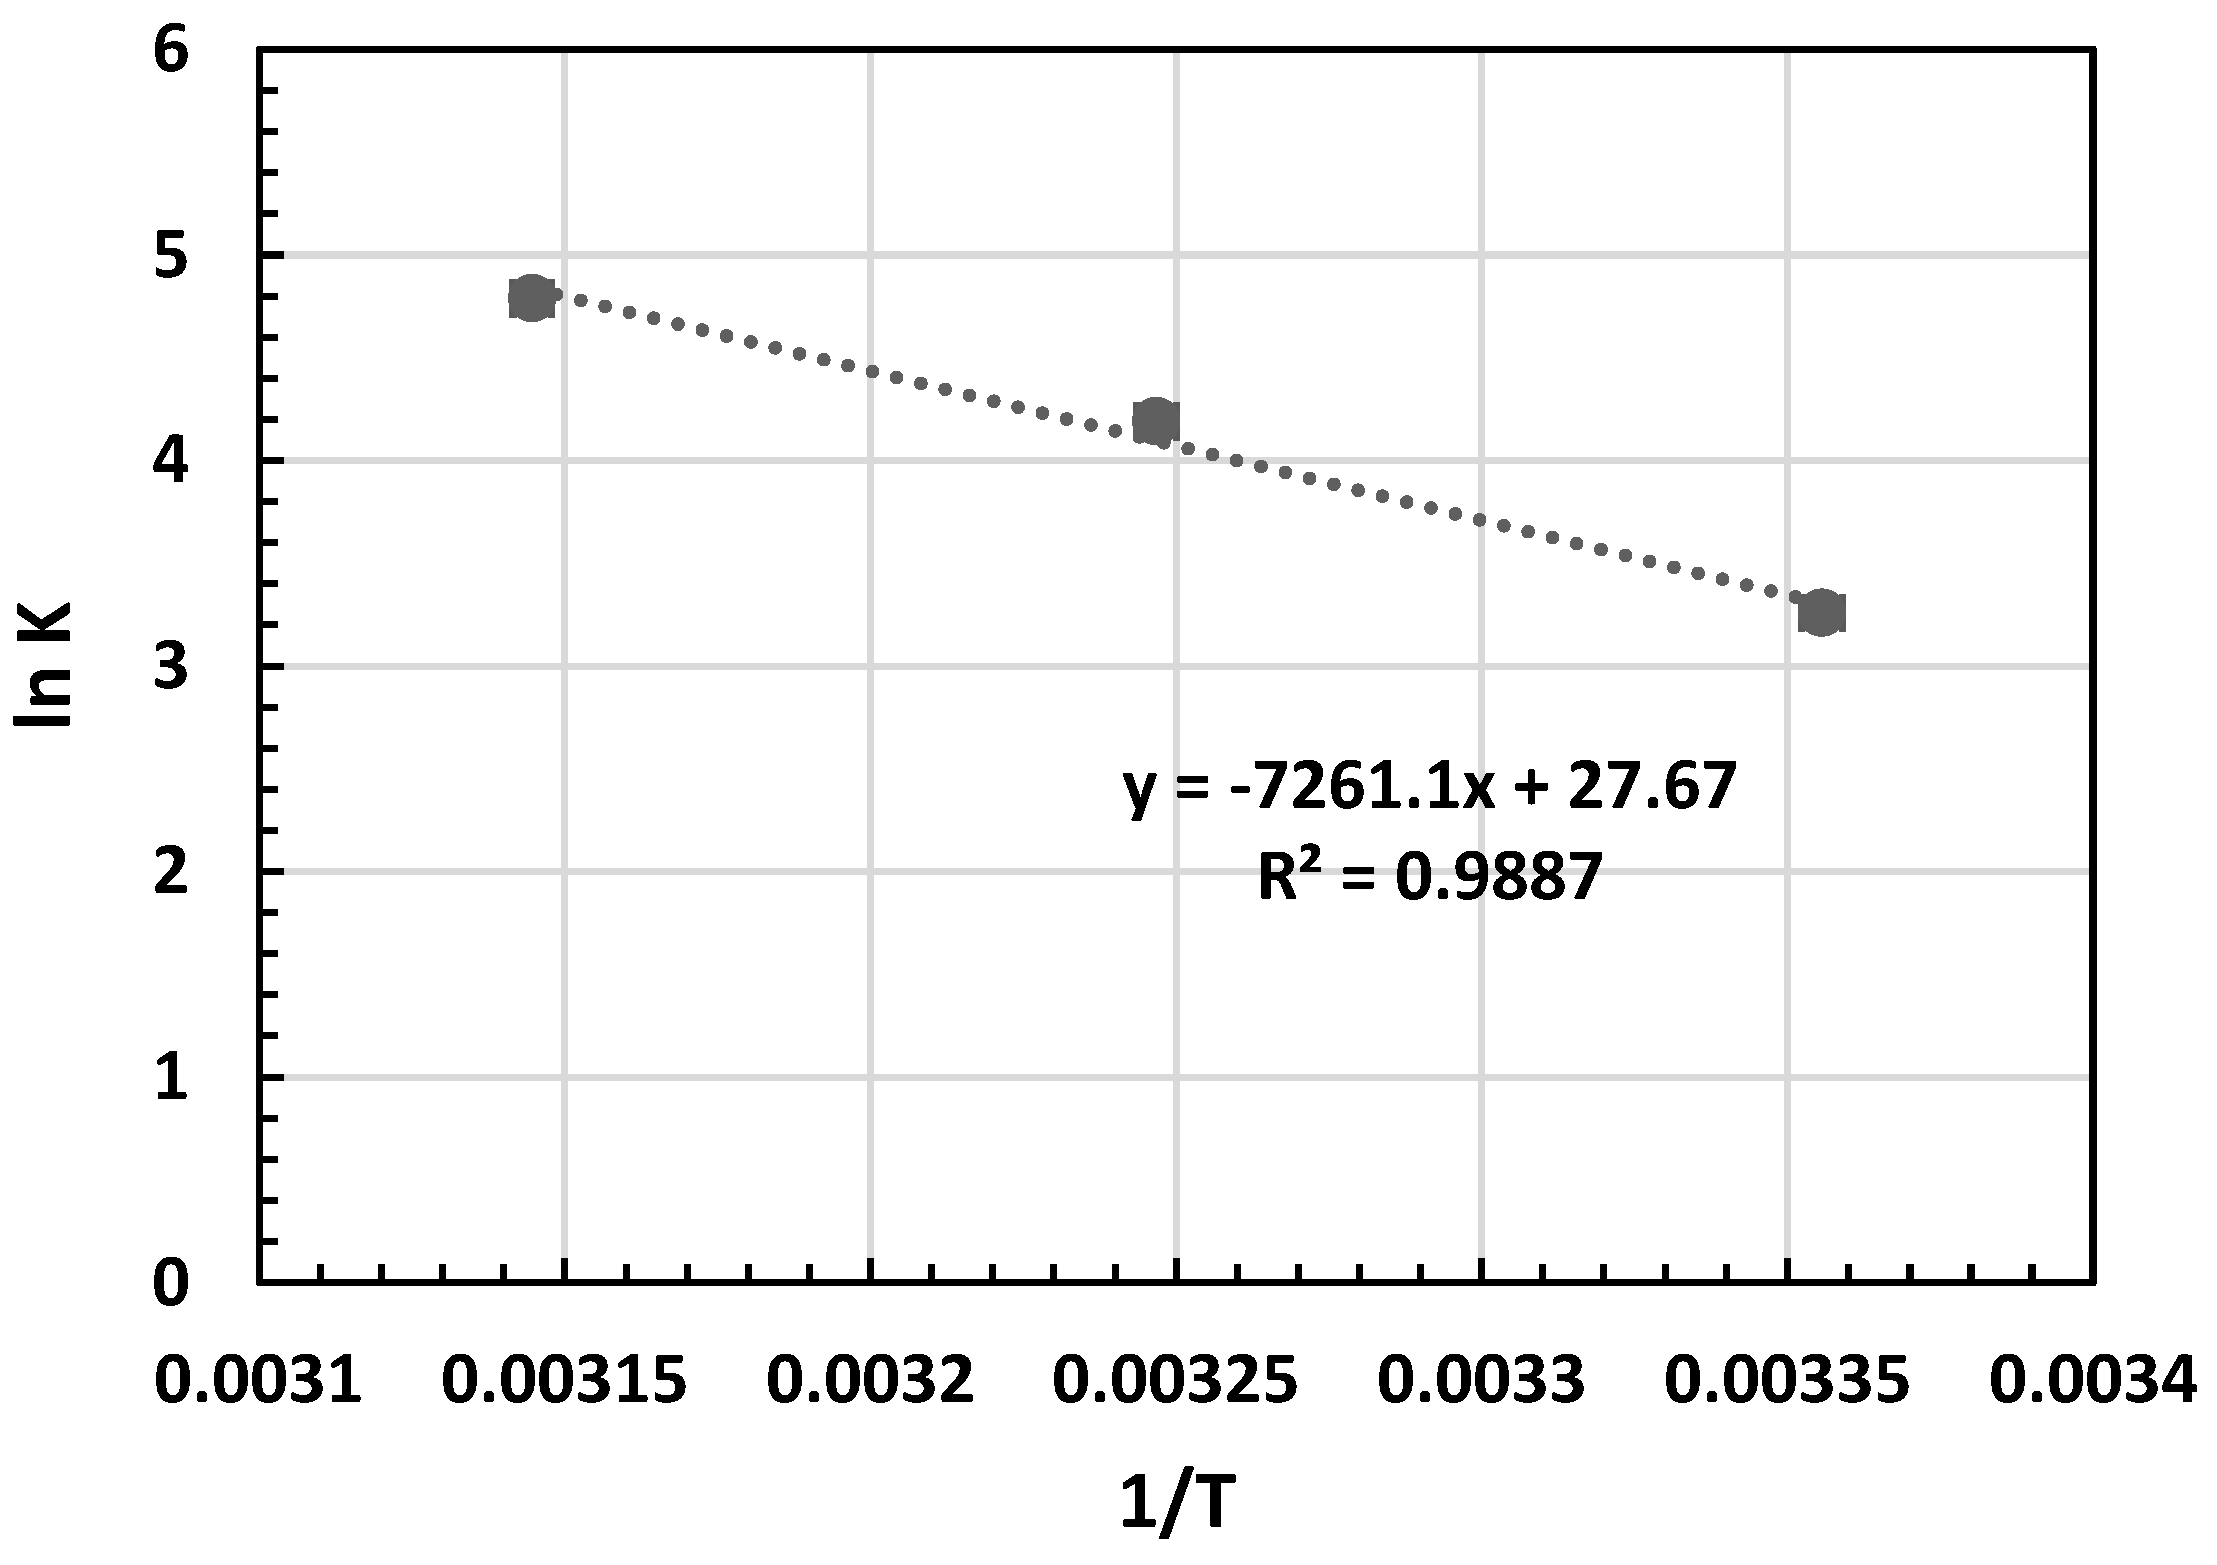
In the Van ’t Hoff equation, R (8.314 J/mol K) represents the universal gas constant, and T (K) stands for the absolute temperature of the solution. The ΔH° and ΔS° values were derived from the gradient and y-intercept of the Van ’t Hoff plot, illustrating lnKL against 1/T, as depicted in Figure 8 [42]. The computed thermodynamic parameters are presented in Table 6.

Figure 8.
Van ’t Hoff plot for the adsorption of MB on OPAC.
Table 6.
Thermodynamic properties computed for the adsorption of MB.
Table 6 illustrates that the equilibrium constant (KL) values escalate with rising temperature. The spontaneity of adsorption hinges on the Gibbs free energy, whereby a negative ΔG° denotes spontaneous adsorption [41,42]. Moreover, a surge in ΔG° with temperature indicates heightened MB adsorption at elevated temperatures. The positive ΔS° signifies increased disorderliness at the solid/solution interface during MB dye adsorption on OPAC. A positive ΔH° suggests an endothermic adsorption process. The results were summarized in Table 7 in comparison with previous studies.
Table 7.
Comparison of adsorption capacities for MB removal by different agricultural waste-based activated carbons.
The proposed material exhibits comparable, if not superior, adsorption capacities compared to most documented studies (Table 7). It is evident from the data that the OPAC adsorbent exhibits significantly higher adsorption capacity compared to other adsorbents in terms of the removal of MB dye. Furthermore, the maximum adsorption capacity of MB using OPAC was determined to be 312.05 mg/g, which is considered acceptable compared to other adsorbents. A high BET surface area is an essential parameter for measuring adsorption capacity. The BET method is commonly used to determine the surface area of porous materials and shows how many dye molecules can be adsorbed onto the material’s surface [43,44,45,46,47,48]. In our study, the BET surface area has exceeded 500. When compared to studies in the literature, similar results are found. Additionally, the high adsorption capacity of OPAC adsorbent is consistent with the results.
3.5. Model Building and Statistical Analysis
RSM is a statistical and mathematical technique to ascertain the correlation between dependent and independent variables. It aids in maximizing data insight from a constrained experimental dataset and enables predictive prowess via a systematic experimental approach for constructing and refining an empirical model. We selected initial MB concentration (25–125 mg/L), pH (1–9), dosage (0.1–0.9 g), and time (15–75 min) to enhance the efficacy of dye elimination. Subsequently, we conducted 30 experiments as per the CCD methodology, measuring the efficiencies of dyestuff removal. Modeling was executed using Minitab statistical analysis software 2008. A stepwise reduction approach gradually eliminated parameters with negligible impact on the experimental setup. The improved quadratic regression model is represented by Equation (12), with Y representing decolorization efficiency, and x1, x2, x3, and x4 denoting pH, absorbent dose, contact time, and dye concentration, respectively.
The outcomes of the model’s analysis of variance are presented in Table 8.
Table 8.
Summary of ANOVA results for RSM for MB optimization.
As indicated in Table 8, the regression model demonstrates significance (p = 0.000 < 0.05), while the lack of fit is deemed insignificant (p = 0.356 > 0.05). Additionally, Figure 9 depicts the similarity plot generated for MB adsorption.
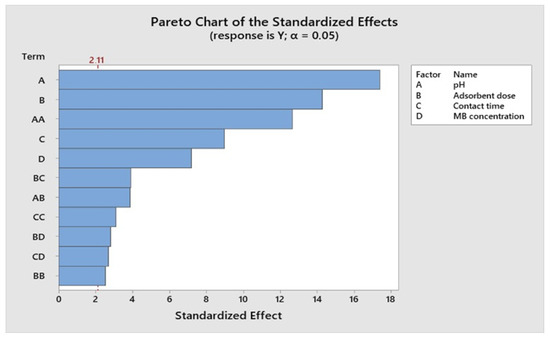
Figure 9.
Parity plot for MB adsorption.
The parity plot in Figure 8 demonstrates a very good agreement between the experimental and predicted MB dye adsorption percentage values. The data points are distributed very closely to a straight line, indicating a strong alignment between them. Similar results are observed in the literature [50,51].
The R-squared (R2) coefficient provides insight into the extent to which the observed response can be attributed to the experimental process variables and their interactions. In the case of MB adsorption, the R2 value is 0.966, signifying a robust correlation between the observed outcomes and the expected values. A modified R2 was also employed to assess the model’s efficacy for further validation. For MB, the modified R2 was determined to be 0.9195, indicating that the proposed model closely aligns with the actual experimental data. These results suggest a favorable agreement between the anticipated R2 values and the adjusted R2 values. In essence, the R-squared coefficient reveals that the independent variables considered in the model explain approximately 98% of the variability observed in MB adsorption.
The significance of each parameter was assessed through the Student t-test and the corresponding p-values in the context of MB removal. Table 8 displays the regression coefficients for the response surface in removing MB. The obtained p-values were 0.021 and 0.356, underscoring the considerable importance of the linear impacts of solution pH, adsorbent dosage, and initial dye concentration on MB removal. It is worth noting that RSM not only elucidates the linear influences of these variables but also captures the quadratic and interactive effects of the process parameters. As detailed in Table 8, the magnitude of the t-values serves as an indicator of whether the dependent variable exhibits a positive or negative impact.
Figure 10, Figure 11, Figure 12 and Figure 13 depict the relationships between different parameters and their impact on removal efficiency throughout the interaction process.
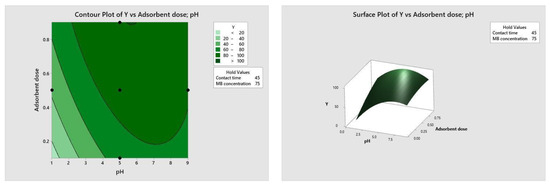
Figure 10.
pH–dose relationship.
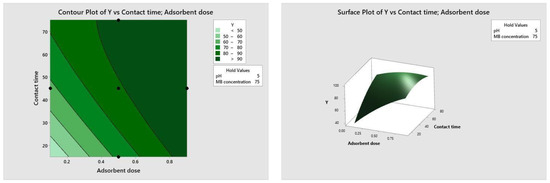
Figure 11.
Dose–time relationship.
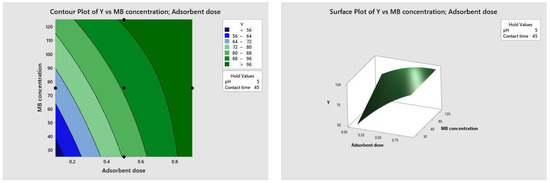
Figure 12.
Dose–concentration relationship.
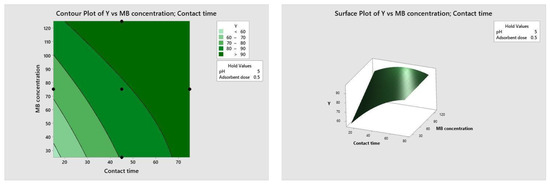
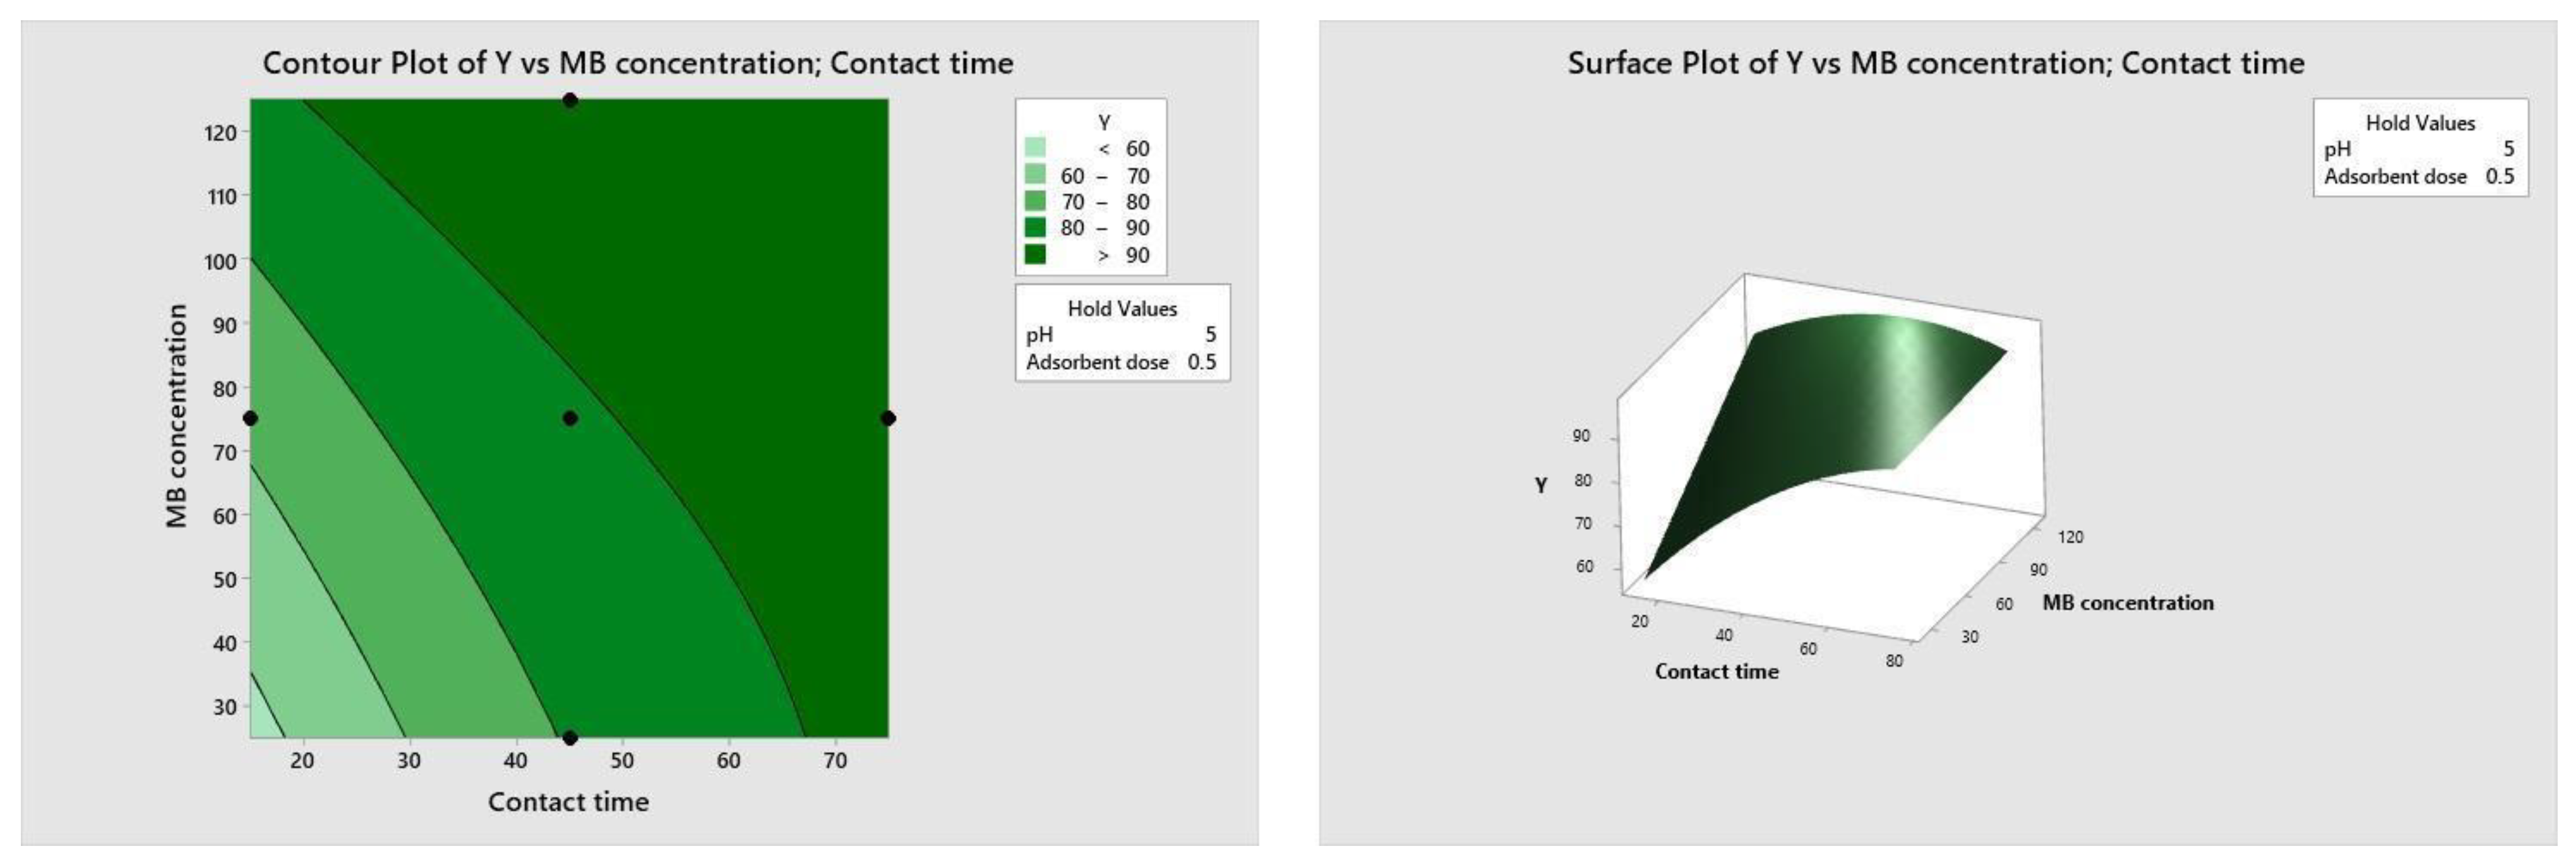
Figure 13.
Time–concentration relationship.
The pH level of the adsorption system plays a critical role in influencing the efficiency of the adsorption process. Figure 10 illustrates the interactive effect of adsorbent dosage and solution pH while keeping the contact time and initial dye concentration at their midpoint values. Similarly, the remaining surface plots elucidate the interaction effects of other independent variables on the percentage of dye adsorption. It is evident from Figure 10, Figure 11, Figure 12 and Figure 13 that the adsorption percentage increased with higher adsorbent dosage, longer contact time, and increased initial MB dye concentration.
The response surface contour plots depicting the percentage of dye adsorption about the interactive effects of all process parameters are presented in Figure 9, Figure 10, Figure 11 and Figure 12 for MB dye. Figure 10, Figure 11, Figure 12 and Figure 13 validate our prior observations from Table 8, indicating that an increase in contact time positively influences the response, typically resulting in improved efficiency. In the literature, analogous investigations and findings have been documented concerning the application of RSM in dye elimination [31,32,33,34,35,36,37,38,39,40,41,42,43,44,45,46,47,48,49,50,51,52,53,54,55].
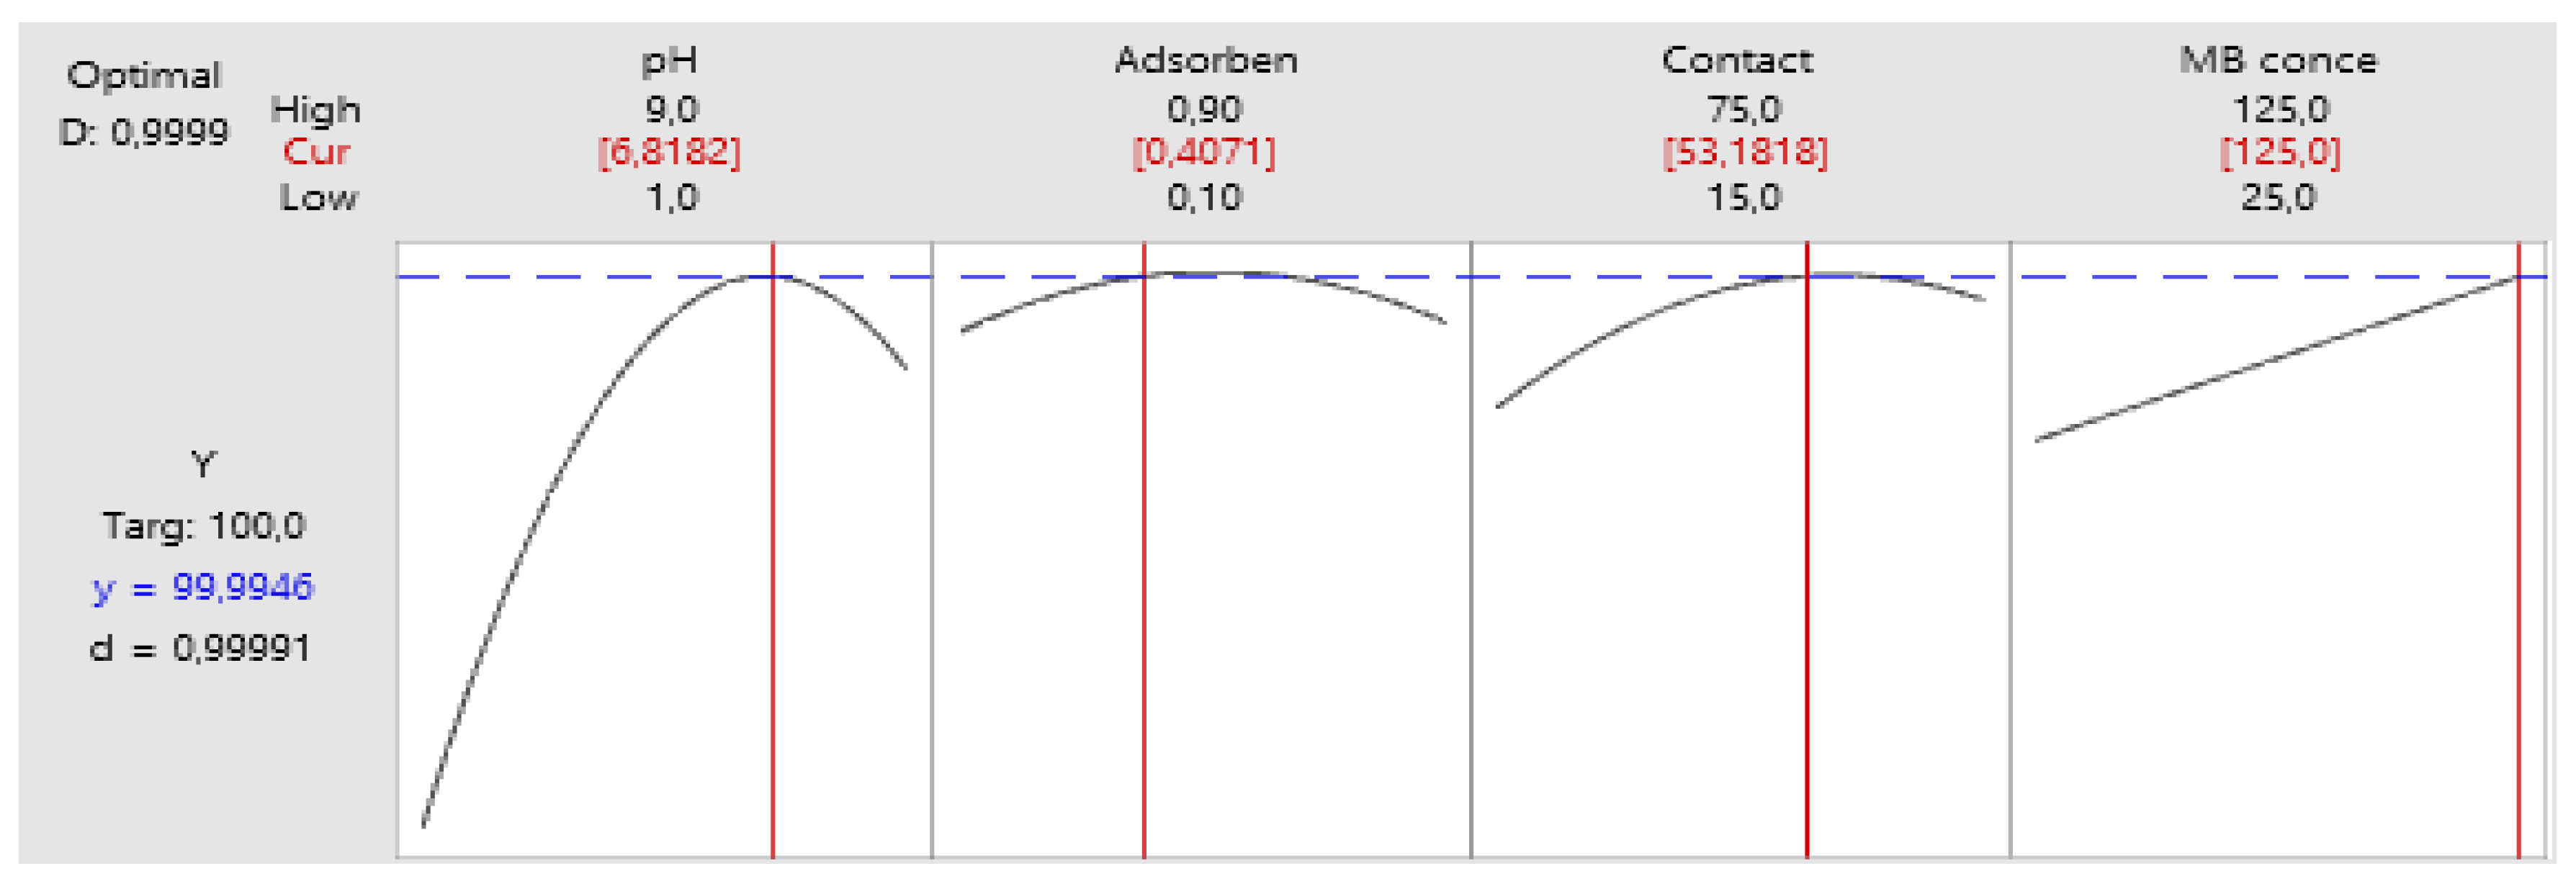
Utilizing the mathematical model derived from experimental analyses to achieve complete removal yields the graphical representation depicted in Figure 14.
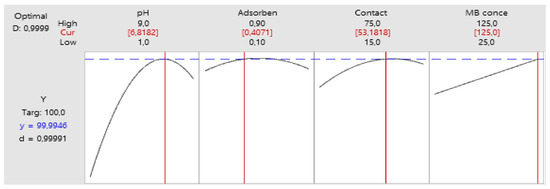
Figure 14.
Optimum parameters.
Under the optimal conditions, it was determined that the maximum percentage of MB biosorption reached an impressive 99.99%. These results closely mirror the outcomes of RSM investigations, reinforcing that employing a statistical experimental design via RSM can be a highly effective approach for optimizing diverse process parameters and enhancing the adsorption of MB dye onto OPAC.
3.6. ANN Model
In this model, pH level, absorbent dosage, concentration of MB, and time of contact were utilized as input parameters, while the output metric denoted the percentage of MB removal. Post-experimentation, it was established that incorporating an intermediate layer with eight neurons utilizing the log-sigmoid transfer function resulted in the most favorable outcomes. The structure of the ANN model is depicted in Figure 15.

Figure 15.
Neural network model.
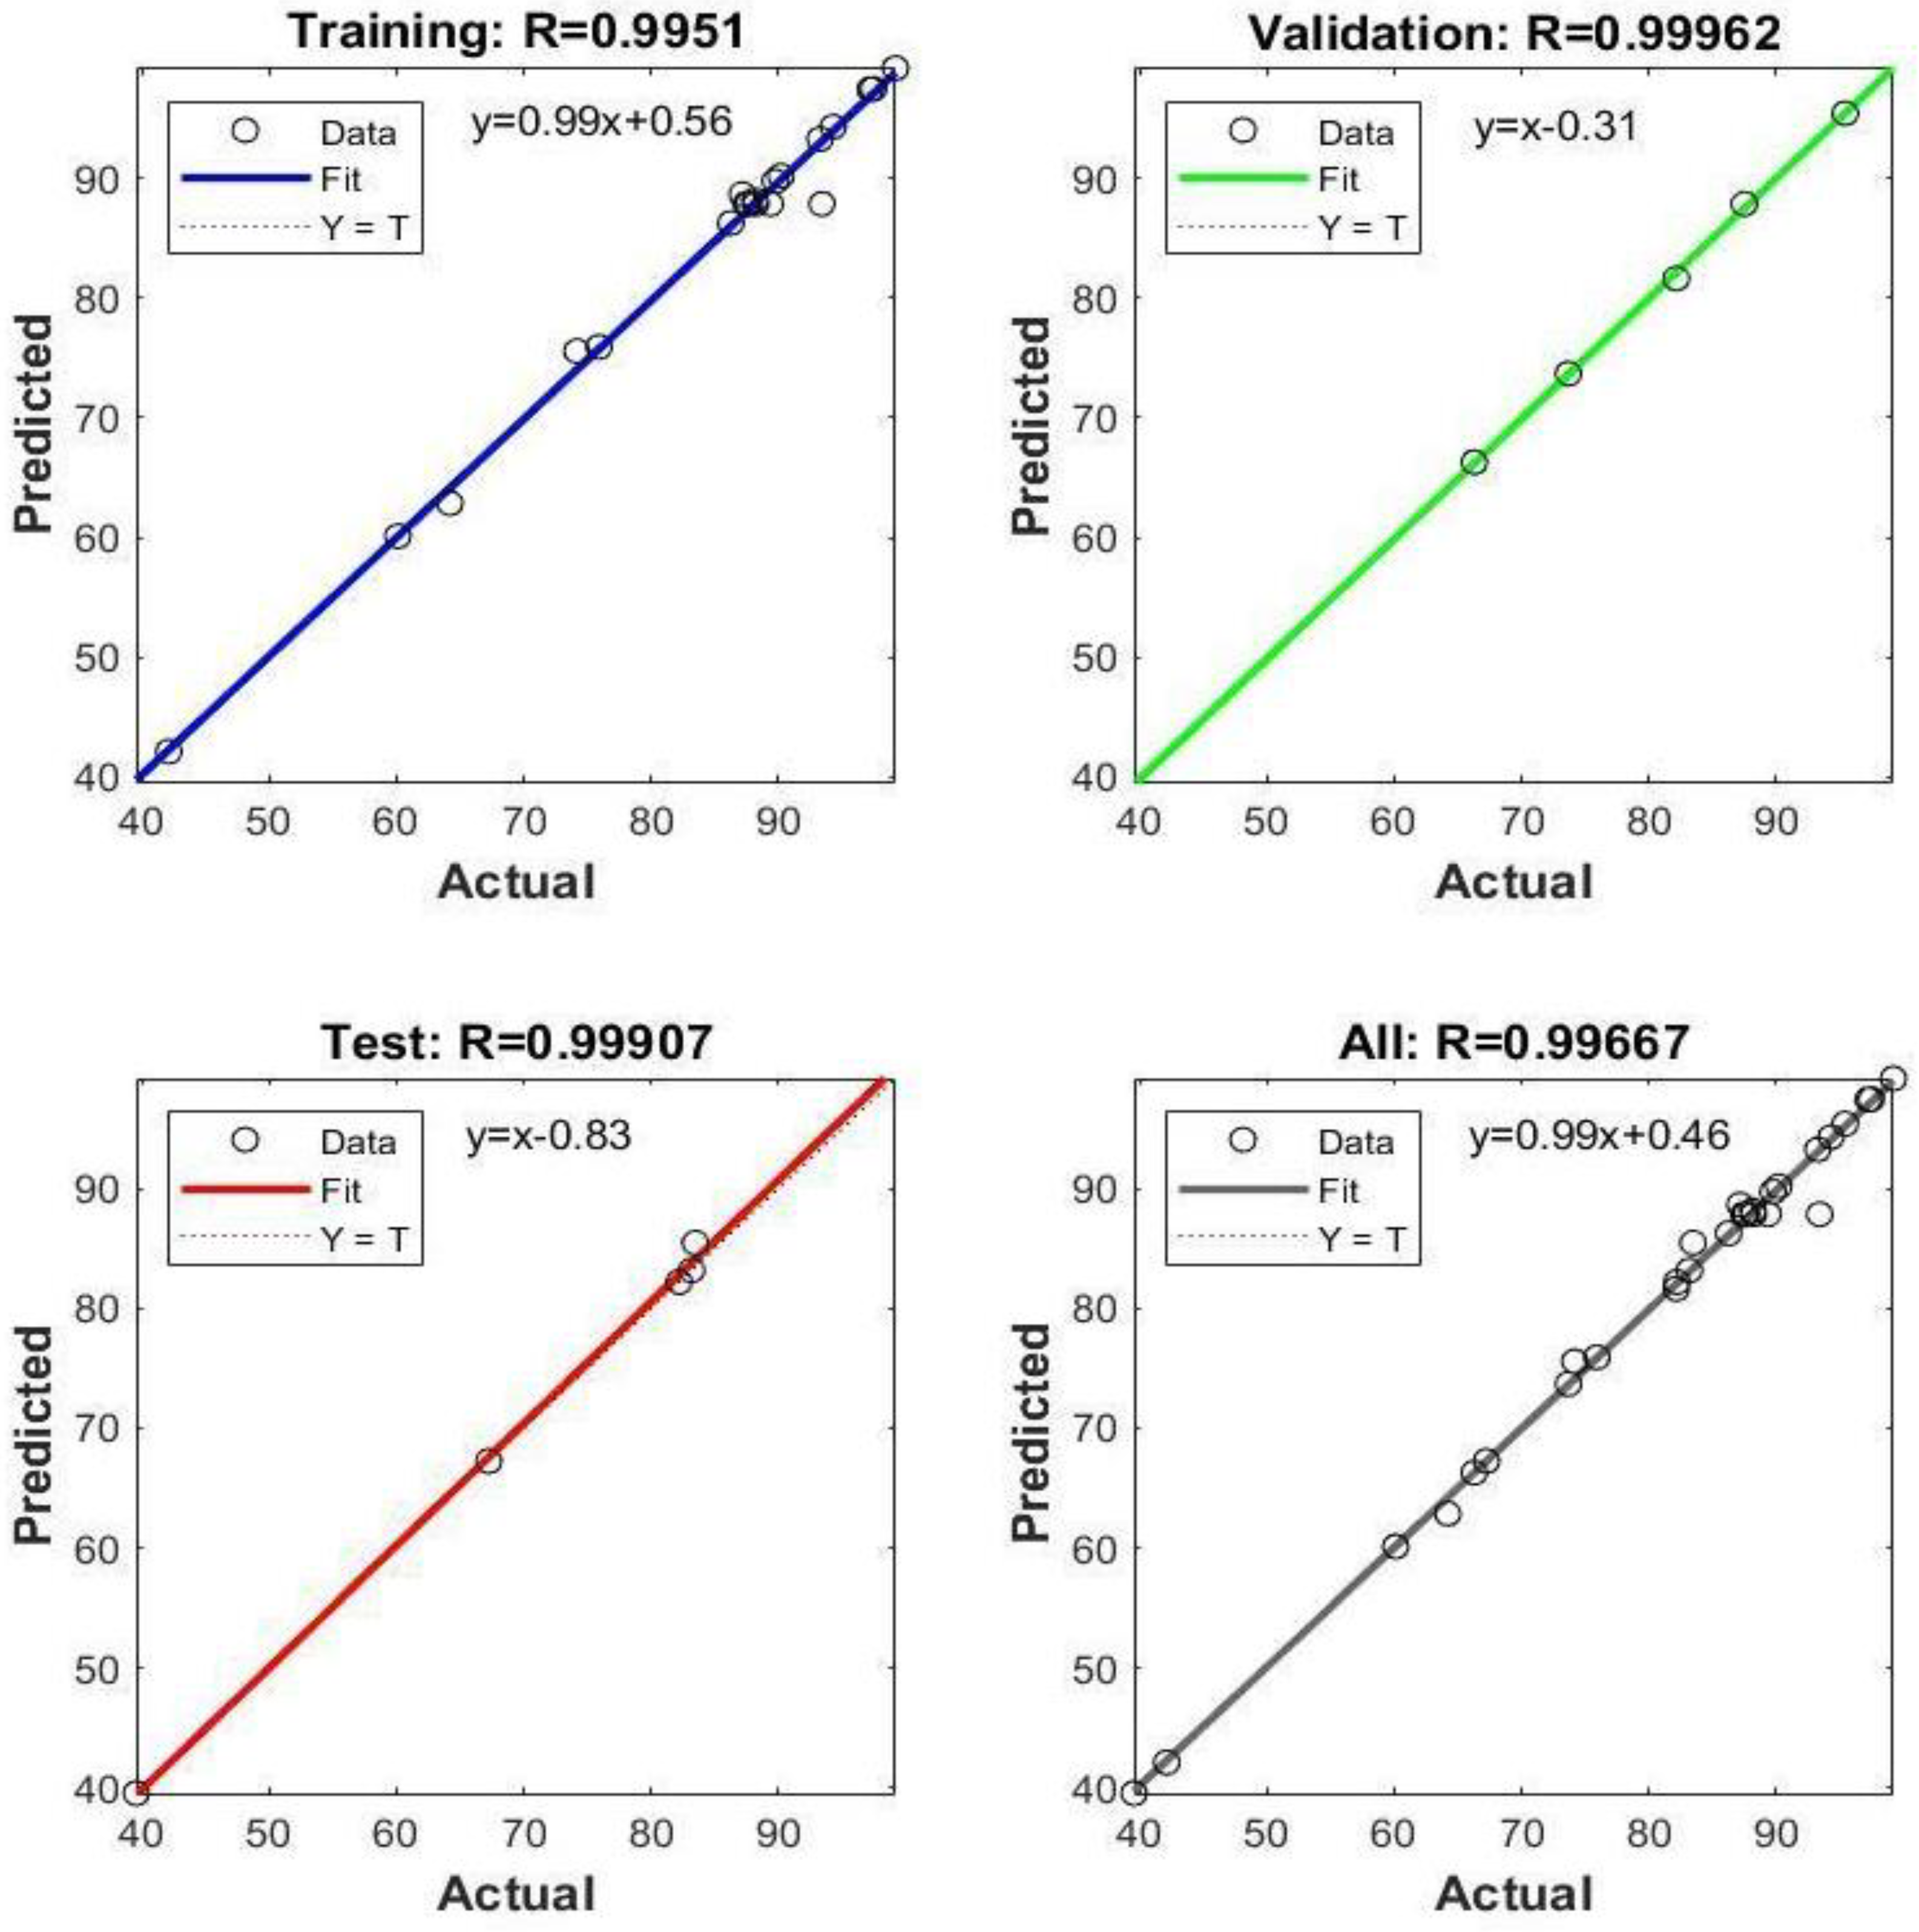
The dataset was pre-processed by normalizing all values within the range of [−1,1]. The mean squared error (MSE) was selected for model evaluation as the loss function. The ANN model was trained using the Levenberg–Marquardt algorithm, which is particularly effective for small-scale problems [31]. From the initial dataset of 30 samples generated via central composite experimental design, 70% was allocated for training, 15% for validation, and the remaining 15% for testing purposes. After the training phase, robust correlation coefficients were noted across the training, validation, and test sets. These correlation coefficients are depicted in Figure 16.
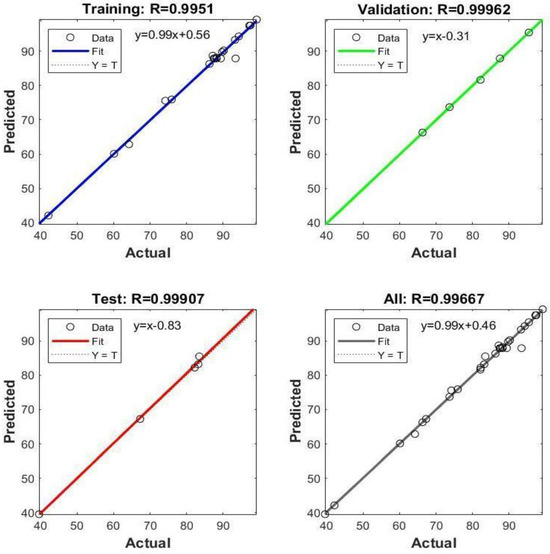
Figure 16.
The correlation values of the datasets in the ANN model.
The model’s coefficient of determination (R2) was computed as 0.9933, indicating a high level of explanatory power, while the mean squared error (MSE) was determined to be 1.4631, reflecting the model’s accuracy. To validate the model’s effectiveness, input values corresponding to 100% removal were derived using the Excel Solver add-on. These inputs were then fed into the ANN model to assess accuracy. The results of this evaluation are presented in Table 9.
Table 9.
Optimum values for ANN.
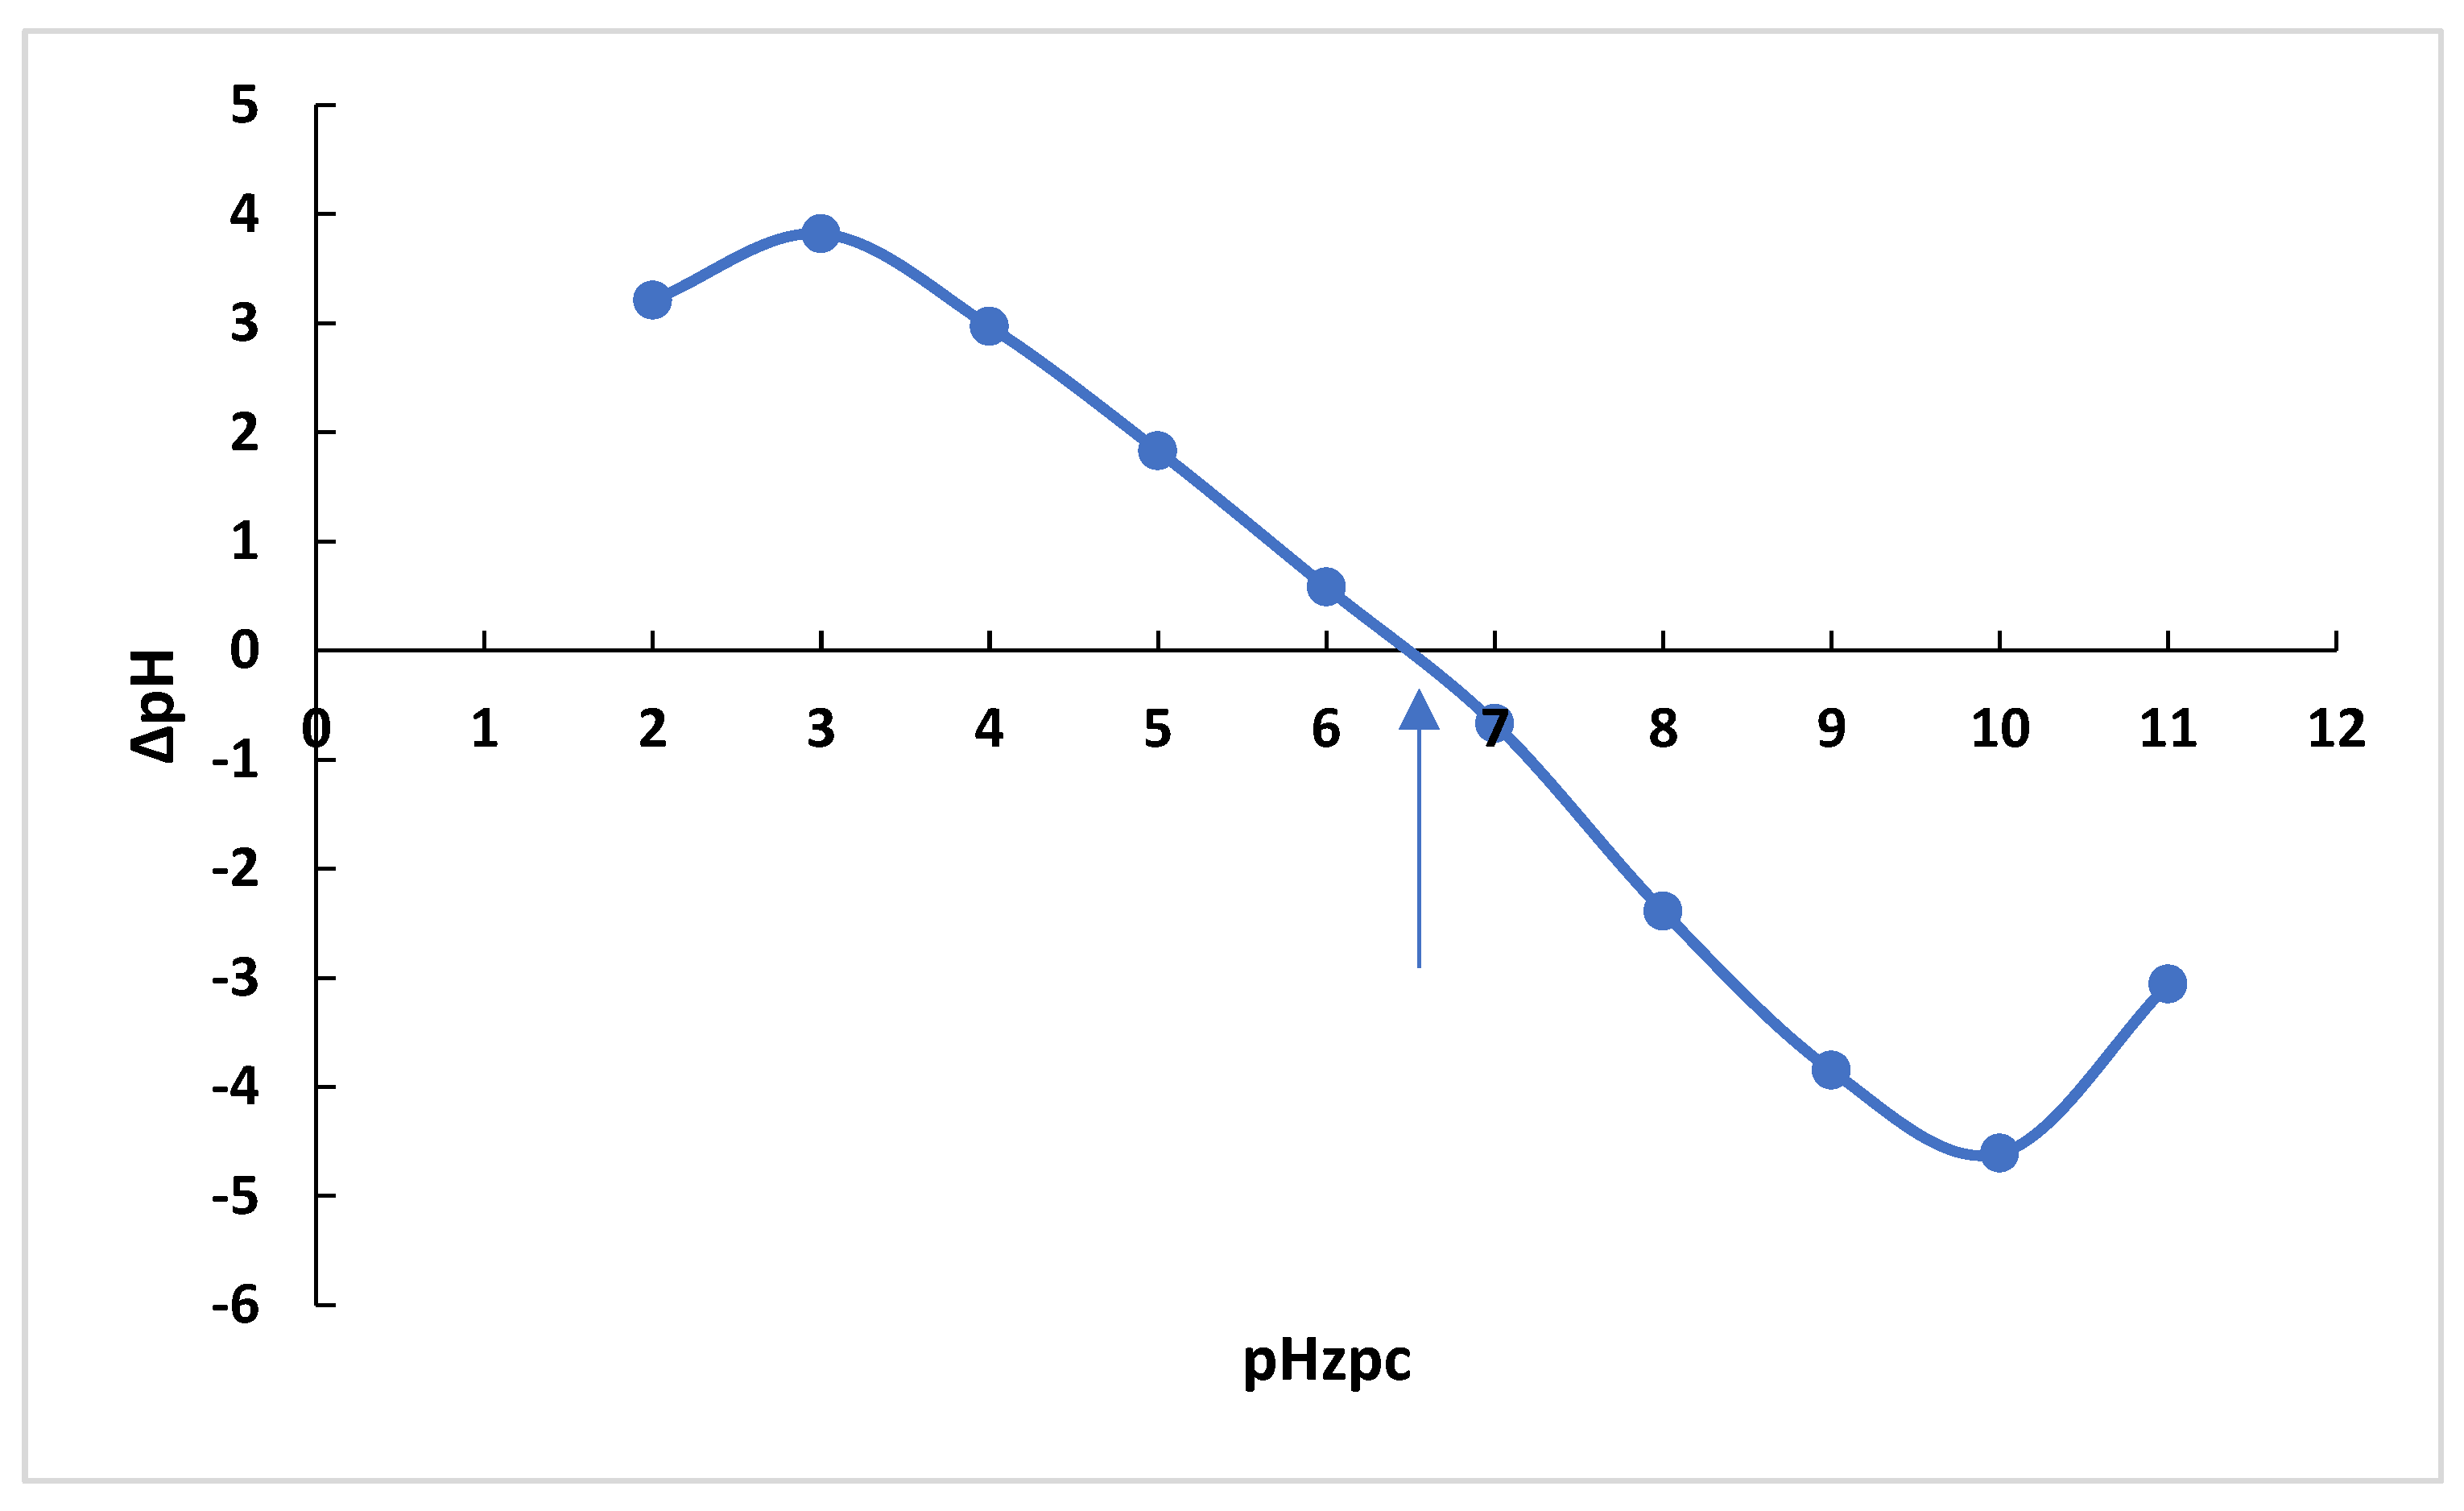
ΔPZC is the point where pH final–pH initial (ΔpH) and pH initial are zero. The pHPZC results for adsorbents can be seen in Figure 17. To determine the zero-charge point, 30 mL of 0.1 M NaCl solution was prepared. The initial pH of the NaCl solutions was adjusted in the range of 2–12 using 0.1 M HCl/NaOH solutions. After reaching a constant value of the initial pH, 0.1 g of OPAC was added to the solution and immediately sealed. These samples were shaken for 48 h, and then the pH was measured for each sample (pHf). The change in pH (pH = pHf − pHi) was plotted against pHi, and the intercept of the resulting curve where pH = 0 is the pHzpc value [44].

Figure 17.
pHPZC values of OPAC.
The value for the point of zero charge (pHzpc) for OPAC was determined as 6.35 (Figure 17) While the positively charged surfaces of the activated carbon behave differently in the dye solution in the environment with pH < pHPZC (zero-charge point), the negatively charged surfaces behave differently in the environment with pH > pHPZC. The adsorption of MB dyes with OPAC is more pronounced at pH > pHPZC conditions. On the other hand, anionic dyes exhibit a more pronounced adsorption behavior at pH < pHPZC conditions. If we consider the adsorption between the negatively charged surface and the cationic dye, the excess H+ ions in the environment at acidic pH values settle in the centers suitable for MB adsorption of OPAC and prevent the adsorption of cationic dyes. The result is compatible with the optimum pH we found in RSM conditions.
4. Conclusions
In the first stage of this study, activated carbon from olive pits (OPAC) was obtained. Using activated carbons derived from agricultural waste, such as olive pits, as adsorbents instead of high-cost commercial products is crucial for local industry and ecology. In the second stage of the study, OPAC was characterized, and equilibrium experiments for removing MB from aqueous solutions were conducted. Adsorption isotherm studies have shown that the equilibrium data are consistent with the Langmuir isotherm model, and the maximum adsorption capacity was found to be 312.5 mg g−1. In the third stage of the study, RSM and ANN methods were employed to optimize the adsorption of MB onto OPAC from an aqueous solution. The study investigated the impact of four key parameters, namely pH, contact time, adsorbent dosage, and dye concentration, on the efficiency of MB adsorption, aiming to optimize the percentage removal. The optimized process variables derived from both Response Surface Methodology (RSM) and artificial neural network (ANN) approaches are closely aligned with the experimental data. Notably, the ANN model exhibited a higher coefficient of determination (R2) than the RSM model. Based on the results obtained from the ANN model, the ideal parameters for achieving complete removal were projected as follows: pH at 6.194, adsorbent quantity of 0.7461 g, contact time of 50.1528 min, and a concentration of MB at 75 mg/L. These results underscore the applicability of ANN models in accurately describing and modeling the effects of the experimental factors on the efficiency of MB adsorption. Both analysis of variance (ANOVA) and ANN approaches demonstrated a perfect fit between the predicted models and experimental data, with very small mean squared error (MSE) values confirming the accuracy of the ANN models. The F-tests conducted for the entire model further validated its statistical significance. The primary reason for choosing an ANN is its strong ability to learn and generalize non-linear data relationships. Like other machine learning models, an ANN can learn patterns within a dataset. Still, its main distinction lies in its multilayer structure and advanced learning techniques, which enable it to capture deeper and more latent relationships in the data. This feature is particularly effective for building models with complex, large, and high-dimensional datasets. Moreover, the flexible structure of ANNs allows for high accuracy through parameter tuning and hyperparameter optimization. In conclusion, the regression model and associated statistical tests were highly significant, highlighting the efficacy of neural network modeling in predicting MB removal from aqueous solutions using OPAC. This study suggests the potential of OPAC as a cost-effective solution for removing organic contaminants like MB. This can be adapted for various water treatment applications dealing with dye substances resistant to conventional treatment methods.
Author Contributions
T.O.O.: experimental design and writing of results; M.C.: mathematical modeling of experiments and application of RSM technique; B.S.: experimental studies; D.B.A.: artificial intelligence studies; E.A.: article writing and checking procedures; A.A.: study design and editing. All authors have read and agreed to the published version of the manuscript.
Funding
No financial support was received for this research.
Data Availability Statement
The original contributions presented in this study are included in the article. Further inquiries can be directed to the corresponding authors.
Conflicts of Interest
The authors have declared no conflicts of interest.
References
- Asfaram, A.; Ghaedi, M.; Dashtian, K.; Ghezelbash, G.R. Preparation and characterization of Mn0.4Zn0.6Fe2O4 nanoparticles supported on dead cells of Yarrowia lipolytica as a novel and efficient adsorbent/biosorbent composite for the removal of azo food dyes: Central composite design optimization study. ACS Sustain. Chem. Eng. 2018, 6, 4549–4563. [Google Scholar] [CrossRef]
- Rejeb, Z.B.; Abidli, A.; Zaoui, A.; Fashandi, M.; Selka, A.; Naguib, H.E.; Park, C.B. One-pot synthesis of rationally-designed fexible, robust, and hydrophobic ambient-dried molecularly-bridged silica aerogels with efcient and versatile oil/water separation applications. Adv. Compos. Hybrid Mater. 2024, 7, 188. [Google Scholar] [CrossRef]
- Lee, G.; Ahmed, I.; Lee, H.J.; Jhung, S.H. Adsorptive removal of organic pollutants with a specific functional group from water by using metal–organic frameworks (MOFs) or MOF-derived carbons: A review. Sep. Purif. Technol. 2024, 347, 127602. [Google Scholar] [CrossRef]
- Badeenezhad, A.; Azhdarpoor, A.; Bahrami, S.; Yousefinejad, S. Removal of methylene blue dye from aqueous solutions by natural clinoptilolite and clinoptilolite modified by iron oxide nanoparticles. Mol. Simul. 2019, 45, 564–571. [Google Scholar] [CrossRef]
- Dai, Y.; Zou, J.; Liu, D.; Niu, L.; Zhou, L.; Zhou, Y.; Zhang, X. Preparation of Congo red functionalized Fe3O4@SiO2 nanoparticle and its application for the removal of methylene blue. Colloids Surf. A Physicochem. Eng. Asp. 2018, 550, 90–98. [Google Scholar]
- Farghali, M.A.; Abo-Aly, M.M.; Salaheldin, T.A. Modified mesoporous zeolite-A/reduced graphene oxide nanocomposite for dual removal of methylene blue and Pb2+ ions from wastewater. Inorg. Chem. Commun. 2021, 126, 108487. [Google Scholar] [CrossRef]
- Hosseini, H.; Pirahmadi, P.; Shakeri, S.E.; Khoshbakhti, E.; Sharafkhani, S.; Fakhri, V.; Saeidi, A.; McClements, D.J.; Chen, W.-H.; Su, C.-H.; et al. A novel environmentally friendly nanocomposite aerogel based on the semi-interpenetrating network of polyacrylic acid into Xanthan gum containing hydroxyapatite for efficient removal of methylene blue from wastewater. Int. J. Biol. Macromol. 2022, 201, 133–142. [Google Scholar] [CrossRef]
- Mosleh, S.; Rahimi, M.R.; Ghaedi, M.; Dashtian, K.; Hajati, S.; Wang, S. Ag3PO4/AgBr/Ag-HKUST-1-MOF composites as novel blue LED light active photocatalyst for enhanced degradation of ternary mixture of dyes in a rotating packed bed reactor. Chem. Eng. Process. Process Intensif. 2017, 114, 24–38. [Google Scholar] [CrossRef]
- Chen, M.; Yang, H.; Xu, Z.L.; Cheng, C. Separation of single and mixed anionic dyes in saline solutions using uncharged polyacrylonitrile-tris (hydroxymethyl) aminomethane (PAN-Tris) ultrafiltration membrane: Performance and mechanism. J. Clean. Prod. 2022, 336, 130471. [Google Scholar] [CrossRef]
- Nnaji, P.C.; Anadebe, V.C.; Ezemagu, I.G.; Onukwuli, O.D. Potential of Luffa cylindrica seed as coagulation-flocculation (CF) agent for the treatment of dye wastewater: Kinetic, mass transfer, optimization and CF adsorption studies. Arab. J. Chem. 2022, 15, 103629. [Google Scholar] [CrossRef]
- Sayin, F. Insight into decolorization characteristics of a green biocomposite sorbent system prepared by immobilization of fungal cells on lignocellulosic matrix: Box-behnken design. Water Air Soil Pollut. 2022, 233, 262. [Google Scholar] [CrossRef]
- Sánchez-Albores, R.; Cano, F.J.; Sebastian, P.J.; Reyes-Vallejo, O. Microwave-assisted biosynthesis of ZnO-GO particles using orange peel extract for photocatalytic degradation of methylene blue. J. Environ. Chem. Eng. 2022, 10, 108924. [Google Scholar] [CrossRef]
- Singh, A.L.; Chaudhary, S.; Kumar, S.; Kumar, A.; Singh, A.; Yadav, A. Biodegradation of Reactive Yellow-145 azo dye using bacterial consortium: A deterministic analysis based on degradable Metabolite, phytotoxicity and genotoxicity study. Chemosphere 2022, 300, 134504. [Google Scholar] [CrossRef]
- Pormazar, S.M.; Dalvand, A. Adsorption of Reactive Black 5 azo dye from aqueous solution by using amine-functioned Fe3O4 nanoparticles with L-arginine: Process optimisation using RSM. Int. J. Environ. Anal. Chem. 2022, 102, 1764–1783. [Google Scholar] [CrossRef]
- Ahmed, M.J. Application of agricultural based activated carbons by microwave and conventional activations for basic dye adsorption: Review. J. Environ. Chem. Eng. 2016, 4, 89–99. [Google Scholar] [CrossRef]
- Azari, A.; Nabizadeh, R.; Nasseri, S.; Mahvi, A.H.; Mesdaghinia, A.R. Comprehensive systematic review and meta-analysis of dyes adsorption by carbon-based adsorbent materials: Classification and analysis of last decade studies. Chemosphere 2020, 250, 126238. [Google Scholar] [CrossRef]
- Limousy, L.; Ghouma, I.; Ouederni, A.; Jeguirim, M. Amoxicillin removal from aqueous solution using activated carbon prepared by chemical activation of olive stone. Environ. Sci. Pollut. Res. 2017, 24, 9993–10004. [Google Scholar] [CrossRef]
- Sinha, K.; Saha, P.D.; Datta, S. Response surface optimization and artificial neural network modelling of microwave assisted natural dye extraction from pomegranate rind. Ind. Crops Prod. 2012, 37, 408–414. [Google Scholar] [CrossRef]
- Barbanera, M.; Lascaro, E.; Foschini, D.; Cotana, F.; Buratti, C. Optimization of bioethanol production from steam exploded hornbeam wood (Ostrya carpinifolia) by enzymatic hydrolysis. Renew. Energy 2018, 124, 136–143. [Google Scholar] [CrossRef]
- Shojaeimehr, T.; Rahimpour, F.; Khadivi, M.A.; Sadeghi, M. A modelling study by response surface methodology (RSM) and artificial neural network (ANN) on Cu2+ adsorption optimization using light expended clay aggregate (LECA). J. Ind. Eng. Chem. 2014, 20, 870–880. [Google Scholar] [CrossRef]
- Bagheri, R.; Ghaedi, M.; Asfaram, A.; Dil, E.A.; Javadian, H. RSM-CCD design of malachite green adsorption onto activated carbon with multimodal pore size distribution prepared from Amygdalus scoparia: Kinetic and isotherm studies. Polyhedron 2019, 171, 464–472. [Google Scholar] [CrossRef]
- Singh, A.; Bishnoi, N.R. Enzymatic hydrolysis optimization of microwave alkali pretreated wheat straw and ethanol production by yeast. Bioresour. Technol. 2012, 108, 94–101. [Google Scholar] [CrossRef]
- Prabu, D.; Parthiban, R.; Narendrakumar, G. Application of response surface methodology for removal of Congo red dye by nanozerovalent iron impregnated cashew nutshell. J. Chem. Pharm. Res. 2015, 7, 879–884. [Google Scholar]
- Danda, S.K.; Ramachandramurthy, C.V.; Dayana, K.; Sowjanya, C.V. Application of response surface methodology (RSM) for the removal of nickel using rice husk ash as biosorbent. Int. J. Eng. Res. Generic Sci. 2014, 2, 162–176. [Google Scholar]
- Dhiman, N.; Singh, A.; Verma, N.K.; Ajaria, N.; Patnaik, S. Statistical optimization and artificial neural networkmodeling for acridine orange dye degradation using in-situ synthesized polymer capped ZnO nanoparticles. J. Colloid Interface Sci. 2017, 493, 295–300. [Google Scholar] [CrossRef]
- Igwegbe, C.A.; Mohmmadi, L.; Ahmadi, S.; Rahdar, A.; Khadkhodaiy, D.; Dehghani, R.; Rahdar, S. Modeling of adsorption of methylene blue dye on Ho-CaWO4 nanoparticles using response surface methodology (RSM) and artificial neural network (ANN) techniques. MethodsX 2019, 6, 1779–1797. [Google Scholar] [CrossRef]
- Onu, C.E.; Nwabanne, J.T.; Ohale, P.E.; Asadu, O. Comparative analysis of RSM, ANN and ANFIS and the mechanistic modeling in eriochrome black-T dye adsorption using modified clay. S. Afr. J. Chem. Eng. 2021, 36, 24–42. [Google Scholar] [CrossRef]
- Dil, E.A.; Ghaedi, M.; Asfaram, A.; Mehrabi, F.; Bazrafshan, A.A.; Ghaedi, A.M. Trace determination of safranin O dye using ultrasound assisted dispersive solidphase micro extraction: Artificial neural network-genetic algorithm and response surface methodology. Ultrason. Sonochem. 2016, 33, 129–140. [Google Scholar] [CrossRef] [PubMed]
- Karri, R.R.; Sahu, J.N. Modeling and optimization by particle swarm embedded neural network for adsorption of zinc (II) by palm kernel shell based activated carbon from aqueous environment. J. Environ. Manag. 2018, 206, 178–191. [Google Scholar] [CrossRef]
- Lingamdinne, L.P.; Singh, J.; Choi, J.; Chang, Y.; Yang, J.; Karri, R.R.; Koduru, J.R. Multivariate modeling via artificial neural network applied to enhance methylene blue sorption using graphene-like carbon material prepared from edible sugar. J. Mol. Liq. 2018, 265, 416–427. [Google Scholar] [CrossRef]
- Buledi, J.A.; Pato, A.H.; Kanhar, A.H.; Solangi, A.R.; Batool, M.; Ameen, S.; Palabiyik, I.M. Heterogeneous kinetics of CuO nanoflakes in simultaneous decolorization of Eosin Y and Rhodamine B in aqueous media. Appl. Nanosci. 2021, 11, 1241–1256. [Google Scholar] [CrossRef]
- Kumar, M.R.; King, P.; Wolde, Z.; Mulu, M. Application of optimization response surface for the biosorption of crystal violet dye from textile wastewater onto Clerodendrum fragrans leaves. Biomass Convers. Biorefinery 2022, 13, 17133–17148. [Google Scholar] [CrossRef]
- Kumari, S.; Verma, A.; Sharma, P.; Agarwal, S.; Rajput, V.D.; Minkina, T.; Rajput, P.; Singh, S.P.; Garg, M.C. Introducing machine learning model to response surface methodology for biosorption of methylene blue dye using Triticum aestivum biomass. Sci. Rep. 2023, 13, 8574. [Google Scholar] [CrossRef]
- Prasad, R.; Yadav, K.D. Use of Response Surface Methodology And Artificial Neural Network Approach For Methylene Blue Removal By Adsorption Onto Water Hyacinth. Water Conserv. Manag. WCM 2020, 4, 83–89. [Google Scholar] [CrossRef]
- Muhammad, N.; Manurung, Y.H.; Jaafar, R.; Abas, S.K.; Tham, G.; Haruman, E. Model development for quality features of resistance spot welding using multi-objective Taguchi method and response surface methodology. J. Intell. Manuf. 2013, 24, 1175–1183. [Google Scholar] [CrossRef]
- Pato, A.H.; Balouch, A.; Talpur, F.N.; Abdullah; Panah, P.; Mahar, A.M.; Jagirani, M.S.; Kumar, S.; Sanam, S. Fabrication of TiO2@ITO-grown nanocatalyst as efficient applicant for catalytic reduction of Eosin Y from aqueous media. Environ. Sci. Pollut. Res. 2021, 28, 947–959. [Google Scholar] [CrossRef] [PubMed]
- Alardhi, S.M.; Fiyadh, S.S.; Salman, A.D.; Adelikhah, M. Prediction of methyl orange dye (MO) adsorption using activated carbon with an artificial neural network optimization modeling. Heliyon 2023, 9, e12888. [Google Scholar] [CrossRef] [PubMed]
- Rene, E.R.; Veiga, M.C.; Kennes, C. Experimental and neural model analysis of styrene removal from polluted air in a biofilter. J. Chem. Technol. Biotechnol. 2009, 84, 941–948. [Google Scholar] [CrossRef]
- Tamjidi, S.; Esmaeili, H.; Moghadas, B.K. Application of magnetic adsorbents for removal of heavy metals from wastewater: A review study. Mater. Res. Express 2019, 6, 102004. [Google Scholar] [CrossRef]
- Pan, D.; Chen, H. Border pollution reduction in China: The role of livestock environmental regulations. China Econ. Rev. 2021, 69, 101681. [Google Scholar] [CrossRef]
- Ahmadi, A.; Foroutan, R.; Esmaeili, H.; Tamjidi, S. The role of bentonite clay and bentonite clay@MnFe2O4 composite and their physico-chemical properties on the removal of Cr(III) and Cr(VI) from aqueous media. Environ. Sci. Pollut. Res. 2020, 27, 14044–14057. [Google Scholar] [CrossRef]
- Abdel-GhANi, N.T.; El-Chaghaby, G.A.; Rawash, E.S.A.; Lima, E.C. Adsorption of coomassie brilliant blue r-250 dye onto novel activated carbon prepared from Nigella sativa L. waste: Equilibrium, kinetics and thermodynamics running title: Adsorption of brilliant blue dye onto Nigella sativa L. waste activated carbon. J. Chil. Chem. Soc. 2017, 62, 3505–3511. [Google Scholar] [CrossRef]
- Thang, H.N.; Sy Khang, D.; Duy, H.T.; Thi, N.D.; Dinh, T.P. Methylene blue adsorption mechanism of activated carbon synthesized from cashew nut shells. RSC Adv. 2021, 11, 26563–26570. [Google Scholar] [CrossRef] [PubMed]
- Jabar, J.M.; Odusote, Y.A.; Ayinde, Y.T.; Yılmaz, M. African almond (Terminalia catappa L.) leaves biochar prepared through pyrolysis using H3PO4 as chemical activator for sequestration of methylene blue dye. Results Eng. 2022, 14, 100385. [Google Scholar] [CrossRef]
- Yousef, T.A.; Sahu, U.K.; Jawad, A.H.; Abd Malek, N.N.; Al Duaij, O.K.; ALOthman Zeid, A. Fruit peel-based mesoporous activated carbon via microwave assisted K2CO3 activation: Box Behnken design and desirability function for methylene blue dye adsorption. Int. J. Phytoremediation 2023, 25, 1142–1154. [Google Scholar] [CrossRef] [PubMed]
- Yagmur, H.K.; Kaya, I. Synthesis and characterization of magnetic ZnCl2-activated carbon produced from coconut shell for the adsorption of methylene blue. J. Mol. Struct. 2021, 1232, 130071. [Google Scholar] [CrossRef]
- Ma, Y. Comparison of Activated Carbons Prepared from Wheat Straw via ZnCl2 and KOH Activation. Waste Biomass Valorization 2017, 8, 549–559. [Google Scholar] [CrossRef]
- Zahari, K.F.A.; Sahu, U.K.; Khadiran, T.; Surip, S.N.; ALOthman Zeid, A.; Jawad, A.H. Mesoporous Activated Carbon from Bamboo Waste via Microwave-Assisted K2CO3 Activation: Adsorption Optimization and Mechanism for Methylene Blue Dye. Separations 2022, 9, 390. [Google Scholar] [CrossRef]
- Sarici, B.; Karataş, Ş.; Altintig, E. Removal of Methylene blue from aqueous solution with activated carbon produced from hazelnut shells by K2CO3 activation. Desalination Water Treat. 2022, 254, 287–301. [Google Scholar] [CrossRef]
- El-Mekkawi, D.; Galal, H.R. Removal of a synthetic dye “Direct Fast Blue B2RL” via adsorption and photocatalytic degradation using low-cost rutile and Degussa P25 titanium dioxide. J. Hydro-Environ. Res. 2013, 7, 219–226. [Google Scholar] [CrossRef]
- Yagub, M.T.; Sen, T.K.; Afroze, S.; Ang, H.M. Dye and its removal from aqueous solution by adsorption: A review. Adv. Colloid Interface Sci. 2014, 209, 172–184. [Google Scholar] [CrossRef]
- Salleh, M.A.M.; Mahmoud, D.K.; Karim, W.A.W.A.; Idris, A. Cationic and anionic dye adsorption by agricultural solid wastes: A comprehensive review. Desalination 2011, 280, 1–13. [Google Scholar] [CrossRef]
- Ali, I.; Asim, M.; Khan, T.A. Low cost adsorbents for the removal of organic pollutants from wastewater. J. Environ. Manag. 2012, 113, 170–183. [Google Scholar] [CrossRef]
- Gupta, V.K.; Kumar, R.; Nayak, A.; Saleh, T.A.; Barakat, M.A. Adsorptive removal of dyes from aqueous solution onto carbon nanotubes: A review. Adv. Colloid Interface Sci. 2013, 193, 24–34. [Google Scholar] [CrossRef]
- Mahmoodi, N.M. Photodegradation of dyes using multiwalled carbon nanotube and ferrous ion. J. Environ. Eng. 2013, 139, 1368–1374. [Google Scholar] [CrossRef]


Disclaimer/Publisher’s Note: The statements, opinions and data contained in all publications are solely those of the individual author(s) and contributor(s) and not of MDPI and/or the editor(s). MDPI and/or the editor(s) disclaim responsibility for any injury to people or property resulting from any ideas, methods, instructions or products referred to in the content. |
© 2025 by the authors. Licensee MDPI, Basel, Switzerland. This article is an open access article distributed under the terms and conditions of the Creative Commons Attribution (CC BY) license (https://creativecommons.org/licenses/by/4.0/).