Article

Techno-Economic Assessment of Biogas-to-Methanol Processes Coupled with Low-Carbon H2 Production Technologies

1
State Key Laboratory of Materials-Oriented Chemical Engineering, College of Chemical Engineering, Nanjing Tech University, Nanjing 211816, China
2
School of Energy Science and Engineering, Nanjing Tech University, Nanjing 211816, China
*
Authors to whom correspondence should be addressed.
Processes 2025, 13(2), 313; https://doi.org/10.3390/pr13020313
Submission received: 28 December 2024 / Revised: 14 January 2025 / Accepted: 21 January 2025 / Published: 23 January 2025
(This article belongs to the Section Chemical Processes and Systems)

Abstract

:
In order to realize carbon mitigation and the efficient utilization of waste biogas, the biogas-to-methanol process is an important method. The syngas produced by the conventional biogas reforming technology is rich in CO2 and CO, whereas it is poor in hydrogen. Therefore, additional H2 is introduced into the system to adjusted the syngas ratio, promoting the efficient conversion of the biogas. However, the use of traditional H2 production technologies generally results in considerable carbon emissions. Given these points, low-carbon H2 production technologies, namely methane pyrolysis technology and chemical looping reforming technology, are integrated with the biogas-to-methanol process to enhance carbon conversion, carbon reduction, and cost-saving potentials. Comprehensive technical and economic comparisons of the integrated processes are conducted. The process coupled with chemical looping reforming technology has a higher carbon conversion efficiency (73.52%) and energy efficiency (70.41%), and lower unit carbon emissions (0.73 t CO2/t methanol). Additionally, the process coupled with methane pyrolysis technology has higher product revenue, whereas that including chemical looping reforming technology has a lower net production cost (571.33 USD/t methanol). In summary, the novel chemical looping reforming technology provides a cleaner and more sustainable pathway with which to promote the efficient conversion of biogas into methanol.

1. Introduction

The demand for fossil fuels has continued to grow since the Industrial Revolution. From 2023 to 2024, the growth rate of fossil fuels reached 2.3%, exceeding the highest level in history. Despite the increase in the deployment of renewable energy, its share in the current energy structure is still relatively small, and it is difficult to replace traditional fossil energy in a short time [1]. Therefore, we need to simultaneously find other clean alternative energy sources to alleviate the scarcity of fossil resources. In recent years, biogas has attracted a lot of attention because it is renewable, cheap, and abundant [2]. Typically, biogas is combusted to provide heat for industrial production or daily life. However, this means of utilization inevitably results in considerable carbon emissions [3]. To address this issue, biogas has been considered an important feedstock and is used to produce valuable chemicals in industry. It is expected to achieve carbon mitigation and produce alternatives to fossil energy.
Methanol is regarded as an important platform chemical that can be used to produce light olefins, aromatics, dimethyl ether, and so on. Meanwhile, methanol is considered a clean fuel, and its combustion process generates lower CO2 emissions compared with fossil fuels [4,5]. Given these points, biogas-to-methanol technology has attracted a lot of attention. The typical biogas-to-methanol process is divided into three steps, namely, the biogas reforming, methanol synthesis, and methanol purification steps [6]. Unlike industrial steam methane reforming, the poor-hydrogen syngas is generally generated during the biogas reforming process due to the higher CO2 content in the biogas (>30 mol%). Therefore, the additional H2 needs to be supplied to adjust the syngas ratio of H2/(2CO + 3CO2) to 1.0, which can satisfy the requirement of the following methanol synthesis step. The typical reactions in the methanol synthesis process are shown in Equations (1) and (2).
CO 2 + 3 H 2 CH 3 OH + H 2 O
CO + 2 H 2 CH 3 OH
In general, H2 is generated by steam methane reforming technology in industry. However, the technology generally results in considerable CO2 emissions along with H2 production, further aggravating climate change [7]. Therefore, novel H2 production methods are proposed, such as water electrolysis, methane pyrolysis, and chemical looping reforming pathways [8,9,10]. The water electrolysis technologies are heavily dependent on renewable electricity [11]. Nevertheless, it should be noted that the intermittency of renewable electricity can affect the stable operation of the plant [12]. Meanwhile, the cost of renewable electricity is the crucial challenge in enhancing the economic feasibility of water electrolysis technologies in the current market conditions [13,14]. Nevertheless, the methane pyrolysis and chemical looping reforming pathways could see large-scale deployment under the present energy structure. More specifically, in the methane pyrolysis process, the methane is pyrolyzed into solid carbon and H2 in high-temperature conditions without generating any CO2 [15]. The byproduct solid carbon can be sold as a high-value-added product. Notably, the carbon dioxide in the feedstock needs to be separated out if the biogas is selected as the feedstock. In the chemical looping reforming process, pure methane or biogas can be used as feedstock [16]. Taking biogas as an example, H2 can be obtained and in situ CO2 separation can be achieved through the calcination and generation of the solid adsorbent.

Literature Review

Currently, CH4 pyrolysis as well as chemical looping reforming technologies are integrated with various chemical processes. For instance, Galish et al. [17] presented the ammonia production process used to integrate the methane pyrolysis and reforming technologies and conducted techno-economic analysis. The results indicated that the integrated process can significantly reduce carbon emissions and coproduced valuable carbon black can improve economic feasibility. Ostadi et al. [18] suggested using the biomass/municipal solid waste-to-methanol process coupled with water electrolysis and CH4 pyrolysis technologies. Meanwhile, the process performances of two options were compared in detail. It was found that two process options enhanced carbon efficiency. However, the latter process had stronger economic competitiveness under the current energy structure. In addition to methane pyrolysis technology, the chemical looping reforming technology has obtained widespread attention. For instance, Chisalita et al. [19] developed the gas-to-H2 process in a way that was integrated with chemical looping reforming technology. Compared with the conventional H2 production process, which uses steam methane reforming, the novel process has superior advantages in terms of carbon mitigation potential. Xiang et al. [20] presented a novel coal-to-methanol process combined with a chemical looping reforming technology. The introduction of the chemical looping reforming unit replaced the water–gas shift unit in the traditional coal-to-methanol process, improving the carbon conversion capacity and reducing CO2 emissions. Similar findings were reported in the study of Zhang et al. [21]. In summary, the aforementioned literature indicated that the introduction of methane pyrolysis and chemical looping reforming in the chemical process can enhance process performances. However, there is still a gap in research regarding the biogas-to-methanol process coupled with chemical looping reforming and CH4 pyrolysis technologies.
Given these points, in this work, we propose the integration of biogas-to-methanol processes with low-carbon H2 production technologies. Herein, the CH4 pyrolysis and chemical looping reforming technologies are employed to adjust the ratio of H2/(2CO + 3CO2) in syngas. The detailed technical and economic performances are evaluated and compared to quantitatively manifest the strength of two processes. On this basis, the optimal process can be determined. This is expected to provide a sustainable pathway for the efficient conversion of waste biogas.

2. Material and Methods

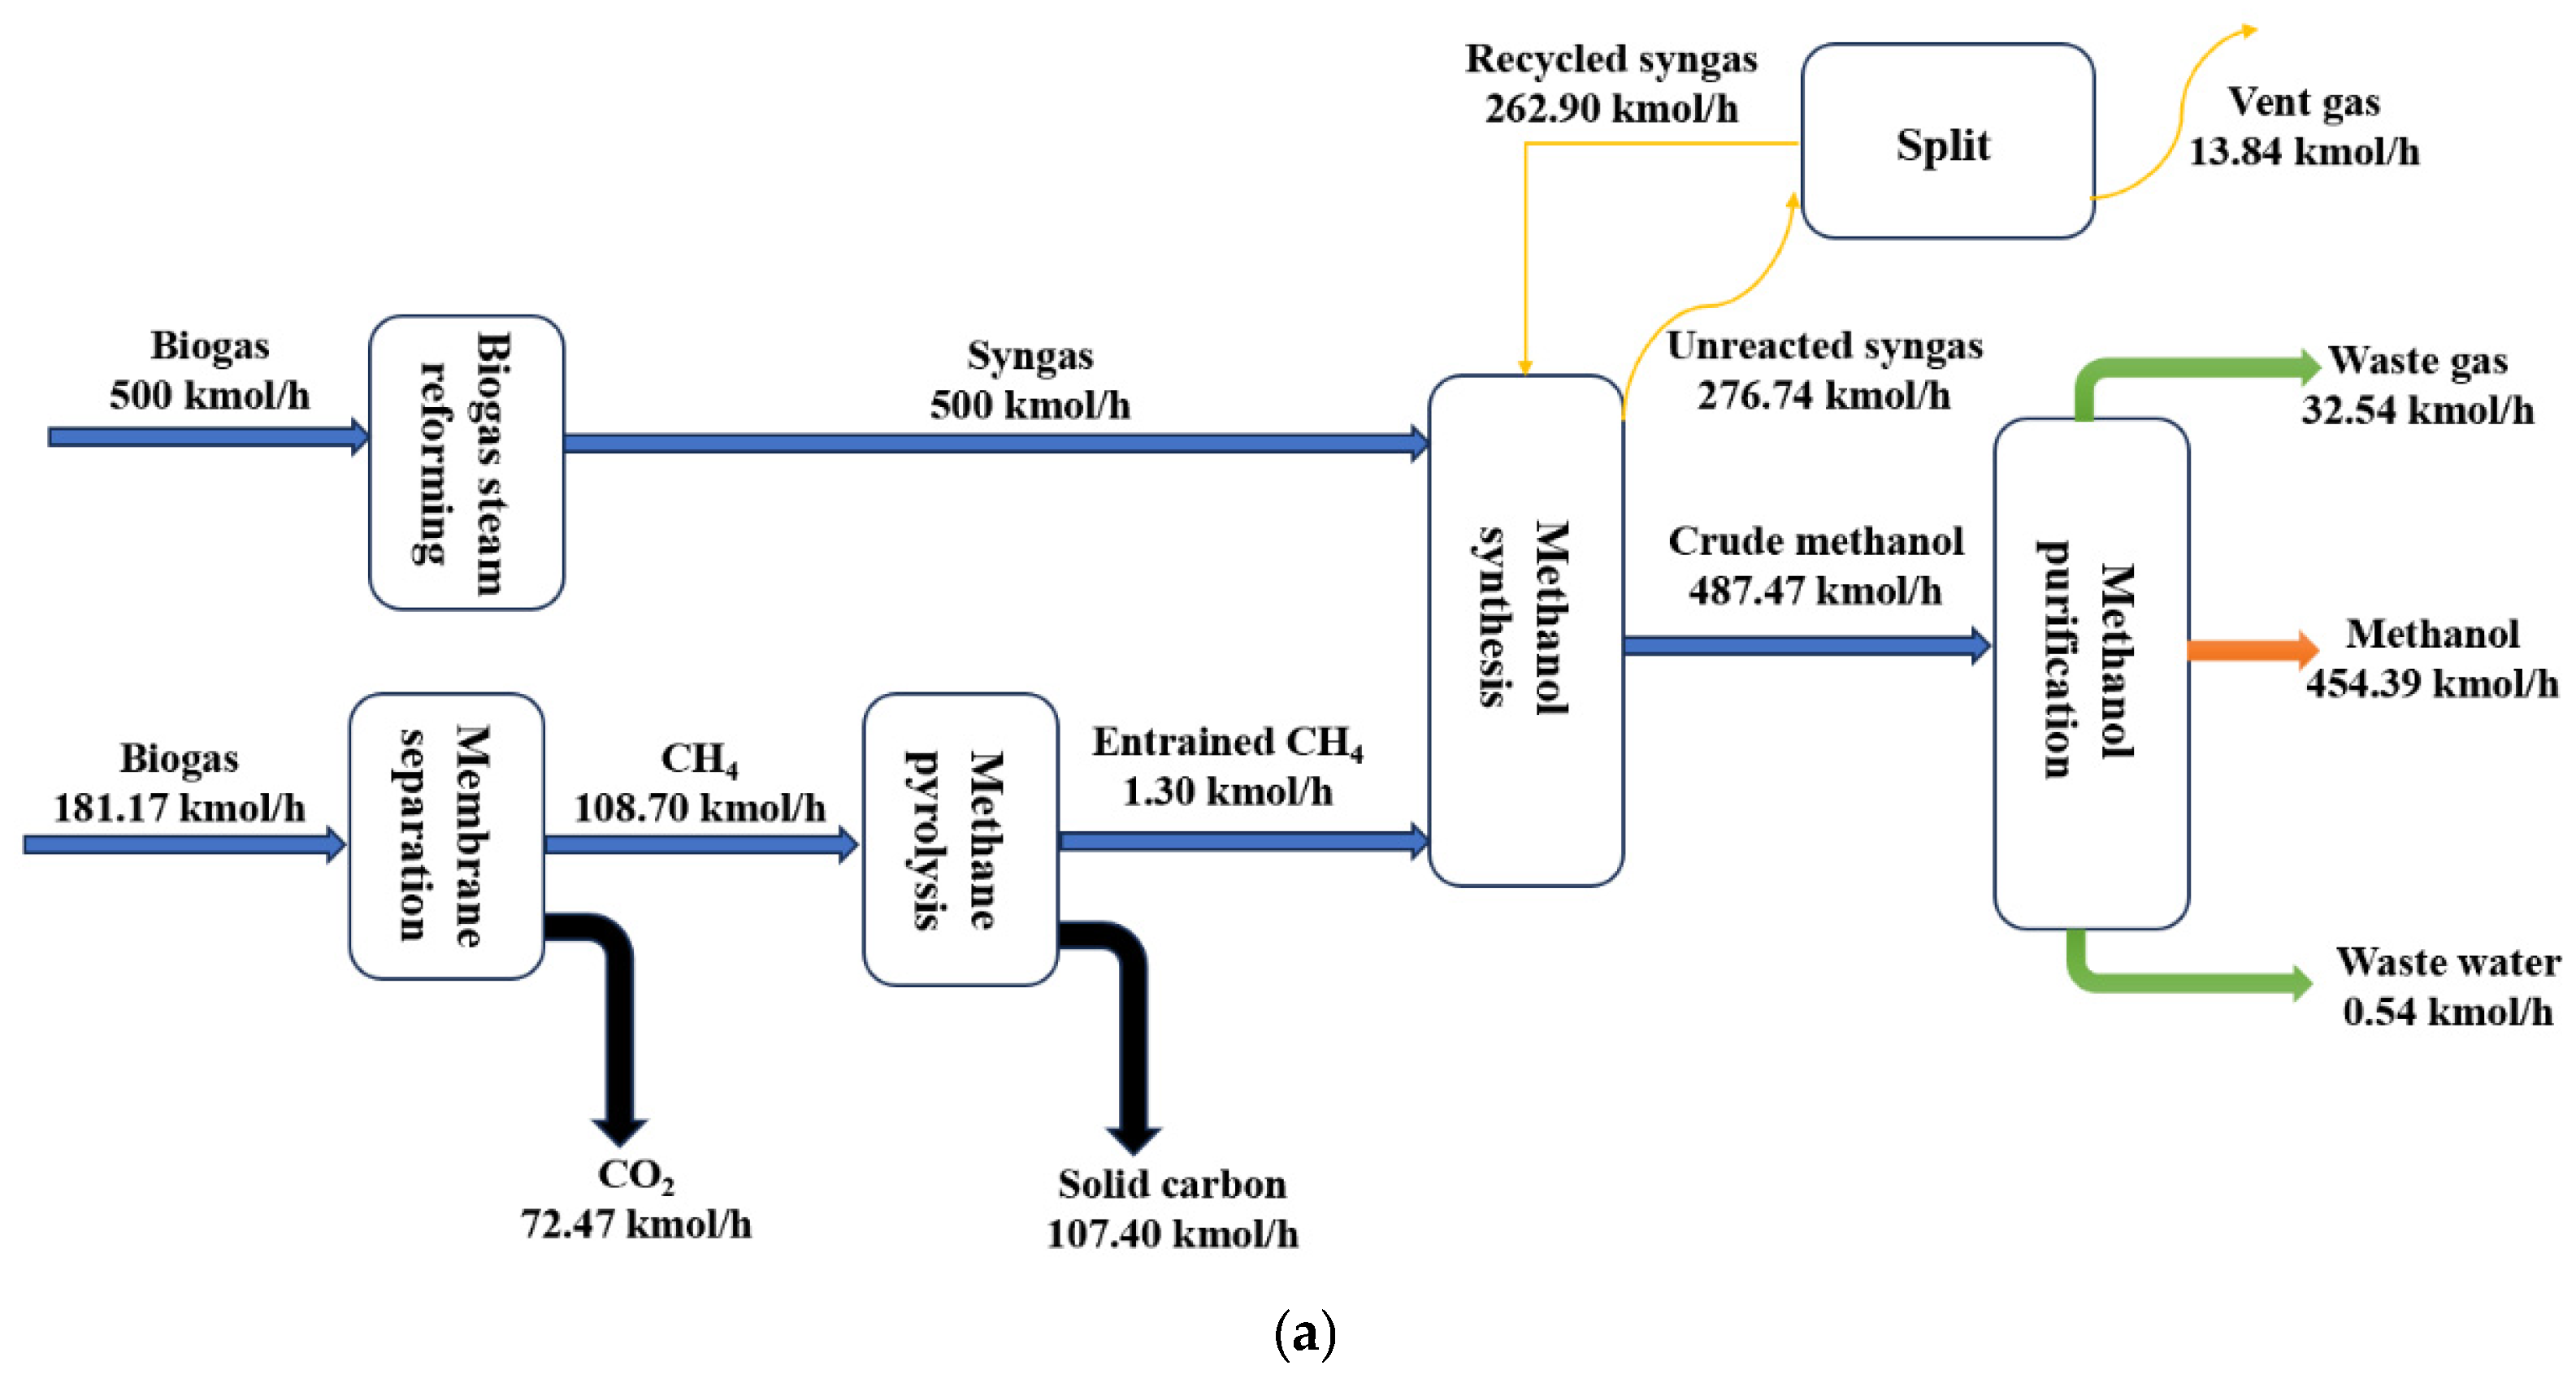
2.1. Process Description

In this work, the biogas-to-methanol processes, integrated with methane pyrolysis technology (Option A) and chemical looping reforming technology (Option B), are proposed. The specific process flowsheet diagrams and heat exchange network diagrams are shown in Figure 1 and Figure 2, respectively. The proposed biogas-to-methanol processes mainly include a biogas reforming unit, a H2 production unit, and a methanol synthesis unit. For two process options, the process configurations of biogas reforming and methanol synthesis units are similar, whereas the key difference is the H2 production unit. The relevant process models are designed using the Aspen Plus v.11 (Aspen Technology Inc., Cambridge, MA, USA). The important assumption is illustrated as follows:
(1)
The Peng–Robinson equation of state is chosen as the thermodynamic model owing to its better prediction ability for polar and nonpolar compounds [22].
(2)
The biogas is made up of CH4 (60 mol%) and CO2 (40 mol%). Its operating conditions are assumed to be 25 °C and 1 bar, respectively.
(3)
The isentropic efficiency of the compressor is set at 75%. The pressure drop of the reactor and heat exchangers is not considered. Additionally, the heat loss in the system is ignored.
Figure 1. (a) Process flowsheet diagram of biogas-to-methanol process combined with methane pyrolysis technology. (b) Process flowsheet diagram of biogas-to-methanol process combined with chemical looping reforming technology.
Processes 13 00313 g001
Figure 2. (a) Heat exchange network diagram of biogas-to-methanol process combined with methane pyrolysis technology. (b) Heat exchange network diagram of biogas-to-methanol process combined with chemical looping reforming technology.
Processes 13 00313 g002

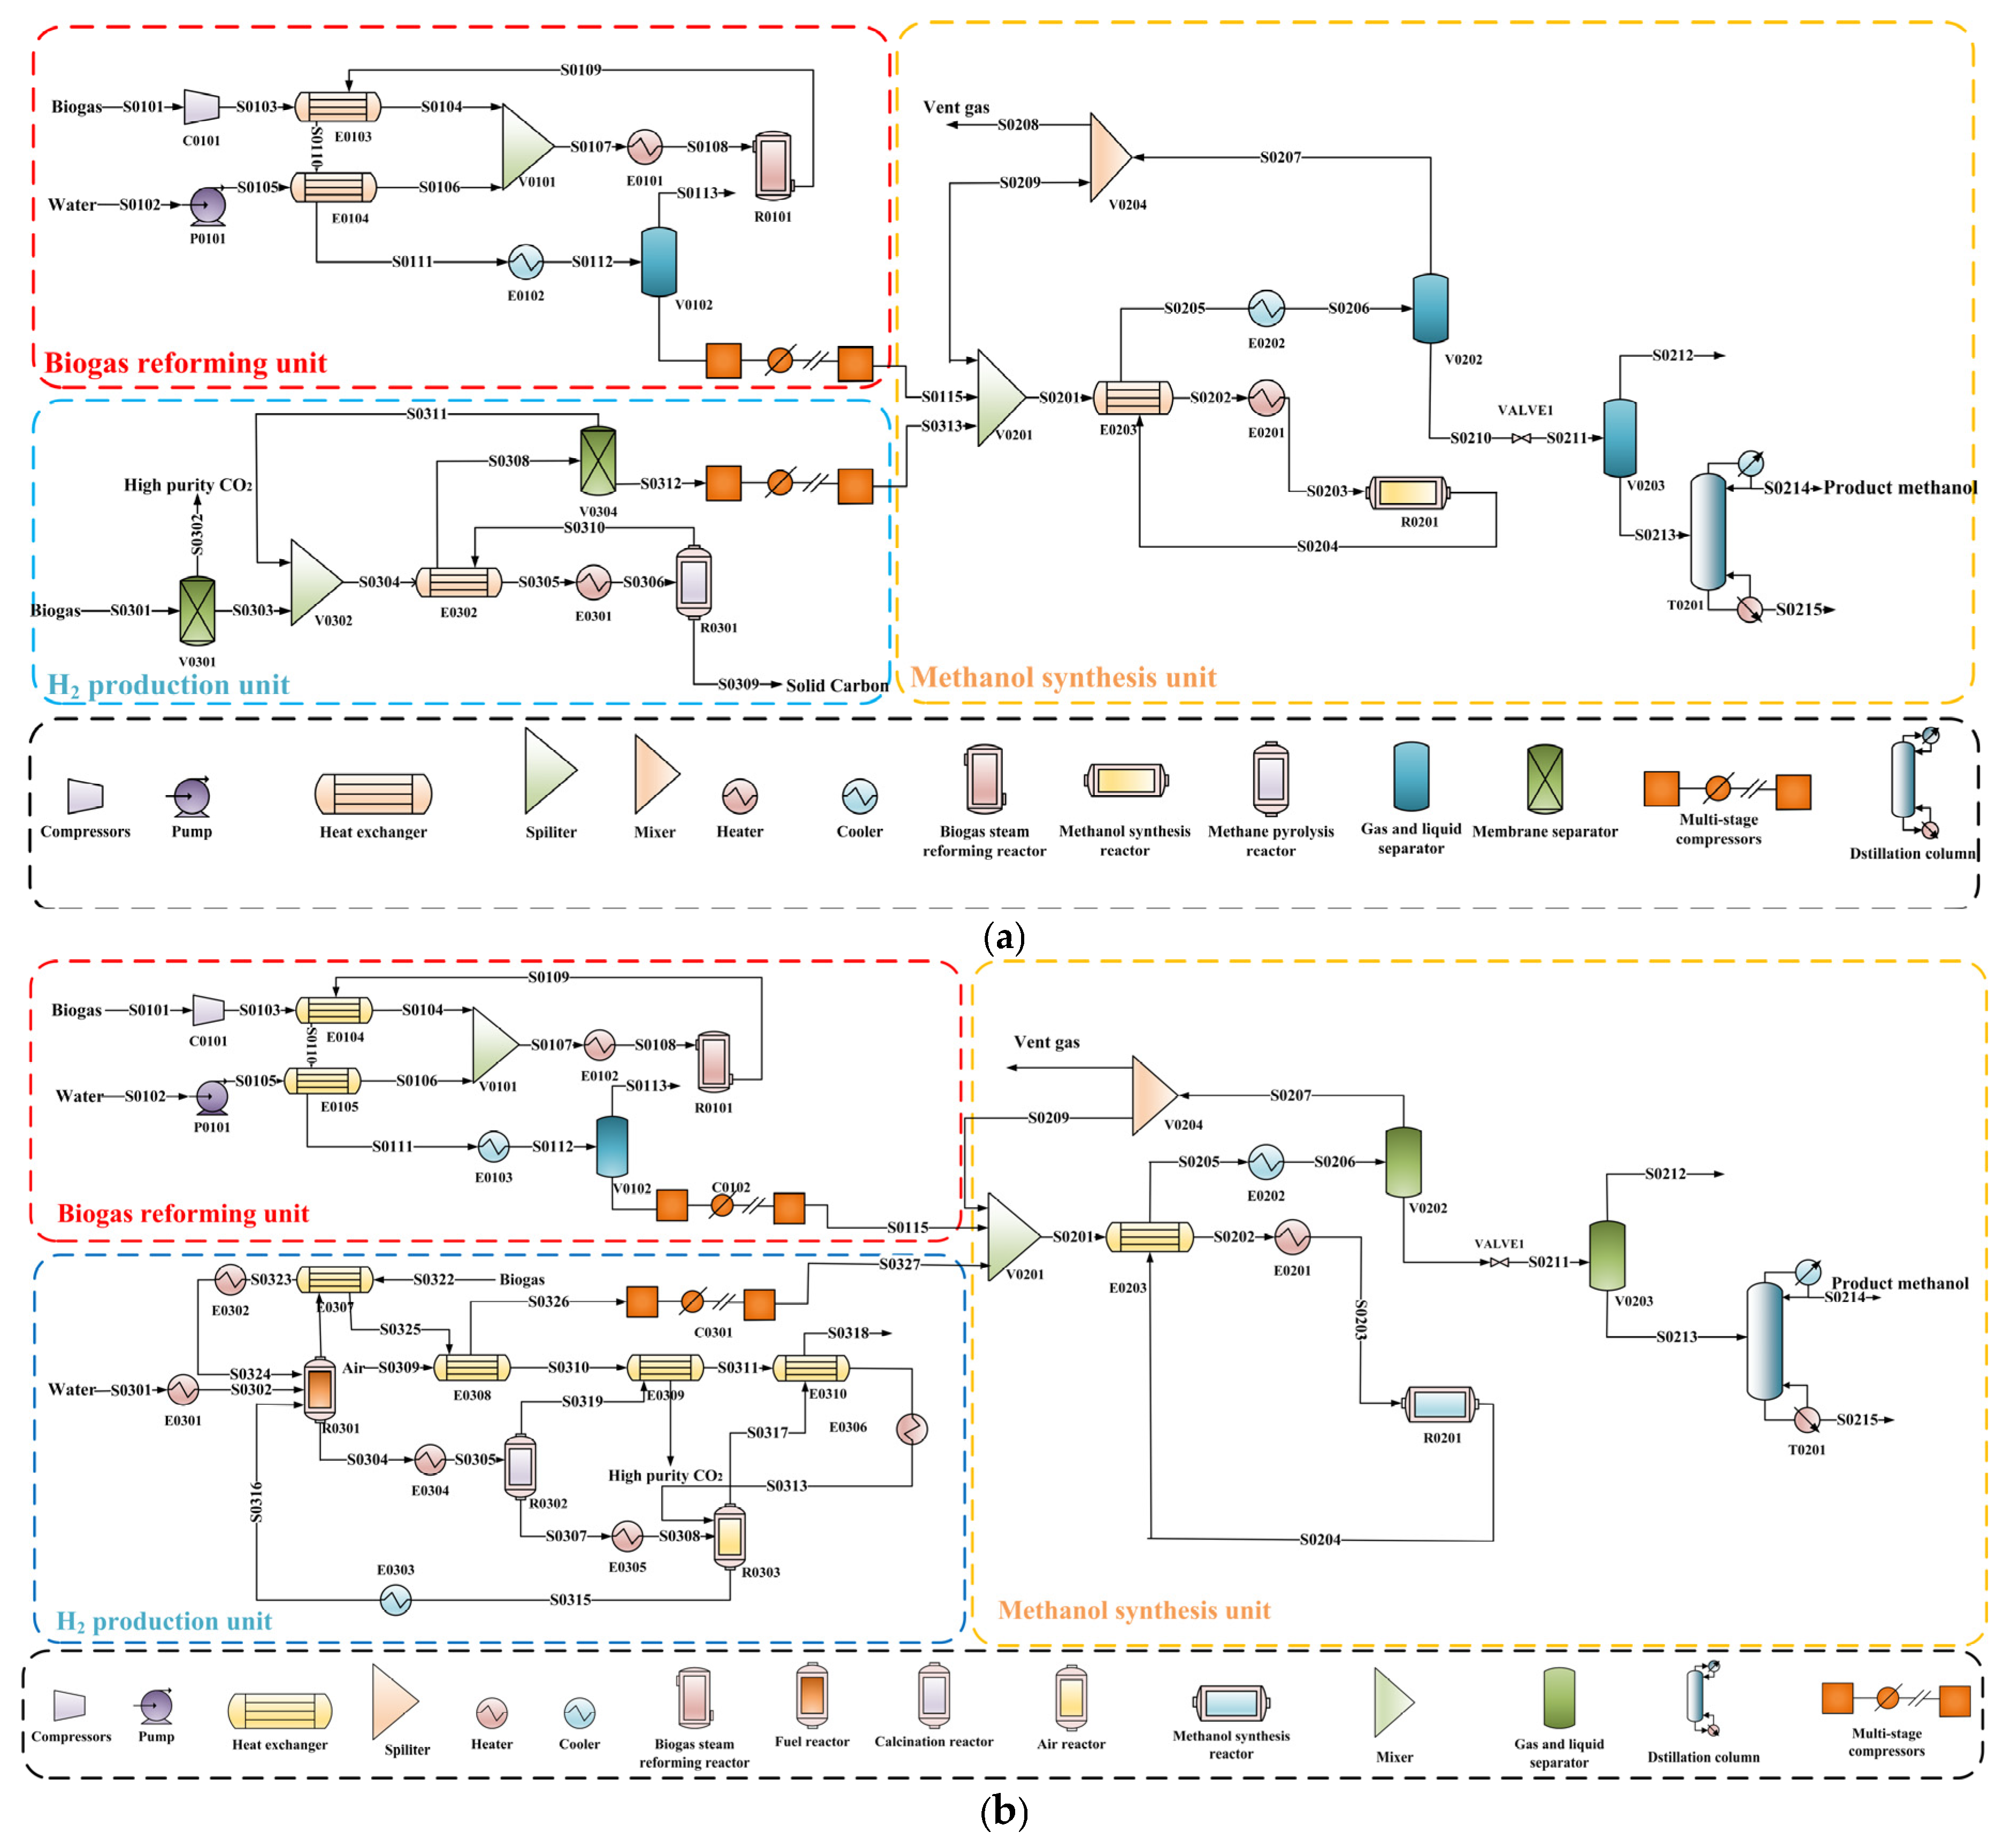
2.1.1. Biogas Reforming Unit

The water is pumped and evaporated; then, the obtained steam is mixed with the biogas. The generated mixture enters the reformer after heating to 850 °C, where the steam methane reforming and dry reforming reactions occur simultaneously. Herein, the RGibbs model is selected to simulate the biogas steam reforming reactor [23]. The gaseous stream from the outlet of the reformer includes unreacted methane, syngas (i.e., CO2, CO, and H2), and byproduct water. It is cooled down and is sent to the flash tank to remove the byproduct water. Afterward, small amounts of methane and the desired syngas are compressed to 7.2 MPa, and they are routed to the methanol synthesis unit.

2.1.2. H2 Production Unit

Considering that the ratio of H2/(2CO + 3CO2) in the aforementioned syngas is lower than 1, a level at which it is difficult to achieve the efficient conversion of the syngas, and additional H2 production unit is added to adjust this ratio.
(1)
Methane pyrolysis unit
The biogas is first sent to the membrane separator to remove CO2. Following this, the obtained methane is heated and fed into the methane pyrolysis reactor, which is operated at 1200 °C and 0.1 MPa. The RPlug model, based on kinetics, is adopted to simulate the methane pyrolysis reactor, and the specific kinetic parameters are referenced to the work of Keipi et al. [24]. The gaseous stream from the reactor is primarily composed of H2, solid carbon, and some unreacted CH4. Afterward, the cyclone separator is used to recover the solid carbon. The remaining H2 and unreacted CH4 are sent to the membrane separator to further recover the H2, and it is routed to the subsequent methanol synthesis unit after compression.
(2)
Chemical looping reforming unit
The chemical looping reforming unit primarily comprises a fuel reactor, a calcination reactor, and an air reactor. Herein, CaO and NiO are selected as the CO2 adsorbent and oxygen carrier, respectively [25]. To be specific, the water and biogas are heated and then enter the fuel reactor where the desired H2 and byproduct CO2 can be obtained with the influence of the NiO and steam. Meanwhile, the NiO is reduced to Ni, and the CaO is used to capture the byproduct CO2, generating CaCO3 (2.27 kg CaCO3/kg CO2). The obtained water-containing H2 is cooled, and the water is separated in the following flash. The generated high-purity H2 is fed into the following methanol synthesis unit after compression. In the calcination reactor, CaCO3 is decomposed into CaO and CO2. The CaO, along with the Ni, enters the subsequent air reactor. Herein, the Ni is oxidated to the NiO with the aid of the air. Finally, the oxygen carrier NiO and adsorbent CaO are recycled into the fuel reactor. The operating temperatures of the fuel reactor, air reactor, and calcination reactor are set at 500, 900, and 1000 °C. The operating pressures of the fuel reactor, air reactor, and calcination reactor are set at 1 atm. The RGibbs model is selected to simulate the three reactors mentioned [26].

2.1.3. Methanol Synthesis Unit

The syngas from the biogas reforming unit and the H2 from the H2 production unit are mixed with the unreacted syngas. Then, they enter the methanol reactor, which is packed with the commercial Cu-based catalyst and operated at 240 °C as well as 7.2 MPa. The RPlug model is used to simulate this reactor, and the detailed kinetic parameters are derived from the work of Bisotti et al. [27]. The crude product at the outlet of the reactor consists of methanol, water, COx (i.e., CO and CO2), and H2. COx and H2 are collected through the two flash tanks. In order to avoid the accumulation of inert components, a some COx and H2 from the first flash tank are exhausted, and the residual portion is recirculated to the previous reactor to increase the methanol yield. Afterward, the crude methanol is sent to the second flash tank to remove a small amount of dissolved CO2. Finally, the fuel-grade methanol is generated by removing the water from the crude methanol in the distillation column.

2.2. Technical Analysis Methods

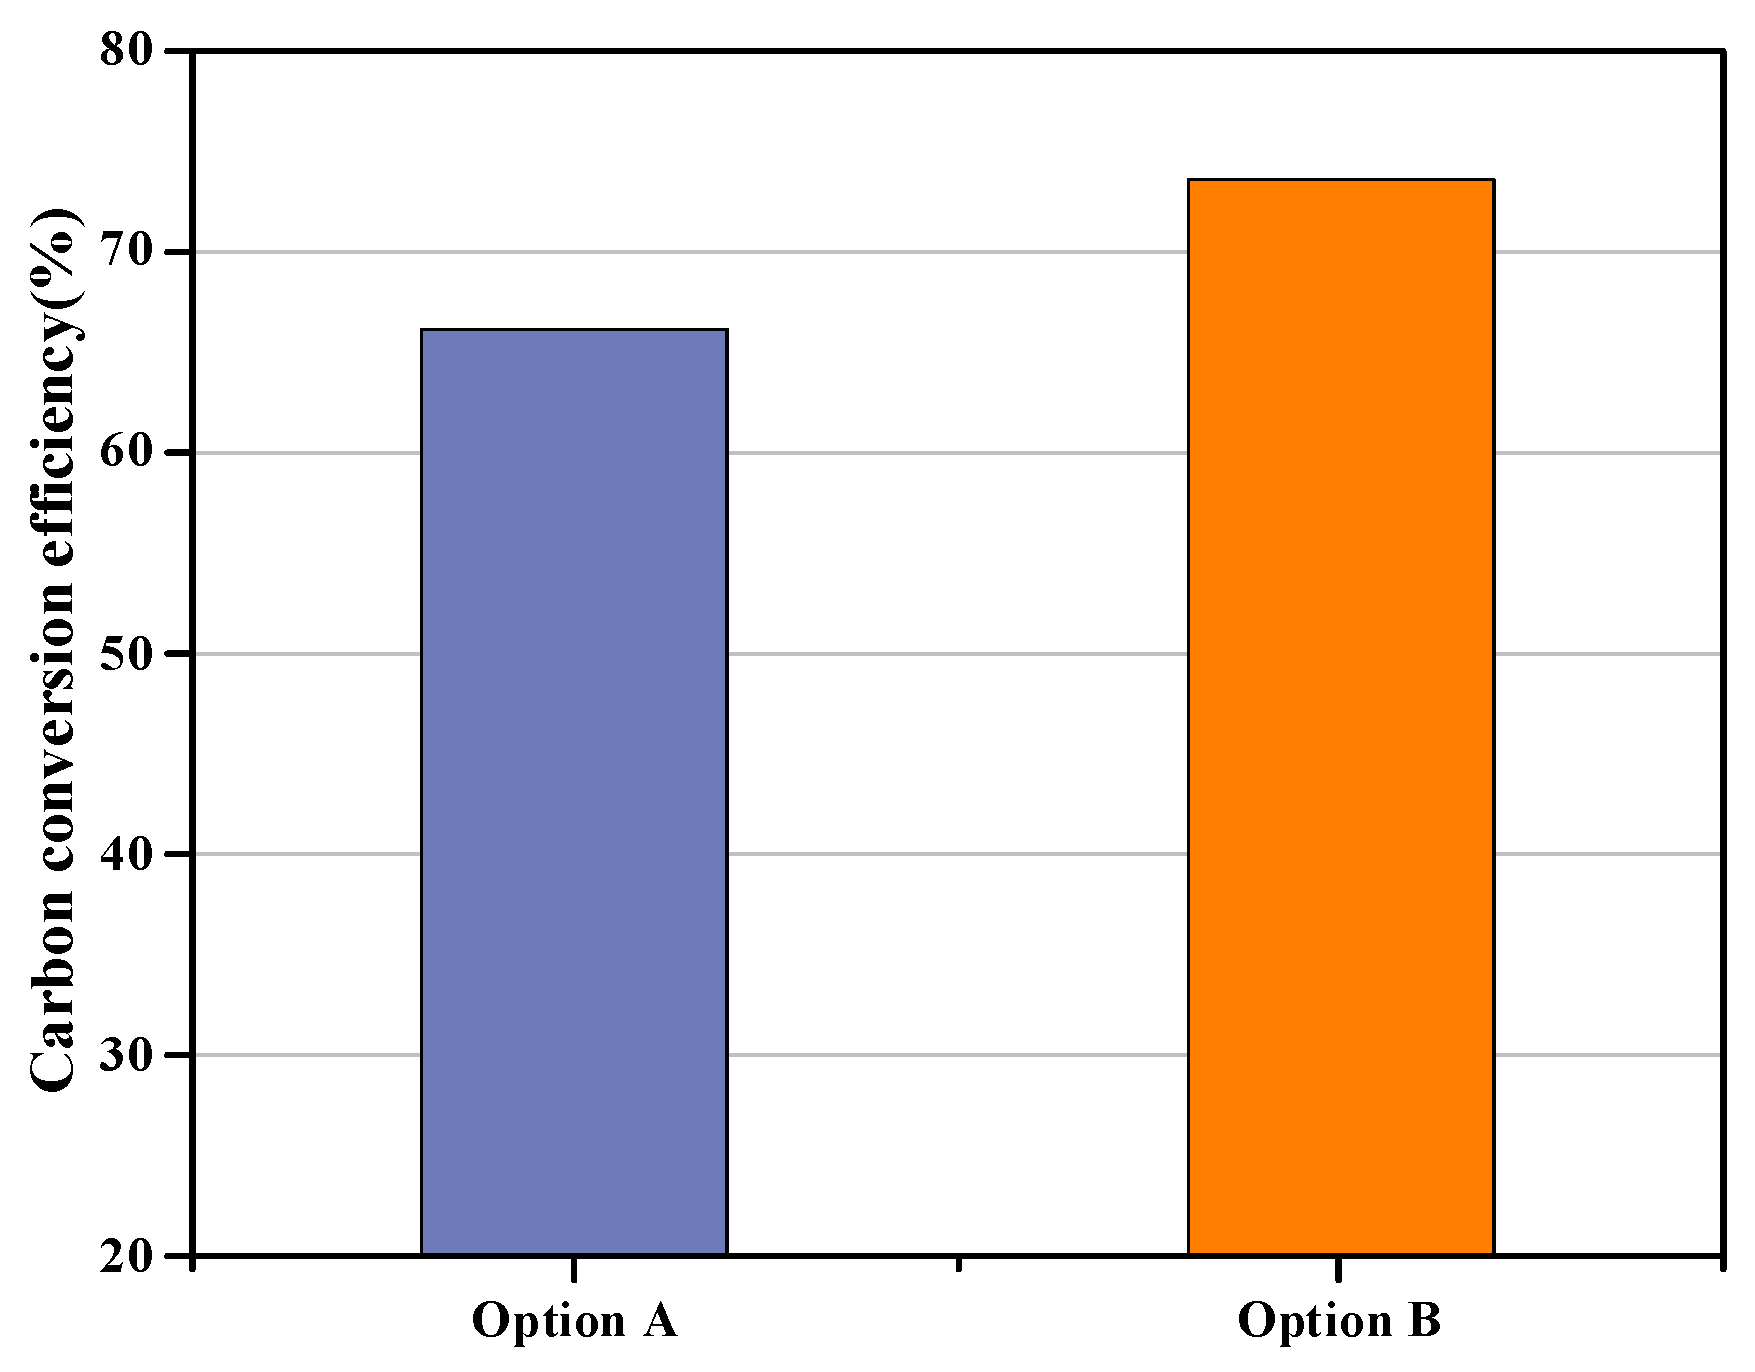
2.2.1. Carbon Conversion Efficiency

Carbon conversion efficiency (CE) donates the momentous parameter to quantify the carbon conversion ability, as shown in Equation (3).
C E = M C , p r o d u c t M C , t o t a l × 100
where MC,product is the mole flowrate of total carbon atoms for the product methanol, and MC,total is the mole flowrate of total carbon atoms for the feedstock biogas.

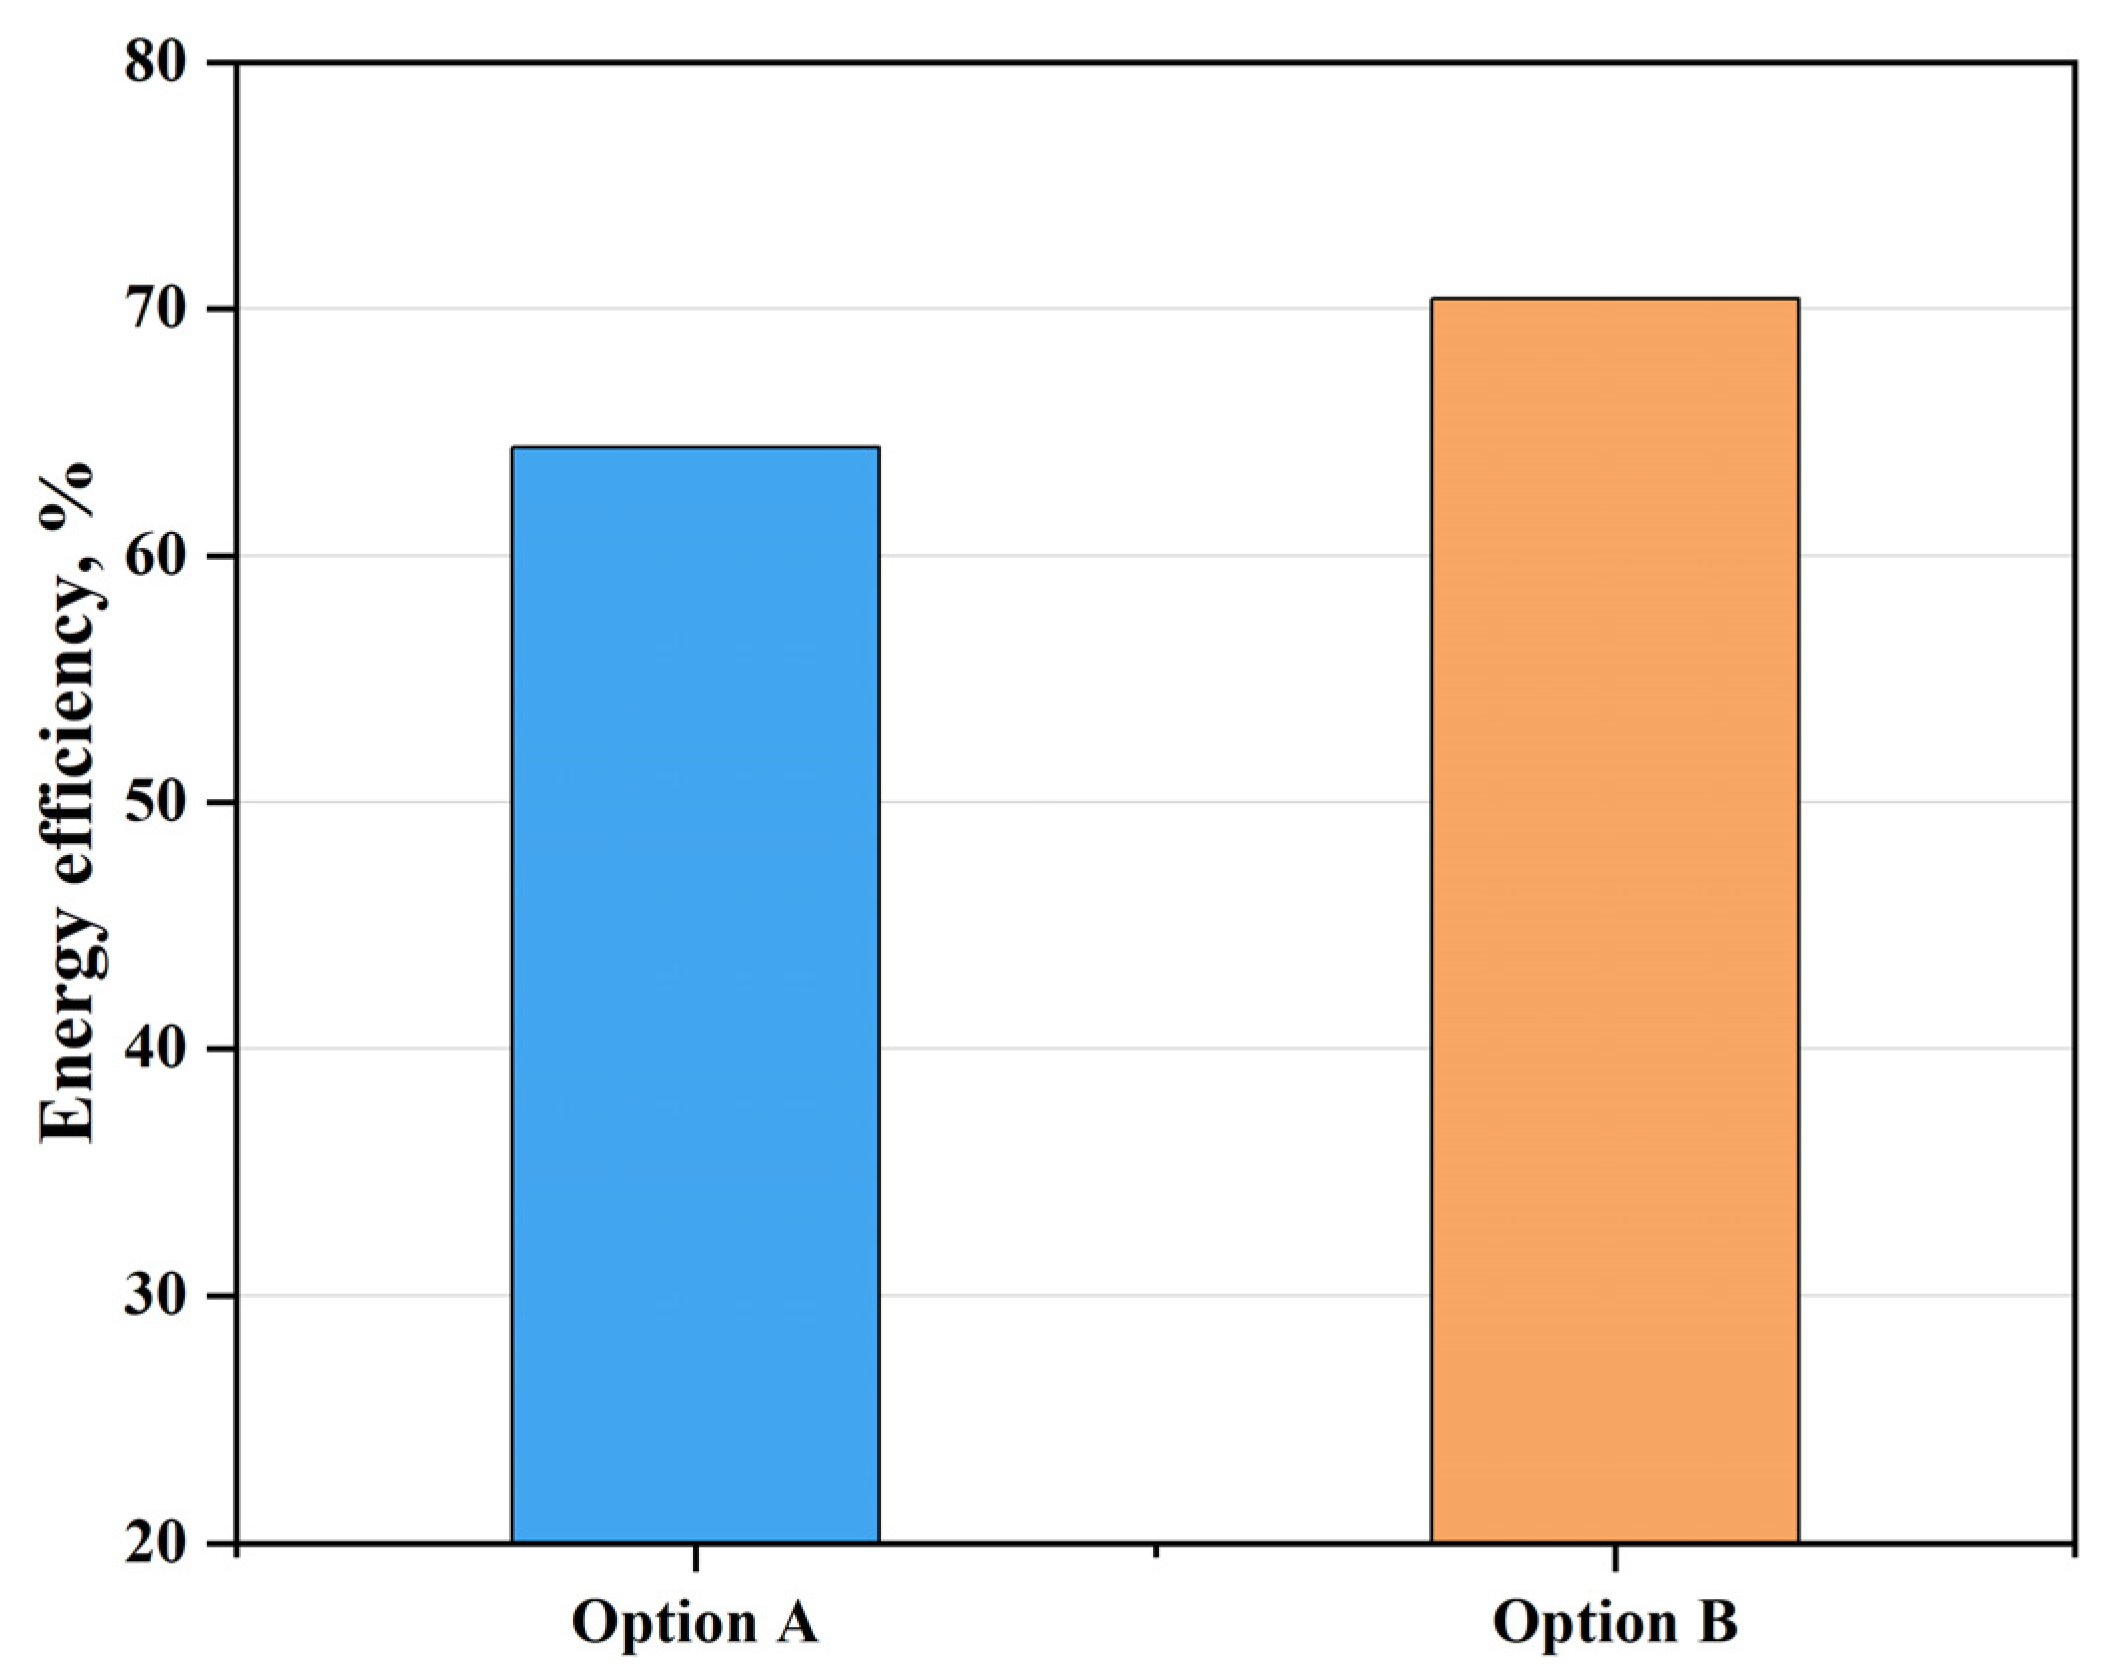
2.2.2. Energy Efficiency

Energy efficiency (EE) refers to the ratio of the output energy to input energy of the overall system. Thia is expressed as follows:
E E = Q m e t h a n o l Q + W × 100
where Q is the sum of the lower heating values (LHV) of feed biogas and the external fuel natural gas required by the key equipment (e.g., preheaters and endothermic reactor), W represents the power consumption of the compressor as well as the pump, and Qmethanol means the LHV of targeted methanol.

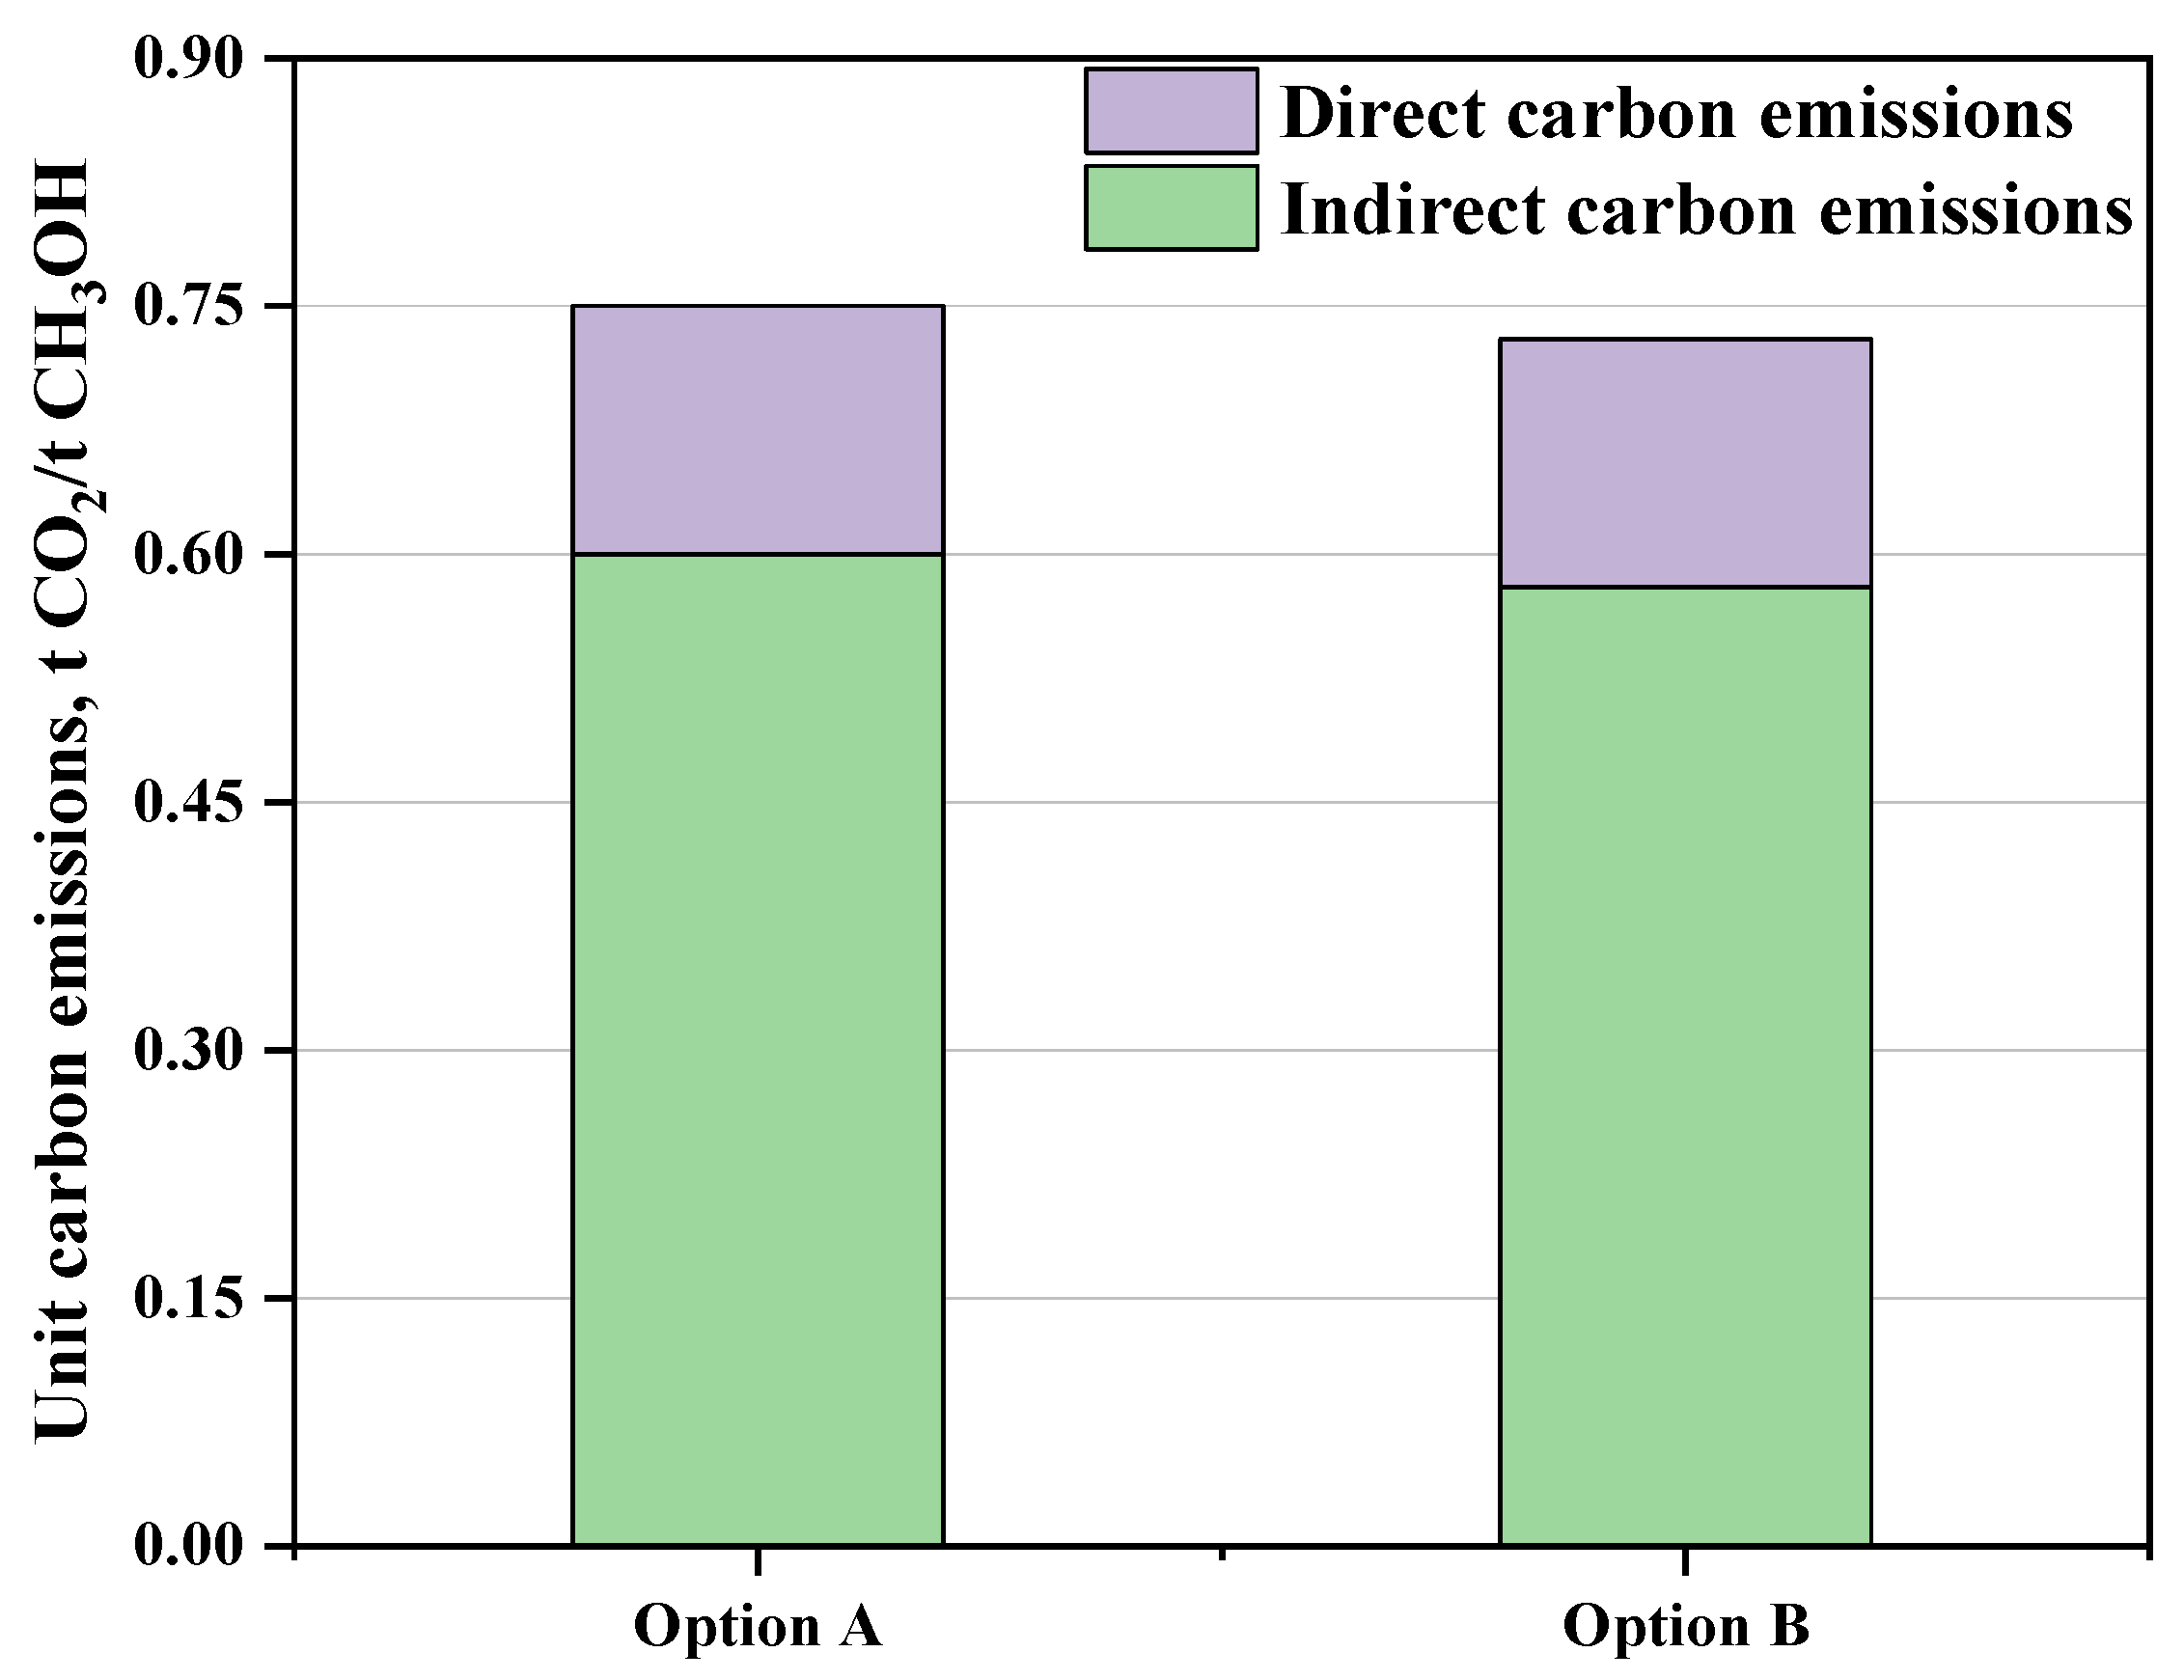
2.2.3. Unit Carbon Emissions

The measurement unit carbon emissions (UCE) refer to the CO2 emissions (CE) based on one-tonne methanol during the whole biogas-to-methanol stage. This measure is composed of direct (CEdirect) and indirect (CEindirect) CO2 emissions, as shown in Equation (5). The direct ones in this system are generated by the combustion of the tail gas, which can be acquired through the simulation results. The indirect ones are generally produced by utility consumption (i.e., external fuel and electricity).
U C E = C E d i r e c t + C E i n d i r e c t M M e t h a n o l

2.3. Economic Evaluation Methods

In this section, four indicators are considered to explore the economic performance of different process options, namely, annual capital investment (ACI), total operating cost (TOC), total production cost (TPC), and net production cost (NPC). Their correlation is shown in Equations (6)–(8). More specifically, the TPC consists of the annual capital investment and total operating cost. The NPC depends on TPC, total production revenue (TPR), and the mass flow of methanol.
T P C = A C I + T O C
T P R = m i × p c i
N P C = T P C T P R M m e t h a n o l
where Mmethanol denotes the mass flow of methanol. mi and pci denote the mass flowrate and price of byproducts such as solid carbon, highly purified CO2, and N2, respectively.

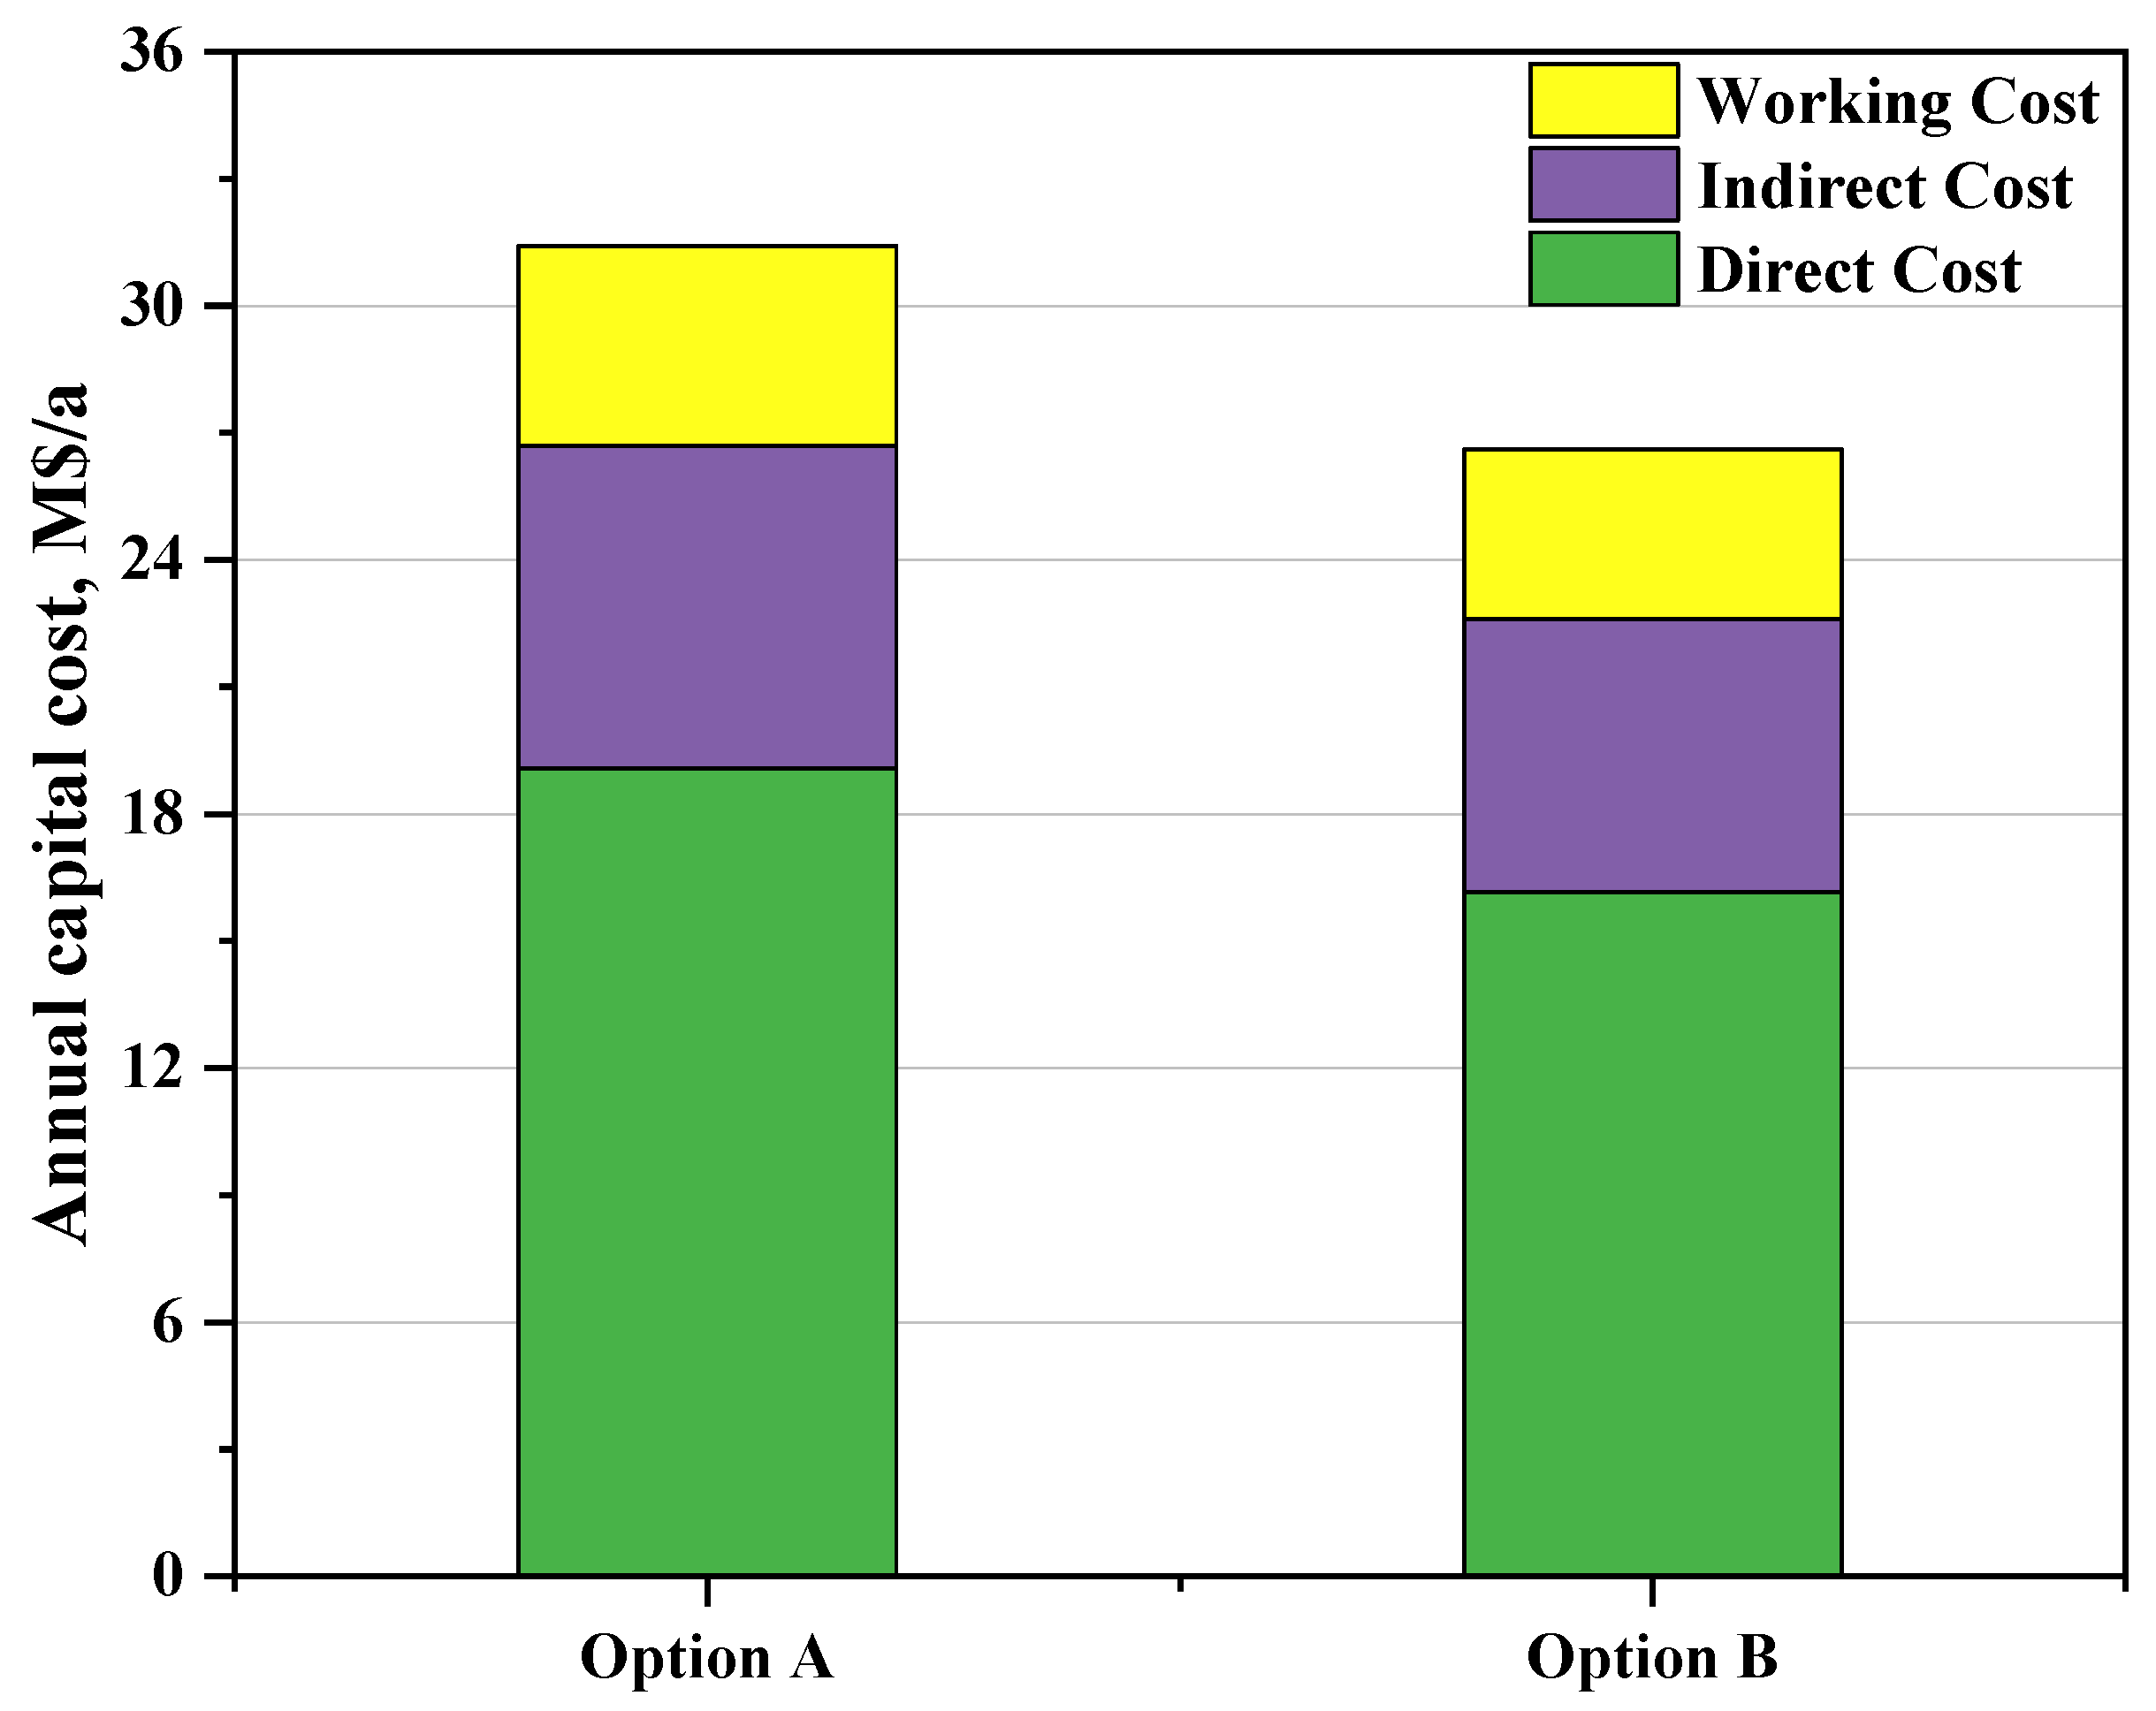
2.3.1. Annual Capital Investment

ACI is composed of the capital recovery factor (CRF) and total capital investment (TCI). Herein, TCI is used to reflect the construction cost, which consists of two parts: fixed capital cost (FCC) and working cost (WC). Its calculation formula is shown in Equations (9)–(13). The mentioned costs are estimated according to the total equipment cost (CE). The primary equipment cost is calculated according to Equations (14) and (15). More specific calculation methods are described in the work of Zhang et al. [28,29].
A C I = T C I × C R F
T C I = F C C + W C
W C = C E × α × R F
F C C = C E × α × 1 + i = 1 n R F i
C R F = i × 1 + i N 1 + i N 1
where the rate factor (RF) is reported in the work of Peters et al. (see Table 1) [30]. The delivery factor α is assumed to be 1.1, and the capital recovery factor (CRF) is used to calculate the recovered investment cost in a given number of years. Herein, the interest rate (i) is considered to be 7%, and the plant life (N) is set as 20 years. The cost of the equipment involved in this work is identified by the six-tenth rule, and it is updated by considering the chemical engineering plant cost index (CEPCI) given in Equation (15).
I 1 = I r e f × Q 1 Q r e f n
I = I 1 × C I 2 C I 1
where n is the characteristic scaling index of the whole device and is taken as 0.6. I denotes the equipment cost, Q denotes the production capacity of the equipment or the size of the equipment, and CI denotes the (CEPCI) [31].

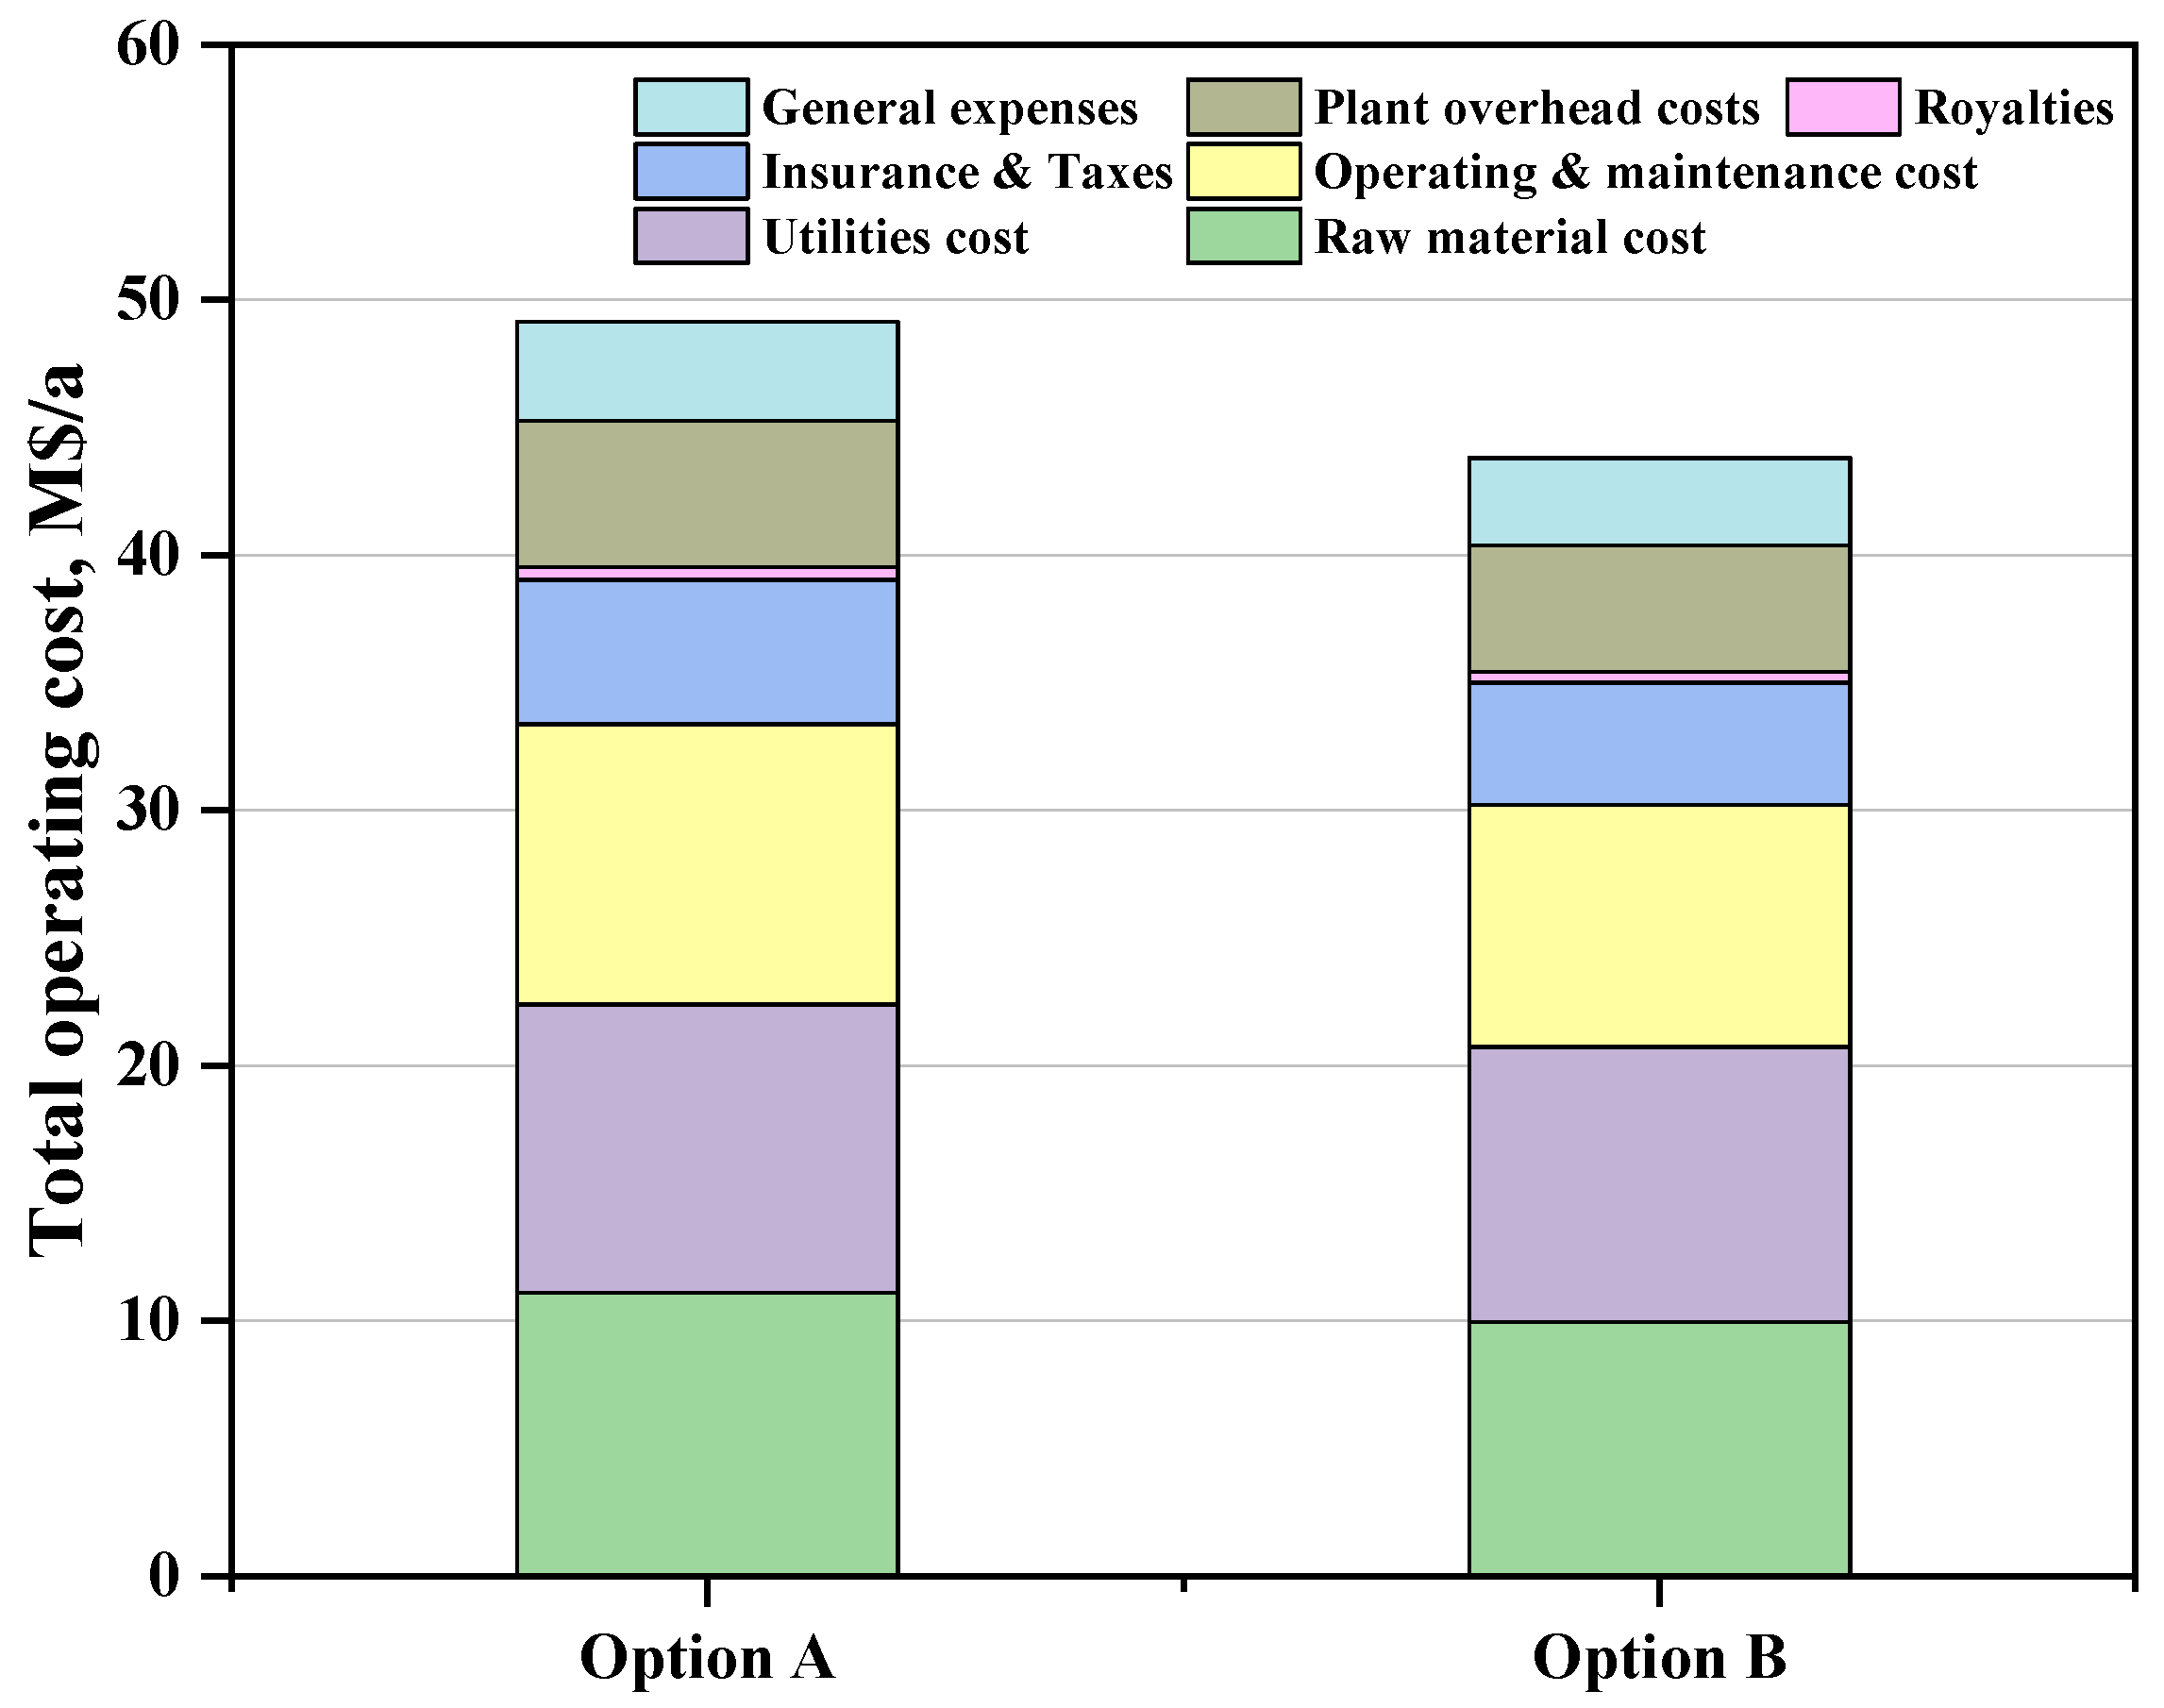
2.3.2. Total Operating Cost

The OC is the cost incurred in the daily production process, as shown in Equation (16). The OC mainly includes the cost of raw materials (CR), utility cost (CU), operation and maintenance cost (CO&M), and other costs (Cother). The calculation method is shown in Table 2; we use the full load of 8400 h for the calculation of OC.
O C = C R + C U + C O & M + C o t h e r

3. Results and Discussion

3.1. Technical Performance Analysis

Carbon conversion efficiency, energy efficiency, and CO2 emissions are selected as the key technical indicators. On this basis, we compare the technical performance of the biogas-to-methanol processes coupled with methane pyrolysis (Option A) and chemical looping reforming (Option B) technologies to investigate the carbon utilization potential, energy conversion capacity, and environmental impact of the overall system.

3.1.1. Carbon Conversion Efficiency

Figure 3 presents the carbon conversion efficiency of the two process options. The carbon conversion efficiency of Option B is 73.97%, while the carbon conversion efficiency of Option A is 66.71%. Therefore, Option B is more competitive regarding carbon utilization potential. As can be seen in Figure 4, the process configuration in the biogas reforming and methanol synthesis units of the two options is the same. Therefore, the variation in carbon conversion efficiency between the two process options is seen in the H2 production unit. In detail, the amount of biogas consumed in this unit in Option A is 181.17 kmol/h, and that in Option B is 111.73 kmol/h. This is mainly because the hydrogen generated via the methane pyrolysis pathway is mainly derived from the methane. However, the hydrogen obtained via the chemical looping reforming pathway originates from methane and an oxidizing agent (i.e., steam). Thus, Option B has lower biogas consumption compared with Option A, resulting in higher carbon conversion efficiency.

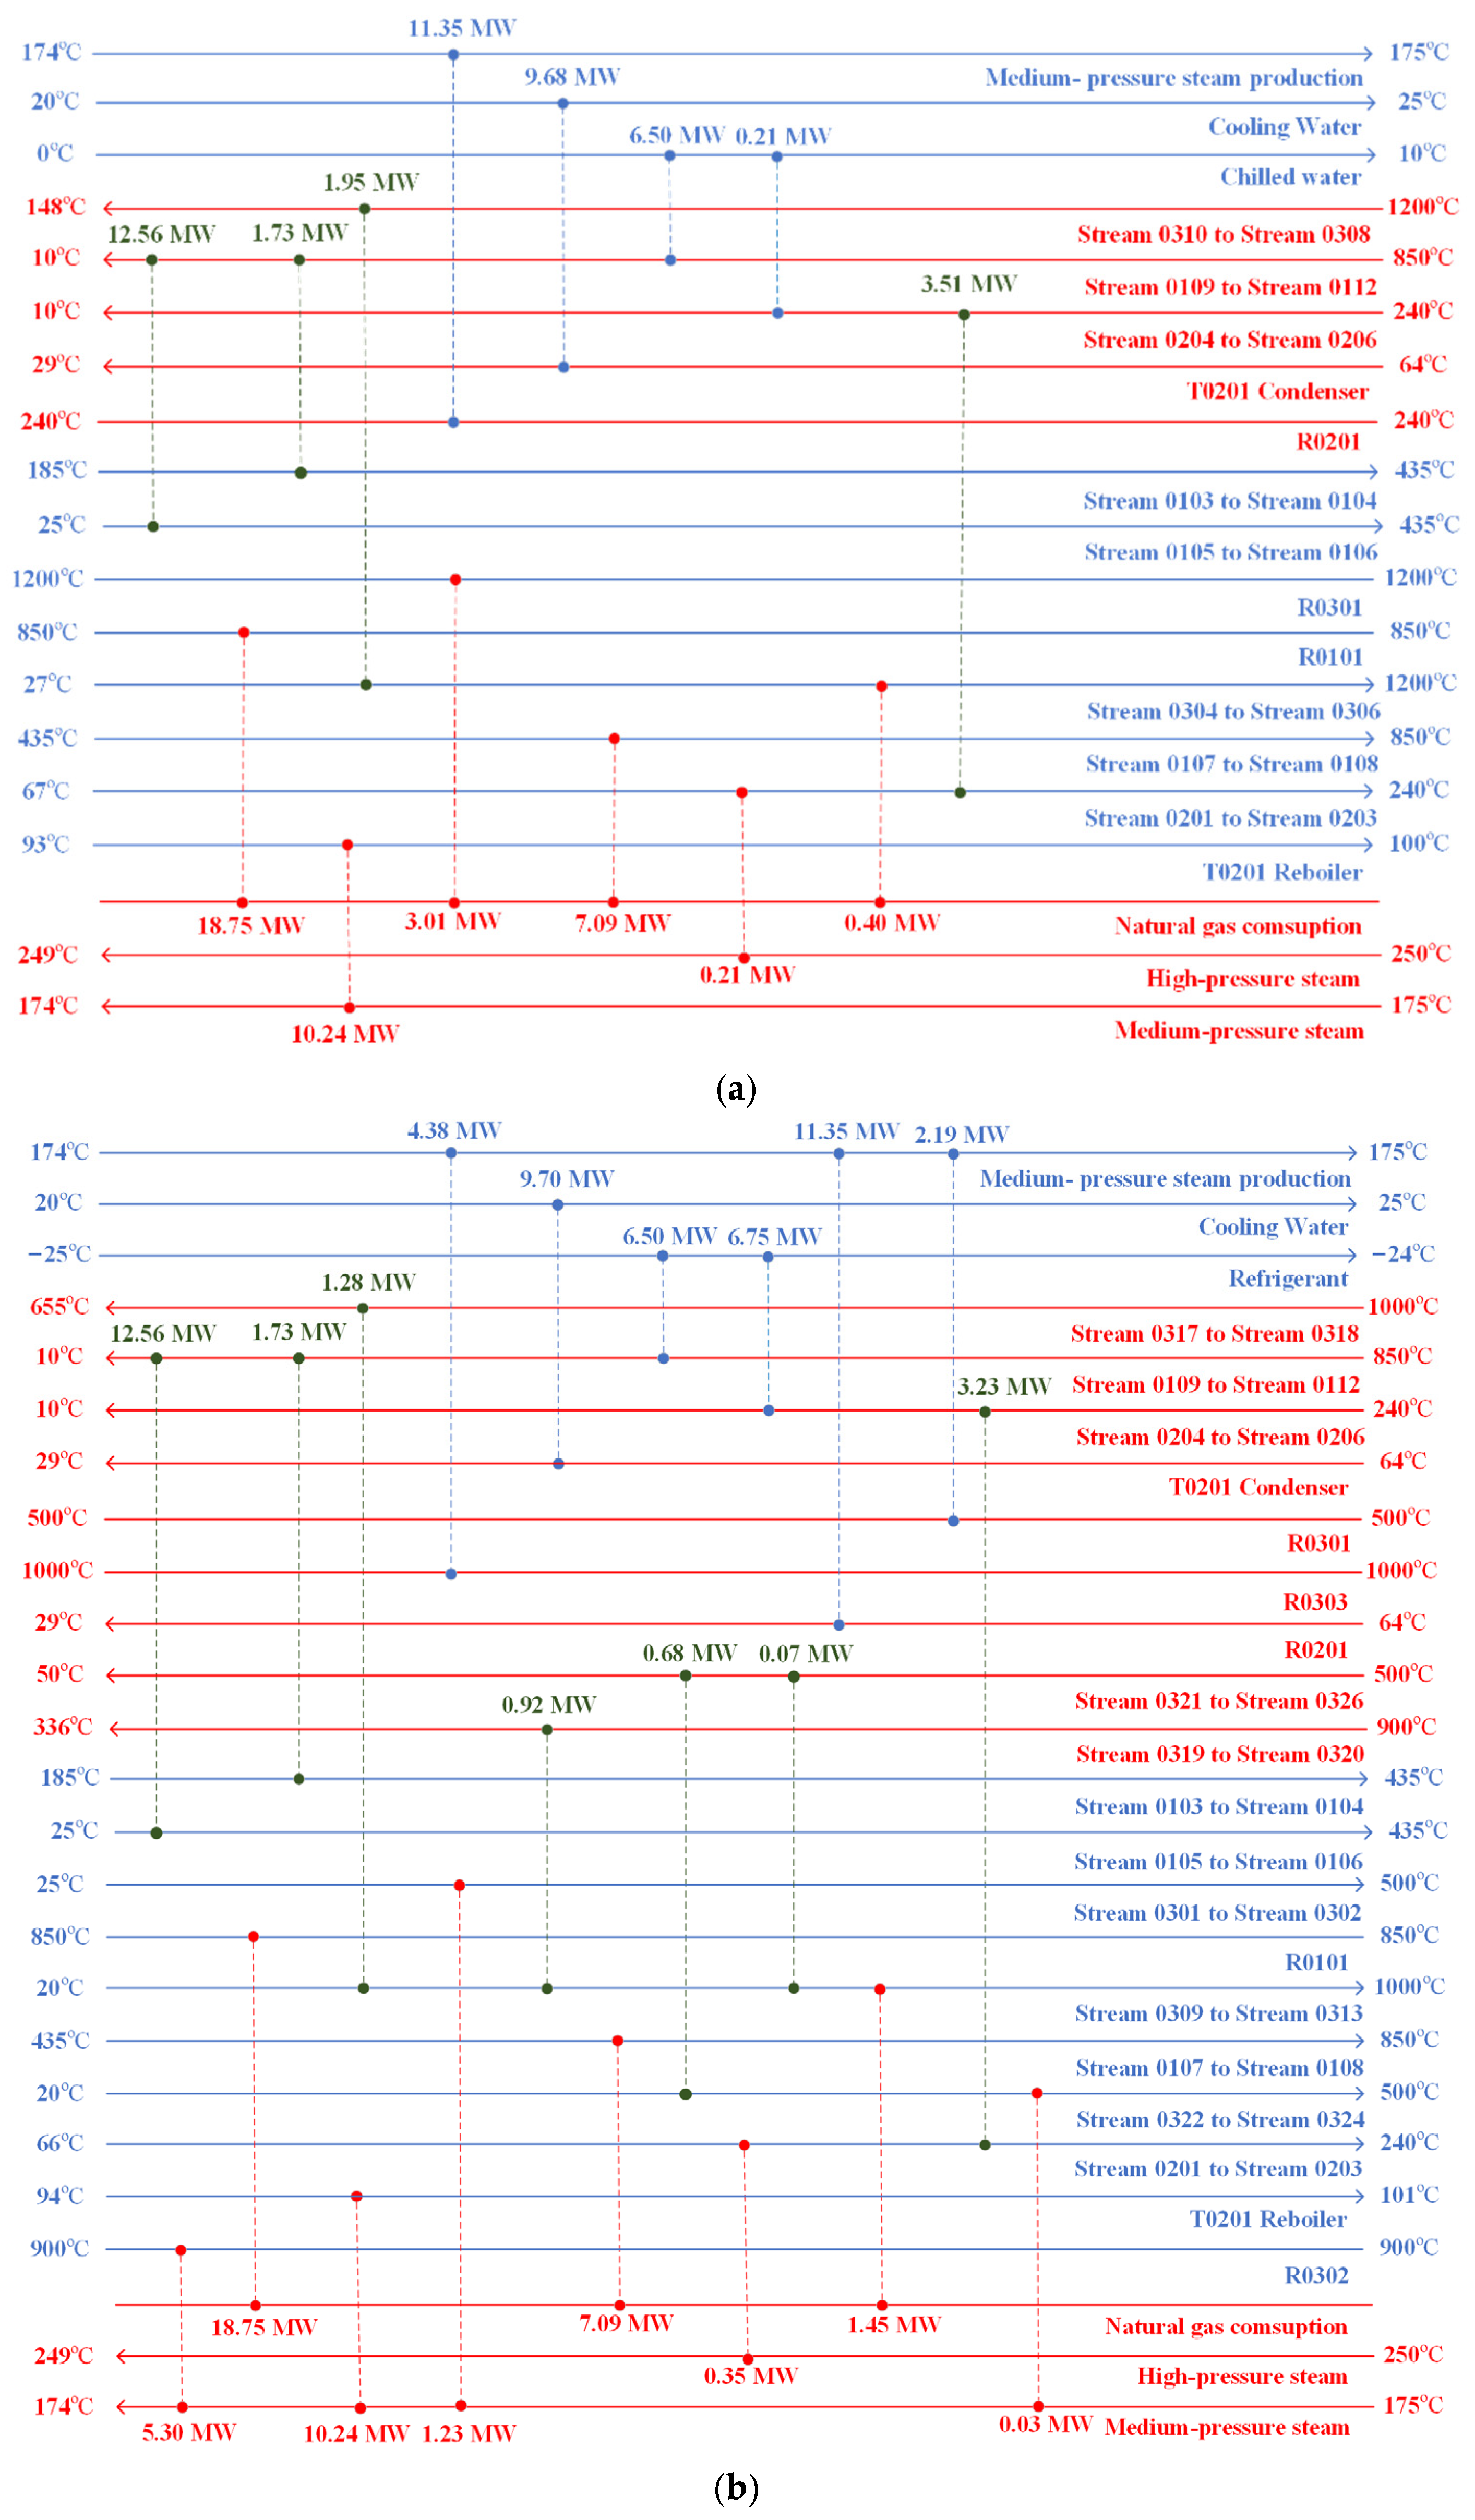
3.1.2. Energy Efficiency

Figure 5 presents the energy efficiency of the two process options. The energy efficiency of Option A is 64.37%, while that of Option B is 70.41%. As mentioned above, their difference in this level is reflected in the heat duty of the energy-consuming equipment and the demand for the consumed biogas in the H2 production unit. More specifically, in Option A, the stream exiting the methane pyrolysis reactor is used to preheat its feed to minimize the external heat consumption of the energy-consuming equipment. However, the highly endothermic methane pyrolysis reactor still requires considerable external heat. According to the simulation results, the energy consumption of the methane pyrolysis reactor is 10.96 GJ/h. In Option B, the streams exiting the three reactors are also used to preheat the feed. Meanwhile, the reaction heat in the air and the fuel reactors is recovered to provide the endothermic calcination reactor and the preheater. In this situation, only the air preheater requires external heat in the H2 production unit, which is set to 5.20 GJ/h. In addition, as described in Section 3.1.1, Option B has a significant advantage over Option A in biogas consumption in the H2 production unit. Therefore, the closely associated LHV is lower than that of Option A by 10.43%.

3.1.3. Unit Carbon Emissions

Figure 6 shows the unit carbon emissions of the two process options. The results indicate that the same direct CO2 emissions are observed in the two options proposed. However, Option B has lower indirect CO2 emissions than Option A by 4.31%, which is mainly ascribed to the lower level of heat consumption, as shown in Table 3. In two options, CO2 emissions from external fuel combustion are reduced by optimizing the initial heat exchanger networks. Nevertheless, the advantage of heat integration in Option B is more significant compared to Option A. As shown in Section 3.1.2, the heat consumption in Option B is reduced to 89.53 GJ/h through the cascade utilization of the waste heat. However, the heat consumption in Option A is still as high as 94.59 GJ/h due to the energy-intensive methane pyrolysis reactor. As a result, the resulting unit carbon emissions in Option B are lower compared to those in Option A in terms of 0.012 t CO2/t methanol. In addition, the electricity consumption in Option A is slightly higher than that in Option B by 0.64 GJ/h. This is mainly because the little unreacted methane, along with the desired H2, is compressed in Option A. The associated unit carbon emissions in Option B are lower than those in Option A in terms of 0.005 t CO2/t methanol.

3.2. Economic Performance Analysis

Annual capital investment, total operating cost, and net production cost are considered as important economic indicators. Moreover, the economic performance of two process options is compared to explore their economic feasibility.

3.2.1. Annual Capital Investment Estimation

Table 4 presents the cost of major equipment for two options. As shown in the calculation result, Option A has more expensive devices than Option B. More specifically, on the one hand, the high-temperature operating temperature (1200 °C) of the methane pyrolysis reactor could result in higher design and manufacturing costs. Therefore, the cost of the methane pyrolysis reactor exceeds that of the three reactors in Option B by 5.47 M$. On the other hand, the significant advantages of the chemical looping reforming technology lie in the in situ separation of H2 and CO2. The feedstock pretreatment device is not necessary. However, for the methane pyrolysis technology, CO2 needs to be separated from the feed biogas to avoid CO2 being reduced to CO in the reactor, which affects the subsequent adjustment of the hydrogen–carbon ratio. Hence, the cost of the relevant purchased equipment in Option B is lowered by 2.98 M$. Based on the equipment cost mentioned, the annual investment cost of the two process options is calculated further, and the result is shown in Figure 7. The annual capital investment of Option B is lower than that of Option A by 4.80 M$/a owing to lower equipment cost. Therefore, Option B is more competitive than Option A in terms of annual investment cost.

3.2.2. Total Operating Cost Estimation

The total operating costs of the two process options are illustrated in Figure 8 and Table 5. As can be seen in this figure, the total operating cost of Option A is determined to be 49.13 M$/a, whereas that of Option B is identified to be 43.80 M$/a. Consequently, Option B has notable advantages compared with Option A in terms of the total operating cost. As described above, the higher carbon conversion efficiency of Option B means less biogas consumption, reducing the cost of raw materials by 1.15 M$/a. Moreover, the stronger heat integration ability in Option B further reduces the external fuel consumption, lowering the utility cost by 0.35 M$/a. In addition, Option B has a lower investment cost than Option A. Therefore, the closely related operation and maintenance costs, as well as other costs, are reduced by 1.49 M$/a.

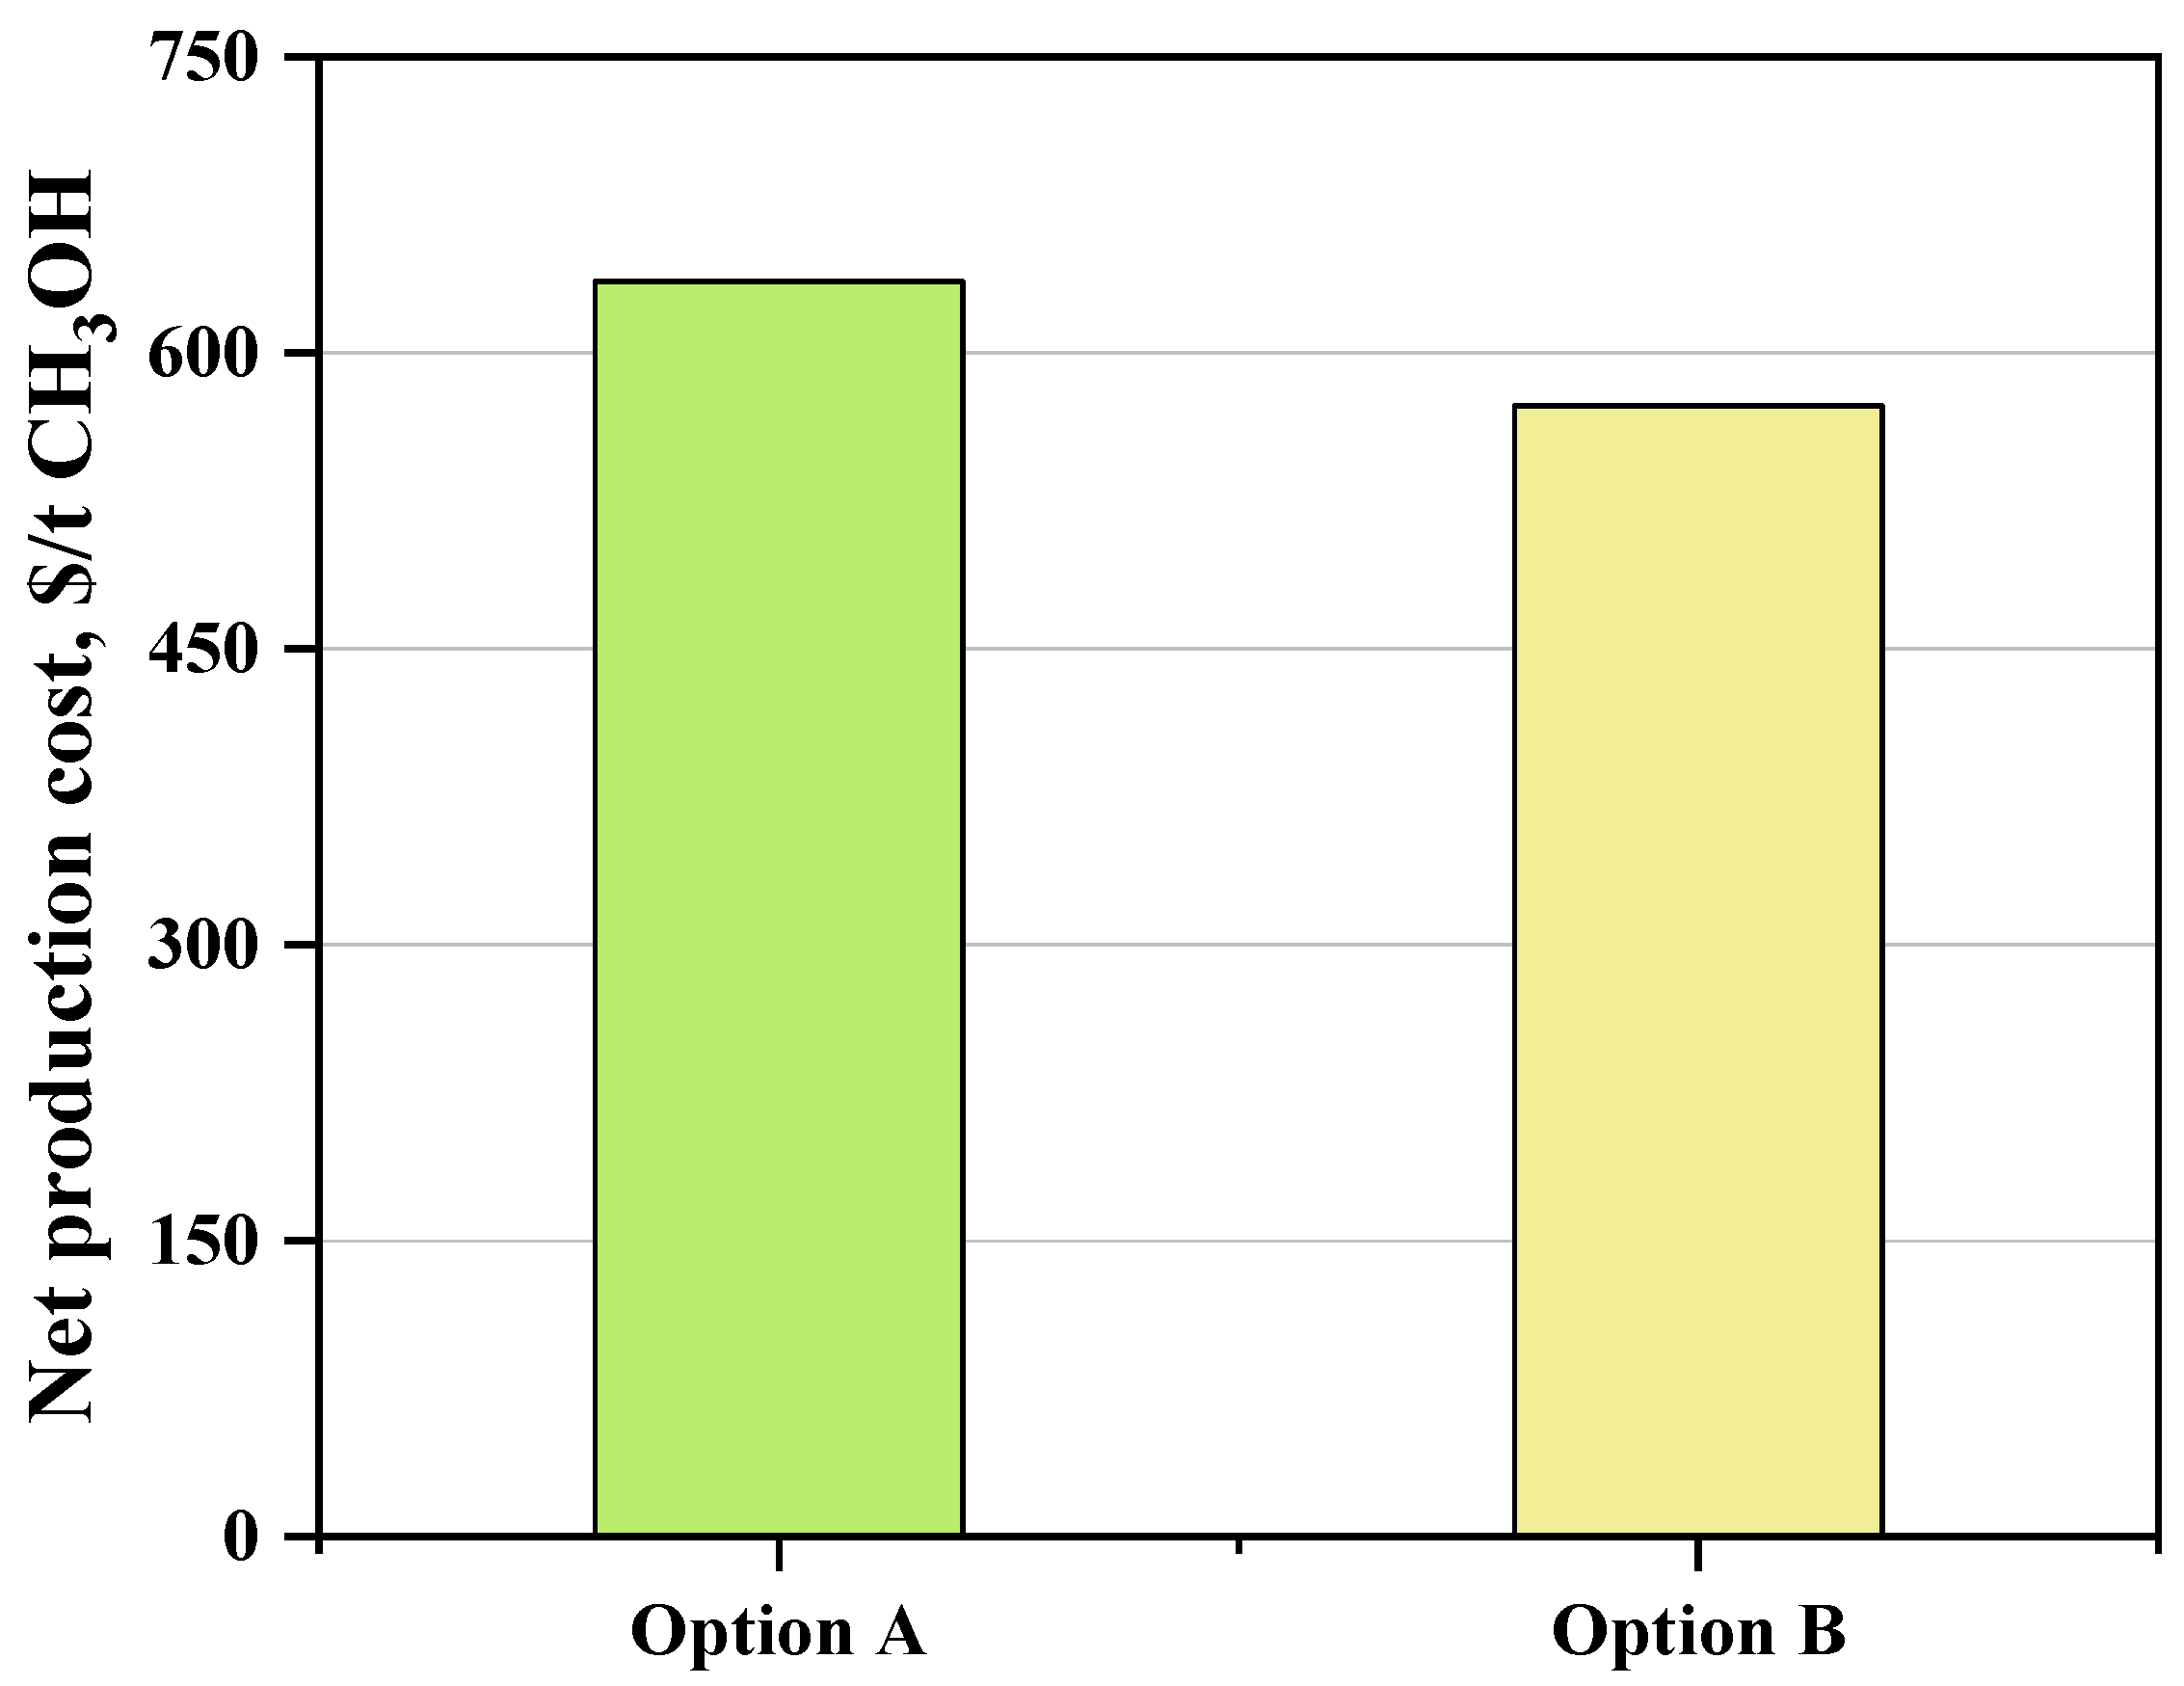
3.2.3. Net Production Cost Estimation

The net production costs of two options are shown in Figure 9. Generally, the net production cost is composed of the mentioned total production cost together with total production revenue. In the following content, the economic performances of two options are compared from three mentioned aspects. In terms of the total production cost, Option B has a 12.24% lower total production cost compared with Option A. This is attributed to the lower annual capital investment and total operating cost. In terms of the total production revenue, the product benefit of Option A is mainly obtained by selling the solid carbon generated in the methane pyrolysis reactor and the CO2 separated from the biogas. The product benefit of Option B is primarily derived by selling CO2 generated in the fuel reactor. However, compared with the highly purified CO2, the carbon black has higher economic values. Therefore, the total production revenue of Option A exceeds that of Option B by 16.26 USD/t CH3OH (see Table 6). Considering the total production cost and the product revenue together, the net production cost of Option B is lower than that of Option A by 64.82 USD/t CH3OH. Although the total production revenue of Option B is superior to that of Option A, the resulting small margin (16.26 USD/t CH3OH) hardly makes up for the gap between total production costs (81.08 USD/t CH3OH). Overall, Option B has stronger economic competitiveness in comparison to Option A when assessed in terms of economic feasibility.

4. Conclusions

In order to achieve the efficient utilization of biogas and the carbon mitigation of the overall system, two biogas-to-methanol processes are proposed. The methane pyrolysis and chemical looping reforming technologies are integrated into these to adjust the syngas ratio. Moreover, we compare their technical (e.g., carbon conversion efficiency, energy efficiency, and CO2 emissions) and economic (e.g., net production cost) performances to determine the more competitive process option. As a result, the process coupled with chemical looping reforming technology has more significant strength from technical and economic perspectives. In more detail, in technical terms, the introduction of the chemical looping reforming technology reduces the demand for biogas in the H2 production unit. In this situation, this process has higher carbon conversion efficiency (73.52%). Moreover, the process integrated with chemical looping reforming technology has a stronger heat integration ability, leading to higher energy efficiency (70.41%) and lower unit carbon emissions (0.73 t CO2/t CH3OH). In economic terms, the relatively cheaper equipment and fewer demands for the raw materials and external fuels result in lower net production costs (571.33 USD/t CH3OH) in the process coupled with chemical looping reforming technology. Overall, the two biogas-to-methanol processes proposed both provide feasible and sustainable technical pathways for promoting the conversion of waste carbon into valuable methanol. In particular, the adoption of the chemical looping reforming technology further improves carbon conversion ability, energy-saving potential, and carbon mitigation potential; meanwhile, it enhances economic competitiveness. In future work, a more detailed environmental analysis assessment must be considered in order to determine the environmental impact of the biogas-to-methanol processes when integrated with different H2 production technologies.

Author Contributions

Methodology, Y.Y., J.F. and L.Z.; Software, Y.Y.; Writing—original draft, Y.Y.; Writing—review and editing, J.F., L.Z. and R.G.; Visualization, Y.Y. and L.Z.; Supervision, R.G. and C.Z.; Funding acquisition, C.Z. All authors have read and agreed to the published version of the manuscript.

Funding

This work is supported by the “Carbon Upcycling Project for Platform Chemicals” (Project Nos. 2022M3J3A1045999, 2022M3J3A1039377) through the National Research Foundation (NRF) funded by the Ministry of Science and ICT, Republic of Korea. We are also grateful to the Natural Science Foundation of Jiangsu Province (BZ2023051, BK20200694, and BK20240546), the open program supported by the Foundation of State Key Laboratory of Coal Combustion (FSKLCCA2505), Science and Technology Project of Changzhou (CJ20241053), the Postgraduate Research & Practice Innovation Program of Jiangsu Province (SJCX24_0539), and the Jiangsu Specially-Appointed Professors Program.

Data Availability Statement

All relevant data are within the manuscript.

Conflicts of Interest

The authors declare no conflict of interest.

References

  1. Işık, C.; Kuziboev, B.; Ongan, S.; Saidmamatov, O.; Mirkhoshimova, M.; Rajabov, A. The volatility of global energy uncertainty: Renewable alternatives. Energy 2024, 297, 131250. [Google Scholar] [CrossRef]
  2. Arutyunov, V.; Nikitin, A.; Strekova, L.; Savchenko, V.; Sedov, I. Utilization of renewable sources of biogas for small-scale production of liquid fuels. Catal. Today 2021, 379, 23–27. [Google Scholar] [CrossRef]
  3. Hosseini, S.E.; Wahid, M.A. Development of biogas combustion in combined heat and power generation. Renew. Sustain. Energy Rev. 2014, 40, 868–875. [Google Scholar] [CrossRef]
  4. Chen, C.; Yang, A. Power-to-methanol: The role of process flexibility in the integration of variable renewable energy into chemical production. Energy Convers. Manag. 2021, 228, 113673. [Google Scholar] [CrossRef]
  5. Verhelst, S.; Turner, J.W.G.; Sileghem, L.; Vancoillie, J. Methanol as a fuel for internal combustion engines. Prog. Energy Combust. Sci. 2019, 70, 43–88. [Google Scholar] [CrossRef]
  6. Santos, R.O.d.; Santos, L.d.S.; Prata, D.M. Simulation and optimization of a methanol synthesis process from different biogas sources. J. Clean. Prod. 2018, 186, 821–830. [Google Scholar] [CrossRef]
  7. Holladay, J.D.; Hu, J.; King, D.L.; Wang, Y. An overview of hydrogen production technologies. Catal. Today 2009, 139, 244–260. [Google Scholar] [CrossRef]
  8. Hassan, N.S.; Jalil, A.A.; Rajendran, S.; Khusnun, N.F.; Bahari, M.B.; Johari, A.; Kamaruddin, M.J.; Ismail, M. Recent review and evaluation of green hydrogen production via water electrolysis for a sustainable and clean energy society. Int. J. Hydrogen Energy 2024, 52, 420–441. [Google Scholar] [CrossRef]
  9. Riley, J.; Atallah, C.; Siriwardane, R.; Stevens, R. Technoeconomic analysis for hydrogen and carbon Co-Production via catalytic pyrolysis of methane. Int. J. Hydrogen Energy 2021, 46, 20338–20358. [Google Scholar] [CrossRef]
  10. Murugan, A.; Thursfield, A.; Metcalfe, I.S. A chemical looping process for hydrogen production using iron-containing perovskites. Energy Environ. Sci. 2011, 4, 4639–4649. [Google Scholar] [CrossRef]
  11. Zhang, L.; Gao, R.; Tang, Z.; Zhang, C.; Jun, K.-W.; Ki Kim, S.; Zhao, T.; Wan, H.; Guan, G. Boosting carbon utilization efficiency for sustainable methanol production from biomass: Techno-economic and environmental analysis. Energy Convers. Manag. 2024, 311, 118504. [Google Scholar] [CrossRef]
  12. Brouwer, A.S.; van den Broek, M.; Seebregts, A.; Faaij, A. Impacts of large-scale Intermittent Renewable Energy Sources on electricity systems, and how these can be modeled. Renew. Sustain. Energy Rev. 2014, 33, 443–466. [Google Scholar] [CrossRef]
  13. Lim, D.; Lee, B.; Lee, H.; Byun, M.; Lim, H. Projected cost analysis of hybrid methanol production from tri-reforming of methane integrated with various water electrolysis systems: Technical and economic assessment. Renew. Sustain. Energy Rev. 2022, 155, 111876. [Google Scholar] [CrossRef]
  14. Moioli, E.; Schildhauer, T. Eco-Techno-Economic Analysis of Methanol Production from Biogas and Power-to-X. Ind. Eng. Chem. Res. 2022, 61, 7335–7348. [Google Scholar] [CrossRef]
  15. Prabowo, J.; Lai, L.; Chivers, B.; Burke, D.; Dinh, A.H.; Ye, L.; Wang, Y.; Wang, Y.; Wei, L.; Chen, Y. Solid carbon co-products from hydrogen production by methane pyrolysis: Current understandings and recent progress. Carbon 2024, 216, 118507. [Google Scholar] [CrossRef]
  16. Sun, Z.; Wang, S.; Aziz, M. Highly integrated system for ammonia and electricity production from biomass employing direct chemical looping: Exergy and exergoeconomic analyses. Energy Convers. Manag. 2022, 251, 115013. [Google Scholar] [CrossRef]
  17. Chisalita, D.-A.; Cormos, C.-C. Techno-economic assessment of hydrogen production processes based on various natural gas chemical looping systems with carbon capture. Energy 2019, 181, 331–344. [Google Scholar] [CrossRef]
  18. Ostadi, M.; Bromberg, L.; Cohn, D.R.; Gençer, E. Flexible methanol production process using biomass/municipal solid waste and hydrogen produced by electrolysis and natural gas pyrolysis. Fuel 2023, 334, 126697. [Google Scholar] [CrossRef]
  19. Okeke, I.; Mani, S. Techno-economic assessment of biogas to liquid fuels conversion technology via Fischer-Tropsch synthesis: Cost of producing liquid biofuels from biogas. Biofuels Bioprod. Biorefining 2017, 11, 472–487. [Google Scholar] [CrossRef]
  20. Xiang, D.; Li, P.; Yuan, X.; Cui, P.; Huang, W. Highly efficient carbon utilization of coal-to-methanol process integrated with chemical looping hydrogen and air separation technology: Process modeling and parameter optimization. J. Clean. Prod. 2020, 258, 120910. [Google Scholar] [CrossRef]
  21. Zhang, D.; Duan, R.; Li, H.; Yang, Q.; Zhou, H. Optimal design, thermodynamic, cost and CO2 emission analyses of coal-to-methanol process integrated with chemical looping air separation and hydrogen technology. Energy 2020, 203, 117876. [Google Scholar] [CrossRef]
  22. Vita, A.; Italiano, C.; Previtali, D.; Fabiano, C.; Palella, A.; Freni, F.; Bozzano, G.; Pino, L.; Manenti, F. Methanol synthesis from biogas: A thermodynamic analysis. Renew. Energy 2018, 118, 673–684. [Google Scholar] [CrossRef]
  23. Gao, R.; Zhang, C.; Lee, Y.-J.; Kwak, G.; Jun, K.-W.; Kim, S.K.; Park, H.-G.; Guan, G. Sustainable production of methanol using landfill gas via carbon dioxide reforming and hydrogenation: Process development and techno-economic analysis. J. Clean. Prod. 2020, 272, 122552. [Google Scholar] [CrossRef]
  24. Keipi, T.; Li, T.; Løvås, T.; Tolvanen, H.; Konttinen, J. Methane thermal decomposition in regenerative heat exchanger reactor: Experimental and modeling study. Energy 2017, 135, 823–832. [Google Scholar] [CrossRef]
  25. Meng, W.X.; Banerjee, S.; Zhang, X.; Agarwal, R.K. Process simulation of multi-stage chemical-looping combustion using Aspen Plus. Energy 2015, 90, 1869–1877. [Google Scholar] [CrossRef]
  26. Kasemanand, S.; Im-orb, K.; Tippawan, P.; Wiyaratn, W.; Arpornwichanop, A. Exergy analysis of the biogas sorption-enhanced chemical looping reforming process integrated with a high-temperature proton exchange membrane fuel cell. Energy Convers. Manag. 2017, 149, 485–494. [Google Scholar] [CrossRef]
  27. Bisotti, F.; Fedeli, M.; Prifti, K.; Galeazzi, A.; Dell’Angelo, A.; Manenti, F. Impact of Kinetic Models on Methanol Synthesis Reactor Predictions: In Silico Assessment and Comparison with Industrial Data. Ind. Eng. Chem. Res. 2022, 61, 2206–2226. [Google Scholar] [CrossRef]
  28. Rinaldi, R.; Lombardelli, G.; Gatti, M.; Visconti, C.G.; Romano, M.C. Techno-economic analysis of a biogas-to-methanol process: Study of different process configurations and conditions. J. Clean. Prod. 2023, 393, 136259. [Google Scholar] [CrossRef]
  29. Baena-Moreno, F.M.; Pastor-Pérez, L.; Wang, Q.; Reina, T.R. Bio-methane and bio-methanol co-production from biogas: A profitability analysis to explore new sustainable chemical processes. J. Clean. Prod. 2020, 265, 121909. [Google Scholar] [CrossRef]
  30. Peters, J.I. Review of: “ Plant Design and Economics for Chemical Engineers ” Max S. Peters: McGraw-Hill Book Company, New York, 1958. 511 pp. $11.00. Eng. Econ. 2007, 5, 27–30. [Google Scholar] [CrossRef]
  31. Gao, R.; Zhang, L.; Wang, L.; Zhang, C.; Jun, K.-W.; Kim, S.K.; Park, H.-G.; Zhao, T.; Wan, H.; Guan, G. Efficient utilization of CO2 in power-to-liquids/power-to-gas hybrid processes: An economic-environmental assessment. J. CO2 Util. 2023, 68, 102376. [Google Scholar] [CrossRef]
  32. Gao, R.; Zhang, L.; Wang, L.; Zhang, X.; Zhang, C.; Jun, K.-W.; Ki Kim, S.; Park, H.-G.; Gao, Y.; Zhu, Y.; et al. A comparative study on hybrid power-to-liquids/power-to-gas processes coupled with different water electrolysis technologies. Energy Convers. Manag. 2022, 263, 115671. [Google Scholar] [CrossRef]
  33. Tang, Z.; Zhang, L.; Wang, L.; Gao, R.; Jun, K.-W.; Kim, S.K.; Zhang, C.; Yang, Y.; Wan, H.; Guan, G. Carbon negative methanol production for CO2 utilization: Process design and 4E analysis. Energy 2024, 313, 134064. [Google Scholar] [CrossRef]
Figure 3. Carbon conversion efficiency of Option A and Option B.
Processes 13 00313 g003
Figure 4. (a) Detailed carbon flow diagram in Option A. (b) Detailed carbon flow diagram in Option B.
Processes 13 00313 g004aProcesses 13 00313 g004b
Figure 5. Energy efficiency of Option A and Option B.
Processes 13 00313 g005
Figure 6. Unit carbon emissions in Option A and Option B.
Processes 13 00313 g006
Figure 7. Annual capital investment of Option A and Option B.
Processes 13 00313 g007
Figure 8. Detailed total operating cost of Option A and Option B.
Processes 13 00313 g008
Figure 9. Net production costs of Option A and Option B.
Processes 13 00313 g009
Table 1. Estimation method of total capital investment.
ClassificationRF
(1) Delivered purchased equipment1
(2) Equipment and installation cost1.47
(3) Auxiliary system1.15
(4) Building and land cost0.98
(5) Project construction cost0.63
(6) Supervision and contingency cost0.81
(7) Working capital cost0.89
(8) Fixed capital cost (2) + (3) + (4) + (5) + (6) + (7)
Table 2. Operating cost estimation.
Item
(1) Raw materialsBiogas 4 USD/GJ [19]
Feed water 0.53 USD/tonne [31]
(2) UtilitiesNonrenewable electricity 0.063 USD/kWh [32]
Natural gas 8.80 USD/MMBtu [33]
Cooling water 0.033 USD/m3 [31]
(3) Operating and maintenance
  (3.1) Operating labor5 labors/shift, 3 shift/day, 60,000 USD/labor/a
  (3.2) Operating supervision and laboratory charges35% of operating labor
  (3.3) Maintenance and repairs3% of fixed capital investment
  (3.4) Operating supplies15% of maintenance and repairs
(4) Other costs
  (4.1) Insurance and taxes2% of fixed capital investment
  (4.2) Royalties1% of operating cost
  (4.3) Plant overhead costs60% of labor, supervision and maintenance
  (4.4) General expenses
    (4.4.1) Administration20% of labor, supervision and maintenance
    (4.4.2) Distribution and selling2% of operating cost
    (4.4.3) Research and development2% of operating cost
Total operating cost(1) + (2) + (3) + (4)
Table 3. CO2 emissions distribution for Option A and Option B.
Item Option AOption BUnit
Direct carbon emissionsWaste gas1.781.86tonne/h
Tail gas0.350.35tonne/h
Indirect carbon emissionsElectricity consumption3.353.26tonne/h
Heat consumption5.315.02tonne/h
Total carbon emissions 10.7910.50tonne/h
Unit carbon emissions 0.750.73t CO2/t CH3OH
Table 4. Detailed equipment cost of Option A and Option B.
No.EquipmentOption AOption BUnit
1Heat exchangers6.587.56M$
2Compressors and pumps6.956.79
3Biogas reforming reactor19.1019.10
4Methanol synthesis reactor6.276.09
5Membrane separator2.98/
6Methanol separation column0.410.41
7Flash tanks0.490.48
8Methane pyrolysis reactor8.23/
9Chemical looping reforming reactor/2.76
Total equipment cost51.0043.20
Table 5. Detailed total operating costs in Option A and Option B.
CategoryOption AOption BUnit
(1) Raw materials11.119.96M$/a
  (1.1) Biogas11.059.90
  (1.2) Process water0.060.07
(2) Utilities11.2910.77
  (2.1) Nonrenewable electricity3.553.46
  (2.2) Natural gas6.636.27
  (2.3) Cooling water1.111.03
(3) Operating and maintenance10.979.48
(4) Other cost15.7613.59
  (4.1) Insurance and taxes5.664.79
  (4.2) Royalties0.490.44
  (4.3) Plant overhead costs5.744.96
  (4.4) General expenses3.883.41
Operating cost49.1343.80
Table 6. Byproduct revenue of Option A and Option B.
ItemOption AOption BUnit
Solid carbon20.61/USD/t CH3OH
Highly purified CO25.8810.23
Total production revenue26.4910.23
Disclaimer/Publisher’s Note: The statements, opinions and data contained in all publications are solely those of the individual author(s) and contributor(s) and not of MDPI and/or the editor(s). MDPI and/or the editor(s) disclaim responsibility for any injury to people or property resulting from any ideas, methods, instructions or products referred to in the content.

