1. Introduction
As a globally important source of energy, coal plays an irreplaceable role in the economic development of many countries [
1]. However, underground coal mining is usually carried out under high-risk and complex environmental conditions and involves many major risks, such as fire, explosion, toxic gas leakage, mine collapse, and water seepage [
2]. Although the frequency of coal mine gas explosions is relatively low, they are particularly destructive, often leading to mass deaths and serious property losses [
3]. Therefore, gas-related accidents have always been the focus of attention in the field of mine safety. From a global perspective, the risk of gas explosion is a prominent safety hazard in the coal industry. In European countries that still maintain large-scale coal mining activities (such as Poland), research shows that gas and coal dust disasters occur due to many key factors, such as mining, transportation, and coal preparation, and have strong systematic characteristics [
4]. Similarly, in mine accidents in Pakistan, mine collapse and gas explosion accounted for about 80% of all deaths [
5], indicating that the risk level is extremely high. Coal has remained the primary source of energy in China for decades, as the country leads the world in both coal production and consumption. According to 2019 statistics, China’s coal consumption accounts for 56.6% of the country’s total fossil energy consumption [
6], indicating that the coal-dominated energy structure will continue for a long time to come [
7]. However, the coal industry has the typical characteristics of high labor intensity, complex working environments, and high accident rates. Coal mine safety has always been the core problem restricting the high-quality development of the industry [
8]. Coal mine accidents have occurred frequently over the years; official data from the Ministry of Emergency Management of the People’s Republic of China show that gas explosions account for nearly 70% of coal mine accidents involving more than 10 deaths, establishing them as the dominant cause of serious incidents. Gas explosion is the biggest killer that threatens the safety of coal mining. It not only causes serious casualties and huge economic losses but also leads to a series of negative social effects [
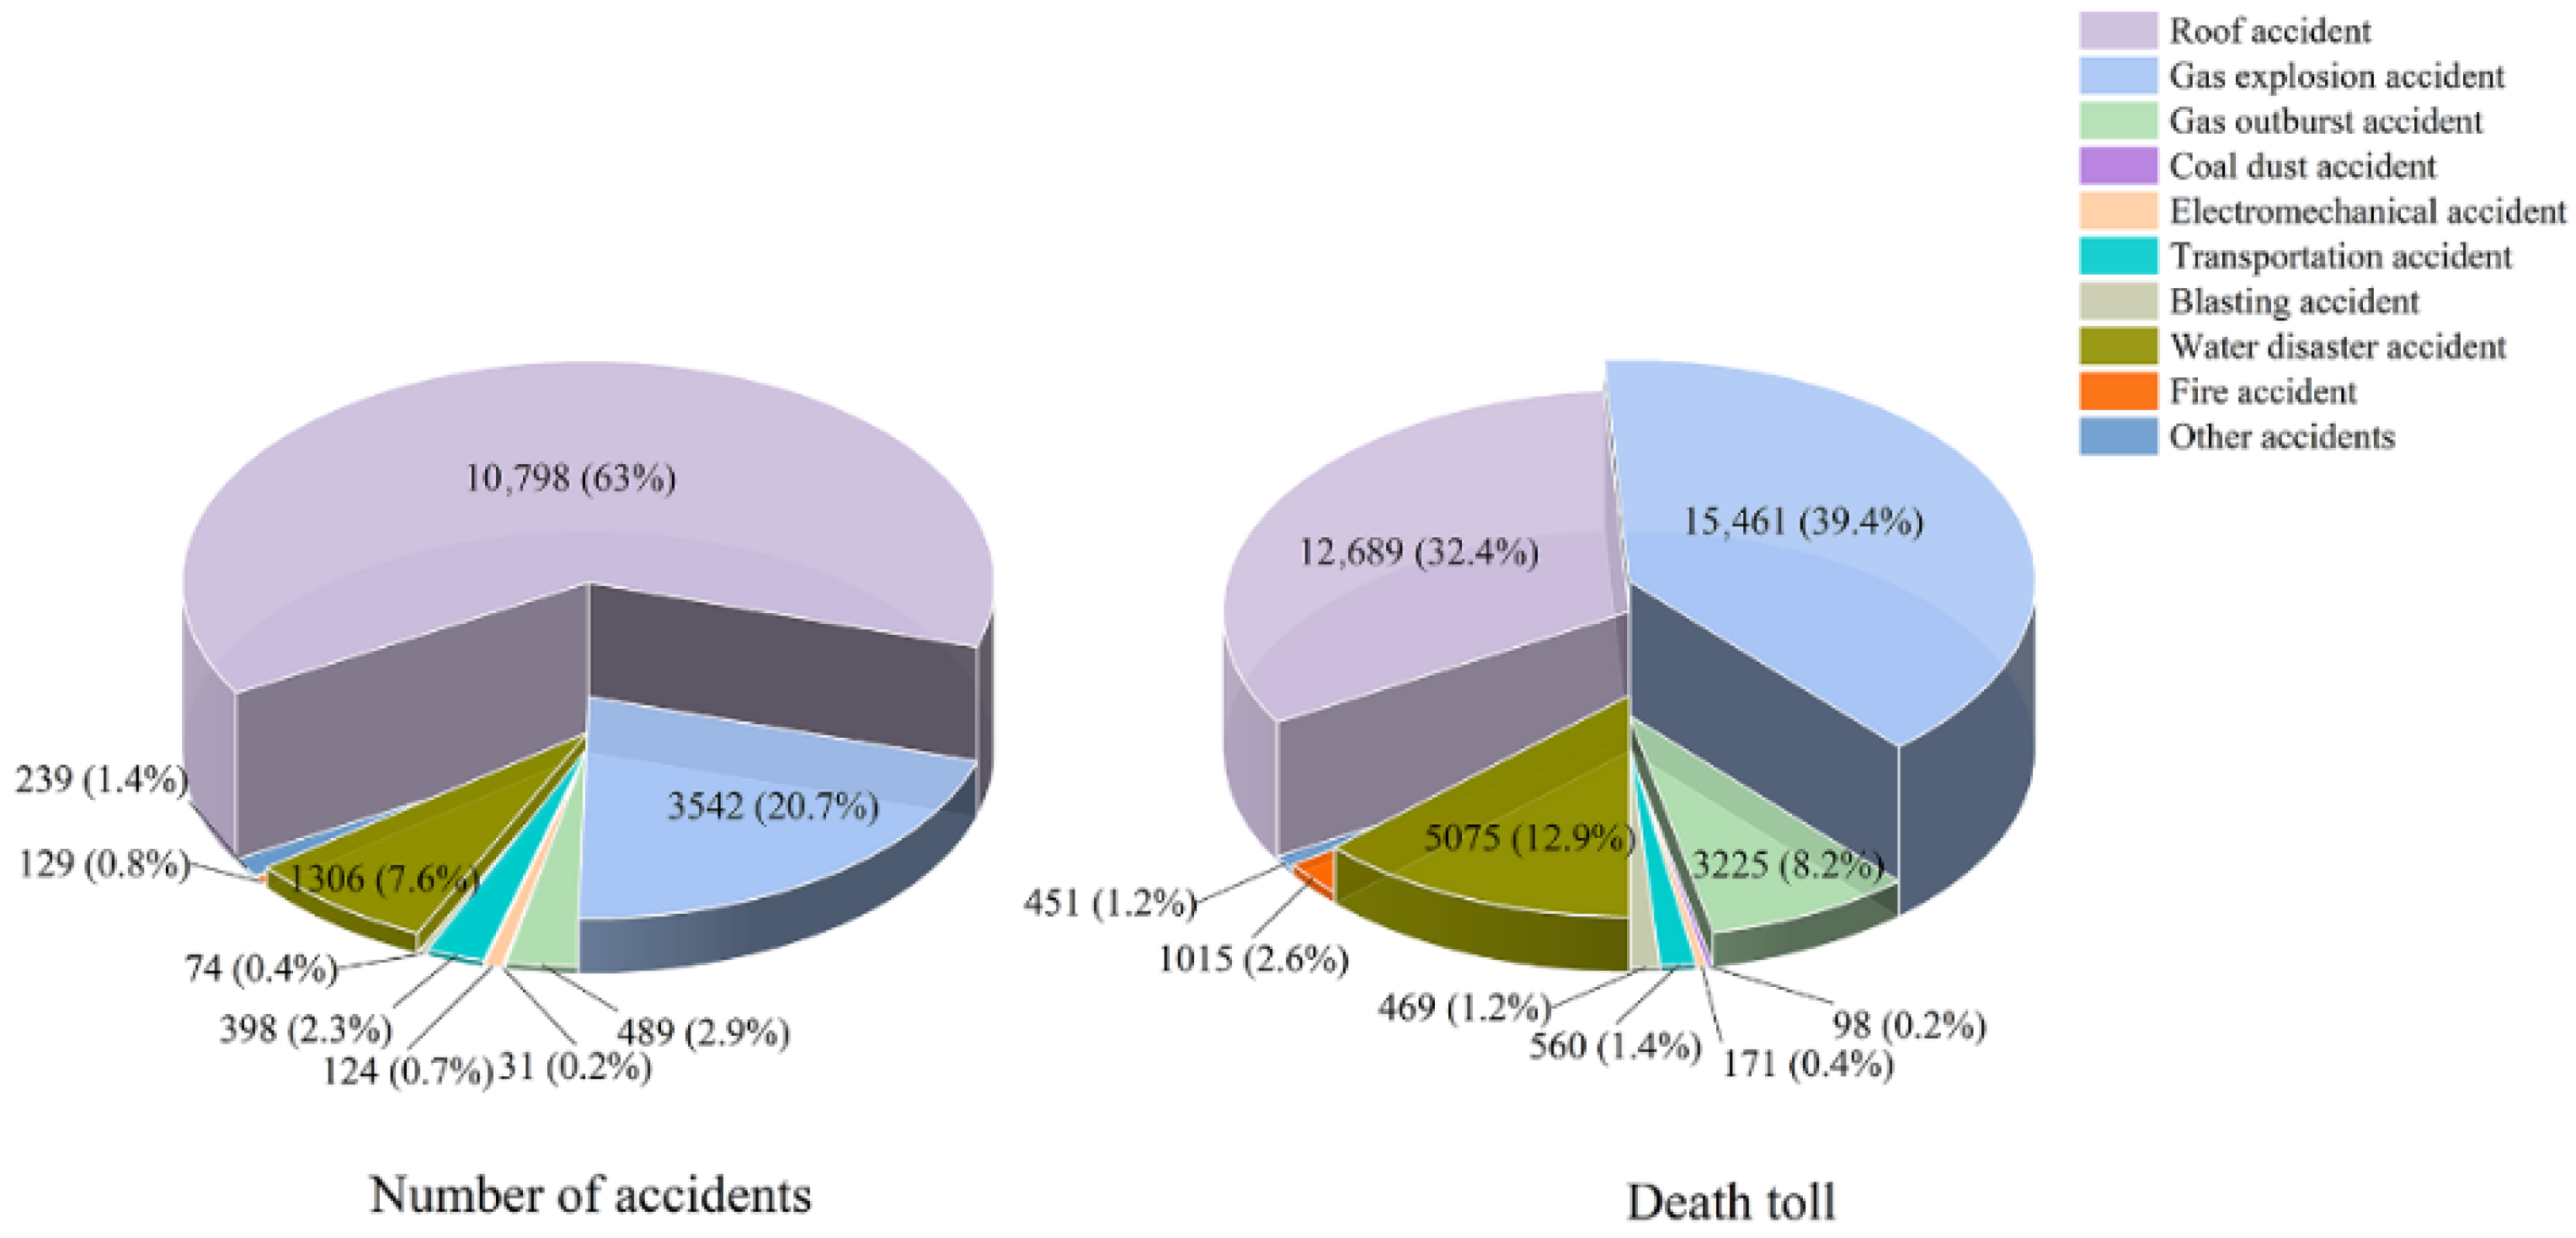
9]. As shown in
Figure 1, from 2000 to 2024, a total of 3542 gas explosion accidents occurred in China, accounting for 20.7% of the total number of accidents. However, the number of deaths accounted for 39.4% of the total, ranking first. It is therefore urgently necessary to explore the causes of accidents and propose effective risk mitigation methods. In recent years, the introduction of intelligent technology into mining has achieved remarkable results in reducing labor intensity, improving operation efficiency, and strengthening safety guarantees. The coal mine accident rate and death toll have decreased significantly [
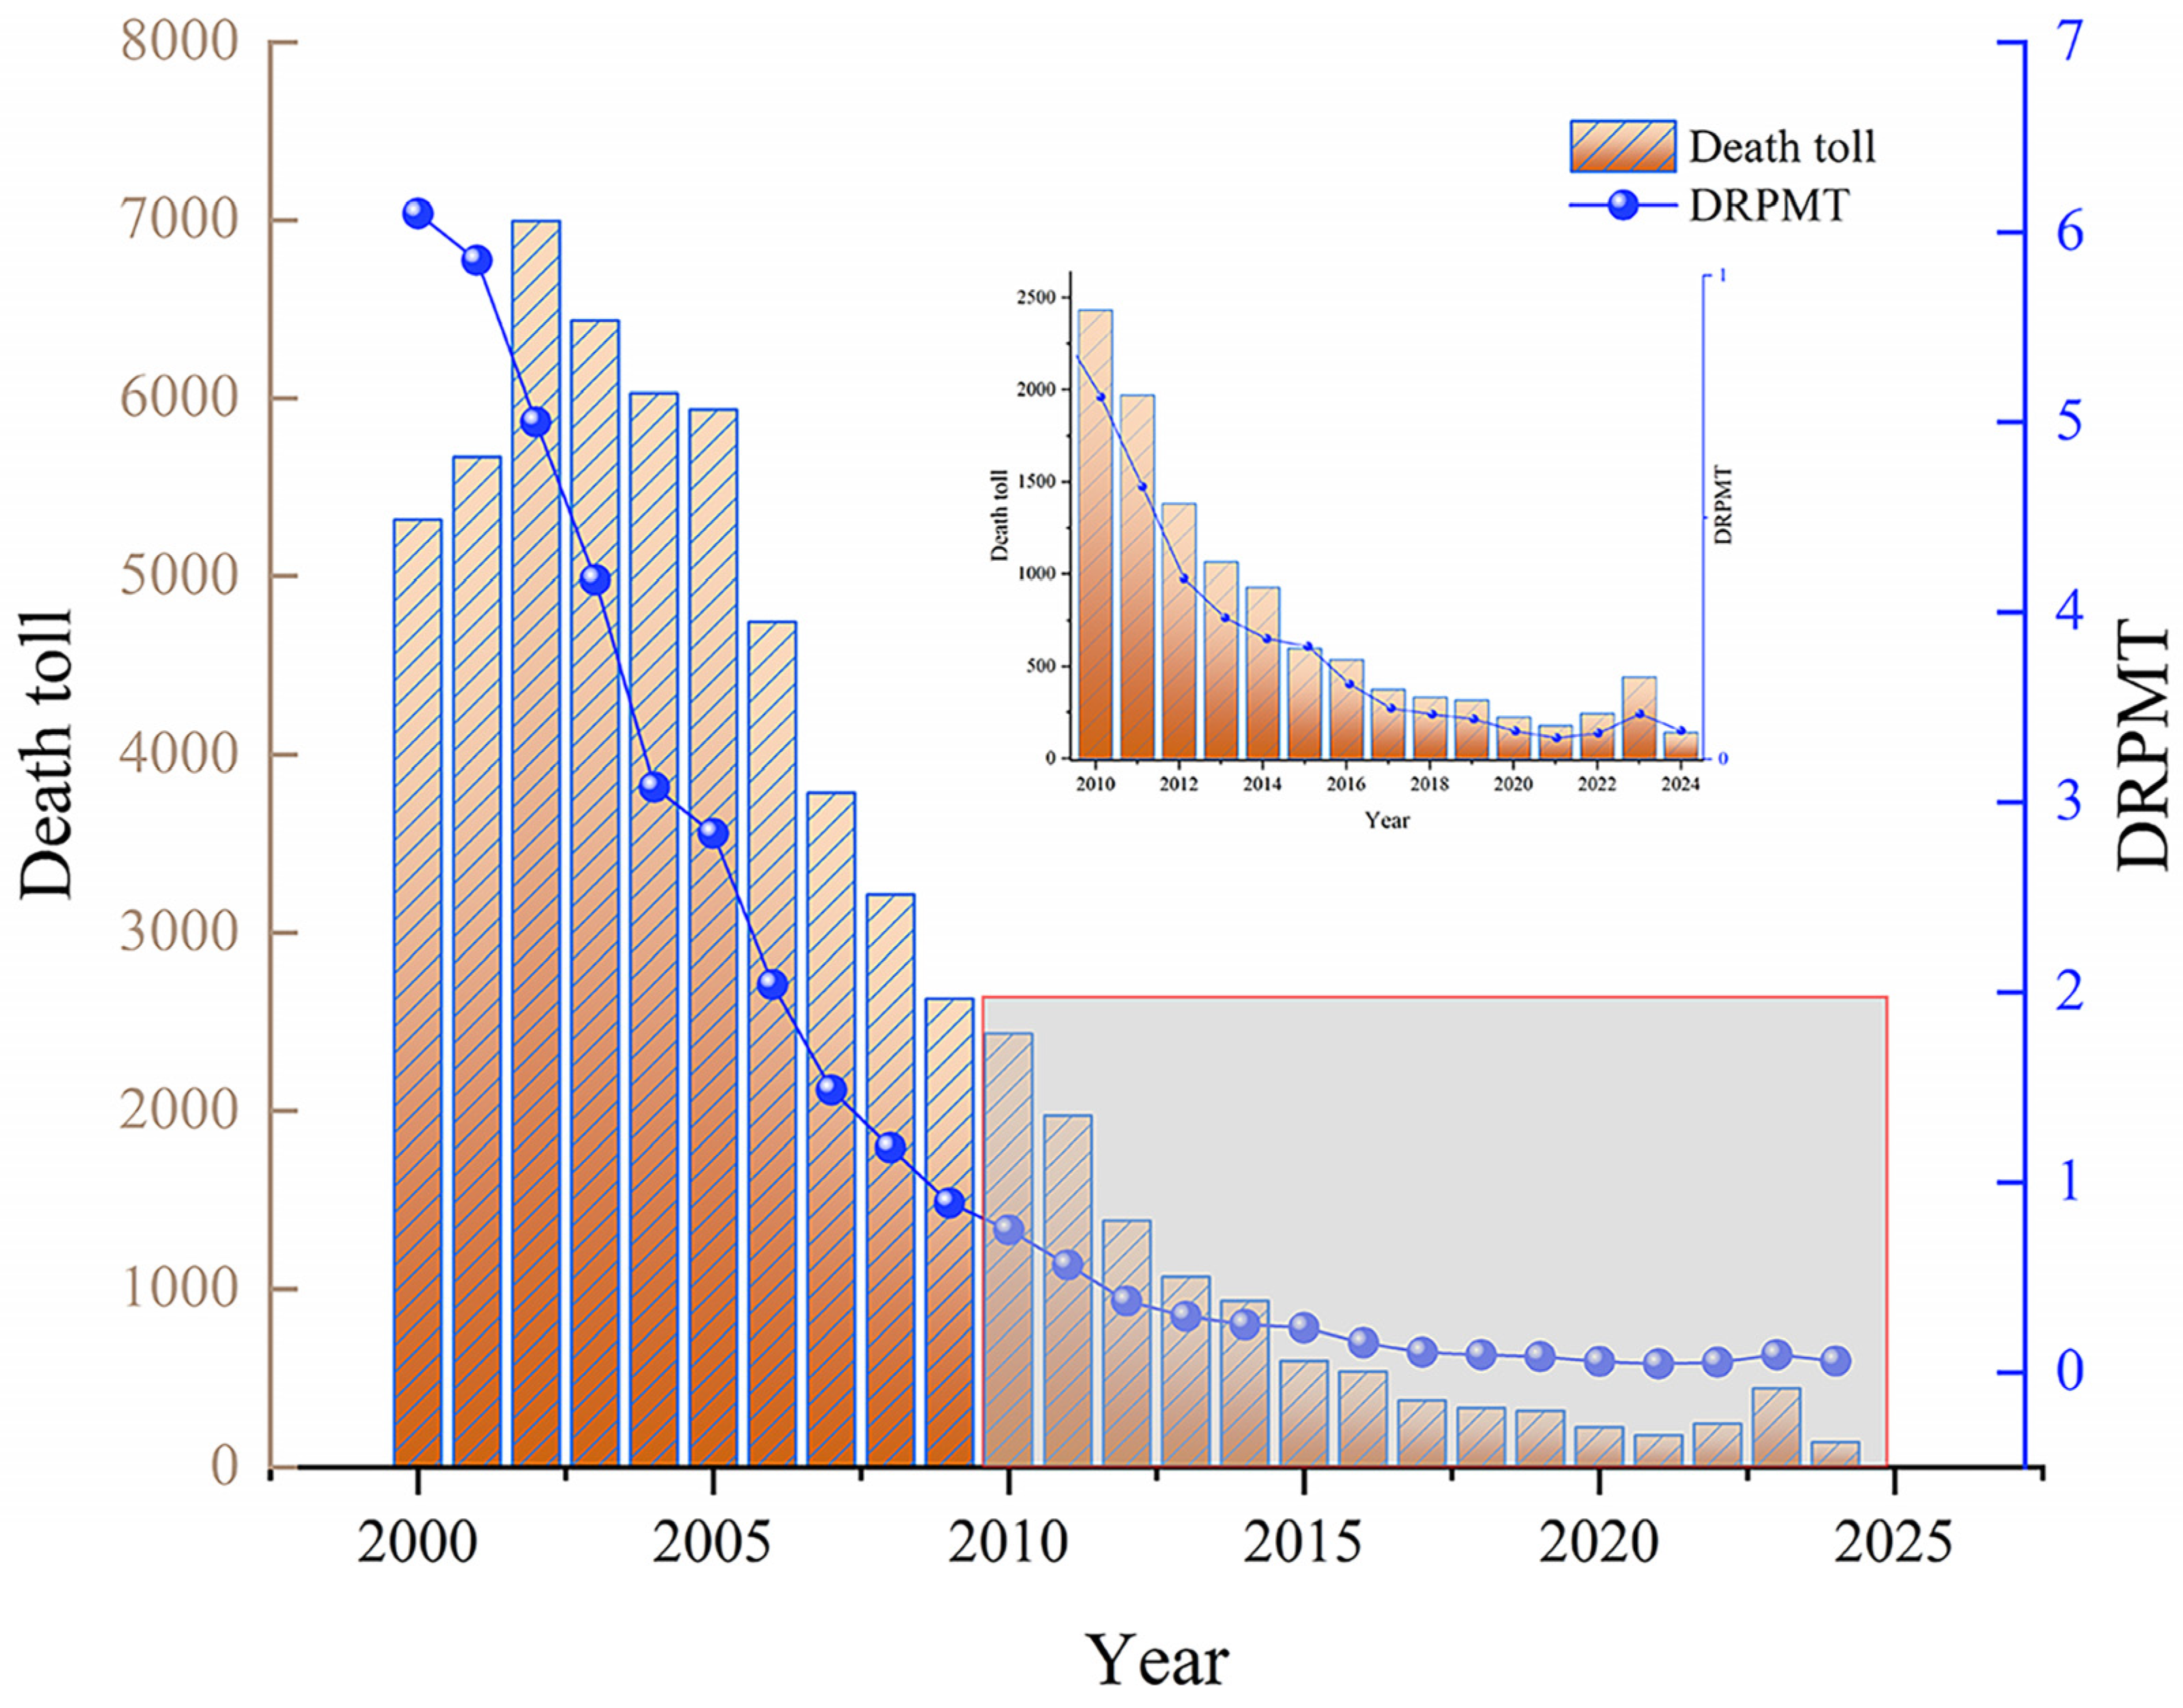
10]. In 2019, the death rate per million tons of coal mines in China (DRPMT) fell below 0.1 for the first time [
11] (the specific data are shown in
Figure 2). Although the application of intelligent technologies has significantly improved the safety level of coal mine operations, statistics indicate that three major coal mine gas explosion accidents occurred in China in 2023, resulting in 47 fatalities [
12]. This reality highlights the fact that accident prevention remains a core challenge in ensuring coal mine safety.
A systematic summary and analysis of the causes of historical accidents can provide valuable insights and effective support for developing preventive strategies. The researchers in [
13] statistically examined coal mine accidents in China between 2018 and 2022, analyzing their patterns, causal factors, and relative significance. The results show that the incidence of general accidents in coal mines is the highest, and human factors are the main causes of accidents. In [
14], GIS spatial analysis and rescaled range analysis were used to comprehensively reveal the spatial and temporal distribution characteristics and evolution rules of coal mine accidents based on 2269 survey reports in China from 2005 to 2022. These macro-level statistical analyses reveal the general rules of coal mine accidents. However, they often fail to provide an in-depth understanding of the mechanisms and evolution of accidents, which limits their effectiveness in accident prevention. Therefore, some researchers began to seek quantitative methods for use in specific situations, aiming to make up for the shortcomings of macro analysis in revealing the mechanism of accidents. The authors of [
15] proposed a risk assessment method based on management supervision, risk tree (MORT), and energy release theory. This method provides a quantitative multi-dimensional risk analysis framework for coal mine water inrush accidents. In [
16], the relationships between risk factors were analyzed using risk coupling theory from macro, meso, and micro levels. The researchers constructed a multi-factor coupling risk assessment model for gas explosions based on the C-OWA operator and interaction matrix. These studies have promoted the development of a quantitative risk analysis framework. Nevertheless, they are biased towards post hoc analysis and focus primarily on accident results. Risk management should not be implemented only after injury or damage occurs; instead, it should focus on training, processes, and systematization to address potential future risks. Effective risk management begins with accurate identification, which forms its foundational step. In the mining sector, both managers and workers must recognize potential hazards in their operational settings to minimize the likelihood of accidents.
Therefore, a systematic approach is essential to identify and analyze the underlying mechanisms of accidents, as well as to trace their root cause. Accident causal models such as the 2–4 model [
17], HFACS [
18], and STAMP [
19] are widely used. In [
20], the 2–4 model was applied to a coal mine gas explosion accident, revealing the evolution process of gas explosions and the interactions among multiple contributing factors. The researchers in [
21] employed an improved HFACS model to classify 29 human factors across the supervisory, managerial, and operational levels, and further validated the clustering of these factors using complex network analysis. A STAMP-Game model was proposed in [
22] for accident analysis in oil and gas storage and transportation systems, aiming to enhance the safety of existing infrastructures. Although traditional accident causation models have substantially advanced the identification of contributing factors, root cause analysis, and the understanding of causal mechanisms, they still exhibit several limitations. First, large-scale studies on coal mine gas explosions have mainly relied on subjective approaches, such as surveys and the Delphi method, to determine contributing factors. These approaches are often influenced by the researcher’s personal experience and expertise, which can lead to incomplete analytical frameworks or biased information, thereby affecting the reliability of factor identification. Second, most existing models concentrate on human factors, resulting in factor systems that are not sufficiently comprehensive and may overlook critical triggers of accidents. Third, while causal models elucidate the mechanisms of accidents from the perspective of causation, they only provide limited insight into the complex nonlinear interactions among factors and the dynamic evolution of accidents.
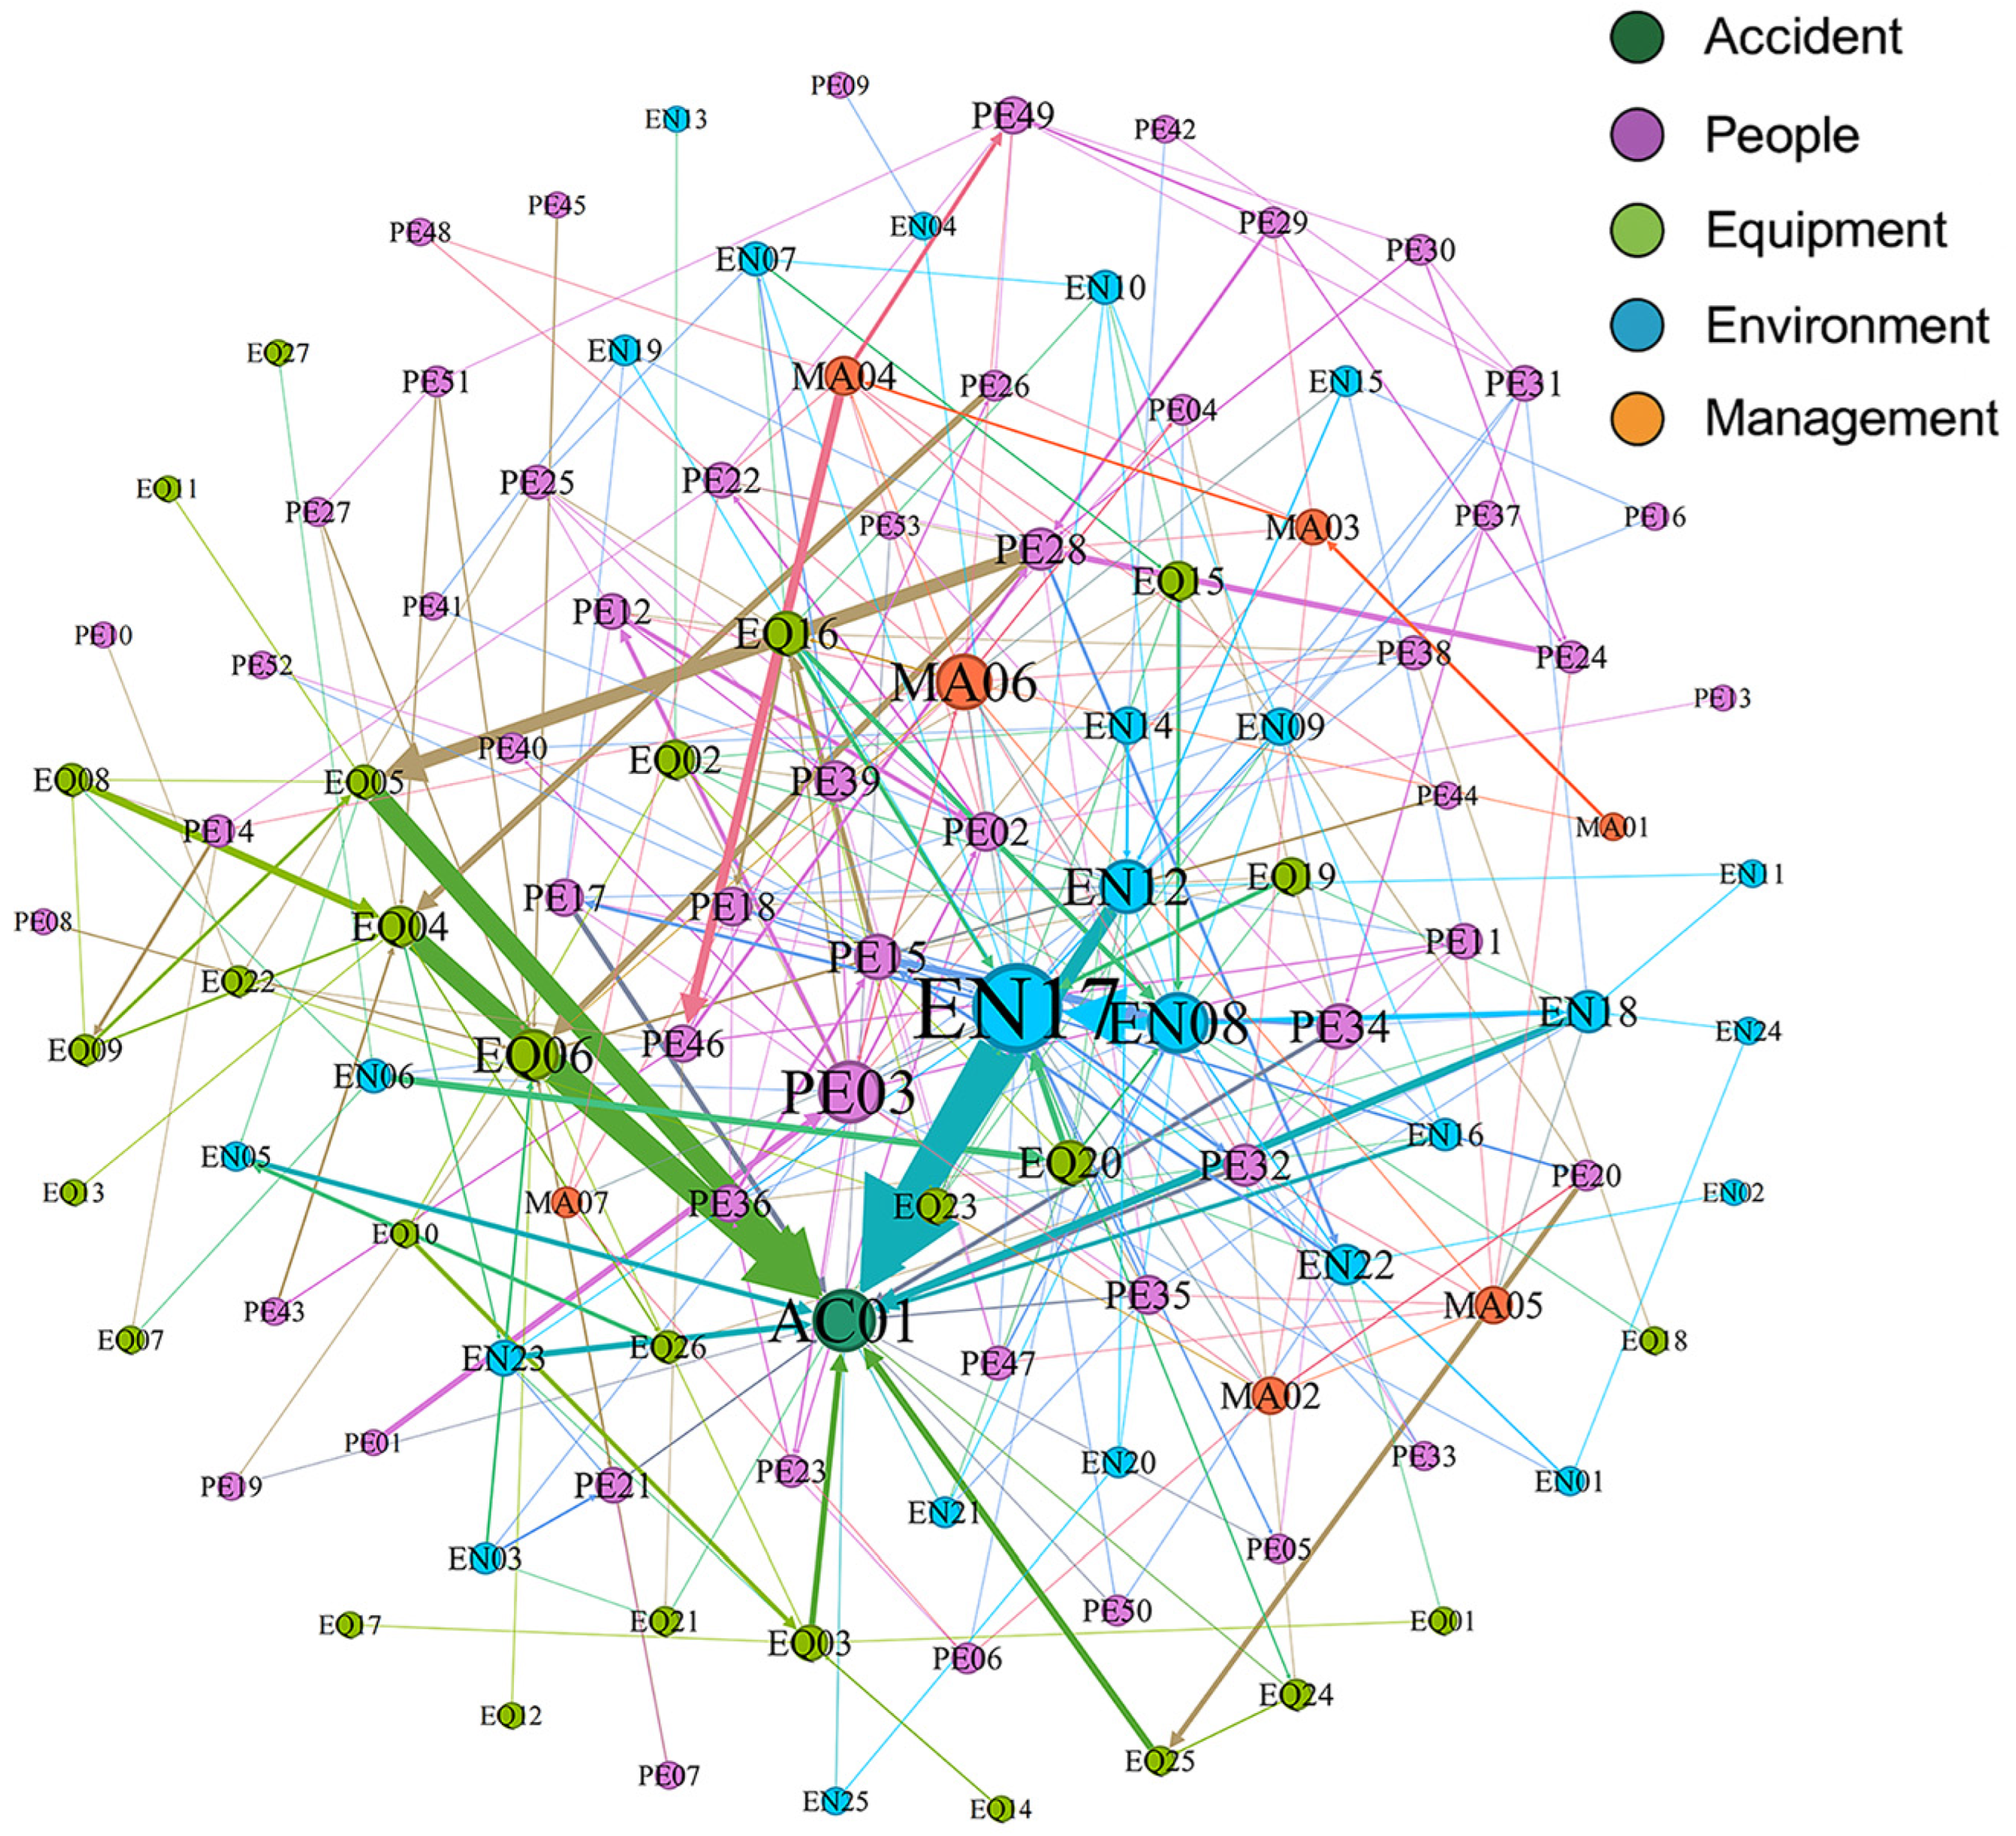
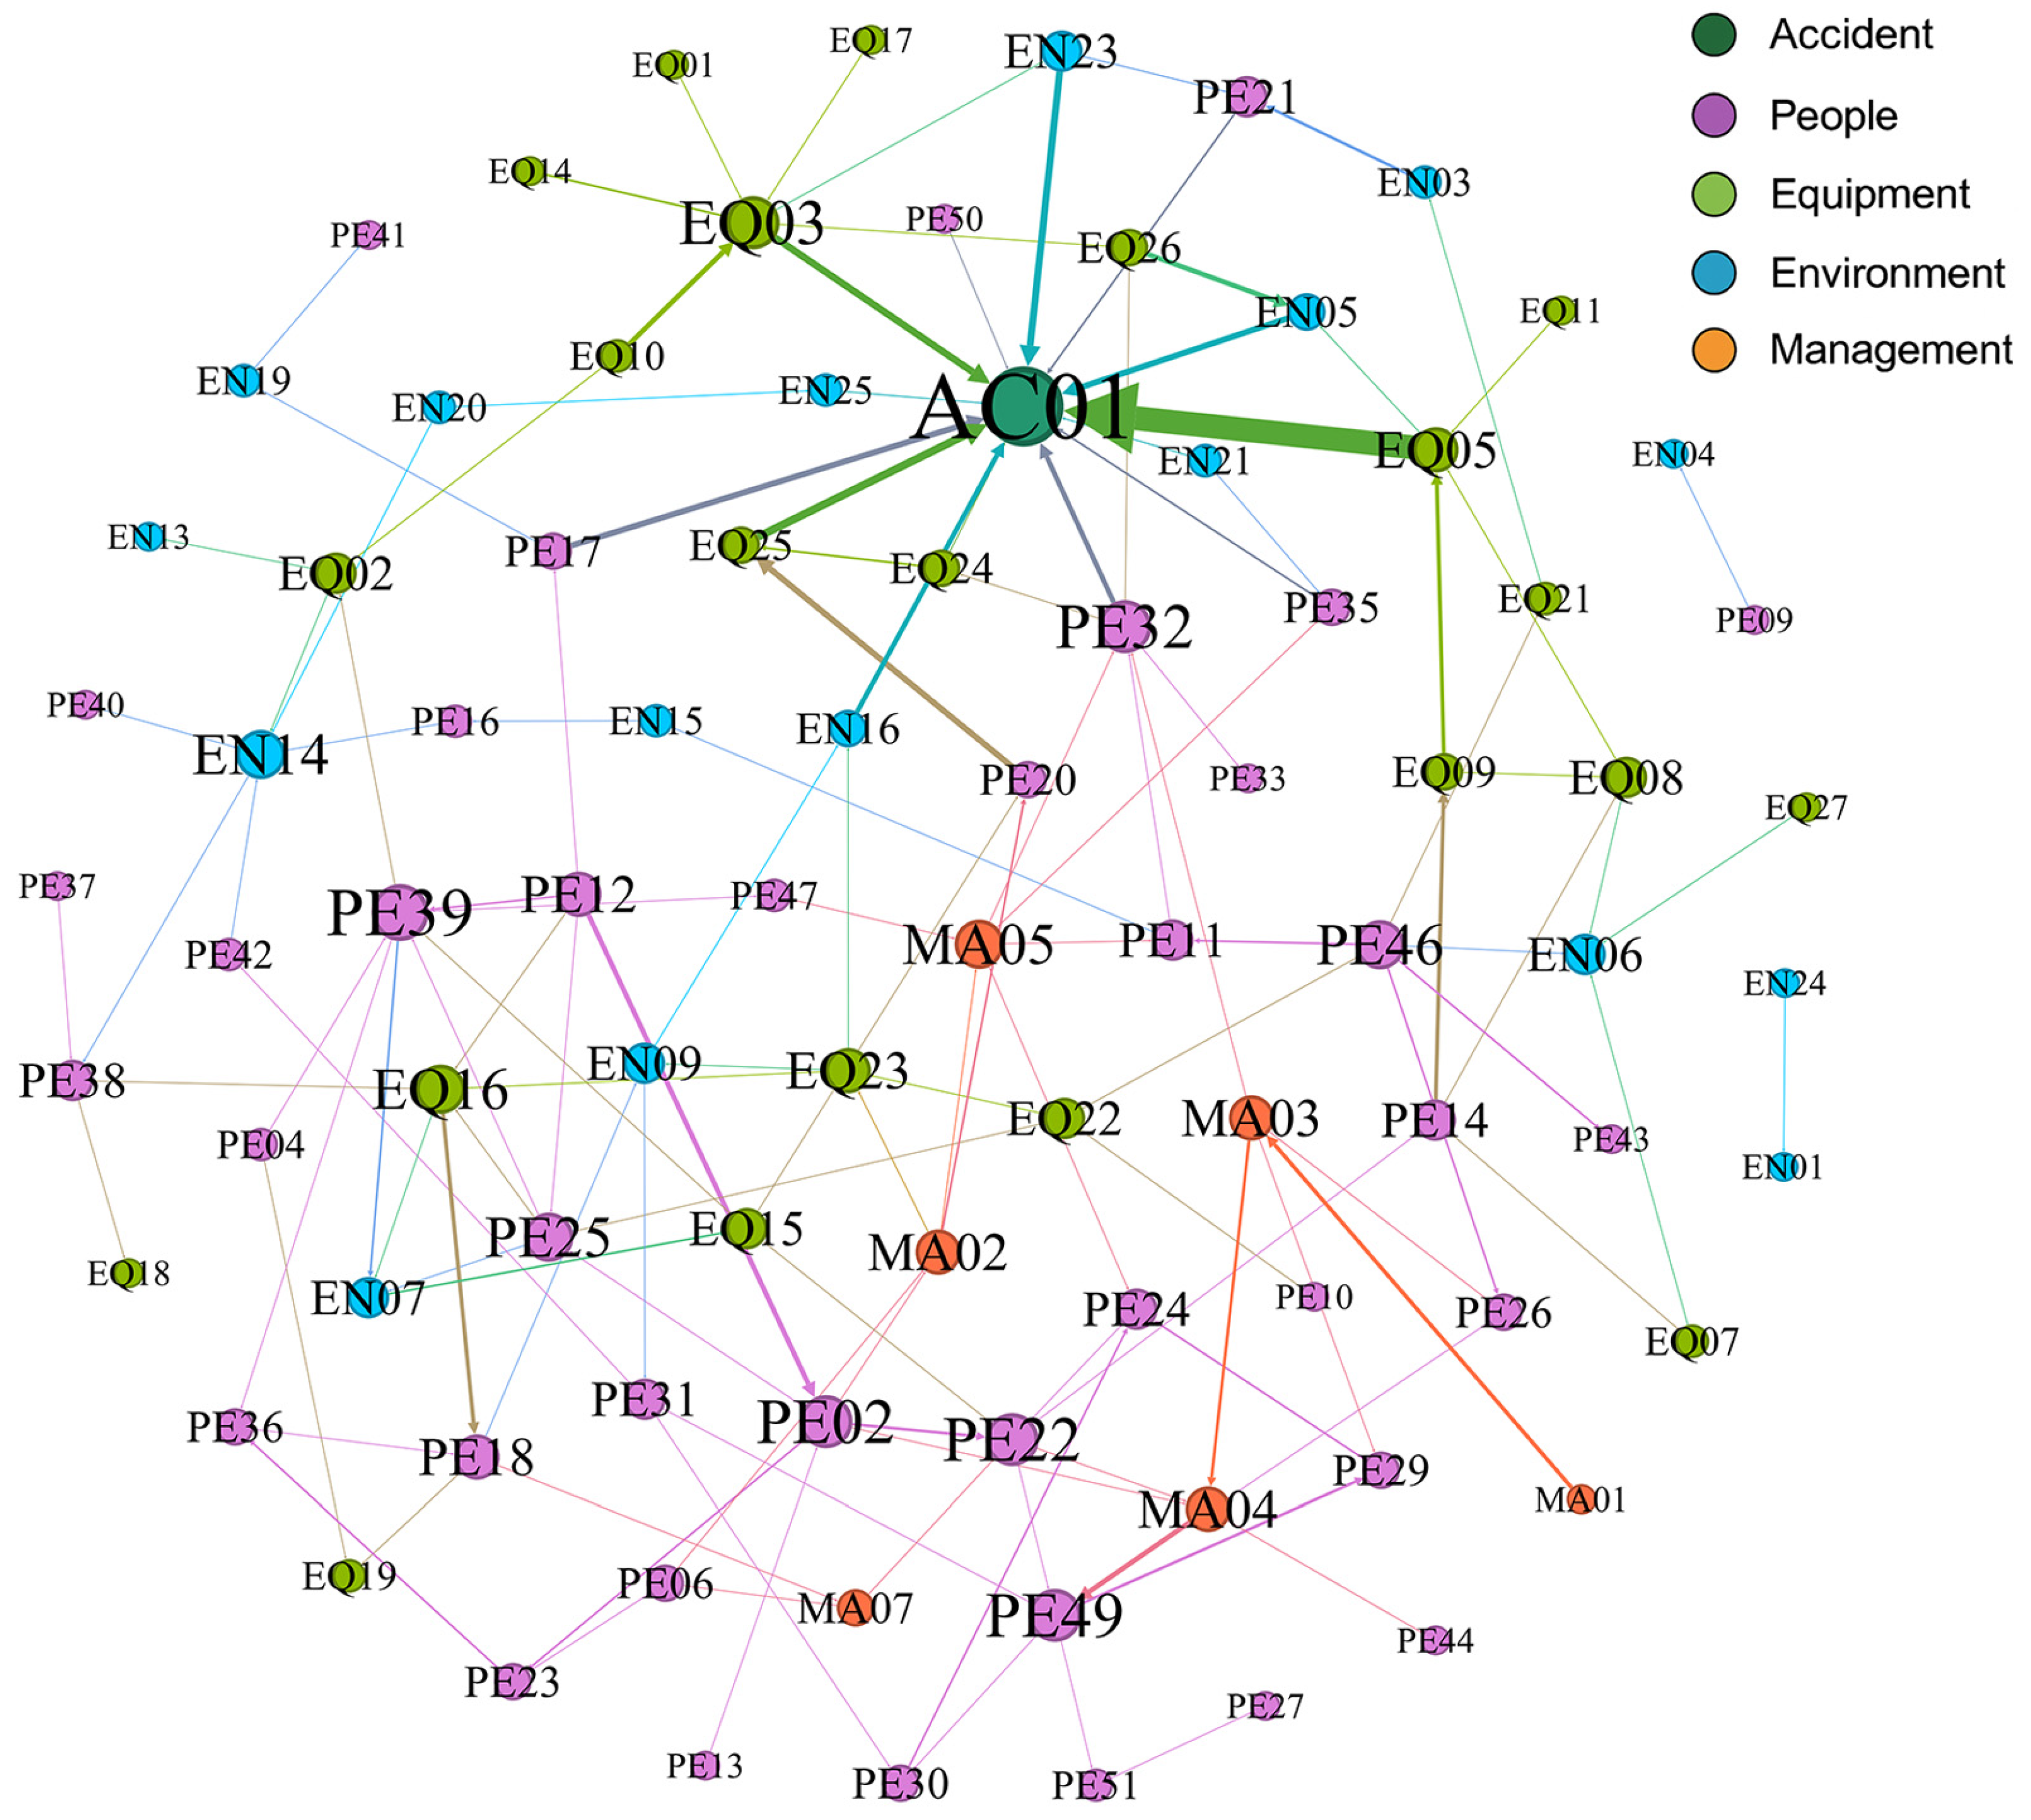
Specifically, a more systematic and comprehensive method is needed to identify accident risk factors, determine key incentives, and analyze risk evolution paths, so as to formulate a more efficient prevention strategy for coal mine gas explosion accidents. Based on this, in this paper, an accident cause analysis framework is proposed that combines root–state risk identification (RSRI) theory and complex network theory. Firstly, the RSRI theory is used to systematically analyze 102 accident reports, and 112 risk factors are extracted. The risks are divided into “root risk” and “state risk”. The internal relationship between them is analyzed in depth, and a systematic risk factor framework is constructed according to the four dimensions of unsafe human behavior, unsafe equipment, unsafe environmental conditions, and unsafe management measures. Secondly, based on complex network theory, a directed weighted causal network model of coal mine gas explosion accidents is constructed, and its topological structure is analyzed to reveal the complex interaction between risk factors. Thirdly, to evaluate the overall significance of each node and pinpoint major risk elements, the entropy weight TOPSIS (EW-TOPSIS) approach integrates four network metrics: degree centrality, betweenness centrality, clustering coefficient, and PageRank. Edge vulnerability is determined by the three indices of edge betweenness, average path length, and connectivity to determine the key evolution path. Finally, the causal network simulation reveals the significant impact of key risks and key risk interactions on network complexity. Based on this, a targeted risk mitigation strategy is proposed. The research results provide a more systematic quantitative analysis tool for coal mine safety management to support more scientific risk management and control decisions and reduce the probability of accidents.
The remainder of this paper is arranged as follows:
Section 2 covers the materials and methods;
Section 3 describes the results;
Section 4 is the discussion; and
Section 5 presents the conclusion.
2. Materials and Methods
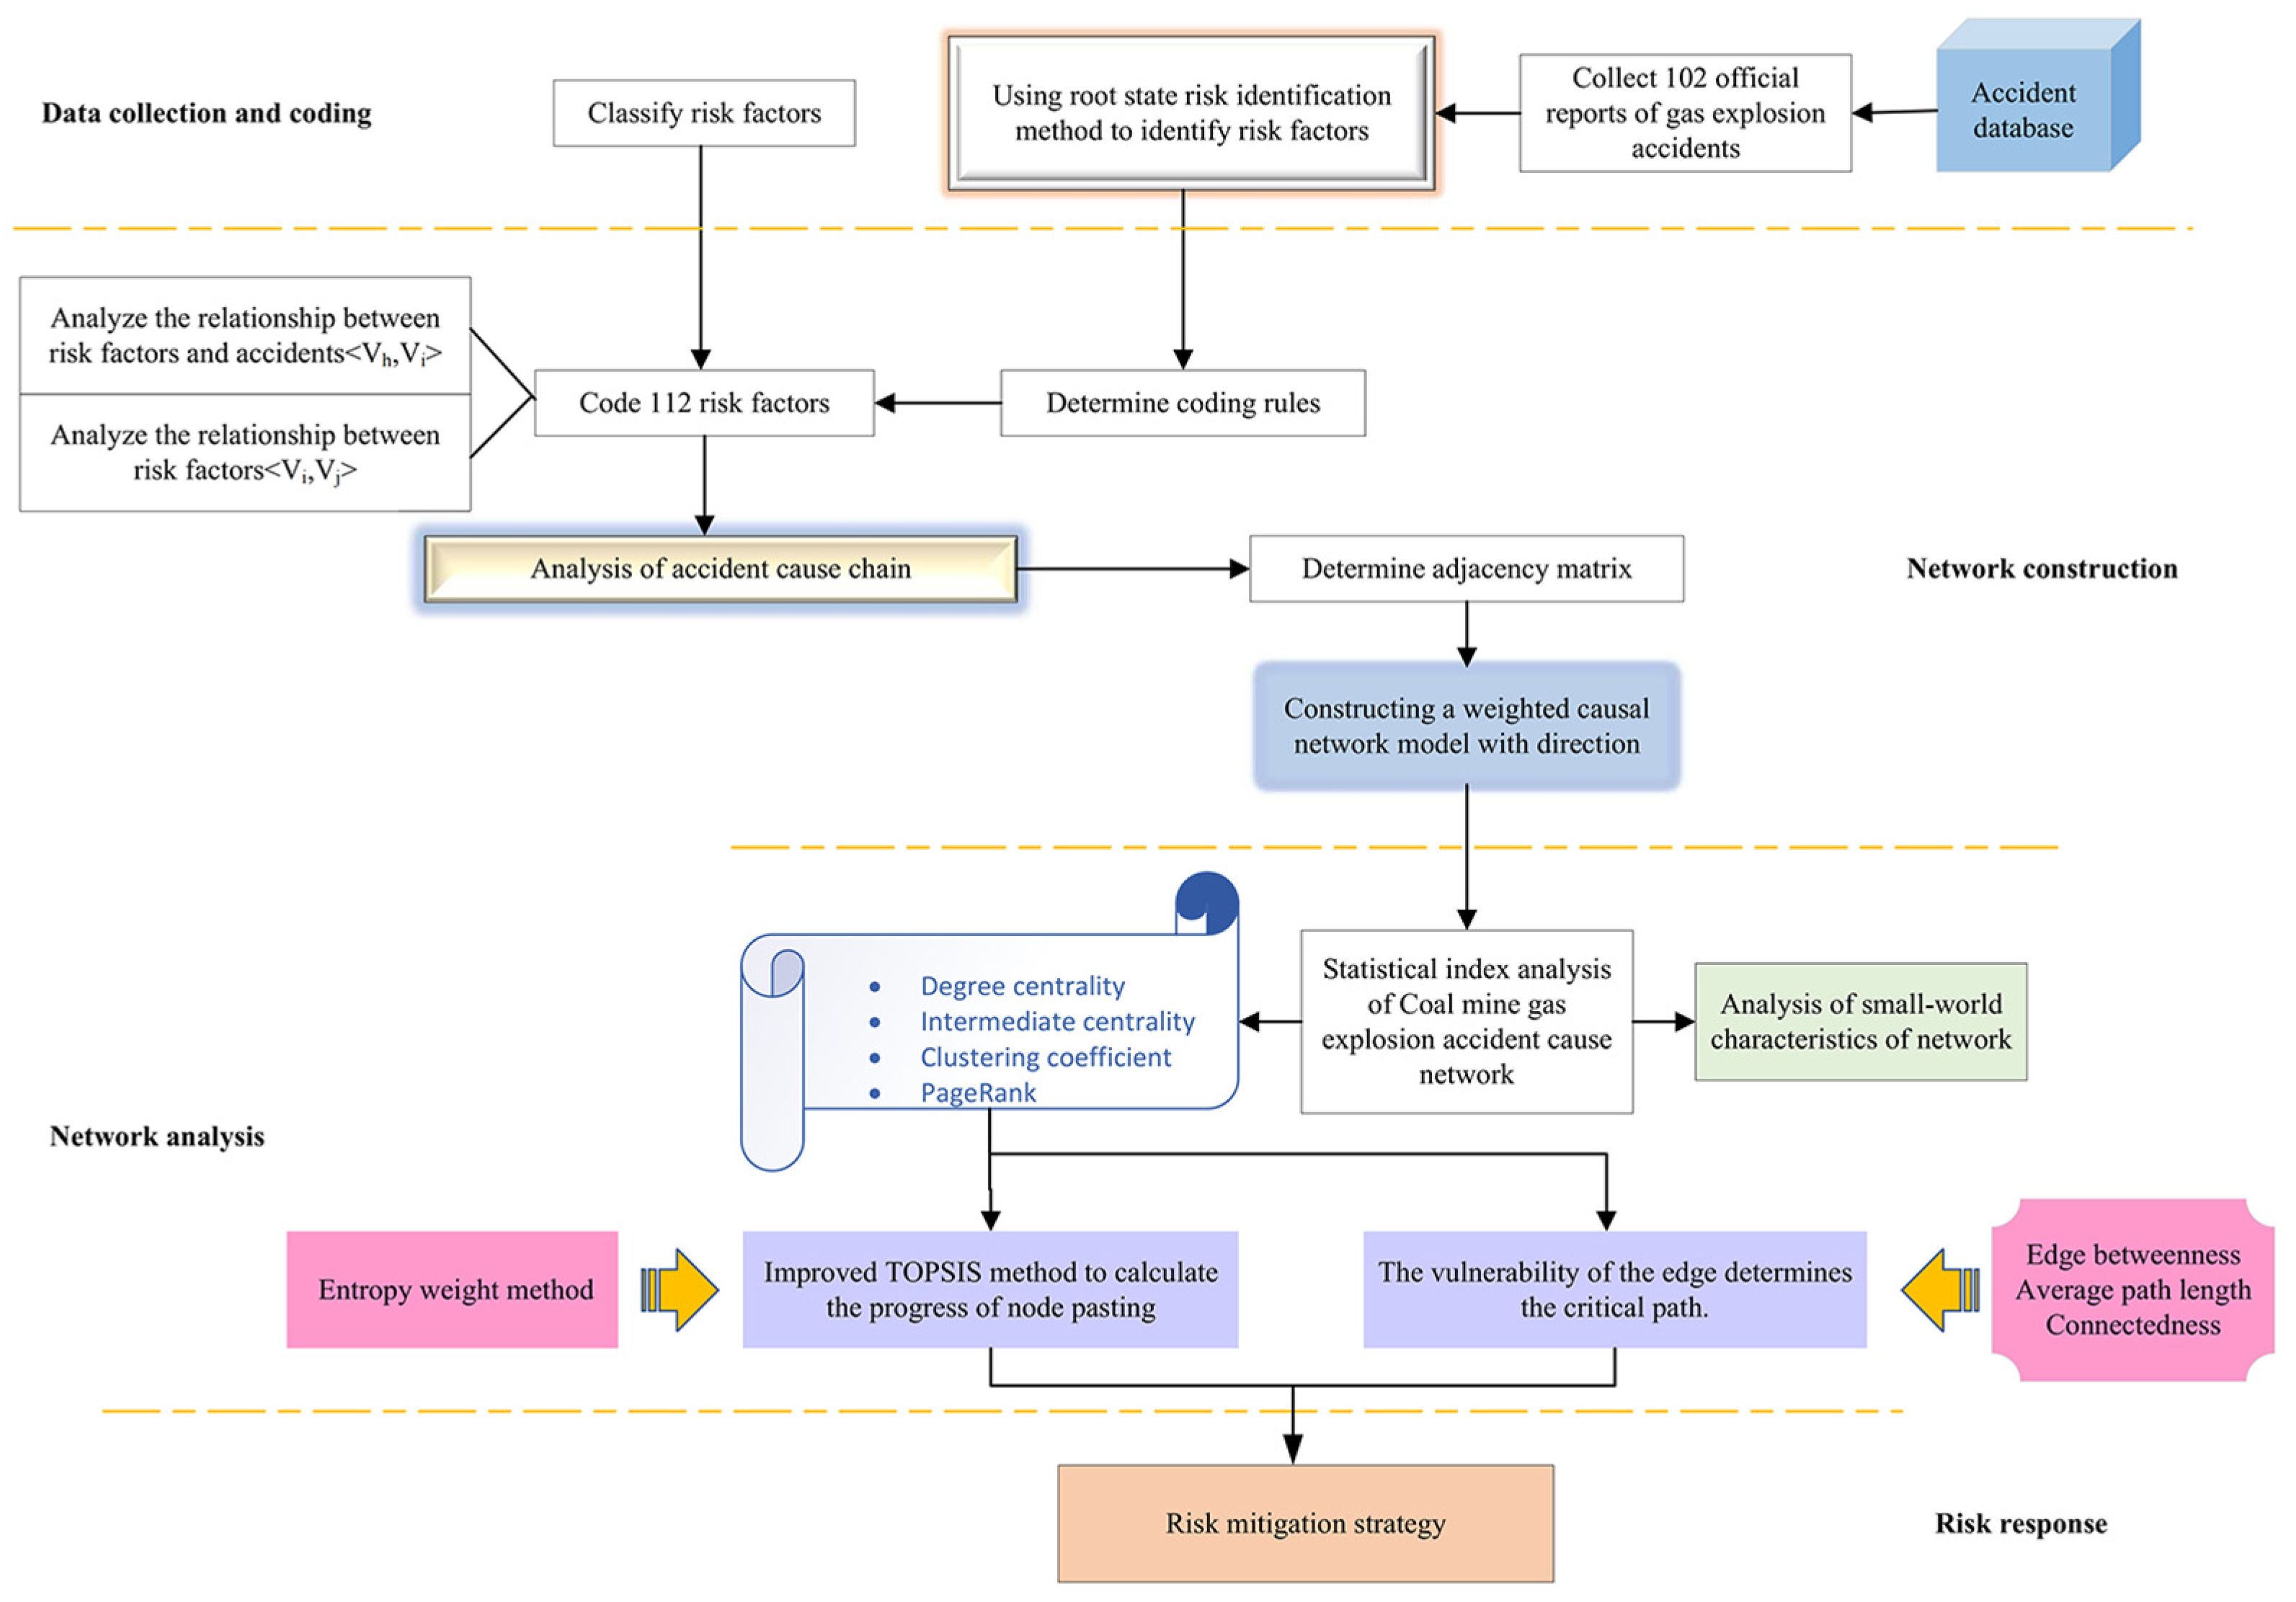
Figure 3 outlines the four steps of this study: data collection and coding, network modeling, network analysis, and proposing risk mitigation strategies. During data preparation and encoding, 102 accident reports were examined through the application of root–state risk identification (RSRI) theory. The extracted risk factors are designated as nodes in the network, and the directed edges represent the determined causal relationship between these factors. In the follow-up stage of the study, a network model of coal mine gas explosion accident causation was established. Through the analysis of the network, the key factors and critical paths were determined. Finally, the network changes were verified after eliminating key factors and paths, and then targeted risk mitigation strategies were proposed.
2.1. Root–State Risk Identification (RSRI) Theory
The theory of root–state risk identification (RSRI) originated from the theory of Root–Hazard Identification (RHRI) [
23]. Both have strong continuity in terms of theoretical basis and analytical thinking, and their core differences are mainly reflected in their identification objects: RHRI pays more attention to identifying “hazard sources” that may cause accidents, while RSRI further expands this concept into “risk factors”, extending the identification content from narrow hazard sources to broader systematic risk components. Although both of these models aim to reveal the cause of accidents in essence, RSRI emphasizes the interaction of internal and external factors in the conceptual framework, and divides the identification results into “root risks” and “state risks”, thus building a more structured and hierarchical risk identification system on the basis of the original RHRI. Through this extension, RSRI can make a more comprehensive and forward-looking analysis of potential risks in complex systems.
Root–state risk identification (RSRI) theory divides the risks identified from accident reports into root risk and state risk. The root cause risk is the root cause of the accident. These risks are intrinsic to underground coal mining and production processes, regardless of whether they are recognized. They can be categorized into four types: human, equipment, environmental, and managerial risks. Specifically, the fundamental risk caused by people refers to the jobs of coal mining enterprises, such as mine managers, gas miners, and blasting workers. The root risks caused by machines include all mechanical equipment, such as shearers, hydraulic supports, and ventilators. The environment includes the working environment and natural geological conditions, including methane, coal, and groundwater. Fundamental organizational hazards encompass elements such as organizational structure, safety culture, and operational regulations [
24,
25]. State risk refers to unsafe conditions or behaviors caused by potential hazards that are the direct cause of accidents [
26]. For example, human state risk mainly refers to unsafe behaviors, such as the improper installation of ventilators by ventilation workers or non-compliance with gas extraction processes by gas discharge workers. Equipment state risk mainly refers to the unsafe state of equipment, such as machine leakage, mine lamp explosion, or unqualified detonators. Environmental state risk mainly refers to the unsafe state of coal spontaneous combustion, insufficient air volume in the working face, and high gas concentrations in the heading face. Institutional state risks mainly refer to problems within institutions, such as an unreasonable organizational structure or insufficient safety supervision. As a new risk identification method, RSRI has not been widely used in prior research, but it can be used to effectively analyze the objective information of accident reports and classify them reasonably. The researchers in [
27] used the root–state identification method to screen and evaluate the risk factors of cold chain logistics, which expanded the scope of the RSRI application.
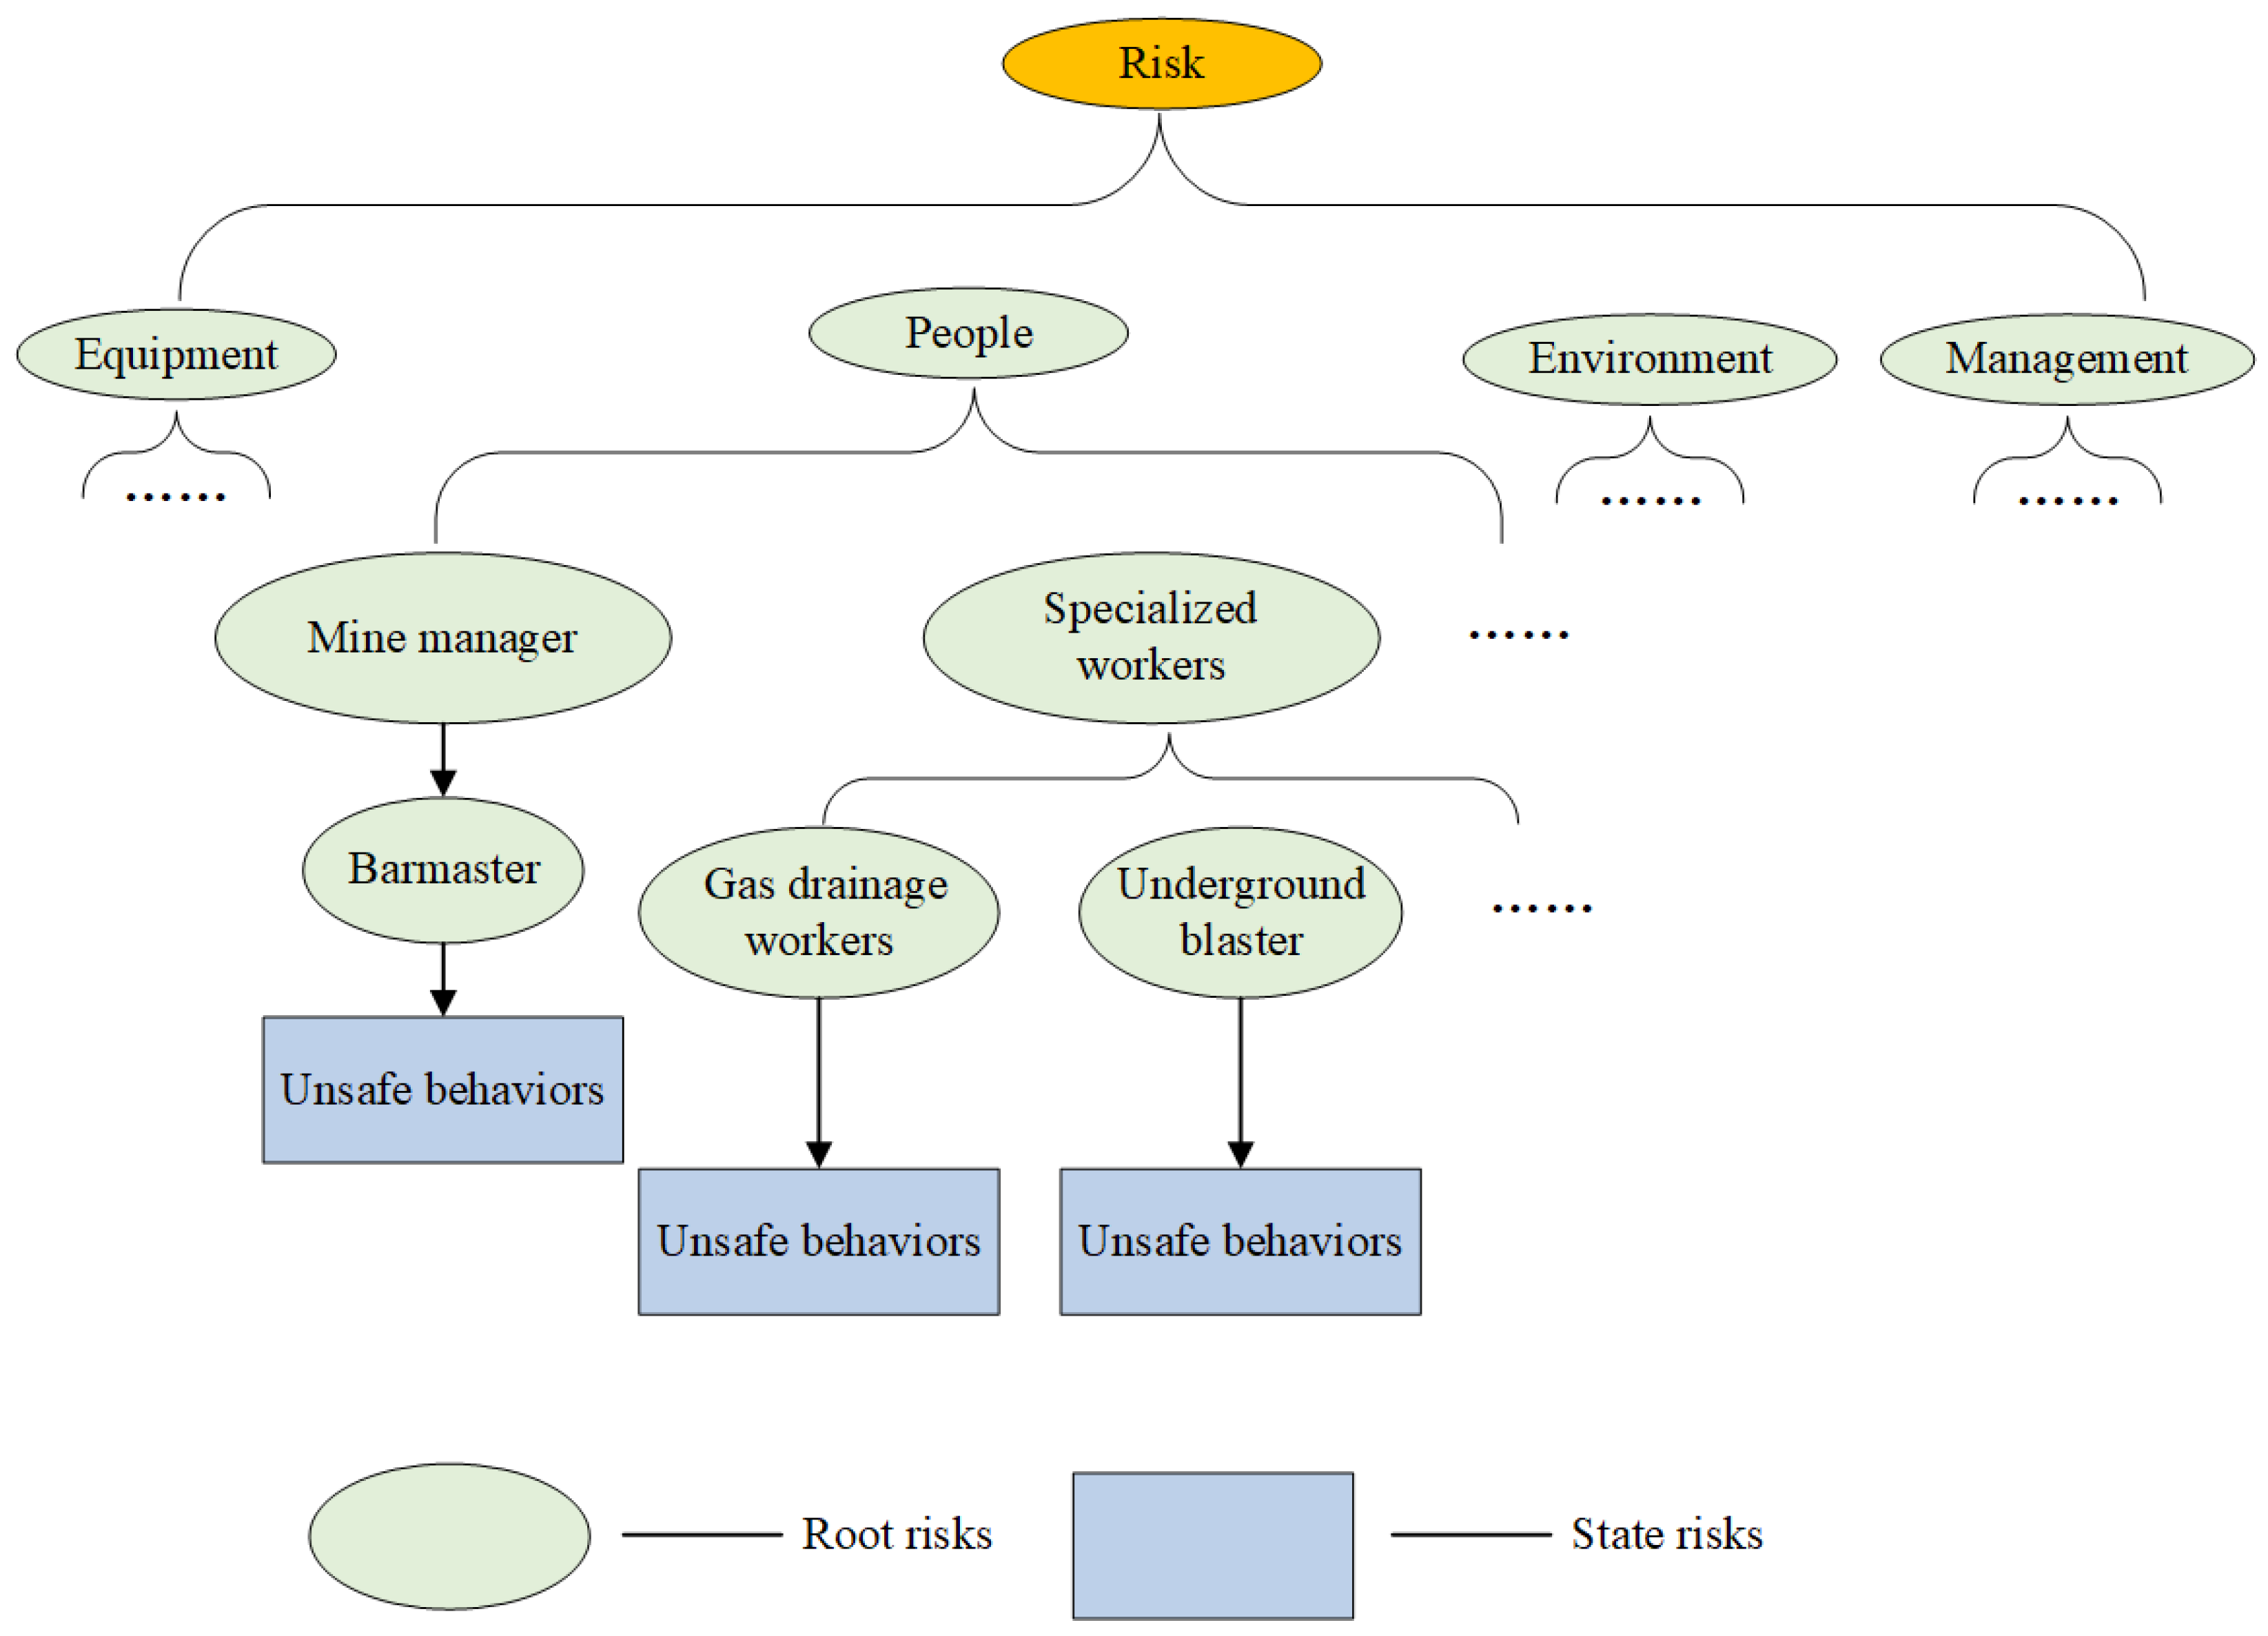
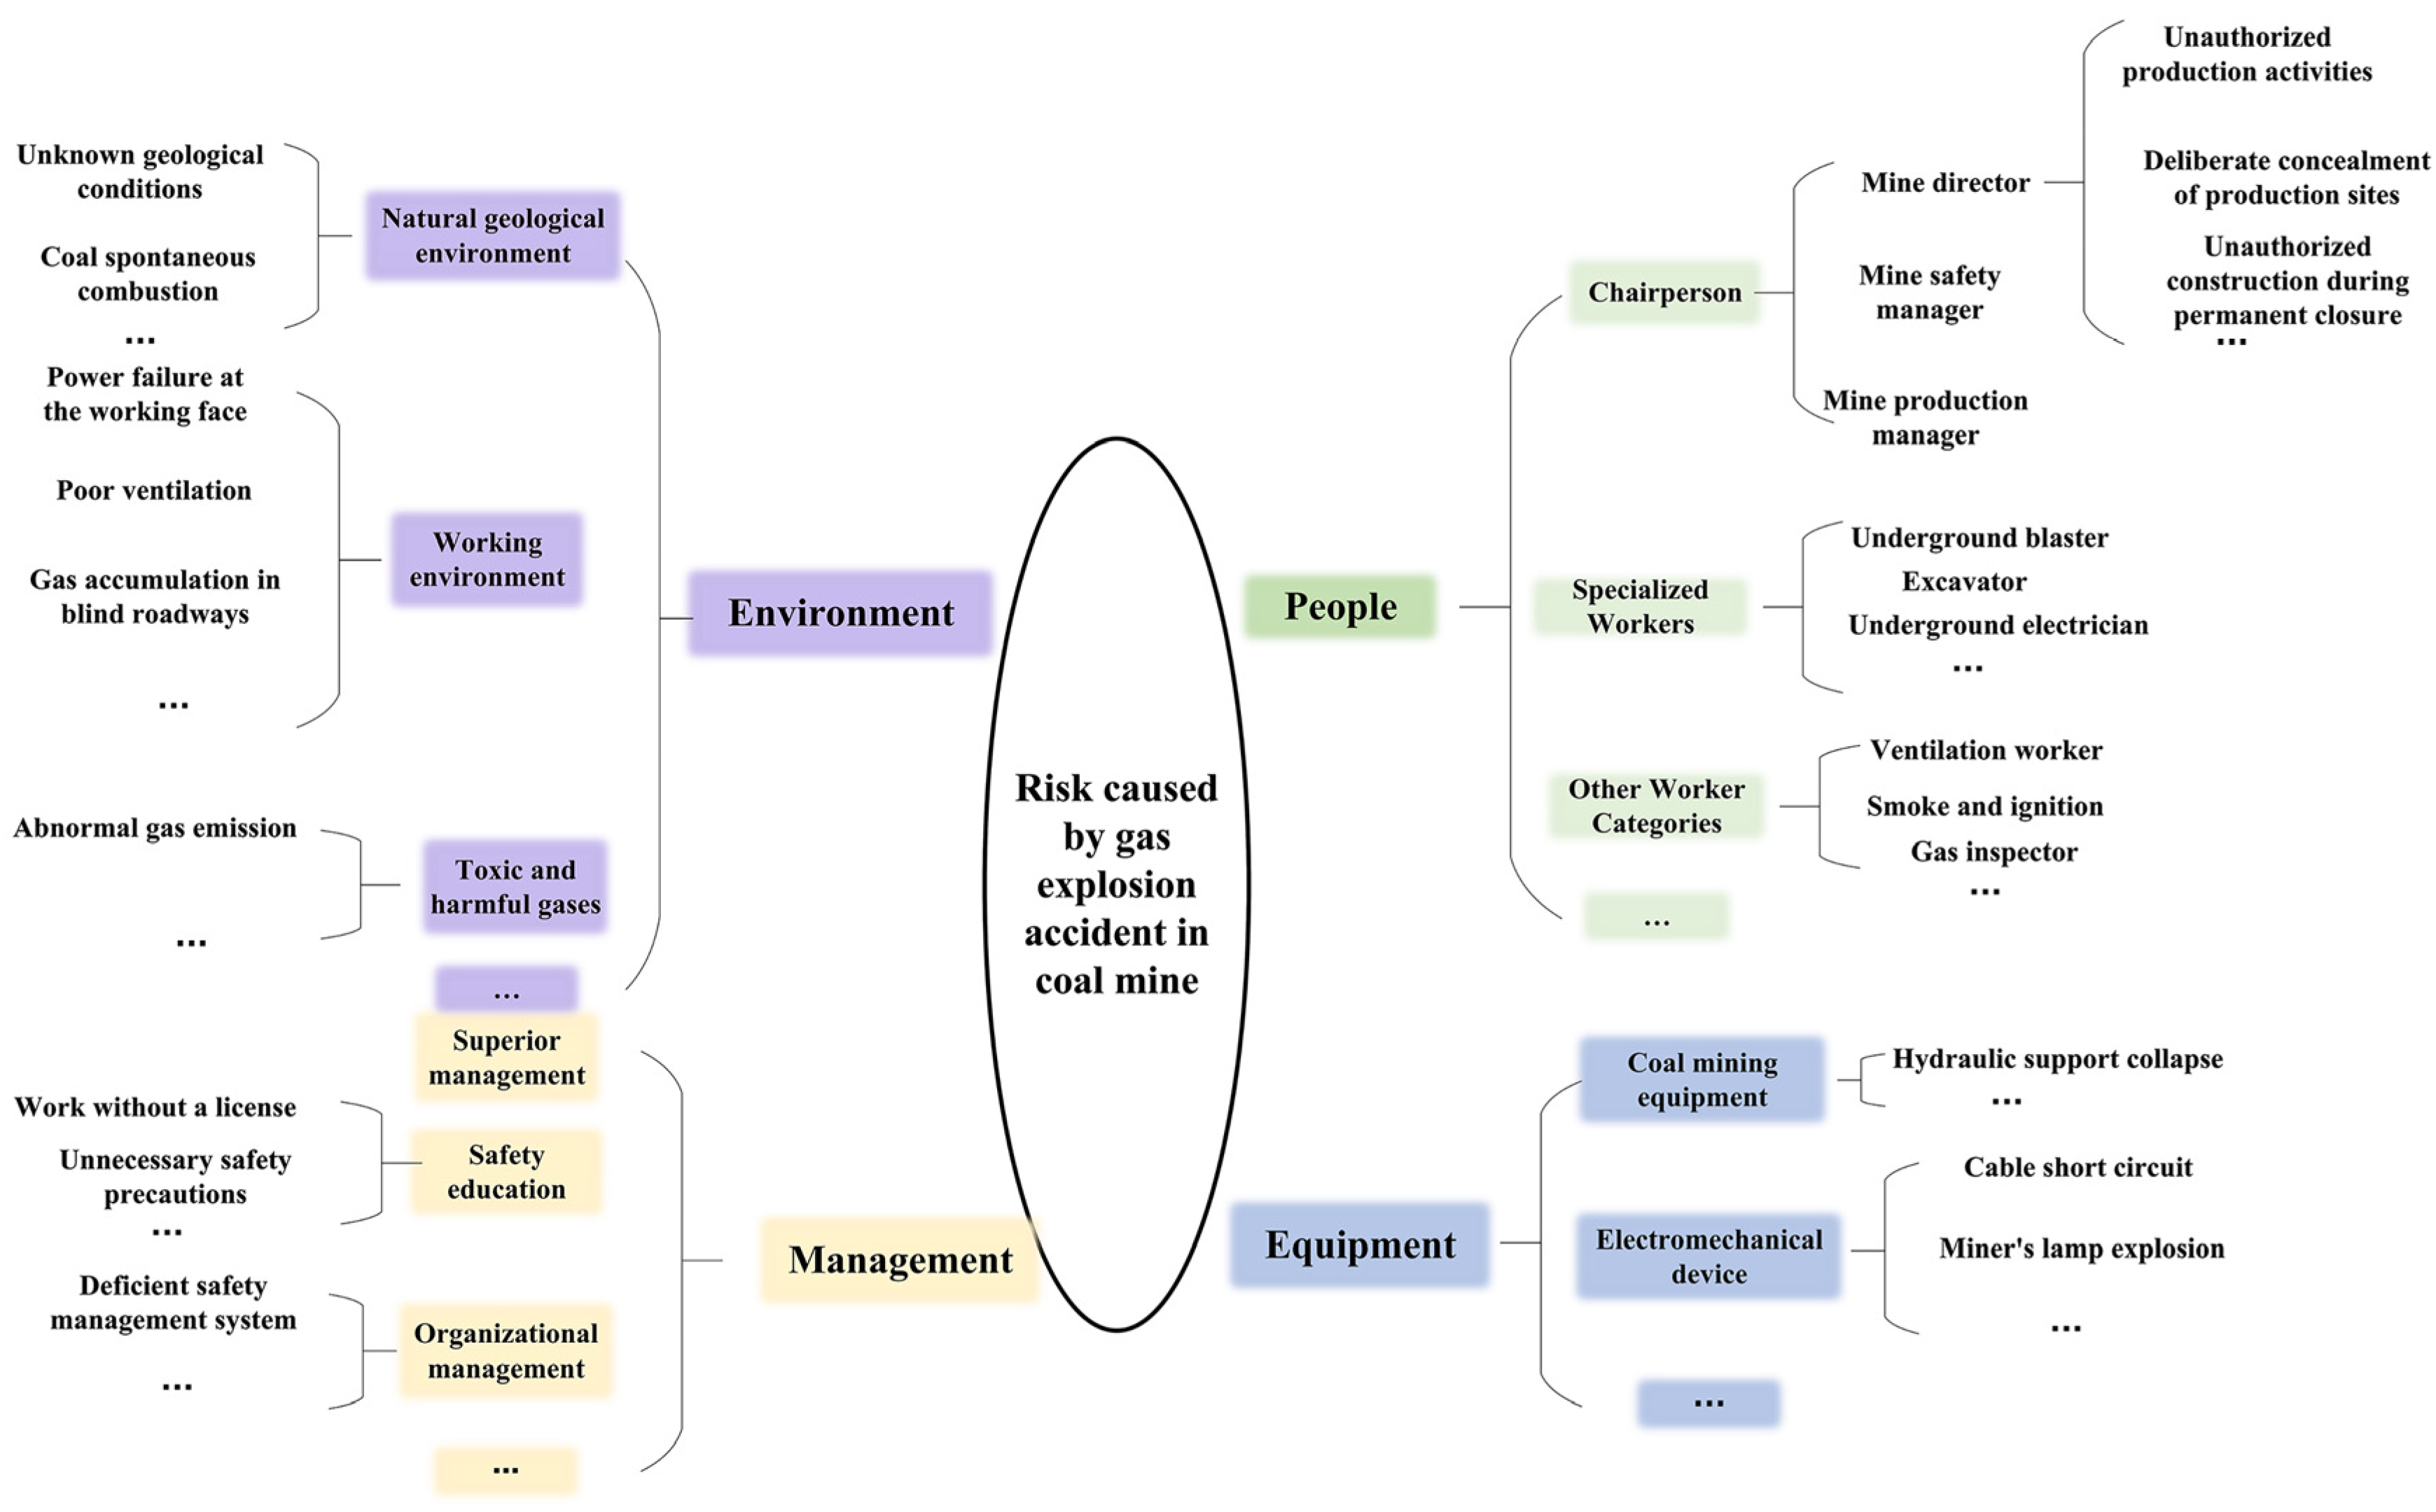
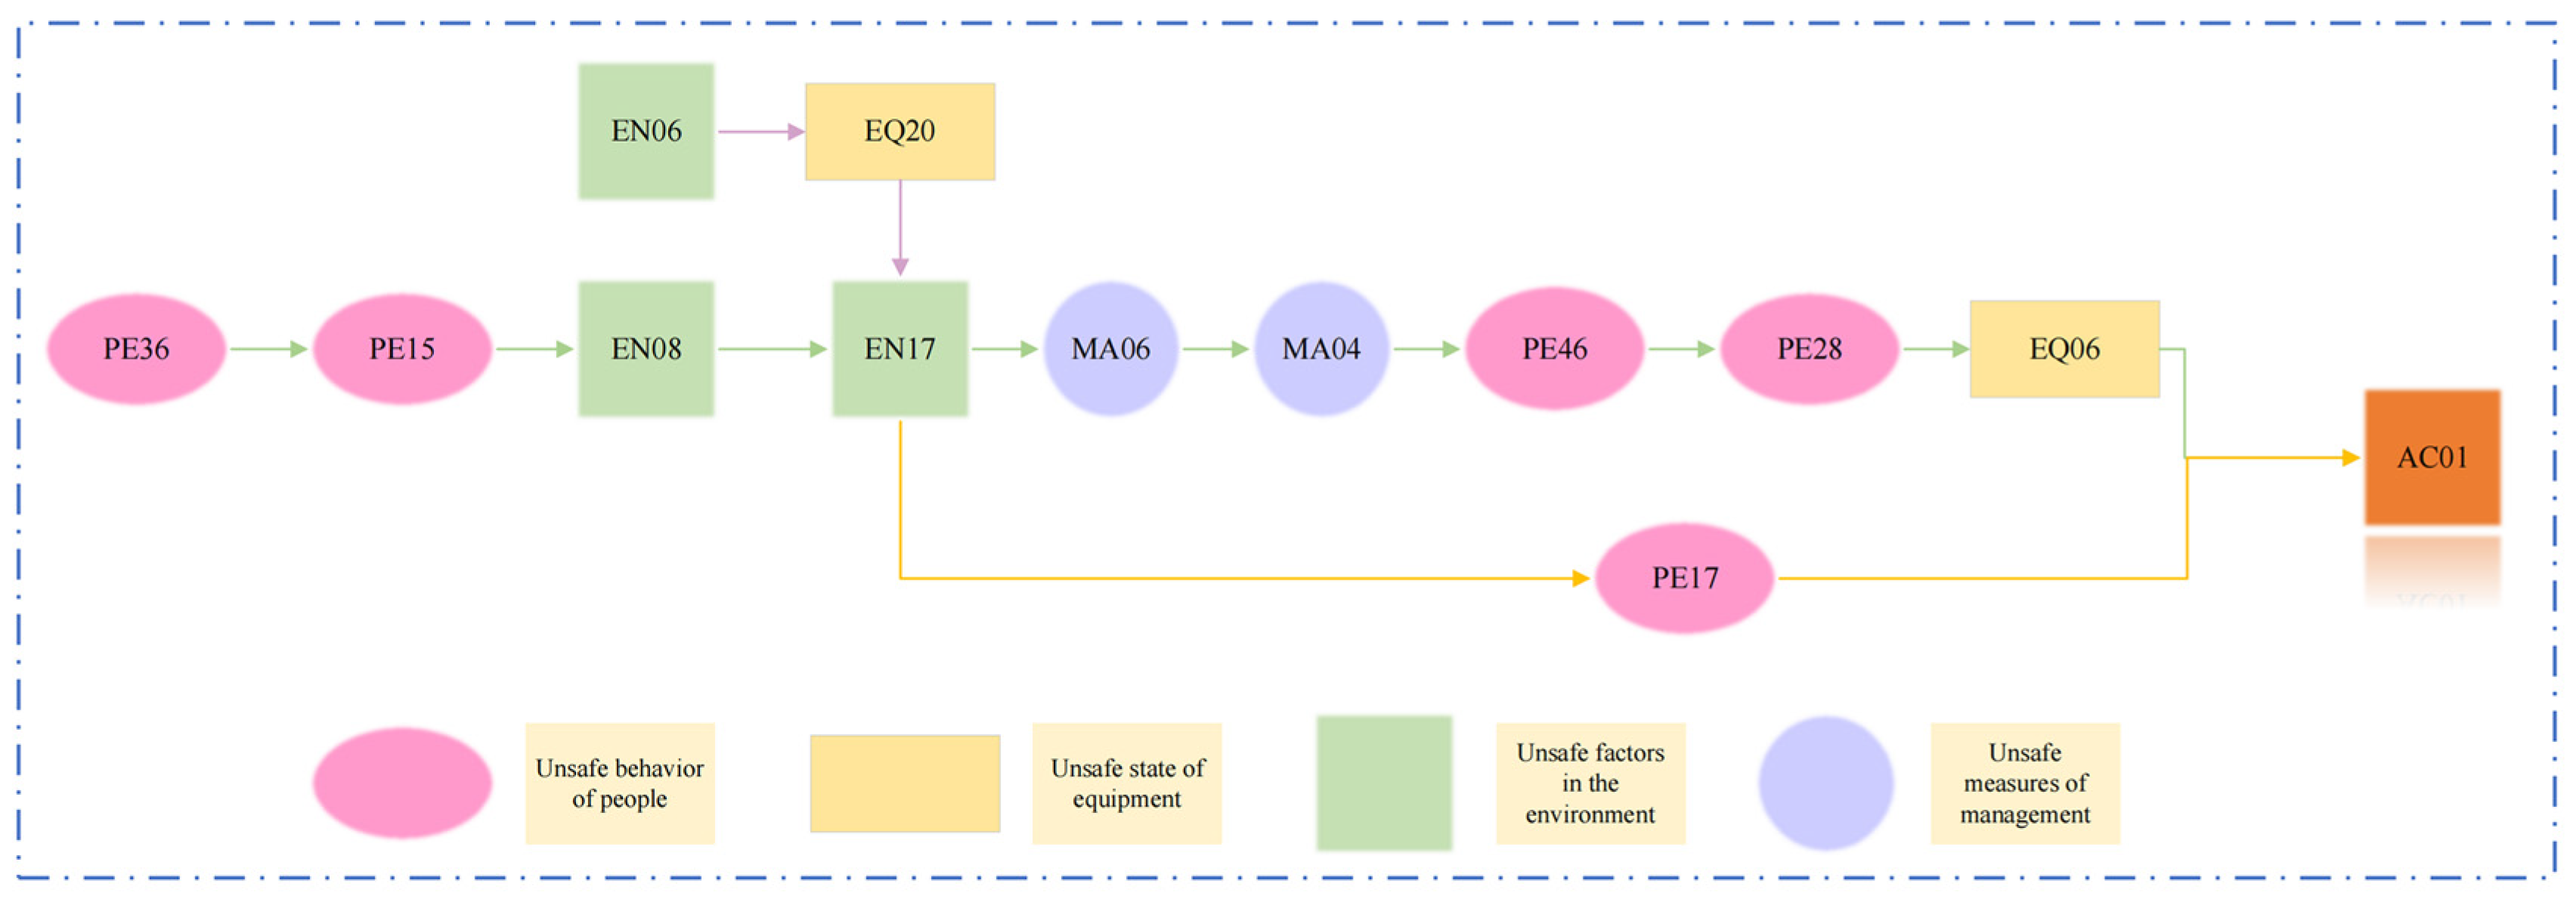
When the RSRI theory is applied to coal mine gas explosion analysis, a tree structure diagram is constructed from the root risks to illustrate human, equipment, environmental, and managerial factors. Then, each root risk is subdivided to find the corresponding state risk according to the root risk, and the risk system is finally determined. The identification process is shown in
Figure 4.
2.2. Complex Network Construction
Complex networks are widely used to describe diverse systems in nature and society [
28]. They reveal the evolutionary processes of interactions among risk factors, explain the collective behavior of complex systems, and clarify the influence of individual elements on the system. Consequently, complex network analysis has been increasingly applied to accident prevention and risk assessment. It is represented as a graph
, where
denotes the set of nodes in the network,
denotes the set of edges in the network [
29], and
represents the weight of the edge.
According to the descriptions provided in accident investigation reports, the causes of accidents are not independent of each other; rather, there is a causal relationship [
30]. A complex network is a topological description of complex systems or objects and can be used as a modeling and analysis method for identifying the correlations between various factors in the system [
31]. Complex networks include directed networks and undirected networks. In a directed network, the direction of an edge indicates causality between factors, whereas its weight represents the intensity of this relationship [
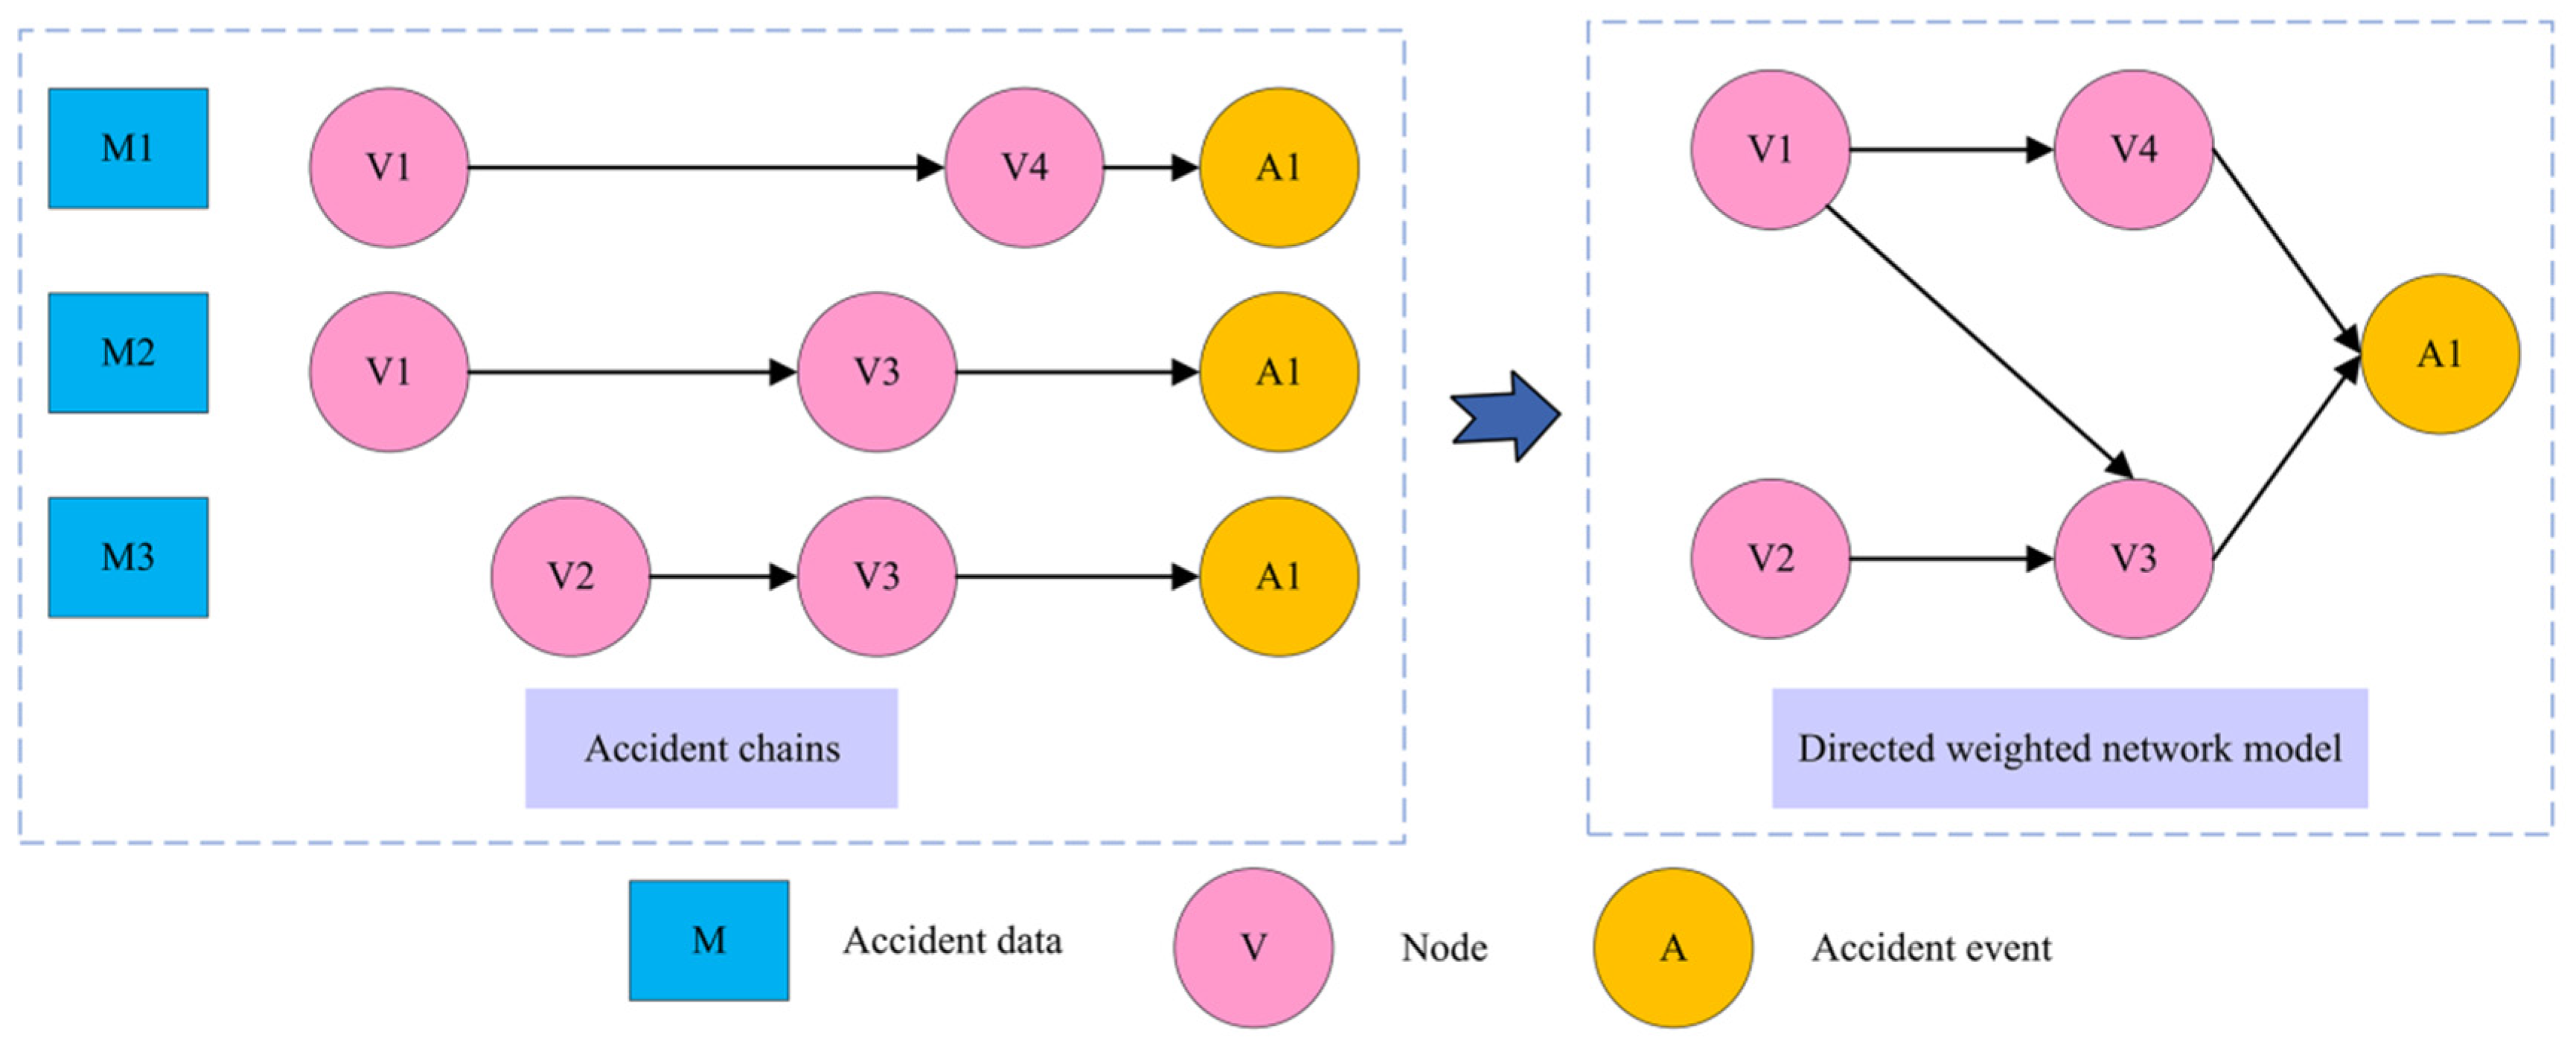
32]. Different accidents may involve similar causal factors, leading to duplicated edges in the network. The frequency of such repetitions defines the corresponding edge weight. The construction of the directed network is illustrated in
Figure 5.
An adjacency matrix is established according to the content in
Figure 5, as shown in
Table 1.
Accordingly, the
adjacency matrix
forms the basis for constructing a directed weighted network.
stands for the quantity of nodes involved in the network, and
defines the edge set that connects them:
is the weight of the edge, that is, the frequency of repeated occurrence of causality.
2.3. Causal Network Topology Analysis
In complex network analysis, the characterization of topological features usually depends on a series of statistical indicators, such as degree centrality and betweenness centrality [
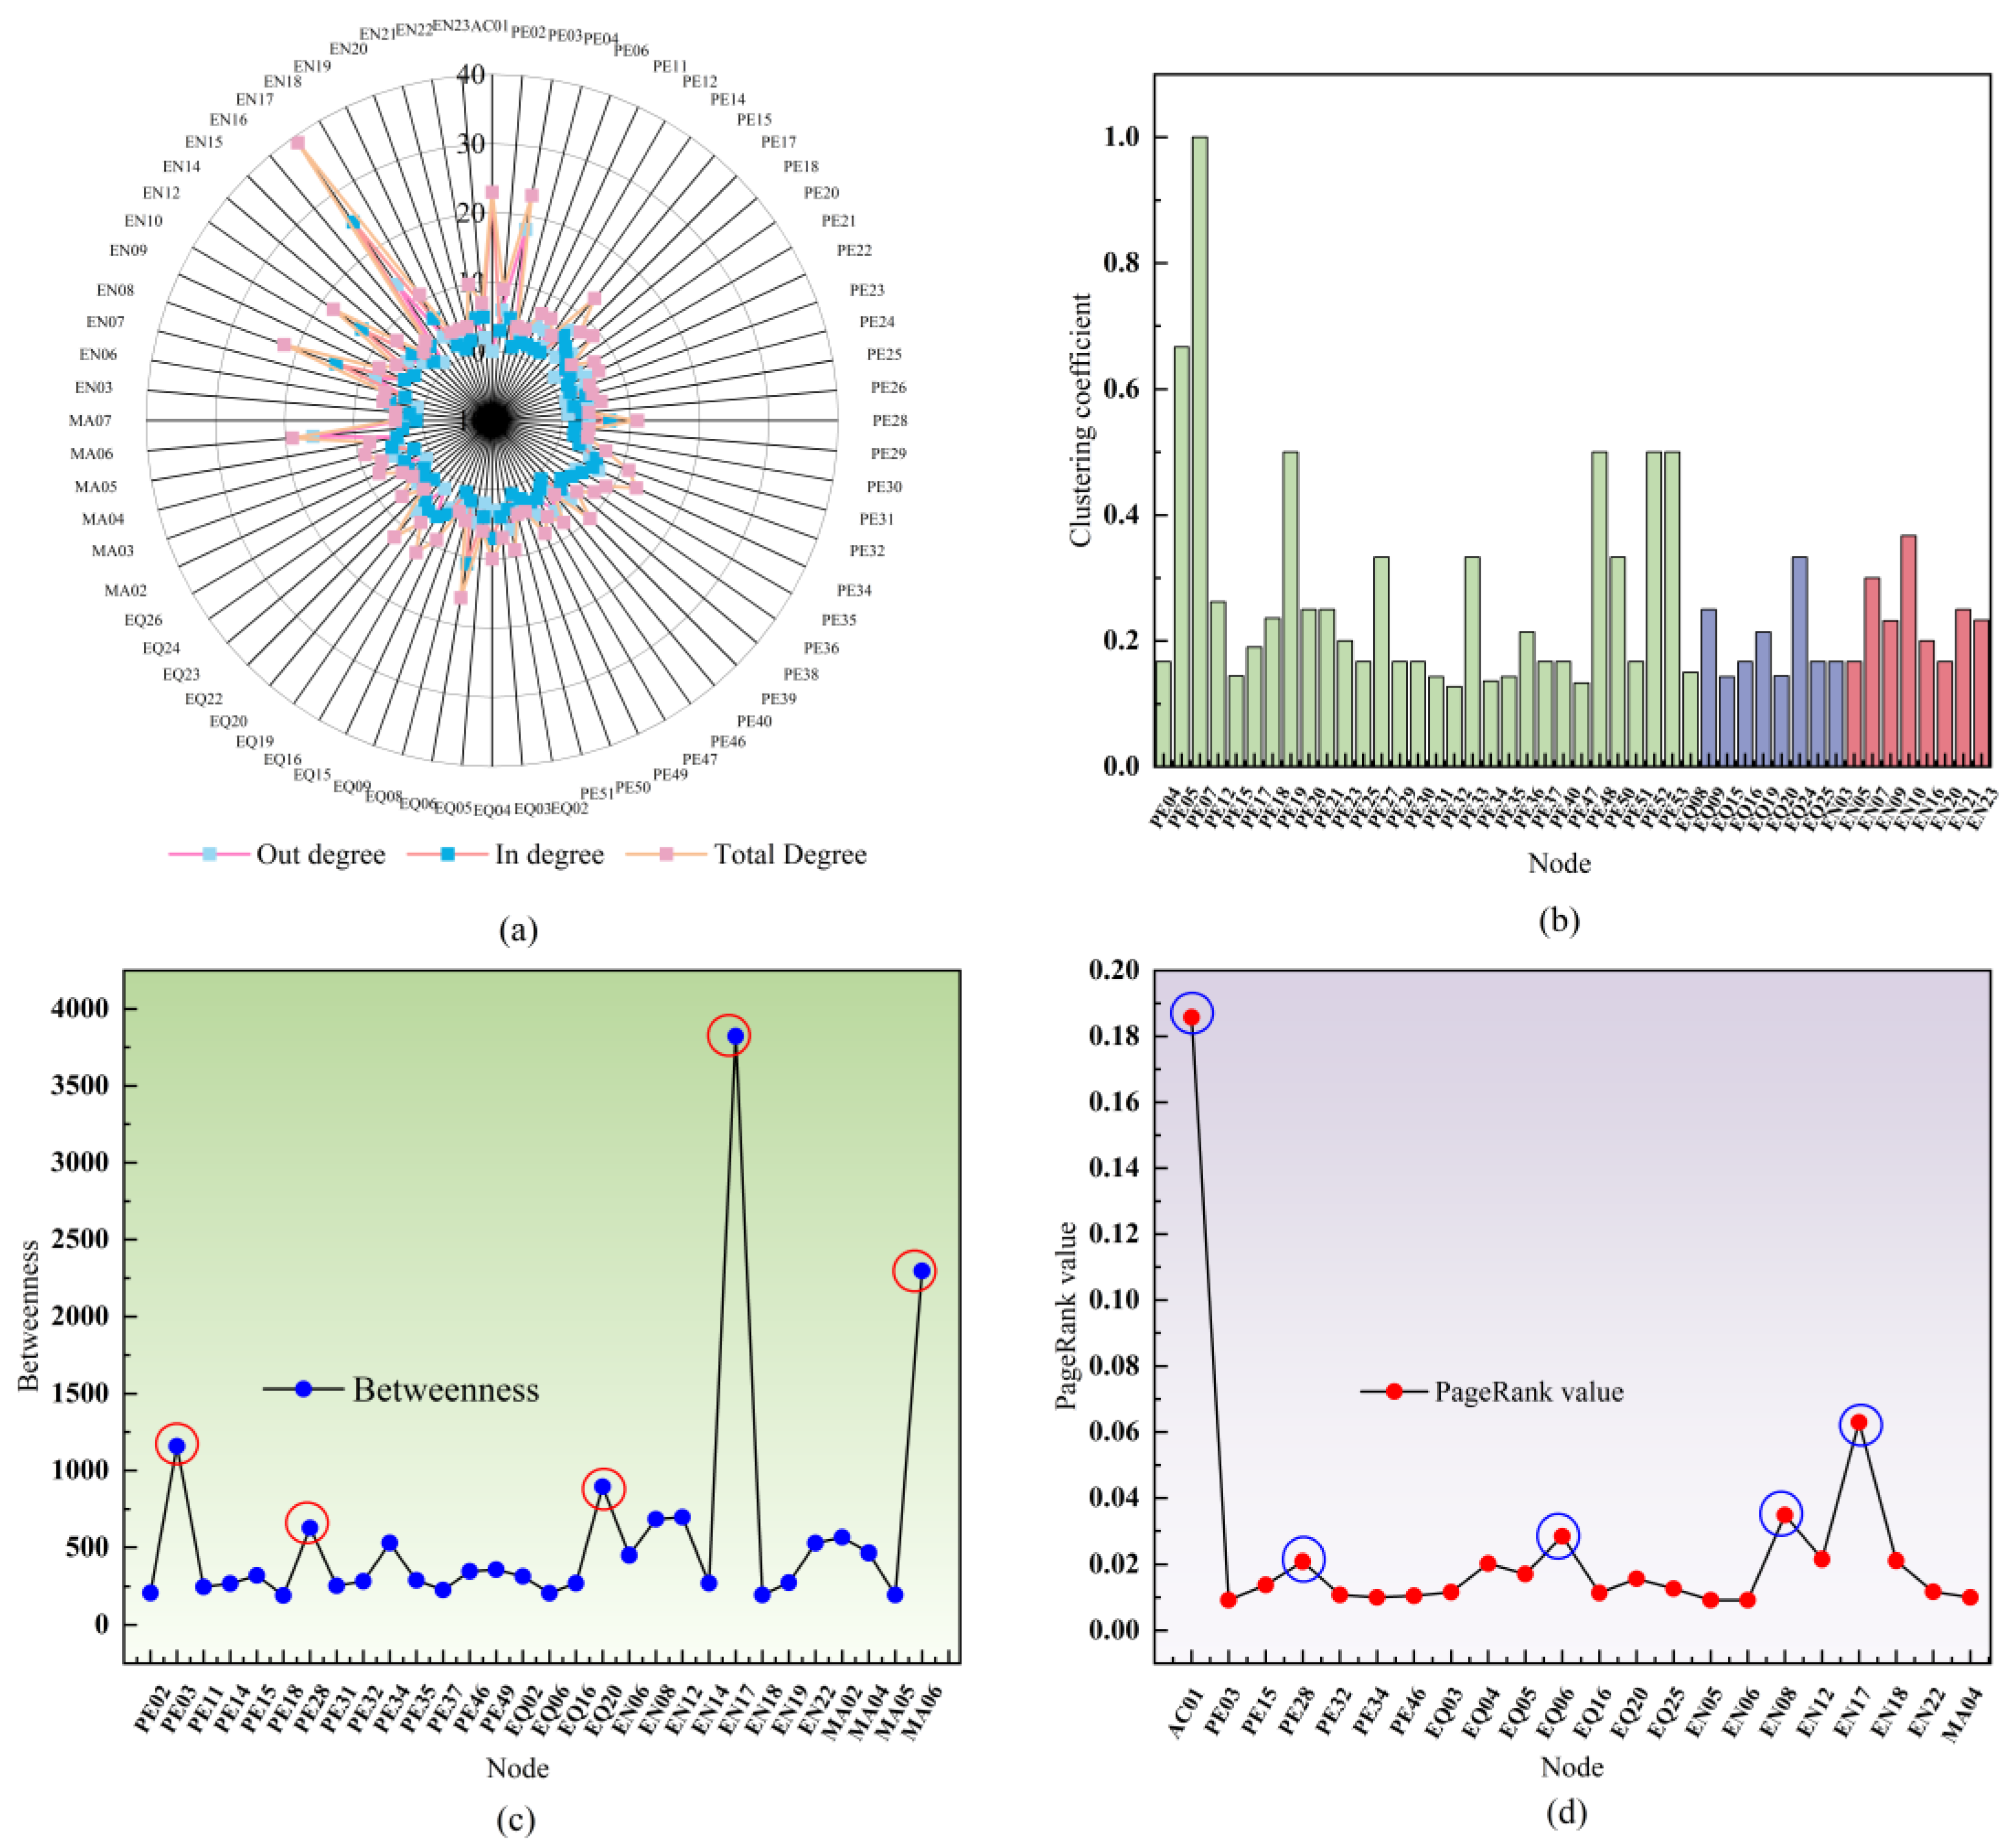
33]. By applying these indicators, the structural characteristics of the network can be revealed from different dimensions, so as to identify the key risk nodes. Therefore, in this study, four representative network indicators were selected—degree centrality, betweenness centrality, clustering coefficient, and PageRank value—to determine key risk factors. These indicators can comprehensively reflect the local and global characteristics of the network and characterize the connectivity of nodes, the control of information flow, the degree of cohesion of neighborhoods, and the influence of nodes in the overall network.
- (1)
Degree centrality
The centrality of a node is a significant indicator that quantifies its direct connectivity with other nodes in the network [
34]. In the context of coal mine safety, a node with a higher degree centrality represents a risk factor that directly interacts with multiple other hazards, indicating that it should be prioritized for preventive inspection and control. In directed networks, degree centrality is defined as the combined value of in-degree and out-degree, as presented in Equation (2):
and are the node input degree and the node output degree, respectively. is the total number of nodes in the network.
- (2)
Betweenness centrality
Betweenness centrality is defined as the frequency with which a node appears on geodesic paths between pairs of nodes within the network [
34]. This index can identify important nodes that play a role as a bridge in the network, even if their degree centrality is low. In coal mine accident evolution, a node with high betweenness centrality serves as a bridge or key transmission point in the risk propagation chain and should therefore be treated as a critical node for safety monitoring and emergency intervention, as expressed in Equation (3):
is the number of lines passing through node in the shortest path from node to node . is the shortest path number from node to node .
- (3)
Clustering coefficient
The clustering coefficient reflects the local density of connections among a node and its neighbors [
35]. As defined in Equation (4), the greater the value of the clustering coefficient, the closer it is to the surrounding nodes. In the context of coal mine safety, a high clustering coefficient indicates locally concentrated risk factors, suggesting that these regions require enhanced inspection and coordinated management to prevent chain accidents.
is the number of edges actually existing between the neighbors of node ; represents the out-degree of node .
- (4)
PageRank
Different from degree centrality and betweenness centrality, this method determines the criticality of nodes according to the input/output relationship of nodes [
36]. In coal mine safety management, a node with a higher PageRank value indicates a risk factor with strong global influence in the accident evolution process, which should be regarded as a strategic target for system-level risk control and resource allocation.
is the attenuation factor, taking 0.85 [
37];
is the out-degree of node
;
is the set of all incoming neighbors pointing to node
; and
represents the degree of node
.
2.4. Node Importance Evaluation Method
Since network indicators highlight different aspects of node significance, a comprehensive assessment is required. The existing literature often uses heuristic methods to sort the multiple centrality values of nodes and form multiple lists. A node is considered important if it appears in the top 5% of at least two lists [
38]. However, the heuristic method has certain limitations, such as ambiguity in distinguishing the relative importance of nodes. To address this, the EW-TOPSIS approach is employed in this study to integrate degree centrality, PageRank, betweenness centrality, and clustering coefficient, thereby enhancing the accuracy of node identification and enabling the generation of a comprehensive ranking of node importance.
Key node identification in complex networks can be achieved through EW-TOPSIS, which merges entropy weighting and the TOPSIS decision-making framework. To implement this method for the evaluation matrix with objects and indicators, this process consists of the following main steps.
2.4.1. Entropy Weight Method
As a quantitative approach derived from information entropy principles, the entropy weight method enables integrated evaluation across multiple criteria. It mainly reflects the uncertainty of information by calculating the entropy value of the index so as to determine the weight of each index [
39]. The calculation process can be divided into the following steps:
- (1)
Define the initial decision matrix
, in which each element
represents the score of object
under indicator
. The matrix has
objects and
indicators.
- (2)
Standardized decision matrix.
- (3)
Calculate the value of the object under the index as the proportion of the index
- (4)
Calculate the index entropy . When , ,
- (5)
Calculate the weight of each indicator ,
where
represents the information utility value of the indicator; that is, the higher the certainty of information, the greater the weight.
2.4.2. TOPSIS
TOPSIS, a classical method in multi-criteria decision-making, ranks alternatives according to how close they are to the ideal solution and how far they are from the negative ideal solution [
40]. The specific steps are as follows.
- (1)
Calculate the weighted standardization matrix. That is, each column of the standardized matrix is multiplied by the corresponding weight.
represents the weighted score of objects on indicator .
- (2)
Calculate the positive ideal solution and the negative ideal solution . The positive ideal solution is defined as the maximum value of each column in the weighted normalized matrix, whereas the negative ideal solution is defined as the corresponding minimum value.
- (3)
The Euclidean distance is used to calculate the distance between the object and the positive ideal solution and the negative ideal solution.
- (3)
Calculate the relative closeness of each decision object.
2.5. Analysis of Key Evolution Path Based on Edge Vulnerability
From the cause network of coal mine gas explosion accidents, it can be seen that the occurrence of accidents is usually the interaction of multiple risk factors, which evolve and accumulate through different paths, eventually leading to accidents. Therefore, from the perspective of the edge of the causal network, in this study, we comprehensively apply the three indicators of edge betweenness, average path length, and connectivity to determine the vulnerability of the edge, and then identify the key evolution path.
- (1)
Edge betweenness
Edge
is characterized by the count of shortest paths traversing it, which reflects the extent of its influence in the coal mine gas explosion accident cause network [
41]. If a certain edge
is removed, the larger the value of
is, the more significant the contribution of edge
to risk evolution is, and the easier it is to cause accidents.
- (2)
Average path length
This is used to represent the evolution speed of coal mine gas explosion accidents in the network [
42]. The influence of each side on the accident evolution is determined by comparing the change in
after removing some edges in the network. If a certain edge
is removed, the larger the value of
is, the more significant the effect of edge
on risk evolution is, and the easier it is to cause accidents.
denotes the number of edges in the shortest path from node to node ; means that only those node pairs with the shortest path are considered—that is, node to node are reachable.
- (3)
Connectedness
Connectedness denotes the ratio of nodes connected to node
relative to the total number of nodes in the network, reflecting the stability of the coal mine gas explosion accident evolution network [
43]. The larger the value of
, the more difficult it is for the accident evolution network to be destroyed. When edge
is removed, a smaller
value indicates a greater impact of this edge on risk evolution and a higher likelihood of accidents.
- (4)
Vulnerability of the edge
Edge vulnerability is used to indicate the importance of edge
in the network and the degree of influence on the network. Connectivity
, average path length
and edge betweenness
are selected to comprehensively evaluate the vulnerability of edge
in the network.
