Article

Distribution Model of Wellbore Collapse Pressure in Deviated Wells Considering Fracture Development and Engineering Applications

1
Wulumuqi China Sinopec Northwest Oilfield Company, Urumqi 830011, China
2
National Key Laboratory of Oil and Gas Reservoir Geology and Exploitation, Chengdu Southwest Petroleum University, Chengdu 610500, China
*
Author to whom correspondence should be addressed.
Processes 2025, 13(12), 3769; https://doi.org/10.3390/pr13123769
Submission received: 4 September 2025 / Revised: 20 September 2025 / Accepted: 26 September 2025 / Published: 21 November 2025
(This article belongs to the Topic Petroleum and Gas Engineering, 2nd edition)

Abstract

During drilling in fractured formations, wellbore instability issues such as fluid loss and collapse frequently occur, severely compromising drilling safety. Traditional criteria such as Mohr–Coulomb often fail to adequately account for fracture effects, leading to inaccurate collapse pressure predictions. Taking the Tahe Oilfield as a case study, this research develops an enhanced model for predicting wellbore collapse pressure in fractured formations. Based on principles of elastic mechanics and Biot’s effective stress theory, a stress distribution model around deviated wellbores is established. The single weak plane strength criterion is integrated with the Mohr–Coulomb criterion to characterize failure mechanisms in both fractured zones and intact rock matrix. Newton’s iterative method, implemented in MATLAB, is employed to solve for collapse pressure, and a sensitivity analysis is conducted to evaluate the influence of factors such as in situ stresses and fracture orientation. A case study from Well THX demonstrates that neglecting fractures results in a symmetrical collapse pressure profile and an unduly narrow safe mud weight window. In contrast, accounting for fractures significantly increases the required mud weight and identifies an optimal azimuth range for enhancing wellbore stability. The Mohr–Coulomb criterion is shown to underestimate the necessary mud weight, which aligns with actual wellbore collapse incidents encountered during drilling. The single weak plane criterion offers more accurate predictions, recommending a higher minimum mud density and an optimized well trajectory to mitigate drilling risks. These findings offer theoretical and practical guidance for mitigating wellbore instability in fractured formations.

1. Introduction

Wellbore stability analysis is a complex interdisciplinary issue involving rock mechanics, geomechanics, flow mechanics, and other fields [1,2,3,4,5]. Traditional wellbore stability models commonly assume the formation to be a continuous medium, treating it as either isotropic or transversely isotropic, and typically adopt strength criteria such as Mohr–Coulomb (MC) or Drucker–Prager (DP) to evaluate wellbore integrity [6,7,8,9,10]. However, both field observations and laboratory experiments have shown that in heavily fractured formations, such models significantly underestimate the required collapse pressure. Consequently, drilling fluid densities designed based on these conventional approaches often prove insufficient to ensure adequate wellbore support [11,12,13]. A major limitation of these models lies in their inability to adequately account for the influence of fractures on near-wellbore stress distribution and rock strength anisotropy [14,15,16]. Fractures not only compromise rock mass integrity and modify the local stress field, but also promote the infiltration of drilling fluid [17,18,19]. This infiltration triggers a range of physicochemical interactions—including pore pressure transmission, reduction in effective stress, and hydraulic softening of fracture surfaces—which collectively elevate the risk of wellbore instability [20].
In recent years, scholars both domestically and internationally have gradually recognized the controlling effect of fractures on wellbore stability and have conducted extensive research [21,22,23]. The single plane of weakness criterion, proposed by Jaeger [24], provides a theoretical foundation for evaluating strength anisotropy in fractured rocks. It accounts for two distinct failure modes: shear failure through the intact rock matrix and slip failure along pre-existing fracture surfaces. Subsequent research has further developed and applied this framework. For example, Singh et al. [11] combined the Mogi–Coulomb criterion with the single plane of weakness model to analyze wellbore stability in anisotropic formations. Their findings revealed that when the intermediate principal stress was taken into account, the predicted size of the plastic zone was 13–20% smaller than that obtained using the Mohr–Coulomb criterion. Meanwhile, McLean et al. [25] and Plazas [26] adopted the Lekhnitskii–Amadei analytical solution to compute near-wellbore stresses in transversely isotropic formations and applied a true triaxial failure criterion to forecast wellbore collapse pressure, underscoring the necessity of coupled elastic and strength anisotropy analysis. From an engineering perspective, multiple studies have highlighted that the orientation and intensity parameters of fractures are key factors governing wellbore stability [27,28,29,30]. Zhang et al. [31,32,33,34,35] demonstrated through an analytical model that the relative orientation between the wellbore trajectory and the in situ stress direction significantly affects the distribution of collapse pressure. They found that ignoring shear stress could result in a prediction error exceeding 10% in well inclination angle under reverse fault stress regimes. Cao et al. [9] employed a three-dimensional finite difference model to simulate drilling in fractured shale formations. Their simulations revealed that at high well inclination angles (>45°), the failure zone around the wellbore transitions from a symmetric to an asymmetric pattern aligned with fracture direction. They also emphasized the critical role of drilling fluid sealing capacity in restraining the propagation of the failure zone. Dokhani et al. [10] incorporated chemo–mechanical coupling between shale and water-based drilling fluids, developing a model for moisture adsorption and diffusion. Their results showed that hydration-induced strength degradation on fracture surfaces can reduce the safe mud weight window by more than 40%.
Despite significant advancements in existing research, several limitations remain. Most current models are developed for vertical wells or specific fracture orientations, failing to comprehensively address the coupling effects between arbitrarily oriented fractures and complex in situ stress fields in deviated or horizontal wells [36]. Numerous studies continue to employ simplified models such as the Mohr–Coulomb (MC) criterion. While practical, these models are unable to simultaneously and accurately represent both rock matrix failure and fracture plane slip mechanisms, and they frequently neglect the effect of the intermediate principal stress [37,38,39]. Moreover, a significant gap persists between theoretical advances and practical field applications, owing particularly to the scarcity of customized models and validated case studies tailored to region-specific geological conditions [40,41,42,43,44,45]. To address this challenge, the present study investigates fractured formations in the Tahe Oilfield of the Tarim Basin, leveraging field data from Well THX to construct a predictive model of collapse pressure distribution for deviated wells. The research begins by deriving an analytical near-wellbore stress model for arbitrary well trajectories based on elastic mechanics and Biot’s effective stress principle. Subsequently, the Single Weak Plane Strength Criterion is combined with the Mohr–Coulomb criterion to independently evaluate the potential for shear failure within the intact rock matrix and along pre-existing fracture planes. Using MATLAB R2024a, the Newton’s iterative method is employed to efficiently compute critical collapse pressures at various wellbore orientations and generate corresponding polar plots. Finally, a parametric sensitivity analysis is conducted to assess the influence of in situ stress, fracture orientation, and rock strength parameters on the safe mud weight window. The model’s accuracy is validated through comparison with actual drilling data. The findings of this study aim to provide a theoretical basis and technical support for drilling fluid density design and well trajectory optimization in the Tarim Basin and other similar fractured formations. This research holds significant practical value for reducing drilling risks and enhancing the efficiency of shale gas development.

2. Methodology

2.1. Stress Distribution Model Around Deviated Wellbores

The linear elastic model is conceptually clear and mathematically straightforward, requiring a limited set of parameters that can be reliably determined through laboratory experiments. This model offers an efficient and practical framework for characterizing the role of the dominant factor—stress—in wellbore instability. In contrast, the poroelastic wellbore stress model is inherently more complex, demanding a large number of input parameters, many of which are difficult to measure experimentally. This not only complicates field application but also introduces considerable uncertainty and potential errors into the prediction outcomes. Under the assumption that the rock behaves as a perfectly homogeneous, linear elastic medium, the stress distribution around a wellbore in polar coordinates is derived through a series of coordinate transformations. First, the in situ stresses are transformed from their initial reference system to the geodetic coordinate system [46,47,48,49]. They are then converted into the wellbore Cartesian coordinate system and finally into the polar coordinate system centered on the wellbore. The detailed procedure for these stress transformations is outlined below.

2.1.1. Coordinate Transformation

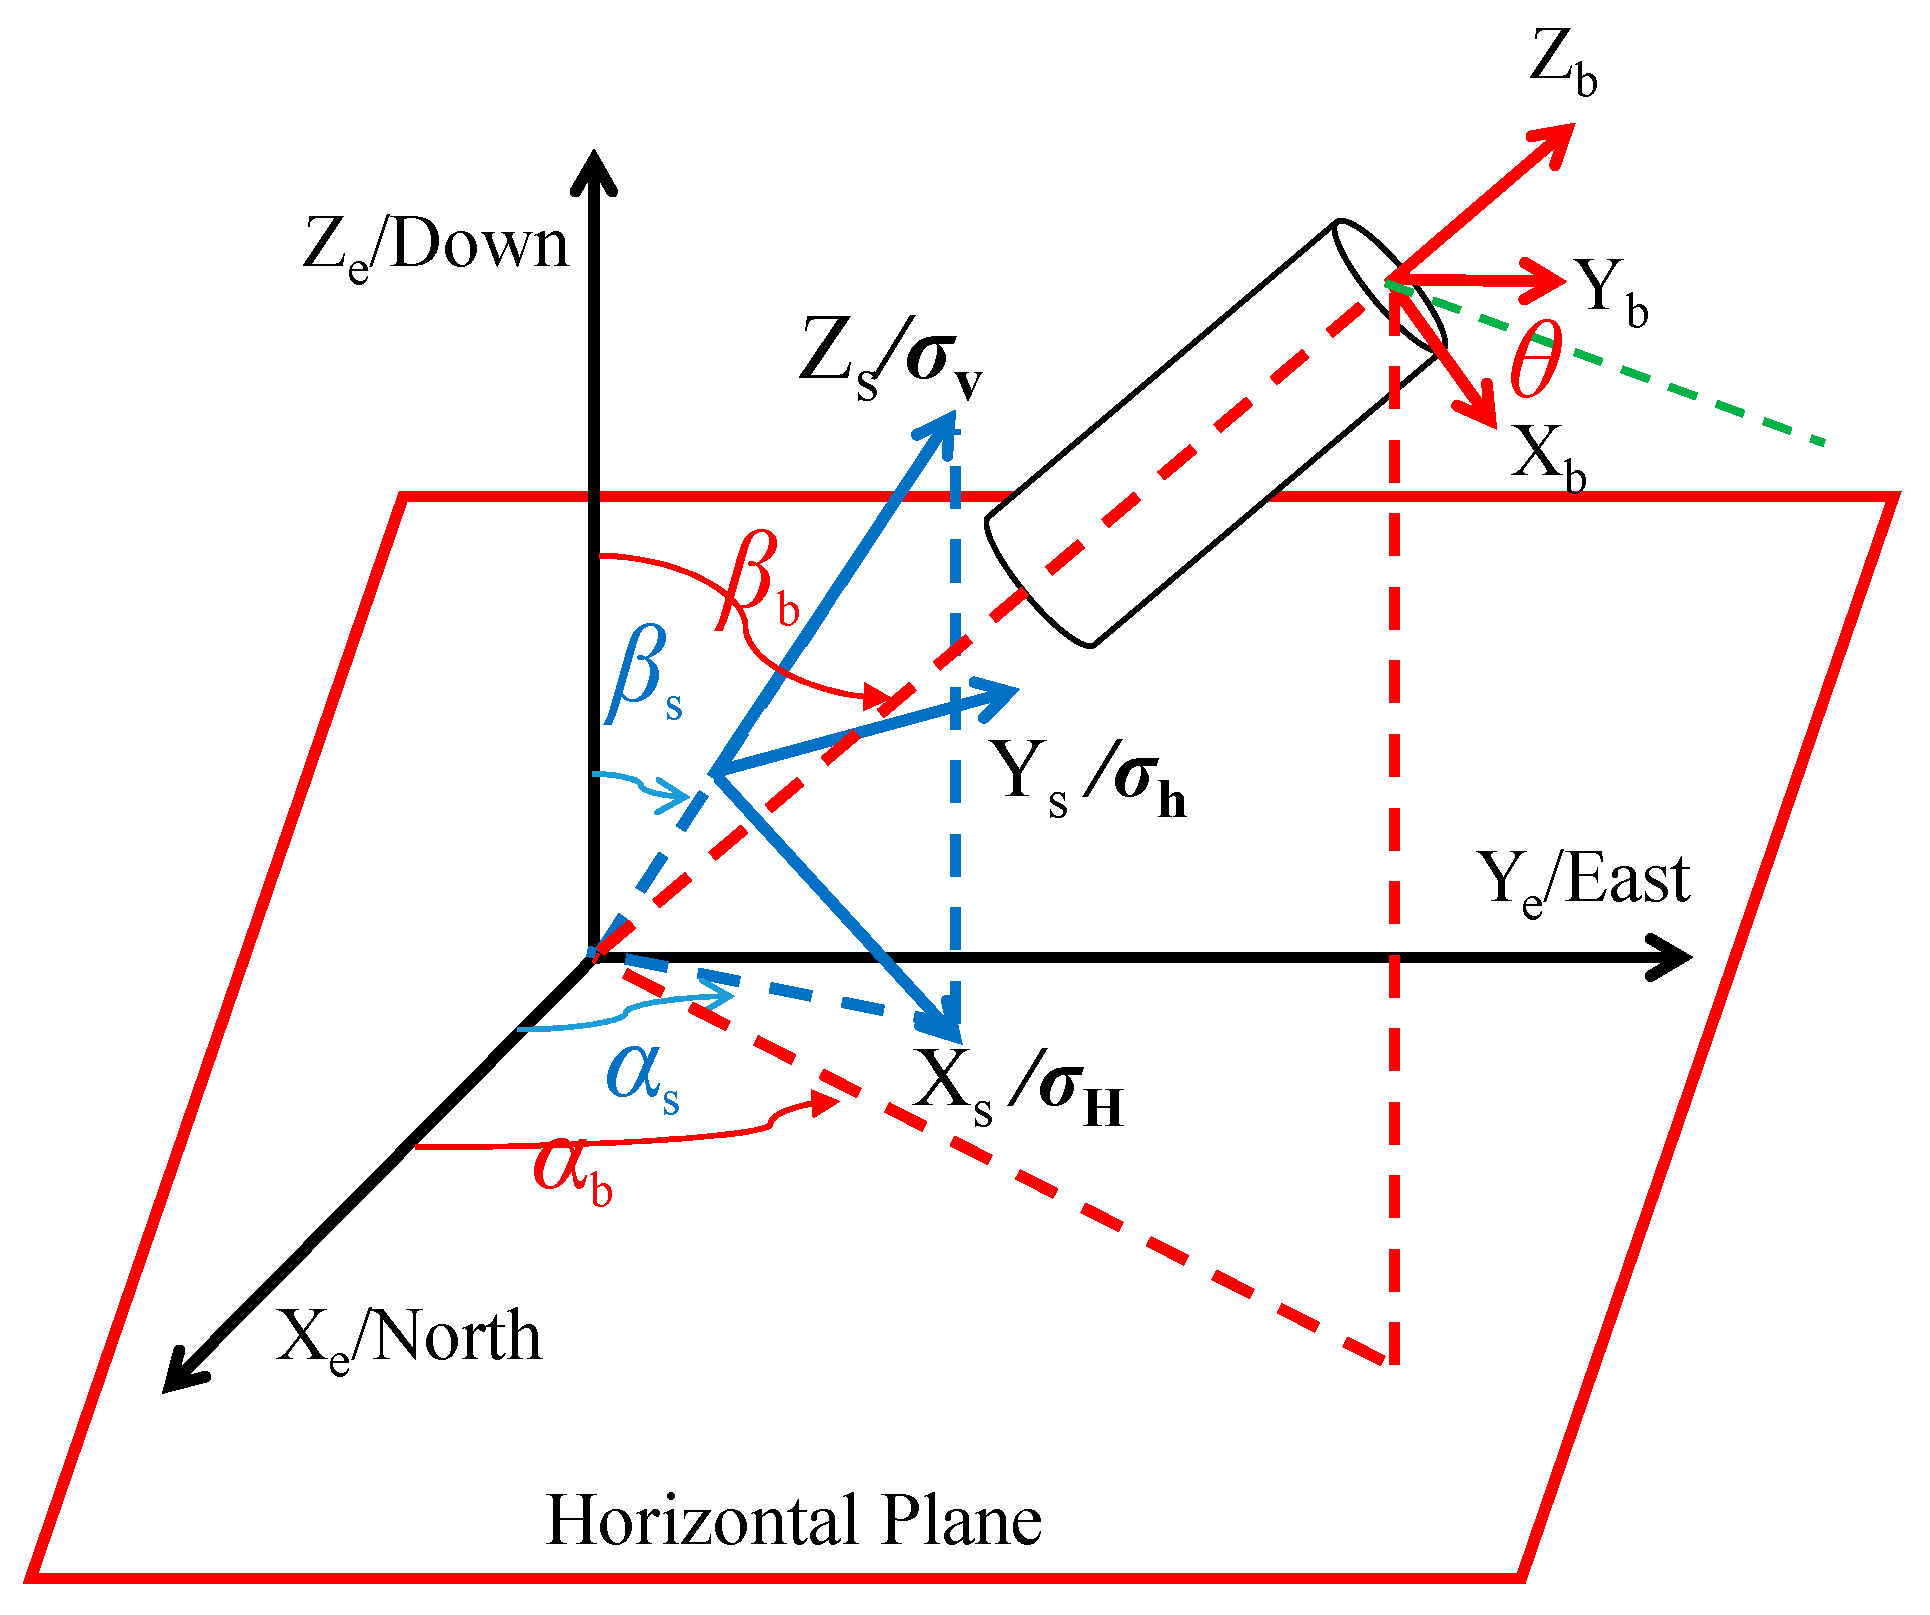
After the formation is drilled, the boundary stresses acting on the surrounding rock of the wellbore are illustrated in Figure 1 [31]. The exterior of the wellbore is subjected to three mutually perpendicular in situ stresses, while the interior is under the pressure of the drilling fluid column. Additionally, the formation pore pressure also exerts an influence [50,51,52]. To determine the stress distribution around a wellbore of arbitrary trajectory, four coordinate systems are established: the geodetic coordinate system ( X e , Y e , Z e ), the in situ stress coordinate system ( X s , Y s , Z s ), the wellbore Cartesian coordinate system ( X b , Y b , Z b ), and the wellbore cylindrical coordinate system ( r , θ , z ), as shown in Figure 2 [31]. The coordinate axis Xe is set to point toward true north, and the coordinate axis Ye is parallel to the east direction. The coordinate axes X s , Y s , Z s are parallel to σ H , σ h , σ v . The azimuth of the maximum horizontal in situ stress α s is designated as the angle between its direction and true north. The projection of the wellbore axis on the horizontal plane and its angle with true north is defined as the wellbore azimuth angle α b [53,54,55,56,57]. The angle between the overburden pressure and the coordinate axis Ze is defined as the dip angle of the vertical in situ stress β s . In structurally complex formations the vertical in situ stress may not be vertical, but in general cases the vertical stress is oriented vertically, meaning β s = 0°. The angle between the wellbore axis and the vertical direction is defined as the well inclination angle β b .
Based on the above definitions, according to coordinate transformation theory, the in situ stresses are transformed into the geodetic coordinate system, as shown in Equation (1):
σ e = E T × σ i c s × E
where σ i c s is the in situ stress matrix, E is the transformation matrix, and ET is the transpose of matrix E, as given in Equation (2),
E = cos α s cos β s sin α s cos β s sin β s sin α s cos α s 0 cos α s sin β s sin α s sin β s cos β s
The in situ stresses are then transformed from the geodetic coordinate system to the wellbore Cartesian coordinate system, as expressed by Equation (3):
σ b = B × σ e × B T
In the equation, the expression for the transformation matrix B is given by Equation (4):
B = cos α b cos β b sin α b cos β b sin β b sin α b cos α b 0 cos α b sin β b sin α b sin β b cos β b
Finally, the stress components of the in situ stresses in the wellbore Cartesian coordinate system can be obtained as shown in Equation (5):
σ x x = σ H cos 2 β b cos 2 α b α s + σ h cos 2 β b sin 2 α b α s + σ v sin 2 β b σ y y = σ H sin 2 α b α s + σ h cos 2 α b α s σ z z = σ H sin 2 β b cos 2 α b α s + σ h sin 2 β b sin 2 α b α s + σ v cos 2 β b τ x y = σ H cos β b cos α b α s sin α b α s + σ h cos β b cos α b α s sin α b α s τ y z = σ H sin β b cos α b α s sin α b α s + σ h sin β b cos α b α s sin α b α s τ x z = σ H cos β b sin β b cos 2 α b α s + σ h cos β b sin β b sin 2 ω σ v cos β b sin β b
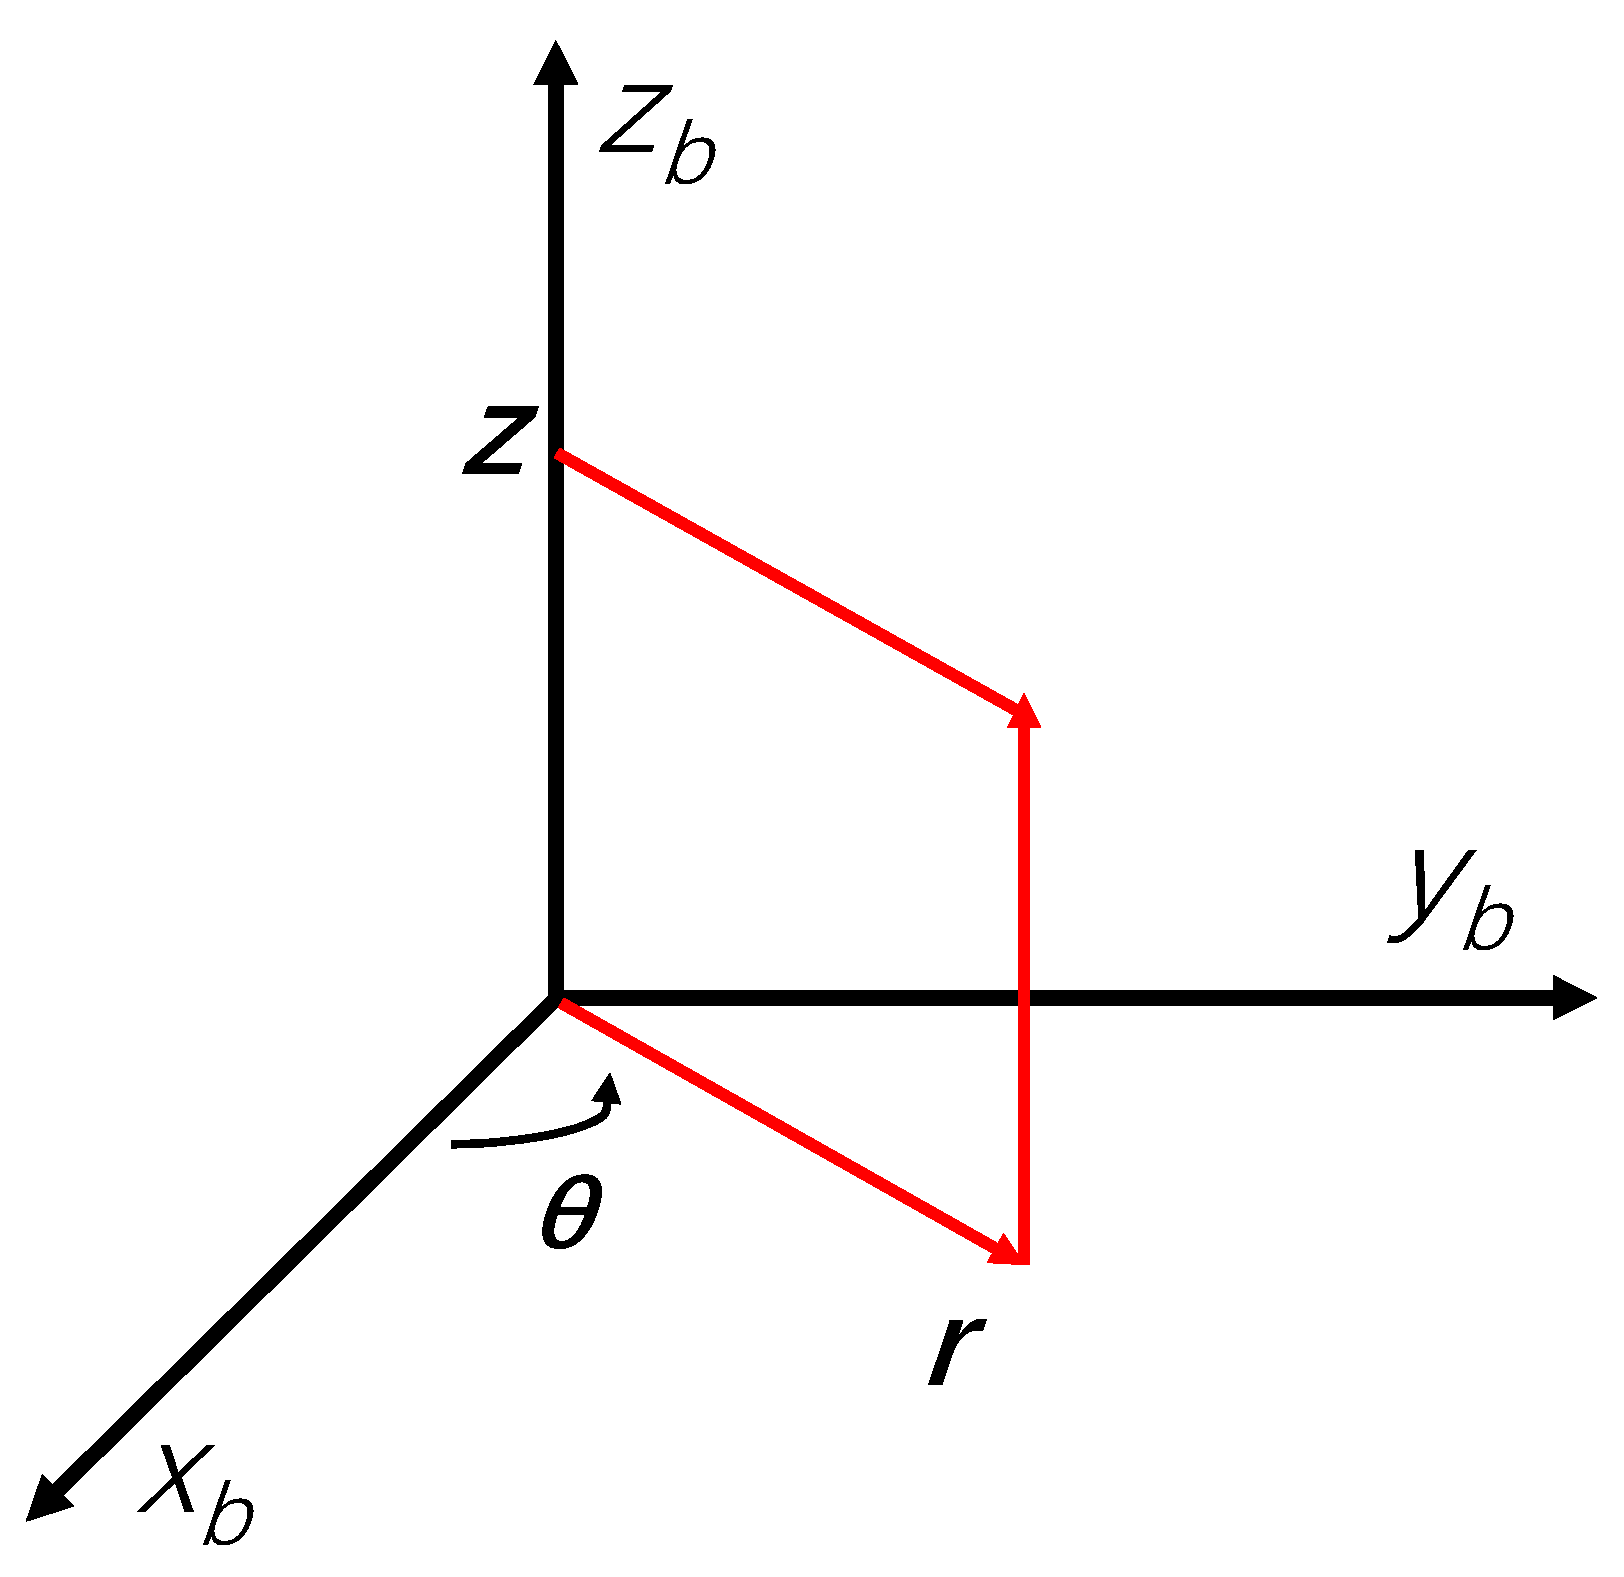
The wellbore stress matrix expressed in the polar coordinate system is more convenient to use. Therefore, the wellbore stress components in the Cartesian coordinate system ( X b , Y b , Z b ) are typically transformed into the wellbore stress components in the polar coordinate system ( r , θ , z ). Figure 3 illustrates the transformation of an arbitrary point from the Cartesian coordinate system to the polar coordinate system [31]. The functional relationship between the variables of the two coordinate systems is given by Equation (6):
r = x 2 + y 2 θ = arctan y / x x = r cos θ y = r sin θ
Through coordinate transformation from Cartesian to polar systems, the in situ stresses defined in the wellbore Cartesian coordinate system (Equation (5)) are transformed into the corresponding stress components in the wellbore polar coordinate system, as expressed in Equation (7). This equation describes the stress state in polar coordinates at any point within the formation prior to drilling:
σ r = σ x x cos 2 θ + σ y y sin 2 θ + τ x y sin 2 θ σ θ = σ x x sin 2 θ + σ y y cos 2 θ τ x y sin 2 θ τ r θ = 0.5 σ x x sin 2 θ + 0.5 σ y y sin 2 θ + τ x y cos 2 θ τ θ z = τ y z cos θ τ x z sin θ τ r z = τ y z sin θ + τ x z cos θ σ z = σ z z

2.1.2. Wellbore Stress Distribution Model

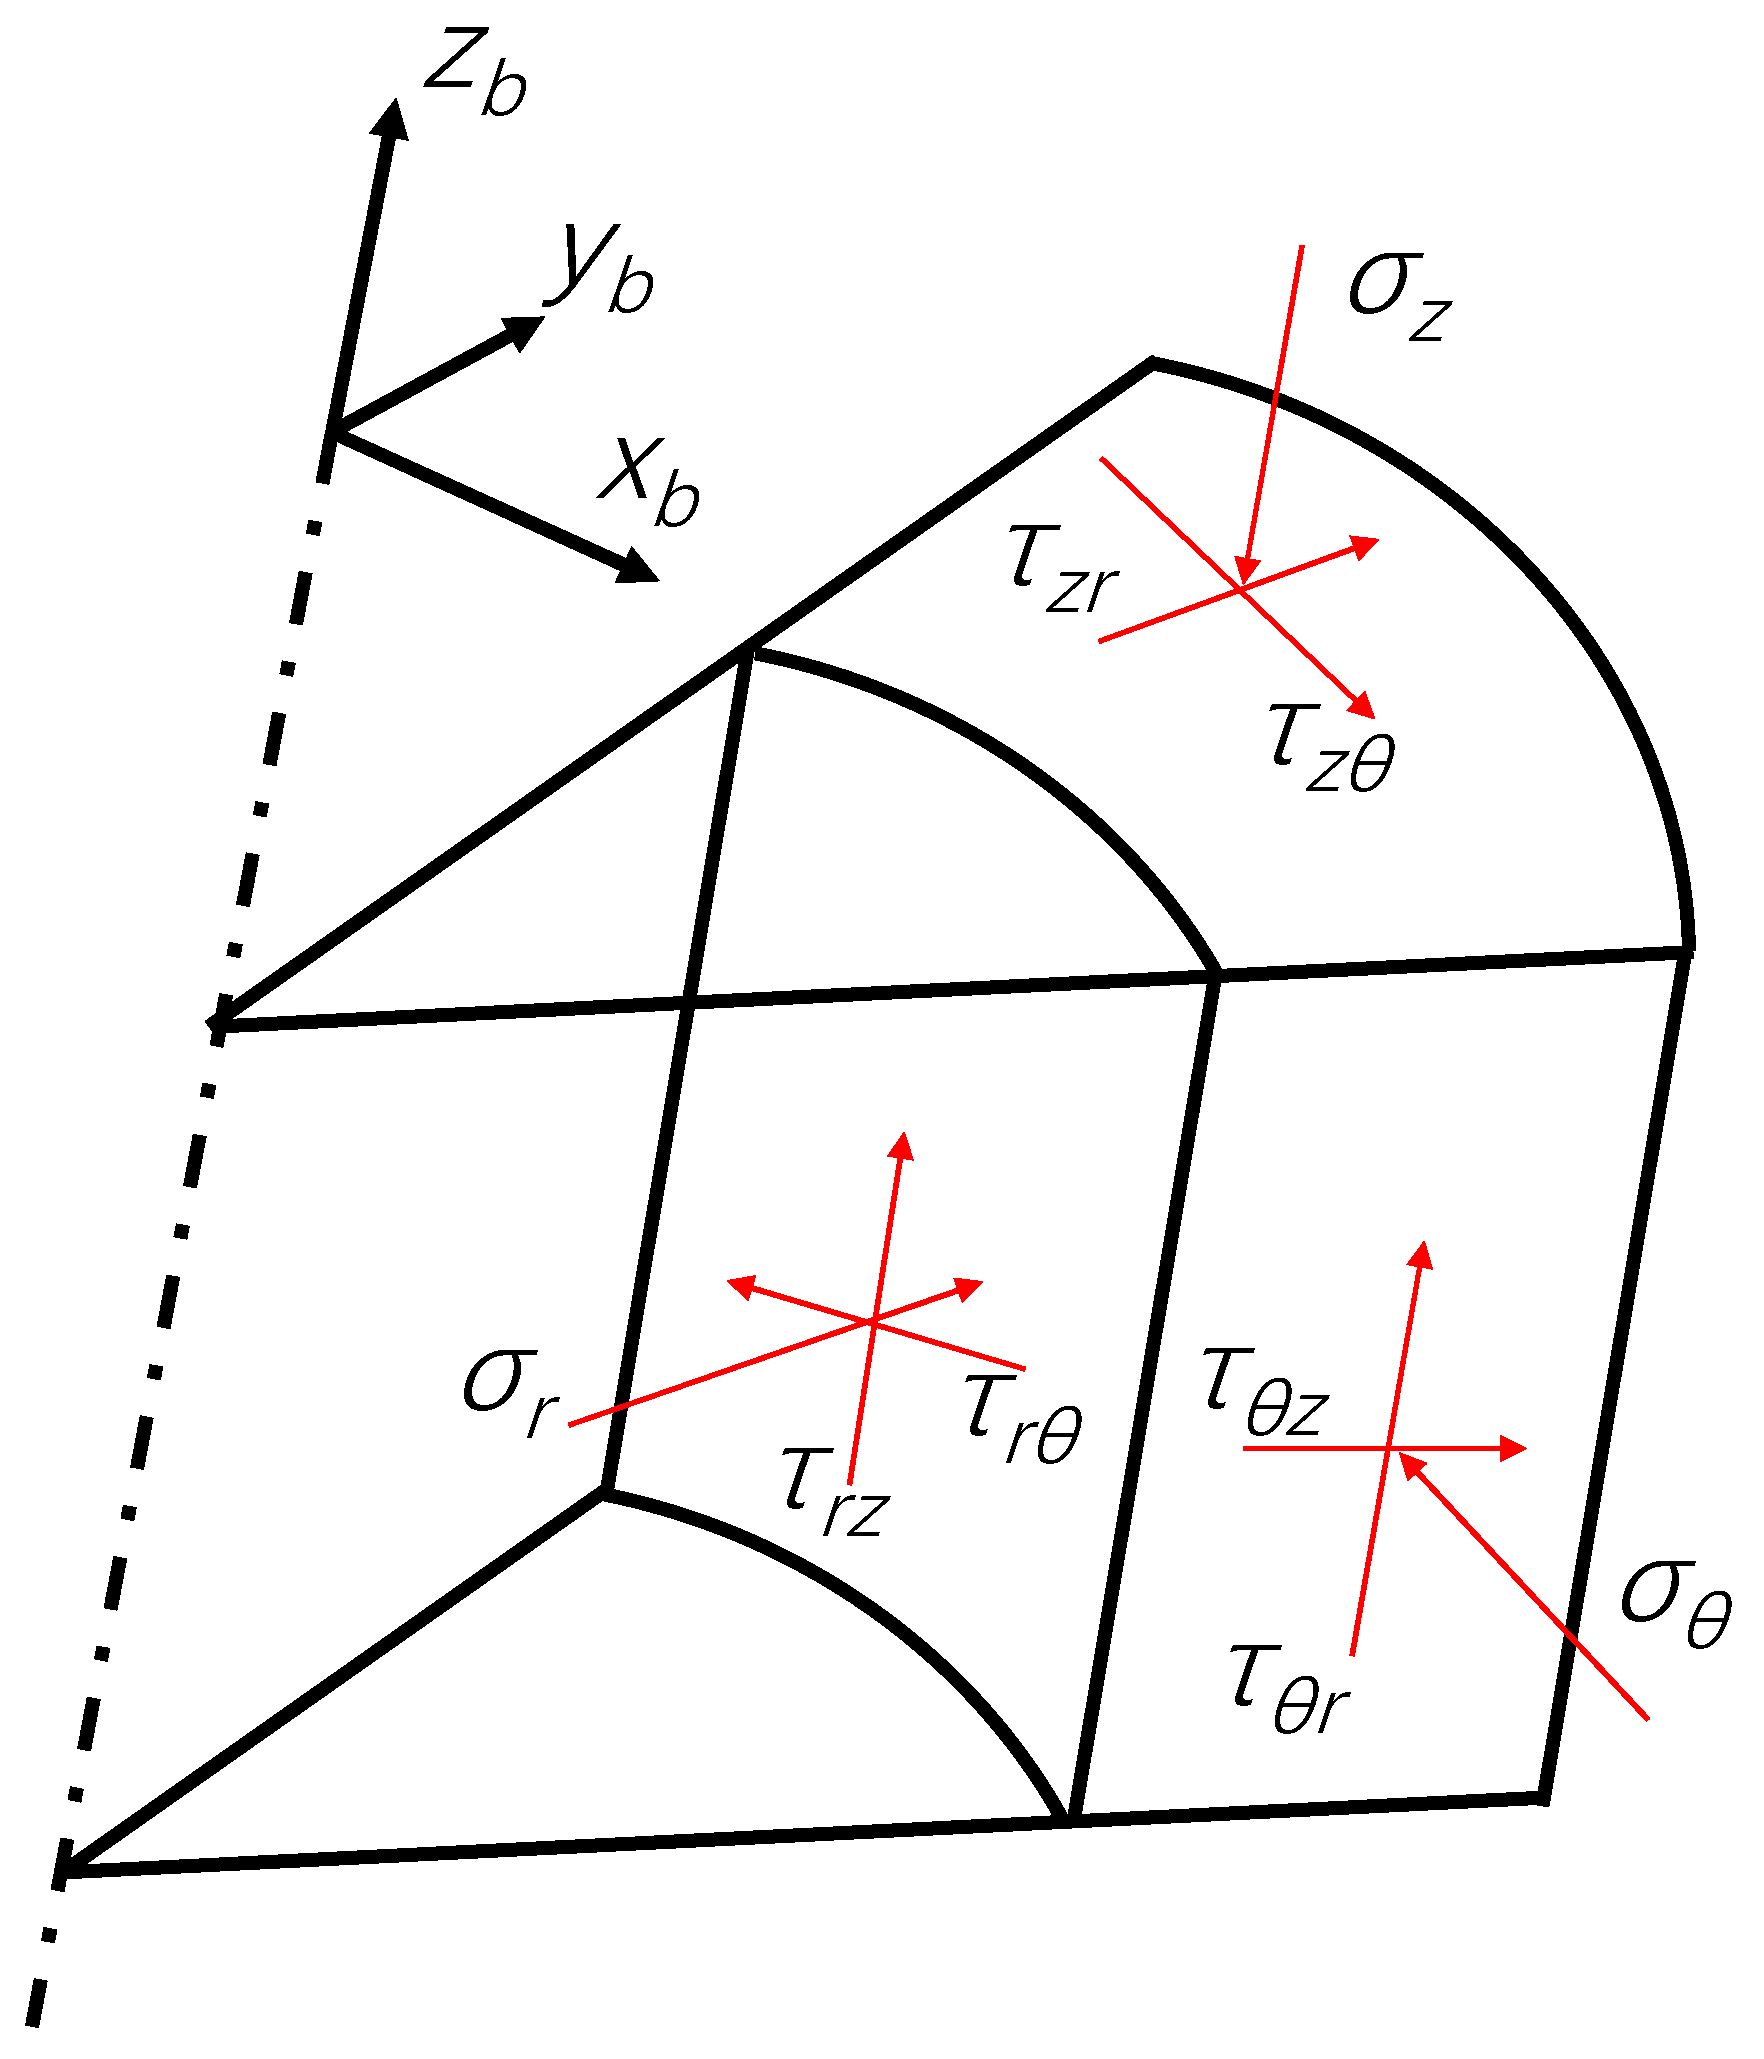
After the formation is drilled, the original in situ stress state is disrupted, leading to stress redistribution around the wellbore and resulting in stress concentration effects. Within the framework of elasticity and using the principle of linear superposition along with Biot’s effective stress theory, Figure 4 illustrates all nine stress components acting on a rock unit in the wellbore polar coordinate system, the effective stress for an arbitrarily deviated wellbore is derived as Equation (8):
σ r = σ x x + σ y y 2 1 r w 2 r 2 + σ x x σ y y 2 1 4 r w 2 r 2 + 3 r w 4 r 4 cos 2 θ     + τ x y 1 4 r w 2 r 2 + 3 r w 4 r 4 sin 2 θ + P w r w 2 r 2 α P p σ θ = σ x x + σ y y 2 1 + r w 2 r 2 σ x x σ y y 2 1 + 3 r w 4 r 4 cos 2 θ     + τ x y 1 + 3 r w 4 r 4 sin 2 θ P w r w 2 r 2 α P p σ z = σ z z 2 ν σ x x σ y y r w 2 r 2 cos 2 θ 4 ν τ x y r w 2 r 2 sin 2 θ α P p τ r θ = σ x x + σ y y 2 sin 2 θ + τ x y cos 2 θ 1 + 2 r w 2 r 2 3 r w 4 r 4 τ r z = τ y z sin θ + τ x z cos θ 1 r w 2 r 2 τ θ z = τ x z sin θ + τ y z cos θ 1 + r w 2 r 2
where r w is the wellbore radius (m); r is the distance from any point around the wellbore to the wellbore axis (m); P w is the bottomhole fluid column pressure (MPa); P p is the formation pore pressure (MPa); θ is the wellbore azimuth angle, defined as the angle from a point around the wellbore clockwise to the coordinate axis Xb (rad); α is the Biot effective stress coefficient, a dimensionless parameter ranging from 0 to 1; and σ x x , σ y y , σ z z , τ x y , τ y z , τ x z represents the stress components of the original in situ stress in the wellbore Cartesian coordinate system before drilling in MPa, as given in Equation (5). This wellbore stress equation is established based on the plane strain condition, where no displacement occurs along the coordinate axis Zb. The linear elastic wellbore stress model was first proposed by Kirsch. However, the classical Kirsch solution is limited to cases where the wellbore axis is aligned with one of the in-situ stresses. The stress equations for arbitrarily oriented wellbores were later derived by Hiramatsu and Oka, as well as by Fairhurst in 1968 [32,33,34].

2.2. Strength Criteria

2.2.1. Mohr–Coulomb Strength Criterion

In 1773, Coulomb [29] proposed that rock failure occurs when the shear stress on any plane surpasses the cohesive strength of the rock plus the frictional resistance along that plane. This idea was later given a graphical interpretation by Mohr [33] in 1900, leading to the establishment of what is now known as the Mohr–Coulomb failure criterion. Owing to its conceptual clarity, mathematical simplicity, and demonstrated reliability in ensuring the safety of geotechnical designs, this criterion has been widely adopted in engineering practice. It states that the strength of rock is governed by the minimum principal stress, cohesive strength, and internal friction angle, as expressed by Equation (9):
σ 1 = 1 + sin φ o 1 sin φ o σ 3 + 2 c o cos φ o 1 sin φ o
where co is the cohesion (MPa); φ o is the internal friction angle (rad).
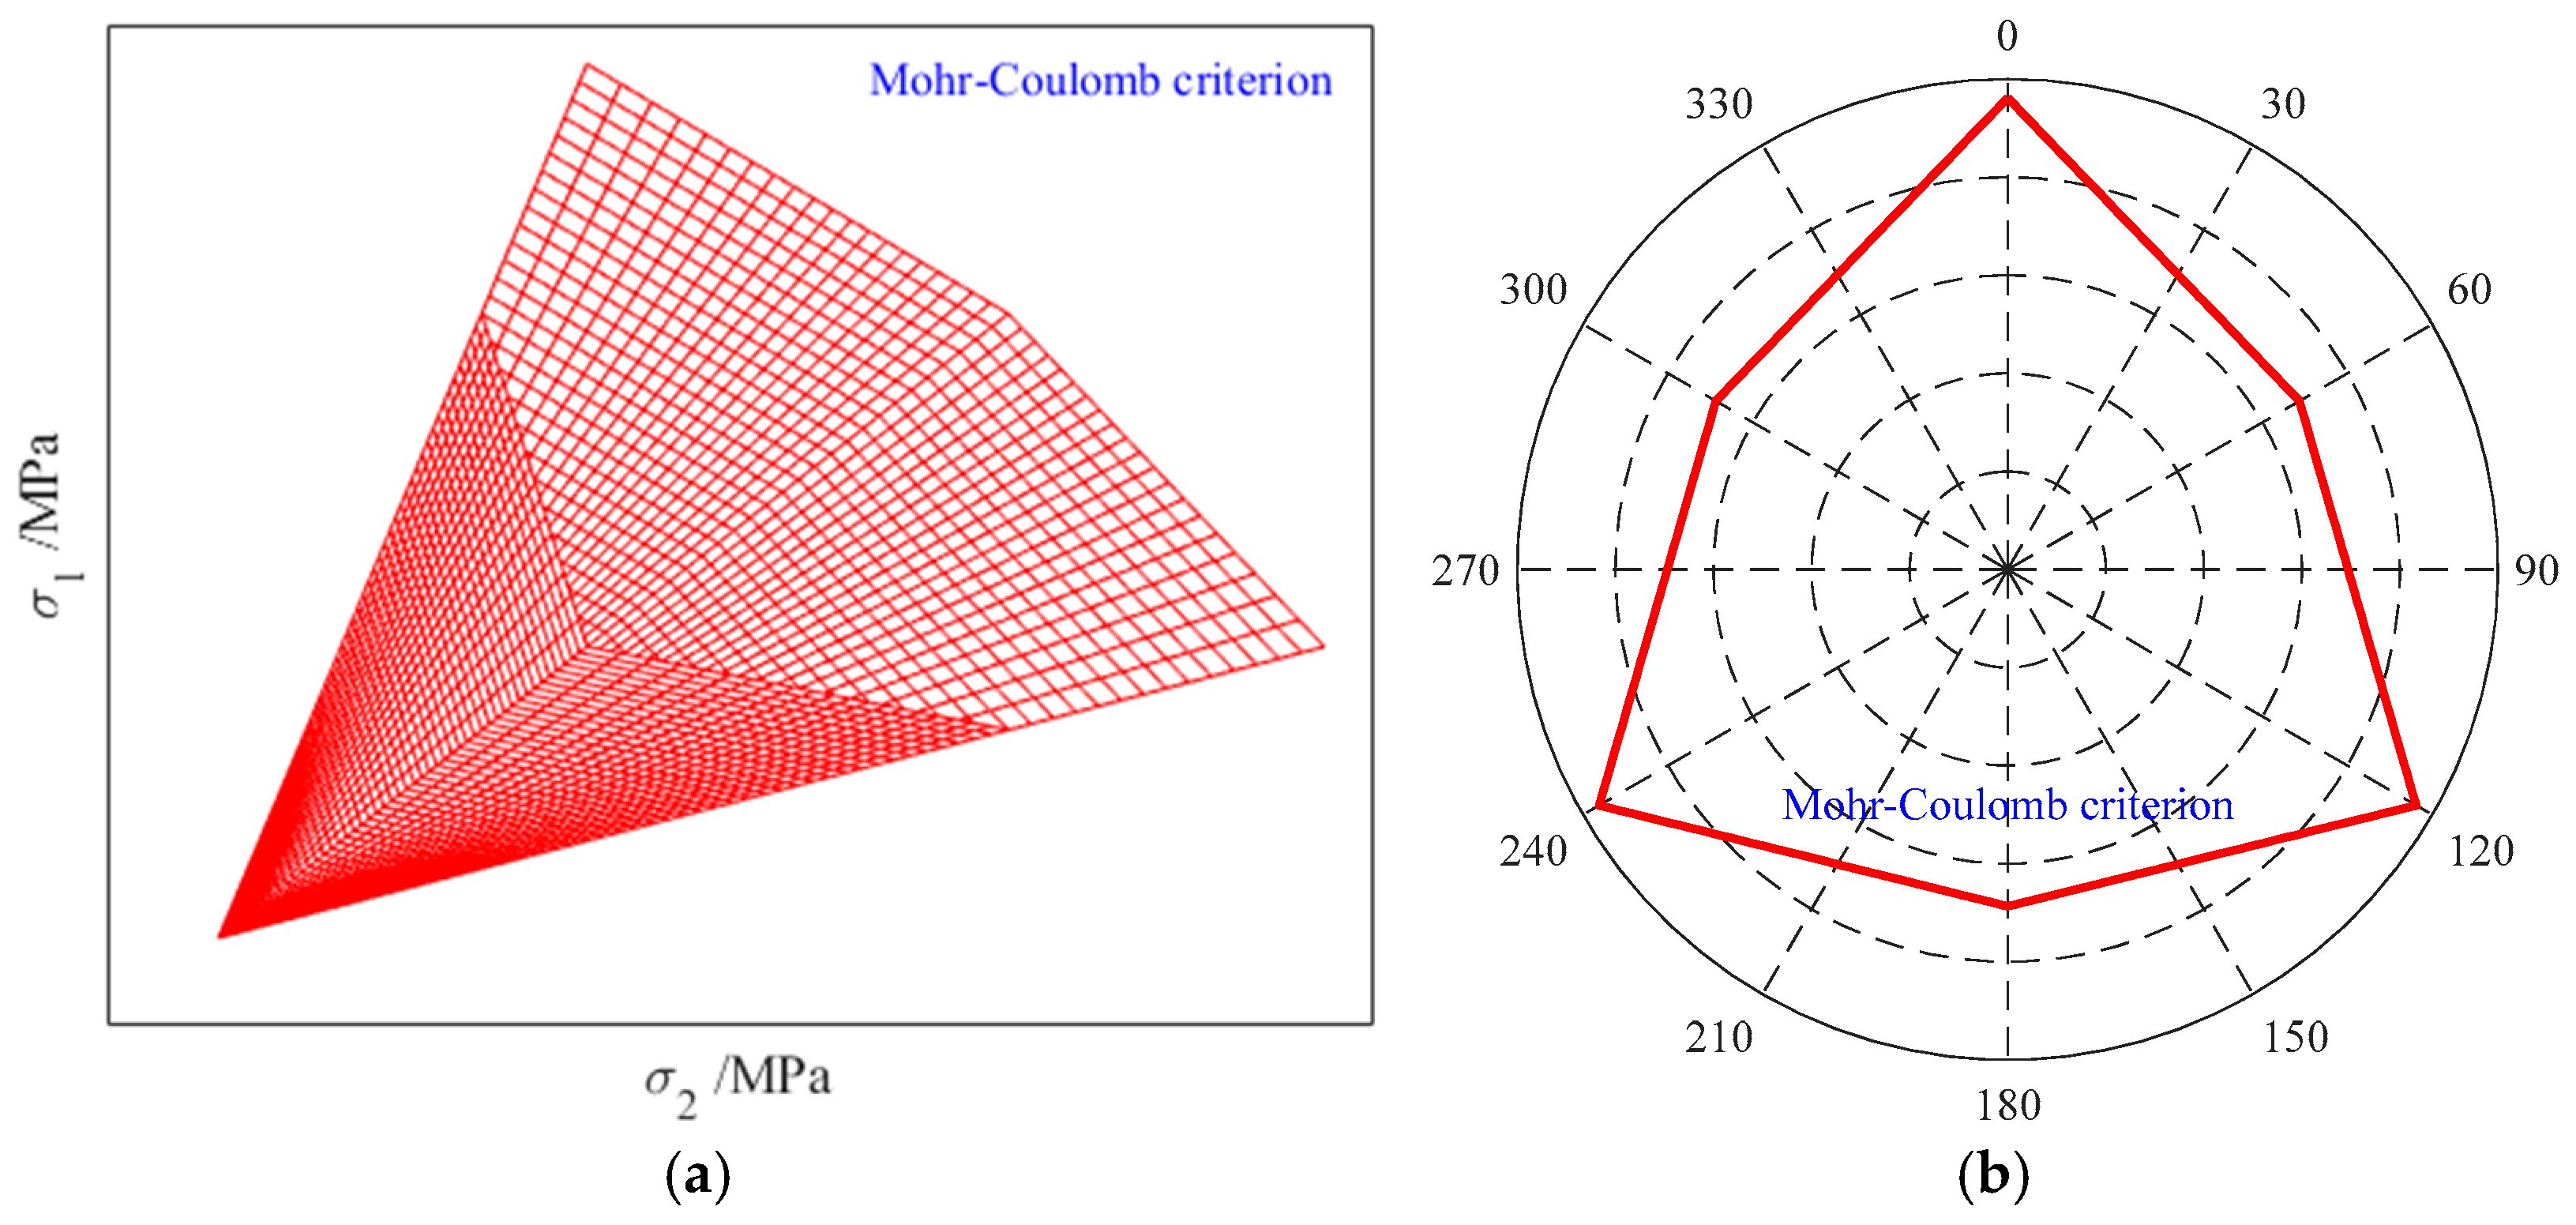
Figure 5a depicts the yield surface of the Mohr–Coulomb criterion in principal stress space, which forms a hexagonal pyramid. The meridian varies linearly with increasing hydrostatic pressure. At constant hydrostatic pressure, the corresponding yield curve of the Mohr–Coulomb criterion on the π-plane is shown in Figure 5b. The yield curve is a hexagon with six inflection points, and its shape remains unchanged on this plane under different hydrostatic pressures.

2.2.2. Single Plane of Weakness Criterion

In 1960, Jaeger [24] classified the failure modes of rocks containing a set of parallel fractures into matrix shear failure and slip failure along the weak plane, establishing the Single Plane of Weakness Criterion. The physical concepts of cohesion and internal friction angle in this criterion are well-defined, and it is widely applied in the petroleum industry. The instability criteria for the matrix and the weak plane in Jaeger’s criterion are given by Equations (10) and (11):
σ 1 σ 3 = 2 c o + σ 3 tan ϕ o 1 + tan 2 ϕ o + tan ϕ o
σ 1 σ 3 = 2 c w + σ 3 tan ϕ w 1 tan ϕ w tan β sin 2 β
where co and ϕ o represent the cohesion and internal friction angle of the rock matrix, while cw and ϕ w denote the cohesion and internal friction angle of the fracture plane. β is the angle between the maximum principal stress and the normal to the fracture plane (°).
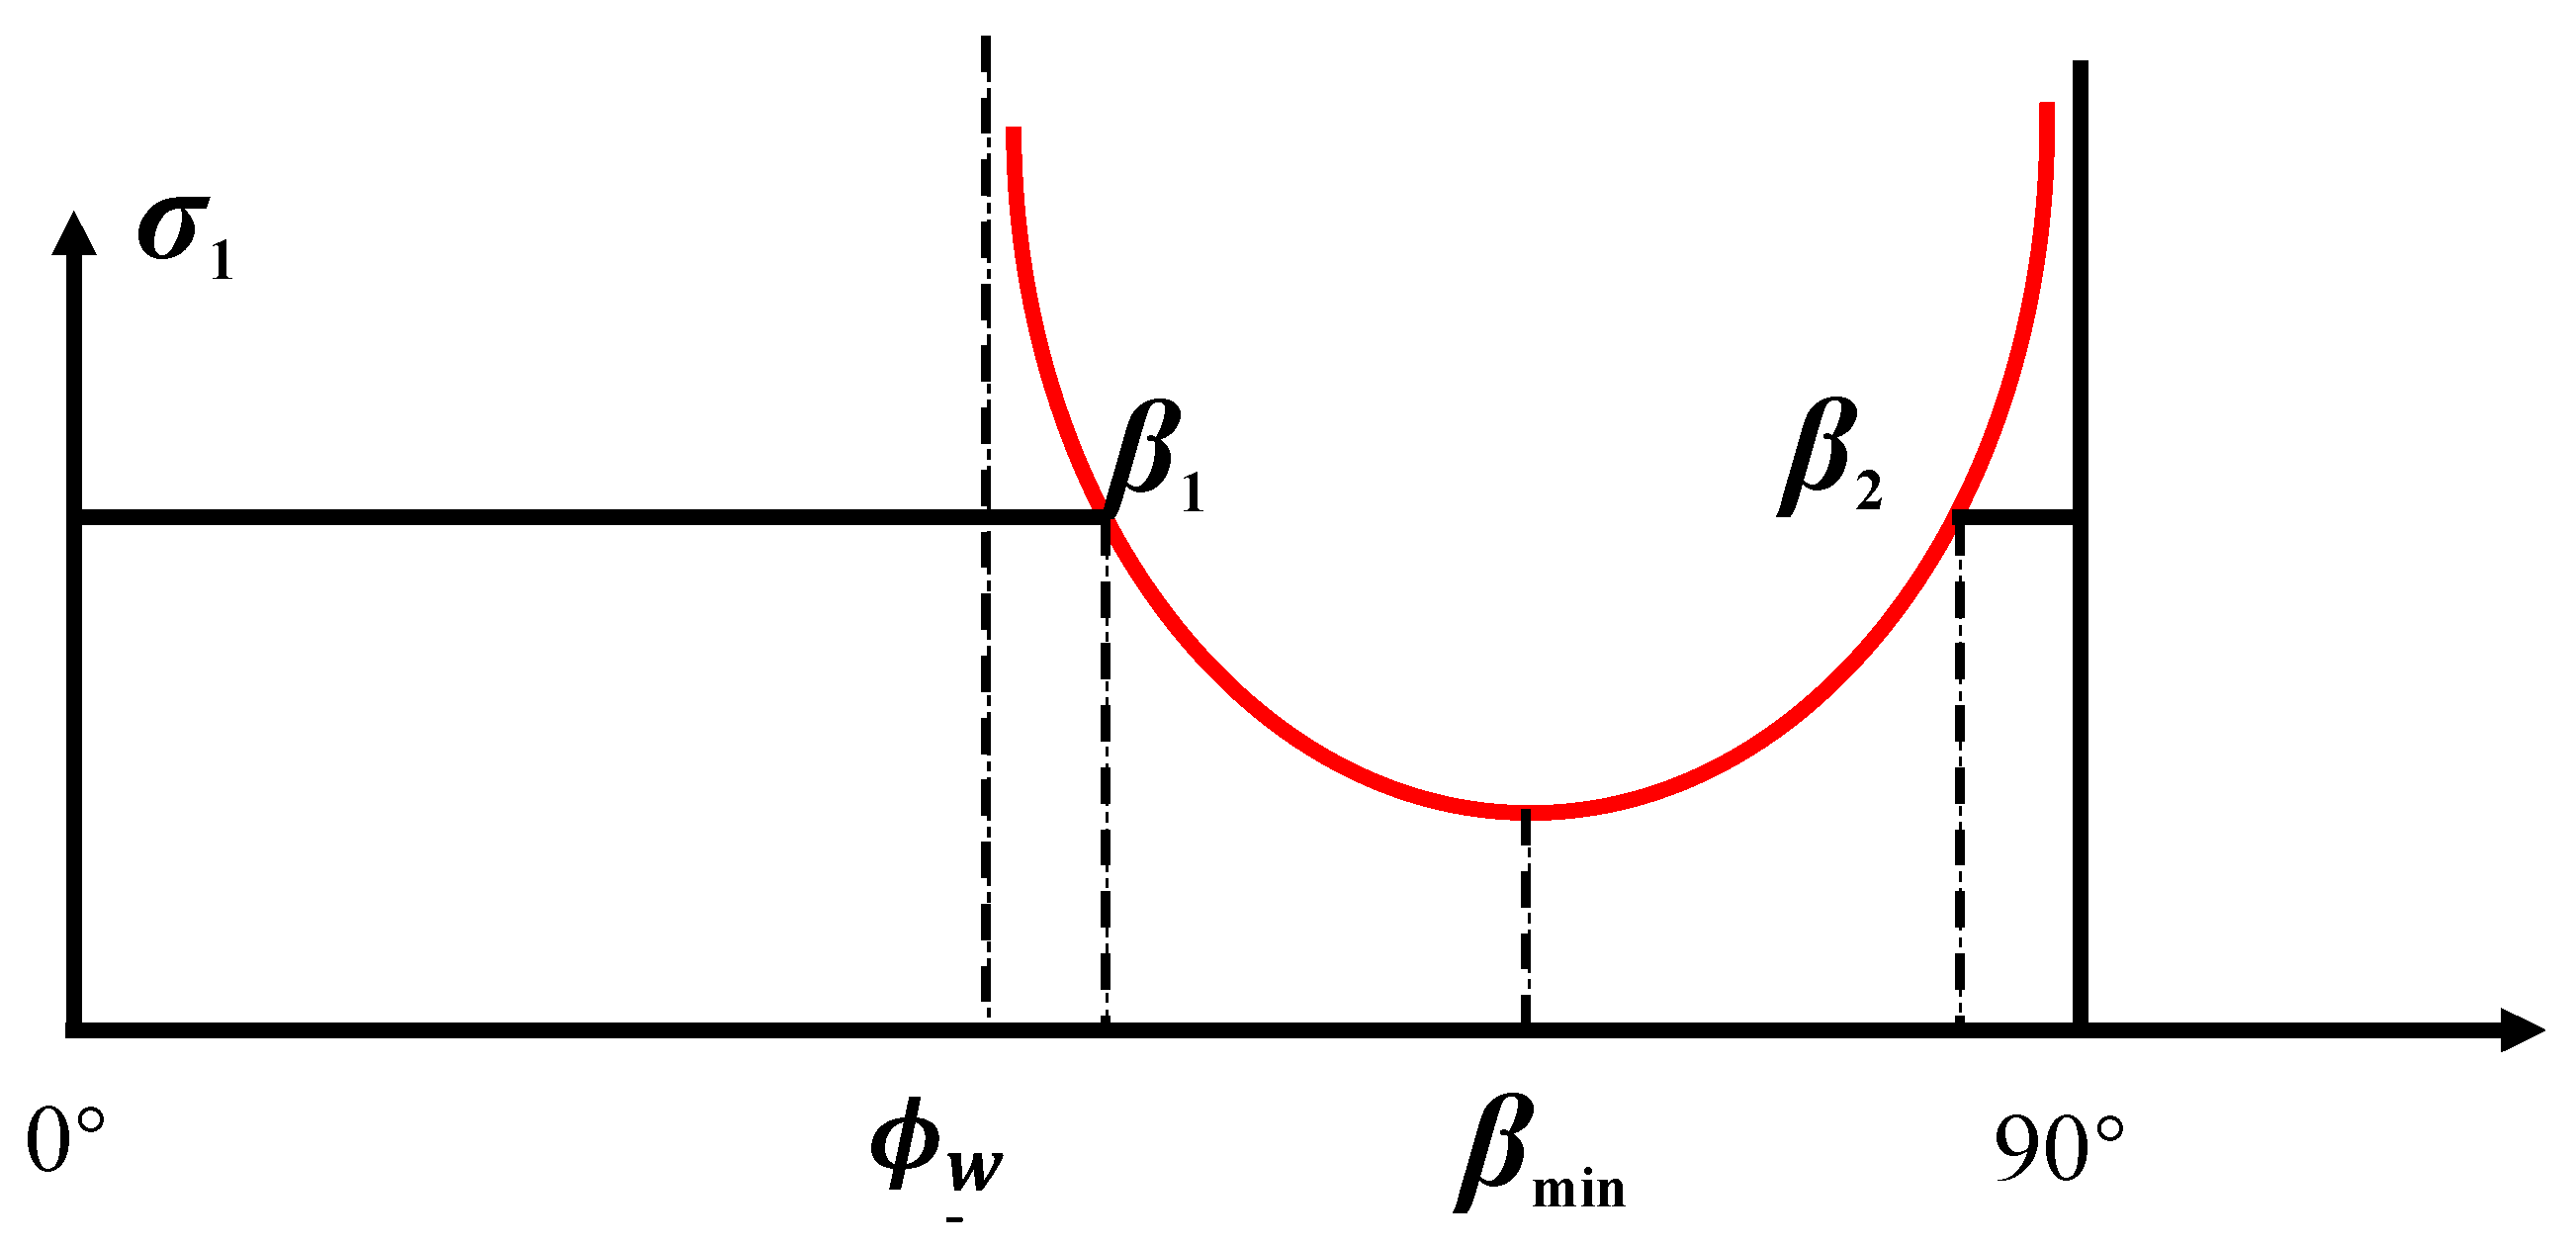
According to the Single Plane of Weakness Criterion, the variation trend of rock strength with the angle β is shown in Figure 6. Based on the physical meaning and geometric characteristics of the Mohr circle, the upper and lower bounds of the angle between the normal to the fracture plane and the maximum principal stress—for slip failure along that plane—are functions of the internal friction angle of the fracture surface, as expressed by Equation (12):
β 1 = ϕ w / 2 + 0.5 arcsin c w cot ϕ w + σ m sin ϕ w / τ m β 2 = 90 ° + ϕ w / 2 0.5 arcsin c w cot ϕ w + σ m sin ϕ w / τ m
where σm and τm represent the maximum normal stress and maximum shear stress on the bedding plane, respectively (MPa). As shown in Figure 5a, when the angle between the normal to the fracture plane and the maximum principal stress β 1 approaches the internal friction angle of the bedding plane ϕ w or β 2 approaches 90°, the strength of the fracture plane tends toward infinity.

2.3. Collapse Pressure Solution Model

2.3.1. Transformation of Wellbore Principal Stresses

Following the determination of the stress distribution around the wellbore, these stresses must be applied to an appropriate rock strength criterion to assess the stability of the surrounding rock. As rock strength criteria are formulated in terms of principal stresses, it is necessary to convert the wellbore stress components into the corresponding principal stresses. The equation for converting wellbore stresses in polar coordinates to principal stresses is given by Equation (13):
σ i = σ r σ j = σ θ + σ z / 2 + σ θ + σ z 2 + 4 τ θ z 2 / 2 σ k = σ θ + σ z / 2 σ θ + σ z 2 + 4 τ θ z 2 / 2
The relative magnitudes of the three principal stresses around the wellbore vary as a function of bottomhole pressure. To accurately determine these stresses, the expressions derived from Equations (4)–(9) should be substituted into Equation (14),
σ 1 = max σ i , σ j , σ k σ 3 = min σ i , σ j , σ k σ 2 = σ i + σ j + σ k σ 1 σ 3

2.3.2. Stress Distribution on Fracture Planes Around the Wellbore

According to the Single Plane of Weakness Criterion, wellbore stability analysis in fractured formations involves three key components: determining the stress distribution around the wellbore, characterizing the strength parameters of the fractures, and obtaining the distributions of normal and shear stresses acting on the fracture surfaces.
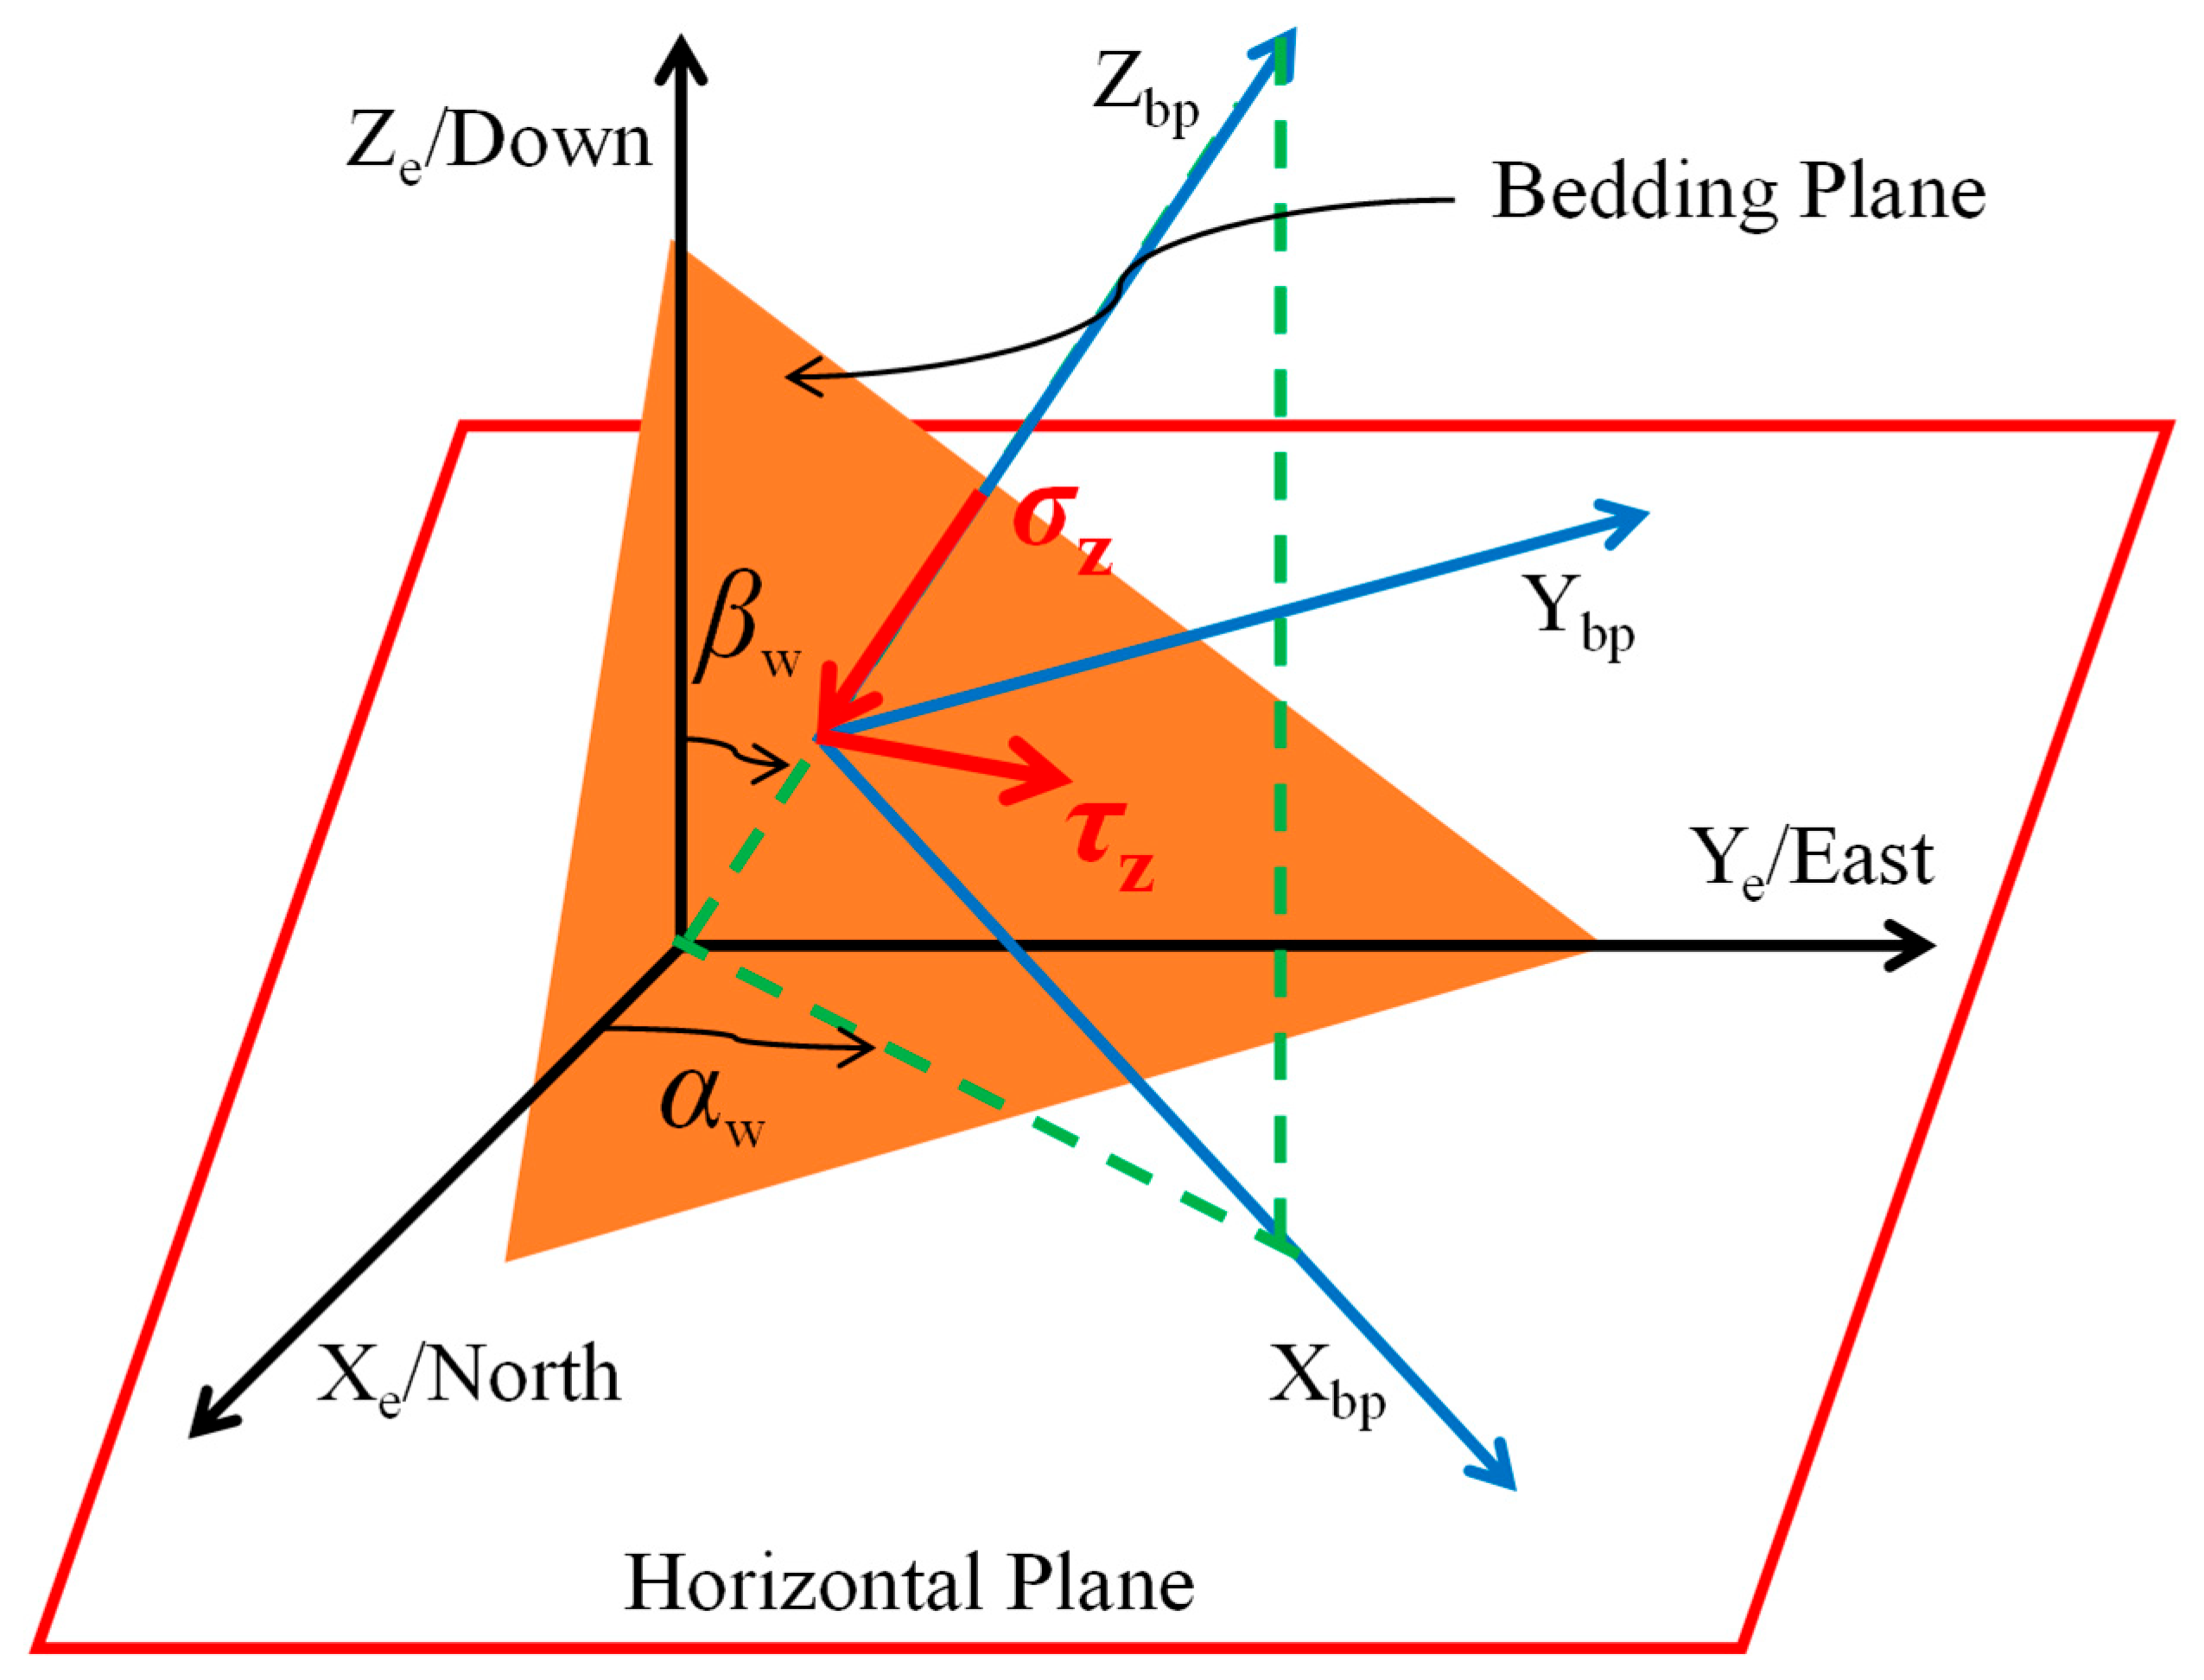
The distribution characteristics of the fracture plane in the geodetic coordinate system are shown in Figure 7. The Zw axis represents the normal direction to the fracture plane, and Yw represents the strike direction of the fracture plane. The dip angle of the fracture plane, βw, is defined as the angle between the normal vector to the fracture plane and the vertical direction, while the azimuth angle, αw, refers to the angle between the projection of that normal vector onto the horizontal plane and the true north direction. To determine the stress distribution on the fracture plane, the wellbore stresses must first be transformed into the geodetic coordinate system using the transformation matrix provided in Equation (4). These values are then further transformed into the fracture plane coordinate system via the transformation matrix given in Equation (15),
W = cos α w cos β w sin α w cos β w sin β w sin α w cos α w 0 cos α w sin β w sin α w sin β w cos β w
After spatial transformation of the stresses, the stress distribution on the fracture plane is obtained as shown in Equation (16):
σ w = W × B T × σ b × B × W T
In Equation (16), σ b is given by Equation (3), and σ w is given by Equation (17):
σ w = σ x w τ x y w τ x z w τ y x w σ y w τ y z w τ z x w τ z y w σ z w
Based on Figure 7, the stresses on the fracture plane are projected onto the Zw axis and the fracture plane itself, yielding the normal and shear stresses as shown in Equation (18):
σ n w = σ z w τ w = τ z x w 2 + τ z y w 2
Substituting Equation (18) into Equation (14) allows solving for the critical lower limit of bottomhole pressure required to maintain stability along the fracture plane. For the failure criterion of the rock matrix (Equation (10)), the orientation of the fracture plane must first be determined, which can only be achieved experimentally.
Following the above principles, the principal stresses at the wellbore wall are substituted into the Mohr-Coulomb criterion to obtain the critical bottomhole pressure P c r i i for rock matrix shear failure. Similarly, the normal and shear stresses on the fracture plane at the wellbore wall are substituted into the Single Plane of Weakness Criterion (Equation (11)) to obtain the critical bottomhole pressure P c r i w for shear failure along the fracture plane. The collapse pressure of the wellbore is determined by the maximum of these two values. Using the methodology described above, a MATLAB program was developed to compute the collapse pressure distribution around the wellbore via Newton’s iterative method. This approach efficiently generates polar plots of collapse pressure for fracture-developed formations, providing critical visualization of wellbore instability risks.
  • Input basic model parameters, such as in situ stresses and their orientations, the orientation and strength parameters of fracture plane i, wellbore trajectory, and wellbore radius r.
  • Determine the wellbore azimuth angle θ, increasing from 0° to 360° in increments of 2°. Set the initial bottomhole pressure Pw = 0 MPa and calculate the wellbore stress components at a specific point in the wellbore Cartesian coordinate system.
  • Transform the stress components into polar coordinates and convert them into principal stresses using Equation (14). Substitute the principal stresses into the Single Plane of Weakness Criterion. Gradually increase the bottomhole pressure until the point reaches critical equilibrium. The corresponding bottomhole pressure is the collapse pressure P c r i i for rock matrix shear failure.
  • Transform the stresses onto fracture plane i using coordinate conversion and obtain the normal and shear stresses. Substitute these into the 3D Weak Plane Strength Criterion (Equations (5)–(14)). Gradually increase the bottomhole pressure until the point reaches critical equilibrium. The corresponding bottomhole pressure is the collapse pressure P c r i w for shear failure along fracture plane i.
  • Determine the maximum collapse pressure P c r i = max P c r i i , P c r i w at the point. The maximum collapse pressure value along the wellbore wall is identified as the wellbore collapse pressure for the specified trajectory. The procedure is repeated by varying the well inclination from 0° to 90° in 10° increments and the azimuth from 0° to 360° in 10° increments to generate a comprehensive polar plot of wellbore collapse pressure.

2.3.3. Model Validation

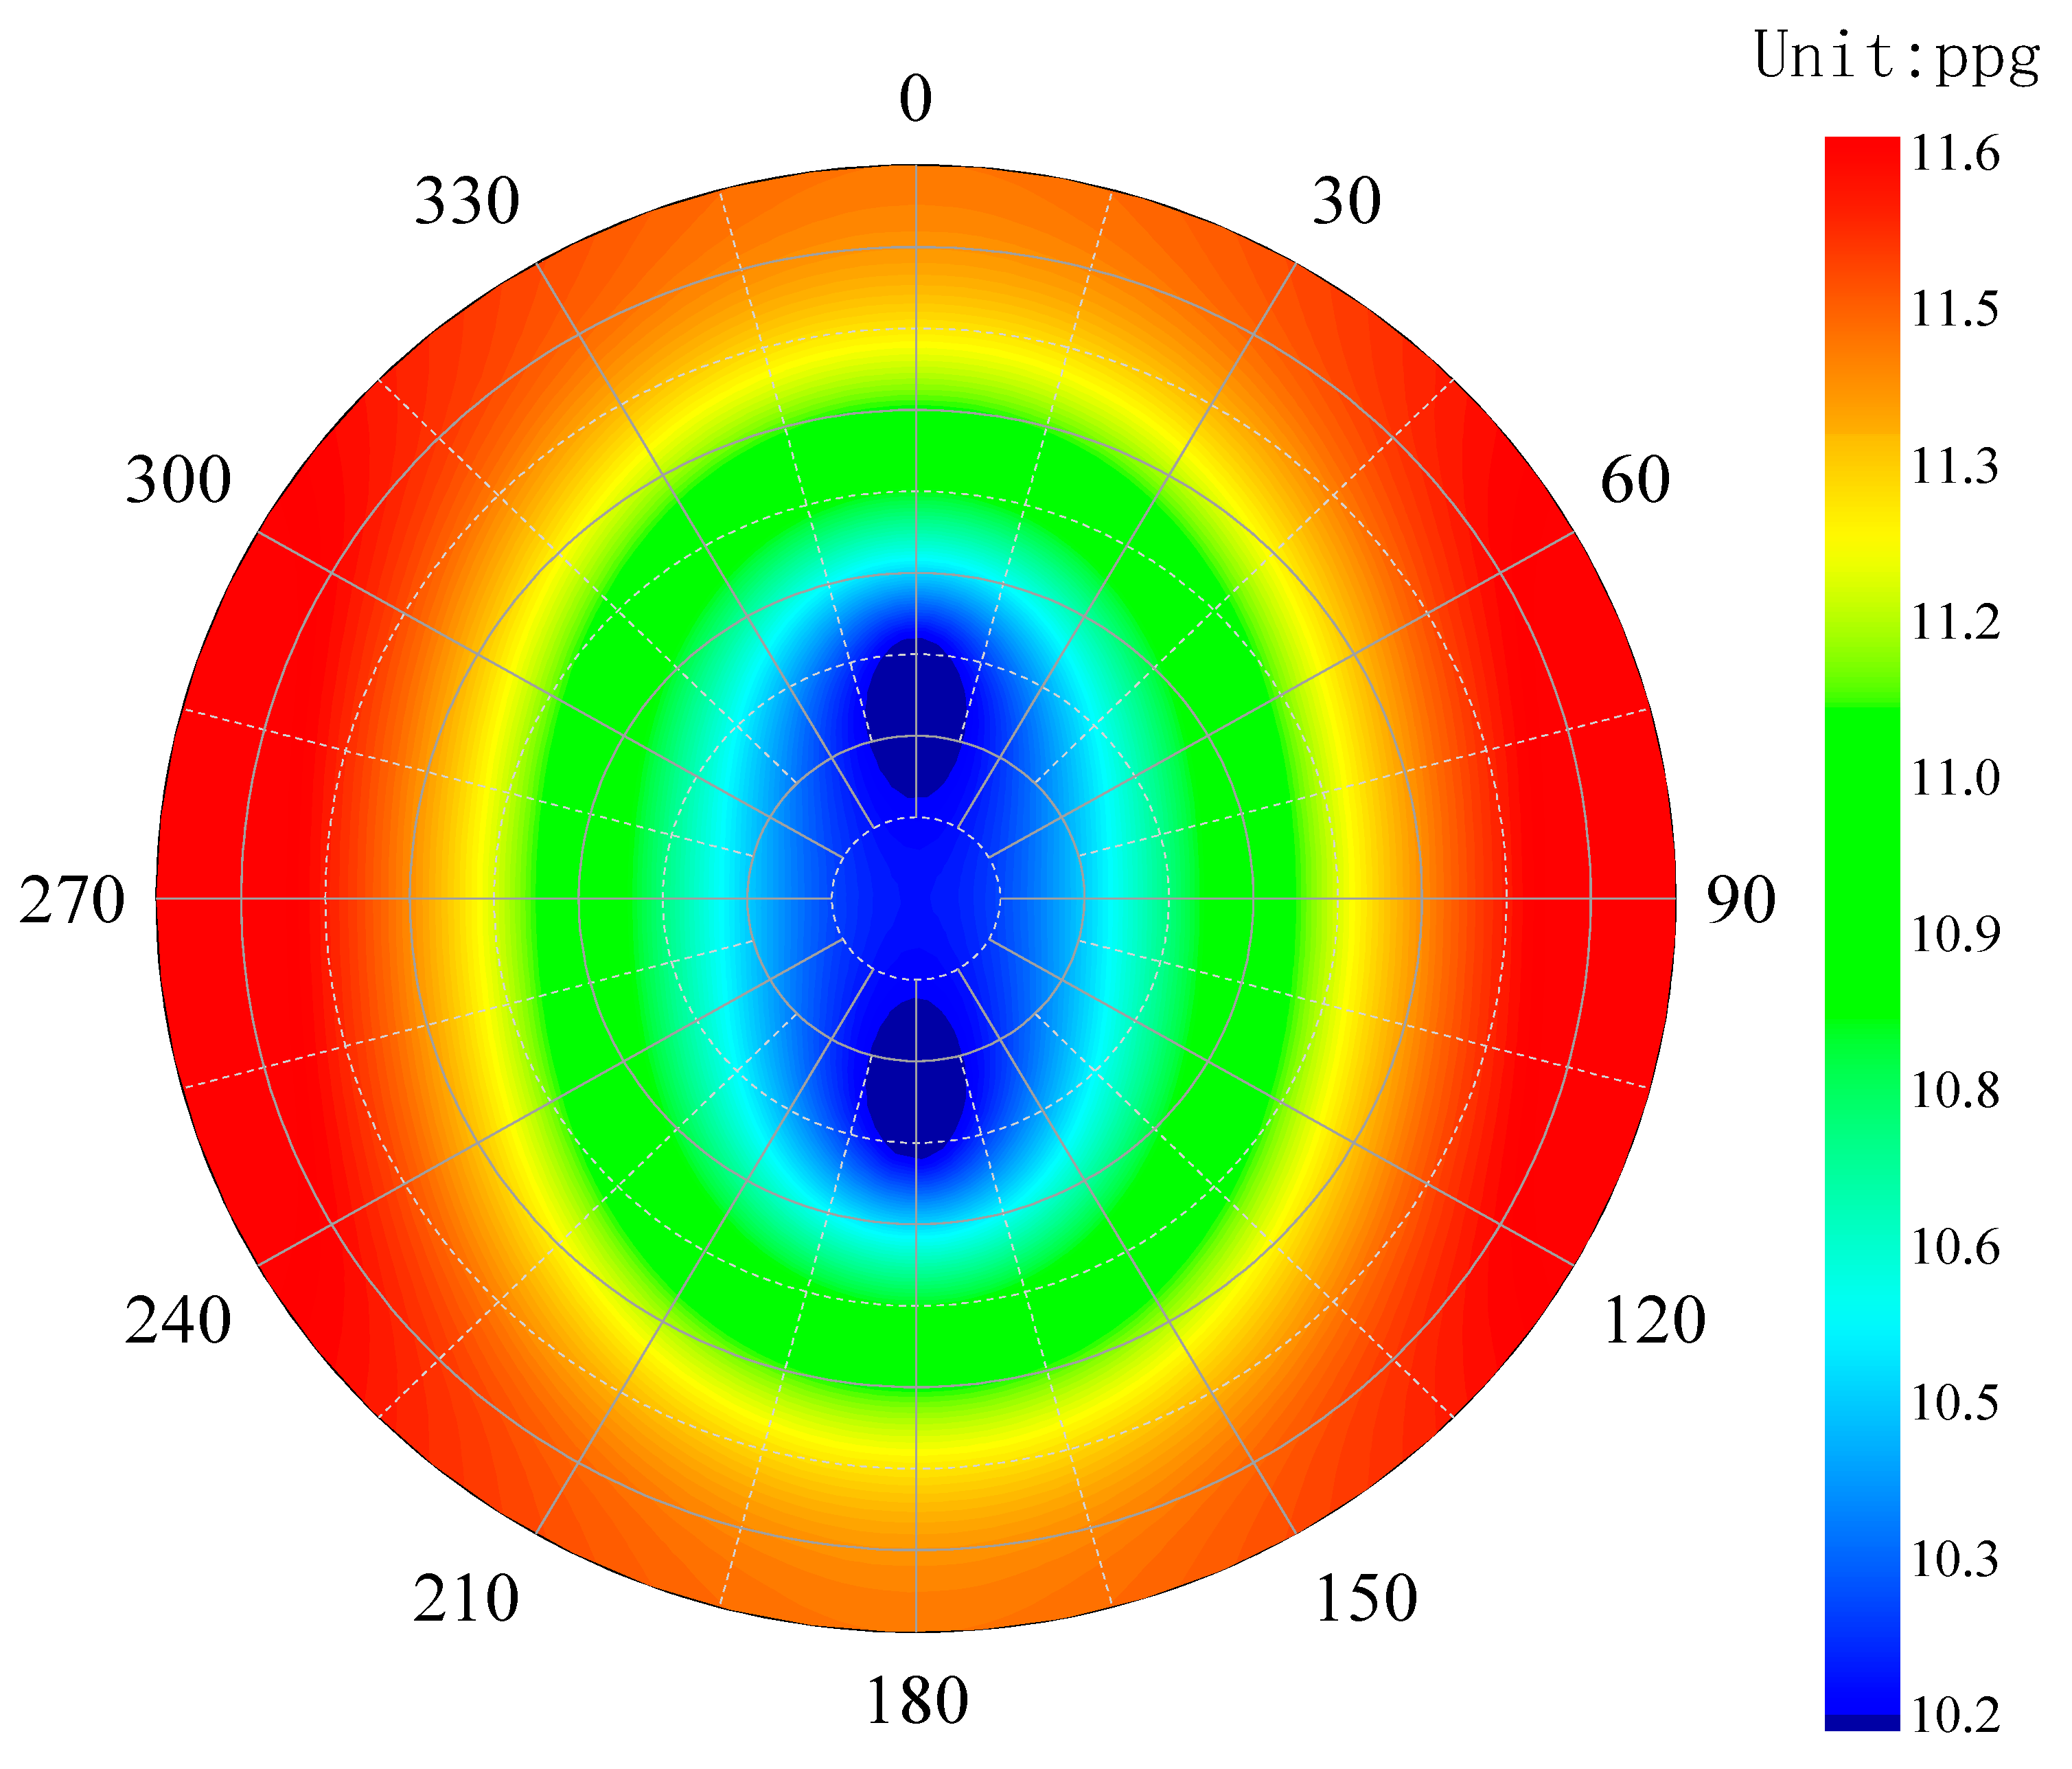
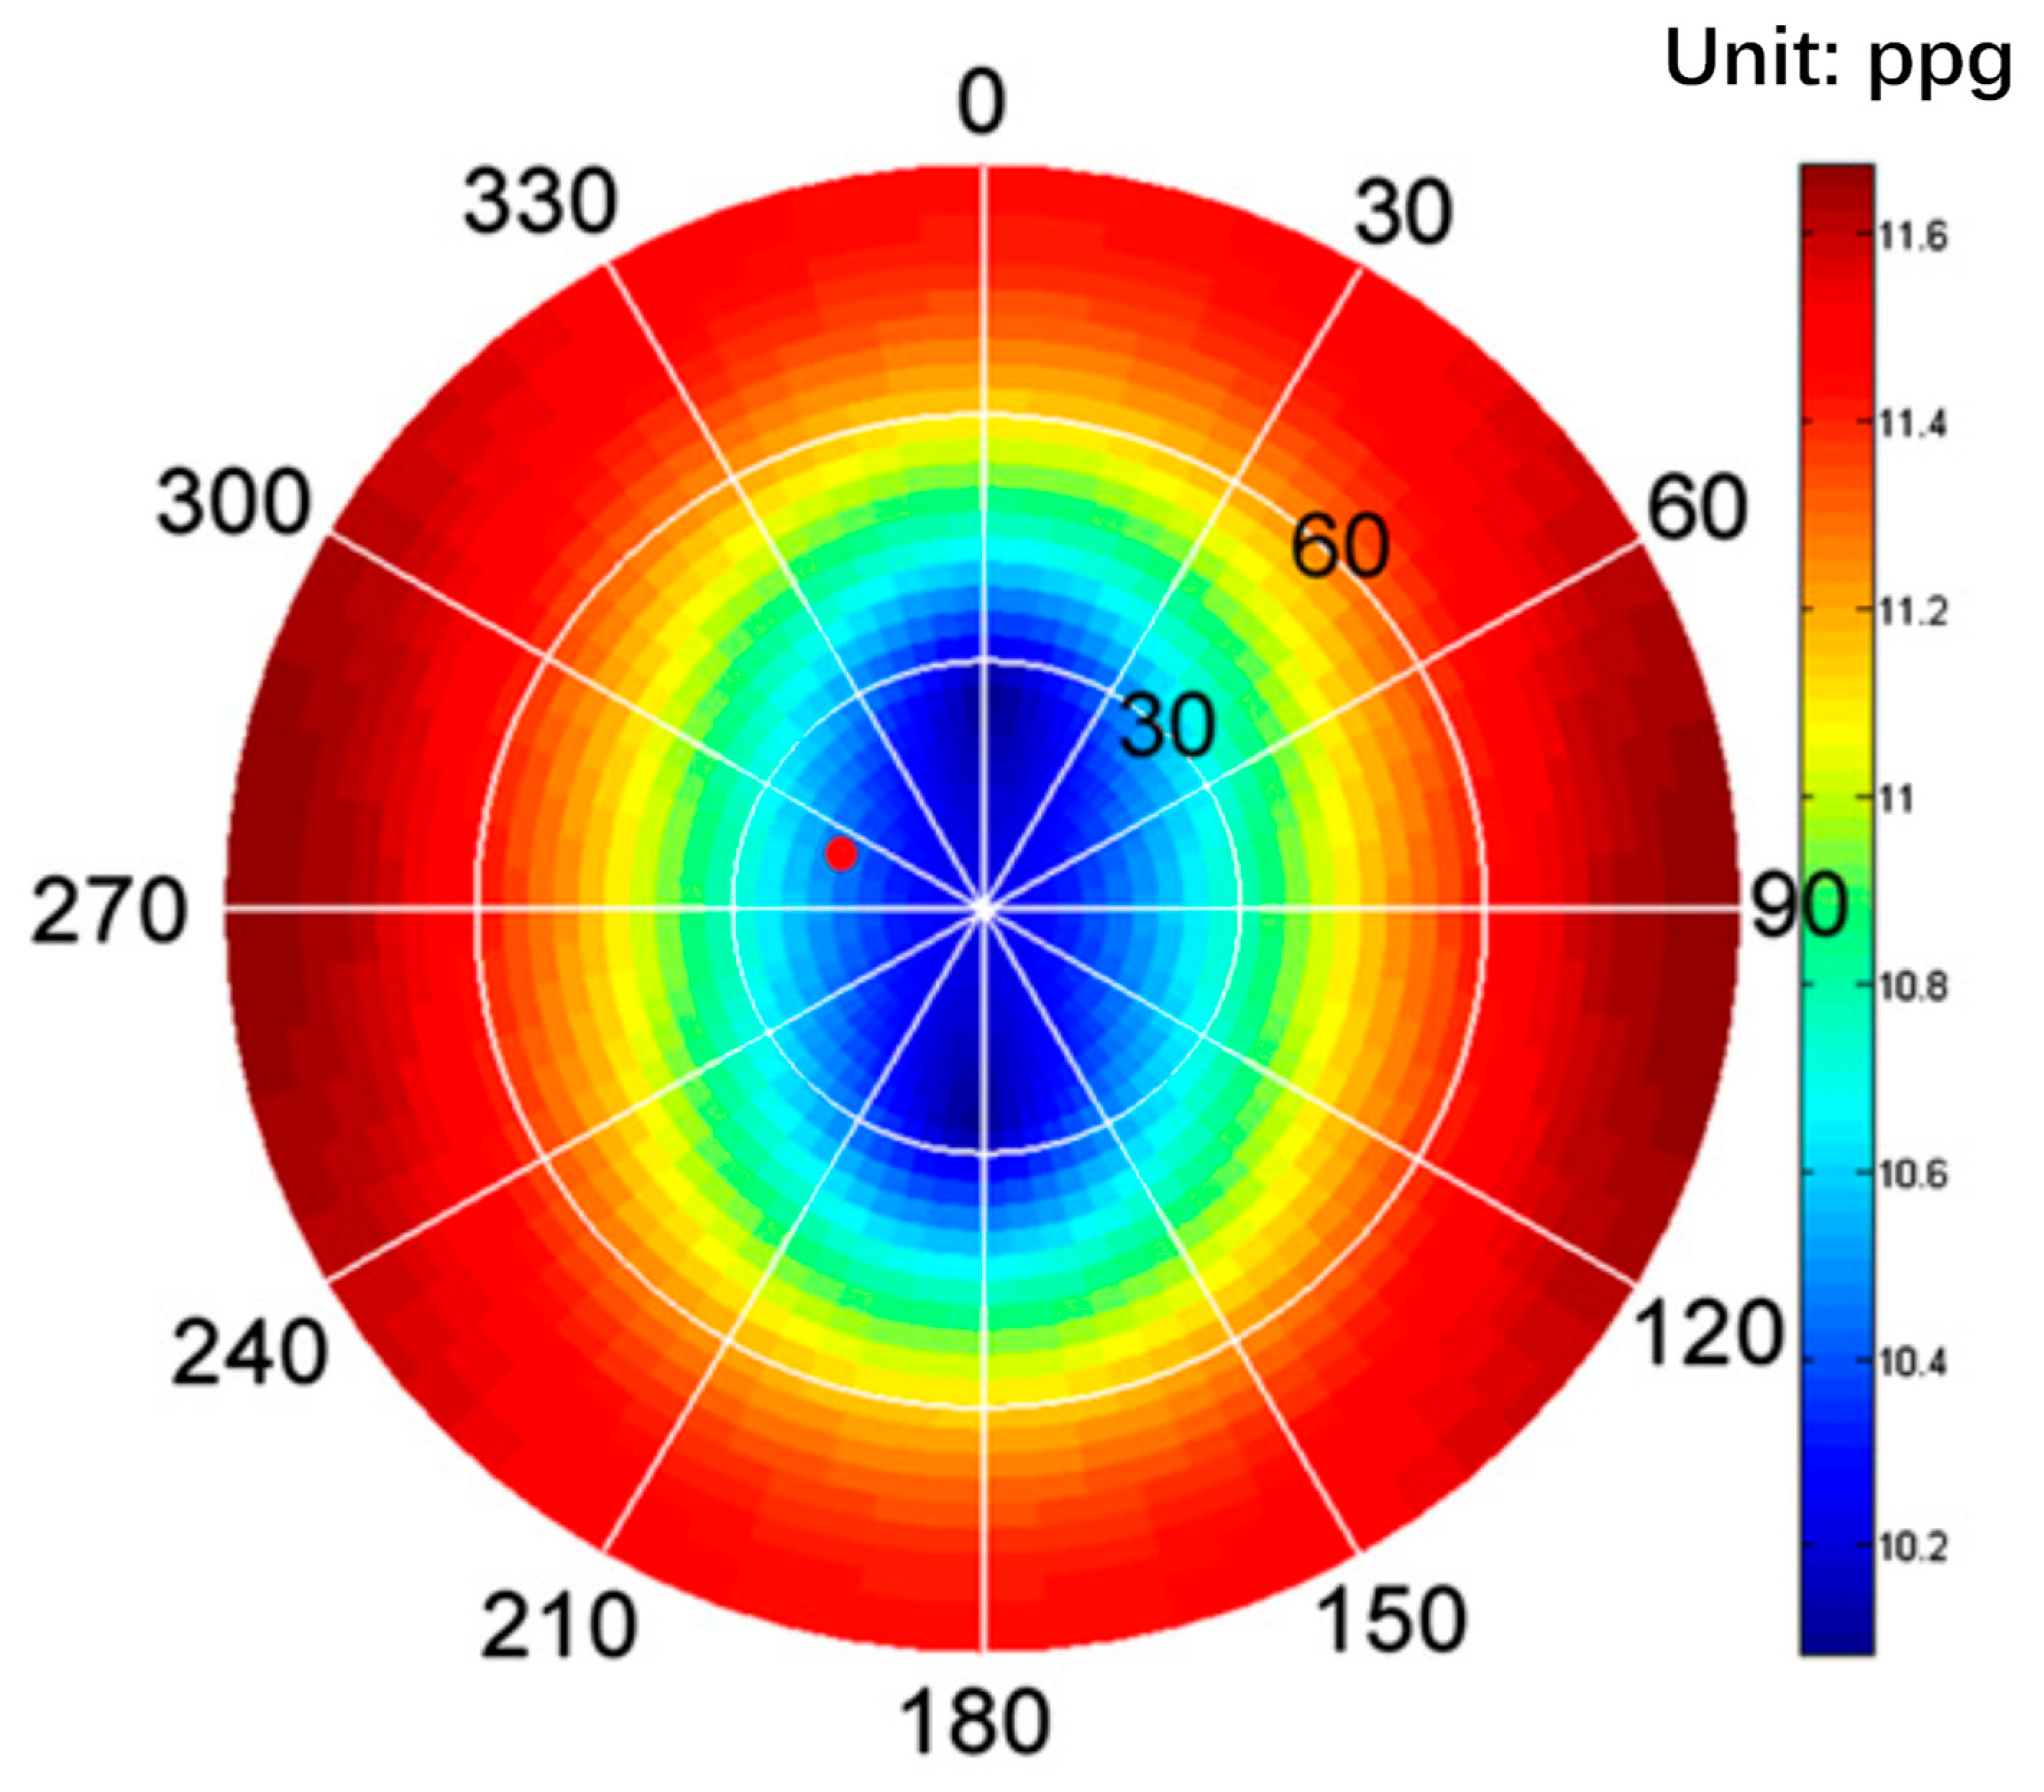
In this study, the computational results from Lee et al. [55] were used as the benchmark. The parameters listed in Table 1 of their work were input into the computational program developed in this study. Using the Mohr–Coulomb criterion as the failure criterion, the collapse pressure of the wellbore for arbitrary trajectories was calculated, and a contour map of wellbore collapse pressure was generated. The computational results are shown in Figure 8.
As shown in Figure 9, the collapse pressure contour calculated by Lee et al. [55] is presented. A comparison between the results from this study (Figure 8) and those from Figure 9 demonstrates that the predictions of the two models are in excellent agreement, thereby confirming the reliability of the program developed in this study.

3. Results and Discussion

Taking Well THX as an example, this study analyzes the distribution of wellbore collapse pressure in the target block. During the third spud-in phase, after reaching a depth of 4879 m, the mud density was reduced to 1.55 g/cm3. Shortly after this adjustment, cavings were observed, along with torque fluctuations ranging between 4 and 13 kN·m during connections [56,57]. A total of 0.1 m3 of thin-chip cavings was recovered. Subsequent short trips encountered obstructions at multiple depths, including 4848 m and the interval from 4720 m to 4400 m. Reaming operations at 4848.00 m proved challenging, with repeated instances of bit sticking and increased annular pressure. When the flow rate was raised to 30 L/s, approximately 3 m3 of cuttings were returned, about 5% of which consisted of thin-chip cavings. Available data indicate that the formation is highly fractured. The third spud-in phase penetrated the Upper-Middle Permian Aqa Group, which is subdivided—from top to bottom—into the Upper Clastic Section, the Igneous Section, and the Lower Clastic Section, all of which contain fractured intervals. The wellbore collapse pressure at a depth of 4800.00 m in Well THX was analyzed. Input parameters were determined based on a review of relevant literature, as summarized in Table 1.
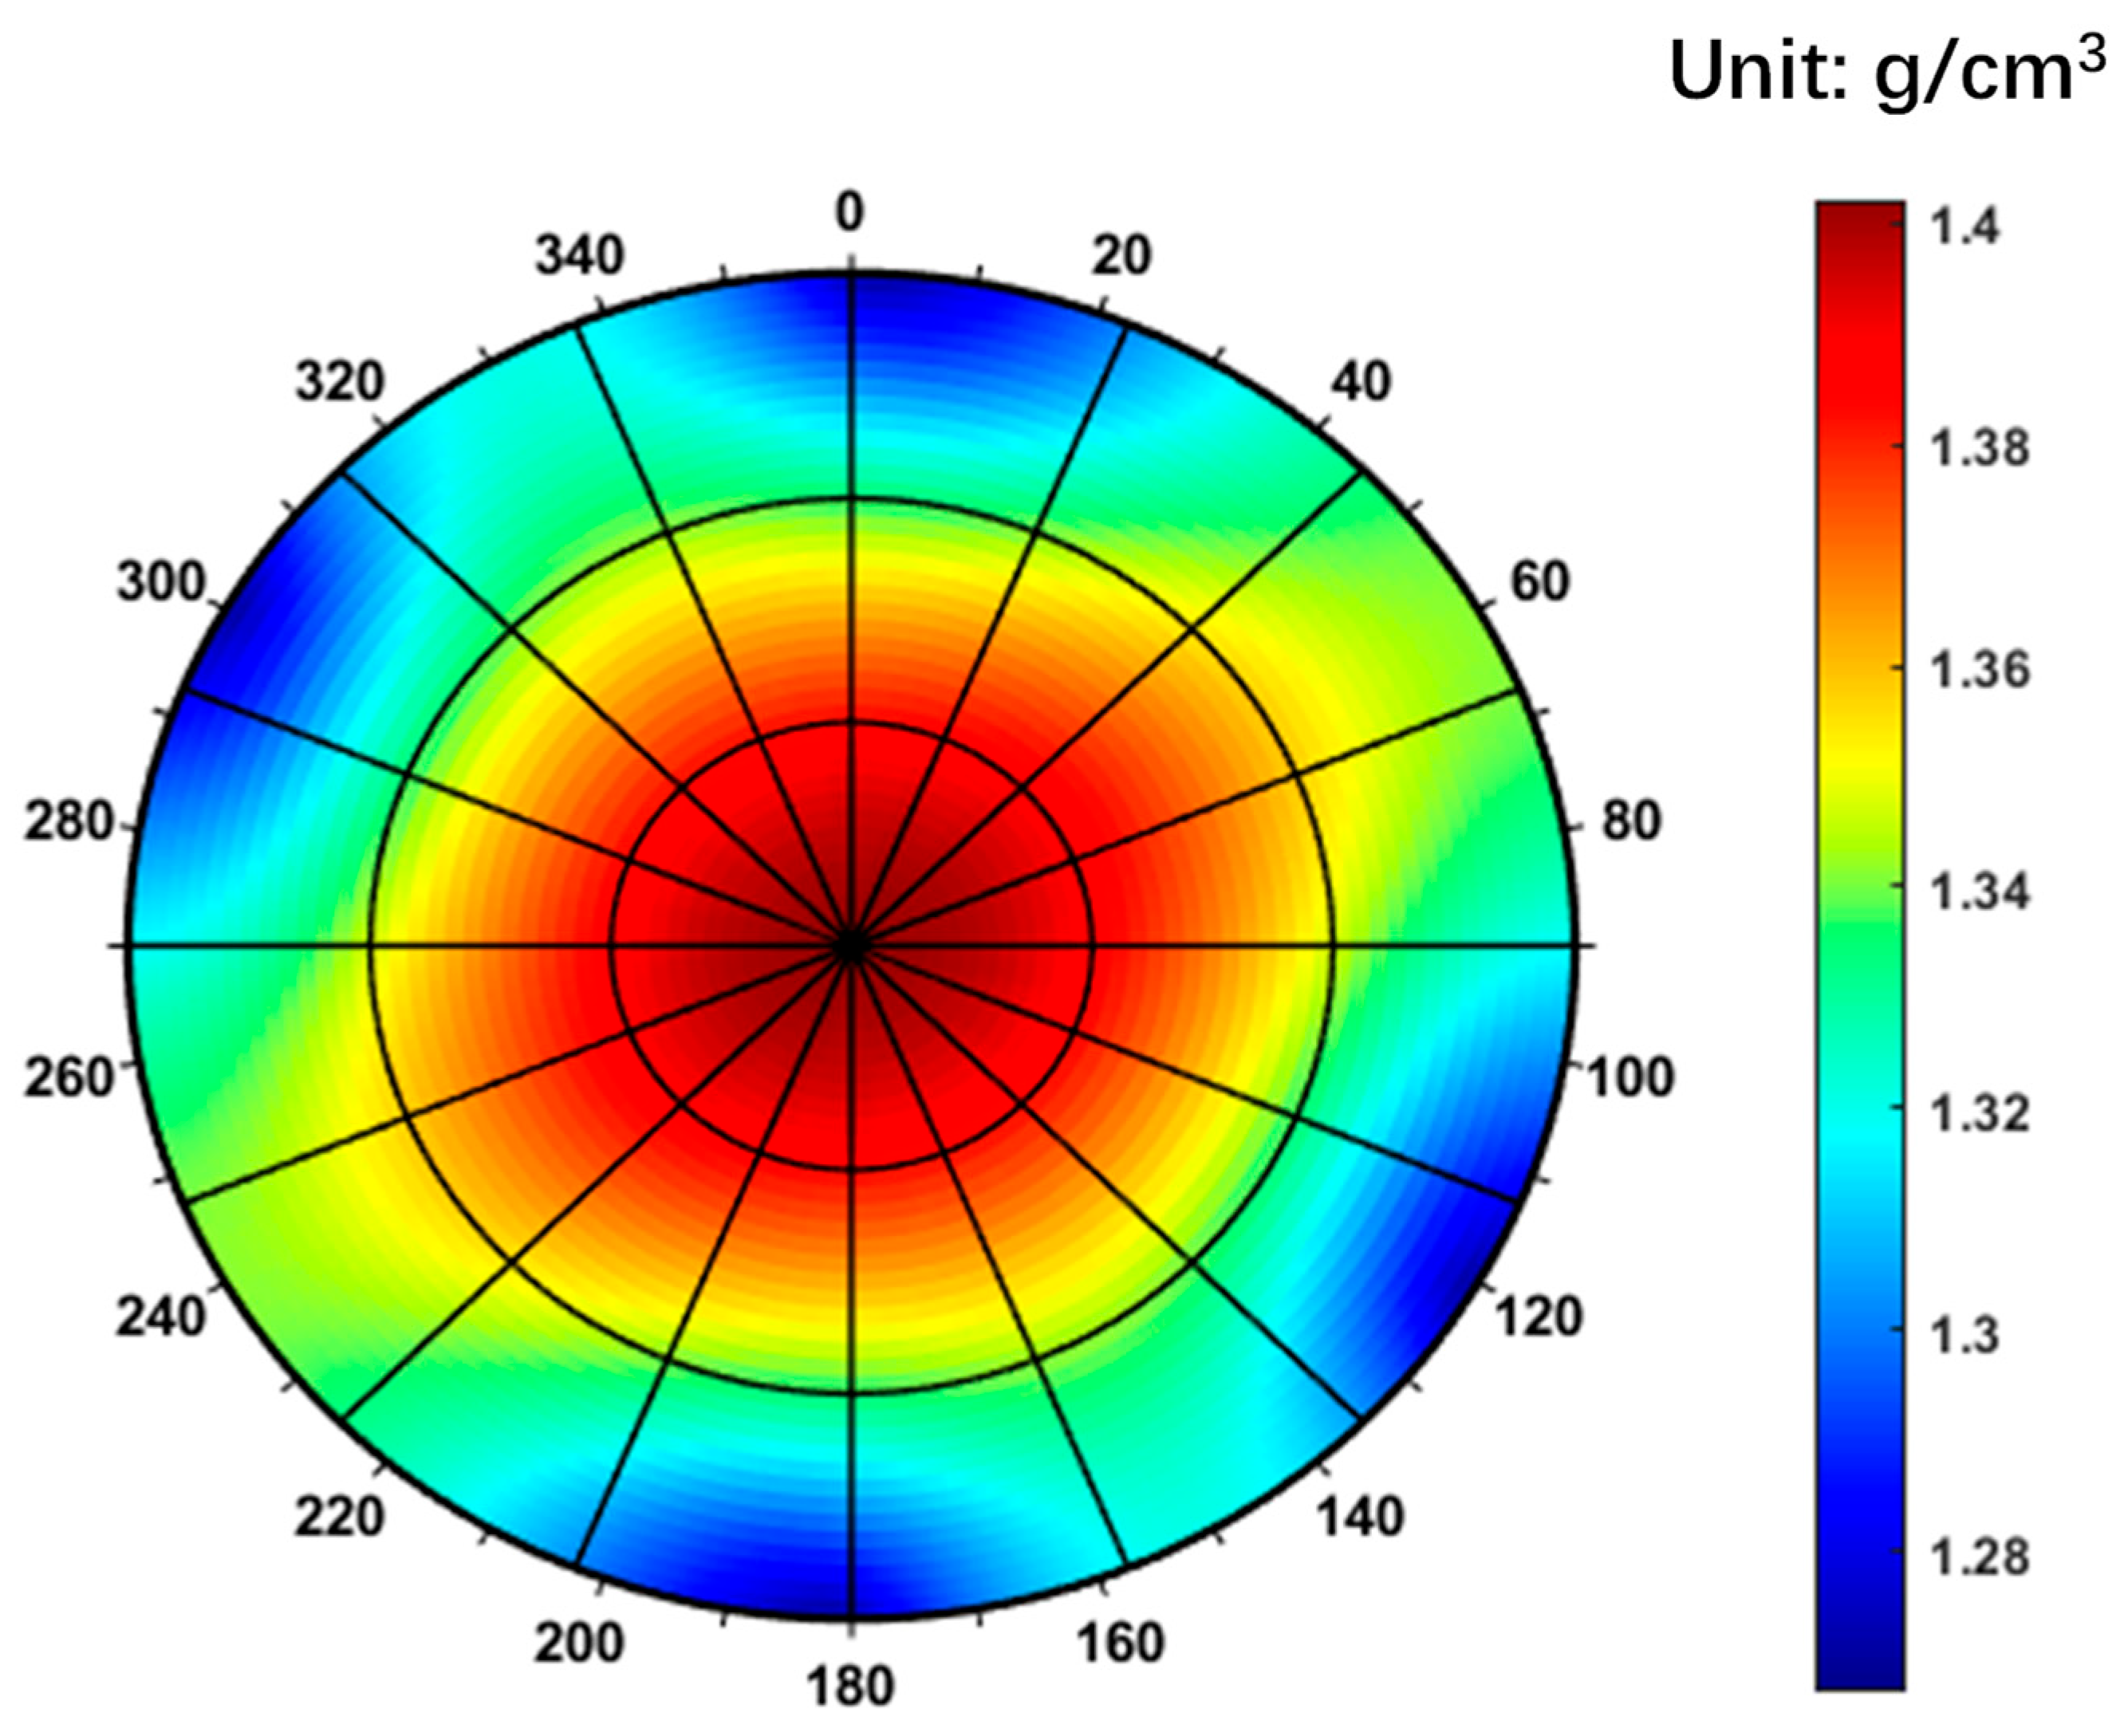
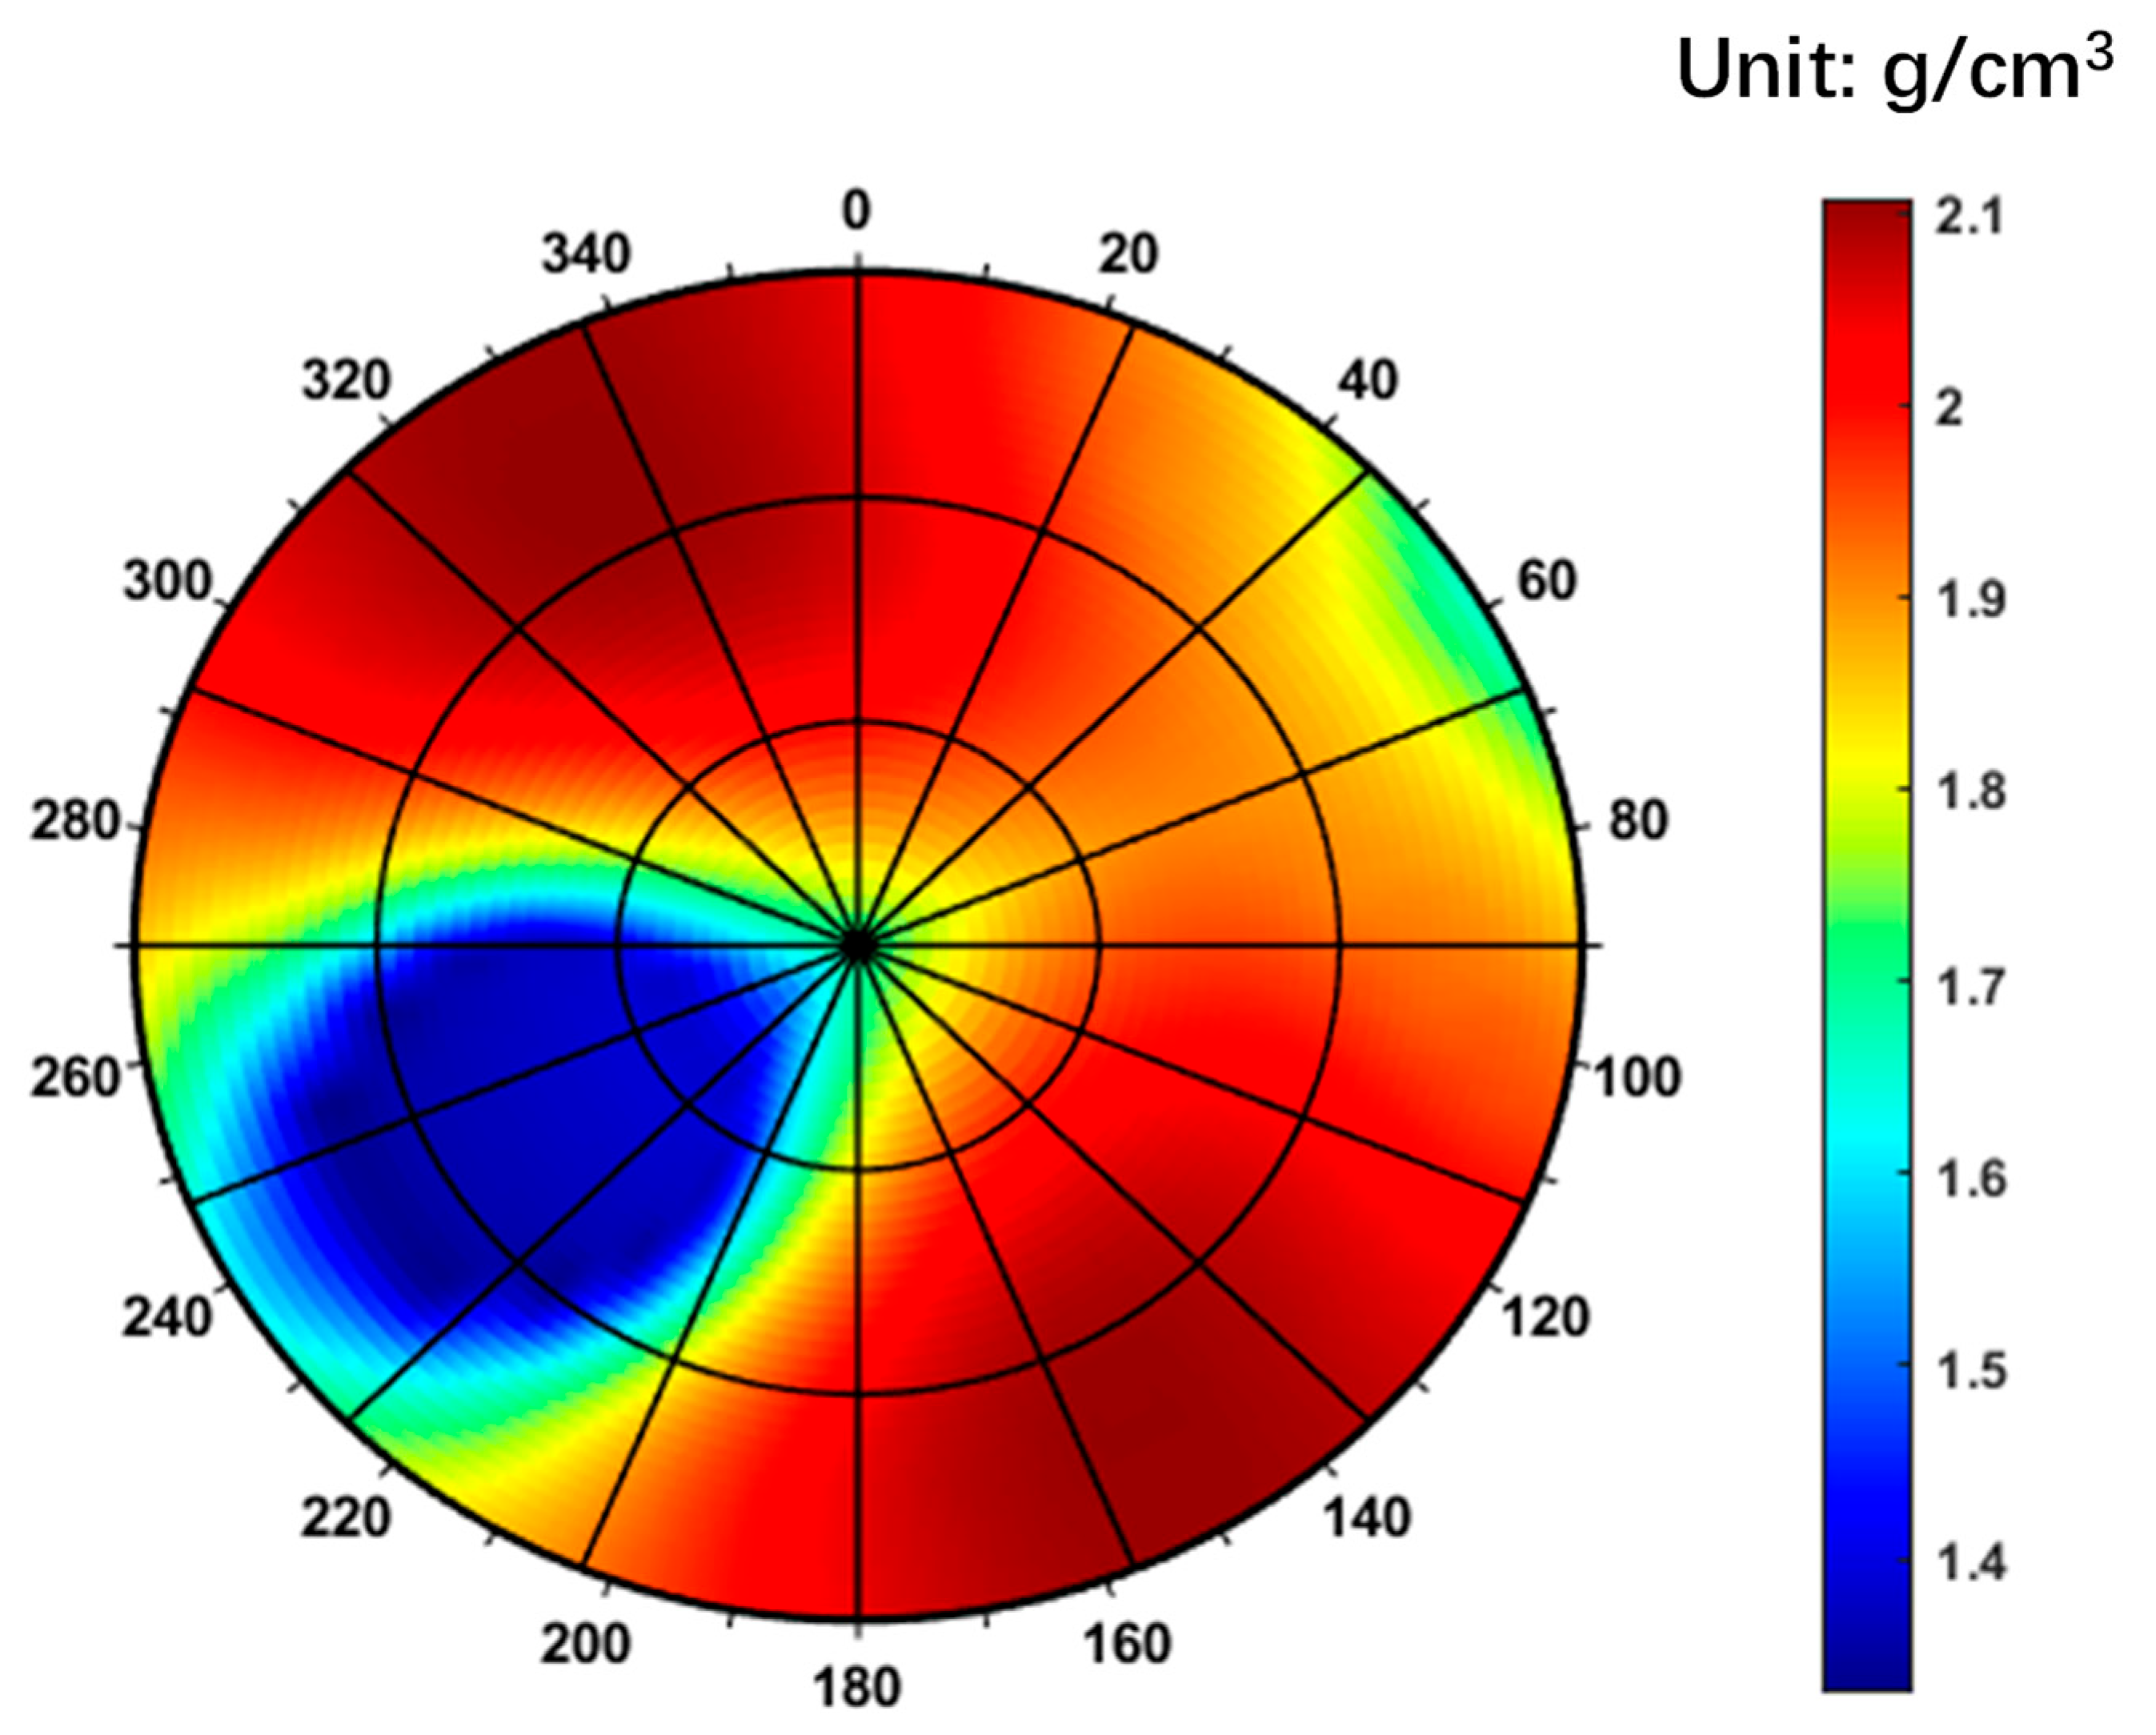
The predicted lower limits of the safe drilling fluid density window based on the Mohr–Coulomb criterion and the Single Weak Plane Criterion are presented in Figure 10 and Figure 11, respectively. In both figures, a color gradient from dark blue to dark red represents increasing values of the lower density limit. The radial axis corresponds to the well inclination angle, with 0° indicating a vertical well and 90° a horizontal well. The circumferential axis represents the wellbore azimuth, where 0° refers to true north and 90° to true east. As shown in Figure 9, the contour plot of the lower mud weight limit exhibits a symmetrical pattern aligned with the directions of the maximum and minimum horizontal in situ stresses. Collapse pressure is higher in vertical wells and relatively lower in horizontal wells. The safe drilling fluid density window ranges from 1.28 to 1.40 g/cm3. However, when formation fractures are considered, this range increases significantly to 1.40–2.10 g/cm3. Within the wellbore azimuth range of 220–260°, the wellbore collapse pressure is relatively lower.
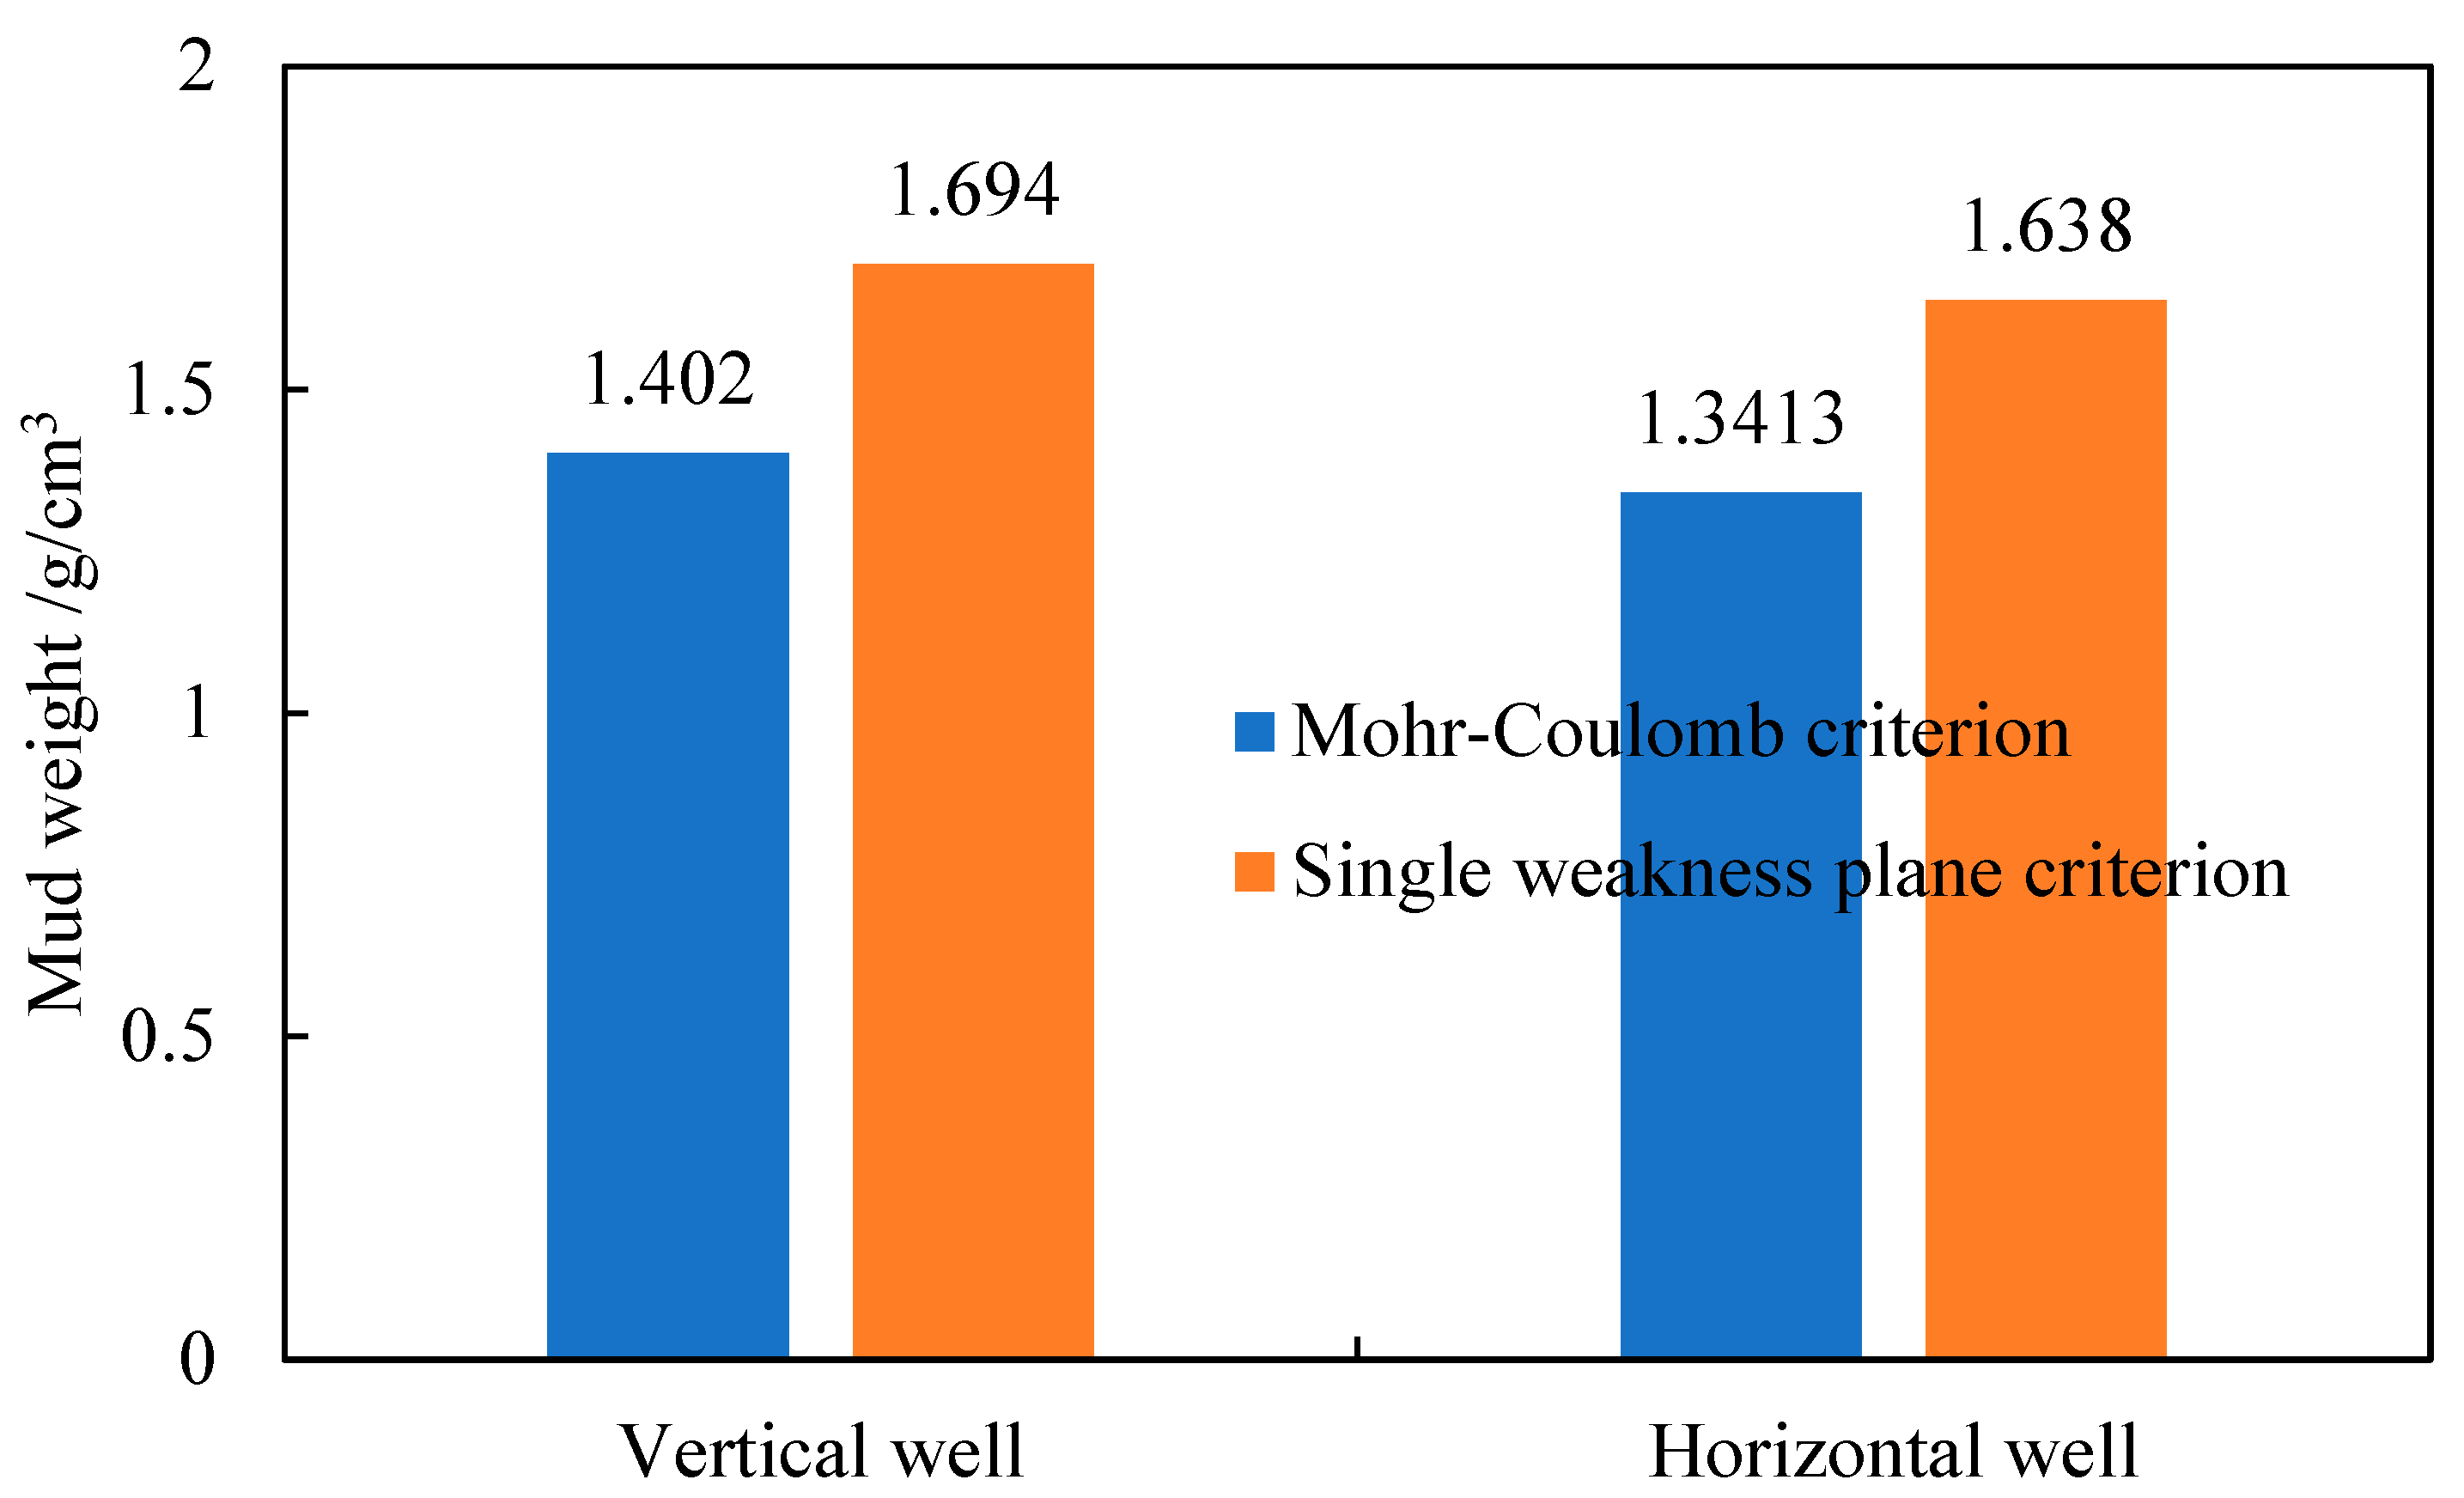
The bar chart in Figure 12 compares the lower limits of the safe drilling fluid density window for vertical and horizontal wells predicted using the Mohr–Coulomb criterion and the Single Weak Plane Criterion. The results indicate that disregarding the impact of fractures on wellbore stability would yield a recommended drilling fluid density of 1.55 g/cm3 to prevent collapse. However, when considering the extensively developed fractures in the formation, the Single Weak Plane Criterion shows that a higher density of 1.638 g/cm3 is required to ensure stability in the horizontal wellbore. The actual application of 1.55 g/cm3 resulted in wellbore collapse and instability, which is consistent with field observations and confirms the predictive accuracy of the model.

4. Conclusions

This study combines principles of elastic mechanics, Biot’s effective stress theory, and the single weak plane criterion to develop a dual-mechanism failure model for deviated wells in fractured formations. The critical wellbore pressure is efficiently solved using MATLAB’s Newton iterative method, overcoming the limitations of conventional isotropic models. Validation based on engineering data from Well THX leads to the following conclusions,
(1)
In highly fractured formations, wellbore collapse pressure is strongly influenced by fracture orientation and density. The traditional Mohr–Coulomb criterion significantly underestimates the required mud density due to its inability to account for fracture effects. When fractures are considered, the collapse pressure range widens to 1.40–2.10 g/cm3, with the most stable wellbore azimuth falling between 220° and 260°. This confirms that fractures reduce rock integrity and modify stress distribution, thereby elevating instability risks.
(2)
A mud density of 1.55 g/cm3, as derived from the Mohr–Coulomb criterion, is insufficient in fractured formations. The proposed model recommends a density of at least 1.638 g/cm3 for horizontal sections, which aligns with actual drilling experience in Well THX—where wellbore instability occurred at 1.55 g/cm3, validating the model’s accuracy.
(3)
Sensitivity analysis identifies fracture orientation as the dominant factor influencing collapse pressure. Collapse pressure increases significantly when the angle between the fracture plane and the maximum principal stress approaches the internal friction angle of the fracture. Furthermore, the interaction between in situ stress direction and wellbore trajectory results in asymmetric stress distribution. A 10° deviation in azimuth can lead to a 15% increase in prediction error.
(4)
To mitigate collapse risk, the wellbore trajectory should be optimized within the azimuth range of 220–260°, and drilling fluid density should be maintained at or above 1.638 g/cm3. In extensively fractured intervals, additional measures such as improved bridging or cement plugging are recommended to counteract hydration-induced softening.
(5)
These conclusions are primarily based on data from Well THX; thus, generalizability may be limited. Future work should incorporate true triaxial strength criteria to consider the influence of the intermediate principal stress and apply machine learning methods to address uncertainties in fracture parameters. Such enhancements will improve the model’s applicability in complex shale gas reservoirs, such as those in the Sichuan Basin, supporting safe and efficient development of unconventional resources under the “Dual Carbon” framework.

Author Contributions

Conceptualization, Y.Z.; Methodology, L.L.; Software, L.L.; Validation, L.L.; Formal analysis, L.L. and P.Y.; Investigation, Y.Z. and P.Y.; Resources, Y.Z. and P.Y.; Data curation, Y.Z.; Writing—original draft, Y.F.; Supervision, Y.F.; Project administration, Y.F. All authors have read and agreed to the published version of the manuscript.

Funding

This study was supported by no funding.

Institutional Review Board Statement

All research activities were conducted in accordance with the ethical guidelines and principles outlined by the Committee on Publication Ethics.

Informed Consent Statement

All individuals involved in this study have provided their consent for the publication of the study findings. Any personal or identifying information that could potentially compromise privacy has been carefully removed or anonymized.

Data Availability Statement

The original contributions presented in this study are included in the article. Further inquiries can be directed to the corresponding author.

Conflicts of Interest

Authors Lu Li, Yang Zhao and Yafei Fu are employed by Wulumuqi China Sinopec Northwest Oilfield Company. The remaining author declares that the research was conducted in the absence of any commercial or financial relationships that could be construed as a potential conflict of interest.

References

  1. Singh, A.; Rao, K.S.; Ayothiraman, R. An analytical solution to wellbore stability using Mogi-Coulomb failure criterion. J. Rock Mech. Geotech. Eng. 2019, 11, 1211–1230. [Google Scholar] [CrossRef]
  2. Aubertin, M.; Li, L.; Simon, R. A multiaxial stress criterion for short- and long-term strength of isotropic rock media. Int. J. Rock Mech. Min. Sci. 2000, 37, 1169–1193. [Google Scholar] [CrossRef]
  3. Zhang, C.; Zhao, J.; Zhang, Q.; Hu, X. A new closed-form solution for circular openings modeled by the Unified Strength Theory and radius-dependent Young’s modulus. Comput. Geotech. 2012, 42, 118–128. [Google Scholar] [CrossRef]
  4. Haimson, B.; Chang, C. A new true triaxial cell for testing mechanical properties of rock, and its use to determine rock strength and deformability of Westerly granite. Int. J. Rock Mech. Min. Sci. 2000, 37, 285–296. [Google Scholar] [CrossRef]
  5. Zhang, W.; Gao, J.; Lan, K.; Liu, X.; Feng, G.; Ma, Q. Analysis of borehole collapse and fracture initiation positions and drilling trajectory optimization. J. Pet. Sci. Eng. 2015, 129, 29–39. [Google Scholar] [CrossRef]
  6. Xu, K.; Liu, Z.; Chen, Q.; Zhang, Q.; Ling, X.; Cai, X.; He, Q.; Yang, M. Application of machine learning in wellbore stability prediction: A review. Geoenergy Sci. Eng. 2024, 232, 212409. [Google Scholar] [CrossRef]
  7. Muller, A.L.; do Amaral Vargas, E., Jr.; Vaz, L.E.; Gonçalves, C.J. Borehole stability analysis considering spatial variability and poroelastoplasticity. Int. J. Rock Mech. Min. Sci. 2009, 46, 90–96. [Google Scholar] [CrossRef]
  8. Zare-Reisabadi, M.R.; Kaffash, A.; Shadizadeh, S.R. Determination of optimal well trajectory during drilling and production based on borehole stability. J. Pet. Sci. Eng. 2012, 77–87. [Google Scholar] [CrossRef]
  9. Cao, W.; Liu, W.; Liu, H.; Lin, H. Effect of formation strength anisotropy on wellbore shear failure in bedding shale. J. Pet. Sci. Eng. 2012, 90–91, 107–118. [Google Scholar] [CrossRef]
  10. Dokhani, V.; Yu, M.; Miska, S.Z.; Takach, N.E.; Ozbayoglu, E.; Bloys, B. Effects of adsorptive characteristics of shale on wellbore stability. In Proceedings of the 49th US Rock Mechanics/Geomechanics Symposium, San Francisco, CA, USA, 28 June–1 July 2015; American Rock Mechanics Association: Alexandria, VA, USA, 2015. [Google Scholar]
  11. Singh, A.; Kumar, C.; Kannan, L.G.; Rao, K.S.; Ayothiraman, R. Engineering properties of rock salt and simplified closed-form deformation solution for circular opening in rock salt under the true triaxial stress state. Eng. Geol. 2018, 243, 218–230. [Google Scholar] [CrossRef]
  12. Xiang, Z.; Kang, W.-H.; Ji, Y.; Si, G.; Canbulat, I.; Lin, H.; Oh, J. Estimation of in-situ horizontal stresses based on multiscale borehole breakout data via machine learning: Model development, validation and application. Geophys. J. Int. 2025, 242, ggaf144. [Google Scholar] [CrossRef]
  13. Ma, X.; Haimson, B.C. Failure characteristics of two porous sandstones subjected to true triaxial stresses. J. Geophys. Res. Solid Earth 2016, 121, 6477–6498. [Google Scholar] [CrossRef]
  14. Charlez, P.A. The impact of constitutive laws on wellbore stability: A general review. SPE Drill. Complet. 1997, 12, 123–134. [Google Scholar] [CrossRef]
  15. Mehrabian, A. The stability of inclined and fractured wellbores. SPE J. 2016, 21, 1050–1068. [Google Scholar] [CrossRef]
  16. Zhang, L.; Zhu, H. Three-dimensional Hoek-Brown strength criterion for rocks. J. Geotech. Geoenviron. Eng. 2007, 133, 1128–1135. [Google Scholar] [CrossRef]
  17. Zhou, X.P.; Shou, Y.D.; Qian, Q.H. Three-dimensional nonlinear dynamic strength criterion for rock. J. Mater. Civ. Eng. 2015, 27, 04015047. [Google Scholar] [CrossRef]
  18. Zhou, X.P.; Bao, X.R.; Yu, M.H.; Xie, Q. Triaxial stress state of cylindrical openings for rocks modeled by elastoplasticity and strength criterion. Theor. Appl. Fract. Mech. 2010, 53, 65–73. [Google Scholar] [CrossRef]
  19. Chang, C.; Haimson, B. True triaxial strength and deformability of the German Continental Deep Drilling Program (KTB) deep hole amphibolite. J. Geophys. Res. Solid Earth 2000, 105, 18999–19013. [Google Scholar] [CrossRef]
  20. Oku, H.; Haimson, B.; Song, S.-R. True triaxial strength and deformability of the siltstone overlying the Chelungpu fault (Chi-Chi earthquake), Taiwan. Geophys. Res. Lett. 2007, 34, L09306. [Google Scholar] [CrossRef]
  21. Lee, H.; Haimson, B.C. True triaxial strength, deformability, and brittle failure of granodiorite from the San Andreas Fault Observatory at Depth. Int. J. Rock Mech. Min. Sci. 2011, 48, 894–901. [Google Scholar] [CrossRef]
  22. Sriapai, T.; Walsri, C.; Fuenkajorn, K. True-triaxial compressive strength of Maha Sarakham salt. Int. J. Rock Mech. Min. Sci. 2013, 61, 256–265. [Google Scholar] [CrossRef]
  23. Chen, S.L.; Abousleiman, Y.N. Wellbore stability analysis using strain hardening and/or softening plasticity models. J. Pet. Sci. Eng. 2012, 86–87, 109–119. [Google Scholar] [CrossRef]
  24. Kang, Y.; Yu, M.; Miska, S.; Takach, N.E. Wellbore stability: A critical review and introduction to DEM. In Proceedings of the SPE Annual Technical Conference and Exhibition, New Orleans, LA, USA, 4–7 October 2009; SPE: Richardson, TX, USA, 2009. SPE-124364. [Google Scholar]
  25. McLean, M.R.; Addis, M.A. Wellbore stability analysis: A review of current methods of analysis and their field application. In Proceedings of the IADC/SPE Drilling Conference, Houston, TX, USA, 27 February–2 March 1990; SPE: Richardson, TX, USA, 1990. IADC/SPE-19941. [Google Scholar]
  26. Plazas Niño, F.A. Wellbore stability analysis based on sensitivity and uncertainty analysis. In Proceedings of the SPE Annual Technical Conference and Exhibition, Dubai, United Arab Emirates, 26–28 September 2016; SPE: Richardson, TX, USA, 2016. SPE-184480-STU. [Google Scholar]
  27. Zhang, H.; Ren, Y.; Zhang, Y.; Zheng, S. Intelligent prediction method for fracture pressure based on stacking ensemble algorithm. J. Pet. Explor. Prod. Technol. 2023, 9, 149. [Google Scholar] [CrossRef]
  28. Barsanescu, P.; Sandovici, A.; Serban, A. Mohr-Coulomb criterion with circular failure envelope, extended to materials with strength-differential effect. J. Rock Mech. Geotech. Eng. 2018, 10, 647–669. [Google Scholar] [CrossRef]
  29. Detournay, E.; Cheng, A.H.-D. Poroelastic response of a borehole in a non-hydrostatic stress field. Int. J. Rock Mech. Min. Sci. Geomech. Abstr. 1988, 25, 171–182. [Google Scholar] [CrossRef]
  30. Zhang, M.M.; Liang, L.X.; Liu, X.J. Analysis of the Influence of Different Rock Shear Failure Criteria on Wellbore Collapse Pressure. Chin. J. Rock Mech. Eng. 2017, 36, 3485–3491. [Google Scholar]
  31. Zhang, M.; Fan, X.; Zhang, Q.; Yang, B.; Zhao, P.; Yao, B.; He, L. Influence of multi-planes of weakness on unstable zones near wellbore wall in a fractured formation. J. Nat. Gas Sci. Eng. 2021, 93, 104026. [Google Scholar] [CrossRef]
  32. Zhang, M.; Fan, X.; Zhang, Q.; Yang, B.; Zhao, P.; Yao, B.; Ran, J. Parametric sensitivity study of wellbore stability in transversely isotropic medium based on poly-axial strength criteria. J. Pet. Sci. Eng. 2021, 197, 108078. [Google Scholar] [CrossRef]
  33. Zhang, M.; Li, D.; Liu, J.; Zhang, D.; Zhang, Y.; Cui, K. The modification of Mohr-Coulomb criteria based on shape function and determination method of undetermined parameters. Mech. Mater. 2023, 185, 104772. [Google Scholar] [CrossRef]
  34. Zhang, M.; Wen, J.; Xu, Z.; Feng, J.; Zhao, X. Study of borehole stability of volcanic rock formation with the influence of multiple factors. J. Pet. Explor. Prod. Technol. 2024, 14, 3367–3382. [Google Scholar] [CrossRef]
  35. Abousleiman, Y.; Cui, L. Poroelastic solutions in transversely isotropic media for wellbore and cylinder. Int. J. Rock Mech. Min. Sci. Geomech. Abstr. 1998, 35, 171–182. [Google Scholar] [CrossRef]
  36. Tiwari, R.P.; Rao, K.S. Post failure behaviour of a rock mass under the influence of triaxial and true triaxial confinement. Eng. Geol. 2006, 84, 112–129. [Google Scholar] [CrossRef]
  37. Gao, J.; Chen, F.; Zhao, Y.; Meng, M.; Peng, H.; Bian, G.; Huang, L. Quantitative risk analysis and parameter sensitivity evaluation of wellbore instability in poroelastic media considering uncertainty of geomechanical parameters. Comput. Geotech. 2024, 170, 106234. [Google Scholar] [CrossRef]
  38. Lei, G.; Ren, J.; Liu, B.; Xiong, J.; Liu, X.; Cheng, W.; Liang, L.; Li, Z. Evolution of physical properties of Longmaxi Formation shale under scCO2-water-rock interaction and its influence on wellbore stability. Nat. Gas Ind. 2025, 45, 136–149. [Google Scholar] [CrossRef]
  39. Liu, X.; Ding, Y.; Cao, G.; Yue, Z.; Zhang, Z.; Zhang, W.; Liang, L.; Yu, X. The investigation on wellbore stability of large size borehole of upper part of ultradeep well. Coal J. 2025. [Google Scholar] [CrossRef]
  40. Zhou, Z.; Li, B.; Geng, Y.; Xiao, R. Prediction model of rock mechanics parameters in ultra-deep fractured formations based on big data. Pet. Drill. Tech. 2024, 52, 91–96. [Google Scholar] [CrossRef]
  41. Gao, S.; Bo, K.; Zhang, Y.; Gao, H.; Huangfu, J. Study on wellbore instability mechanism of continental shale reservoir in Northeastern Sichuan Basin. Drill. Fluid Complet. Fluid 2025, 42, 217–224. [Google Scholar] [CrossRef]
  42. Bai, Y.; Yang, Z.; Bai, H.; Wang, C.; Zhang, X.; Chen, Y.; Wu, H. Study on the mechanism of borehole instability in Wujiaping Formation in Hongxing area and countermeasures of drilling fluid. Fault Block Oil Gas Field 2025, 32, 685–691. Available online: https://link.cnki.net/urlid/41.1219.TE.20250425.1513.002 (accessed on 27 September 2025).
  43. Shi, X.; Zhang, Q.; Gao, L.; Zhang, H. Evaluation model and application of wellbore stability based on an improved three-dimensional Hoek-Brown strength criterion. Pet. Sci. Bull. 2025, 10, 762–777. Available online: https://link.cnki.net/urlid/10.1405.te.20250709.1509.002 (accessed on 27 September 2025).
  44. Chu, Q.; Mu, G.; Ge, C.; Zhang, T.; Yang, M.; Liu, C. Preparation and properties of a drilling fluid non-fluorescent flexible plugging. Drill. Fluid Complet. Fluid 2025, 42, 290–295. [Google Scholar] [CrossRef]
  45. He, M.; Wang, L.; Zhou, B.; Xu, M. Multi-field coupling model of wellbore stability in gas drilling horizontal wells. World Pet. Ind. 2025, 32, 82–92. [Google Scholar] [CrossRef]
  46. Yang, S.; Feng, C.; Guo, L. Experiments on the expansion, spallation and mechanical deterioration in coal rocks immersed into water-based drilling fluid. Nat. Gas Technol. Econ. 2025, 19, 15–22. [Google Scholar] [CrossRef]
  47. Zhai, K.; Dang, Z.; Chen, X.; Yang, W.; Zhao, X. Numerical analysis of in-situ stress inversion and main controlling factors of wellbore stability in the mudstone section of the Tahe Block. Chin. Q. Mech. 2024, 45, 1088–1096. [Google Scholar] [CrossRef]
  48. Fan, Z.; Song, X.; Wang, D.; Ayasrah, M.; Li, S. Poroelastic Solutions of a Semi-Permeable Borehole Under Non-Hydrostatic in Situ Stresses Within Transversely Isotropic Media. Int. J. Geomech. 2025, 25, 04024342. [Google Scholar] [CrossRef]
  49. Gao, R.; Kuang, T.; Meng, X.; Huo, B. Effects of ground fracturing with horizontal fracture plane on rock breakage characteristics and mine pressure control. Rock Mech. Rock Eng. 2021, 54, 3229–3243. [Google Scholar] [CrossRef]
  50. Gao, R.; Dou, B.; Yu, B.; Yang, T.; Meng, X.; Zhang, W. Ground fracturing of multi-strata for strong ground pressure control in extra-thick coal seams with hard roofs: Numerical simulation and case study. Eng. Fract. Mech. 2024, 303, 110129. [Google Scholar] [CrossRef]
  51. Jiang, S.; Zhang, J.; Diao, K.; Liu, X.; Ding, Z. Research Advances in Solvent Extraction of Lithium: The Potential of Ionic Liquids. Adv. Funct. Mater. 2025, 35, 2423566. [Google Scholar] [CrossRef]
  52. Yang, M.; Si, S.; Zhang, K.; Xi, M.; Zhang, W. Bridging the relationship between physical exercise and mental health in adolescents based on network analysis. PsyCh J. 2024, 13, 835–848. [Google Scholar] [CrossRef]
  53. Mehrabi, A.; Bagheri, M.; Bidhendi, M.N.; Delijani, E.B.; Behnoud, M. Improved porosity estimation in complex carbonate reservoirs using hybrid CRNN deep learning model. Earth Sci. Inf. 2024, 17, 4773–4790. [Google Scholar] [CrossRef]
  54. Moosavi, N.; Bagheri, M.; Nabi-Bidhendi, M. Hydrocarbon reservoir parameter estimation using a fuzzy Gaussian based SVR method. Bull. Geophys. Oceanogr. 2024, 65, 70. [Google Scholar] [CrossRef]
  55. Lee, H.; Ong, S.H.; Azeemuddin, M.; Goodman, H. A wellbore stability model for formations with anisotropic rock strengths. J. Pet. Sci. Eng. 2012, 96, 109–119. [Google Scholar] [CrossRef]
  56. Zhang, X.; Li, J. Advancements and challenges of high-speed active flow control: Plasma actuators. Int. J. Heat Mass Transf. 2025, 252, 127481. [Google Scholar] [CrossRef]
  57. Li, J.; Zhang, X. Active flow control for supersonic aircraft: A novel hybrid synthetic jet actuator. Sens. Actuators A Phys. 2020, 302, 111770. [Google Scholar] [CrossRef]
  58. Gao, X.; Wang, M.; Shi, X.; Li, C.; Zhang, M. Risk Assessment Method for Analyzing Borehole Instability Considering Formation Heterogeneity. Processes 2024, 12, 70. [Google Scholar] [CrossRef]
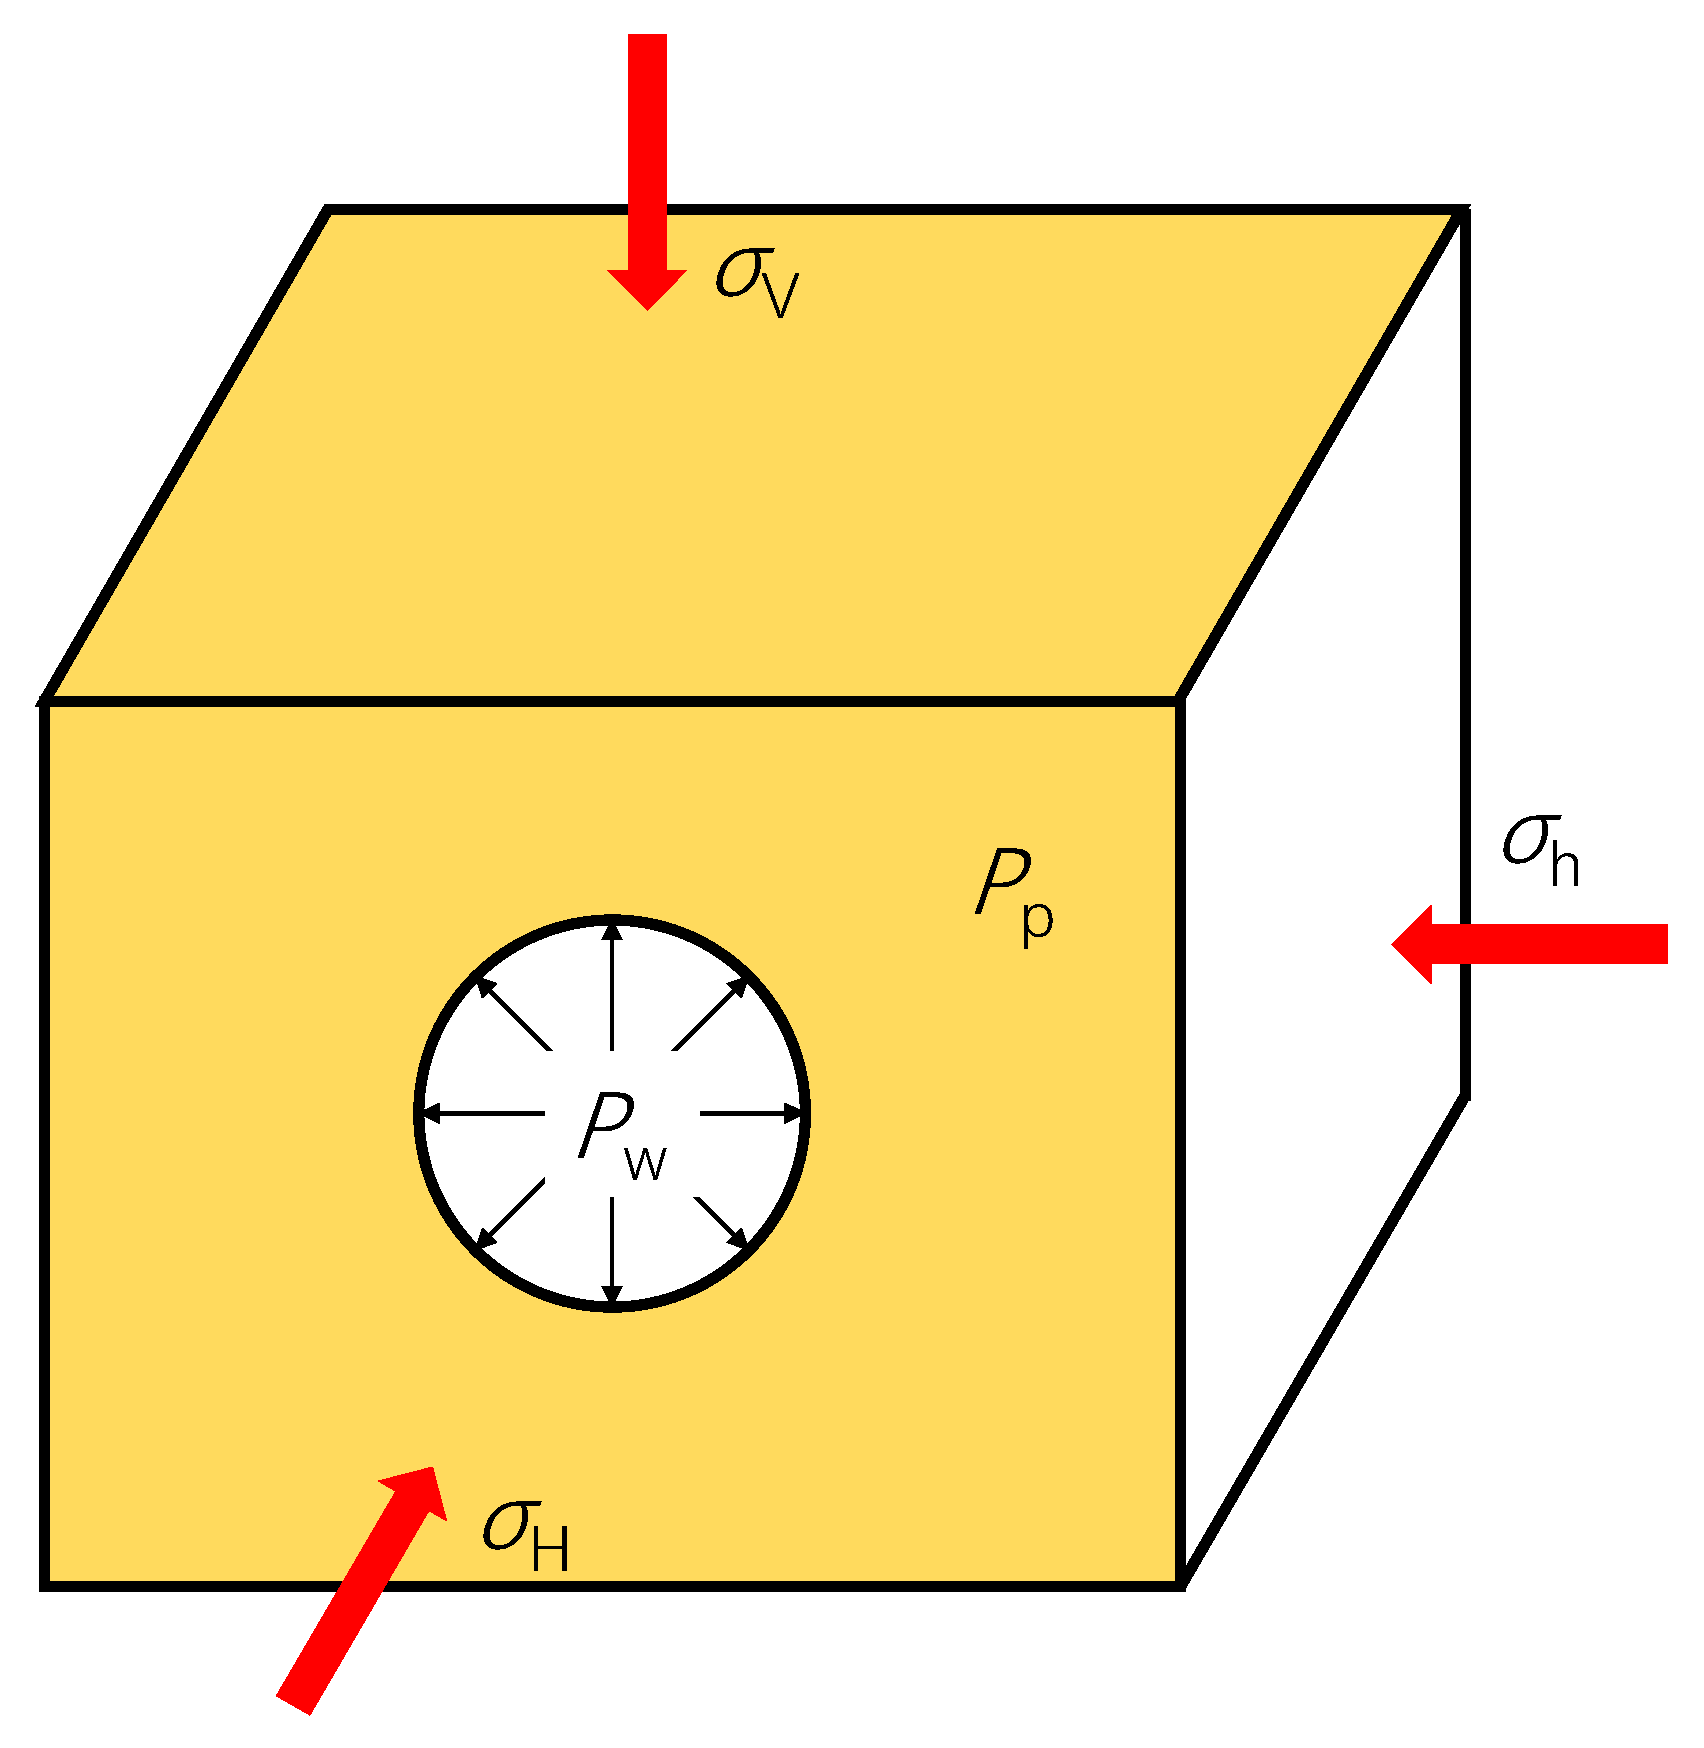
Figure 1. Schematic diagram of boundary stresses acting on a wellbore after drilling into the formation [31].
Processes 13 03769 g001
Figure 2. Transformation relationships between stresses in the wellbore cylindrical coordinate system and the geodetic coordinate system, in situ stress coordinate system, and wellbore Cartesian coordinate system [31].
Processes 13 03769 g002
Figure 3. Schematic diagram of the conversion between rectangular and polar coordinate systems [31].
Processes 13 03769 g003
Figure 4. Stress State of the Rock Unit at the Wellbore Wall.
Processes 13 03769 g004
Figure 5. Limit distribution characteristics of the MC criterion in principal stress space and on the π-plane [58]. (a) Yield surface in principal stress space; (b) Yield curve on the π-plane.
Processes 13 03769 g005
Figure 6. Varying strength envelope of the Single Weak Plane Criterion in the σ1-β plane.
Processes 13 03769 g006
Figure 7. Orientation of formation fractures in geodetic coordinates.
Processes 13 03769 g007
Figure 8. Collapse pressure contour predicted by the degenerated thermal-hydraulic-mechanical wellbore stability model.
Processes 13 03769 g008
Figure 9. Collapse pressure contour predicted by the model of Lee et al. (2012) [55].
Processes 13 03769 g009
Figure 10. Lower limit of the safe drilling fluid density window predicted by the Mohr–Coulomb criterion.
Processes 13 03769 g010
Figure 11. Lower limit of the safe drilling fluid density window predicted by the Single Weak Plane Criterion.
Processes 13 03769 g011
Figure 12. Comparison of prediction results.
Processes 13 03769 g012
Table 1. Inputting parameters.
Well depth, m4800Maximum horizontal in situ stress, MPa97.05
Minimum horizontal in situ stress, MPa83.45Overburden pressure, MPa94.35
Formation pressure, MPa52.7In situ stress orientation, °60
Biot’s coefficient0.8Poisson’s ratio0.22
Intact rock friction angle, °30.8Intact rock cohesion, MPa25.06
Fracture friction angle, °12.9Fracture cohesion, MPa9.03
Fracture plane dip direction, °60Fracture plane dip angle, °45
Disclaimer/Publisher’s Note: The statements, opinions and data contained in all publications are solely those of the individual author(s) and contributor(s) and not of MDPI and/or the editor(s). MDPI and/or the editor(s) disclaim responsibility for any injury to people or property resulting from any ideas, methods, instructions or products referred to in the content.