


Abstract
Aortic valve calcification is the process of calcium buildup on the leaflets of the aortic valve, preceding functional insufficiency. Calcification underlies the development of aortic stenosis by stiffening the valve leaflets, leading to restricted aortic valve opening during systole and obstructed blood flow. However, a more comprehensive understanding of the hemodynamic effects of altered valve properties is required. Therefore, it is crucial to investigate the biomechanical properties of aortic valve leaflets susceptible to calcification. To examine fluid flow in an aorta segment with leaflets of different stiffness, a two-way fluid–structure interaction model was developed. The leaflet’s behavior was modeled using two constitutive laws—linear-elastic and isotropic hyperelastic—followed by numerical testing and comparative analysis. Using the material parameter values and within the ranges of 22–60 and 22–60 kPa, respectively, the hyperelastic model was examined. The valve leaflets’ Young’s modulus ranged from 1 to 22 MPa, while their Poisson’s ratio ranged from 0.35 to 0.45. A high correlation between Poisson’s ratio and wall shear stress was found. With an elastic modulus of 22 MPa and the highest Poisson’s ratio of 0.45, the maximum wall shear stress was 81.78 Pa during peak flow velocity and complete valve opening, while the lowest wall shear stress was 0.38 Pa. We can infer from the study’s results that, when considering the isotropic structure and nonlinear characteristics of valve leaflets, the Delfino hyperelastic model more accurately depicts their complex behavior.
1. Introduction
Aortic valve calcification is a progressive pathology involving the deposition of calcium on the valve leaflets, causing structural and functional changes [1,2]. Recent years have witnessed a significant increase in research activity dedicated to this condition, underscoring its clinical importance due to its high prevalence and serious clinical outcomes [3].
The pathogenesis of aortic valve calcification is complex and multifactorial [4]. Degenerative changes, including age-related [5,6] and stress-induced cellular senescence [7,8], initiate a cascade of pathological events, notably atherosclerosis [9]. Chronic inflammatory diseases such as rheumatoid arthritis [10,11,12] and metabolic disorders including dysglycemia [13,14] contribute significantly to the pathogenesis. The potential influence of external factors should also be considered. Understanding the interplay of these mechanisms is crucial for the development of effective preventive and therapeutic strategies.
The deposition of calcium increases leaflet rigidity, impairing its opening and leading to aortic valve stenosis [15,16]. This causes narrowing of the left ventricular outflow tract and elevates myocardial workload. Furthermore, leaflet calcification can result in valvular insufficiency, allowing blood to flow back into the left ventricle [17]. These hemodynamic disturbances raise the risk of serious cardiovascular problems, including myocardial infarction and heart failure [18], highlighting the importance of prompt diagnosis and appropriate intervention [19].
For more detailed study of this pathology and its influence on aortic valve function, mathematical modeling methods are widely used. Their application provides a quantitative assessment of key hemodynamic indicators, such as wall shear stress [20,21], turbulent kinetic energy [22,23,24,25], effective orifice area (EOA) [26], and geometric orifice area (GOA) [27]. Analyzing a combination of these parameters enables predictions regarding the progression of pathologies [28,29,30] and the outcomes of surgical interventions [31,32]. Additionally, these models support the development of decision-support systems for clinicians [33,34,35]. Further advancements include the integration of artificial intelligence methods for analyzing medical images [36,37] and detecting pathologies [38,39]. Modeling hemodynamics in calcified leaflets can help to assess the degree of pathology and develop a strategy for further treatment. Some of the characteristics evaluated in the clinic are peak velocity and pressure gradient [40,41]. FSI modeling can allow us to estimate these parameters in silico [42,43].
Research on aortic valve modeling adopts a comprehensive, multiscale perspective that spans tissue biomechanics and structural properties [19], intercellular interactions reported by [44], the influence of anatomical features on hemodynamics and hemodynamic behavior under varying leaflet thicknesses described by [16,45,46], side-specific flow patterns on the fibrosa and ventricularis surfaces documented by [47,48], and mechanical responses across pathological stages including explicit disease-progression models reported by [45,49,50].
There are multiple works dedicated to research into aortic valve hemodynamics using hyperelastic models. It was revealed that the aortic valve demonstrates predominantly anisotropic behavior [51], which requires us to take into account the orientation of the fibers and other structural components.
Earlier attempts were made to model calcium accumulation on the leaflets within the collagen fiber network [52], as well as to look at the influence of calcium [53,54,55,56,57,58] on the aortic valve hemodynamic environment [59,60].
Despite significant progress, the impact of leaflet stiffness degree on hemodynamics remains a relevant issue and holds undoubted interest for practical application [61]. In this study, we use fluid–structure interaction (FSI) numerical simulation methods to analyze the influence of varying leaflet stiffness. Particular attention is paid to comparing several models describing the mechanical properties of the leaflets, as well as simulating cases with geometric calcification. The aim of this work is to evaluate the effectiveness of existing models and to identify the one that best reflects the physical properties of the aortic valve and its influence on hemodynamics at various levels of leaflet stiffness.
2. Materials and Methods
The key challenge in computational modeling of the aortic valve is to select a setting that can reliably reproduce soft tissue deformations and the effects of progressive calcification at an acceptable computational cost. Morphological changes were taken into account in two ways: implicitly, through the modification of material parameters in constitutive relations, reflecting tissue compaction and reduced compliance, and explicitly, through the introduction of calcification foci on the aortic valve leaflets into the geometric model. The present study aims to compare these approaches in terms of their impact on velocity and pressure fields, key hemodynamic characteristics, and the sensitivity of results to model parameters, allowing for a quantitative assessment of the contribution of calcification to aortic valve flow impairment.
2.1. Leaflet Geometry
In this study, the three 3D models of a tricuspid aortic valve leaflet in the aorta segment for healthy and calcified state were developed in a commercial software package COMSOL Multiphysics 6.2 (Comsol Inc., Stockholm, Sweden).
To generate the aortic valve leaflet models, the key form parameters defined aortic root radius and leaflet height relative to the aorta. Logarithmic functions were used to mathematically describe the leaflet curvature shape.
The valve leaflet geometry was built up in accordance with a set of curves based on Formulas (1)–(4) (Figure 1a):
where R represents the valve circumference radius, H is the leaflet height, and K and F are curvature parameters. To complete the leaflet, the curves were rotated by copying at angles of −20°, −40°, and −60° successively (Figure 1b).
Figure 1.
Aortic valve leaflet: (a) aortic valve leaflet shape; (b) geometrical models of three leaflets.
A custom software tool was developed to facilitate the design of aortic valve leaflet geometries for FSI calculations. This COMSOL Multiphysics platform-based software provides a user-friendly interface with several key features. Geometries can be designed according to parameters ,, , and . All ranges are chosen to match as closely as possible to real valve leaflet anatomy.
Initially, a plane perpendicular to the radius of one of the sectors is drawn to define a curve describing the shape. This leaflet geometry is entirely described by a system of functions derived from a series of curves, each defined by rotating a plane along its surface (Figure 2A). Hence, the geometry of a single leaflet is obtained (Figure 2B).
Figure 2.
Geometry steps generation: (A) valve leaflet shape forming curves ; (B) curves surface; (C) full valve leaflet; (D) three leaflets of aortic valve; (E) geometry connecting the valve leaflets; (F) the final generated aortic valve leaflets with radius 10.35 mm, height 11.89 mm, thickness 0.5 mm, K = 0.7, F = 3.08, and n = 5 according to the developed software; and (G) designed geometry of aorta segment with leaflets.
Next, the «Loft» modifier was used to merge these curves into a continuous plane. To ensure the correct dimensions, this plane was trimmed using a cylinder of radius R, resulting in the finalized leaflet geometry (Figure 2C). The leaflet was then replicated by rotation at 120° and −240° to form a complete set of three leaflets (Figure 2D). o design the aortic valve wall, a cylinder of radius R was generated (Figure 2E). Unnecessary portions of the cylinder were removed to achieve the final wall geometry (Figure 2F). This method ensures that the constructed valve accurately reflects the required dimensions and curvature. After that, leaflets were imported into the cylinder, which represents blood volume in FSI simulations (Figure 2G).
2.2. Calcified Geometry
Leaflets design generation software (1.0) was adopted to develop leaflet geometries with calcium deposits. We developed two approaches based on image processing of the patient’s calcified leaflets. The first approach deals with the direct design of calcified leaflets by specialized software. The second approach assumes the implementation of surface equations. Let us describe these approaches in more detail.
Firstly, three leaflets containing calcific deposits were cut during the Ozaki procedure and photographed. Images were provided by the S.G. Sukhanov Federal Center for Cardiovascular Surgery. Images were anonymized. The study was approved by the Ethical Committee (protocol No. 85 on 7 October of 2025) and written informed consent was obtained. After that, images were imported into Comsol Multiphysics software (Comsol Inc., Stockholm, Sweden). A height map was constructed based on the color range of the images obtained using Comsol Multiphysics. Using COMSOL’s function capabilities, an imported color or grayscale pixel-based image can be mapped to a scalar function. This scalar function reflects the spatial distribution of calcification across the valve leaflet. The calcifications with the larger deposit accumulation had a more distinct warm color, while the valve itself was white. To generate this function, COMSOL automatically determined the minimum and maximum values based on the color range, mapping the lowest intensity (soft aortic valve tissue) to the highest (calcification regions). This established a scale for height distribution. As a result, a normalized height map in the range from 0 to 1 was obtained. The maximum thickness of the calcification was also measured for each valve. The map of calcium deposit thicknesses was obtained by combining these data. In the third stage, the thickness map of the leaflets was reproduced using 3D modeling in Blender.
Another approach assumes the projection of thickness map onto the surface of the leaflet by using following equations:
where —equation of leaflet surface, —thickness map function and —resulted shape function of calcification pattern on leaflet. Figure 3 contains a non-calcified leaflets model (Figure 3a), calcified leaflets model (Figure 3b) with geometry designed by Equation (5), and calcified leaflets model with geometry designed by Blender 4.5.4 software (Blender Foundation, Rotterdam, The Netherlands) (Figure 3c).
Figure 3.
(a) Non-calcified leaflets model for healthy state; (b) calcified leaflets model 1 based on projection algorithm; and (c) calcification state 2 based on Blender sculpting calcification pattern creation (images were provided by S.G. Sukhanov Federal Center for Cardiovascular Surgery).
2.3. Mesh and Mesh Convergence
An accurate and well-constructed computational mesh is essential for effectively simulating fluid–structure interaction (FSI) phenomena, where the intricate interplay between fluid dynamics and structural mechanics must be captured with high fidelity. In this study, we utilized COMSOL Multiphysics (COMSOL Inc., Stockholm, Sweden) to generate the meshes for both fluid and solid domains. To ensure the reliability of our simulations, we conducted a mesh convergence analysis using material properties of E=1 MPa and μ = 0.35. During the convergence study, various finite element mesh configurations were examined, details of which are provided in Table 1. The minimum element sizes for the solid and fluid meshes were carefully determined based on the smallest characteristic dimensions of the structural features, aiming to adequately resolve critical areas subject to high gradients. This approach allowed us to identify an optimal mesh that strikes a balance between computational efficiency and solution accuracy. While all tested meshes produced convergent results, the discrepancies in key computational outcomes—such as the peak fluid velocity, the von Mises stress within the solid, and the wall shear stress at the fluid–structure interface—were negligible between Mesh 3 and Mesh 4. This observation is illustrated in Figure 4b–d, where the dependence of these variables on the mesh density is plotted. The minimal differences indicated that further mesh refinement beyond Mesh 3 did not yield significant improvements in accuracy, thus confirming the mesh independence of the results. It can be observed that the values of the investigated parameters stabilize with mesh refinement.
Table 1.
Number of mesh elements.
Figure 4.
(a) Mesh of the valve with the segment of aorta; mesh convergence: (b) maximum velocity, (c) maximum von Mises stress, (d) wall shear stress, and (e) spatial velocity distribution.
However, focusing on Mesh 2 during the analysis of peak velocity and maximum wall shear stress, a sharp jump in values is apparent, confirming the necessity of mesh convergence studies and the search for optimal mesh sizes (Figure 4).
Consequently, Mesh 3 was selected for all subsequent analyses. The finalized meshes comprised 344,106 elements for the fluid domain and 38,201 elements for the solid domain. To enhance the resolution of near-wall phenomena, especially in flows with pronounced boundary layer effects, the fluid mesh incorporated five inflation layers adjacent to the walls. The first layer had a thickness of 0.3 mm, with a growth rate of 1.3 for each successive layer. This meshing strategy is crucial for accurately capturing shear stresses and velocity gradients close to solid boundaries. The minimum element sizes were set to 0.25 mm for the solid domain and 0.4 mm for the fluid domain. These dimensions were chosen to ensure sufficient detail in areas with steep stress gradients and complex flow features, respectively. Although the use of a refined mesh increased computational demands, the trade-off was justified by the enhanced accuracy and reliability of the simulation results.
2.4. Mathematical Formulation
In this study, the governing equations for fluid and solid domains were solved using the commercial package COMSOL Multiphysics. An incompressibility equation and Navier–Stokes equations, which are expressed in ALE formulation, were written to describe fluid flow in fluid domain ΩF:
where is the fluid velocity, is grid velocity, is the stress tensor, is the fluid density, is the pressure, is the shear stress tensor, and is body force.
To describe the leaflet dynamics, we used the equation of motion for the rigid body:
where us is solid deformation, and S are Cauchy stress and the second Piola–Kirchhoff stress tensors, respectively, F and j are the deformation gradient tensor and its Jacobian, respectively, and is the force per deformed volume. The formulation for S depends on the choice of material constitutive law. The FSI interface should satisfy the following conditions: displacements of the fluid and solid domains should be compatible, tractions at this boundary must be at equilibrium, and a no-slip condition for the fluid should satisfy wall motion.
2.5. Material Characteristics
Accurate modeling of aortic valve motion under blood flow requires accounting for the corresponding structure material properties for each scenario considered. All values for material properties for valve simulation cases are represented in Table 2.
Table 2.
Constitutive parameter values for used models.
2.5.1. Fluid Properties
The blood domain is assumed to be an incompressible Newtonian fluid with a constant density kg/m3 and viscosity Pa⸱s [66]. With a Reynolds number Re = 2239, calculated for the case of E = 22 MPa and ν = 0.45, the flow pattern is presumed to be laminar.
2.5.2. Aortic Valve Properties
To simulate non-calcified aortic valve leaflets model, two material models were investigated: isotropic and anisotropic hyperelastic.
The isotropic hyperelastic model provides a refined representation of the nonlinear stress–strain relationship. The mechanical behavior of aortic valve leaflets can be approximated by the model that Demiray and Delfino presented [67,68]:
where the strain energy density is defined by two parameters, (Pa or kPa) and (dimensionless), and the first invariant of the isochoric elastic right Cauchy–Green strain tensor , which is found as , where is the right Cauchy–Green strain tensor, is the unit tensor, and is the tensor trace.
Furthermore, this study considers the case of hyperelastic anisotropic model, the modified Holzapfel–Gasser–Ogden model, extended with the Delfino component, which takes into account the radial and circumferential orientation of collagen and elastin fibers, respectively:
where represents the fiber stiffness (Pa), is a dimensionless tuning parameter, is the dimensionless parameter of fiber dispersion, and the invariant represents the squared value of the elastic stretch in the fiber direction .
Moreover, two models were employed to simulate calcified aortic valve leaflets.
The first is the isotropic linear-elastic material model, which was considered to simulate the mechanical behavior of the calcified leaflets. We take into account soft tissues properties in the calcific state by the homogenization of their properties with the Young’s modulus and Poisson’s ratio. Thus, in previous studies it has been shown that 2 MPa and below is associated with healthy aortic valve state, and up to 10 MPa and 20 to 24 MP are associated with a moderately and severely calcified state, respectively [53].
In addition, this model accounted for the geometrical configuration of calcification. The leaflet’s behavior was characterized by the Delfino model, whereas the calcium deposits’ response under blood flow was represented with a linear-elastic constitutive law.
2.6. Boundary Conditions
To obtain a closed system for all the equations described in Section 2.4, it is necessary to define the initial and boundary conditions.
2.6.1. Fluid Domain
The velocity blood flow profile obtained from echocardiography data is set at inlet:
The pressure is determined at the outlet boundary using a two-element Windkessel model (Figure 5):
where is the flow rate in aorta (mL/s), is the characteristic resistance (mmHg∙mL−1∙s), is the peripheral resistance (mmHg∙mL−1∙s), and is arterial compliance (mL/ mm Hg). and represents the aortic pressure (mm Hg) and pressure stored within the Windkessel model (mm Hg) at time t, respectively.
Figure 5.
Three-dimensional model and boundary conditions.
The first-order differential Equation (16) was solved numerically using fourth-order Runge–Kutta. At the current time step, we computed using the value of defined by the Runge–Kutta solution at the same time step. The model parameters are presented in Table 3.
Table 3.
Windkessel model parameters.
The values for diastolic and systolic pressures were taken as 80 mmHg and 120 mmHg, respectively.
2.6.2. Solid Domain
The aortic root and sinuses were modeled as a rigid domain, with the only deformable components being the leaflets, which were fixed and constrained to the aortic walls:
where is the solid displacement.
Two-way FSI requires the equality of displacements and stress across the fluid–solid interface:
2.7. Numerical Methods
To numerically solve the FSI problem using the finite element method (FEM), the governing equations are first transformed into their weak forms and then discretized. This transformation is essential for applying the FEM, which relies on the weak formulation of differential equations [69,70].
Within the software package, this weak form derivation proceeds by multiplying each governing equation with suitable test functions and integrating across the corresponding domains [71]. These test functions—, for fluid velocity and q for fluid pressure—are selected from appropriate function spaces to satisfy boundary conditions and ensure numerical stability. Specifically, the Navier–Stokes equations are multiplied by these test functions and integrated over the fluid domain to yield the weak form of the fluid dynamics equations, neglecting body forces. Coupling conditions at the interface are incorporated into the variational formulation through interface integrals or by appropriate selection of the test functions. The fluid velocity, pressure, and solid displacement, along with their corresponding test functions, are then approximated using shape functions.
Subsequently, these finite element approximations are substituted into the weak forms. Performing numerical integration (e.g., using Gaussian quadrature) over each element then generates the local stiffness matrices, mass matrices, and force vectors. To construct the global system, these local contributions are assembled into global matrices and vectors, accounting for element connectivity. Finally, boundary conditions—inclusive of the coupling conditions at —are incorporated into the global system, potentially modifying the matrices and vectors to enforce the necessary constraints. Solution of the resulting nonlinear system is then achieved using a Newton–Raphson iterative method [72].
2.8. FSI Problem Formulation and Settings
The COMSOL Multiphysics software (Comsol Inc., Stockholm, Sweden) suggests the PARDISO as a default direct solver in 3D. The nonlinear method is set to Constant Newton.
The leaflet hemodynamics is described using the FSI formulation for blood flow field and deformable leaflets domains.
The problem is solved in a coupled formulation, considering fluid–solid interactions. The mathematical formulation is supplemented by the conditions of coordination of velocities and stresses on the fluid–solid interface:
where n is the outward unit normal vector to the solid boundary.
This paper presents the implementation of an Arbitrary Lagrangian–Eulerian FSI (ALE-FSI) approach using the COMSOL Multiphysics software environment. This method is utilized to solve complex FSI problems by effectively coupling fluid dynamics and solid mechanics. The core concept of this approach lies in combining the Eulerian description of fluid flow with the Lagrangian representation of solid deformation. The forces generated by the fluid flow cause deformation in the solid structure, which in turn influences the movement of mesh nodes within the computational domain. The fluid flow is described by the Navier–Stokes equations, accounting for the viscosity and incompressibility of the fluid. The resultant force acting on the solid body, which determines its mechanical response, is calculated based on the interaction stresses at the fluid–solid interface:
where is the velocity field, determined by the Navier–Stokes equations, is pressure, is dynamic viscosity, n is exterior normal to the solid boundary, and I is identity tensor.
Since the Navier–Stokes equations are solved on a moving mesh using the ALE formulation, and the solid mechanics equations are solved in a Lagrangian framework where the mesh moves with the solid, the fluid forces acting on the solid must be carefully transformed and transferred across the interface to ensure accurate coupling between the fluid and solid domains:
where is the ratio between mesh element sizes in the laboratory and material coordinate systems.
3. Results
This study is devoted to influence of the material parameters of linear-elastic, isotropic and anisotropic hyperelastic models on mechanical and fluid dynamic characteristics of the aortic valve, including fluid flow velocity, leaflet extension, vertical displacement, von Mises stress, volumetric strain, and wall shear stress. The work also involves studying the hemodynamics of a calcified aortic valve, with the pathological condition represented by mathematical and geometrical models.
Based on a comprehensive review and analysis of the literature on hemodynamic modeling of the aortic valve, commonly used material property values were selected. The analysis was performed using 12 different combinations of Young’s modulus and Poisson’s ratio, along with 25 combinations of Delfino material parameters. For the anisotropic case, 18 parameter sets were considered. Additionally, in the explicit modeling of aortic calcification, two geometric configurations were considered, using similar material model parameters.
The influence of mathematical model coefficients on computed metrics was examined. For generating the plots, a range of values was taken for one material parameter while varying it, with the second parameter held constant, as depicted by the shaded area.
Two geometries for calcified state were generated and their hemodynamic parameters computed. All obtained results are displayed in the graphs alongside other investigated models.
3.1. Velocity Field
Figure 6 depicts the opening and closing phases of the aortic valve in healthy (a–c) and calcified (d,e) states.
Figure 6.
The aortic valve displacement and velocity field distribution during the cardiac cycle for the (a) isotropic hyperelastic model with = 35 kPa, and = 35; (b) anisotropic hyperelastic model with = 35 kPa, = 35, = 35 kPa, = 100 kPa, and = 80; (c) linear-elastic model with E = 1 MPa, and μ = 0.35; (d) aortic valve with calcium deposits, geometry 1; and (e) continuous calcified aortic valve, geometry 2.
During gradual opening, blood flow achieves peak velocities over the Valsalva sinuses. After peak systole, as velocity diminishes, vortices develop, predominantly in the Valsalva sinuses. At the beginning of diastole, the valve leaflets start to close with the reduction in left ventricular pressure. The vortices formed in the sinuses contribute to the tight closure of the valve and prevent regurgitation.
In the calcified case, due to the asymmetric distribution of calcification, flow asymmetry is evident, as the affected leaflet experiences unstable displacement. The asymmetric calcification pattern redirects flow towards the inner aortic walls, resulting in recirculation back towards the affected leaflet and promoting its premature closure. Due to the restricted opening ability, associated with altered morphology from calcification, peak blood flow velocities are observed to be significantly high for the heart to pump a sufficient volume of blood. Calcification introduces instability, rendering the flow chaotic and unsteady, leading to turbulence.
3.1.1. Non-Calcified Leaflets Model
The modeling hyperelastic isotropic Delfino case indicates that this approach more accurately captures the behavior of the aortic valve leaflets throughout the cardiac cycle. All plots in Figure 7a demonstrate a similar pattern. Observation reveals that an increase in any of the Delfino model’s material parameters corresponds to elevated blood flow velocities. Figure 7a also highlights that the second parameter has a greater influence on the distribution of values, as evidenced by the width of the shaded areas.
Figure 7.
The flow velocity integral features for the (a) isotropic hyperelastic model, (b) anisotropic hyperelastic model, and (c) linear-elastic model for both parameters and calcified states.
The peak velocity for the first parameter of the model ranges between 1.31 m/s and 1.36 m/s, while that for the second parameter ranges from 1.35 m/s to 1.39 m/s.
Due to the anisotropic nature of soft tissues, arising from their fibrous structure, the modified Holzapfel–Gasser–Ogden model with Delfino isotropic part provided the highest accuracy. The graphs in Figure 7b nearly match throughout the simulated cardiac cycle, differing only during complete valve closure. These deviations reflect the impact of the aortic valve’s tissue structure.
In the cases considered, peak velocities range from 1.27 to 1.28 m/s. This demonstrates that, despite the significant influence of isotropy (peak velocity of 1.3 m/s), anisotropy also makes a contribution, which is responsible for a more accurate representation of the behavior.
3.1.2. Calcified Leaflet Model
Numerical simulations for the linear-elastic model were conducted to analyze the influence of Young’s modulus and Poisson’s ratio on blood flow velocity through aortic valve leaflets. The analysis revealed that blood flow velocity through the aortic valve leaflets is predominantly influenced by Young’s modulus. The influence of Poisson’s ratio is shown as modulus shaded areas.
The results, illustrated in Figure 7c, demonstrate that larger Young’s modulus values correspond to increased flow velocities, ranging from 1.64 m/s to 3.08 m/s. The impact of Poisson’s ratio is also apparent, particularly at more advanced stages of calcification.
The stiffening of the aortic valve leaflets leads to increasing peak flow velocities. Leaflets with higher resistance to deformation restrict blood flow through the aorta, concentrating all flow in the valve orifice area. Conversely, more elastic leaflets allow for lower blood flow, which means that the aortic valve becomes more susceptible to deformation leading to the increased opening area of the valve, allowing a greater volume of blood to pass through the leaflets and increasing risk of regurgitation.
Maximum flow velocity reaches 1.78 m/s for the geometry with continuous calcification along the leaflets, and 1.66 m/s for the geometry with calcium deposits. These values are substantially higher than those obtained for the isotropic and anisotropic hyperelastic models (Figure 7a,b). A linear-elastic model, with a Young’s modulus from E = 1 to E = 8 MPa, provides a good approximation for the flow velocity across the leaflets of both geometries (Figure 7b).
3.2. Aortic Valve Motion and Strain
Aortic valve motion, which includes valve displacement along the aorta and elongation, allow us to determine how changing the model parameters will affect their behavior and the overall hemodynamic efficiency of the valve. Those parameters are calculated over the aortic valve surface and averaged over time. The elongation of the leaflets is related to their displacement under the influence of blood flow, both in the linear- and hyperelastic models.
Volume deformations of the aortic valve leaflets, characterized by changes in their initial volume, allow for an assessment of how alterations in model parameters will affect the internal structure of the tissue, as well as the overall geometry and function of the valve, including the formation of micro-damage within the tissues.
An expected observation is that calcification disrupts the symmetric opening of the valve, as is evident in Figure 8. Valve calcification leads to reduced leaflet mobility, which, depending on the pattern and degree of calcification, affects the opening of other leaflets. In Figure 8, the calcification is distributed quite uniformly; however, even in this case, asymmetry in valve opening is apparent. It is also observed that calcification, by altering the valve’s morphology, influences the opening area, reducing it.
Figure 8.
The aortic valve displacement distribution during the cardiac cycle for the isotropic hyperelastic model with = 35 kPa, and = 35; the anisotropic hyperelastic model with = 35 kPa, = 35, = 35 kPa, = 100 kPa, and = 80; and the linear-elastic model with E = 1 MPa, μ = 0.35; aortic valve with calcium deposits, geometry 1; continuous calcified aortic valve, geometry 2.
3.2.1. Non-Calcified Leaflets Model
Figure 9, Figure 10 and Figure 11 illustrate the aortic valve leaflet deformations and volumetric strain sensitivity to changes in Delfino model parameters. It is observed that higher and values yield greater leaflet displacement (Figure 9a), elongation (Figure 10a), and volumetric change (Figure 11a).
Figure 9.
The aortic valve integral displacement for the (a) isotropic hyperelastic model, (b) anisotropic hyperelastic model, and (c) linear-elastic model for both parameters and calcified states.
Figure 10.
The aortic valve extension for the (a) isotropic hyperelastic model, (b) anisotropic hyperelastic model, and (c) linear-elastic model for both parameters and calcified states.
Figure 11.
The aortic valve integral volumetric strain for the (a) isotropic hyperelastic model, (b) anisotropic hyperelastic model, (c) linear-elastic model for Young’s modulus, and the (d) linear-elastic model for Poisson’s coefficient and calcified states.
The coefficient determines tissue stiffness and closure dynamics. A decrease in leads to a rapid decline in the graphs. The influence of is less pronounced during full valve opening, as evidenced in Figure 9a and Figure 10a. Numerical modeling results reveal that increasing the material parameters leads to greater elasticity in the aortic valve leaflets. This behavior is opposite to that of a linear-elastic model.
Specifically, maximum volumetric deformations occur much earlier, preceding full valve opening. Furthermore, the investigated model shows a strong parameter influence on volumetric strain. Additionally, for or , the maximum volumetric change exceeds the initial volume.
Analysis of the graphs for the anisotropic model (Figure 9b, Figure 10b and Figure 11b) reveals that during tight leaflet coaptation, valve deformation is less attributed to its displacement relative to the attachment area due to blood flow forces. Collagen and elastin fibers, in conjunction with the sinuses of Valsalva, ensure tight closure and redistribute mechanical stresses.
During blood ejection from the left ventricle, significant differences in deformations are observed due to the leaflets’ compliance. At the peak of valve opening, upon reaching the tensile limit, curves for the tissues converge throughout the cardiac cycle. At the moments of valve closure, fiber stretch reaches maximum values, similar to those observed during full opening. During diastole, displacement values decrease, which is attributed to tissue elasticity, the sinuses of Valsalva, and myocardial relaxation.
The simulation results indicate that maximum valve displacements relative to the attachment occur at coefficients of and , whereas maximum elongations are observed at and Furthermore, the coefficients exhibit a notable mutual influence.
The profiles illustrating volumetric strains within the valve during the cardiac cycle show consistent patterns across different fiber material parameter values (varying and ), suggesting that these parameters have a minimal impact when altered. The largest values align with peak velocity and the point of complete opening. The maximum values are observed at and
3.2.2. Calcified Leaflet Model
Figure 9c illustrates the variation in leaflet displacement throughout the cardiac cycle as a function of Young’s modulus and Poisson’s ratio. Excessive stiffness restricts leaflet opening, limiting aortic blood flow, while insufficient stiffness increases sensitivity to blood flow, potentially leading to aortic regurgitation. Moreover, significant elongations (Figure 10c) are observed at low Young’s modulus values, indicating that more elastic leaflets are more prone to deformation under flow conditions.
Figure 11c,d demonstrate that reduced elasticity in the valve leaflets is associated with an increase in volumetric deformation. Young’s modulus values between 15 and 22 MPa may signify valve calcification, while values close to 1 MPa may be indicative of abnormal blood flow. These observations underscore the importance of material properties in determining the mechanical behavior of the aortic valve leaflets. Understanding the inter-play between Young’s modulus and Poisson’s ratio is crucial for accurate modeling of valve mechanics and can inform the design of artificial valves, as well as improve the diagnosis and treatment of valve pathologies. Regardless of Young’s modulus, the lowest volumetric deformations are observed at Poisson’s ratio of 0.4. Deviations from a Poisson’s ratio of 0.4 (Figure 11d), in either direction, result in increased volumetric deformation or a wider range of measured values.
The deformation characteristics of the aortic valve differ between the constructed geometries. Specifically, the model with calcium deposits exhibits greater leaflet deformation at peak systole and is also more susceptible to deformation during diastole, compared to the geometry with continuous calcification.
Findings suggest that leaflets with lower calcification exhibit reduced susceptibility to destructive deformation under blood flow, differing from the isotropic and anisotropic hyperelastic behaviors. However, it is observed that the geometric incorporation of calcification on the leaflet demonstrates higher elasticity compared to a case with a Young’s modulus of E = 1 MPa when mathematically accounted for.
The volumetric strain evolution for the investigated calcification geometries exhibits considerable variation. The aortic valve with calcification distributed across its leaflets experiences greater deformation compared to the valve with calcium nodules. Comparing the calcification modeling results, it is observed that both models fall within the range of values of the linear-elastic model with E = 1 MPa. Interestingly, for the continuous calcified valve, the aortic valve’s volumetric strain over the cardiac cycle aligns with the predictions of the isotropic hyperelastic model with coefficients and kPa. However, the behavior patterns diverge significantly: explicit calcification causes a much faster and stronger decay in deformation.
3.3. Aortic Valve Wall Shear Stress and Von Mises Stress
Von Mises stress is critical for predicting the start of plastic deformation in a material under a complex stress state. The aortic valve experiences intense cyclic loading, making the calculation of this parameter crucial to identifying regions of high stress concentration, studying the effect of pathological conditions on the mechanical behavior, and gaining insights into the underlying causes of valve diseases. Von Mises stresses are evaluated over the entire aortic valve.
The shear stress vector can be defined as follows:
The wall shear stress vector can be written as:
The time-averaged wall shear stress magnitude:
The distribution of wall shear stress along the aortic valve leaflet represented in Figure 12.
Figure 12.
The aortic valve wall shear stress distribution during cardiac cycle for the isotropic hyperelastic model with = 35 kPa and = 35; anisotropic hyperelastic model with = 35 kPa, = 35, = 35 kPa, = 100 kPa, and = 80; and the linear-elastic model with E = 1 MPa, μ = 0.35; aortic valve with calcium deposits, geometry 1,; continuous calcified aortic valve, geometry 2.
Regarding stress distribution, it is observed that the commissures (Arantius nodules) and leaflet edges are the most susceptible to high stresses. Calcification significantly elevates leaflet stresses, as evidenced in Figure 12. Graphs demonstrate that the ventricular layer of the aortic valve leaflet, facing the left ventricle, experiences greater stress than the fibrous layer facing the ascending aorta. This is a consequence of the intense blood flow from the left ventricle, subjecting the leaflets to substantial mechanical loads and stresses.
3.3.1. Non-Calcified Leaflets Model
Figure 13a shows the relationship between the model parameters for the hyperelastic isotropic Delfino model and the von Mises stress, demonstrating that the stress increases with the growth of either parameter.
Figure 13.
The aortic valve integral von Mises stress for the (a) isotropic hyperelastic model, (b) anisotropic hyperelastic model, and the (c) linear-elastic model for both parameters and calcified states.
At the beginning of the graphs, a small stress jump is observed, which may be attributed to the initial ejection phase of blood from the left ventricle—at this moment, the valve opens rapidly and abruptly. During diastole, small stress fluctuations are recorded, as the valve is tightly closed and does not experience strong loads—the internal structure of the valve redistributes stresses, preventing its damage. However, a significant influence of the coefficient on the state of the closed valve during diastole is noticeable, whereas critical changes in the parameter values during systole manifest with changes in the coefficient .
Figure 14a shows how wall shear stresses vary with the parameters of the isotropic hyperelastic model. For both model parameters, oscillations are visible at the beginning of valve opening. The first parameter, , has a greater influence on the model’s oscillating response, as seen in the graph. At peak velocity, the maximum wall shear stress of 51.49 Pa is reached when = 22 kPa and = 22 kPa.
Figure 14.
The aortic valve integral wall shear stress for the (a) isotropic hyperelastic model, (b) anisotropic hyperelastic model, and the (c) linear-elastic model for both parameters and calcified states.
With the anisotropic hyperelastic model, the graphs show oscillations, especially as the valve opens and closes. The parameters have a major effect on the curves, with higher values making the curves smoother. These oscillations are a direct result of stress redistribution inside the leaflet. The model is sensitive to these parameters when loads are highest. Peak von Mises stress occurs when the material parameters are = 20 kPa and = 60.
Regarding wall shear stress, Figure 13b and Figure 14b show oscillations in the graphs at the moments when the leaflets open and begin to close. The parameters and have a similar influence. During blood ejection from the left ventricle, it can be observed that as parameter increases, the amplitude of the parameter under consideration also increases, and the influence of coefficient also increases. Conversely, at the beginning of diastole, as decreases, the influence of becomes significant. As both coefficients increase, the peaks on the graphs become slightly higher and wider, indicating a stronger and more prolonged response of the model at larger values of and . The highest wall shear stress values are observed when the material parameters of the investigated model are = 20 kPa and = 60.
3.3.2. Calcified Leaflet Model
In the case of the linear-elastic model, Figure 13c illustrates the dependence of von Mises stress on Young’s modulus and Poisson’s ratio. The von Mises stress in the aortic valve leaflets increases with rising leaflet elasticity. Notably, at a Young’s modulus of 22 MPa, there is a strong dependence of leaflet behavior on Poisson’s ratio. More compliant leaflets, which contain higher concentrations of elastin, reduce the high radial stresses that arise from peak forward blood flow through the fully open valve.
A strong correlation between wall shear stresses and Poisson’s ratio was observed (Figure 14c). At an elastic modulus of 22 MPa and the highest Poisson’s ratio of 0.45, the maximum wall shear stresses reached 81.78 Pa during complete valve opening, while the minimum wall shear stresses were 0.38 Pa. This level of leaflet stiffness is associated with pathological findings.
Poisson’s ratio and wall shear stresses correlation arises from the deformation induced by ratio. Variations in coefficient directly modulate the degree of transverse deformation when the leaflet is loaded. At high stiffness, where longitudinal deformation is strongly resisted, the effect of Poisson’s ratio (responsible for transverse deformations) becomes more explicit with changes. This leads to alterations in the valve leaflet’s geometric shape under blood flow, impacting the flow dynamics, vortex formation, and consequently, the wall shear stresses distribution.
Analysis of the explicit calcification models reveals that the von Mises stress profiles during the cardiac cycle are similar in behavior. Nevertheless, the aortic valve with continuous calcification experiences higher stress levels, reaching 3.44 MPa, than the valve with calcium deposits, which reaches 2.3 MPa.
Comparing the hemodynamic modeling results for these geometries with others, it can be noted that the von Mises stress values are significantly higher than those for the isotropic and anisotropic hyperelastic models. In relation to the linear-elastic model, the von Mises stress profile for the geometry with calcium deposits falls within the range of a Young’s modulus from E = 15 MPa to E = 22 MPa, while the model with continuous calcification exhibits results above E = 22 MPa.
It can also be observed that the aortic valve with calcium deposits exhibits greater sensitivity to wall shear stresses, reaching 39.92 Pa, compared to valves with discrete calcium deposits, which reach 39.37 Pa. When the valve opens, stress builds up faster in the model with calcium deposits. However, even though the maximum stress it reaches is lower than in the continuous calcified valve, the stress fades away more slowly when the valve closes.
The achieved values of wall shear stresses for this model are significantly higher than those achieved for the aortic valve model with isotropic and anisotropic properties. In comparison with the mathematical model of calcification, the wall shear stresses for the explicit geometries fall within the range of a Young’s modulus of E = 1 MPa.
4. Discussion
In this study, we investigated the influence of the stiffness of the aortic valve material model on its hemodynamics. The problem was solved using a fluid–structure interaction (FSI) approach implemented in the COMSOL Multiphysics software package. To evaluate the impact of the material model parameters, we calculated and analyzed several key indicators, including fluid flow velocity, leaflet elongation under the action of flow, vertical displacements of the leaflets due to fluid flow, von Mises stresses, and wall shear stresses on the aortic valve.
To analyze the results of the numerical experiments, we plotted the variations in these characteristics over the full cardiac cycle. The qualitative assessment of the computed parameters revealed that increasing the Young’s modulus and both model parameters for the isotropic model leads to a higher peak blood flow velocity through the aortic valve leaflets. This increase in stiffness contributes to elevated values of von Mises stresses, wall shear stresses, and the degree of internal deformations within the valve. Conversely, decreasing the Young’s modulus and , , renders the valve leaflets more sensitive to the fluid flow, significantly affecting their vertical displacements and elongation. A strong dependence on the coefficients and is observed during the phase when blood is ejected from the left ventricle into the aorta, which causes the valve leaflets to open. This dependence is also evident during diastole, when the valve begins to close. Our findings validate that incorporating anisotropy into the aortic valve model leads to a more precise representation of its behavior under blood flow.
The findings from our investigation into aortic valve calcification modeling led to several significant conclusions relevant for valve hemodynamics simulation. In this work, we considered two approaches to defining aortic valve calcification: using a mathematical biomechanical model that describes the behavior of the pathological valve as a structure with uniformly distributed properties, and using geometries that included the valve in a non-pathological state along with calcification as separate entities. Consequently, the linear-elastic model, employed to represent calcification, can only provide an approximate description of the pathology. Numerical experiments suggest that the geometric model of calcification is more sensitive to blood flow forces. Furthermore, the specific calcification pattern used in the geometry construction impacts the outcomes: the continuous calcified model exhibits higher peak velocity and maximum stress values than the model with calcium deposits on the leaflets, yet this geometry is less prone to deformation.
These conclusions are consistent with the findings reported in other studies [73,74,75]. The results highlight the critical role of material stiffness and calcification allocation in the mechanical behavior and hemodynamic performance of the aortic valve, emphasizing the importance of accurate material modeling in simulations of cardiac valve dynamics.
4.1. Geometry Generation
One of the key aspects of this study was the methodology for constructing geometric models of the aortic valve. As a result, we developed a software module for creating parameterized geometries of the aortic valve leaflets and the aortic root.
It is worth noting that this is an emerging area in biomechanical research, as evidenced by numerous studies [65,76,77]. These works propose both similar approaches [78,79,80], based on geometric parameterization of the aortic valve leaflets, and alternative methodologies [81,82], in which the geometry of the valve leaflets is obtained by deforming a cylindrical sample divided into three sectors.
Both approaches have their advantages and disadvantages. For example, the deformation approach more accurately models the contact between leaflets but depends heavily on the choice of material properties. In contrast, the advantages of the geometrically parameterized approach lie in obtaining a set of control parameters, which can be varied to generate numerous variations in the shapes and sizes of the aortic valve leaflets.
The latter is particularly relevant considering the development of neural networks in the field of bioengineering [83,84,85], which require large volumes of data for training, including geometric models. By advancing the methodology proposed in our work, we can create synthetic geometries for training neural network-based models [86].
Based on statistical data on the sizes and shapes of the aortic valve [87,88], the geometric models generated using our developed software module can reproduce valve leaflet shapes and sizes that closely resemble real anatomical structures. This capability is crucial for creating realistic simulations and for enhancing the accuracy of computational models used in cardiovascular research.
4.2. Velocity Field
Modern computational modeling enables the acquisition of prognostic information about the hemodynamics of the cardiovascular system that is not accessible through standard medical methods [89,90]. Detailed 2D and 3D models allow for the consideration of numerous factors influencing the functioning of biomechanical systems, such as pressure, detailed anatomy, feedback mechanisms within the circulatory system, and deformation of the vascular walls [91,92,93].
This approach provides a non-invasive means of determining various hemodynamic parameters that facilitate the monitoring of pathological developments. All characteristics are highly dependent on both the hemodynamic environment under consideration and the morphological features of the studied solid structures.
In this study, one of the key parameters examined is the blood flow velocity. An increase in peak velocity is a consequence of changes in the structural and morphological properties of the valve itself, specifically an increase in its stiffness. The obtained results are consistent with the findings and hypotheses described in the works of Salmon and Nowak [94,95] and they also correlate with the main criteria for the classification of aortic stenosis proposed by Baumgartner et al. [96].
The obtained velocity distribution results for the linear-elastic model correlate with the values reported [53,97]. As evident from Figure 6, increased valve stiffness resulting from calcification leads to augmented vortex formation and intensity within the Valsalva sinuses, thereby altering the hemodynamic profile [53]. Furthermore, asymmetric calcification patterns lead to varied velocity flow distributions, a trend also observed in prior research. The obtained velocity profiles reveal a pattern identical to that described in [98]. Concerning the isotropic and anisotropic models, the ranges of our obtained values are consistent with the results from [99].
Analyzing the aortic valve simulation results using three different constitutive models yields several conclusions. For the linear-elastic model, the Young’s modulus is the dominant factor influencing velocity changes (Figure 15a), while the Poisson’s ratio has negligible effect. The isotropic model exhibits an increasing, near-linear behavior where both coefficients significantly affect the results similarly. In the anisotropic hyperelastic model, the first coefficient defines the nonlinear characteristics, and the second controls an increasing, near-linear response.
Figure 15.
Linear-elastic model: (a) peak velocity (diamonds correspond to Young’s modulus values: E = 1 MPa, E = 8 MPa, E = 15 MPa, E = 22 MPa), (b) maximum volumetric strain at different values of Poisson’s ratio (circles correspond to Young’s modulus values: E = 1 MPa, E = 8 MPa, E = 15 MPa, E = 22 MPa), (c) maximum wall shear stress at different values of Young’s modulus, (d) maximum von Mises stress (triangles correspond to Young’s modulus values: E = 1 MPa, E = 8 MPa, E = 15 MPa, E = 22 MPa).
The results of the calcification modeling indicate that a linear-elastic model can approximately describe the distribution of blood flow velocity through the valve.
A key observation from the obtained results is that the valve exhibiting the greatest susceptibility to deformation under blood flow distributed over the entire aortic valve leaflet. This advanced calcification poses a risk of leaflet rupture.
4.3. Aortic Valve Motion, Stress, and Strain
The investigation of the mechanical behavior of aortic valve leaflets plays a crucial role in the development of models that can provide prognostic recommendations to medical professionals. Analysis of the stress–strain state of the aortic valve can provide a more complete description of the soft tissue structure, its tendency towards plastic deformation, and potential rupture.
By conducting a series of numerical experiments, we analyzed data related to displacements, deformations, and stresses in the aortic valve leaflets. A similar approach is observed in existing studies [100], which examine both native valves and prostheses made from bovine tissues with subsequent processing [101], as well as polymeric materials [102,103,104].
Our findings suggest that increased valve stiffness, arising from parameter changes, results in decreased leaflet compliance under flow, thus hindering valve opening [53]. The results reveal that the isotropic aortic valve model exhibits more rigid behavior compared to the anisotropic model. The consideration of anisotropy results in lower stress magnitudes, with stresses distributed more broadly along the leaflet, consistent with conclusions from previous studies [99,105].
The simulation results suggest that the displacement and elongation parameters of the valve leaflets are correlated across all models. In the linear-elastic model, increasing the material’s stiffness via the Young’s modulus leads to a reduction in deformation and displacement values. For the isotropic hyperelastic model, higher parameter values correspond to increased leaflet displacements. The anisotropic model exhibits a nonlinear relationship between deformations and the variation in both parameters, which are related to the isotropic component.
It is important to highlight that, in the linear-elastic model, the Young’s modulus and Poisson’s ratio together influence volumetric deformations. Specifically, increasing the stiffness reduces volumetric deformations, while an increase in Poisson’s ratio results in a larger decrease in this parameter (Figure 15b). For the isotropic hyperelastic model, increasing the parameters also causes a decline in deformation values. The results from the anisotropic model show a nonlinear dependence of volumetric deformations on the variation in both parameters.
Regarding the von Mises stresses, in the linear-elastic model, increasing the stiffness of the valve results in a relative increase in a linear manner (see Figure 15c). Higher values of Young’s modulus correlate with greater von Mises stresses, emphasizing the critical role of material stiffness in stress distribution within the valve leaflets. Furthermore, the isotropic hyperelastic model reveals a disparate dependency of von Mises stresses upon parameter values below 60 kPa and , as illustrated in Figure 15b. The maximum recorded stress does not exceed 0.8 MPa, concurring with the findings documented in [106]. For the anisotropic model, the nonlinear dependence of stress values on changes in material parameters is again evident.
Our findings indicate that valve calcification obstructs efficient valve opening, resulting in stenosis. This observation aligns with previous studies [53,57]. Furthermore, we note that with increased valve stiffness, the areas most exposed to stress are the tips of the valve leaflets and the Arantius nodules [57]. As calcification severity increases, the wall shear stress elevation is observed to extend into the belly region and mid-sections of the leaflets.
The findings from the aortic valve calcification modeling study highlight several key conclusions. Compared to the mathematical calcification model, the geometric calcification model displays more elastic properties than the case with E = 1 MPa, and is also less susceptible to displacements and elongations than the isotropic and anisotropic models. The model with continuous distributed calcification shows less volumetric deformation than one with calcium deposits. The first geometry corresponds to the range of the linear-elastic model with a Young’s modulus E = 1 MPa, whereas the second aligns with the range for an isotropic hyperelastic model. Calcification spread across the aortic valve leaflets is more susceptible to high-stress conditions than calcification deposits. The model with the first geometry can be approximated using a linear-elastic model with E ≥ 22 MPa, while the second falls within the range of 15 to 22 MPa.
The model displaying diffuse calcification across the valve leaflet indicates a higher susceptibility to degenerative rupture under physiological stress. Based on the obtained conclusions, it cannot be said that the linearly elastic model is capable of approximately describing all the examined characteristics in relation to the obtained values when calcium structures are explicitly assigned to the soft tissues of the valve.
4.4. Wall Shear Stress
Changes in hemodynamics significantly affect the values of wall shear stress on the leaflets of the aortic valve. This parameter is non-invasive and frequently investigated for assessing the aortic valve hemodynamic environment [107]. Areas of high wall shear stress frequently exhibit a predisposition to calcification. Tracking variations in these biomechanical parameters can provide insights into the rate of disease advancement, which is vital for identifying opportune moments for surgical intervention and for tailoring treatment strategies to individual patients.
In this study, it was found that during mild calcification, the maximum wall shear stress values reached 47.4–49.1 Pa (at E = 8 MPa), while severe calcification resulted in a peak of 81.78 Pa (at E = 22 MPa). Noticeably, increasing stiffness corresponds to a nonlinear, nearly linear rise in the values of wall shear stress (Figure 15d). These values fall within the range of values reported in the article [53].
Using the isotropic hyperelastic model, the maximum wall shear stress was found to reach 51.49 Pa under conditions of = 22 kPa and = 22, a level indicative of severe calcification. Lower wall shear stress values, in the range of 30.11 to 34.90 Pa, were associated with a normal aortic valve leaflet. Considering the anisotropic hyperelastic model, the maximum wall shear stress values reach 33.49 Pa with coefficients 35 kPa, 35, 20 kPa, and 60. Lower wall shear stress values range from 24.26 to 27.02 Pa.
When modeling the aortic valve considering calcification and soft tissue properties, the maximum shear stresses increase to about 39.92 Pa with uniform calcification and 39.37 Pa with localized calcific deposits. These stress distributions can be accurately approximated by linear models characterized by a very low Young’s modulus of 1 MPa. According to numerical results, obtained values correspond to the mild calcification degree [53,97].
Received results are higher than those reported in [107,108], suggesting that the developed model is more sensitive to variations in parameters describing valve morphology. Furthermore, there is a clear trend of increasing maximum and average wall shear stress values with progressive calcification.
Figure 12 highlights regions of the valve where wall shear stress reaches its highest levels, notably at the attachment points of the leaflets to the aortic root and along the free edges of the leaflets. These areas are identified as being particularly susceptible to calcification, aligning with observations in clinical and computational studies [109].
5. Limitations
Despite the comprehensive approach employed in developing a fluid–structure interaction (FSI) model of aortic valve hemodynamics, the proposed model has several limitations.
In this study, the aortic walls were modeled as non-deformable, and the leaflets were assumed to be rigidly fixed to the aortic walls. Future research could consider representing the aortic walls as linear-elastic materials [110,111], and exploring alternative boundary conditions for the attachment of the valve leaflets. Introducing deformable walls would increase the computational complexity of the model, as demonstrated in prior work [64], but it would enhance the physiological accuracy of the simulations. Notably, some studies [112,113] have highlighted that the motion of the valve leaflets is driven not only by direct blood flow from the left ventricle but also by the deformation of the aortic walls to which the leaflets are attached. A potential intermediate solution could involve implementing a sliding boundary condition with appropriate constraints.
It is important to acknowledge that current hemodynamic simulations were performed using a Newtonian fluid model for blood flow. While this assumption simplifies the computational aspects and provides a reasonable approximation for high shear rate regions, such as the main flow path in the aorta during peak systole [63,114], it does not fully capture the complex non-Newtonian rheological behavior of blood [115,116,117]. Specifically, blood exhibits shear-thinning properties, meaning its viscosity decreases with increasing shear rate. This effect becomes significant in regions of low shear rate, such as recirculation zones behind calcified deposits, near stagnant areas within the Valsalva sinuses, or close to the valve leaflets themselves, where flow velocities and shear rates are low. In these critical low-shear areas, our model may not accurately predict the local blood viscosity, potentially leading to an underestimation (or overestimation) of wall shear stress and other shear-dependent hemodynamic parameters. Consequently, the precise characterization of vortex formation and intensity in these specific regions might be limited by this assumption. This approach is vital for accurately describing the hemodynamics and potential clinical implications that may arise from the shear-dependent viscosity of blood.
The study also employed a linear-elastic material model, which is another limitation, particularly when describing processes at smaller scales where the biological structure of the valve becomes critical. While most existing studies use phenomenological models to describe the mechanical behavior of valve leaflets [118,119,120], recent efforts have shifted towards anisotropic hyperelastic models [62]. However, the challenge of selecting parameters for such models remains an open issue.
This work demonstrated a numerical investigation of the effects of Young’s modulus and Poisson’s ratio on the hemodynamic characteristics of the aortic valve. Moving forward, the approach will be extended to hyperelastic isotropic and anisotropic materials, incorporating the distribution of collagen fibers. This development aims to further improve the physiological accuracy and predictive power of the model, contributing to a deeper understanding of valve mechanics and aiding the design of artificial valves and therapeutic strategies.
An analysis of the hemodynamics related to the geometrical configurations of aortic valve calcification is also presented. The modeling approach assumes that the calcified deposits behave as linearly elastic solid bodies, spatially distributed across the leaflet following specific distribution patterns.
6. Conclusions
This study investigated the mechanical and hemodynamic behavior of aortic valve leaflets using a fluid–structure interaction model.
A program was developed for the generation of 3D aortic valve geometries. To investigate the system’s hemodynamics, multiple models were employed to simulate aortic valve motion, notably a modified hyperelastic HGO model. The impact of material parameters within these models on aortic valve hemodynamics was systematically examined. Furthermore, two distinct calcification geometries of the aortic valve were explored, with their distribution functions derived using COMSOL Multiphysics.
The influence of material properties, specifically Young’s modulus and Poisson’s ratio, isotropic hyperelastic material properties, and , anisotropic hyperelastic material properties, and , and built calcified aortic valve states on critical parameters such as wall shear stress, volumetric deformation, leaflet displacement, and von Mises stress was analyzed. The findings highlight that material stiffness significantly affects leaflet mechanics and flow dynamics, with increased Young’s modulus leading to higher stresses and reduced deformations, while Poisson’s ratio has a more nuanced effect, particularly at lower stiffness levels.
Considering the material parameters of the Delfino model, both parameters play a role in the distribution of material properties. Thus, increasing both parameters leads to a decrease in peak velocity, von Mises stress, and wall shear stress, which corresponds to an increase and redistribution of elastic properties throughout the material. Increasing either parameter leads to an increase in deformations, displacements, von Mises stress, and wall shear stress of the aortic valve leaflet model.
Numerical results of modeling the aortic valve using an anisotropic hyperelastic model show the more concise distribution of the evaluated parameters. The greater influence on the behavior of the investigated aortic valve model is exerted by the isotropic part of the energy density equation—accounting for anisotropy only refines the system behavior. Nevertheless, volumetric strain reveals that fiber consideration affects the internal valve structure.
Additionally, the study confirmed that zones with the highest wall shear stress—often near the leaflet attachment points and free edges—are prone to calcification, emphasizing the clinical relevance of these parameters. Clinically, high wall shear stress is associated with endothelial dysfunction, platelet activation, and inflammation, which accelerate valve calcification and disease progression, highlighting the importance of monitoring these biomechanical markers for prompt intervention and personalized treatment strategies [120]. This understanding aids in predicting disease advancement and optimizing the choice of surgical intervention timing to enhance therapeutic effectiveness and patient recovery.
In conclusion, the study underscores the critical role of material properties in aortic valve mechanics and their potential to inform diagnostic and therapeutic strategies. The developed model offers a robust foundation for future research, paving the way for improved patient outcomes in cardiovascular medicine.
Author Contributions
Conceptualization, A.G.K. and N.P.; methodology, A.G.K. and N.P.; software, V.T.; investigation, P.F., V.T., N.P. and A.G.K.; writing—original draft preparation, P.F., V.T., N.P., F.N., T.P., B.K., T.S.H. and A.G.K.; writing—review and editing A.G.K. and E.B.; funding acquisition, A.G.K. All authors have read and agreed to the published version of the manuscript.
Funding
Alex G. Kuchumov, Nikita Pil, and Vladimir Tsilibin thank the Ministry of Science and Higher Education of the Russian Federation (Project № FSNM-2024-0009) for funding. Fulufhelo Nemavhola and Thanyani Pandelani thank the International Research Groups-2024 grant by the Ministry of Perm Region (project: Technologies for the personalized aortic valve treatment with TAVI surgery: from numerical modeling to additive manufacturing of shape memory alloy stent meshes).
Data Availability Statement
The original contributions presented in this study are included in the article. Further inquiries can be directed to the corresponding author.
Conflicts of Interest
The authors declare that the research was conducted in the absence of any commercial or financial relationships that could be construed as a potential conflict of interest.
References
- Yu, Y.L.; Jiang, Q. Advances in Pathophysiological Mechanisms of Degenerative Aortic Valve Disease. Cardiol. Res. 2025, 16, 86–101. [Google Scholar] [CrossRef] [Scilit]
- He, Y.; Yang, Y.J.; Wang, Z.J.; Tang, L. Bibliometric Analysis of Treatment Modalities in Calcific Aortic Valve Stenosis. Front. Pharmacol. 2025, 16, 1431311. [Google Scholar] [CrossRef] [Scilit] [PubMed]
- Whelton, S.P.; Jha, K.; Dardari, Z.; Razavi, A.C.; Boakye, E.; Dzaye, O.; Verghese, D.; Shah, S.; Budoff, M.J.; Matsushita, K.; et al. Prevalence of Aortic Valve Calcium and the Long-Term Risk of Incident Severe Aortic Stenosis. JACC Cardiovasc. Imaging 2024, 17, 31–42. [Google Scholar] [CrossRef] [Scilit]
- Lerman, D.A.; Prasad, S.; Alotti, N. Calcific Aortic Valve Disease: Molecular Mechanisms and Therapeutic Approaches. Eur. Cardiol. Rev. 2015, 10, 108. [Google Scholar] [CrossRef] [Scilit]
- Chakrabarti, A.; Goldstein, D.R.; Sutton, N.R. Age-Associated Arterial Calcification: The Current Pursuit of Aggravating and Mitigating Factors. Curr. Opin. Lipidol. 2020, 31, 265–272. [Google Scholar] [CrossRef] [Scilit]
- Kodra, A.; Kim, M. Calcific Aortic Valve Stenosis with Aging and Current Development in Its Pathophysiology. Int. J. Angiol. 2022, 31, 229–231. [Google Scholar] [CrossRef] [Scilit]
- Hénaut, L.; Candellier, A.; Huish, S.; Issa, N.; Sinha, S.; Massy, Z.A. Valvular Calcification in Chronic Kidney Disease: New Insights from Recent Clinical and Preclinical Studies. Clin. Kidney J. 2025, 18, i27–i45. [Google Scholar] [CrossRef] [Scilit]
- Poniedziałek, B.; Perek, B.; Proch, A.; Komosa, A.; Niedzielski, P.; Buczkowski, P.; Jemielity, M.; Rzymski, P. Mineral Composition and Ratios in Aortic Valves, Serum, and Epicardial Fat among Patients with Aortic Stenosis Undergoing Aortic Valve Replacement. Sci. Rep. 2025, 15, 1233. [Google Scholar] [CrossRef] [Scilit] [PubMed]
- Chen, H.Y.; Engert, J.C.; Thanassoulis, G. Risk Factors for Valvular Calcification. Curr. Opin. Endocrinol. Diabetes Obes. 2019, 26, 96–102. [Google Scholar] [CrossRef] [Scilit]
- Peng, B.; Zha, L.; Juaiti, M.; Lin, W.; Zhou, X.; Ou, Z.; Zhang, M.; Yu, Z.; Tang, Y. Association Between Inflammatory Arthritis, Genetic Risk, and the Long-Term Risk of Degenerative Aortic Stenosis: A Prospective Cohort Study. J. Am. Heart Assoc. 2025, 14, e038815. [Google Scholar] [CrossRef] [Scilit] [PubMed]
- Rajamannan, N.M.; Evans, F.J.; Aikawa, E.; Grande-Allen, K.J.; Demer, L.L.; Heistad, D.D.; Simmons, C.A.; Masters, K.S.; Mathieu, P.; O’Brien, K.D.; et al. Calcific Aortic Valve Disease: Not Simply a Degenerative Process: A Review and Agenda for Research from the National Heart and Lung and Blood Institute Aortic Stenosis Working Group. Circulation 2011, 124, 1783–1791. [Google Scholar] [CrossRef] [Scilit]
- Conte, M.; Petraglia, L.; Campana, P.; Gerundo, G.; Caruso, A.; Grimaldi, M.G.; Russo, V.; Attena, E.; Leosco, D.; Parisi, V. The Role of Inflammation and Metabolic Risk Factors in the Pathogenesis of Calcific Aortic Valve Stenosis. Aging Clin. Exp. Res. 2021, 33, 1765–1770. [Google Scholar] [CrossRef] [Scilit]
- Wang, A.; Östgren, C.J.; Norhammar, A.; Kylhammar, D.; Jernberg, T.; Lind, L.; Söderberg, S.; Blomberg, A.; Engström, G.; Bergström, G.; et al. Aortic Valve Calcification across Stages of Dysglycemia in Middle-Aged Individuals from the General Population. Cardiovasc. Diabetol. 2025, 24, 105. [Google Scholar] [CrossRef] [Scilit] [PubMed]
- Kopytek, M.; Undas, K.W.; Tarasiuk, J.; Wroński, S.; Ząbczyk, M.; Natorska, J. Dysglycaemia Is Associated with the Pattern of Valvular Calcification in Micro-Computed Tomography Analysis: An Observational Study in Patients with Severe Aortic Stenosis. Cardiovasc. Diabetol. 2025, 24, 129. [Google Scholar] [CrossRef] [Scilit] [PubMed]
- Lindman, B.R.; Clavel, M.A.; Mathieu, P.; Iung, B.; Lancellotti, P.; Otto, C.M.; Pibarot, P. Calcific Aortic Stenosis. Nat. Rev. Dis. Primers 2016, 2, 16006. [Google Scholar] [CrossRef] [Scilit] [PubMed]
- El-Nashar, H.; Sabry, M.; Tseng, Y.T.; Francis, N.; Latif, N.; Parker, K.H.; Moore, J.E.; Yacoub, M.H. Multiscale Structure and Function of the Aortic Valve Apparatus. Physiol. Rev. 2024, 104, 1487–1532. [Google Scholar] [CrossRef] [Scilit]
- Venkatram, P. Aortic Valve: Stenosis, Regurgitation and Both. In Heart Diseases and Echocardiogram; Springer Nature: Cham, Switzerland, 2024; pp. 123–144. [Google Scholar] [CrossRef] [Scilit]
- Izquierdo-Gómez, M.M.; Hernández-Betancor, I.; García-Niebla, J.; Marí-López, B.; Laynez-Cerdeña, I.; Lacalzada-Almeida, J. Valve Calcification in Aortic Stenosis: Etiology and Diagnostic Imaging Techniques. BioMed Res. Int. 2017, 2017, 5178631. [Google Scholar] [CrossRef] [Scilit]
- Wang, J.; Wang, Y.; Liew, Y.M.; Sivalingam, S.; Mohd Ramdzan, M.Y.; Krishnasamy, S.; Sari, N.A.M.; Lim, E. Hemodynamics and Structural Mechanics of the Aortic Valve after Ozaki Procedure: A Systematic Review. Phys. Med. Biol. 2025, 70, 14TR02. [Google Scholar] [CrossRef] [Scilit]
- Minderhoud, S.C.S.; Arrouby, A.; van den Hoven, A.T.; Bons, L.R.; Chelu, R.G.; Kardys, I.; Rizopoulos, D.; Korteland, S.-A.; van den Bosch, A.E.; Budde, R.P.J.; et al. Regional Aortic Wall Shear Stress Increases over Time in Patients with a Bicuspid Aortic Valve. J. Cardiovasc. Magn. Reson. 2024, 26, 101070. [Google Scholar] [CrossRef] [Scilit]
- Liu, J.; Shar, J.A.; Sucosky, P. Wall Shear Stress Directional Abnormalities in BAV Aortas: Toward a New Hemodynamic Predictor of Aortopathy? Front. Physiol. 2018, 9, 993. [Google Scholar] [CrossRef] [Scilit]
- Pietrasanta, L.; Zheng, S.; De Marinis, D.; Hasler, D.; Obrist, D. Characterization of Turbulent Flow Behind a Transcatheter Aortic Valve in Different Implantation Positions. Front. Cardiovasc. Med. 2022, 8, 804565. [Google Scholar] [CrossRef] [Scilit]
- Hudani, A.; White, J.A.; Greenway, S.C.; Garcia, J. Whole-Heart Assessment of Turbulent Kinetic Energy in the Repaired Tetralogy of Fallot. Appl. Sci. 2022, 12, 10946. [Google Scholar] [CrossRef] [Scilit]
- Manchester, E.L.; Pirola, S.; Salmasi, M.Y.; O’Regan, D.P.; Athanasiou, T.; Xu, X.Y. Analysis of Turbulence Effects in a Patient-Specific Aorta with Aortic Valve Stenosis. Cardiovasc. Eng. Technol. 2021, 12, 438–453. [Google Scholar] [CrossRef] [Scilit] [PubMed]
- Bornemann, K.M.; Obrist, D. Leaflet Fluttering Changes Laminar-Turbulent Transition Mechanisms Past Bioprosthetic Aortic Valves. Phys. Fluids 2025, 37, 051911. [Google Scholar] [CrossRef] [Scilit]
- Kim, H.J.; Park, S.J.; Koo, H.J.; Kang, J.W.; Yang, D.H.; Jung, S.H.; Choo, S.J.; Chung, C.H.; Lee, J.W.; Kim, J.B. Determinants of Effective Orifice Area in Aortic Valve Replacement: Anatomic and Clinical Factors. J. Thorac. Dis. 2020, 12, 1942–1951. [Google Scholar] [CrossRef] [Scilit]
- Adda, J.; Stanova, V.; Habib, G.; Rieu, R. In Vitro Correlation between the Effective and Geometric Orifice Area in Aortic Stenosis. J. Cardiol. 2021, 77, 334–340. [Google Scholar] [CrossRef] [Scilit] [PubMed]
- Loureiro-Ga, M.; Veiga, C.; Fdez-Manin, G.; Jimenez, V.A.; Calvo-Iglesias, F.; Iñiguez, A. A Biomechanical Model of the Pathological Aortic Valve: Simulation of Aortic Stenosis. Comput. Methods Biomech. Biomed. Eng. 2020, 23, 303–311. [Google Scholar] [CrossRef] [Scilit]
- Gianfranco, P.T.; Silvia, B.; Giovanni, S.; Doff, B. Modelling Congenital Heart Disease; Springer: Cham, Switzerland, 2022; ISBN 9783030888916. [Google Scholar] [CrossRef] [Scilit]
- Atkins, S.K.; McNally, A.; Sucosky, P. Mechanobiology in Cardiovascular Disease Management: Potential Strategies and Current Needs. Front. Bioeng. Biotechnol. 2016, 4, 79. [Google Scholar] [CrossRef] [Scilit]
- Bechsgaard, T.; Lindskow, T.; Lading, T.; Røpcke, D.M.; Nygaard, H.; Johansen, P.; Nielsen, S.L.; Hasenkam, J.M. Biomechanical Characterization and Comparison of Different Aortic Root Surgical Techniques. Interdiscip. Cardiovasc. Thorac. Surg. 2019, 28, 112–119. [Google Scholar] [CrossRef] [Scilit]
- Feng, Y.; Cao, Y.; Wang, W.; Zhang, H.; Wei, L.; Jia, B.; Wang, S. Computational Modeling for Surgical Reconstruction of Aortic Valve by Using Autologous Pericardium. IEEE Access 2020, 8, 97343–97352. [Google Scholar] [CrossRef] [Scilit]
- Zikos, D.; Delellis, N. CDSS-RM: A Clinical Decision Support System Reference Model. BMC Med. Res. Methodol. 2018, 18, 137. [Google Scholar] [CrossRef] [Scilit] [PubMed]
- Kuchumov, A.G.; Khairulin, A.R.; Biyanov, A.N.; Porodikov, A.A.; Arutyunyan, V.B.; Sinelnikov, Y.S. Effectiveness of Blalock–Taussig shunt performance in the congenital heart disease children. Russ. J. Biomech. 2020, 24, 65–83. [Google Scholar] [CrossRef] [Scilit] [PubMed]
- Ha, H.; Kim, G.B.; Kweon, J.; Lee, S.J.; Kim, Y.H.; Lee, D.H.; Yang, D.H.; Kim, N. Hemodynamic Measurement Using Four-Dimensional Phase-Contrast MRI: Quantification of Hemodynamic Parameters and Clinical Applications. Korean J. Radiol. 2016, 17, 445–462. [Google Scholar] [CrossRef] [Scilit] [PubMed]
- Cibis, M.; Jarvis, K.; Markl, M.; Rose, M.; Rigsby, C.; Barker, A.J.; Wentzel, J.J. The Effect of Resolution on Viscous Dissipation Measured with 4D Flow MRI in Patients with Fontan Circulation: Evaluation Using Computational Fluid Dynamics. J. Biomech. 2015, 48, 2984–2989. [Google Scholar] [CrossRef] [Scilit]
- Gadhachanda, K.R.; Marsool Marsool, M.D.; Bozorgi, A.; Ameen, D.; Nayak, S.S.; Nasrollahizadeh, A.; Alotaibi, A.; Farzaei, A.; Keivanlou, M.-H.; Hassanipour, S.; et al. Artificial Intelligence in Cardiovascular Procedures: A Bibliometric and Visual Analysis Study. Ann. Med. Surg. 2025, 87, 2187–2203. [Google Scholar] [CrossRef] [Scilit]
- Holste, G.; Oikonomou, E.K.; Mortazavi, B.J.; Coppi, A.; Faridi, K.F.; Miller, E.J.; Forrest, J.K.; McNamara, R.L.; Ohno-Machado, L.; Yuan, N.; et al. Severe Aortic Stenosis Detection by Deep Learning Applied to Echocardiography. Eur. Heart J. 2023, 44, 4592–4604. [Google Scholar] [CrossRef] [Scilit]
- Pil, N.E.; Kuchumov, A.G. Aortic valve leaflets motion trajectories tracking by using echocardiography. Russ. J. Biomech. 2024, 28, 137–145. [Google Scholar] [CrossRef] [Scilit]
- Hohri, Y.; Chung, M.M.; Kandula, V.; Kim, I.; Leb, J.; Hayashi, H.; Elmously, A.; O’Donnell, T.F.; Patel, V.; Vedula, V.; et al. Blood Flow Assessment Technology in Aortic Surgery: A Narrative Review. J. Thorac. Dis. 2024, 16, 2623–2636. [Google Scholar] [CrossRef] [Scilit]
- Whiting, R.; Sander, E.; Conway, C.; Vaughan, T.J. In Silico Modelling of Aortic Valve Implants—Predicting in Vitro Performance Using Finite Element Analysis. J. Med. Eng. Technol. 2022, 46, 220–230. [Google Scholar] [CrossRef] [Scilit]
- Kuchumov, A.G.; Makashova, A.; Vladimirov, S.; Borodin, V.; Dokuchaeva, A. Fluid–Structure Interaction Aortic Valve Surgery Simulation: A Review. Fluids 2023, 8, 295. [Google Scholar] [CrossRef] [Scilit]
- Pil, N.; Kuchumov, A.G.; Kadyraliev, B.; Arutunyan, V. Influence of Aortic Valve Leaflet Material Model on Hemodynamic Features in Healthy and Pathological States. Mathematics 2023, 11, 428. [Google Scholar] [CrossRef] [Scilit]
- Azimi-Boulali, J.; Mahler, G.J.; Murray, B.T.; Huang, P. Multiscale Computational Modeling of Aortic Valve Calcification. Biomech. Model. Mechanobiol. 2024, 23, 581–599. [Google Scholar] [CrossRef] [Scilit]
- Chen, Y.; Luo, H. Pressure Distribution over the Leaflets and Effect of Bending Stiffness on Fluid-Structure Interaction of the Aortic Valve. J. Fluid Mech. 2019, 883, A52. [Google Scholar] [CrossRef] [Scilit]
- Gilmanov, A.; Barker, A.; Stolarski, H.; Sotiropoulos, F. Image-Guided Fluid-Structure Interaction Simulation of Transvalvular Hemodynamics: Quantifying the Effects of Varying Aortic Valve Leaflet Thickness. Fluids 2019, 4, 119. [Google Scholar] [CrossRef] [Scilit]
- Hughes, C.; Whelan, A.; O’Reilly, D.; Campbell, E.M.; Lally, C. Aortic Valve Leaflet Assessment to Inform Novel Bioinspired Materials: Understanding the Impact of Collagen Fibres on the Tissue’s Mechanical Behaviour. J. Mech. Behav. Biomed. Mater. 2025, 163, 106881. [Google Scholar] [CrossRef] [Scilit]
- Yin, Z.; Armour, C.; Kandail, H.; O’Regan, D.P.; Bahrami, T.; Mirsadraee, S.; Pirola, S.; Xu, X.Y. Fluid–Structure Interaction Analysis of a Healthy Aortic Valve and Its Surrounding Haemodynamics. Int. J. Numer. Methods Biomed. Eng. 2024, 40, e3865. [Google Scholar] [CrossRef] [Scilit] [PubMed]
- Salman, H.E.; Saltik, L.; Yalcin, H.C. Computational Analysis of Wall Shear Stress Patterns on Calcified and Bicuspid Aortic Valves: Focus on Radial and Coaptation Patterns. Fluids 2021, 6, 287. [Google Scholar] [CrossRef] [Scilit]
- Cai, L.; Hao, Y.; Ma, P.; Zhu, G.; Luo, X.; Gao, H. Fluid-Structure Interaction Simulation of Calcified Aortic Valve Stenosis. Math. Biosci. Eng. 2022, 19, 13172–13192. [Google Scholar] [CrossRef] [Scilit] [PubMed]
- Balachandran, K.; Sucosky, P.; Yoganathan, A.P. Hemodynamics and Mechanobiology of Aortic Valve Inflammation and Calcification. Int. J. Inflamm. 2011, 2011, 263870. [Google Scholar] [CrossRef] [Scilit]
- Morany, A.; Bardon, R.G.; Lavon, K.; Hamdan, A.; Bluestein, D.; Haj-Ali, R. Analysis of Fibrocalcific Aortic Valve Stenosis: Computational Pre-and-Post TAVR Haemodynamics Behaviours. R. Soc. Open Sci. 2024, 11, 230905. [Google Scholar] [CrossRef] [Scilit]
- Amindari, A.; Saltik, L.; Kirkkopru, K.; Yacoub, M.; Yalcin, H.C. Assessment of Calcified Aortic Valve Leaflet Deformations and Blood Flow Dynamics Using Fluid-Structure Interaction Modeling. Inform. Med. Unlocked 2017, 9, 191–199. [Google Scholar] [CrossRef] [Scilit]
- Mutlu, O.; Salman, H.E.; Yalcin, H.C.; Olcay, A.B. Fluid Flow Characteristics of Healthy and Calcified Aortic Valves Using Three-Dimensional Lagrangian Coherent Structures Analysis. Fluids 2021, 6, 203. [Google Scholar] [CrossRef] [Scilit]
- Halevi, R.; Hamdan, A.; Marom, G.; Lavon, K.; Ben-Zekry, S.; Raanani, E.; Haj-Ali, R. A New Growth Model for Aortic Valve Calcification. J. Biomech. Eng. 2018, 140, 101008. [Google Scholar] [CrossRef] [Scilit]
- Mirza, A.; Hsu, C.P.D.; Rodriguez, A.; Alvarez, P.; Lou, L.; Sey, M.; Agarwal, A.; Ramaswamy, S.; Hutcheson, J. Computational Model for Early-Stage Aortic Valve Calcification Shows Hemodynamic Biomarkers. Bioengineering 2024, 11, 955. [Google Scholar] [CrossRef] [Scilit] [PubMed]
- Daryani, R.; Ersan, E.C.; Çelebi, M.S. Impact of Multi-Grade Localized Calcifications on Aortic Valve Dynamics under Helical Inflow: A Comparative Hemodynamic Study. Appl. Sci. 2023, 13, 2983. [Google Scholar] [CrossRef] [Scilit]
- Weinberg, E.J.; Schoen, F.J.; Mofrad, M.R.K. A Computational Model of Aging and Calcification in the Aortic Heart Valve. PLoS ONE 2009, 4, e5960. [Google Scholar] [CrossRef] [Scilit] [PubMed]
- Mohammed, A.M.; Ariane, M.; Alexiadis, A. Using Discrete Multiphysics Modelling to Assess the Effect of Calcification on Hemodynamic and Mechanical Deformation of Aortic Valve. ChemEngineering 2020, 4, 48. [Google Scholar] [CrossRef] [Scilit]
- Sturla, F.; Ronzoni, M.; Vitali, M.; Dimasi, A.; Vismara, R.; Preston-Maher, G.; Burriesci, G.; Votta, E.; Redaelli, A. Impact of Different Aortic Valve Calcification Patterns on the Outcome of Transcatheter Aortic Valve Implantation: A Finite Element Study. J. Biomech. 2016, 49, 2520–2530. [Google Scholar] [CrossRef] [Scilit]
- Guo, X.N.; Lin, R.; Zhang, K.; Zhang, H.N.; Zhang, N.; Song, G.Y. Biomimetic Multilayered Polymeric Heart Valve Featuring Ultra-Thin Thickness and Exceptional Durability. Biochem. Biophys. Res. Commun. 2025, 756, 151609. [Google Scholar] [CrossRef] [Scilit]
- Thubrikar, M.J. Geometry of the aortic valve. In The Aortic Valve; CRC Press: Boca Raton, FL, USA, 1990; pp. 1–19. [Google Scholar]
- Luraghi, G.; Matas, J.F.R.; Beretta, M.; Chiozzi, N.; Iannetti, L.; Migliavacca, F. The Impact of Calcification Patterns in Transcatheter Aortic Valve Performance: A Fluid-Structure Interaction Analysis. Comput. Methods Biomech. Biomed. Eng. 2020, 24, 375–383. [Google Scholar] [CrossRef] [Scilit]
- Luraghi, G.; Migliavacca, F.; García-González, A.; Chiastra, C.; Rossi, A.; Cao, D.; Stefanini, G.; Rodriguez Matas, J.F. On the Modeling of Patient-Specific Transcatheter Aortic Valve Replacement: A Fluid–Structure Interaction Approach. Cardiovasc. Eng. Technol. 2019, 10, 437–455. [Google Scholar] [CrossRef] [Scilit]
- Travaglino, S.; Murdock, K.; Tran, A.; Martin, C.; Liang, L.; Wang, Y.; Sun, W. Computational Optimization Study of Transcatheter Aortic Valve Leaflet Design Using Porcine and Bovine Leaflets. J. Biomech. Eng. 2020, 142, 011007. [Google Scholar] [CrossRef] [Scilit]
- Khairulin, A.; Kuchumov, A.G.; Silberschmidt, V.V. In silico model of stent performance in multi-layered artery using 2-way fluid-structure interaction: Influence of boundary conditions and vessel length. Comput. Methods Programs Biomed. 2024, 255, 108327. [Google Scholar] [CrossRef] [Scilit] [PubMed]
- Demiray, H. A note on the elasticity of soft biological tissues. J. Biomech. 1972, 5, 309–311. [Google Scholar] [CrossRef] [Scilit] [PubMed]
- Delfino, A.; Stergiopulos, N.; Moore, J.E.; Meister, J.-J. Residual strain effects on the stress field in a thick wall finite element model of the human carotid bifurcation. J. Biomech. 1997, 30, 777–786. [Google Scholar] [CrossRef] [Scilit]
- Dunne, T.; Rannacher, R.; Richter, T. Numerical Simulation of Fluid-Structure Interaction Based on Monolithic Variational Formulations. Fundam. Trends Fluid-Struct. Interact. 2010, 1–75. [Google Scholar] [CrossRef] [Scilit]
- Averweg, S.; Schwarz, A.; Schwarz, C.; Schröder, J. A Monolithic Fluid–Structure Interaction Approach Using Mixed LSFEM with High-Order Time Integration. Comput. Methods Appl. Mech. Eng. 2024, 423, 116783. [Google Scholar] [CrossRef] [Scilit]
- Zimbrod, P.; Fleck, M.; Schilp, J. An Application-Driven Method for Assembling Numerical Schemes for the Solution of Complex Multiphysics Problems. Appl. Syst. Innov. 2024, 7, 35. [Google Scholar] [CrossRef] [Scilit]
- Ben-Israel, A. A modified Newton-Raphson method for the solution of systems of equations. Isr. J. Math. 1965, 3, 94–98. [Google Scholar] [CrossRef] [Scilit]
- Yousefi, S.; Borna, H.; Rohani Shirvan, A.; Wen, C.; Nouri, A. Surface Modification of Mechanical Heart Valves: A Review. Eur. Polym. J. 2024, 205, 112726. [Google Scholar] [CrossRef] [Scilit]
- Oveissi, F.; Naficy, S.; Lee, A.; Winlaw, D.S.; Dehghani, F. Materials and Manufacturing Perspectives in Engineering Heart Valves: A Review. Mater. Today Bio 2020, 5, 100038. [Google Scholar] [CrossRef] [Scilit]
- Li, R.L.; Russ, J.; Paschalides, C.; Ferrari, G.; Waisman, H.; Kysar, J.W.; Kalfa, D. Mechanical Considerations for Polymeric Heart Valve Development: Biomechanics, Materials, Design and Manufacturing. Biomaterials 2019, 225, 119493. [Google Scholar] [CrossRef] [Scilit] [PubMed]
- Hoeijmakers, M.J.M.M.; Waechter-Stehle, I.; Weese, J.; Van de Vosse, F.N. Combining Statistical Shape Modeling, CFD, and Meta-Modeling to Approximate the Patient-Specific Pressure-Drop across the Aortic Valve in Real-Time. Int. J. Numer. Method Biomed. Eng. 2020, 36, e3387. [Google Scholar] [CrossRef] [Scilit]
- Hsu, M.C.; Kamensky, D.; Xu, F.; Kiendl, J.; Wang, C.; Wu, M.C.H.; Mineroff, J.; Reali, A.; Bazilevs, Y.; Sacks, M.S. Dynamic and Fluid–Structure Interaction Simulations of Bioprosthetic Heart Valves Using Parametric Design with T-Splines and Fung-Type Material Models. Comput. Mech. 2015, 55, 1211–1225. [Google Scholar] [CrossRef] [Scilit]
- Cao, K.; Bukač, M.; Sucosky, P. Three-Dimensional Macro-Scale Assessment of Regional and Temporal Wall Shear Stress Characteristics on Aortic Valve Leaflets. Comput. Methods Biomech. Biomed. Eng. 2016, 19, 603–613. [Google Scholar] [CrossRef] [Scilit]
- Liu, X.; Zhang, W.; Ye, P.; Luo, Q.; Chang, Z. Fluid-Structure Interaction Analysis on the Influence of the Aortic Valve Stent Leaflet Structure in Hemodynamics. Front. Physiol. 2022, 13, 904453. [Google Scholar] [CrossRef] [Scilit]
- Yan, W.; Li, J.; Wang, W.; Wei, L.; Wang, S. A Fluid–Structure Interaction Study of Different Bicuspid Aortic Valve Phenotypes Throughout the Cardiac Cycle. Front. Physiol. 2021, 12, 716015. [Google Scholar] [CrossRef] [Scilit] [PubMed]
- Kaiser, A.D.; Shad, R.; Hiesinger, W.; Marsden, A.L. A Design-Based Model of the Aortic Valve for Fluid-Structure Interaction. Biomech. Model. Mechanobiol. 2021, 20, 2413–2435. [Google Scholar] [CrossRef] [Scilit] [PubMed]
- Sodhani, D.; Reese, S.; Aksenov, A.; Soğanci, S.; Jockenhövel, S.; Mela, P.; Stapleton, S.E. Fluid-Structure Interaction Simulation of Artificial Textile Reinforced Aortic Heart Valve: Validation with an In-Vitro Test. J. Biomech. 2018, 78, 52–69. [Google Scholar] [CrossRef] [Scilit]
- Balu, A.; Nallagonda, S.; Xu, F.; Krishnamurthy, A.; Hsu, M.C.; Sarkar, S. A Deep Learning Framework for Design and Analysis of Surgical Bioprosthetic Heart Valves. Sci. Rep. 2019, 9, 18560. [Google Scholar] [CrossRef] [Scilit]
- Ferdian, E.; Dubowitz, D.J.; Mauger, C.A.; Wang, A.; Young, A.A. WSSNet: Aortic Wall Shear Stress Estimation Using Deep Learning on 4D Flow MRI. Front. Cardiovasc. Med. 2022, 8, 769927. [Google Scholar] [CrossRef] [Scilit] [PubMed]
- Du, P.; Zhu, X.; Wang, J.-X. Deep Learning-Based Surrogate Model for 3-D Patient-Specific Computational Fluid Dynamics. Phys. Fluids 2022, 34, 081906. [Google Scholar] [CrossRef] [Scilit]
- Romaszko, L.; Borowska, A.; Lazarus, A.; Dalton, D.; Berry, C.; Luo, X.; Husmeier, D.; Gao, H. Neural Network-Based Left Ventricle Geometry Prediction from CMR Images with Application in Biomechanics. Artif. Intell. Med. 2021, 119, 102140. [Google Scholar] [CrossRef] [Scilit]
- Aljassam, Y.; Sophocleous, F.; Bruse, J.L.; Schot, V.; Caputo, M.; Biglino, G. Machine Learning and Statistical Shape Modelling Methodologies to Assess Vascular Morphology before and after Aortic Valve Replacement. J. Clin. Med. 2024, 13, 4577. [Google Scholar] [CrossRef] [Scilit] [PubMed]
- Bosmans, B.; Huysmans, T.; Lopes, P.; Verhoelst, E.; Dezutter, T.; de Jaegere, P.; Sijbers, J.; Vander Sloten, J.; Bosmans, J. Aortic Root Sizing for Transcatheter Aortic Valve Implantation Using a Shape Model Parameterisation. Med. Biol. Eng. Comput. 2019, 57, 2081–2092. [Google Scholar] [CrossRef] [Scilit]
- Wong, K.K.L.; Wang, D.; Ko, J.K.L.; Mazumdar, J.; Le, T.T.; Ghista, D. Computational Medical Imaging and Hemodynamics Framework for Functional Analysis and Assessment of Cardiovascular Structures. Biomed. Eng. Online 2017, 16, 35. [Google Scholar] [CrossRef] [Scilit]
- Mittal, R.; Seo, J.H.; Vedula, V.; Choi, Y.J.; Liu, H.; Huang, H.H.; Jain, S.; Younes, L.; Abraham, T.; George, R.T. Computational Modeling of Cardiac Hemodynamics: Current Status and Future Outlook. J. Comput. Phys. 2016, 305, 1065–1082. [Google Scholar] [CrossRef] [Scilit]
- Kamada, H.; Nakamura, M.; Ota, H.; Higuchi, S.; Takase, K. Blood Flow Analysis with Computational Fluid Dynamics and 4D-Flow MRI for Vascular Diseases. J. Cardiol. 2022, 80, 386–396. [Google Scholar] [CrossRef] [Scilit]
- Kopylova, V.; Boronovskiy, S.; Nartsissov, Y. Approaches to Vascular Network, Blood Flow, and Metabolite Distribution Modeling in Brain Tissue. Biophys. Rev. 2023, 15, 1335–1350. [Google Scholar] [CrossRef] [Scilit] [PubMed]
- Zhang, Y.; Barocas, V.H.; Berceli, S.A.; Clancy, C.E.; Eckmann, D.M.; Garbey, M.; Kassab, G.S.; Lochner, D.R.; McCulloch, A.D.; Tran-Son-Tay, R.; et al. Multi-Scale Modeling of the Cardiovascular System: Disease Development, Progression, and Clinical Intervention. Ann. Biomed. Eng. 2016, 44, 2642–2660. [Google Scholar] [CrossRef] [Scilit] [PubMed]
- Hinton, R.B.; Yutzey, K.E. Heart Valve Structure and Function in Development and Disease. Ann. Rev. Physiol. 2011, 73, 29–46. [Google Scholar] [CrossRef] [Scilit] [PubMed]
- Nowak, M.; Divo, E.; Adamczyk, W.P. Fluid–Structure Interaction Methods for the Progressive Anatomical and Artificial Aortic Valve Stenosis. Int. J. Mech. Sci. 2022, 227, 107410. [Google Scholar] [CrossRef] [Scilit]
- Baumgartner, H.; Hung, J.; Bermejo, J.; Chambers, J.B.; Edvardsen, T.; Goldstein, S.; Lancellotti, P.; Lefevre, M.; Miller, F.; Otto, C.M. Recommendations on the Echocardiographic Assessment of Aortic Valve Stenosis: A Focused Update from the European Association of Cardiovascular Imaging and the American Society of Echocardiography. Eur. Heart J. Cardiovasc. Imaging 2017, 18, 254–275. [Google Scholar] [CrossRef] [Scilit]
- Sun, C.; Qin, T.; Kalyanasundaram, A.; Elefteriades, J.; Sun, W.; Liang, L. Biomechanical Stress Analysis of Type-A Aortic Dissection at Pre-Dissection, Post-Dissection, and Post-Repair States. Comput. Biol. Med. 2025, 184, 109310. [Google Scholar] [CrossRef] [Scilit] [PubMed]
- Miyazaki, S.; Hatano, A.; Izumi, S.; Morishita, Y.; Fan, B.; Takagi, S.; Tomii, N.; Tsukihara, H.; Maeda, E.; Yamaguchi, H.; et al. Fluid-Structure Interaction Analysis of 3D Human Aortic Valve Model Constructed from CT Images. In 11th Asian-Pacific Conference on Medical and Biological Engineering: Proceedings of the Online Conference APCMBE 2020, May 25–27, 2020; Shiraishi, Y., Sakuma, I., Naruse, K., Ueno, A., Eds.; Springer: Cham, Switzerland, 2021; Volume 82. [Google Scholar] [CrossRef] [Scilit]
- Persson, M.; Glaser, N.; Nilsson, J.; Friberg, Ö.; Franco-Cereceda, A.; Sartipy, U. Comparison of Long-Term Performance of Bioprosthetic Aortic Valves in Sweden from 2003 to 2018. JAMA Netw. Open 2022, 5, E220962. [Google Scholar] [CrossRef] [Scilit]
- Wang, Y.; Fu, Y.; Wang, Q.; Kong, D.; Wang, Z.; Liu, J. Recent Advancements in Polymeric Heart Valves: From Basic Research to Clinical Trials. Mater. Today Bio 2024, 28, 101194. [Google Scholar] [CrossRef] [Scilit]
- Singh, S.K.; Kachel, M.; Castillero, E.; Xue, Y.; Kalfa, D.; Ferrari, G.; George, I. Polymeric Prosthetic Heart Valves: A Review of Current Technologies and Future Directions. Front. Cardiovasc. Med. 2023, 10, 1137827. [Google Scholar] [CrossRef] [Scilit]
- Koch, T.M.; Reddy, B.D.; Zilla, P.; Franz, T. Aortic Valve Leaflet Mechanical Properties Facilitate Diastolic Valve Function. Comput. Methods Biomech. Biomed. Eng. 2010, 13, 225–234. [Google Scholar] [CrossRef] [Scilit]
- Kivi, A.R.; Sedaghatizadeh, N.; Cazzolato, B.S.; Zander, A.C.; Roberts-Thomson, R.; Nelson, A.J.; Arjomandi, M. Fluid Structure Interaction Modelling of Aortic Valve Stenosis: Effects of Valve Calcification on Coronary Artery Flow and Aortic Root Hemodynamics. Comput. Methods Prog. Biomed. 2020, 196, 105647. [Google Scholar] [CrossRef] [Scilit]
- Bańka, P.; Wybraniec, M.; Bochenek, T.; Gruchlik, B.; Burchacka, A.; Swinarew, A.; Mizia-Stec, K. Influence of Aortic Valve Stenosis and Wall Shear Stress on Platelets Function. J. Clin. Med. 2023, 12, 6301. [Google Scholar] [CrossRef] [Scilit] [PubMed]
- Salman, H.E.; Yalcin, H.C. Computational Modeling of Blood Flow Hemodynamics for Biomechanical Investigation of Cardiac Development and Disease. J. Cardiovasc. Dev. Dis. 2021, 8, 14. [Google Scholar] [CrossRef] [Scilit]
- Zolfaghari, H.; Andiapen, M.; Baumbach, A.; Mathur, A.; Kerswell, R.R. Wall Shear Stress and Pressure Patterns in Aortic Stenosis Patients with and without Aortic Dilation Captured by High-Performance Image-Based Computational Fluid Dynamics. PLoS Comput. Biol. 2023, 19, e1011479. [Google Scholar] [CrossRef] [Scilit]
- Moradicheghamahi, J. The Role of Wall Mechanics in the Hemodynamics of a Realistic Abdominal Aortic Aneurysm: A Fluid-Structure Interaction Study. J. Eng. 2024, 2024, 3280563. [Google Scholar] [CrossRef] [Scilit]
- Wang, X.; Carpenter, H.J.; Ghayesh, M.H.; Kotousov, A.; Zander, A.C.; Amabili, M.; Psaltis, P.J. A Review on the Biomechanical Behaviour of the Aorta. J. Mech. Behav. Biomed. Mater. 2023, 144, 105922. [Google Scholar] [CrossRef] [Scilit]
- Spühler, J.H.; Jansson, J.; Jansson, N.; Hoffman, J. 3D Fluid-Structure Interaction Simulation of Aortic Valves Using a Unified Continuum ALE FEM Model. Front. Physiol. 2018, 9, 363. [Google Scholar] [CrossRef] [Scilit]
- Sacks, M.S.; David Merryman, W.; Schmidt, D.E. On the Biomechanics of Heart Valve Function. J. Biomech. 2009, 42, 1804–1824. [Google Scholar] [CrossRef] [Scilit]
- Sacks, M.S.; Yoganathan, A.P. Heart Valve Function: A Biomechanical Perspective. Philos. Trans. R. Soc. B Biol. Sci. 2007, 362, 1369–1391. [Google Scholar] [CrossRef] [Scilit]
- Halevi, R.; Hamdan, A.; Marom, G.; Lavon, K.; Ben-Zekry, S.; Raanani, E.; Bluestein, D.; Haj-Ali, R. Fluid–Structure Interaction Modeling of Calcific Aortic Valve Disease Using Patient-Specific Three-Dimensional Calcification Scans. Med. Biol. Eng. Comput. 2016, 54, 1683–1694. [Google Scholar] [CrossRef] [Scilit] [PubMed]
- Pedrizzetti, G.; Domenichini, F. Flow-Driven Opening of a Valvular Leaflet. J. Fluid Mech. 2006, 569, 321–330. [Google Scholar] [CrossRef] [Scilit]
- Holzapfel, G.A.; Ogden, R.W. Constitutive Modelling of Arteries. Proc. R. Soc. A Math. Phys. Eng. Sci. 2010, 466, 1551–1597. [Google Scholar] [CrossRef] [Scilit]
- Wu, M.C.H.; Zakerzadeh, R.; Kamensky, D.; Kiendl, J.; Sacks, M.S.; Hsu, M.C. An Anisotropic Constitutive Model for Immersogeometric Fluid–Structure Interaction Analysis of Bioprosthetic Heart Valves. J. Biomech. 2018, 74, 23–31. [Google Scholar] [CrossRef] [Scilit]
- Nemavhola, F.; Pandelani, T.; Ngwangwa, H. Fitting of hyperelastic constitutive models in different sheep heart regions based on biaxial mechanical tests. Russ. J. Biomech. 2022, 26, 2022. [Google Scholar] [CrossRef] [Scilit]
- Mackenzie Dover, C.; Goth, W.; Goodbrake, C.; Tunnell, J.W.; Sacks, M.S. Simultaneous Wide-Field Planar Strain-Fiber Orientation Distribution Measurement Using Polarized Spatial Domain Imaging. Ann. Biomed. Eng. 2022, 50, 253–277. [Google Scholar] [CrossRef] [Scilit]
- Laurence, D.W.; Ross, C.J.; Hsu, M.-C.; Mir, A.; Burkhart, H.M.; Holzapfel, G.A.; Lee, C.-H. Benchtop Characterization of the Tricuspid Valve Leaflet Pre-Strains. Acta Biomater. 2022, 152, 321–334. [Google Scholar] [CrossRef] [Scilit] [PubMed]
- Bollache, E.; Guzzardi, D.G.; Sattari, S.; Olsen, K.E.; Di Martino, E.S.; Malaisrie, S.C.; van Ooij, P.; Collins, J.; Carr, J.; McCarthy, P.M.; et al. Aortic Valve-Mediated Wall Shear Stress Is Heterogeneous and Predicts Regional Aortic Elastic Fiber Thinning in Bicuspid Aortic Valve-Associated Aortopathy. J. Thorac. Cardiovasc. Surg. 2018, 156, 2112–2120.e2. [Google Scholar] [CrossRef] [Scilit] [PubMed]
- Weinberg, P.D. Haemodynamic Wall Shear Stress, Endothelial Permeability and Atherosclerosis—A Triad of Controversy. Front. Bioeng. Biotechnol. 2022, 10, 836680. [Google Scholar] [CrossRef] [Scilit] [PubMed]
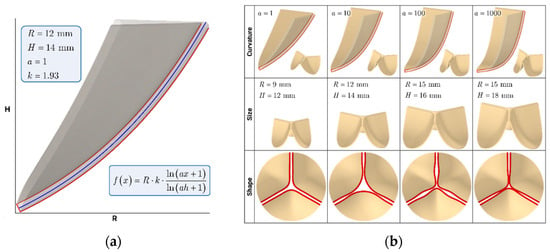
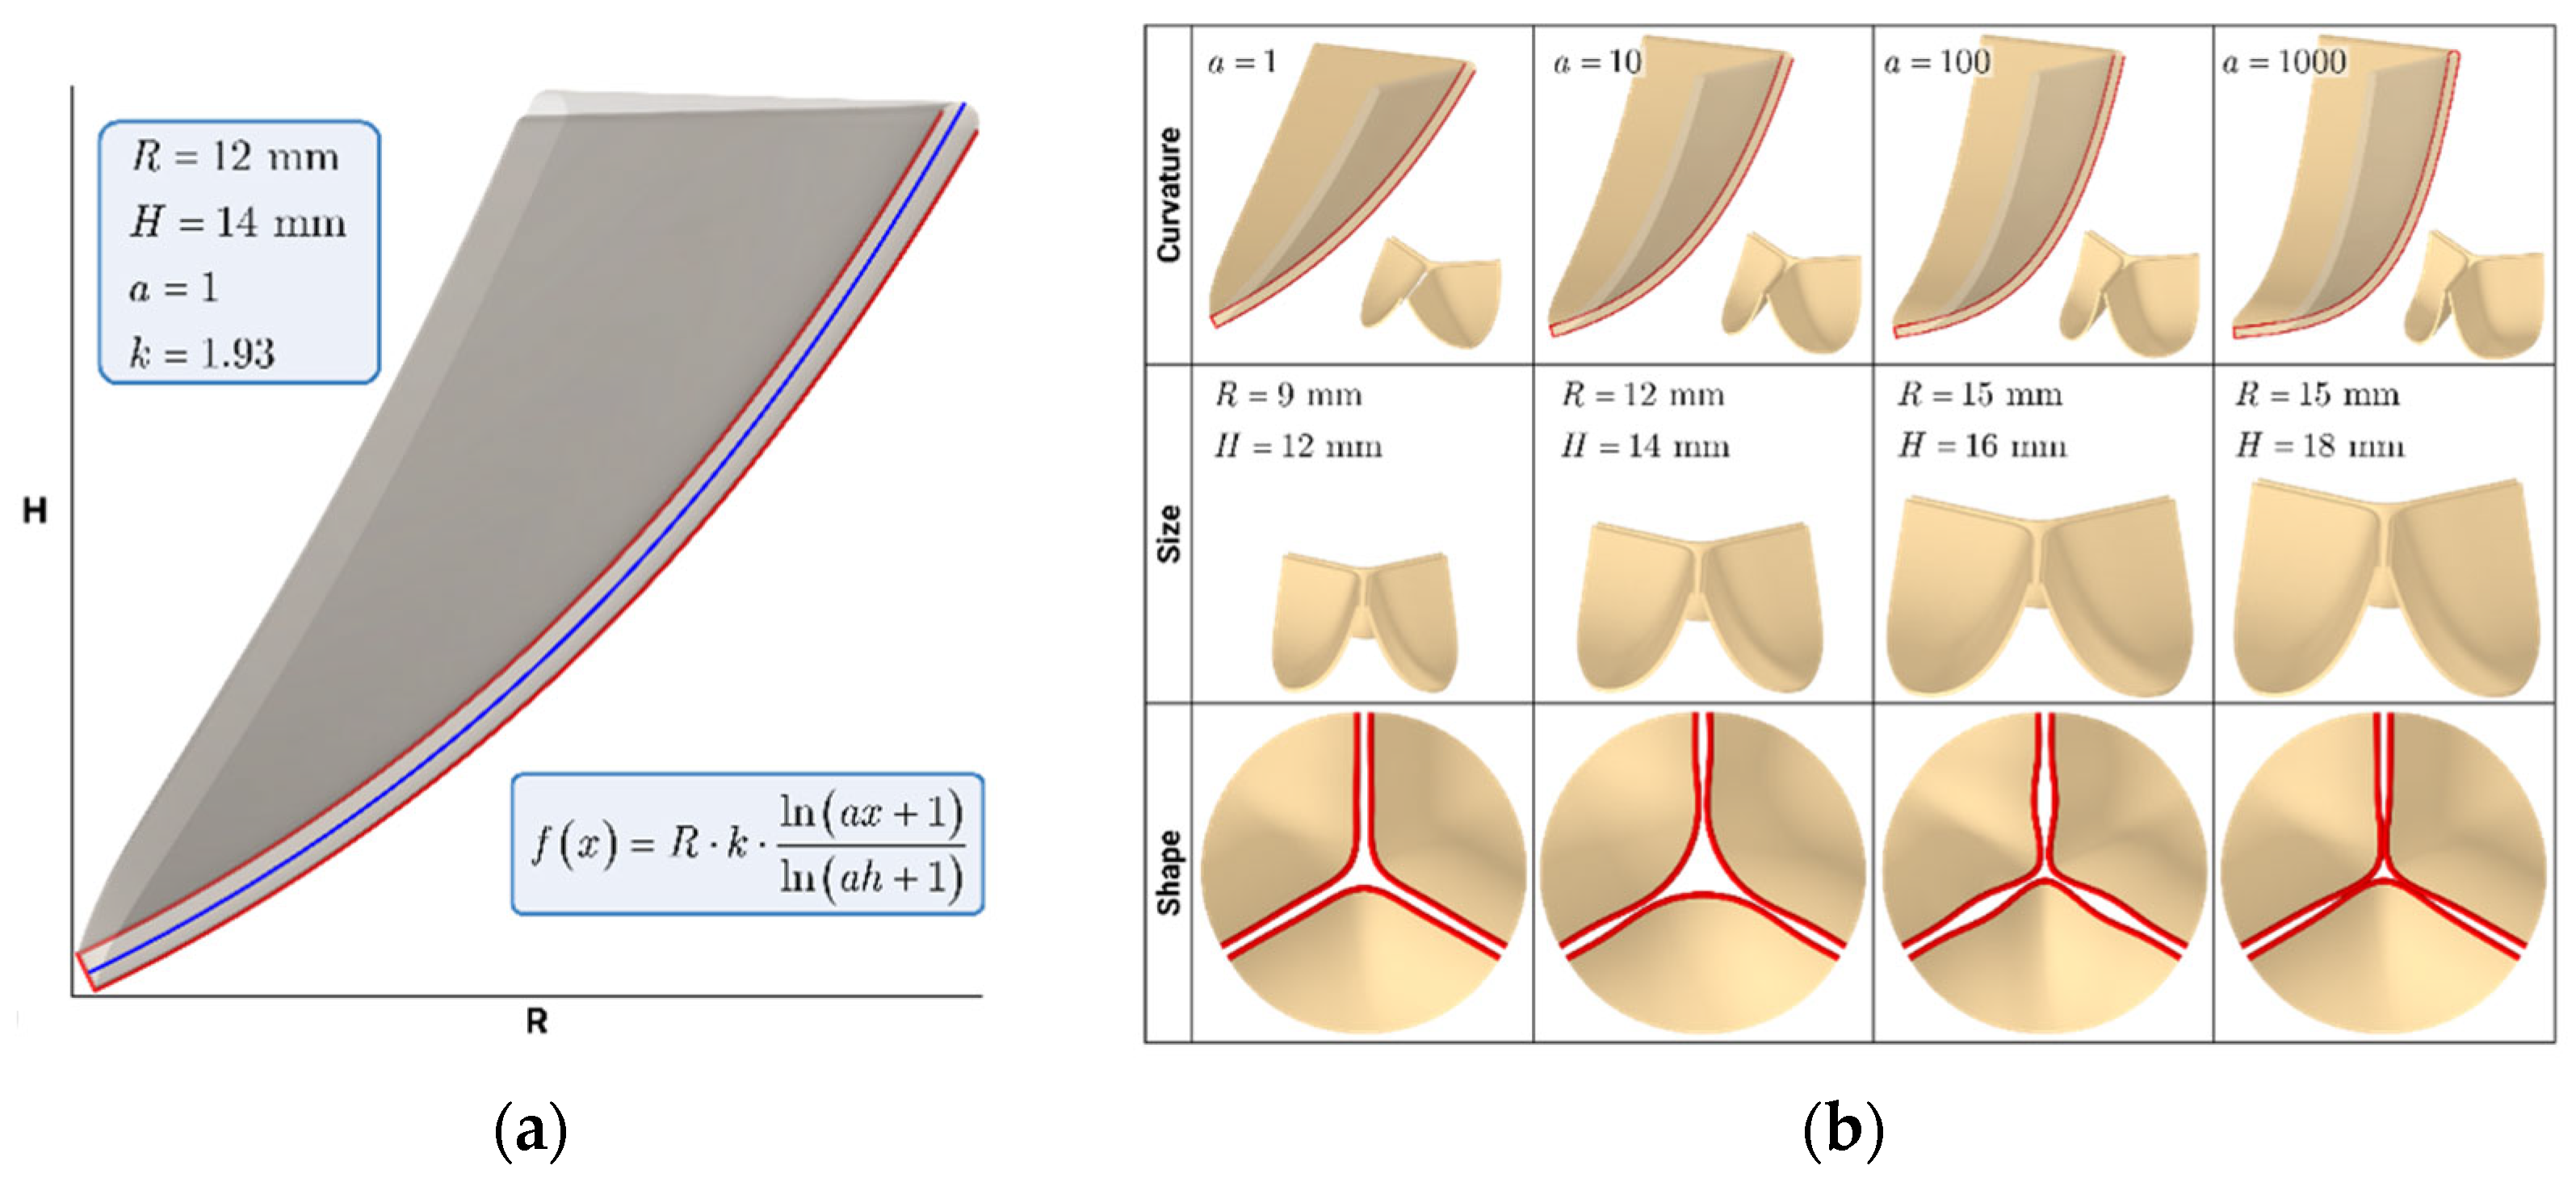
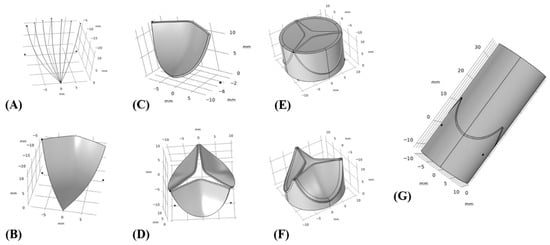
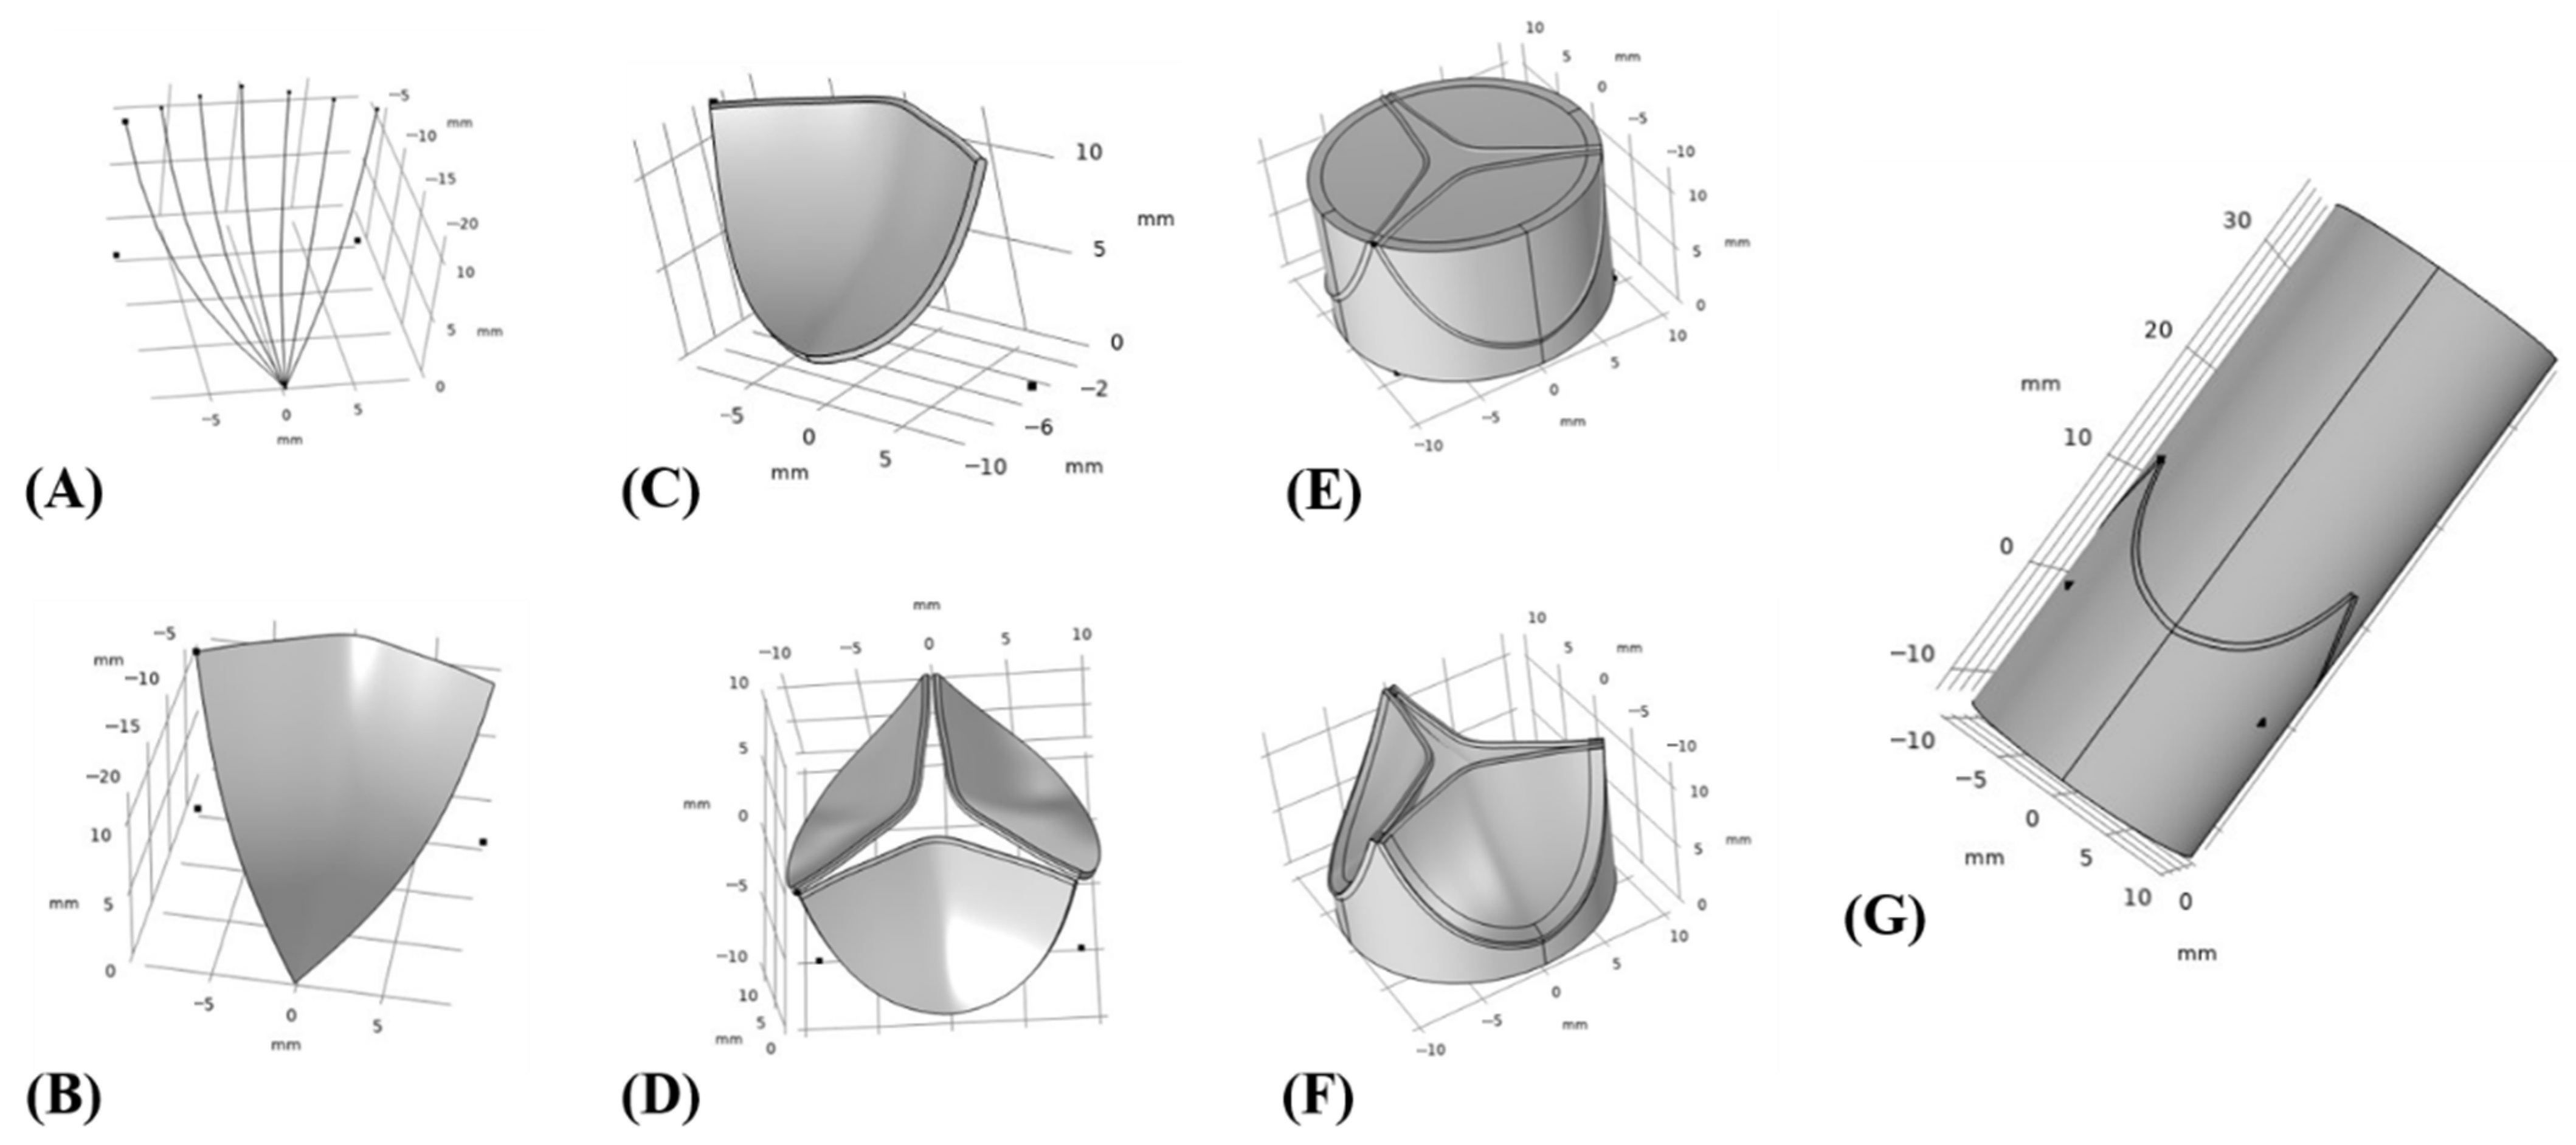
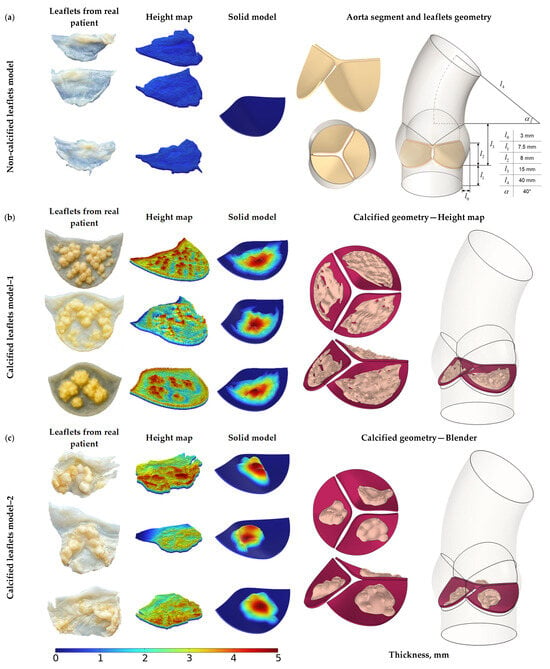
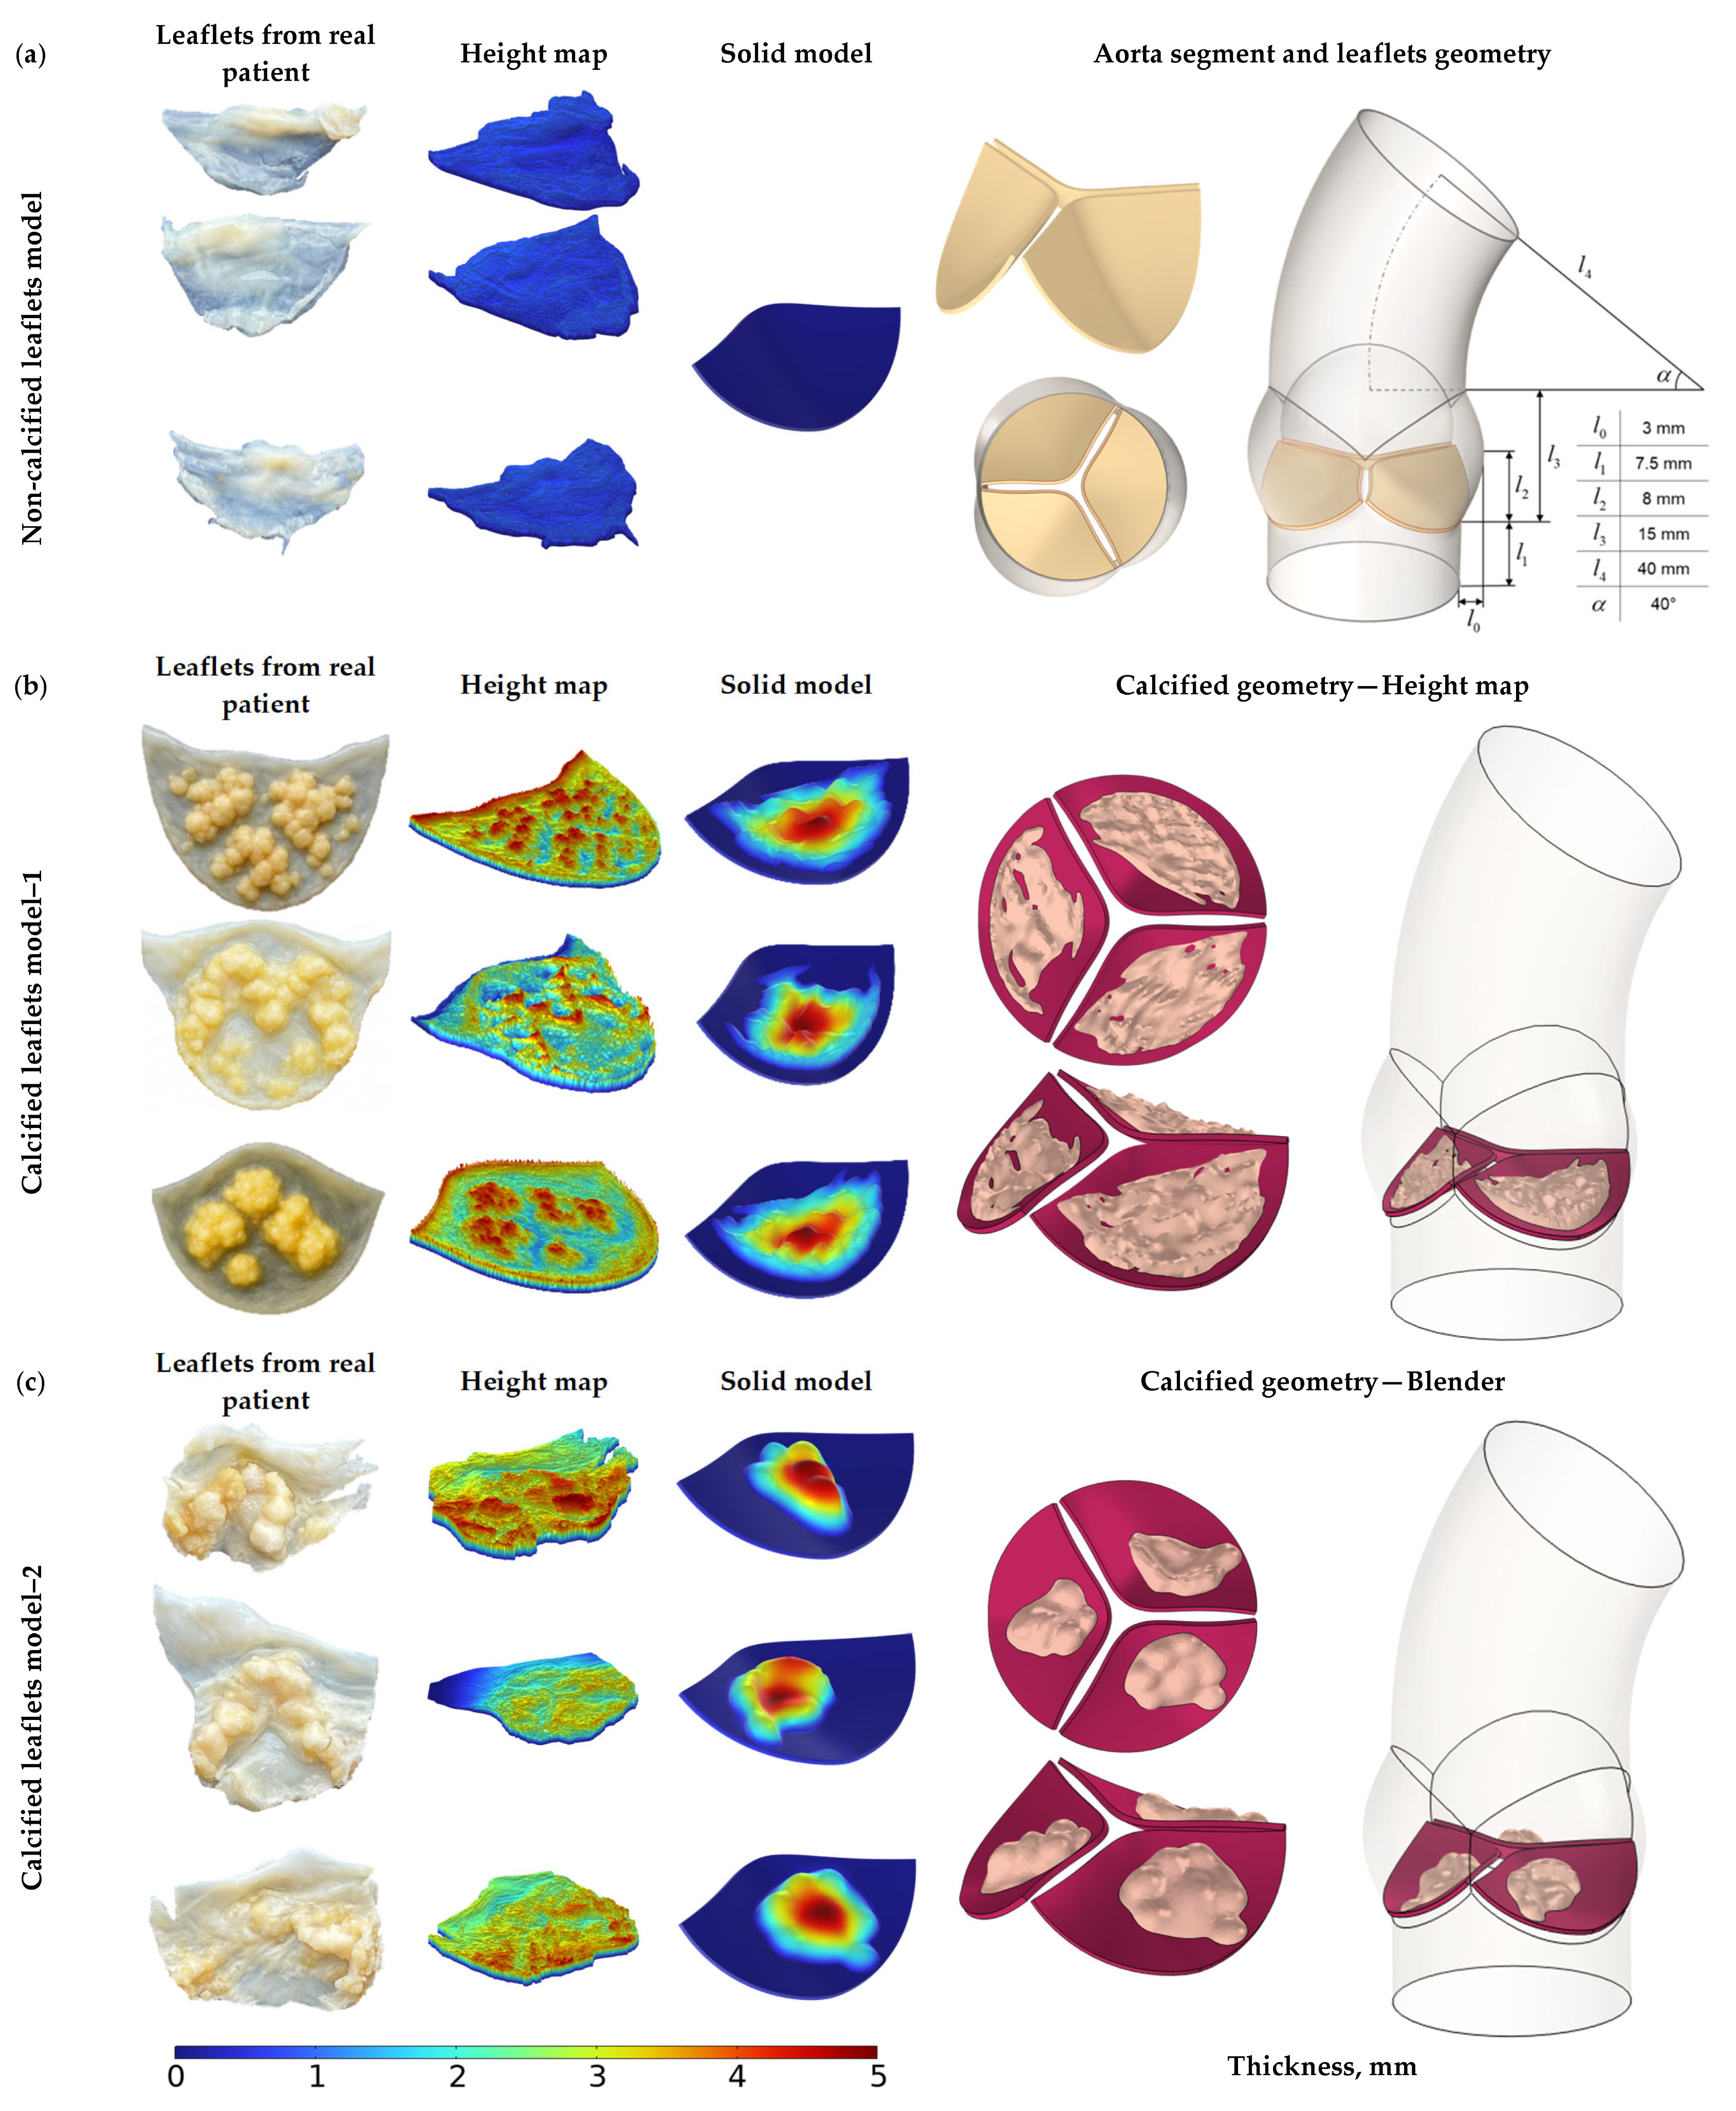
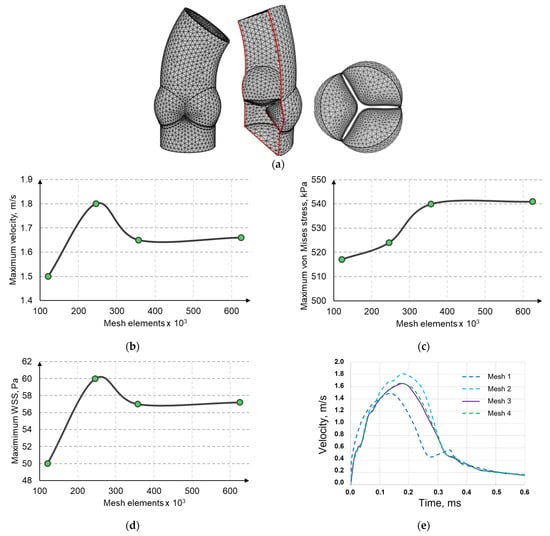
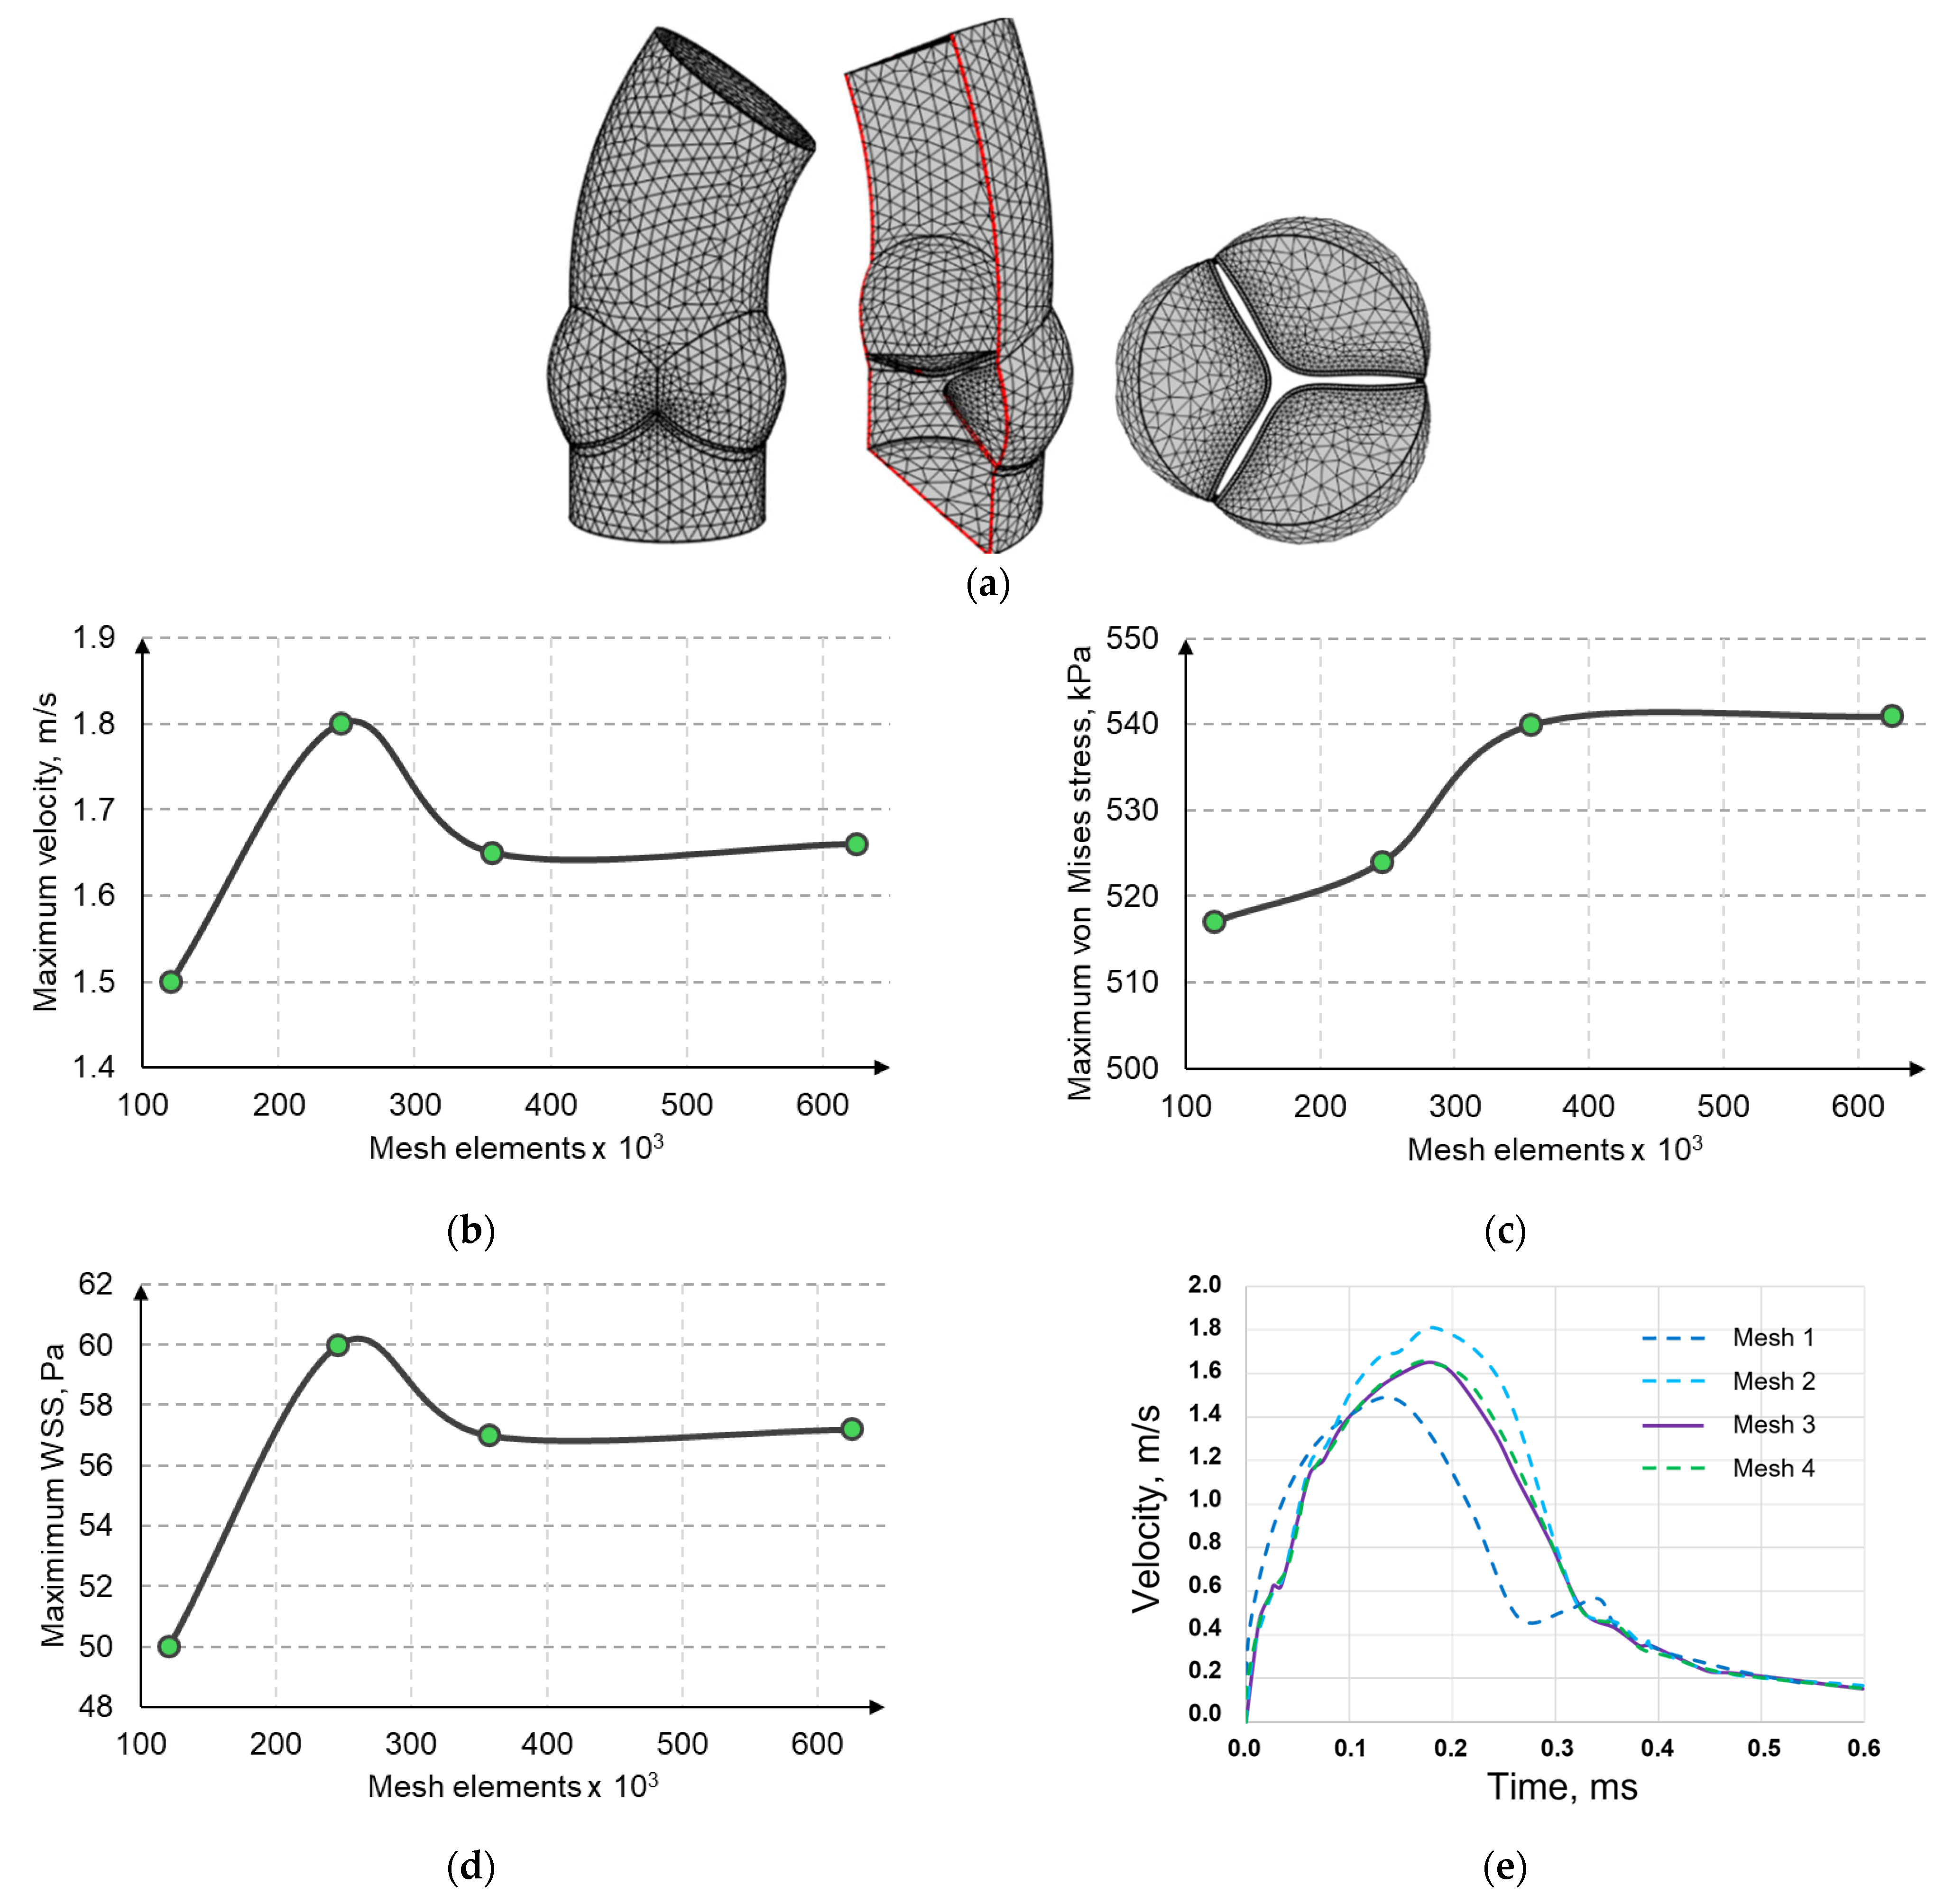
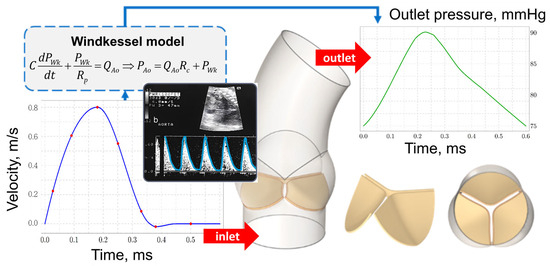
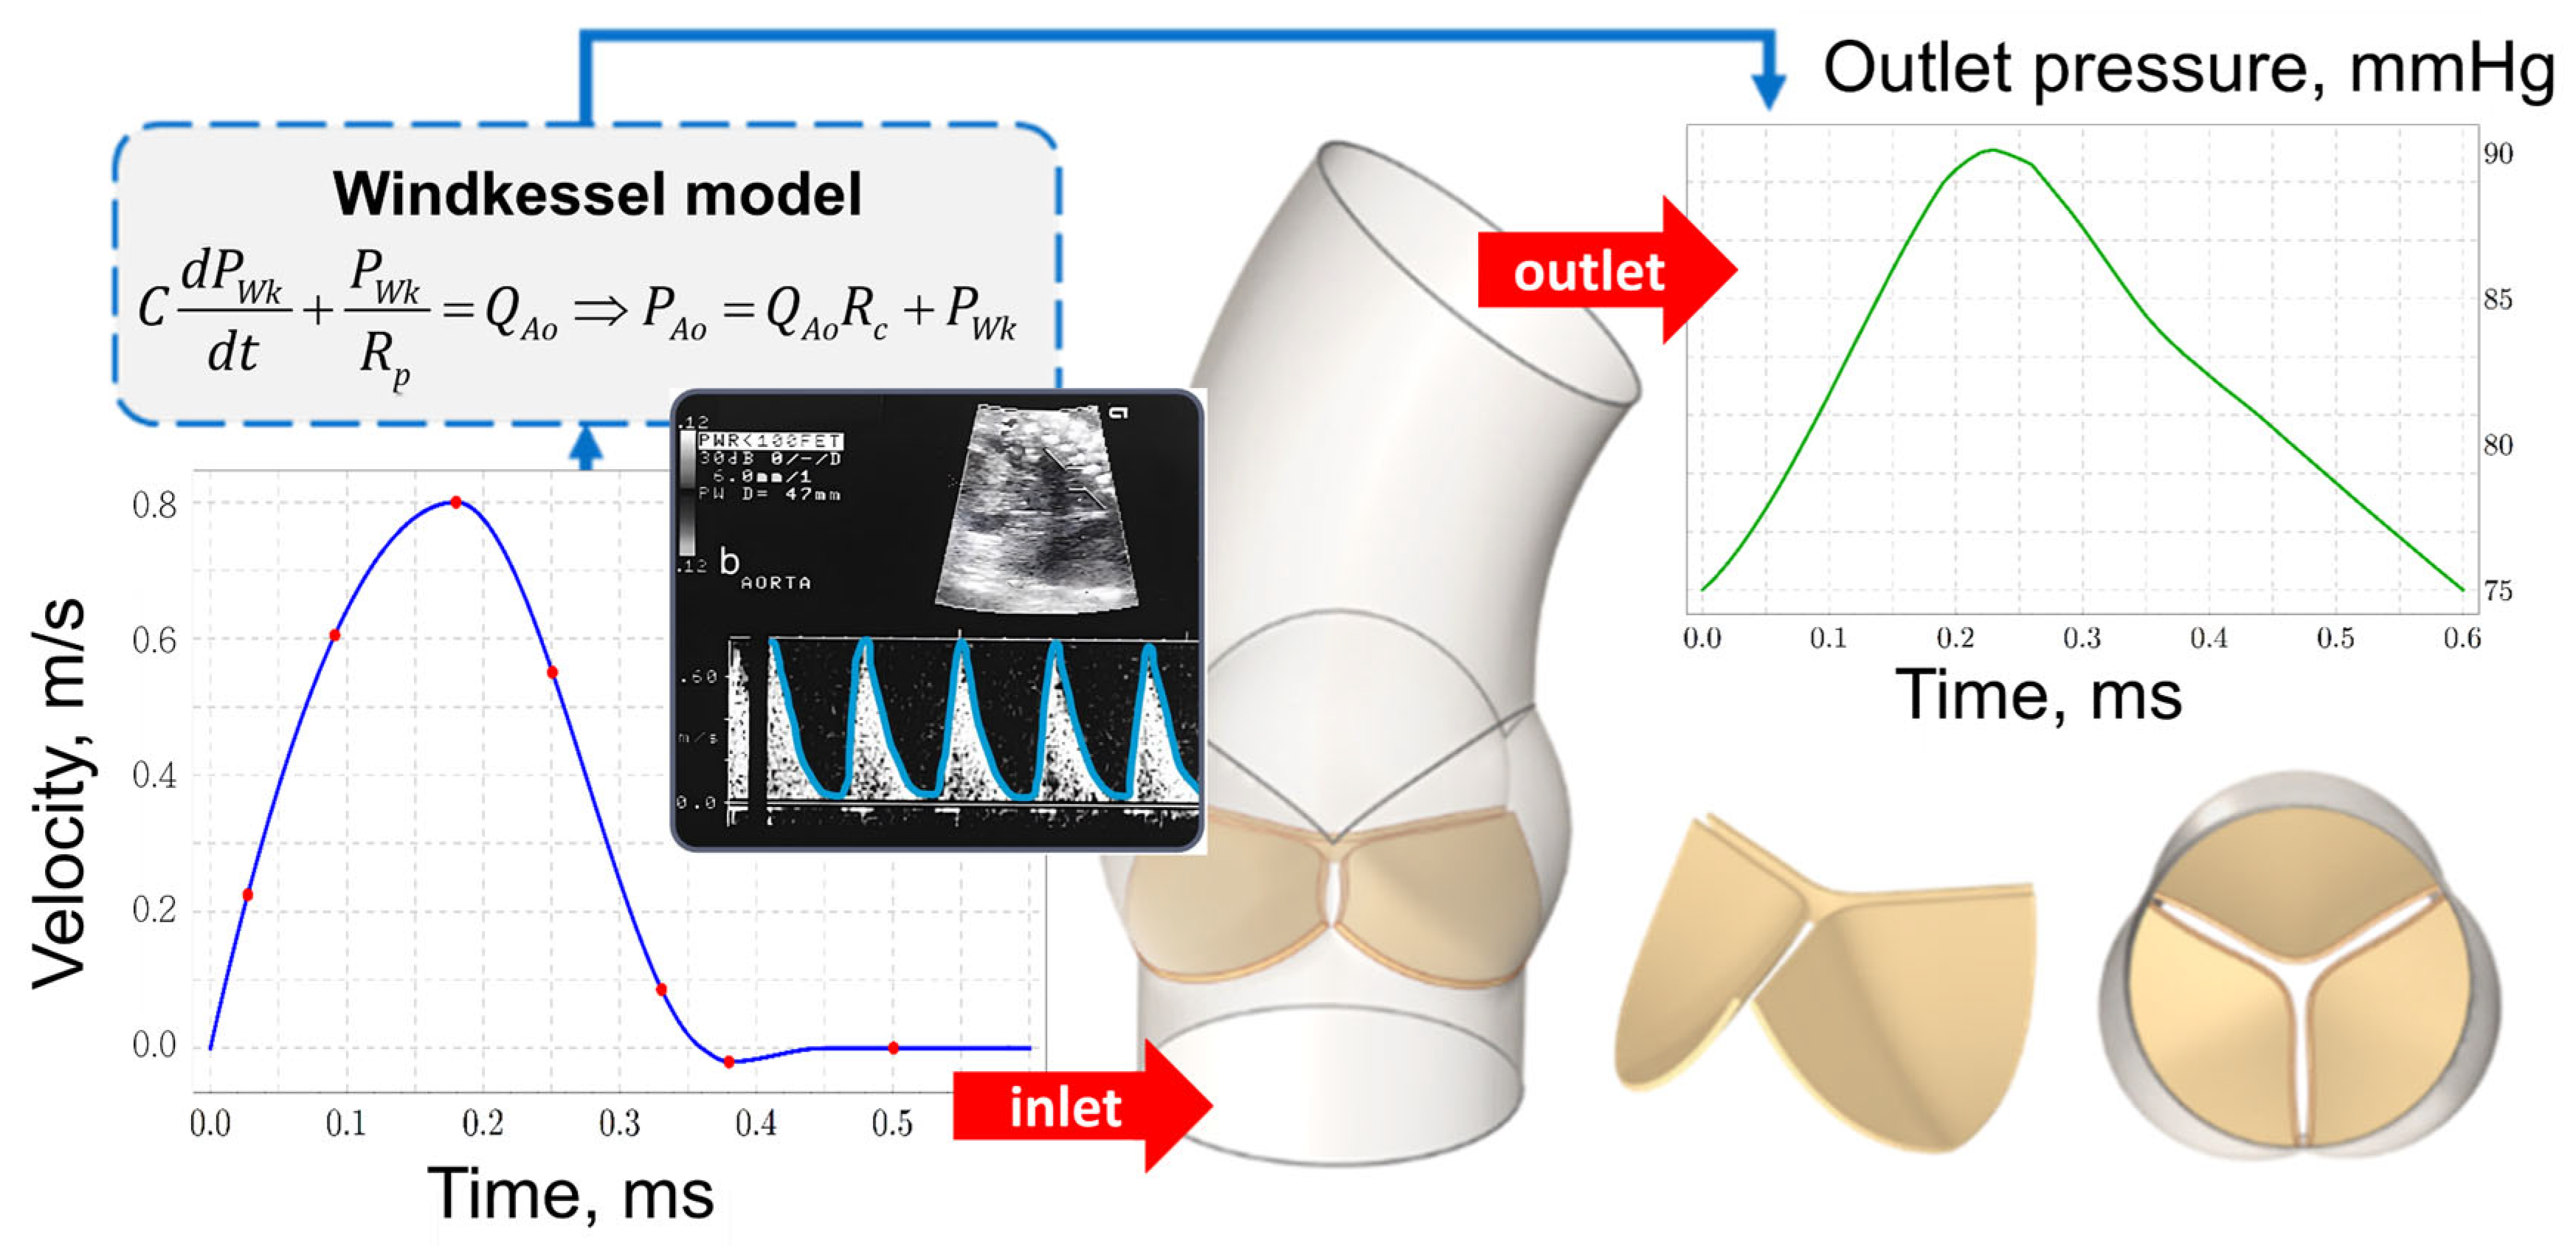
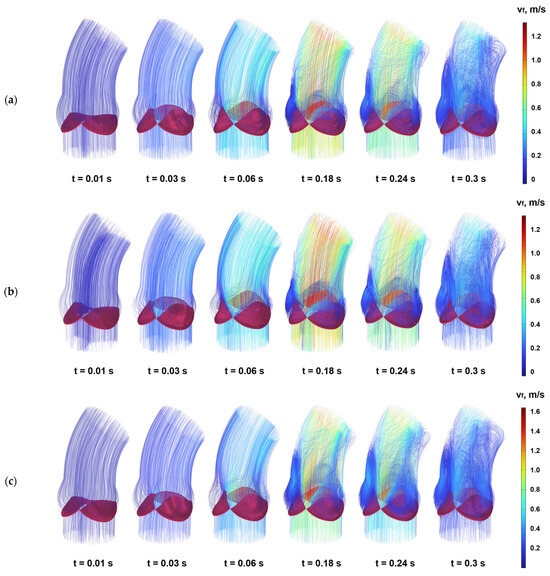
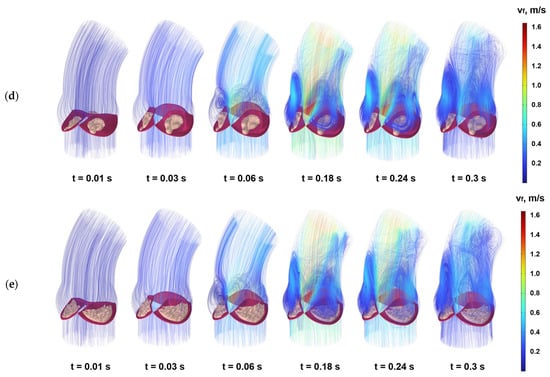
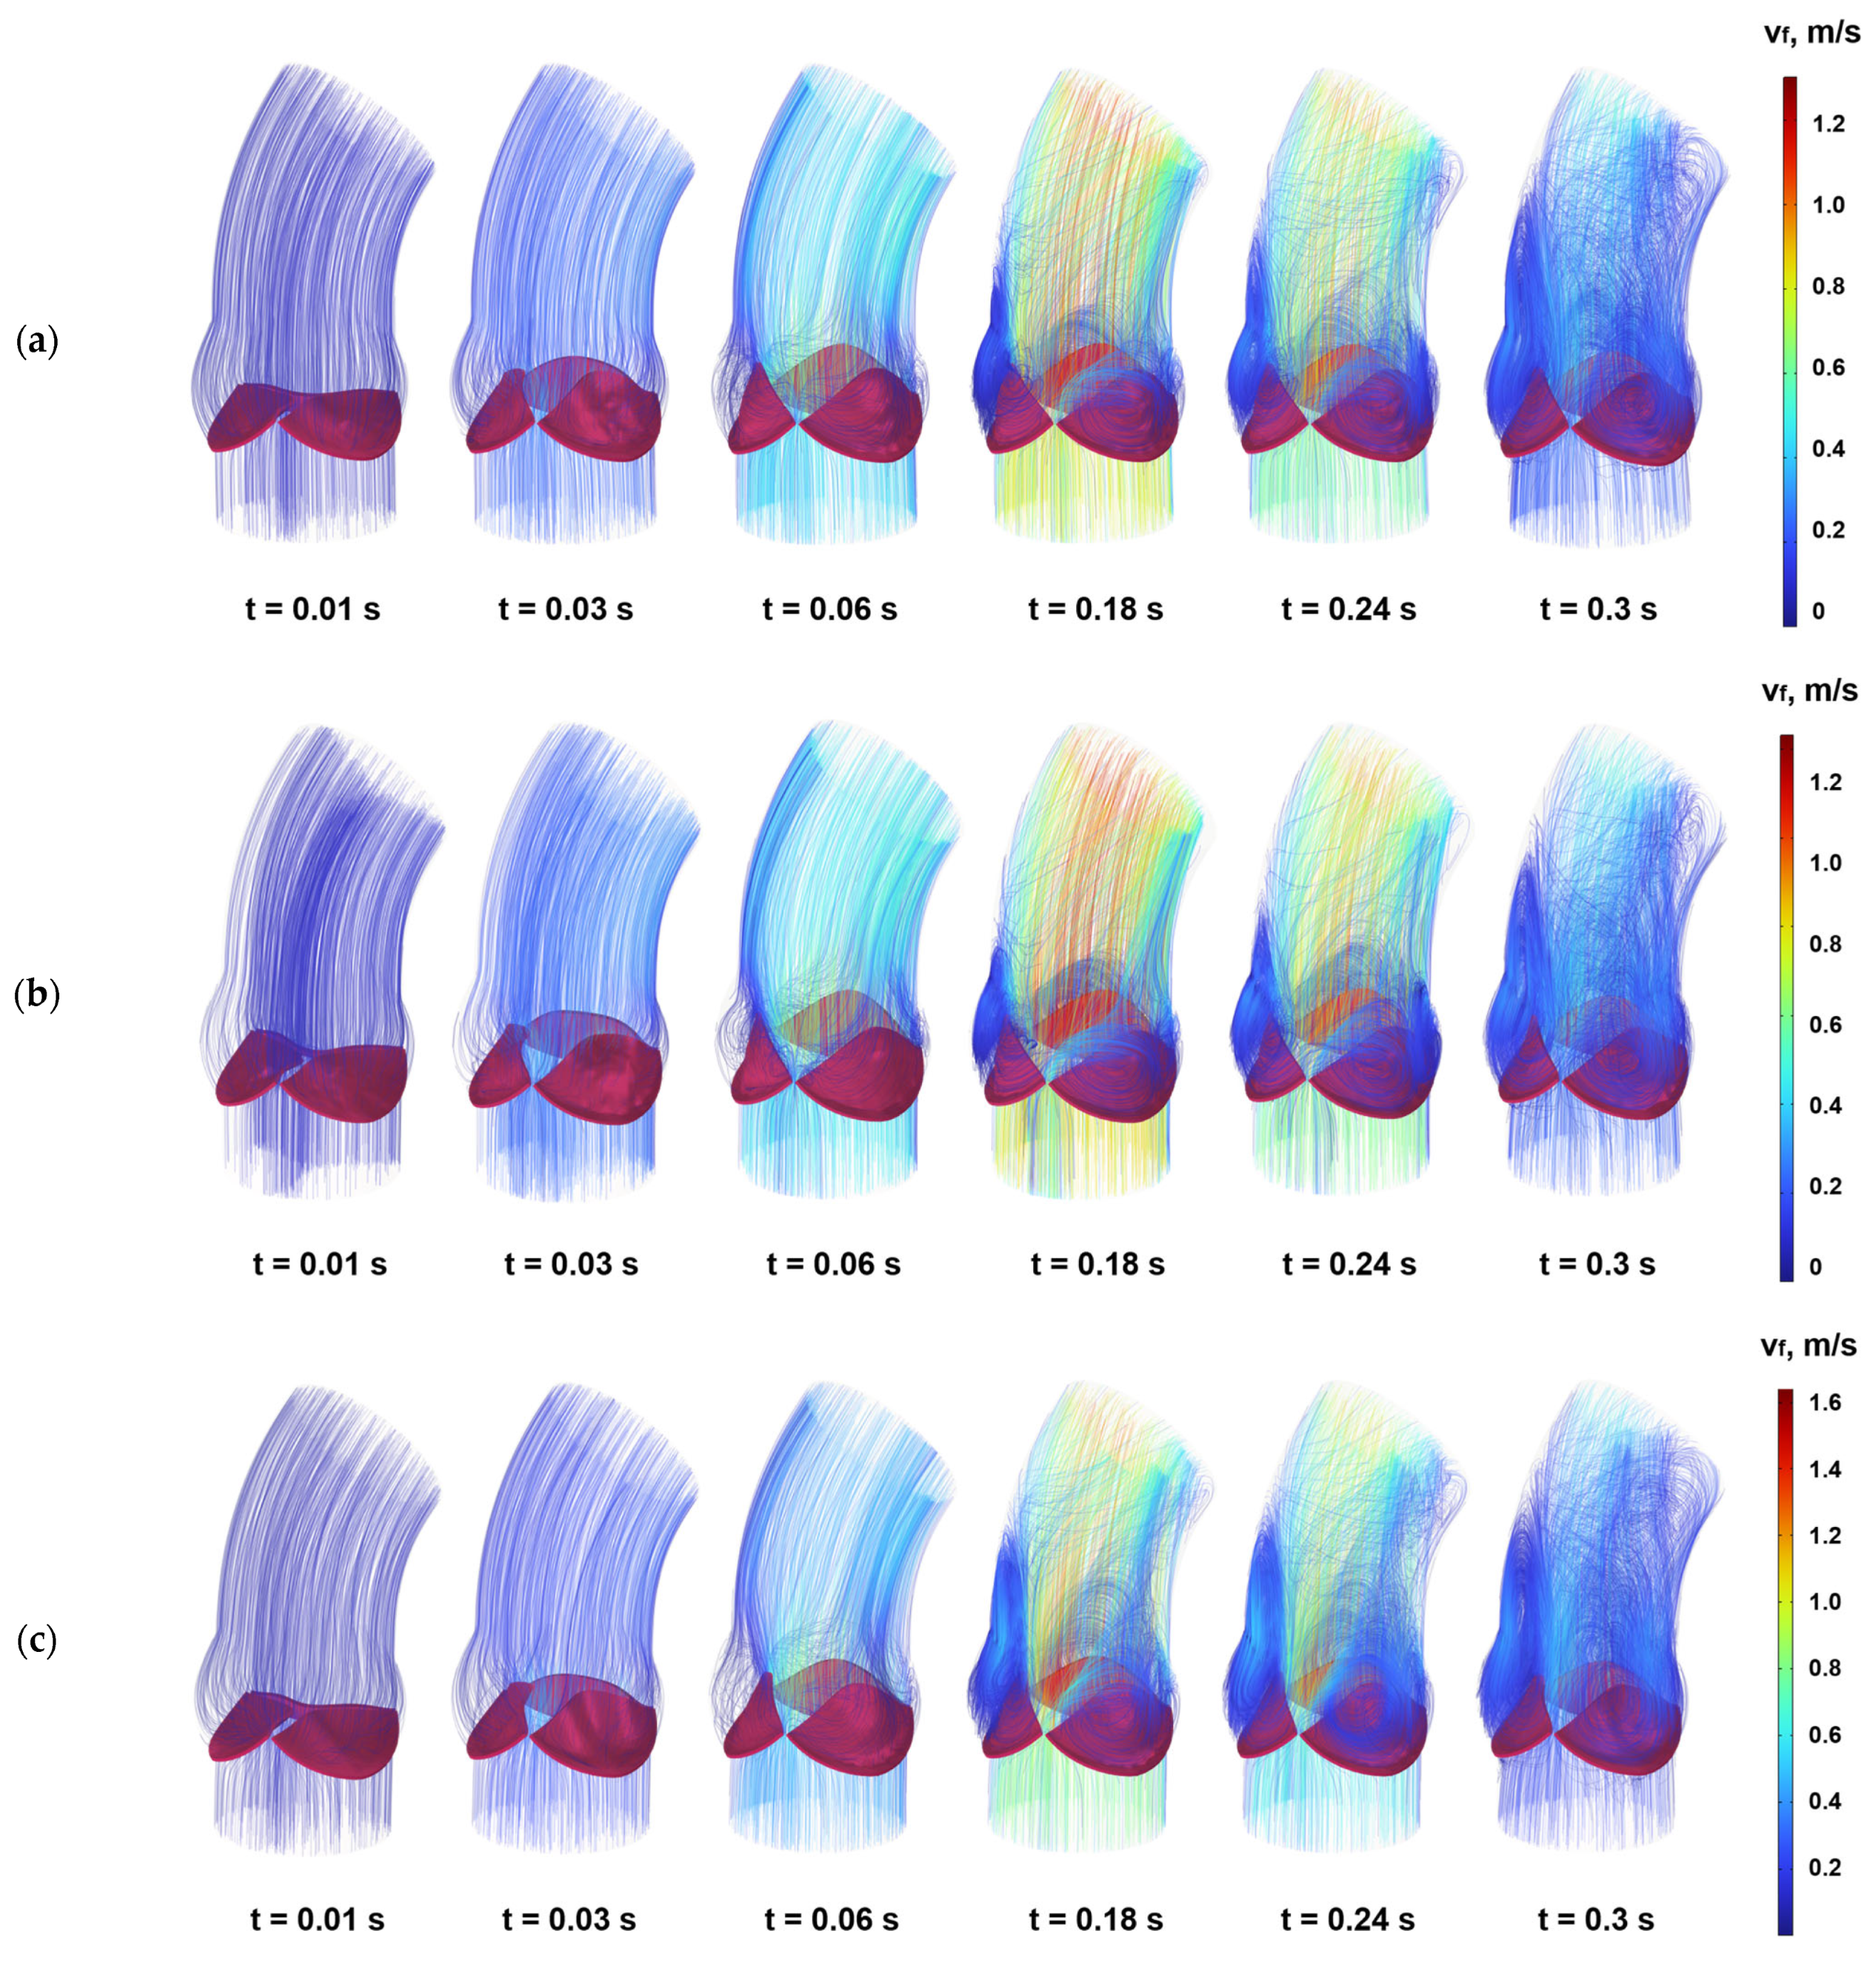
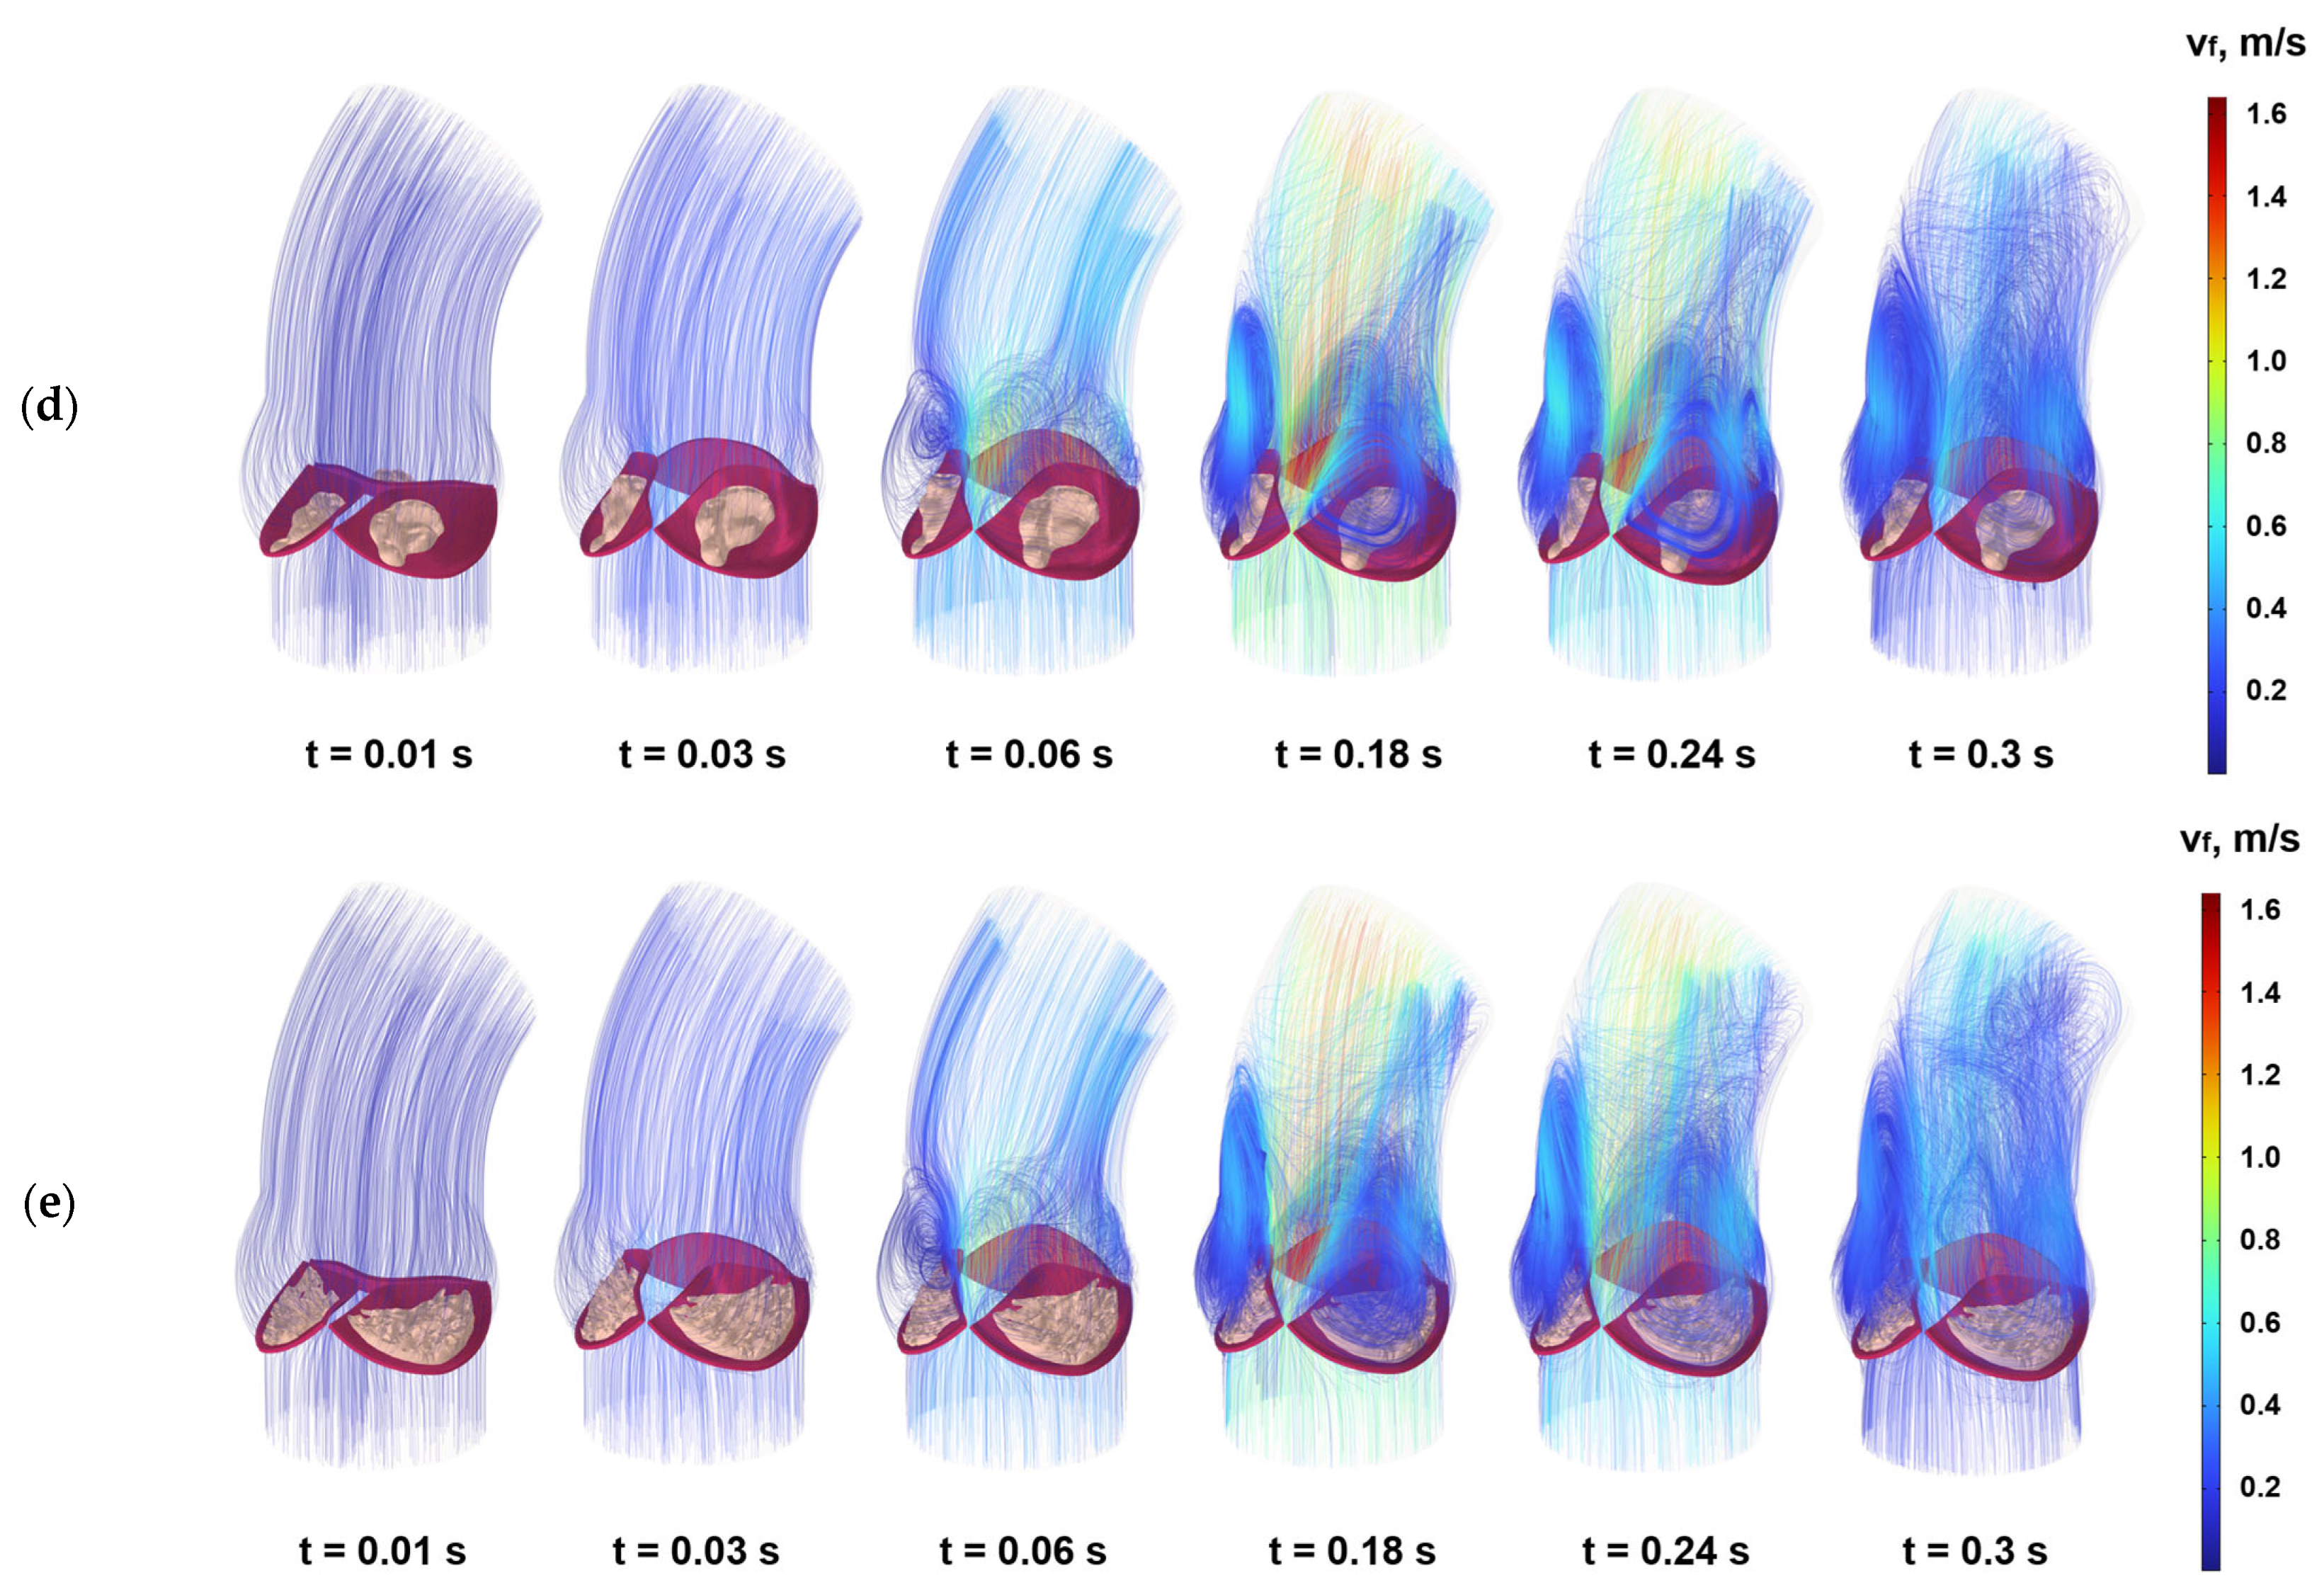
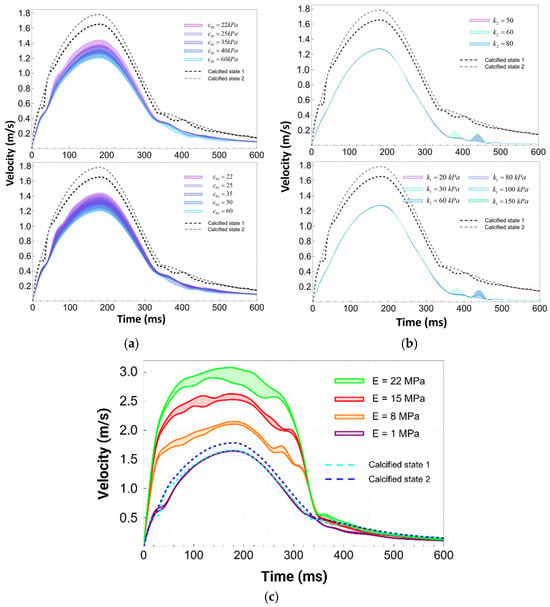
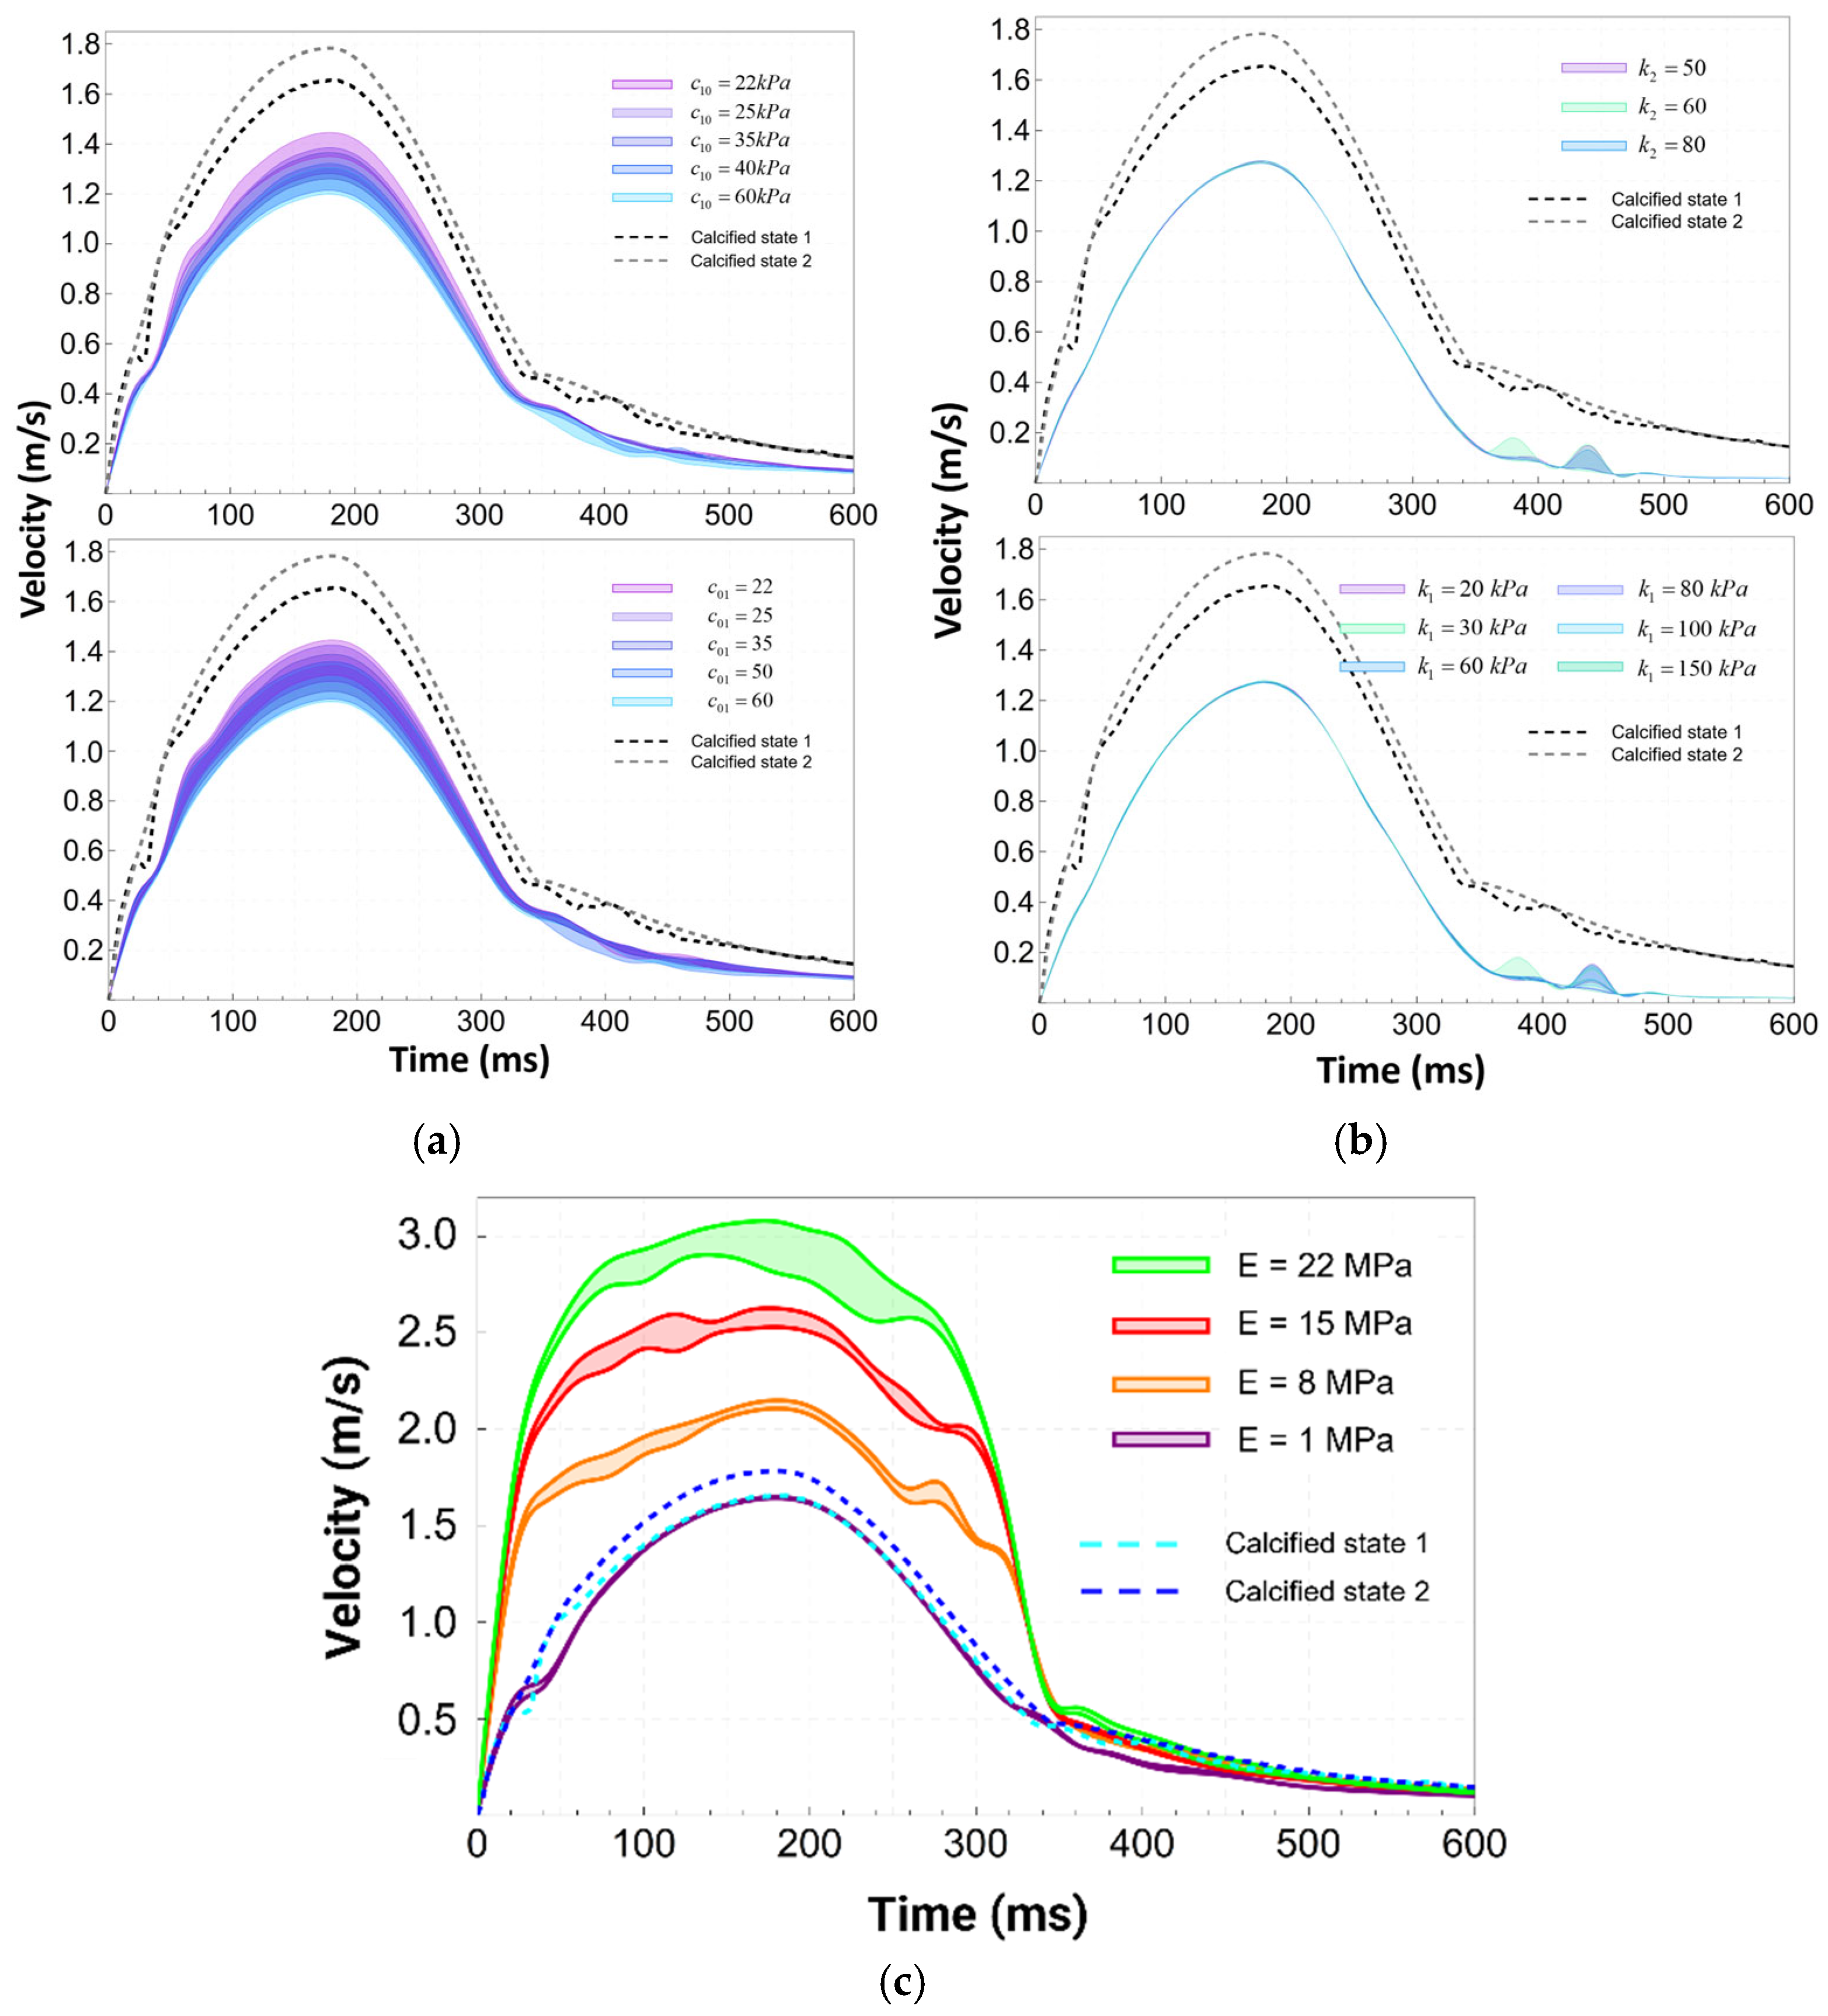
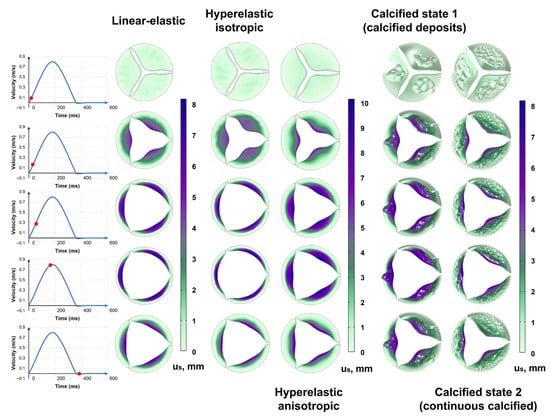
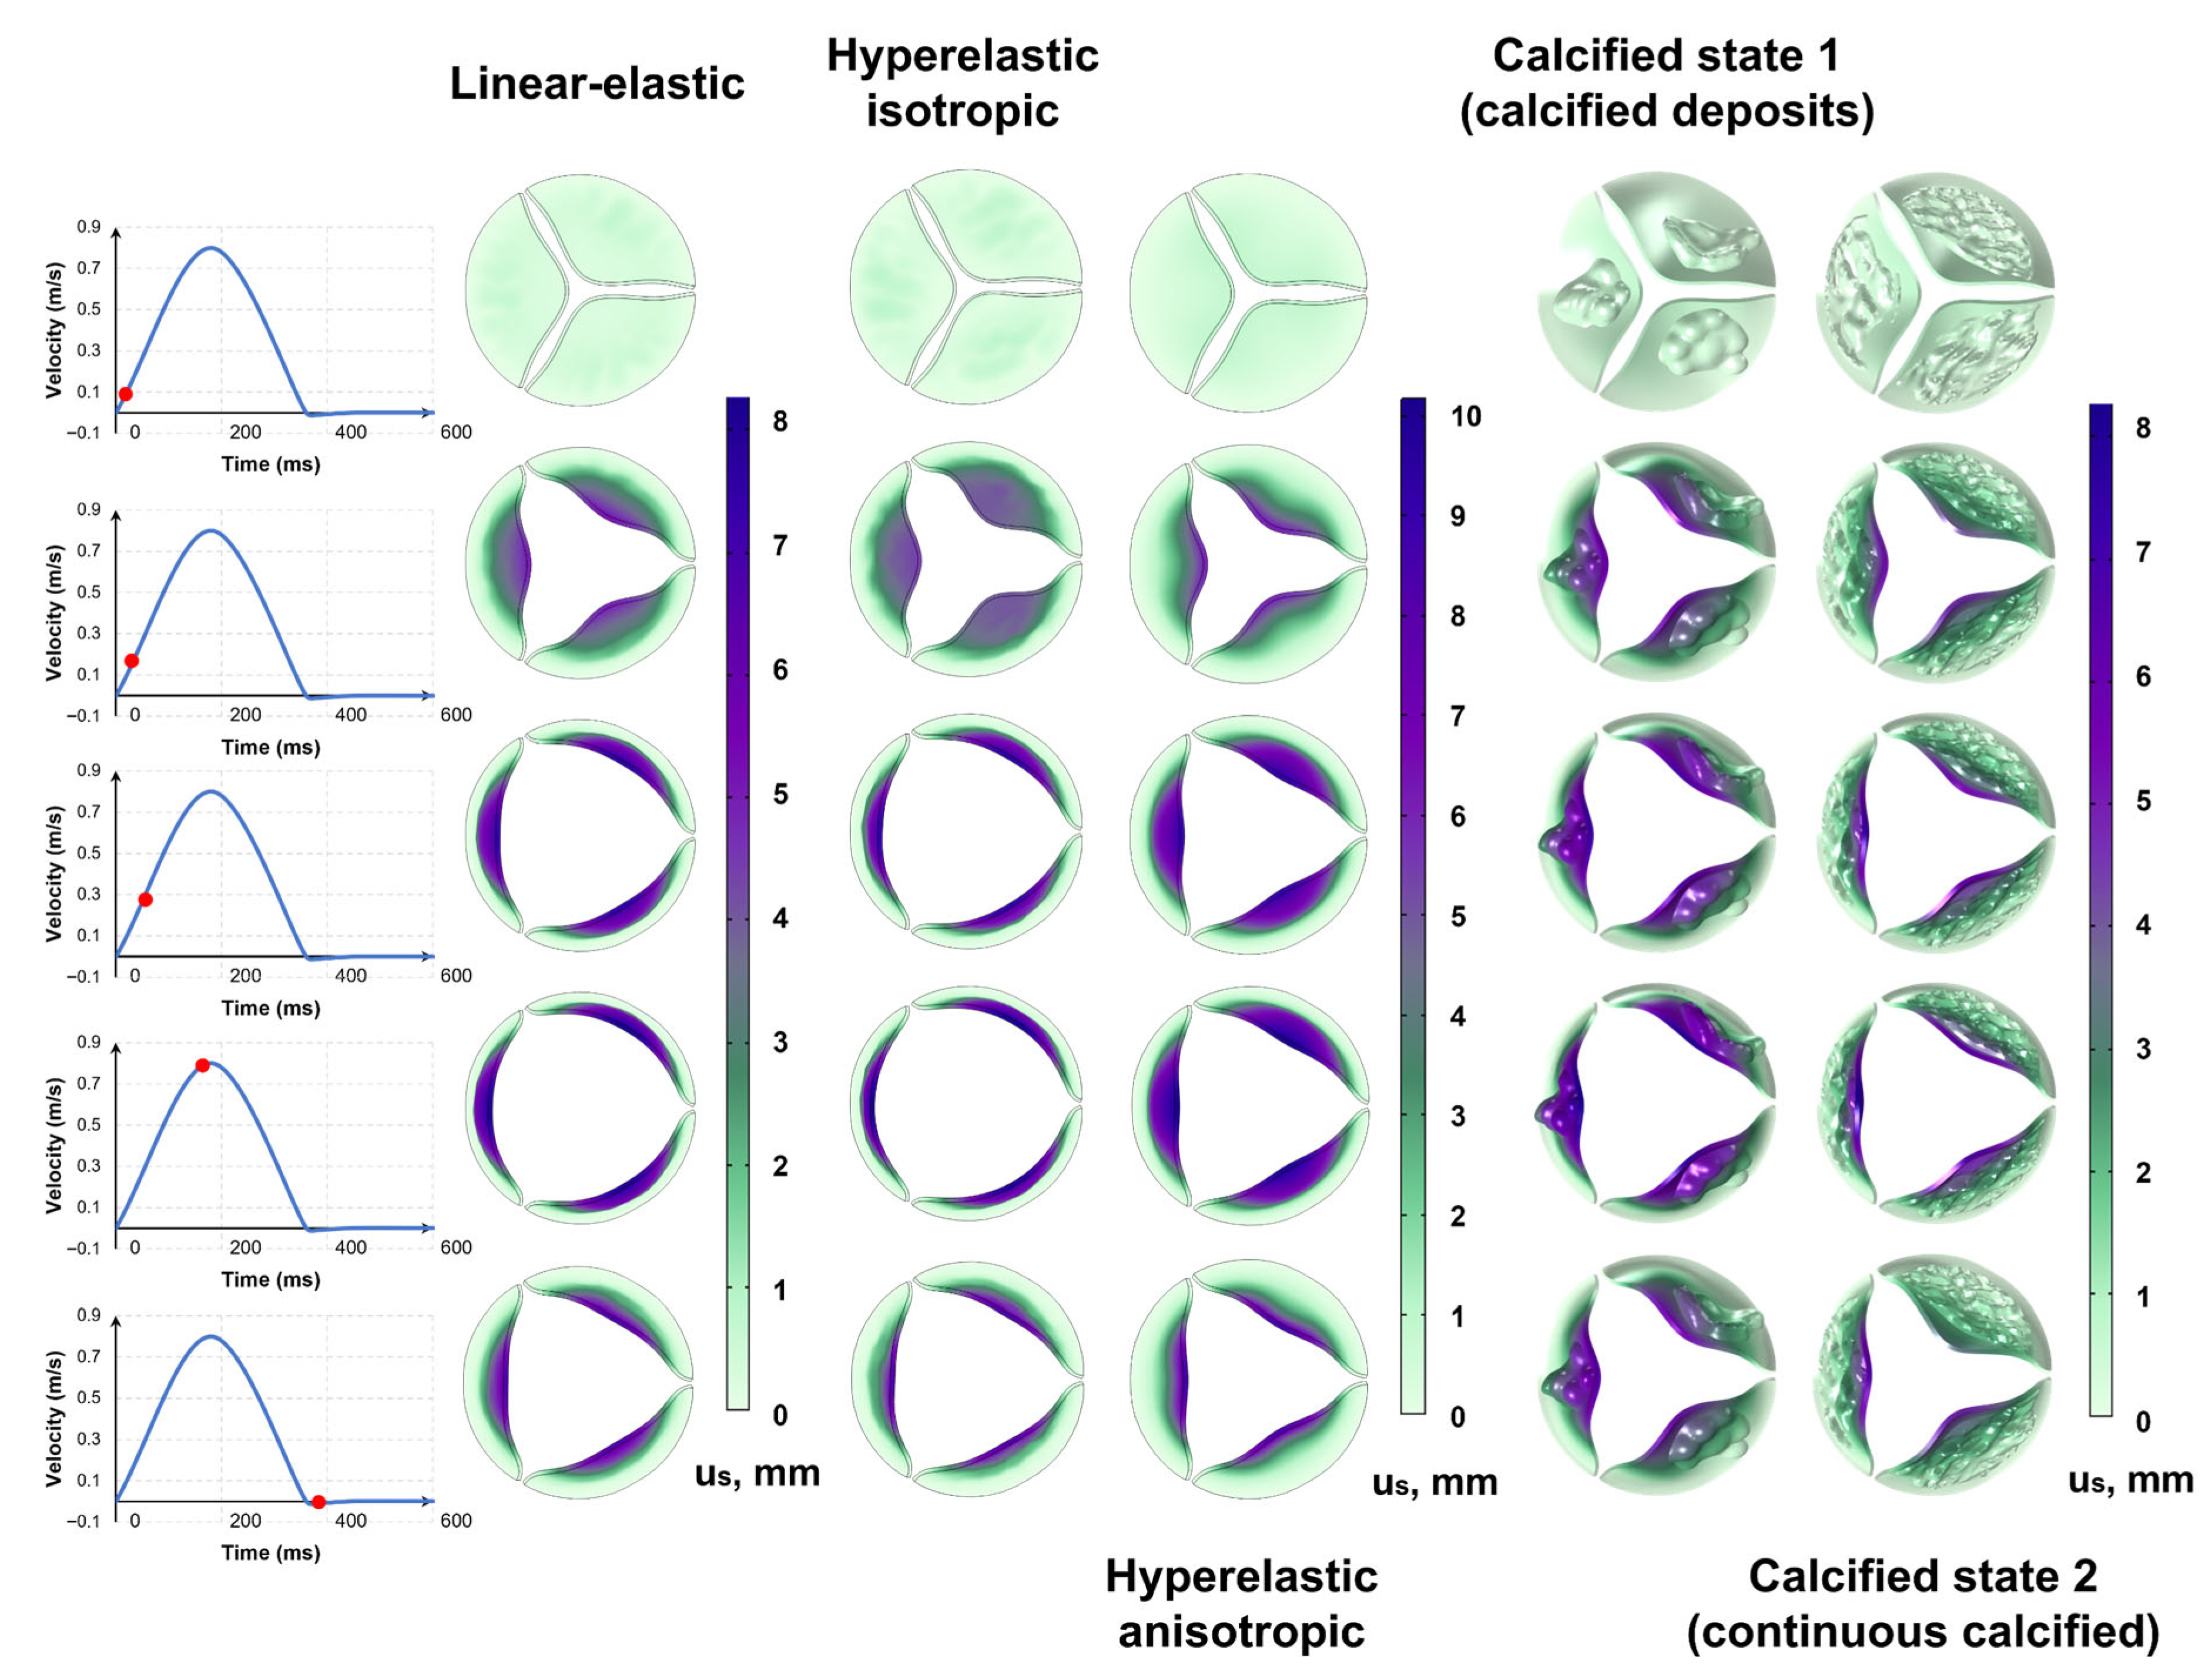
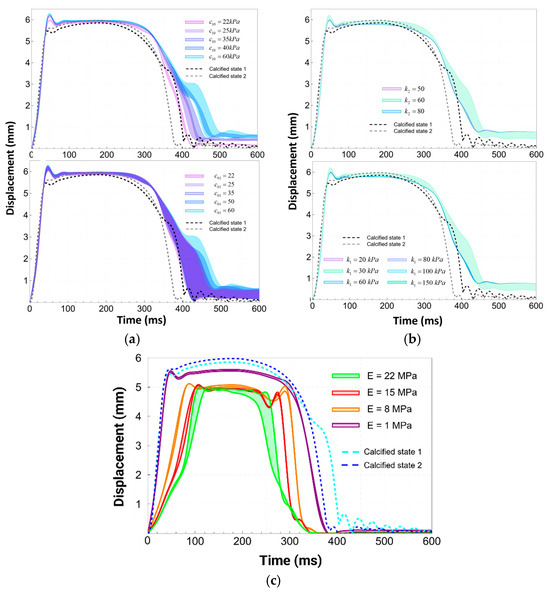
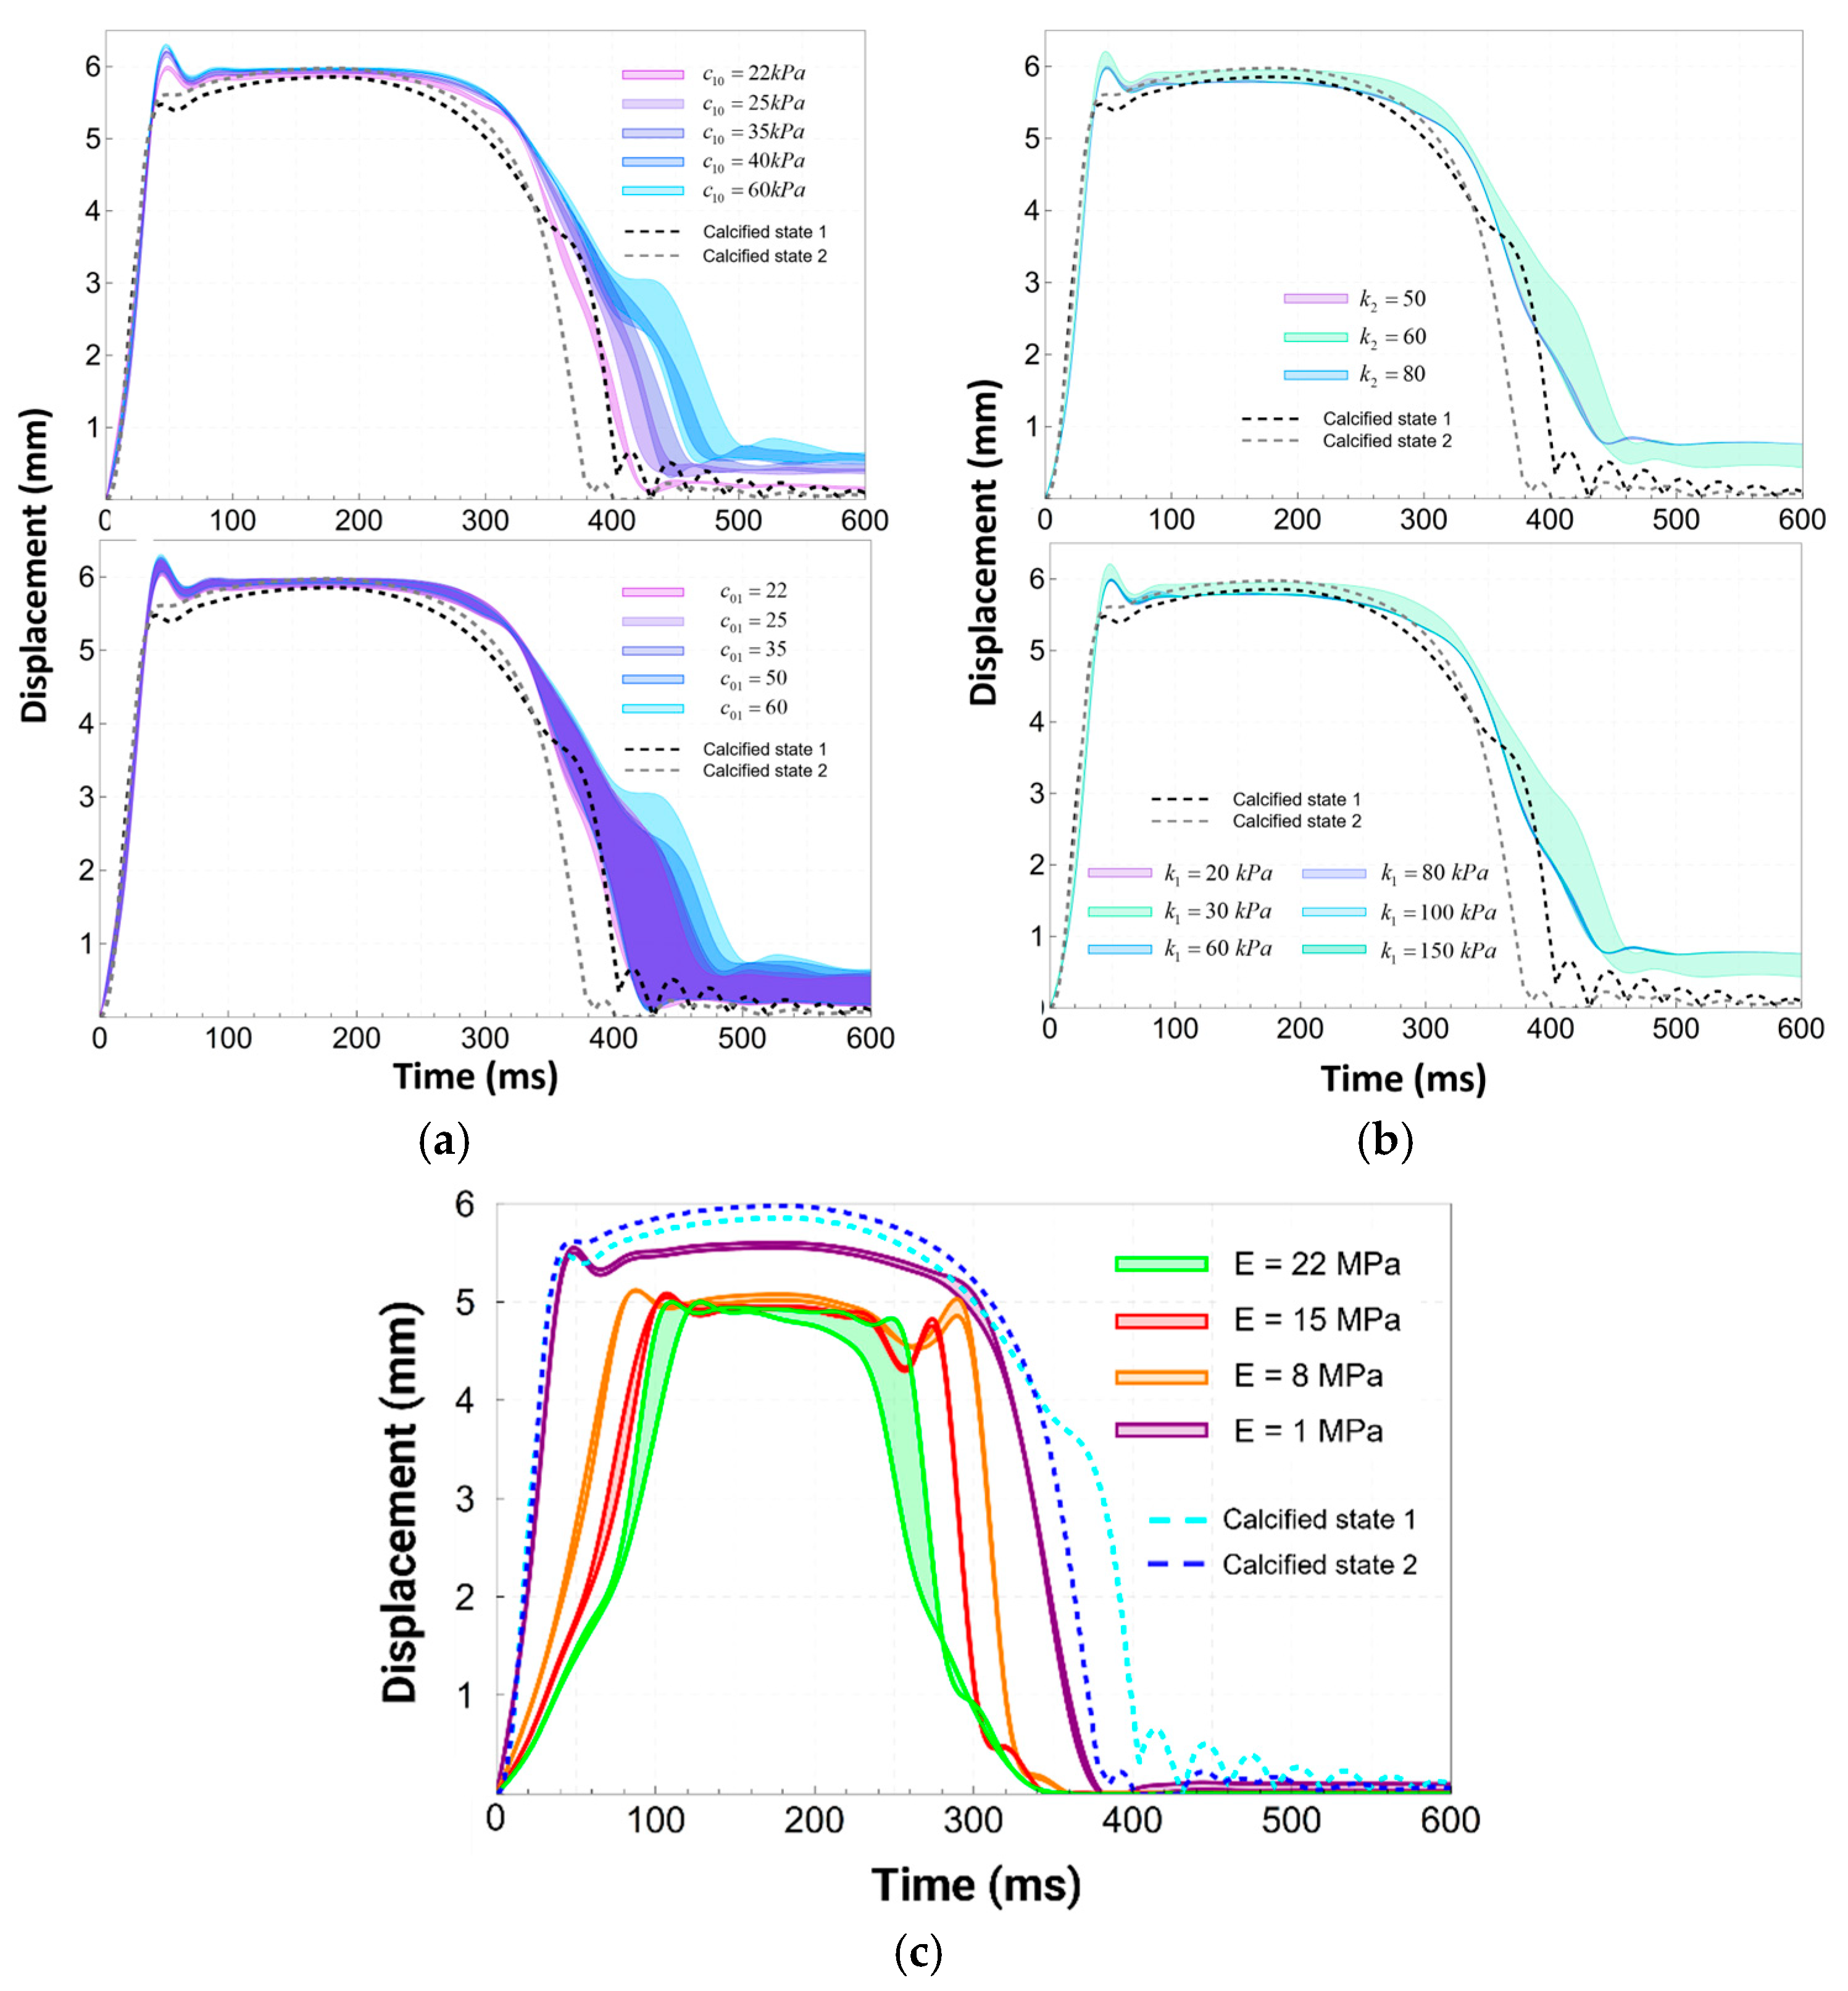
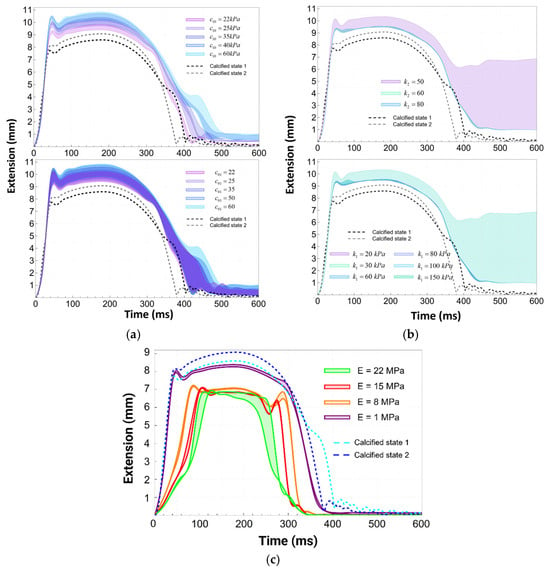
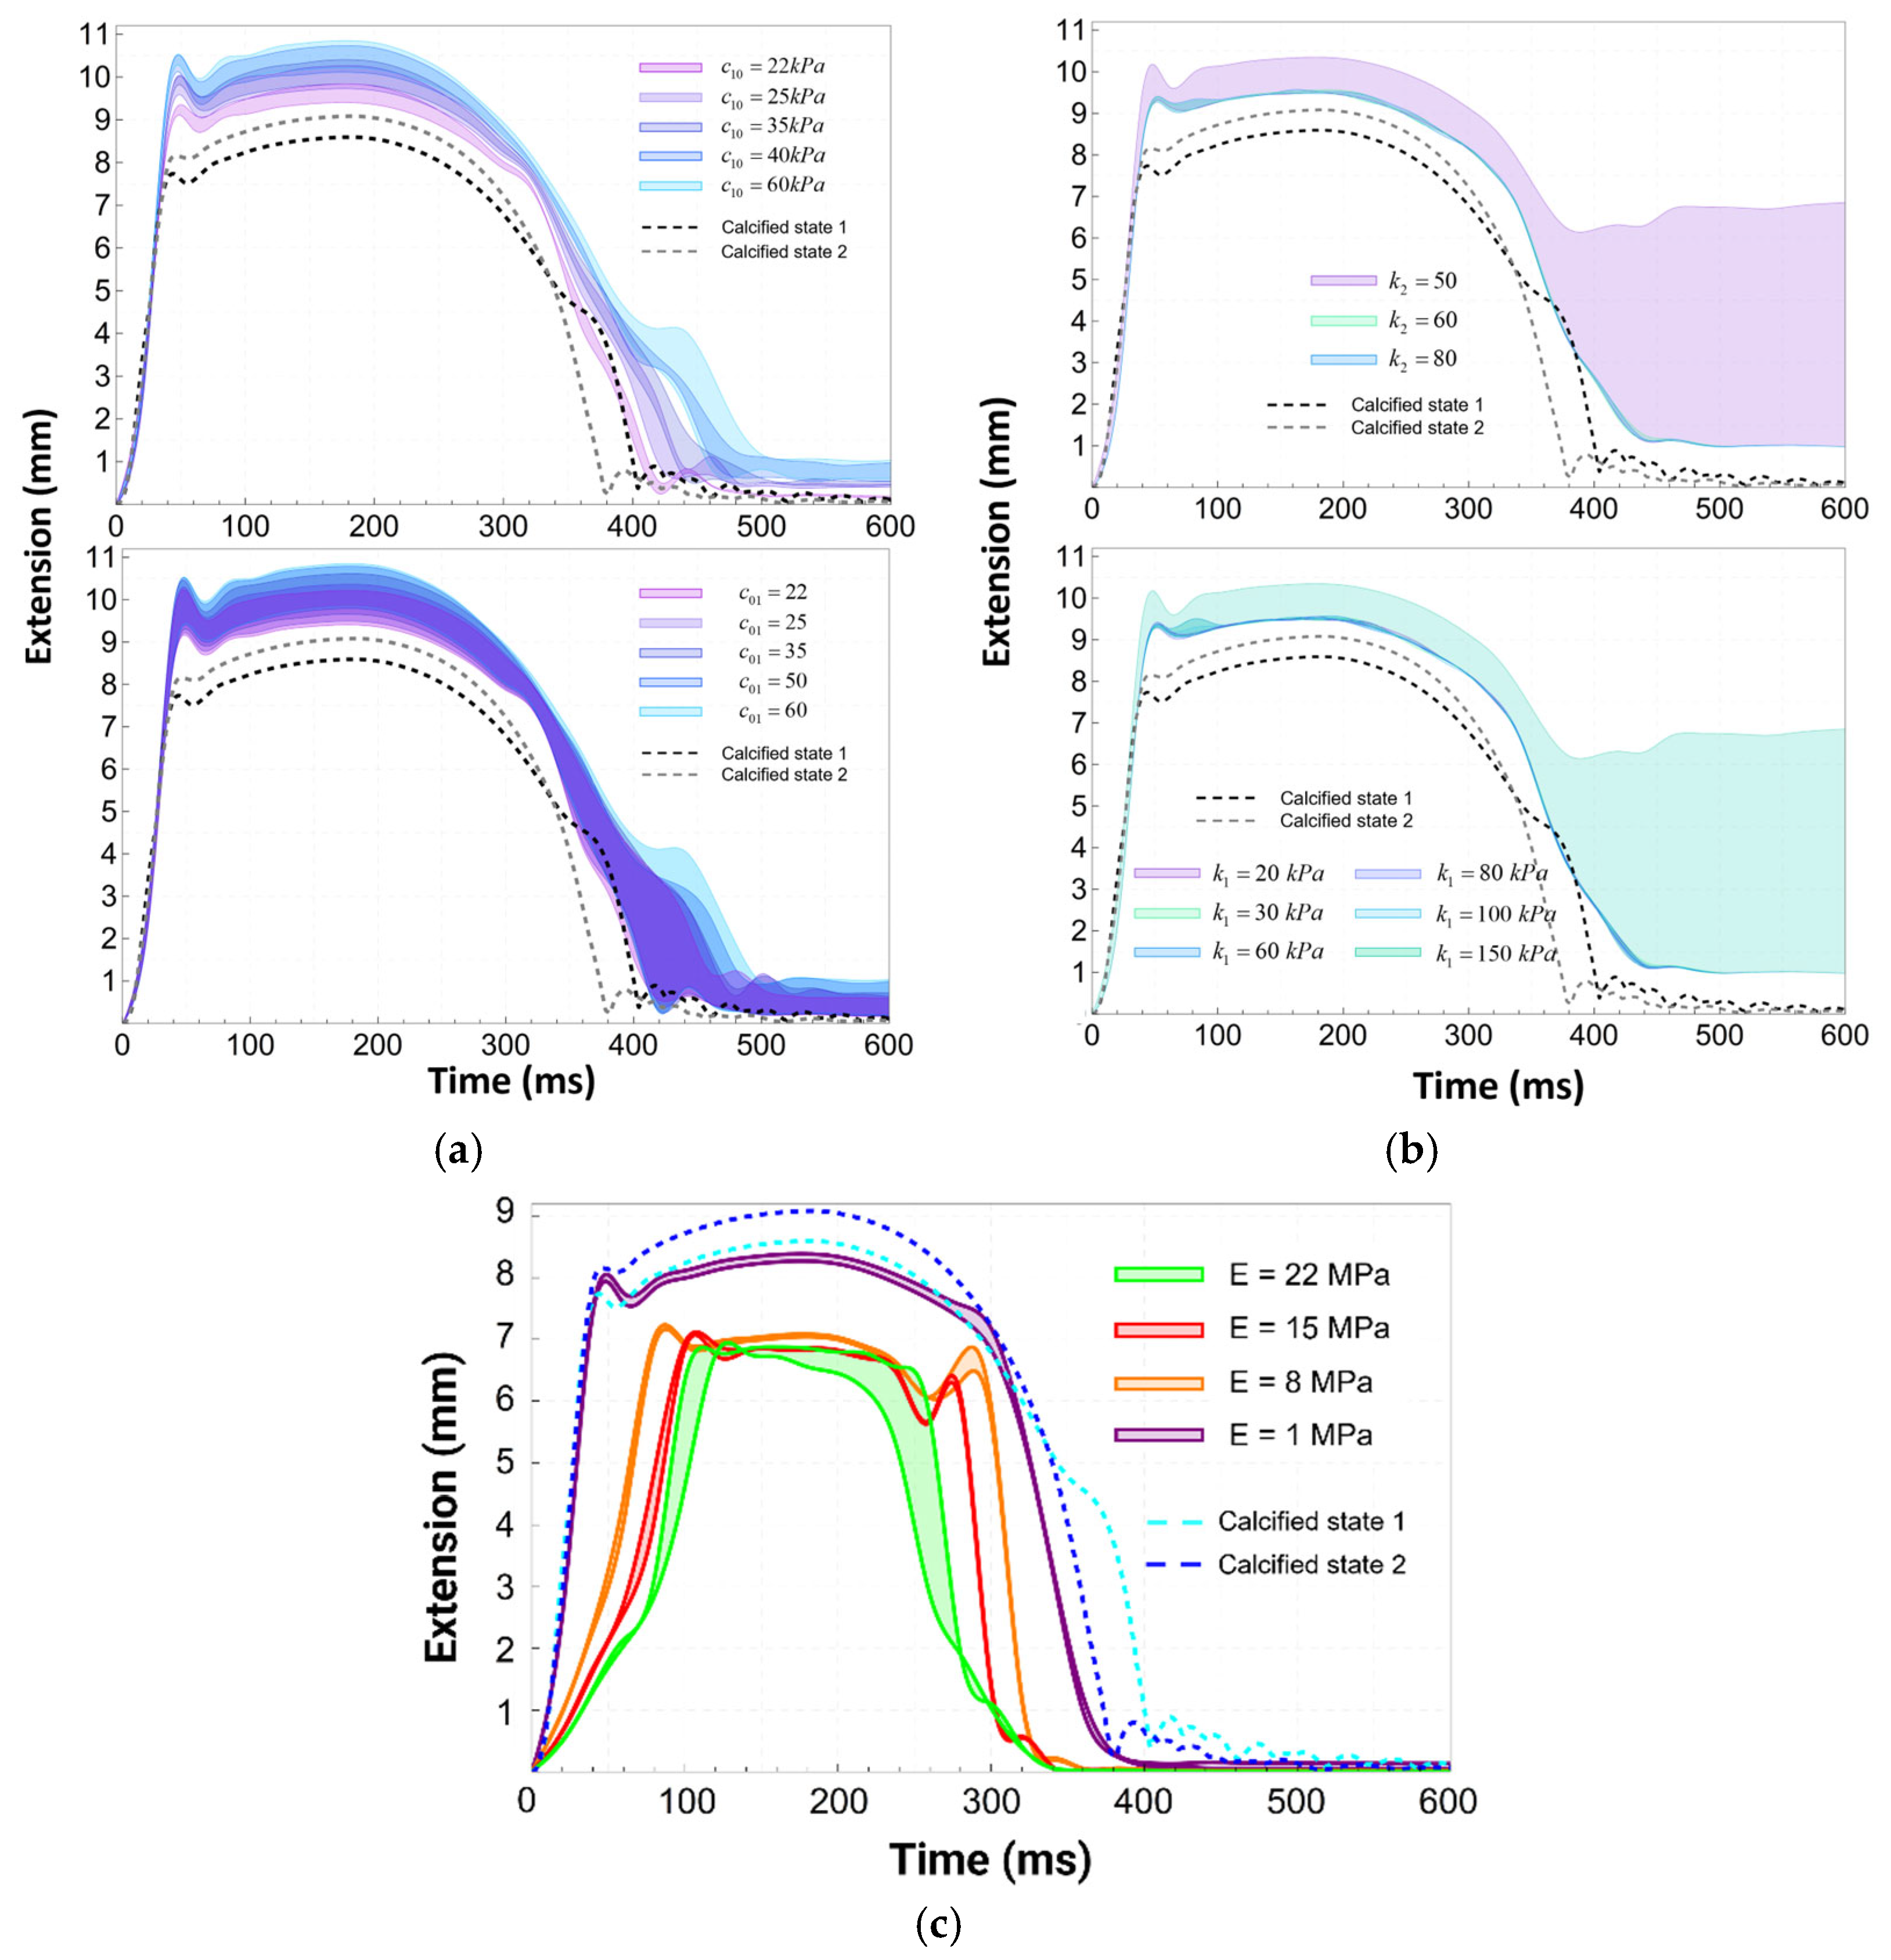
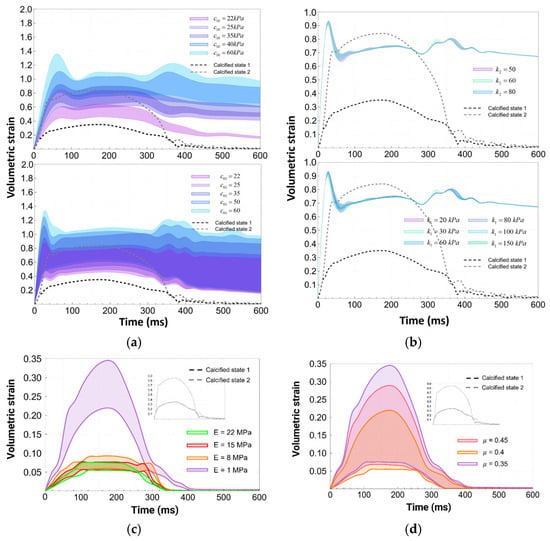
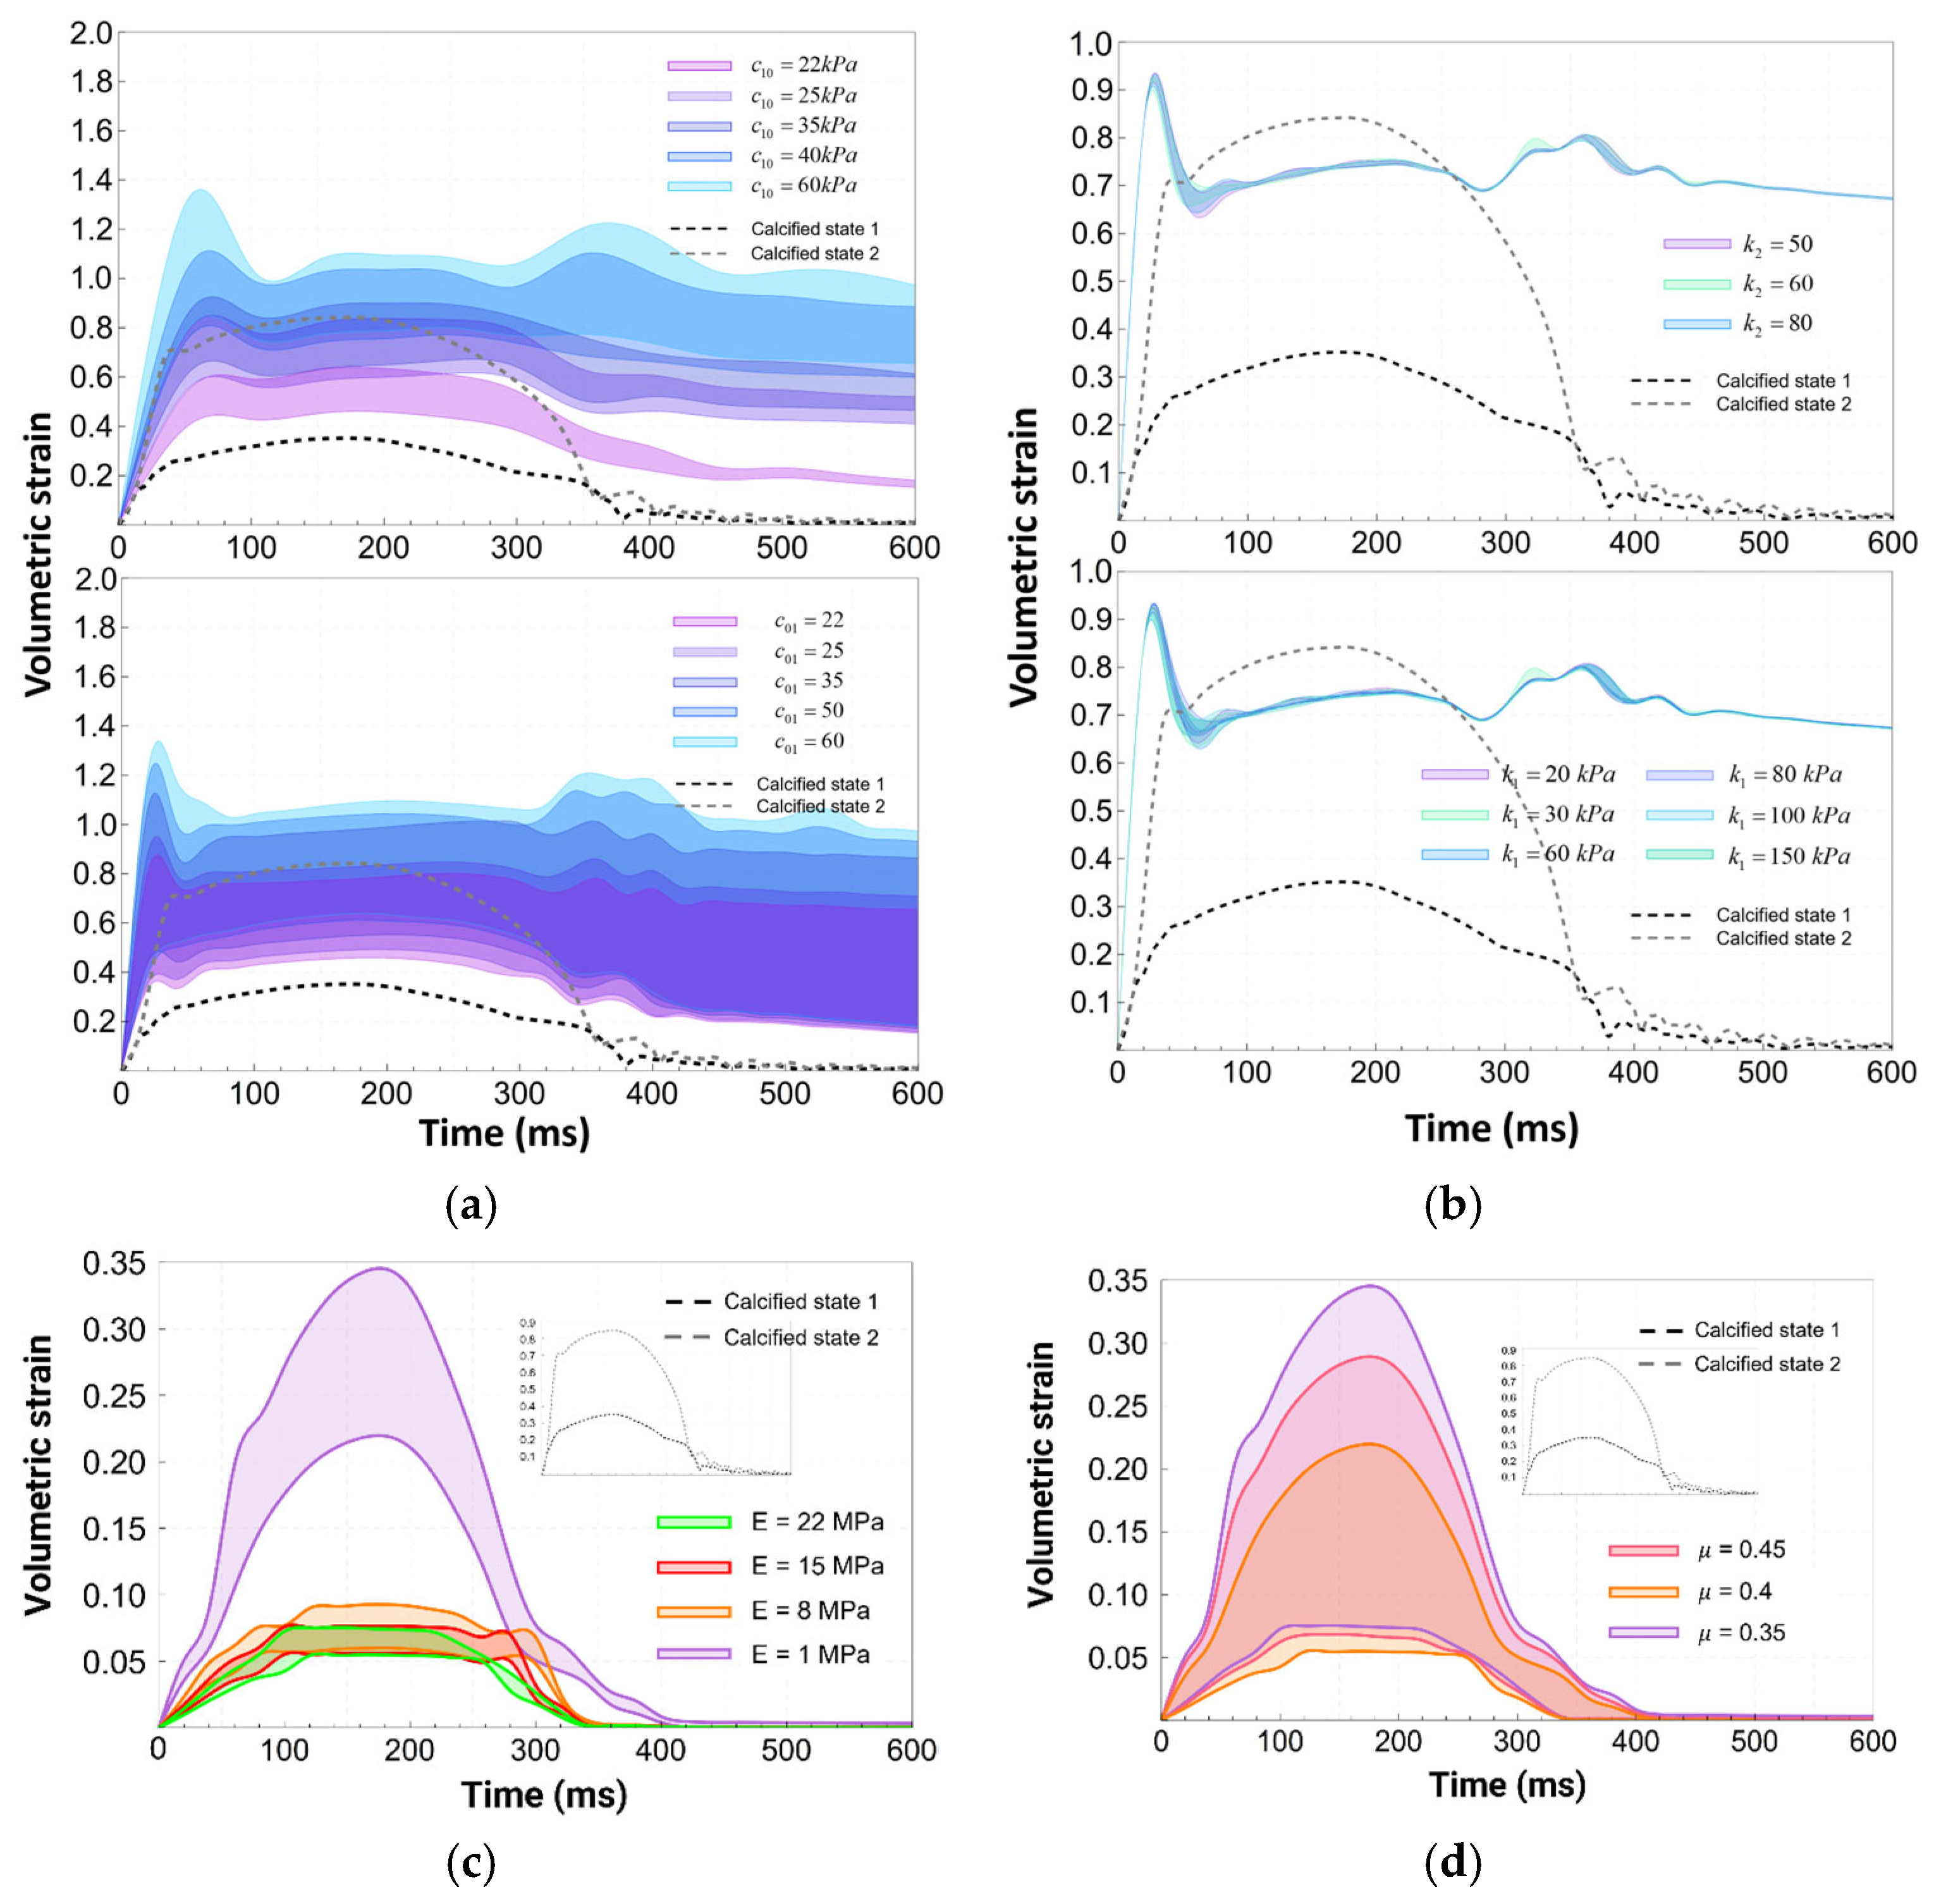
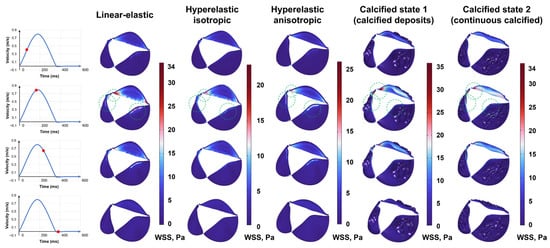
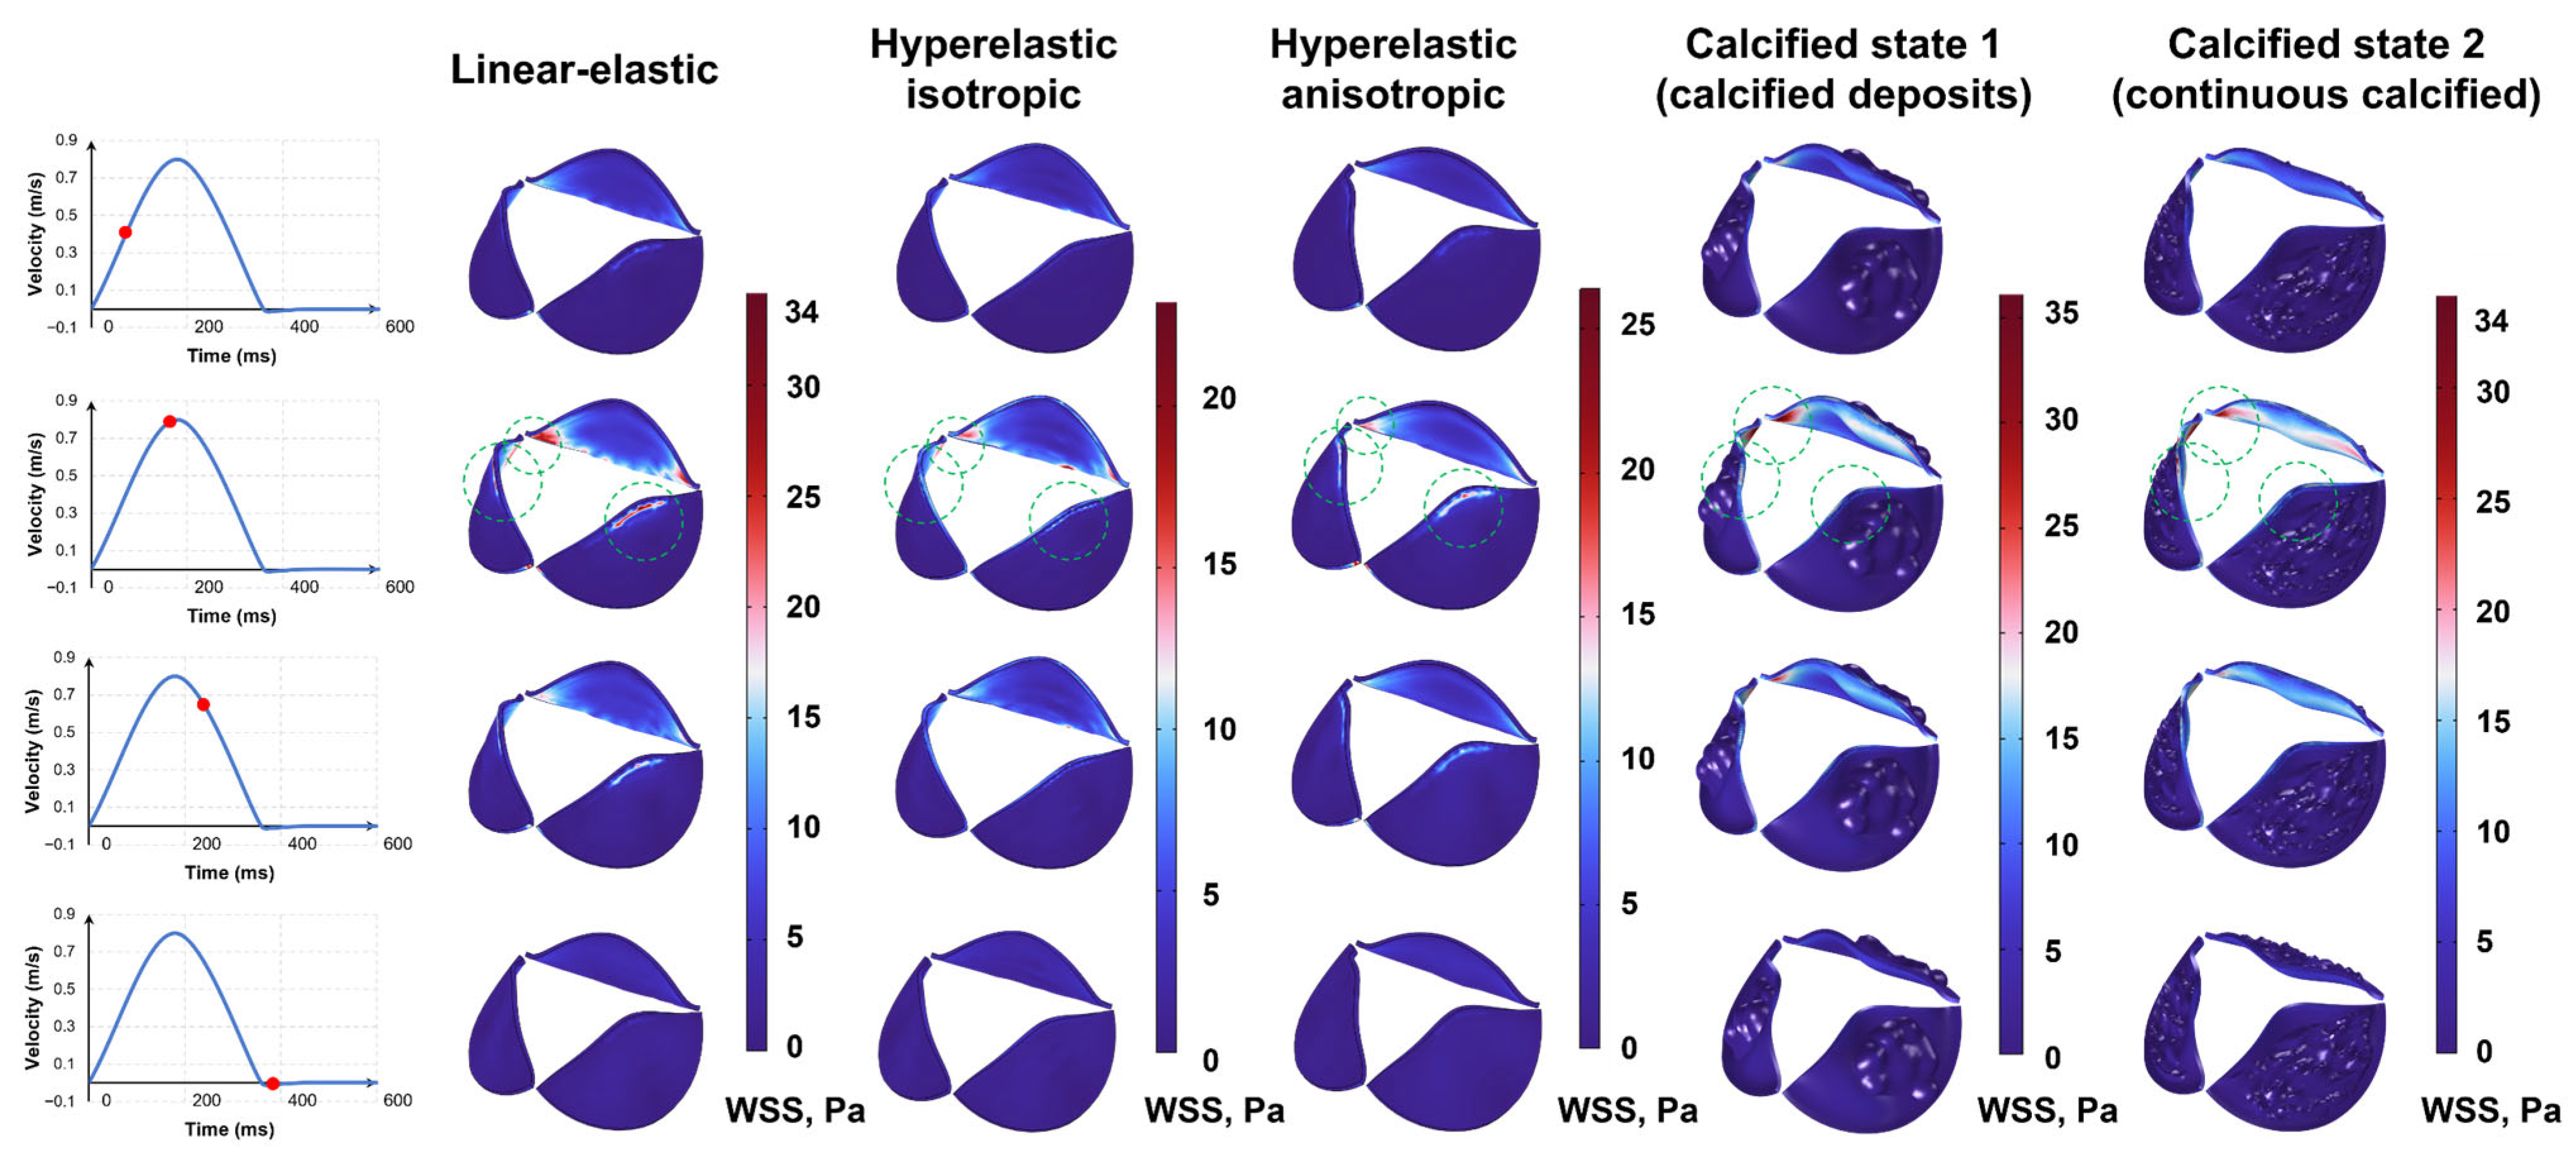
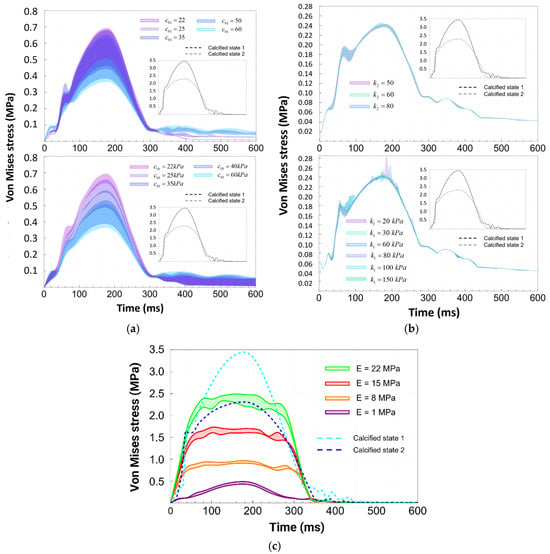
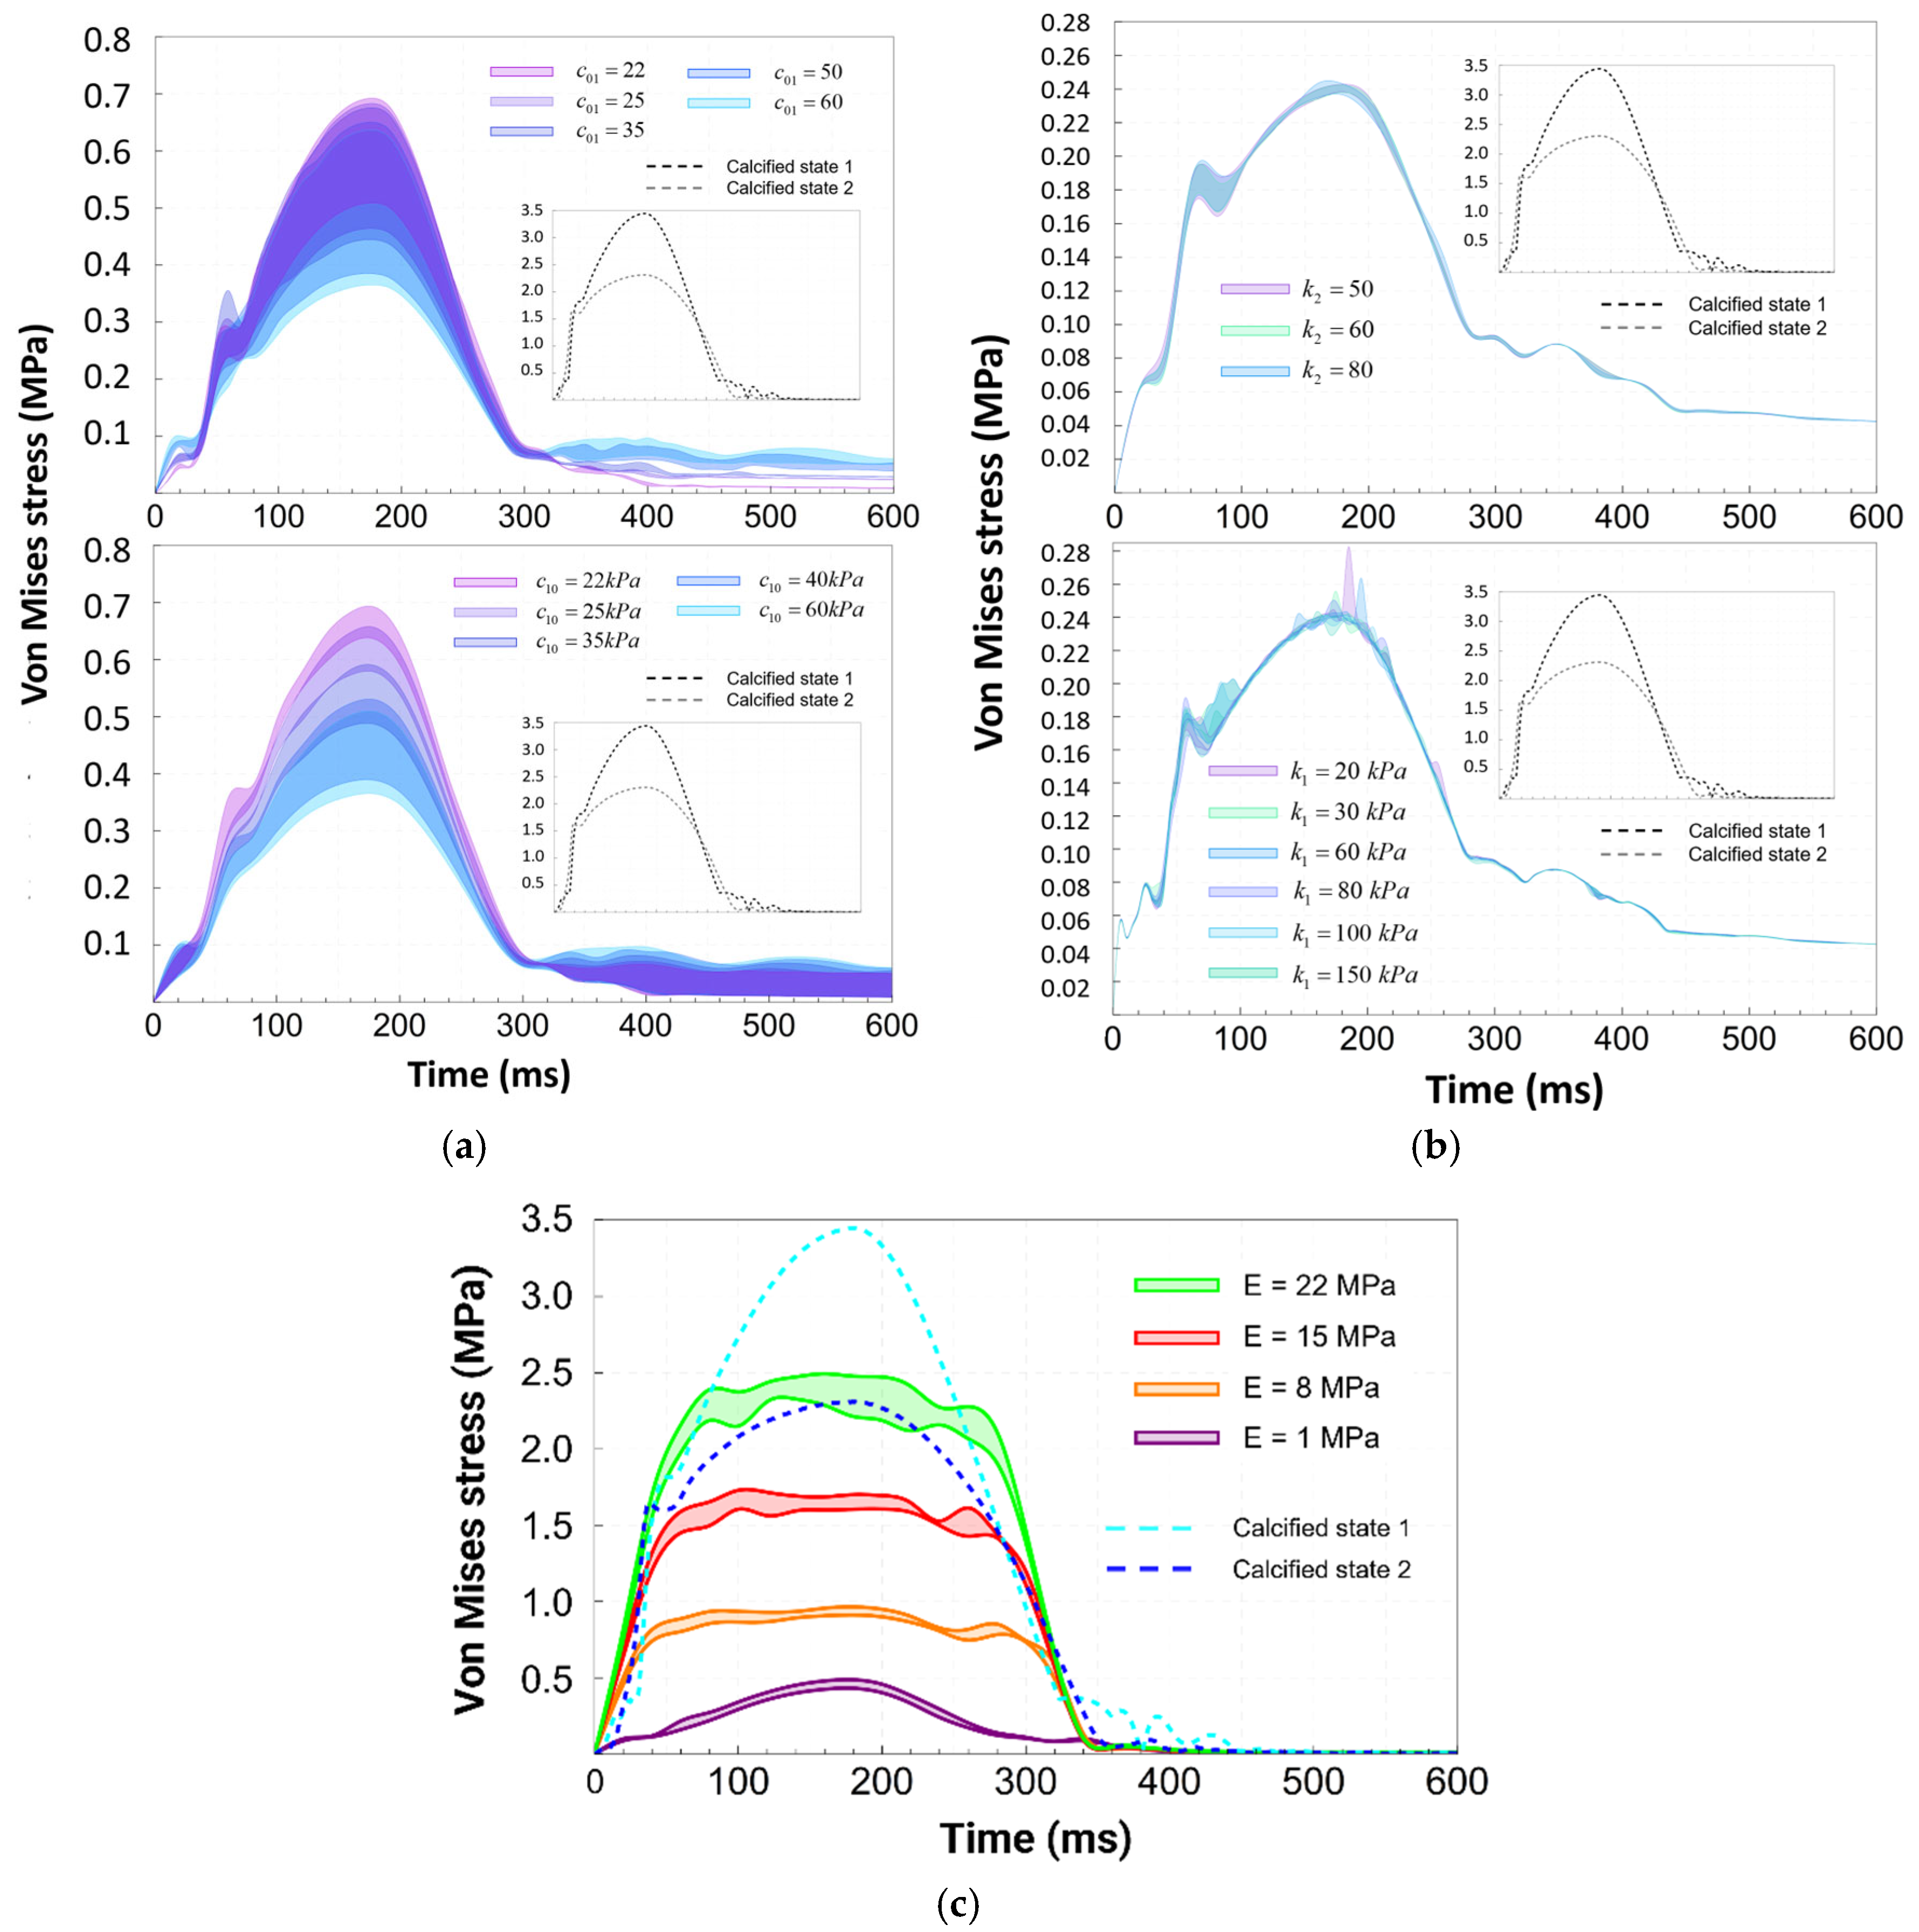
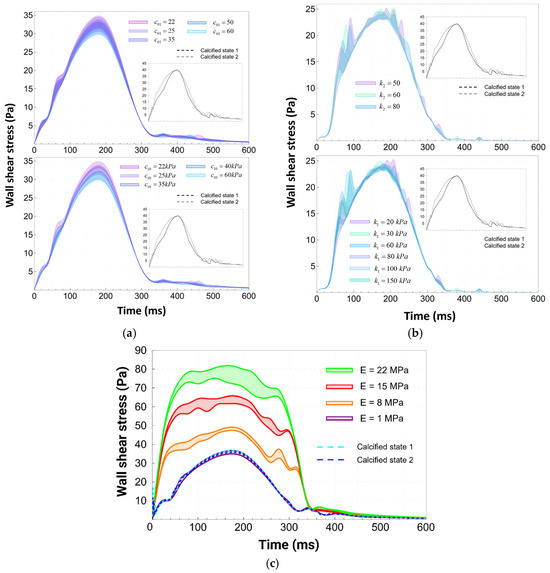
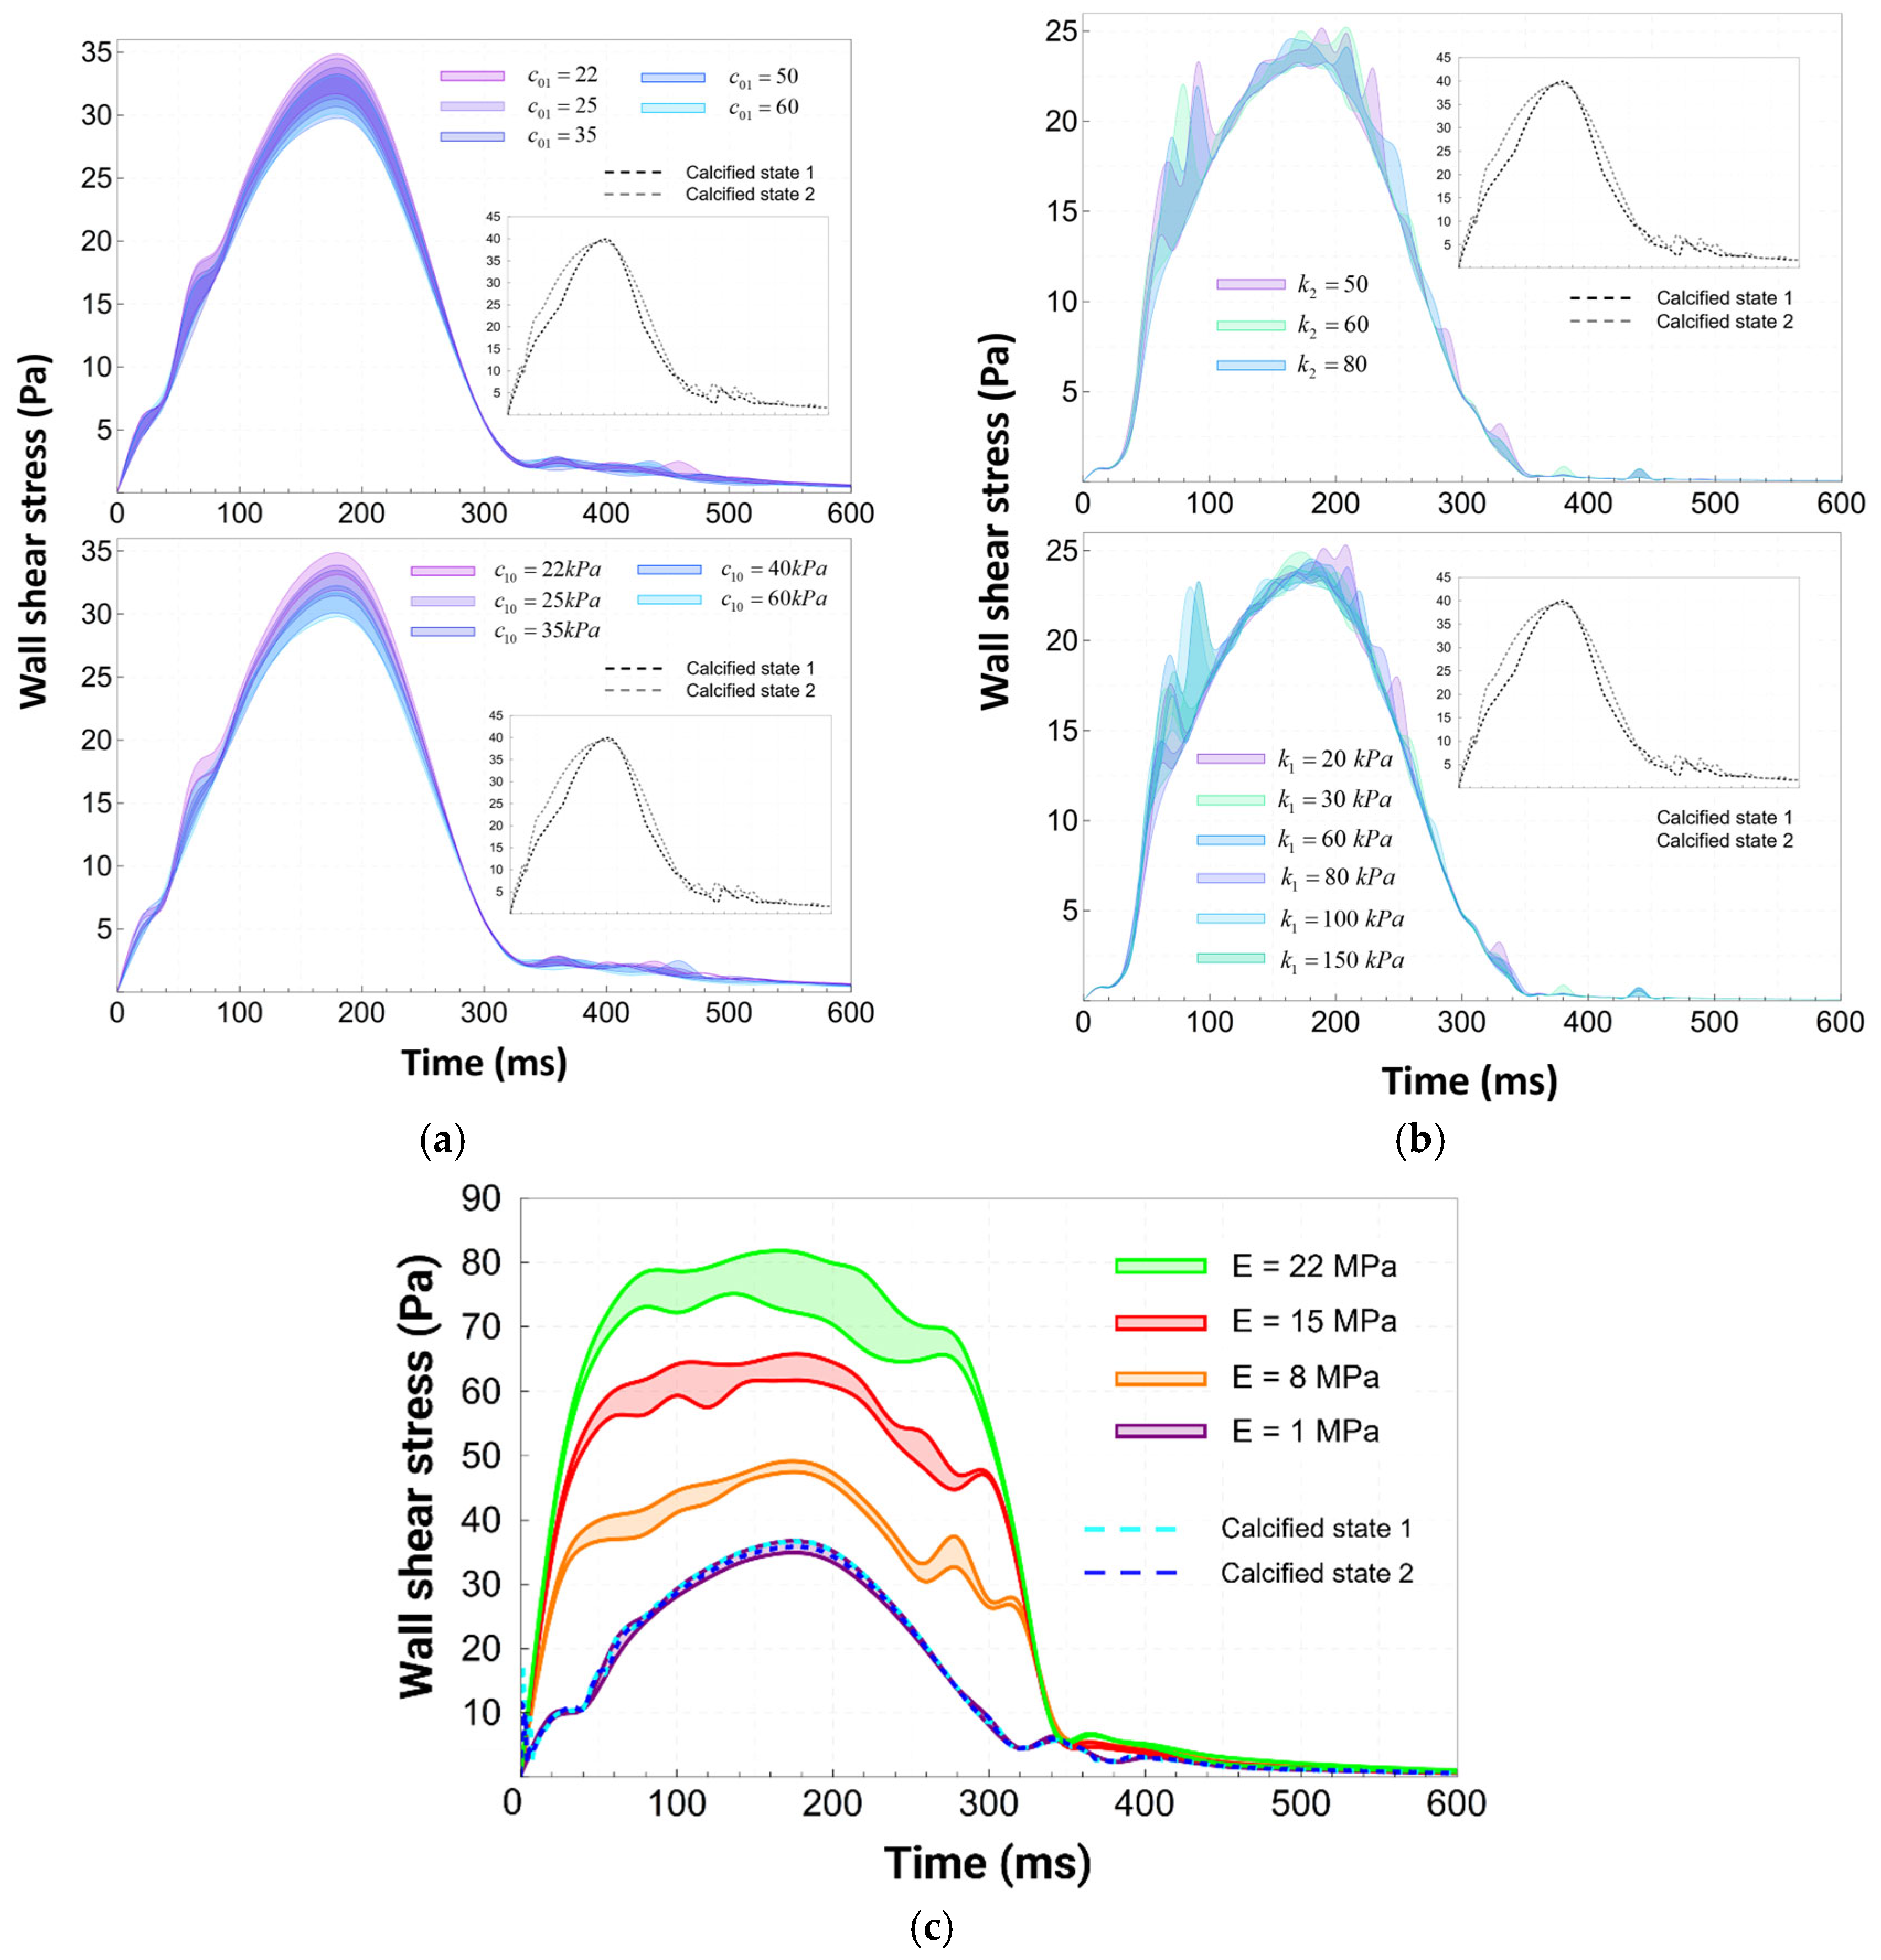
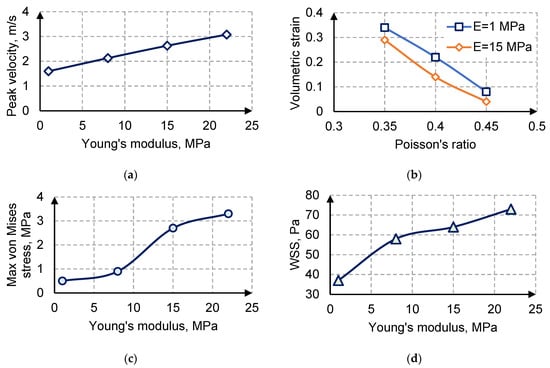
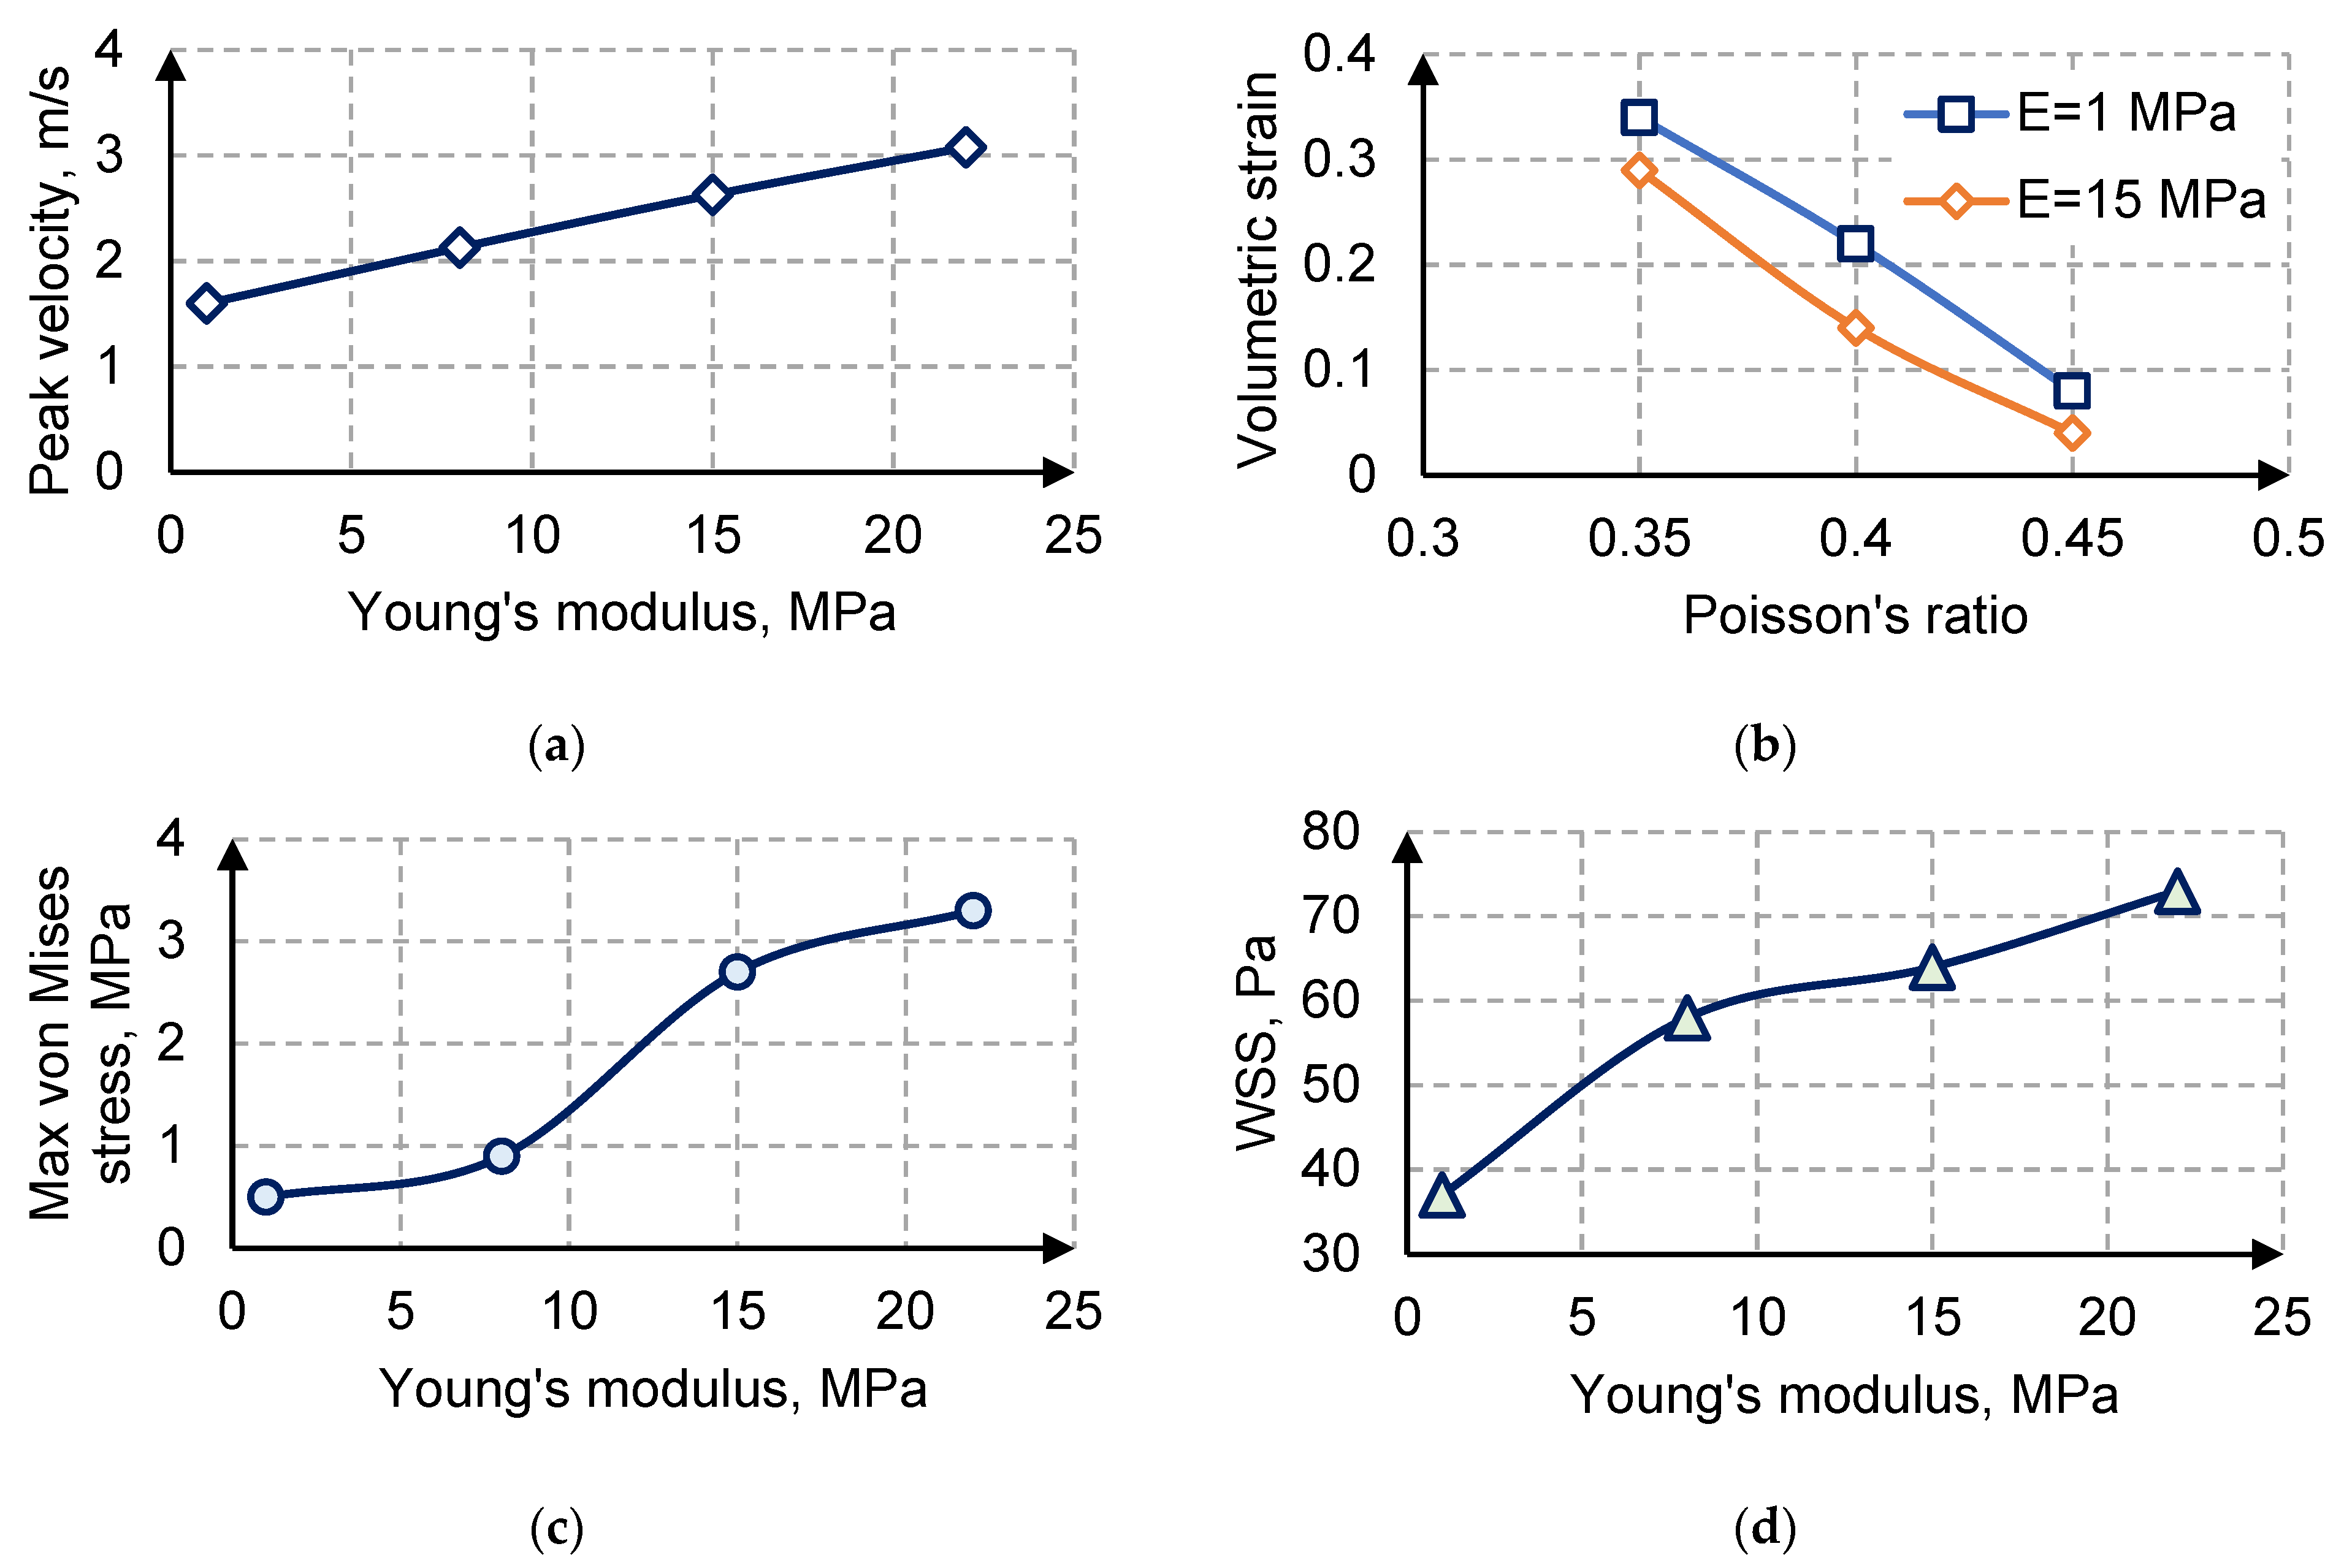

Disclaimer/Publisher’s Note: The statements, opinions and data contained in all publications are solely those of the individual author(s) and contributor(s) and not of MDPI and/or the editor(s). MDPI and/or the editor(s) disclaim responsibility for any injury to people or property resulting from any ideas, methods, instructions or products referred to in the content. |
© 2025 by the authors. Licensee MDPI, Basel, Switzerland. This article is an open access article distributed under the terms and conditions of the Creative Commons Attribution (CC BY) license (https://creativecommons.org/licenses/by/4.0/).