Abstract
To address the optimization challenges arising from the large-scale integration of distributed energy resources into active distribution networks, this paper proposes a multi-objective optimization partitioning method that balances system security/stability with parallel computing efficiency. To address the limitations of existing partitioning approaches, particularly their neglect of parallel computing efficiency and poor adaptability to the radial topology of distribution networks, a three-objective optimization model is constructed. This model incorporates reactive power–voltage control, load balancing, and power balance constraints, while introducing partition scale constraints and connectivity constraints. The NSGA-III algorithm is employed to solve the Pareto front, and an optimal compromise solution is obtained using a fuzzy membership function. A partition adjustment strategy ensures topological connectivity. Validation on 10 kV distribution networks with 47-node, 124-node, and 300-node systems demonstrates that this method achieves reasonable reactive power–voltage partitioning, ensures intra-partition power balance and load balancing, and exhibits significant advantages over traditional methods.
1. Introduction
The intensification of the global energy crisis and environmental pollution has led to heightened focus on developing and utilizing renewable clean energy sources. Currently, renewable sources like wind and solar power are predominantly integrated into distribution networks as distributed energy resources (DERs). While partially dispatchable and providing limited frequency support, these DERs are transforming distribution networks from passive infrastructures into active distribution networks (ADNs) [1]. However, the inherent randomness, intermittency, and volatility of DERs pose significant challenges to ADN optimal operation [2]. First, the partial dispatchability of certain renewable energy units and even some loads extends the traditional reactive power optimization problem to an integrated active–reactive power optimization challenge [3,4]. Second, large-scale DER integration complicates network topology and power flow directions, rendering traditional optimization methods designed for single-feed radial networks inadequate for modern ADNs [5,6].
Furthermore, as the penetration level of distributed generation continues to increase, the number of decision variables in active distribution network optimization grows dramatically, while system operational constraints have become more complex. On the one hand, traditional serial solution algorithms—whether mathematical programming methods or heuristic algorithms—encounter limitations such as memory overflow, slow convergence, and dimensionality issues, rendering them increasingly unsuitable for expanding active distribution networks. On the other hand, with the integration of distributed energy resources and energy storage devices, the physical characteristics of distribution networks have changed from purely passive to active, with significantly enhanced dispatchability. They are gradually showing multi-agent characteristics. Moreover, in the context of an open electricity market, different investment entities pursue different operational goals, and there are even interest competition relationships among them, making the issue of subject information protection increasingly prominent [7]. Currently, centralized optimization scheduling methods are predominantly employed in distribution networks [8]. This approach requires acquiring comprehensive system-wide information to compute optimal scheduling strategies at a central control center. As system scales expand and models grow increasingly complex, centralized methods increasingly fail to meet requirements for both solution accuracy and computational efficiency. Moreover, they cannot adequately safeguard the privacy of diverse stakeholders in deregulated electricity market environments.
To address the aforementioned issues, China currently adopts a hierarchical and partitioned management approach for large-scale power systems [9]. Under the current hierarchical and partitioned management framework of power grids, a reasonable partitioning method is a prerequisite for secure grid operation. Determining how to partition the grid appropriately is a key research topic in hierarchical and zonal management [10]. Currently, there are two main approaches to power grid partitioning: one is based on administrative regions or geographical locations, and the other is the reactive power–voltage control partitioning method.
Partitioning based on administrative regions or geographical locations offers simplicity and practical implementation [11]. Decision-makers typically draw on experience to ensure adequate reactive power sources within each partition, thereby upholding the “localized balancing” principle to a certain extent. However, methods based solely on geographical or administrative boundaries neglect electrical interconnections between network segments. As active distribution networks grow in scale and complexity, relying exclusively on operator experience becomes insufficient for comprehensive analysis of network characteristics and operational conditions. Consequently, the practical applicability of this approach is increasingly limited.
Reactive power–voltage control partitioning represents an effective method for enhancing voltage stability and ensuring secure system operation. Current research in this domain primarily focuses on approaches that utilize electrical distance constructed from voltage/reactive power sensitivity to characterize nodal coupling strength, which then guides the application of appropriate partitioning techniques for network segmentation [12,13,14,15]. These partitioning methodologies can be categorized into three types: (1) Graph-theory-based approaches [16,17,18]: Reference [19] employs electrical distance eigenvalues to determine partition numbers, subsequently applying a Ward distance-based agglomerative hierarchical clustering algorithm to cluster the electrical distance matrix, obtaining optimal reactive power partitioning results. Reference [20] introduces modified electrical distance to identify critical-load nodes using spectral clustering algorithms for distribution network partitioning. Reference [21] proposes an integer programming-based dynamic graph partitioning method for power systems that explicitly incorporates operational constraints into the partitioning algorithm, thereby ensuring partition reliability. (2) Heuristic approaches: Some researchers formulate mathematical models to transform the partitioning problem into an optimization framework, subsequently solved via heuristic algorithms. Reference [22] employs a multi-objective genetic algorithm to solve the optimization model, obtaining partitioning schemes with tightly coupled internal zones and loosely coupled inter-zone connections. Reference [23] simultaneously accounts for intra-zone electrical coupling tightness and reactive power margins to construct an optimized partitioning model, solved using a multi-objective adaptive evolutionary programming algorithm. (3) Community detection methods [24,25,26]: Reference [27] employs electrical coupling strength to automatically identify boundary nodes of virtual microgrids using an improved Newman’s fast partitioning algorithm. This partition distribution networks into multiple virtual microgrids with high internal convergence characteristics, achieving effective network segmentation. Ref. [28] incorporates photovoltaic generation impacts on nodal voltages during partitioning and solves the model based on modularity functions, yielding more rational partitioning schemes for distribution networks with high PV integration.
As discussed above, existing domestic and international research has provided diverse methodologies for grid optimization partitioning, yet these approaches remain limited in scope regarding partitioning criteria. The first method inherently divides distribution networks into sub-regions, neglecting internal nodal electrical interconnections [29]. The second method performs reactive power–voltage control partitioning based on the electrical coupling strength between nodes, adhering to the principle of “strong intra-zone coupling and weak inter-zone coupling” [30,31]. While this methodology prioritizes system voltage stability and operational security during partitioning, it fails to consider the impact of zonal configuration on computational efficiency in dispatch optimization. Notably, research on distribution network partitioning from the perspective of enhancing parallel computation efficiency remains scarce in the current literature.
Parallel computing [32] can significantly improve the computational efficiency of zonal coordination optimization, making it particularly suitable for optimization calculations of modern active distribution networks with larger scales and more complex network structures. Neglecting parallel efficiency during zoning may lead to excessively long waiting times between processes in parallel computation, increasing the complexity of the optimization model and the difficulty of solving it. Rational zoning of the distribution network can reduce the waiting time between different regions during parallel computation of the system and improve the utilization efficiency of computing resources. Therefore, the results of zoning have a significant impact on the optimization efficiency of the distribution network. However, existing research exhibits the following limitations:
- (1)
- While partitioning schemes are important factors affecting parallel efficiency, most current power grid partitioning methods carry out reactive power and voltage optimization partitioning from the perspective of stabilizing the system voltage, largely overlooking the impact of zonal configuration on optimization efficiency. As distribution networks expand in scale and intra-zone optimization becomes more complex, the computational time required for multi-zone coordinated optimization increases significantly. Partitioning methods that neglect parallel optimization efficiency may lead to two critical issues: First, they can cause substantial disparities in computation time across different zones during parallel processing, resulting in prolonged inter-process waiting times and inefficient utilization of computing resources. Second, such methods may lead to uneven distribution of generation and load across zones, potentially slowing down the convergence speed of coordinated optimization. These effects demonstrate the necessity of incorporating parallel optimization efficiency as a key consideration in distribution network partitioning methodologies.
- (2)
- Existing grid partitioning methods are primarily used for large grids with net-like or ring-like structures, while research on distribution grids is relatively rare. Unlike transmission grids, medium- and low-voltage distribution grids mostly adopt radial topologies, which exhibit significant differences in power flow distribution, fault handling, and control strategies. Traditional partitioning methods are based on a net-like assumption and emphasize decoupling between regions, but they do not fully consider characteristics such as one-way power flow in distribution grids, localized electrical connections, and unique connection paths. Directly applying such methods can easily lead to electrical discontinuity in the partition, violate operational constraints, and fail to match the natural boundaries of the feeder, thereby reducing the convergence and computational efficiency of the distributed optimization algorithm. Therefore, there is an urgent need to develop a partitioning method that is adapted to the radial structure of distribution grids to balance the electrical coupling tightness, operational controllability, and computational efficiency within the partition.
Therefore, to address the aforementioned issues, this paper proposes a multi-objective optimal partitioning method tailored for distribution network structural characteristics, which concurrently addressing system security/stability and optimization solution efficiency.
The main contributions of this paper are summarized as follows:
- (1)
- A multi-objective optimization partitioning model is developed, incorporating reactive power–voltage control partitioning, user equilibrium optimization partitioning, and power balance optimization partitioning. Specifically designed for distribution network structures, the model introduces two key constraints: partitioning scale constraints and connectivity constraints. For reactive power–voltage optimization, spatial electrical distances are constructed based on reactive power–voltage sensitivity, with the maximum modularity function Q value from community detection theory as the optimization objective to ensure effective partitioning. For user equilibrium optimization, the objective is to minimize the mean squared deviation of user numbers across all partitions, ensuring balanced user distribution among zones. For power balance optimization, the goal is to minimize the difference between power supply capacity and load demand in each partition, thereby improving the rational allocation of distributed power sources.
- (2)
- The NSGA-III algorithm is employed to solve the optimization partitioning model, yielding a Pareto solution set. An optimal compromise solution is then obtained using fuzzy membership functions. During the solution process, specialized particle encoding schemes, population initialization methods, and variable adjustment approaches are proposed, specifically designed to accommodate the topological characteristics of distribution networks and the features of the partitioning optimization model.
- (3)
- To address the partition connectivity constraints in the optimization model, a partition adjustment method is proposed to appropriately modify the partition schemes obtained from the optimization solution.
- (4)
- The proposed partitioning method was validated using various 10 kV distribution systems with 47-node, 124-node and 300-node test cases, respectively. The results demonstrate the method’s strong practical guidance significance for distribution network partitioning.
The remainder of this paper is organized as follows: Section 2 presents the multi-objective optimization partitioning model for active distribution networks established in this study, first describing the objective functions, followed by the relevant constraints. Section 3 introduces the optimization partitioning methodology for active distribution networks, including the solution approach for the model and constraint handling techniques. Section 4 conducts case studies using multiple 10 kV distribution network systems. Section 5 provides conclusions and outlines directions for future research.
2. Multi-Objective Optimal Partitioning Model for Active Distribution Networks
To simultaneously ensure system operational stability and scheduling optimization efficiency, the proposed partitioning method adheres to three fundamental principles: (1) Following the “tight intra-zone coupling and weak inter-zone coupling” criterion for distribution network division, which maintains sufficient reactive power compensation margin within each zone and ensures voltage stability among nodes inside the operational zones. (2) The “uniform user distribution across all zones” principle guides the network partitioning to ensure balanced load distribution among zones. This approach reduces computational time disparities between zones during optimization and enhances multi-zone parallel optimization efficiency. (3) The distribution network is partitioned following the principle of “minimizing source-load imbalance within all zones during the optimization cycle.” This approach enhances zonal power supply autonomy, reduces inter-zone power exchange during coordinated optimization, and accelerates convergence speed. Based on these three partitioning principles, corresponding objective functions are constructed and integrated with the structural characteristics of the distribution network through constraint formulation, thereby transforming the network partitioning problem into a multi-objective mathematical optimization problem. Using the “on/off” states of each branch as decision variables, a heuristic approach is employed to obtain the Pareto front of the multi-objective optimization. An optimal compromise solution is then selected to ultimately derive a partitioning scheme that satisfies all three principles.
Unlike conventional power system partitioning approaches that primarily focus on reactive power–voltage control, this active distribution network partitioning method simultaneously addresses two critical aspects: enhancing computational efficiency in multi-zone coordinated optimization and improving system operational stability. By comprehensively considering the structural characteristics of distribution networks, the proposed method provides a more rational optimization-based partitioning solution for hierarchical zone coordination in active distribution systems.
2.1. Objective Functions
2.1.1. Reactive Power–Voltage Control
The fundamental principle of reactive power–voltage control partitioning is to achieve “strong intra-zone coupling and weak inter-zone coupling”—meaning nodes within the same partition exhibit high electrical coupling strength, while nodes from different partitions maintain low coupling degrees. In this reactive power–voltage control partitioning framework, we introduce sensitivity-based electrical distance to quantify nodal coupling strength, followed by application of the Fast-Newman algorithm from complex network theory to evaluate partitioning effectiveness.
- (1)
- Voltage Sensitivity
Voltage sensitivity refers to the degree of influence that voltage variations at reactive power control nodes exert on controlled nodes in a power grid. This metric is commonly used to quantify the coupling strength between nodes, with its mathematical expression given as follows [33]:
where denotes the voltage deviation at node j, represents the voltage deviation at node i, indicates the reactive power injection variation at node j, and stands for the electrical sensitivity of reactive power source node j to controlled node i.
The PQ decomposition method is a simplified approach for power flow calculation in electrical grids. In this method, voltage phase angles are corrected using active power mismatches, while voltage magnitudes are solved through reactive power deviations. This yields the relationship between nodal voltage magnitudes and injected reactive power as follows [34]:
where represents the nodal reactive power mismatch vector, denotes the vector of nodal voltage magnitude deviations, and corresponds to the simplified coefficient matrix in the PQ decomposition method, whose elements are the imaginary parts of the corresponding elements in the admittance matrix. The control capability of reactive power source node j over all nodes (except the slack bus) is given by:
where is the inverse matrix of the coefficient matrix , and b is a one-dimensional vector whose j-th element equals 1 while all other elements are 0, i.e., . As evident from Equations (2) and (3), the value of electrical sensitivity is independent of the system power flow state, being determined solely by the network’s topological structure and parameters.
- (2)
- Electrical Distance
Based on the obtained voltage sensitivity matrix , each node is mapped to reactive power source nodes, respectively, to construct an electrical distance matrix:
where n denotes the number of reactive power source nodes, and m represents the number of nodes excluding the slack bus; represents the electrical distance between controlled node i and reactive power source node j, and the calculation method for is shown in Equation (5); the calculation method for the electrical distance between any two nodes i and j is shown in Equation (6).
- (3)
- Community Structure Theory
In community detection theory, nodes within each community exhibit dense interconnections while connections between different communities remain relatively sparse. To quantitatively assess the quality of network partitioning, Newman et al. introduced the modularity index Q and extended its application to weighted networks. The modularity for weighted networks is specifically defined as (7).
In Equation (7), denotes the weight of the edge connecting nodes i and j; represents the sum of weights of all edges attached to node i; and signifies the total weight of all edges in the network. If nodes i and j are assigned to the same partition, then ; otherwise, . Assuming that the values of each node remain unchanged to form a random network, represents the expected value of the weight of the edge connecting nodes i and j. If the sum of the weights of the edges within a community is not greater than the expected value under random connections, then , with an upper limit of 1. The closer Q is to the upper limit, the more pronounced the community structure. Generally, when Q is around 0.3 or greater, it indicates a favorable partitioning scheme.
In reactive power–voltage control partitioning of distribution networks, the electrical distance characterizing the coupling strength between two nodes is assigned as the edge weight connecting them, i.e., . This enables the calculation of the modularity function Q for evaluating partitioning schemes. Since higher Q values indicate better reactive power–voltage control partitioning performance, the objective function of the reactive power and voltage control partitioning is formulated as:
2.1.2. User Equilibrium Optimization
During partitioned parallel optimization, improving the computational load balancing between zones can significantly reduce waiting times among computing clusters during the calculation process. This enhancement boosts both the operational efficiency of parallel computations and the utilization rate of computing clusters, thereby fully leveraging the advantages of parallel processing. In zonal optimization calculations, the user-layer optimization constitutes a significant computational load. Therefore, improving the balance of user distribution across partitions serves as a critical metric for distribution network optimization partitioning. This paper adopts the minimization of mean squared deviation (MSD) of user counts across all partitions as the objective function for user equilibrium optimization, expressed in Equation (9):
where represents the total number of partitions in the current scheme, denotes the user count in the M-th partition, and indicates the average user number per partition under the current partitioning configuration. The equation holds, while corresponds to the total user count across the entire system.
2.1.3. Power Balance Optimization
Active distribution networks typically incorporate distributed generation units of certain capacities that can supply power to local partition loads. However, during zonal coordinated optimization, individual sub-zones may not always achieve self-sufficient power balance through autonomous regulation alone, potentially resulting in either power deficits or surpluses. Consequently, inter-zonal power transfer becomes necessary for further regulation. However, inter-zonal power transfer introduces two critical challenges: on the one hand, it inherently causes power transmission losses; on the other hand, the distribution network needs to continuously iterate the transmission power values between regions to meet the boundary constraints between different regions during operation to ensure the stable operation of the system. This increases the computational burden and affects the efficiency of coordinated optimization and scheduling. Therefore, minimizing intra-zone generation-load imbalance during partitioning helps reduce inter-zonal power transfers, which in turn decreases system power losses and improves computational efficiency in coordinated optimization.
The imbalance of power here refers to the instantaneous mismatch between zonal load demand and power supply at a given moment. The power supply comprises adjustable sources (e.g., diesel-integrated generators—DIG) and non-adjustable sources (e.g., wind turbines and PV systems), making the total power supply a controllable variable within certain operational limits. The load demand consists of flexible and inflexible components. The flexible portion can be adjusted through demand response mechanisms, including load reduction, increase, or temporal shifting. Consequently, the total load demand at any given moment becomes an adjustable quantity within operational limits. To more accurately describe the imbalance between the available power supply and load demand at a specific moment during the actual optimization process, and to reduce the calculation error of the imbalance caused by changes in flexible loads during optimal scheduling, when calculating the load value at a certain moment, the load during each peak period of users is reduced by 50%, and the reduced electricity is evenly distributed across each valley period, while the load during normal periods remains unchanged. The instantaneous imbalance is then defined as the absolute difference between this adjusted load value and the maximum available power supply.
where represents the upper limit of power output at time t, is the adjusted load value at time t, and denotes the source-load imbalance at time t. The objective function is set as the total value of the maximum imbalance across all times in each microgrid:
where T represents the total number of optimization time periods, and nm denotes the number of partitions.
The multi-objective optimization partitioning model constructed in this paper aims to ensure system safety and stability and improve parallel computing efficiency. First, voltage stability is the core of the partitioning scheme to ensure the safe operation of the system. It maximizes the electrical distance between different zones (objective function (8)) to ensure that the partitioning follows the principle of “strong coupling within zones and weak coupling between zones,” forming a highly coordinated voltage–reactive power control area, which lays the foundation for system safety and stability. Second, user balance and power balance are key to improving the efficiency of parallel computing: objective function (9) balances the number of nodes in each partition to avoid the bottleneck effect caused by uneven load in parallel computing; objective functions (10) and (11) jointly promote the balance between power generation and power consumption within each partition, reducing coordination pressure and significantly accelerating the convergence of distributed algorithms. These three objectives are closely coordinated. An ideal partitioning scheme must seek the optimal compromise between the three while satisfying electrical connectivity and operational constraints, ultimately achieving global optimization of safety and computational efficiency.
2.2. Constraints
2.2.1. Regional Node Connectivity Constraints
Unlike the meshed structure typical of transmission systems in power grids, contemporary distribution networks predominantly exhibit radial topologies. Therefore, in partitioning, attention should be paid to ensuring the connectivity of nodes within each region, i.e., there must be at least one path between any two nodes in a sub-region. The connection relationship between nodes in a sub-region is represented by an adjacency matrix:
where , , Ns denotes the total number of partitions and represents the node count within the k-th subzone. The zonal connectivity constraint can be expressed as:
where is the calculation function for the degree of nodes in the region.
2.2.2. Partition Scale Constraints
When the number of partitions is excessive, it tends to increase boundary constraints and inter-regional communication costs, leading to more iterations, greater difficulty in convergence, and reduced computational efficiency. To prevent the issues of an excessive number of optimized partitions and excessively small individual partition sizes, a minimum partition size constraint is set, which requires that the number of nodes in each partition must exceed a specified value:
where represents the minimum number of nodes in a partition. The value of needs to be determined based on actual conditions and expert knowledge.
3. Optimal Partitioning Method for Active Distribution Networks
3.1. Model Solution Methodology
In this section, the improved NSGA-III algorithm introduced in [35,36] is adopted to solve the multi-objective optimal partitioning model of active distribution networks. The decision variables here are the “on-off” states of each branch in the distribution network, which are represented by 0–1 variables.
where Nl denotes the number of branches in the distribution network; represents the l-th branch, and corresponds to a specific partitioning scheme. = 0 indicates that the current line is “disconnected”, meaning the starting node and ending node of the line are not in the same partition; = 1 indicates that the current line is “connected”, meaning the starting node and ending node of the line are in the same partition.
Assuming that the decision variable takes a value of , the partitioning result is shown in Figure 1. The distribution network is “disconnected” at the 6th branch, dividing the system into two partitions.
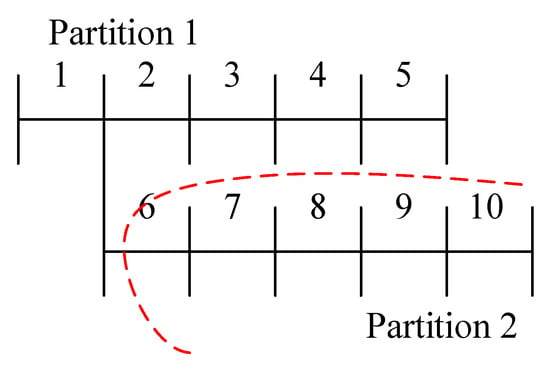
Figure 1.
Partitioning result for a 10-branch distribution network.
3.2. Constraint Handling Approaches
3.2.1. Processing Methods for Partition Scale Constraints
From the constraint on partition size in Equation (14), the constraint on the number of system partitions can be derived as:
where is the total number of nodes in the system; is the number of partitions, and its value is 1 more than the number of “disconnected” branches in the system partitioning scheme. Therefore, the proportion range of the probability of “disconnections” in the total number of branches in the system in the partitioning scheme can be expressed as Equation (17), that is, the probability of “0” elements in the decision variable as a proportion of ’s dimension is bounded by:
In the above equation, represents the number of branches in a disconnected state in the partitioning scheme. Given that the total number of branches in a distribution network is significantly larger than 1 and is comparable in magnitude to the total number of nodes, the above expression can be simplified as follows:
Therefore, when an optimized partitioning scheme satisfies Constraint (18), it can be considered compliant with the partition size constraint (14). To ensure the decision variables meet all constraints, the following population initialization method and variable adjustment strategy are proposed:
- (1)
- Population Initialization Method
First, all decision variables are initialized to 1. Then, according to a certain probability Ptr (where ), 1 is set to 0: when the generated random number is less than Ptr, 1 is changed to 0; otherwise, it remains 1. This method can basically ensure the rationality of the partition size of the initial population.
- (2)
- Variable Adjustment Method
To ensure that the partitioning scheme satisfies the minimum size constraint, the boundary nodes at the ends of partitions that do not meet the constraint are moved backward, i.e., the positions of the disconnected branches are shifted backward. The specific adjustment method for the decision variable is as follows (as shown in Figure 2):
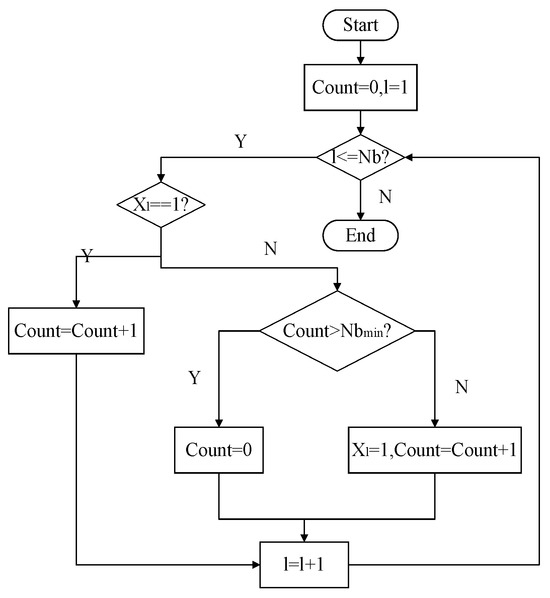
Figure 2.
Processing methods for partition scale constraints.
Step 1: Set count = 0, l = 1;
Step 2: Judge the value of . If = 1, set count = count + 1; otherwise, go to Step 3;
Step 3: If count > Nbmin, set count = 0 and go to Step 5; otherwise, go to Step 4;
Step 4: Set , count = count + 1;
Step 5: Set l = l + 1. If l > Nb, the adjustment ends; otherwise, return to Step 2.
3.2.2. Adjustment Method for Partition Connectivity Constraints
Due to the radial structure of distribution networks, the initial partitioning scheme may result in isolated sub-networks. For example, if the optimized partitioning result is (as shown in Figure 3), the end node of Branch 5 becomes disconnected from other nodes in Partition 2, requiring adjustment.
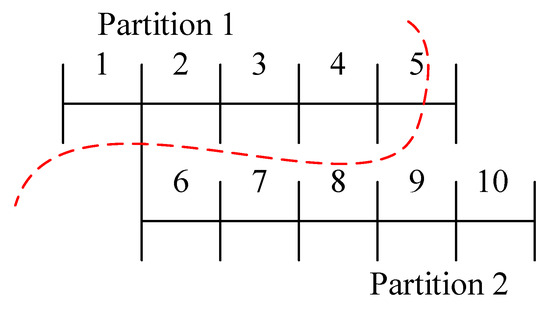
Figure 3.
Other partitioning results for a 10-branch distribution network.
To minimize the impact of post-adjustment on the original partitioning results while ensuring the quality of system-optimized partitioning and subnetwork connectivity, the connectivity adjustment should follow two principles: First, avoid altering the number of users in each partition as well as the assigned partitions of distributed generators and reactive power compensation devices whenever possible. Second, adopt the proximity principle and minimize the number of branches to be moved. The specific method is as follows:
Step 1: Move the disconnection position forward sequentially along the branch numbers until the partition satisfies the connectivity constraint, denoted as Scheme 1. During the movement, count the number of nodes passed through (Mb_f), the number of load nodes (Mld_f), the number of users (Mu_f), the number of DIG (Md_f), and the number of reactive power compensation devices (Ms_f).
Step 2: Move the disconnection position backward sequentially along the branch numbers until the partition satisfies the connectivity constraint, denoted as Scheme 2. During the movement, count the number of nodes passed through (Mb_b), the number of load nodes (Mld_b), the number of users (Mu_b), the number of DIG (Md_f), and the number of reactive power compensation devices (Ms_f).
Step 3: If Mu_f < Mu_b, Scheme 1 is adopted; if Mu_f > Mu_b, Scheme 2 is adopted; otherwise, proceed to Step 4.
Step 4: If Ms_f < Ms_b, Scheme 1 is adopted; if Ms_f > Ms_b, Scheme 2 is adopted; otherwise, proceed to Step 5.
Step 5: If Md_f < Md_b, Scheme 1 is adopted; if Md_f > Md_b, Scheme 2 is adopted; otherwise, proceed to Step 6.
Step 6: If Mld_f < Mld_b, Scheme 1 is adopted; if Mld_f > Mld_b, Scheme 2 is adopted; otherwise, proceed to Step 7.
Step 7: If Mb_f < Mb_b, Scheme 1 is adopted; otherwise, Scheme 2 is adopted.
4. Case Study
The data used for regional division in this study were obtained from an actual 10 kV distribution network system in Panzhihua City, Sichuan Province, China. The three test systems (47, 124, and 300 nodes) were all obtained from the actual network structure of the region. The node connection relationships (topology structure), line impedance parameters (R, X), and reference voltage level (10 kV) of the system were all obtained from the database of the actual distribution network. The main hyperparameters of the proposed method are as follows: The reference point generation parameter for the NSGA-III algorithm is set to 20, the number of iterations is set to 20, the crossover probability and mutation probability are set to 0.9 and 0.1, respectively, the distribution indices for simulated binary crossover and polynomial mutation are both set to 20, and the minimum node count in the partition size constraint is set to 5, 10, and 25.
4.1. 47-Node Distribution Network Optimization Partitioning
A 10 kV 47-node distribution network employed in [37,38] is taken as a case study to test the effectiveness of the optimized partitioning method. The 47-node distribution network has a total of 46 branches, so the dimension of decision variables for this optimized partitioning problem is 46. The minimum number of nodes in each partition is set as Nbmin = 5. The Pareto frontier of the objective function is shown in Figure 4.
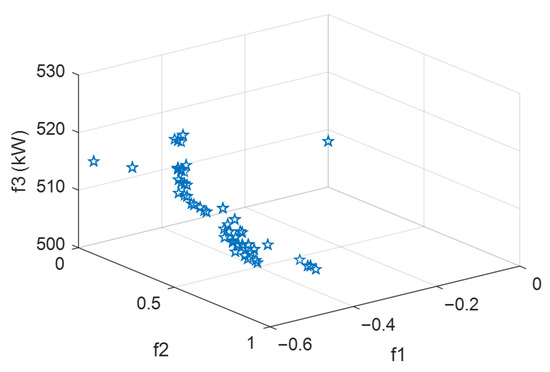
Figure 4.
Pareto frontier for the objective function of optimized partitioning of the 47-node distribution network.
When selecting the optimal compromise solution, the weights of the three objective functions are set as . The objective function values of the optimal compromise solution are f1 = −0.56, f2 = 0, f3 = 516.67. The disconnected branches are numbered 20 and 30, meaning that in the decision variables, all variables equal 1 except for the 29th and 30th variables which are 0. The partitioning results are shown in Figure 5.
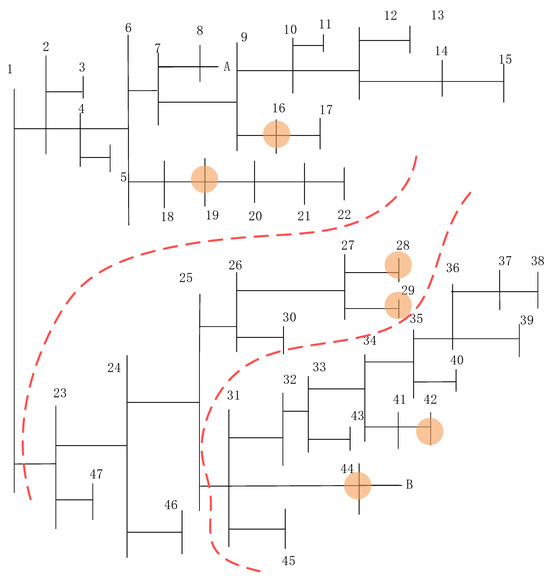
Figure 5.
Optimized partitioning result for the 47-node distribution network.
The objective function values indicate a modularity function Q of 0.56, demonstrating effective reactive power–voltage control partitioning. A zero mean-squared error in zonal user distribution confirms perfectly balanced load allocation. The optimized 24 h total power imbalance equals 516.67 kW. The objective function values demonstrate a modularity index (Q) of 0.56, indicating high-quality reactive power–voltage control partitioning; the mean square deviation of the number of users in each partition is 0, suggesting an even distribution of users; and the total 24 h power imbalance after optimization is 516.67 kW. The partitioning results show that the 47-node distribution network is divided into three zones. Representing branches by their start-end node numbering, the disconnected branches are Branch 1–23 and Branch 25–31, with each zone containing exactly 2 users. The allocation of reactive power compensation devices and adjustable distributed generation units across different partitions is shown in Table 1, with each partition containing a certain capacity of both reactive power compensation devices and adjustable distributed generation units.

Table 1.
Distribution of power in the 47-node distribution network.
4.2. 124-Node Distribution Network Optimization Partitioning
A 10 kV 124-node distribution network is used as a case study to validate the effectiveness of the optimized partitioning method. To compare partitioning performance under varying scale constraints, three distinct constraint schemes are implemented: Scheme 1 sets the minimum node count Nbmin at 5, Scheme 2 at 10, and Scheme 3 at 25. The corresponding Pareto frontiers for each scheme are presented in Figure 6, Figure 7 and Figure 8, respectively.
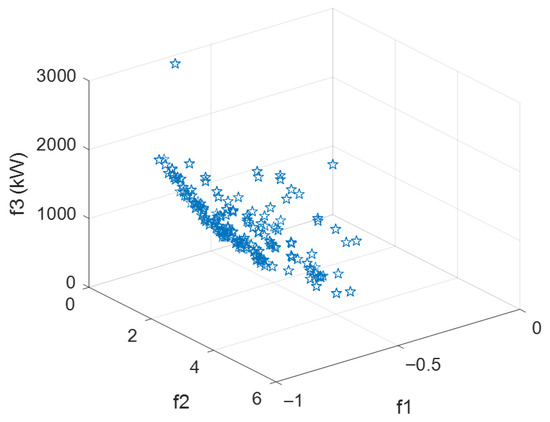
Figure 6.
Pareto frontier of scheme 1.
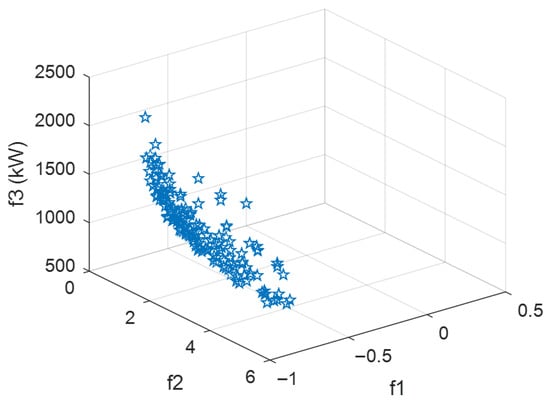
Figure 7.
Pareto frontier of scheme 2.
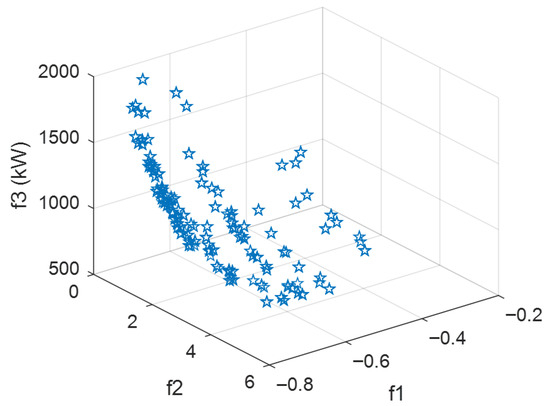
Figure 8.
Pareto frontier of scheme 3.
The partitioning results under the three schemes are presented in Table 2, where , , and denote the weighting factors assigned to the three objective functions when selecting the optimal compromise solution.

Table 2.
Optimized partitioning results.
Comparative analysis of optimized partitioning results under different weight combinations demonstrates that varying the weighting factors for reactive power–voltage control partitioning, user-equilibrium optimization, and power-balance optimization leads to significant differences in both the resulting partition configurations and objective function values. This confirms that the selection of objective function weights substantially influences the partitioning outcomes, necessitating careful weight assignment based on specific operational requirements and system characteristics.
To further illustrate the sensitivity of weight selection, we carry out an in-depth analysis based on the data in Table 2. Taking Scheme 1 as an example: when the weight combination is (0.1, 0.1, 0.8), i.e., placing high emphasis on power balance, the objective function f3 (power balance) achieves its optimal value of 570. However, this negatively impacts the number of partitions (only 2 partitions) and user balance (f2 = 1.41). In contrast, when weights are adjusted to (0.1, 0.8, 0.1)—i.e., prioritizing user number balance, f2 drops to 0 (optimal), but the number of partitions increases to 6, and f3 is worsened to 1346. More extremely, when the weights are (0.8, 0.1, 0.1), f1 (reactive voltage control) improves to −0.75, but f2 rises to 1282, indicating significant competition between different objectives. These results quantitatively demonstrate that variations in weights, such as decreasing from 0.8 to 0.1, cause significant fluctuations in partition counts and performance metrics, validating the high sensitivity of weight parameters.
A comparison of optimization results for the three schemes under identical weighting coefficients reveals that different partition scale constraints yield significantly different partitioning outcomes. The larger the scale of a single partition is set, the smaller the total number of partitions will be. Taking the optimization results of the three schemes when , , as an example, the final partitioning schemes are analyzed as follows.
- (1)
- Analysis of partitioning results—Scheme 1
The optimization analysis indicates that disconnecting Branch 75 isolates Nodes 76, 77, and 68 from their partition. By relocating the disconnection to Branch 79, Nodes 76–78 are reassigned to the preceding partition, maintaining zonal connectivity with minimal impact on the original partitioning performance. Similarly, disconnecting Branch 102 isolates Nodes 103 to 108 from other nodes in their partition. Therefore, the disconnected branch is shifted forward, changing from Branch 102 to Branch 101. This adjustment ensures that Nodes 103 to 108 remain connected to other nodes in their partition while minimizing changes to the original partitioning result. The final partitioning result is shown in Figure 9.
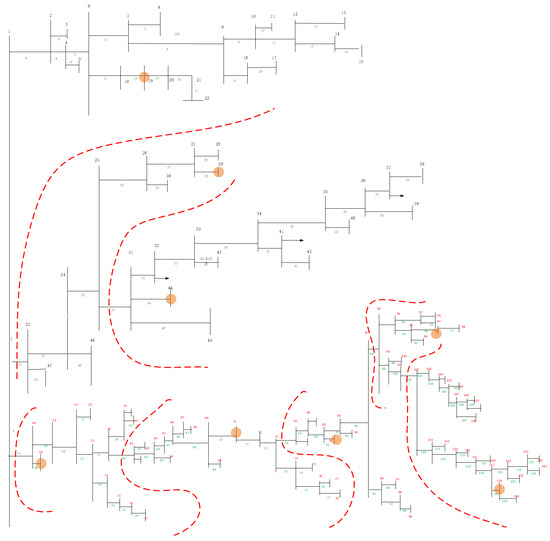
Figure 9.
Optimized Partitioning Results for Scheme 1.
The distribution of users, DIG, and SVC in each partition is shown in Table 3.

Table 3.
Optimized Results (Scheme 1).
- (2)
- Analysis of partitioning results—Scheme 2
Analysis of the optimization results shows that disconnecting Branch 86 causes Nodes 87–89 to be disconnected from their partition. Therefore, the disconnection point is adjusted to the nearby Branch 84 to ensure the connectivity of this partition. Similarly, disconnecting Branch 102 results in Nodes 103–108 being disconnected from their partition, so the disconnection is adjusted to the nearby Branch 101 to maintain the partition’s connectivity. After these adjustments, the numbers of the disconnected branches are: 31, 47, 72, 84, and 101. The final partitioning scheme is shown in Figure 10.
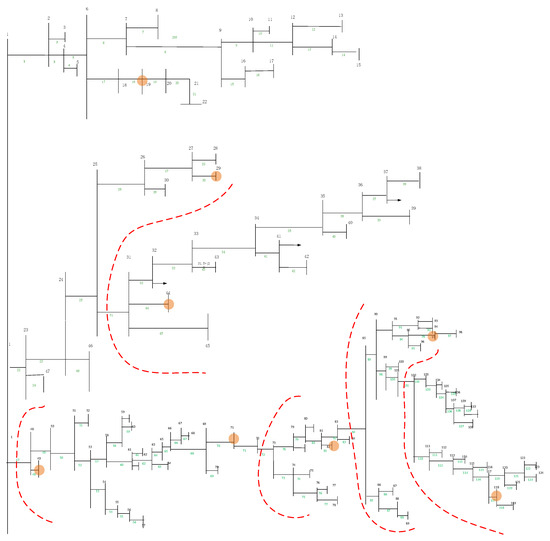
Figure 10.
Optimized partitioning results for Scheme 2.
The distribution of users, DIG, and SVC in each partition is shown in Table 4.

Table 4.
Optimized partitioning results (Scheme 2).
- (3)
- Analysis of partitioning results—Scheme 3
Analysis of the optimization results shows that disconnecting Branch 75 causes Nodes 76, 77, and 78 to be disconnected from their partition. Therefore, the disconnection point is adjusted to the nearby Branch 78, and Nodes 76, 77, and 78 are reallocated to the previous partition to ensure the partition’s connectivity. After the adjustment, the numbers of the disconnected branches are: 47 and 78. The final partitioning scheme is shown in Figure 11.
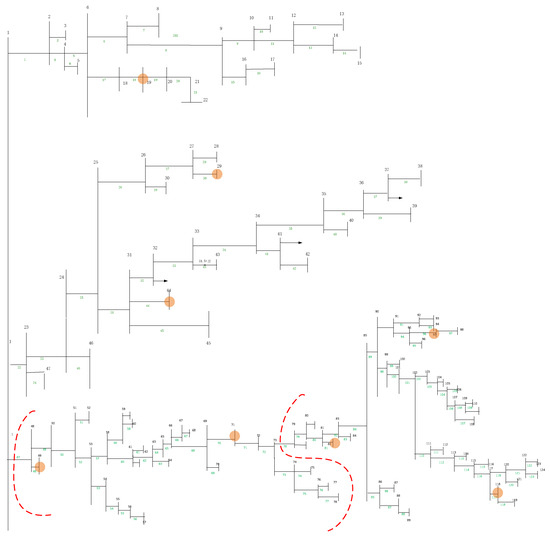
Figure 11.
Optimized partitioning results for Scheme 3.
The distribution of users, DIG, and SVC in each partition is shown in Table 5.

Table 5.
Optimized partitioning results (Scheme 3).
4.3. 300-Node Distribution Network Optimization Partitioning
To further investigate the application of the multi-objective optimization partitioning method in larger-scale systems, the 124-node practical distribution network was expanded to a 300-node system by replicating selected branches and connecting them to designated nodes. With the minimum node count constraint set at Nbmin = 5, the 300-node system was partitioned. The resulting Pareto frontier of the multi-objective optimization is presented in Figure 12.
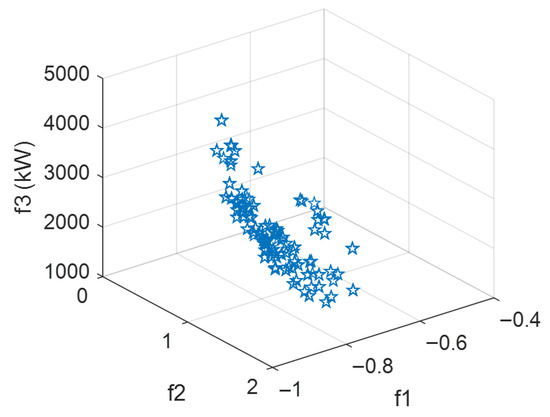
Figure 12.
Pareto frontier for the objective function of optimized partitioning of the 300-node distribution network.
The weights of the three objective functions are set as respectively. In the final partitioning scheme, the numbers of the disconnected branches are: 20, 46, 72, 89, 124, 151, 191, 224, and 273. The objective function values are f1 = −0.7329, f2 = 0, f3 = 2557 kW. The distribution of power sources and users across partitions is detailed in Table 6.

Table 6.
Distribution of power and users in the 300-node distribution network.
4.4. Comparison with Traditional Partitioning Methods
Traditional power grid partitioning primarily refers to reactive power–voltage control partitioning, which follows the principle of “tight coupling within partitions and weak coupling between partitions” based on the electrical coupling degree between nodes, conducting single-objective optimization partitioning. To compare the multi-objective optimization partitioning method proposed in this chapter with traditional reactive power–voltage control partitioning, a single-objective optimization partitioning method using modularity as the evaluation metric [39] was applied to both the 124-node and 300-node distribution networks for reactive power–voltage control partitioning.
The conventional partitioning method divides the 124-node distribution network into six sub-regions, with the corresponding distribution of power sources and users presented in Table 7.

Table 7.
Partitioning results of traditional methods for 124-node distribution system.
The results of the 6-partitioning for the 124-node system obtained from reactive power and voltage control partitioning are compared with those of the 6-partitioning for the 124-node system in Scheme 2 of Section 4.2, as shown in Table 8.

Table 8.
Comparison of partitioning results for the 124-node distribution network.
By comparing the values of f1, it can be seen that the modularity functions obtained by both partitioning methods are greater than 0.3, indicating that both methods can achieve favorable reactive power and voltage partitioning results. However, the reactive power partitioning effect of the traditional partitioning method is better; by comparing the values of f2, it can be seen that the distribution of users in the multi-objective optimized partitioning is significantly more uniform; by comparing the values of f3, it is evident that the distribution of sources and loads within the partitions of the multi-objective optimized partitioning is more balanced.
This traditional partitioning method divides the 300-node distribution network into 9 sub-regions, with the numbers of the disconnected branches being: 20, 72, 89, 124, 151, 203, 255, and 273. The distribution of power sources and users within these sub-regions is shown in Table 9.

Table 9.
Partitioning results of traditional methods for 300-node distribution system.
The partitioning results of the 300-node system obtained from reactive power and voltage control partitioning are compared with the 300-node multi-objective optimization partitioning results in Section 4.3, as shown in Table 10.

Table 10.
Comparison of partitioning results for the 300-node distribution network.
As can be seen from the experimental results above, the partitioning method proposed in this paper is better than traditional methods in partitioning results for distribution networks of different scales. Among the three objectives calculated by the method proposed in this paper, two of them are superior to traditional methods. In the case of 124 nodes, f2 is reduced by 1.03 compared to traditional methods, and f3 is reduced by 50 compared to traditional methods. In the case of 300 nodes, f2 is reduced by 0.6 compared to traditional methods, and f3 is reduced by 139 compared to traditional methods.
Based on the partitioning results of the 300-node system obtained using multi-objective optimization methods and traditional reactive voltage partitioning methods (Table 10), a multi-microgrid day-ahead coordinated optimization dispatch model was established (with the objective function being total cost, where a lower value is better). The same parallel mechanism was employed to solve this operational model, and the results from five independent replicate experiments are summarized in Table 11. As shown in the table, the total costs achieved through operational optimization under the two different partitioning schemes are similar. However, the single iteration time under the multi-objective optimization (The proposed method) partitioning scheme is reduced by 38.87% compared to the traditional reactive voltage (Traditional method) partitioning scheme, and the overall time for multiple iterations is reduced by 24.98%. This is because the microgrid system obtained through the method described in this paper has more even user distribution. When multiple microgrids are optimized in parallel, the waiting time between processes is shorter, resulting in reduced iteration time and higher overall computational efficiency.

Table 11.
Comparison of optimization efficiency between traditional partitioning schemes for 300-node distribution networks and the proposed method.
Based on the above comprehensive analysis, it can be concluded that the multi-objective optimization method not only ensures reasonable reactive power partitioning but also takes into account both user distribution balance and the power balance between sources and loads within partitions. The partitioning results obtained through the multi-objective optimization method not only satisfy system voltage control requirements but also significantly enhance computational efficiency in multi-zone coordinated optimization. Grid operators can adaptively adjust objective function weights to derive optimal zoning schemes tailored to specific operational needs.
5. Conclusions
This paper proposes a multi-objective optimization partitioning method for active distribution networks that simultaneously addresses computational efficiency and system operational stability. Leveraging the topological characteristics of active distribution networks, we establish an optimization model targeting three objectives: reactive power–voltage regulation, load balancing, and power balance. The framework incorporates partition scale constraints and connectivity constraints, with detailed constraint-handling techniques provided. The NSGA-III algorithm obtains the Pareto front, while a fuzzy membership function derives the optimal compromise solution, followed by fine-tuned adjustments to the partitioning scheme. Validation through case studies on 47-node, 124-node, and 300-node 10 kV distribution networks demonstrates the method’s effectiveness and superiority over conventional approaches, yielding an optimized partitioning scheme with considerable reference value. In practical applications, on the one hand, it is possible to collaborate with distribution network operators to utilize their real data to optimize models and integrate algorithms into existing energy management systems. On the other hand, it is possible to select typical feeder lines or transformer districts with high penetration rates of distributed energy for experimental applications, compare them with traditional solutions, and evaluate indicators such as voltage and network losses to verify their effectiveness. Future work will expand the model’s adaptability to mesh topologies and improve the handling strategy for partition connectivity constraints so that it can not only optimize the partitioning of radial distribution networks but also be compatible with multi-loop, multi-source mesh structures.
Author Contributions
Conceptualization, C.L.; Data curation, L.Z.; Formal analysis, Q.G.; Funding acquisition, Q.L.; Investigation, Q.L.; Methodology, Q.G.; Resources, L.Z. and C.L.; Software, Y.X.; Validation, Y.X. and Z.H.; Visualization, Z.H.; Writing—original draft, Q.G.; Writing—review and editing, Q.L. All authors have read and agreed to the published version of the manuscript.
Funding
This work was supported by the Science and Technology Program of State Grid Corporation of China under Grant No. 521310240012.
Data Availability Statement
Data will be made available on request from the corresponding author.
Conflicts of Interest
Authors Qing Ge, Yuezhou Xia, Ling Zeng and Chuanjie Lin were employed by State Grid Fuzhou Power Supply Company. Authors Qi Li and Zhangbin Huang were employed by Xiamen Great Power Geo Information Technology Co.
References
- Wang, S.; Luo, Y.; Yu, P.; Yu, R. Integrated Coordinated Control of Source–Grid–Load–Storage in Active Distribution Network with Electric Vehicle Integration. Processes 2025, 13, 1285. [Google Scholar] [CrossRef]
- Sandeep, A.; Verma, S.; Buznitsky, K.; Henry, A. Design optimization for grid integration of a high-temperature thermal energy storage system. Appl. Energy 2025, 397, 126340. [Google Scholar] [CrossRef]
- Zhang, L.; Shen, C.; Chen, Y.; Huang, S.; Tang, W. Coordinated allocation of distributed generation, capacitor banks and soft open points in active distribution networks considering dispatching results. Appl. Energy 2018, 231, 1122–1131. [Google Scholar] [CrossRef]
- Zhao, F.; Si, J.; Wang, J. Research on optimal schedule strategy for active distribution network using particle swarm optimization combined with bacterial foraging algorithm. Int. J. Electr. Power Energy Syst. 2016, 78, 637–646. [Google Scholar] [CrossRef]
- Bai, L.; Jiang, T.; Li, F.; Chen, H.; Li, X. Distributed energy storage planning in soft open point based active distribution networks incorporating network reconfiguration and DG reactive power capability. Appl. Energy 2018, 210, 1082–1091. [Google Scholar] [CrossRef]
- Ji, H.; Wang, C.; Li, P.; Song, G.; Yu, H.; Wu, J. Quantified analysis method for operational flexibility of active distribution networks with high penetration of distributed generators. Appl. Energy 2019, 239, 706–714. [Google Scholar] [CrossRef]
- Liu, X.; Zhao, P.; Qu, H.; Liu, N.; Zhao, K.; Xiao, C. Optimal Placement and Sizing of Distributed PV-Storage in Distribution Networks Using Cluster-Based Partitioning. Processes 2025, 13, 1765. [Google Scholar] [CrossRef]
- Liang, Z.; Sun, D.; Du, E.; Fang, Y. Event-driven day-ahead and intra-day optimal dispatch strategy for sustainable operation of power systems considering major weather events. Processes 2024, 12, 840. [Google Scholar] [CrossRef]
- Khan, M.A.; Rehman, T.; Kim, H.M. Hierarchical energy management for heterogeneous multi-energy microgrid community: Integrating hydrogen into the water-energy nexus. Appl. Energy 2025, 397, 126254. [Google Scholar] [CrossRef]
- Zhang, J.; Cai, J.; Wang, S.; Li, P. Many-objective optimal power flow problems based on distributed power flow calculations for hierarchical partition-managed power systems. Int. J. Electr. Power Energy Syst. 2023, 148, 108945. [Google Scholar] [CrossRef]
- Yan, W.; Zhang, Z.; Hu, X. Tertiary Voltage Control Method for AC/DC Coordination Considering Constant Power-Constant Extinction Angle Mode. Autom. Electr. Power Syst. 2023, 47, 185–192. [Google Scholar]
- Mahdavi, M.; Alhelou, H.H.; Hatziargyriou, N.D.; Jurado, F. Reconfiguration of electric power distribution systems: Comprehensive review and classification. IEEE Access 2021, 9, 118502–118527. [Google Scholar] [CrossRef]
- Ahrari, M.; Shirini, K.; Gharehveran, S.S.; Ahsaee, M.G.; Haidari, S.; Anvari, P. A security-constrained robust optimization for energy management of active distribution networks with presence of energy storage and demand flexibility. J. Energy Storage 2024, 84, 111024. [Google Scholar] [CrossRef]
- Biswas, S.; Singh, M.K.; Centeno, V.A. Chance-constrained optimal distribution network partitioning to enhance power grid resilience. IEEE Access 2021, 9, 42169–42181. [Google Scholar] [CrossRef]
- Liu, Z.; Wang, Z.; Chen, Y.; Ren, Q.; Zhao, J.; Qiu, S.; Zhao, Y.; Zhang, H. A Hierarchical Distributed and Local Voltage Control Strategy for Photovoltaic Clusters in Distribution Networks. Processes 2025, 13, 1633. [Google Scholar] [CrossRef]
- Liu, W.; Tong, Y.; Xing, X.; Chen, X.; Hu, B.; Sun, Q.; Wang, Y.; Li, H.; Guo, H. Virtual Cluster Partitioning Method of Active Distribution Networks Using Quantum Particle Swarm Optimization and Sector Search. Energy Sci. Eng. 2025, 13, 1883–1895. [Google Scholar] [CrossRef]
- Ebtia, A.; Ghafouri, M.; Debbabi, M.; Kassouf, M.; Mohammadi, A. Power distribution network topology detection using dual-graph structure graph neural network model. IEEE Trans. Smart Grid 2024, 16, 1833–1850. [Google Scholar] [CrossRef]
- Liccardo, A.; Lauria, D.; Bonavolontã, F.; Giannuzzi, G.M.; Pisani, C.; Tessitore, S. A robust spectral clustering method based on PMU measurements for coherent areas identification. IEEE Access 2023, 11, 121445–121456. [Google Scholar] [CrossRef]
- Chen, Y.; Liu, Y.; Yin, H.; Tang, Z.; Qiu, G.; Liu, J. Multiagent soft actor–critic learning for distributed ess enabled robust voltage regulation of active distribution grids. IEEE Trans. Ind. Inform. 2024, 20, 11069–11080. [Google Scholar] [CrossRef]
- Ding, J.; Zhang, Q.; Hu, S.; Wang, Q.; Ye, Q. Clusters partition and zonal voltage regulation for distribution networks with high penetration of PVs. IET Gener. Transm. Distrib. 2018, 12, 6041–6051. [Google Scholar] [CrossRef]
- Balasubramaniam, K.; Abdlrahem, A.; Hadidi, R.; Makram, E.B. Balanced, non-contiguous partitioning of power systems considering operational constraints. Electr. Power Syst. Res. 2016, 140, 456–463. [Google Scholar] [CrossRef]
- Cui, H.; Cao, F.; Liu, R. A multi-objective partitioning algorithm for large-scale graph based on NSGA-II. Expert Syst. Appl. 2025, 263, 125756. [Google Scholar] [CrossRef]
- Cheng, Z.; Wang, L.; Zeng, S.; Su, C.; Zhang, R.; Zhou, W. Partition-global dual-layer collaborative voltage control strategy for active distribution network with high proportion of renewable energy. IEEE Access 2024, 12, 22546–22556. [Google Scholar] [CrossRef]
- Anuar, S.H.H.; Abas, Z.A.; Mukhtar, M.F.; Miswan, N.H. Community detection in practice: A review of real-world applications across six themes. Int. J. Acad. Res. Bus. Soc. Sci. 2024, 14, 953–996. [Google Scholar] [CrossRef]
- Eddin, M.E.; Massaoudi, M.; Abu-Rub, H.; Shadmand, M.; Abdallah, M. Optimum partition of power networks using singular value decomposition and affinity propagation. IEEE Trans. Power Syst. 2024, 39, 6359–6371. [Google Scholar] [CrossRef]
- Kumar, B.A.; Jyothi, B.; Singh, A.R.; Bajaj, M.; Rathore, R.S.; Tuka, M.B. Hybrid genetic algorithm-simulated annealing based electric vehicle charging station placement for optimizing distribution network resilience. Sci. Rep. 2024, 14, 7637. [Google Scholar] [CrossRef]
- Wu, C.; Xue, F.; Xu, X.; Lu, S.; Jiang, L.; Li, G. Partitioning Method of Virtual Microgrid Based on Electrical Coupling Strength. Autom. Electr. Power Syst. 2019, 43, 54–62. [Google Scholar]
- Xiao, C.; Zhao, B.; Zhou, J.; Li, P.; Ding, M. Network partition based cluster voltage control of high-penetration distributed photovoltaic systems in distribution networks. Autom. Electr. Power Syst. 2017, 41, 147–155. [Google Scholar]
- Xiong, X.; Tianjun, J.; Ke, S. Power coordinated optimization among multi-microgrid in active distribution network. Electr. Power Autom. Equip. 2018, 38, 15–21. [Google Scholar]
- Zhao, Y.; Yu, J.; Ban, M.; Liu, Y.; Li, Z. Privacy-preserving economic dispatch for an active distribution network with multiple networked microgrids. IEEE Access 2018, 6, 38802–38819. [Google Scholar] [CrossRef]
- Haddadian, H.; Noroozian, R. Multi-microgrid-based operation of active distribution networks considering demand response programs. IEEE Trans. Sustain. Energy 2019, 10, 1804–1812. [Google Scholar] [CrossRef]
- Zhang, J.; Lin, S.; Liu, H.; Chen, Y.; Zhu, M.; Xu, Y. A small-population based parallel differential evolution algorithm for short-term hydrothermal scheduling problem considering power flow constraints. Energy 2017, 123, 538–554. [Google Scholar] [CrossRef]
- Casacio, L.; Lyra, C.; Oliveira, A.R.L. Interior point methods for power flow optimization with security constraints. Int. Trans. Oper. Res. 2019, 26, 364–378. [Google Scholar] [CrossRef]
- Yang, H.; Yuan, X.; He, W. Active/reactive power generation mechanisms and representations in system dynamics with time-varying amplitude/frequency signals. CSEE J. Power Energy Syst. 2024; early access. [Google Scholar]
- Zhang, J.; Wang, S.; Tang, Q.; Zhou, Y.; Zeng, T. An improved NSGA-III integrating adaptive elimination strategy to solution of many-objective optimal power flow problems. Energy 2019, 172, 945–957. [Google Scholar] [CrossRef]
- Zhang, J.; Cai, J.; Zhang, H.; Chen, T. NSGA-III integrating eliminating strategy and dynamic constraint relaxation mechanism to solve many-objective optimal power flow problem. Appl. Soft Comput. 2023, 146, 110612. [Google Scholar] [CrossRef]
- Zhou, Y.; Zhang, J. Three-layer day-ahead scheduling for active distribution network by considering multiple stakeholders. Energy 2020, 207, 118263. [Google Scholar] [CrossRef]
- Zhang, J.; Zhou, Y.; Li, Z.; Cai, J. Three-level day-ahead optimal scheduling framework considering multi-stakeholders in active distribution networks: Up-to-down approach. Energy 2021, 219, 119655. [Google Scholar] [CrossRef]
- Chen, J.; Zhang, L.; Lu, D.; Guo, P.; Ren, J.; Li, J.; Li, Z. Cluster Partition Method of Distributed Power Supply Based on Improved Particle Swarm Optimization Algorithm. J. Zhengzhou Univ. Eng. Sci. 2023, 44, 77. [Google Scholar]
Disclaimer/Publisher’s Note: The statements, opinions and data contained in all publications are solely those of the individual author(s) and contributor(s) and not of MDPI and/or the editor(s). MDPI and/or the editor(s) disclaim responsibility for any injury to people or property resulting from any ideas, methods, instructions or products referred to in the content. |
© 2025 by the authors. Licensee MDPI, Basel, Switzerland. This article is an open access article distributed under the terms and conditions of the Creative Commons Attribution (CC BY) license (https://creativecommons.org/licenses/by/4.0/).