1. Introduction
Water contamination by heavy metals has become an increasing crisis on a global scale, and this has been accompanied by a vast amount of research aimed at removing these metals from water [
1,
2,
3,
4,
5]. There are various sources of heavy metal contaminants, including but not limited to industries like mining, metal plating, manufacturing, ammunition, ceramics and glass, painting and dying [
6]. These industries have been proven to release large quantities of heavy metals as waste, which are transported by agents like wind, erosion, and gravity into surface and ground water bodies [
7,
8]. Mining processes are one of the key driving factors of the economy in Africa, with high acid drainage processes that deposit heavy metal contaminants into both the surface and groundwater [
9,
10,
11]. As there are minimal resources to properly clean water in African countries, this heavy metal-contaminated water ends up in the drinking and industrial water systems. There are, of course, dire health consequences of ingesting metal-ion-contaminated water by humans and animals alike, including liver, nerve, and bone damage, as well as possible interference with the normal functioning of various metalloenzymes [
12,
13,
14,
15]. The environmental landscape is also affected and subjected to change by the action of heavy metals, affecting biodiversity and general livelihood. A stepwise approach to this problem could contribute to reducing heavy metal poisoning in water.
Amongst the various heavy metals that contaminate water, lead has been identified as one of the common and concerning pollutants [
16,
17,
18,
19]. This metal has had a prolonged water contamination streak that evolves with time. Its sources are mainly mining and other industrial processes globally. In Africa, the sources of lead pollutants can be from the poorly maintained infrastructure, as many water transporting pipes and taps are made of heavy metals like lead and copper. In time, these materials are subjected to corrosion due to poor maintenance procedures like routine checks, replacements, and re-furbishing, releasing the heavy metals to water masses, ultimately. There are many rural areas in Africa that are mountainous, consisting of various types of rocks like sedimentary, igneous, and metamorphic rocks. The sedimentary rocks constitute shale and sandstone, which are known to carry lead ions within them [
20,
21]. When the processes of weathering take place, the lead-containing sediments are deposited into the water masses, polluting the water. Africa and Europe have, over the years, formulated a series of laws and regulations for lead production and contamination in water [
22]. For instance, in South Africa, the usage of leaded petrol was banned, together with the usage of lead-containing paint and some building materials like roofing. The country has seen the development of various laws and regulations to circumvent lead poisoning; however, the contamination of water by lead seems to be ongoing as industrialization, globalization, and natural processes like erosion take place. A collective effort from policymakers, industries, and researchers is needed to contribute to combating the issue of lead poisoning in water.
Researchers have, over time, formulated various methods to remove lead ions from water. These methods, amongst others, include ion exchange, membrane filtration, coagulation and precipitation, and adsorption [
23,
24]. Adsorption has piqued the interest of researchers because of its general sustainability and effectiveness. Various adsorbents have been used, including zeolites, activated carbon, modified silica gel, natural fibers, and recently graphene oxide (GO) [
24,
25,
26,
27]. The oxygen-containing functional groups, as well as the large surface area on GO, are responsible for the adsorption process and continued interest in this material by researchers.
Literature [
28,
29,
30,
31] has illustrated that GO alone possesses excellent lead ion adsorption capabilities, making it an ideal adsorbent and therefore worth exploring. The problem is usually that it is quickly subjected to fouling when it is utilized on its own, which reduces its long-term usage in water remediation. To prolong the lifespan and efficacy of GO for the adsorption of lead ions, it would ideally need to be masked and dispersed on substrates like metals, clays, and polymers, amongst others. Numerous studies have explored GO-based composites with different polymers, including both biodegradable and non-biodegradable matrices [
15]. For instance, Awul et al. [
32] formulated and used large-pore organic ligand/GO composites for the adsorption of lead ions from contaminated water. Their work achieved high Pb(II) adsorption capacities and excellent selectivity towards lead, in the presence of competing ions. Omer et al. [
33] prepared GO@Fe
3O
4/iota-carrageenan composites and tested their effectiveness in removing lead ions from water. The authors established that these composites exhibited rapid adsorption kinetics and a maximum capacity of 440 mg/g, showcasing the benefits of combining GO with biopolymers. Nassar et al. [
34] introduced a cross-linked alginate-rice husk ash-GO-chitosan nanocomposite to use in the adsorption of lead ions from water. Their findings showed a 95% removal efficiency and 242 mg/g maximum adsorption capacity, with good reusability.
Recent research has increasingly focused on the usage of biodegradable polymer/GO composite systems for lead adsorption from water, in line with sustainability goals and green chemistry principles. In particular, Mokoena et al. [
35] prepared PLA/PHBV/GO composites with 1, 3, and 5 wt.% contents of GO, and 70/30, 50/50, and 30/70
w/
w PLA/PHBV blend compositions, and systematically investigated their performance for Pb(II) removal from water. Their study found that composites with 1 wt.% GO in a 49.5/49.5 PLA/PHBV blend achieved optimal adsorption (81–87%), while higher GO contents (3 and 5 wt.%) led to hydrolytic degradation, especially in blends with higher PLA content. The work emphasized the importance of balancing GO content and blend ratio to maintain both adsorption performance and material stability 2.
Despite these advances, no studies have reported the use of PLA/ethylene vinyl acetate (EVA)/GO composites for lead ion removal. EVA is a non-biodegradable and flexible polymer that has a certain level of bio-friendliness, hoping to hinder or slow down the hydrolytic degradation process of PLA, while complementing its brittleness. There is a clear gap in the literature regarding the exploration of PLA/EVA/GO composites for environmental remediation, more so, at 70/30, 50/50, and 30/70 w/w PLA/EVA blend ratios, and higher GO contents (1, 3, 5 wt.%), to see what happens as either polymer is in high, low, and equal quantities. Addressing this gap could reveal new insights into the balance between adsorption efficiency, morphological properties, and environmental compatibility and may offer a novel, effective material for water purification. The aim of this study was to prepare and characterize PLA/EVA/GO composites for the purpose of removing lead ions from water.
2. Materials and Methods
2.1. Materials
Poly (L-Lactic acid) (PLA 4043D) was supplied by Nature Works LLC in Plymouth, MN, USA. It melts in the range of 145–160 °C, with a glass transition temperature range of 55–65 °C, a density (ρ) of 1.248 g/cm3, tensile strength at yield of 48 MPa, and tensile elongation at yield of 2.5%. Ethylene vinyl acetate (EVA-460), with 18% by weight vinyl acetate content and a butylated hydroxyl toluene antioxidant thermal stabilizer, was supplied by DuPont Packaging & Industrial Polymers in Melrose, GP, South Africa. Its Melt flow index (MFI) is 2.5 g/10 min, it melts at 88 °C, with a softening point of 64 °C and a density (ρ) of 0.941 g/cm3. Commercial grade expandable graphite (EG) (ES250 B5), supplied in flake form by Qingdao Kropfmuehl Graphite, Qingdao, SD, China, was used to synthesize graphene oxide. This graphite contains 90–95% carbon content, with an expansion rate of 250–500 cm3/g at a starting temperature range between 180 and 300 °C, and more than 80% of its contents have a particle size greater than 300 µm.
The chemicals used to functionalize EG to GO were supplied by Sigma-Aldrich, Modderfontein, JHB, South Africa. They are listed, with their specifications, are as follows: Sulfuric acid (H2SO4), Mw = 98.1 g/mol, ρ = 1.84 g/cm3, Assay = 95–99%, Phosphoric acid (H3PO4), Mw = 98.0 g/mol, ρ = 1.71 g/cm3, Assay = 85%, Potassium permanganate (KMnO4), Mw = 158.0 g/mol, Appearance: Dark purple needle like crystals, Assay = 99.0%, Hydrogen peroxide (H2O2), Mw = 34.0 g/mol, ρ = 1.11 g/cm3, Assay = 30%, Hydrochloric acid (HCl), Mw = 36.5 g/mol, ρ = 1.16 g/cm3, Assay = 32%.
2.2. Methods
2.2.1. Synthesis of Graphene Oxide (GO)
Modified Hummer’s method was used to synthesize graphene oxide from expandable graphite (EG) [
35,
36]. The process commenced by mixing H
2SO
4 (27 mL) and H
3PO
4 (3 mL) with stirring for 10 min, then adding EG (0.225 g) with a further 10 min of stirring. Thereafter, KMnO
4 (1.32 g) was slowly added, and the solution was stirred at room temperature and 1200 rpm speed for 6 h until it was visibly green. This was followed by the dropwise addition of H
2O
2 (0.675 mL) to the green solution, stirring the mixture for 10 min, and cooling it at room temperature. After this, a 1:3 mixture of HCl (10 mL)/deionized water (30 mL) was added to the reaction solution, followed by a 7 min centrifugation at 5000 rpm. The supernatant from centrifugation was decanted, and a 1:3 HCl/deionized water mixture was used to wash the residuals three times. The recovered product was then oven dried for 3 days; The entire functionalization process was repeated several times until a satisfactorily higher yield was obtained.
2.2.2. Sample Preparation
All the polymeric materials (neat polymers and GO, blends and composites) were prepared via melt mixing, using the Brabender Plastograph, manufactured by Brabender GmbH & Co, Kulturstraße, DU, Germany.
Table 1 shows the different ratios, by mass, that were used to prepare all the polymer samples. Before mixing, PLA, EVA, and GO were oven dried at 40 °C for 24 h to remove any residual moisture adsorbed by these known hydrophilic materials. Then the polymers, PLA and EVA, were first physically mixed and fed to the Brabender at an operational temperature of 180 °C and a rotational speed of 50 rpm, for 3 min before adding the graphene oxide, and mixing for a further 13 min (total of 16 min mixing time). The feeds from the Brabender were pressed into 2 mm thick sheets on a hydraulic melt presser for 10 min, at 180 °C, and 50 kPa pressure. Subsequently, the samples were cooled for 5 min between the steel bars, cut, and taken for different characterizations.
2.3. Characterization of Samples
Fourier-transform infrared spectroscopy (FTIR)–Attenuated total reflectance (ATR), through the Perkin Elmer Spectrum 100 series spectrometer, was used to confirm the functionalization of expandable graphite to graphene oxide. This spectrometer was fitted with a PIKE MiracleTM ATR and equipped with a diamond crystal. The wavenumber range of analyses was set to 650–4000 cm−1, with a resolution of 4 cm−1, and a total of 8 scans.
The crystal and interlayer properties of EG and GO, as part of the GO synthesis confirmation, were analyzed using X-ray diffraction (XRD), specifically using the Bruker D8 powder diffractometer. The analyses utilized CuKα radiation, with an external Si standard, a wavelength of 1.54051 λ, and a beta filter. At 45 kV and 50 mA, a secondary monochromator was used, with a scan range of 2θ = 1–60°, continuous scanning at a rate of 0.02°/s, under ambient temperatures and indexed quality. Bragg’s law, represented by Equation (1), was used to calculate the interlayer spacing in EG and GO.
where λ is the X-ray’s wavelength, θ represents the angle of scattering, d gives the interlayer spacing between adjacent atoms, molecules, ions, and others, and n represents the integer related to the order of the diffraction peak.
The surface and fractured morphology, as well as elemental composition of the neat materials, blends, and composites, were analyzed using scanning electron microscopy (SEM)–energy dispersive X-ray spectroscopy (EDS). This was performed on the TESCAN VEGA 3 Scanning electron microscope–Oxford X–MaxN EDS, using an acceleration voltage of 15 kV. EG and GO were not prior coated with carbon as they constitute, for a larger part, carbon, whereas the polymeric materials (neat polymers, blends, and composites) were cryo-fractured in liquid nitrogen and carbon-coated before analyses. The magnifications of analyses were 60, 200, 500, and 1k× for different materials.
The water intake abilities of the prepared samples were investigated through water absorption experiments. This was preceded by the prior cutting of the pressed films into 2 × 2 × 0.2 cm (l × b × h) shapes and subsequently drying the cuts overnight, at room temperature, to prevent adsorption of moisture. The samples were then pre-weighed and then immersed, for 30 h, in 25 °C distilled water. Following this, the increase in mass (% water absorbed) was determined periodically by removing the samples from distilled water, blot drying with a paper towel, and measuring their mass. Equation (2) was used to calculate the percentage (%) of water absorbed by each sample.
where R
w (%) is the percentage water absorbed, W
t (g) is the weighed mass of the sample after time (t), and W
i (g) is the initial sample mass.
2.4. Adsorption Studies
Atomic absorption spectroscopy (AAS) was used to measure the adsorption of lead ions from water by the samples, through the Flame absorption spectrometer (GBC 909AA), and batch adsorption experiments were conducted. Three parameters of adsorption were investigated, which are the effect of initial concentration, pH, and contact time. The effect of concentration was only performed for the neat GO, as it is the major adsorbent, to allow for the isothermal modeling of the adsorption process. Then the effects of pH and contact time were investigated for only the selected samples, which showed superior water intake properties, for optimization purposes.
The effect of initial lead ion concentration was investigated by first preparing 100, 200, 300, and 400 mg/L Pb(II) solutions at a pH of ~7 and room temperature. To these solutions, ~0.70 g of GO adsorbent was added with stirring for 4 h, after which the aliquots were filtered and the concentrations of Pb(II) remaining in solution were determined by AAS. For the investigation of the effect of pH on adsorption, 400 mg/L Pb(II) solutions were first prepared using adequate amounts of lead nitrate dissolved in deionized water, and their pH media were adjusted to 3 and 12 using 1 M HCl and NaOH solutions. After that, adsorption experiments were conducted by adding 50 mL Pb(II) solutions to 100 mL beakers and then immersing 4 cm × 2 cm × 0.2 cm polymeric films (adsorbents), followed by stirring at 150 rpm for a maximum of 4 h, at room temperature. This was followed by filtration and, ergo, the determination of lead ions in solutions using AAS. The effect of contact time was investigated by following the same procedure but varying the contact times of the adsorbents (polymeric samples) with lead solutions to 1, 2, 3, and 4 h before taking readings, at a pH of 7 and room temperature.
It is vital to note that all adsorption experiments were performed in triplicate for each sample, and the mean values were used for further analysis and calculations. Also, the filtering process for all experiments entailed the decanting of the first 5 mL of filtrate, due to the presence of cellulose in the filter paper, which could adsorb some of the lead ions.
From there, the concentration of Pb(II) adsorbed, C
a in mg/L, was calculated through the usage of Equation (3).
where C
0 and C
e are initial and final concentrations (mg/L) of the lead ions present in solution before and at time t of adsorption. C
e is also regarded as the concentration of lead ions at equilibrium [
34]. The percentage (%) lead ion removal (R
a) was then computed using Equation (4), and Equation (5) was used to calculate the adsorption capacity at equilibrium, q
e (mg/g).
where m represents adsorbent mass (g) and V is the volume of lead ions in solution.
2.4.1. Adsorption Isotherm Modeling
Isotherm Modeling of the adsorption process was performed to be able to ascribe the adsorption to a particular type and make positions regarding the mechanism involved. Two isotherm models, Langmuir and Freundlich, were applied.
Langmuir Isotherm
The Langmuir isotherm model assumes that a monosaturated layer of adsorbates is formed on the surface of the adsorbent, and that the adsorption process exhibits a constant amount of energy, where adsorbent molecules do not interact. This implies that adsorption sites have equal amounts of energy on the adsorbent’s surface, and the intermolecular forces are inversely proportional to the adsorbent surface area. Equation (6) shows the linear form of this isotherm model.
where C
e (mg/L) represents the equilibrium concentration of the adsorbate, K
L (L·mg
−1) and q
m refer to constants relating to the energy of adsorption, and the maximum adsorption capacity, respectively. The separation factor or balance parameter, R
L, is a dimensionless constant that describes important aspects of the Langmuir isotherm model and is given by Equation (7).
According to this model, an R
L value that lies between 0 and 1 describes a favorable linear adsorption process, if this value is greater than 1, then the adsorption is not favorable, and R
L = 0 describes an irreversible adsorption phenomenon [
28].
Freundlich Isotherm
The Freundlich isotherm model is used to describe the processes of adsorption that take place on heterogenous surfaces, with an exponential distribution of active sites and their energies. This isotherm model best fits multilayer adsorption processes that comprise a combination of both physical and chemical adsorption (physisorption and chemisorption). Equation (8) portrays the exponential form of this model.
where K
f (mg/g) is a distribution coefficient related to the quantity of adsorbed material and affinity, and n is a dimensionless number that indicates the type of adsorption: n < 1—chemisorption, n > 1—physisorption. The linearized form of the Freundlich isotherm is given by Equation (9).
3. Results and Discussion
3.1. FTIR Measurements for EG and GO
Fourier transform infrared (FTIR) spectroscopy was employed to confirm the successful transformation of expandable graphite (EG) to graphene oxide (GO).
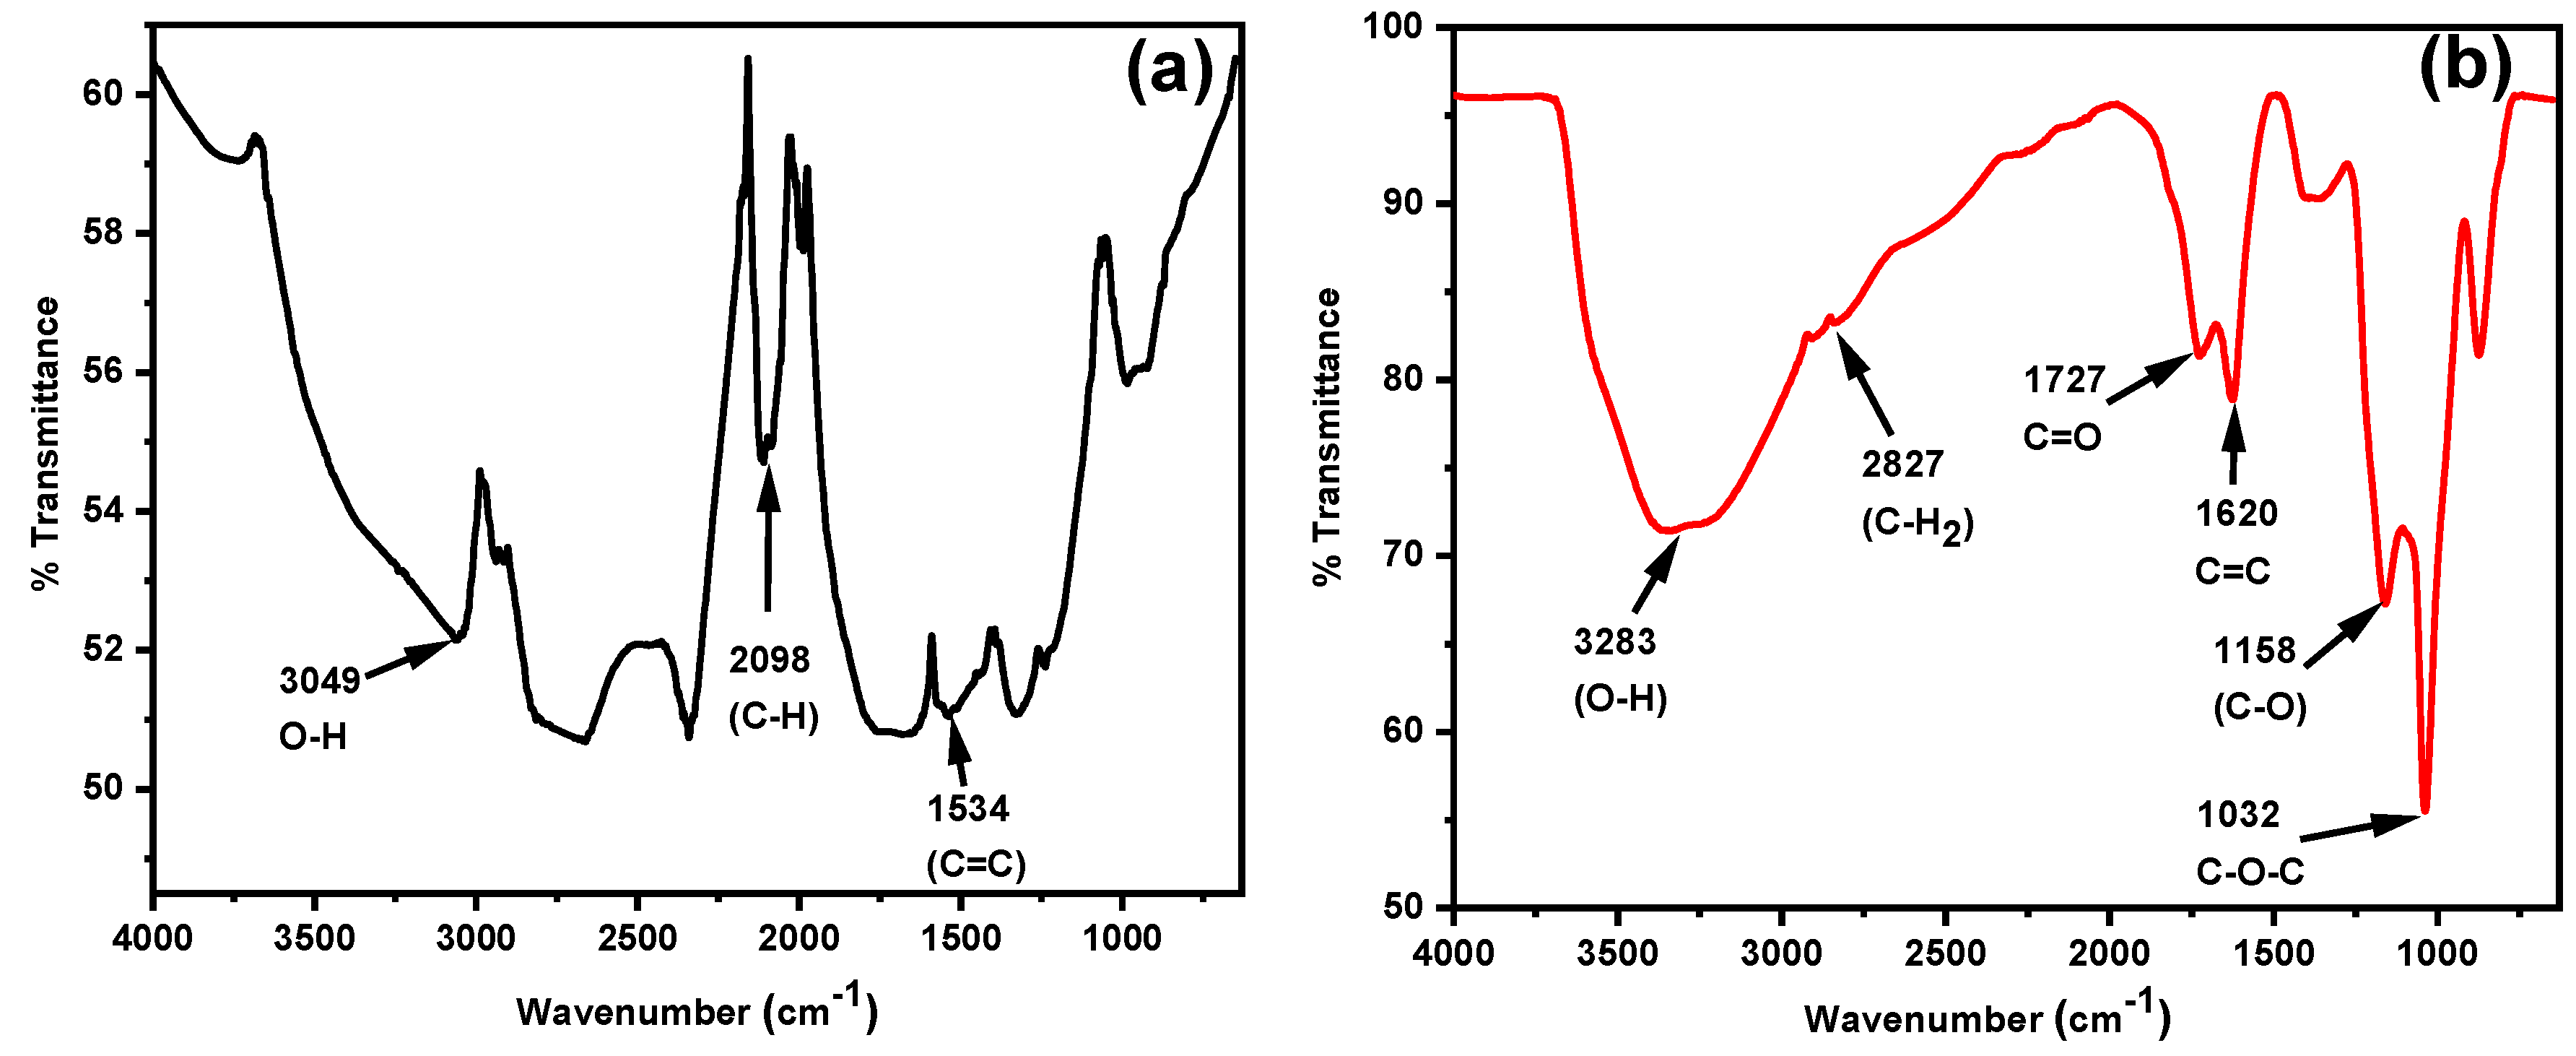
Figure 1 shows a comparison between the FTIR spectra of the starting material EG (
Figure 1a) and the prepared GO (
Figure 1b). The spectrum of EG showed peaks characteristic of its native structure. A broad band around 3060 cm
−1 was assigned to hydroxyl (-OH) groups, possibly due to previously absorbed moisture by EG. Other key peaks included a sharp band at 2075 cm
−1, attributed to -C-H bending of the graphitic cyclic structure, and a peak at 1530 cm
−1 representative of the -C=C- stretching in the conjugated graphite backbone.
Comparatively, the spectrum for GO portrayed several new absorption features consistent with oxygen-containing functional groups attached during oxidation. The broad band between 3000 and 3400 cm
−1 represents the -OH stretching vibrations from bonded hydroxyl groups, as well as adsorbed water molecules. A peak at 2821 cm
−1 indicates symmetric -CH
2 stretching and at 1620 cm
−1, the narrow peak represents C=C stretching as carbons move from sp
2 to sp
3 hybridization (unoxidized to oxidized). Peaks observed at 1729 and 1144 cm
−1 are attributed to carbonyl (-C=O) and hydroxyl (-C-OH) groups, respectively, indicating the presence of carboxyl functionality. The epoxide group (-C-O-C-) was identified by the peak at 1029 cm
−1, while the peak at 869 cm
−1 was ascribed to -C-H bending [
37,
38].
Collectively, these FTIR results demonstrate the introduction of a variety of oxygen-containing moieties characteristic of GO, validating the successful functionalization of EG to GO. This transformation is key to enhancing hydrophilicity and providing active sites for metal ion adsorption in subsequent composite applications.
3.2. XRD Analyses of EG and GO
X-ray diffraction (XRD) was employed to investigate the crystalline properties of expandable graphite (EG) and to confirm its successful oxidation to graphene oxide (GO).
Figure 2 shows the diffractograms of EG flakes (
Figure 2a) and synthesized GO (
Figure 2b). EG’s diffractogram exhibited a sharp peak at 2θ = 25.66°, which corresponds to the (002) crystal plane of graphite, with a calculated interlayer spacing of 0.347 nm. This peak is indicative of a highly ordered crystallite graphite structure, consistent with literature [
25,
28]. Additional peaks at 55.42° and 87.07° were also seen, indexed as (004) and (006) planes, respectively. These peaks confirm the layered nature of the graphite, with flakes orientated along the c-axis. Upon the oxidation of EG to GO (
Figure 2b), a distinctive new peak appeared at 7.5°, associated with an increased interlayer spacing of 1.18 nm. The peak indicates the successful introduction of oxygen-containing functional groups and the intercalation of water molecules between graphene layers during oxidation. This peak sis characteristic of GO, and the d-spacing reflects the disruption of the graphitic lattice by oxidation. Meanwhile, the peaks near 25.87° and 42.01° persisted in the GO diffractogram, corresponding to unoxidized graphitic domains and disordered carbonaceous components formed during chemical processing. Overall, XRD analyses demonstrated a clear transition from the ordered graphitic structure of EG to the more disordered and expanded lattice that is characteristic of GO. The increase in the interlayer spacing and the appearance of the low-angle peak are definitive signatures of the successful synthesis of GO, validating the process of functionalization.
3.3. SEM-EDS Analyses of EG and GO
The surface morphologies of EG and GO were analyzed using SEM;
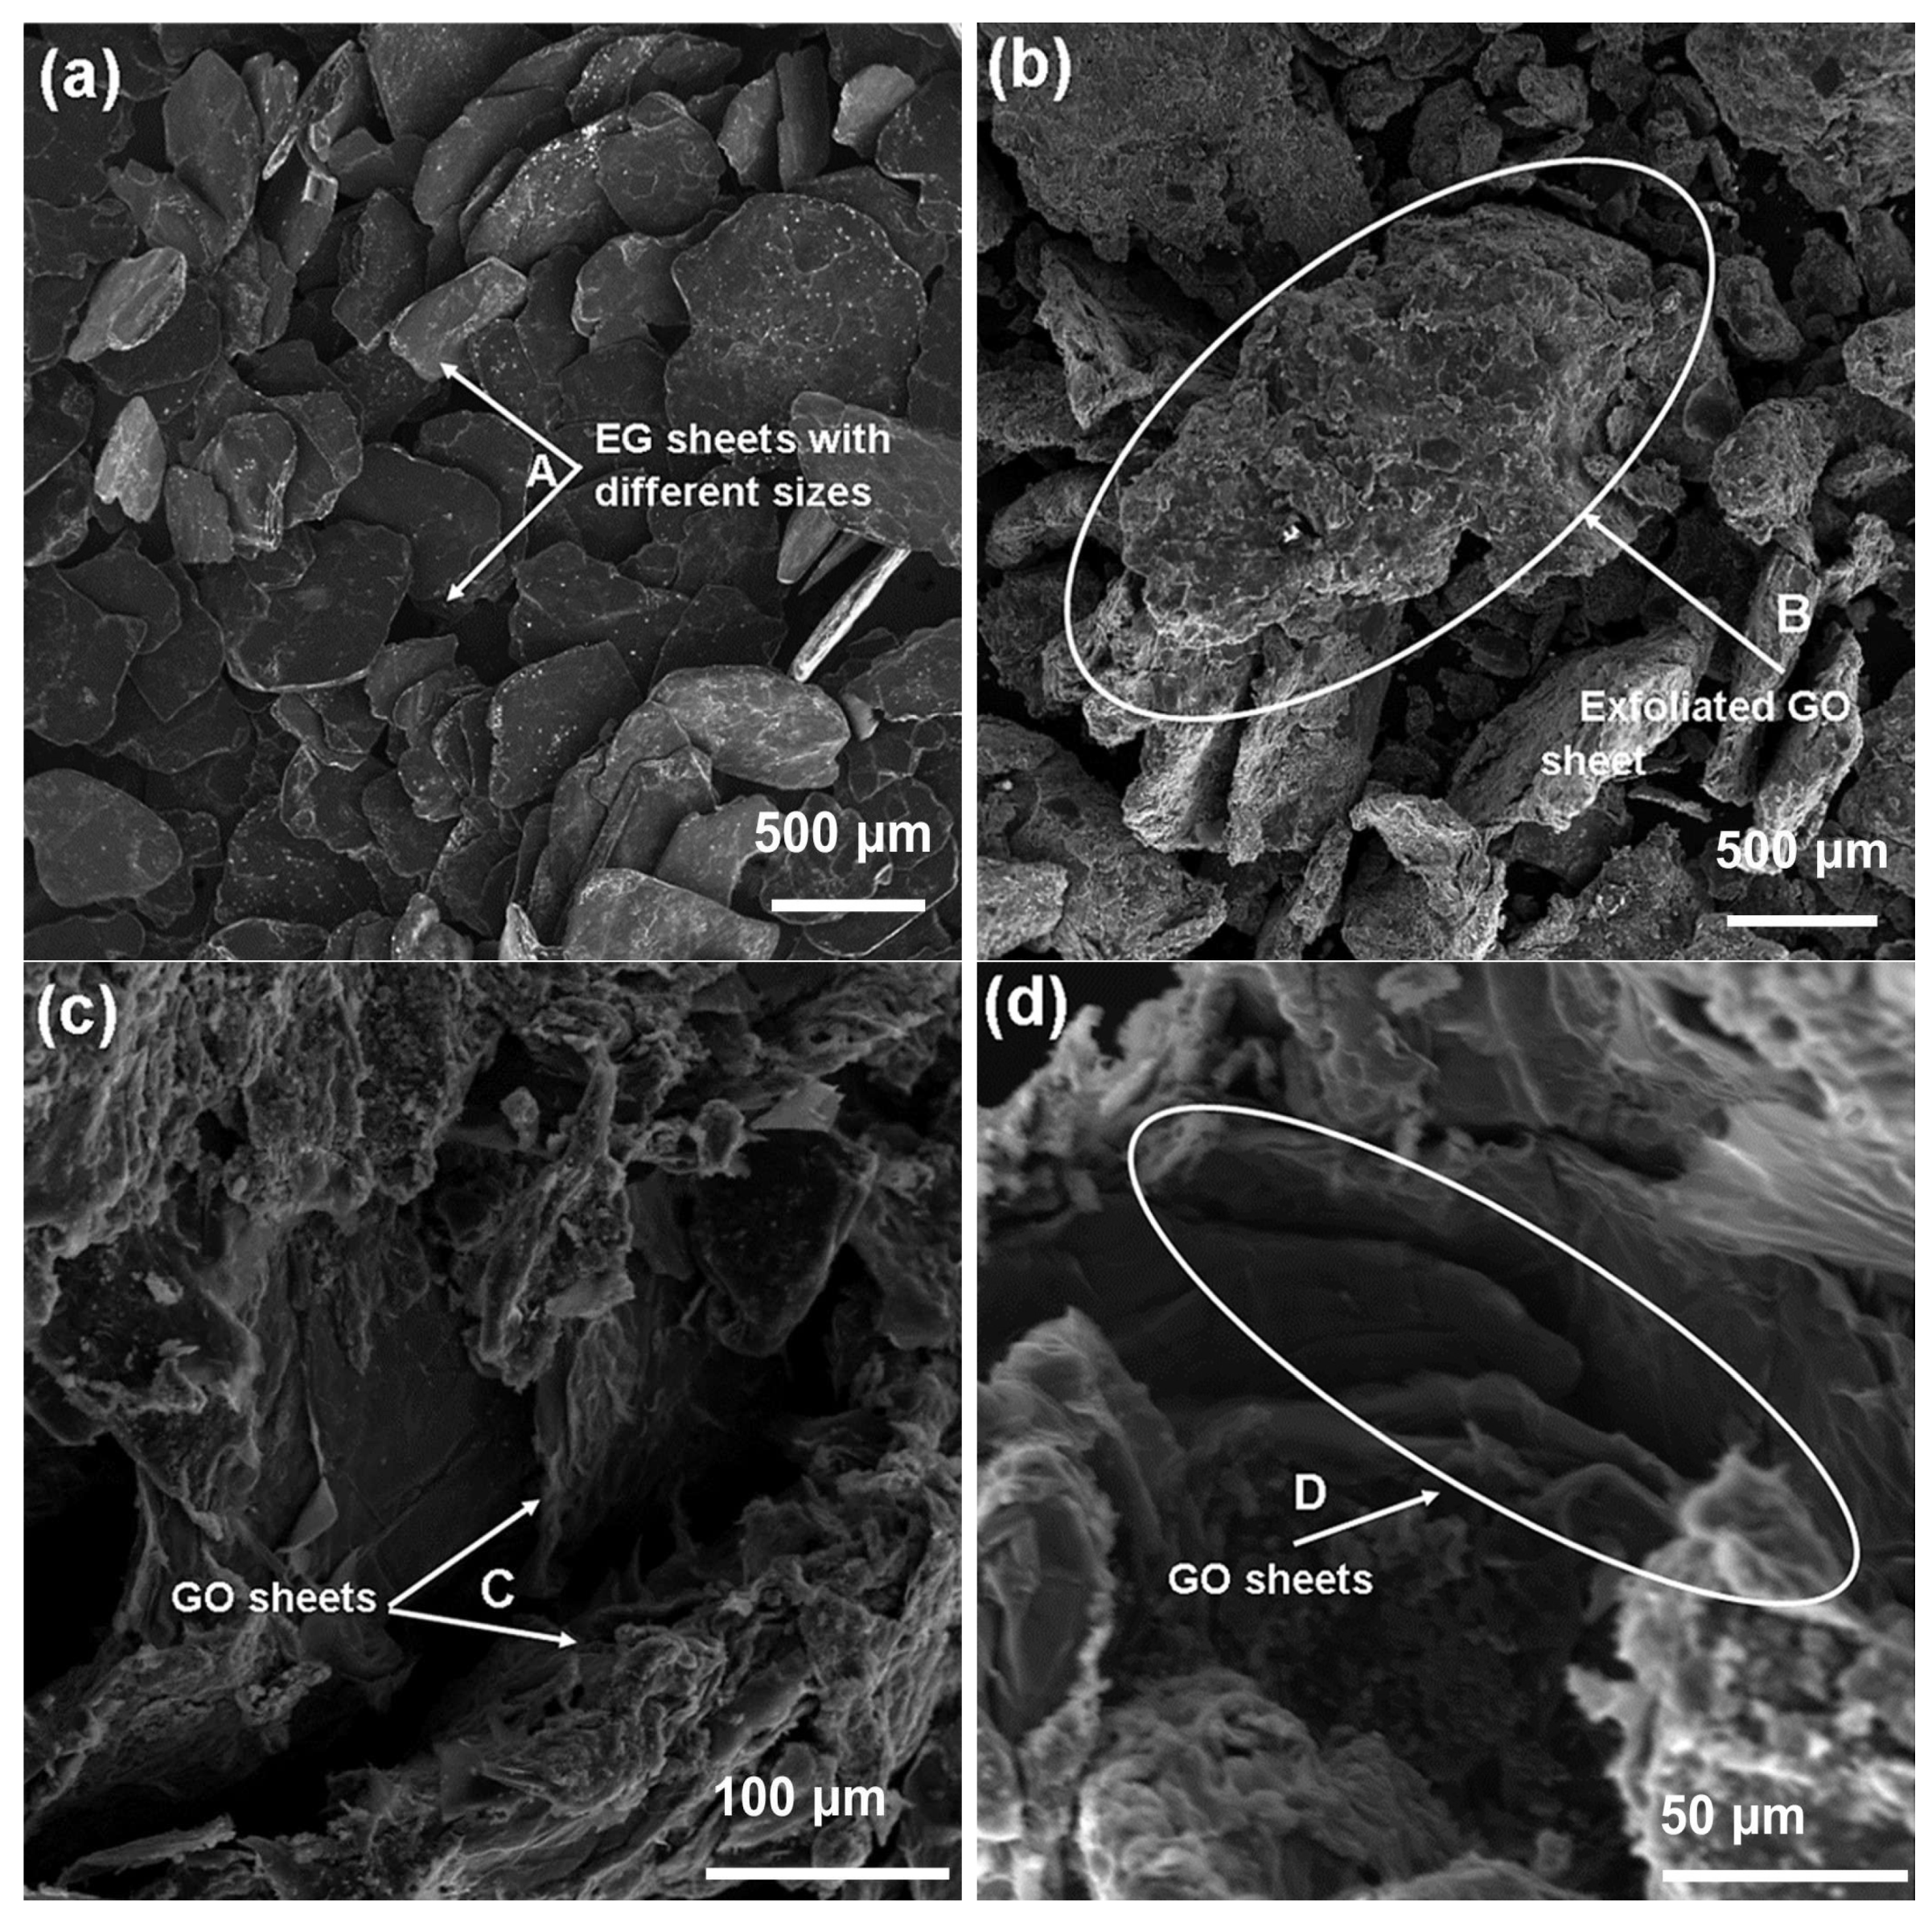
Figure 3 depicts the images of EG (
Figure 3a) at 60× magnification, and
Figure 3b–d show the SEM images of GO at 60, 500, and 1k× magnifications, respectively. SEM imaging for EG (
Figure 3a) revealed that it consists of loosely packed, variably sized flakes ranging from approximately 100 to 500 µm. The EG flakes display smooth, compact surfaces and distinct layered ordering typical of graphitic materials. Arrow A demonstrates the distribution of different-sized graphite flakes, which form due to the thermal expansion process characteristic of EG production. Following oxidation, the morphology of GO (
Figure 3b–d) exhibited noticeable structural changes consistent with chemical exfoliation. At 60× magnification (
Figure 3b), GO visibly retained the original flaky architecture of graphite, but appeared more wrinkled and irregular due to interlayer separation and exfoliation. This exfoliation led to a reduction in flake thickness and an increase in surface roughness, features indicative of the introduction of oxygen-containing functional groups. Higher magnification images at 500× and 1000× (
Figure 3c,d) further confirmed the layered, sheet-like morphology of GO, with visible folds and wrinkles resulting from the increased interlayer spacing caused by oxidation.
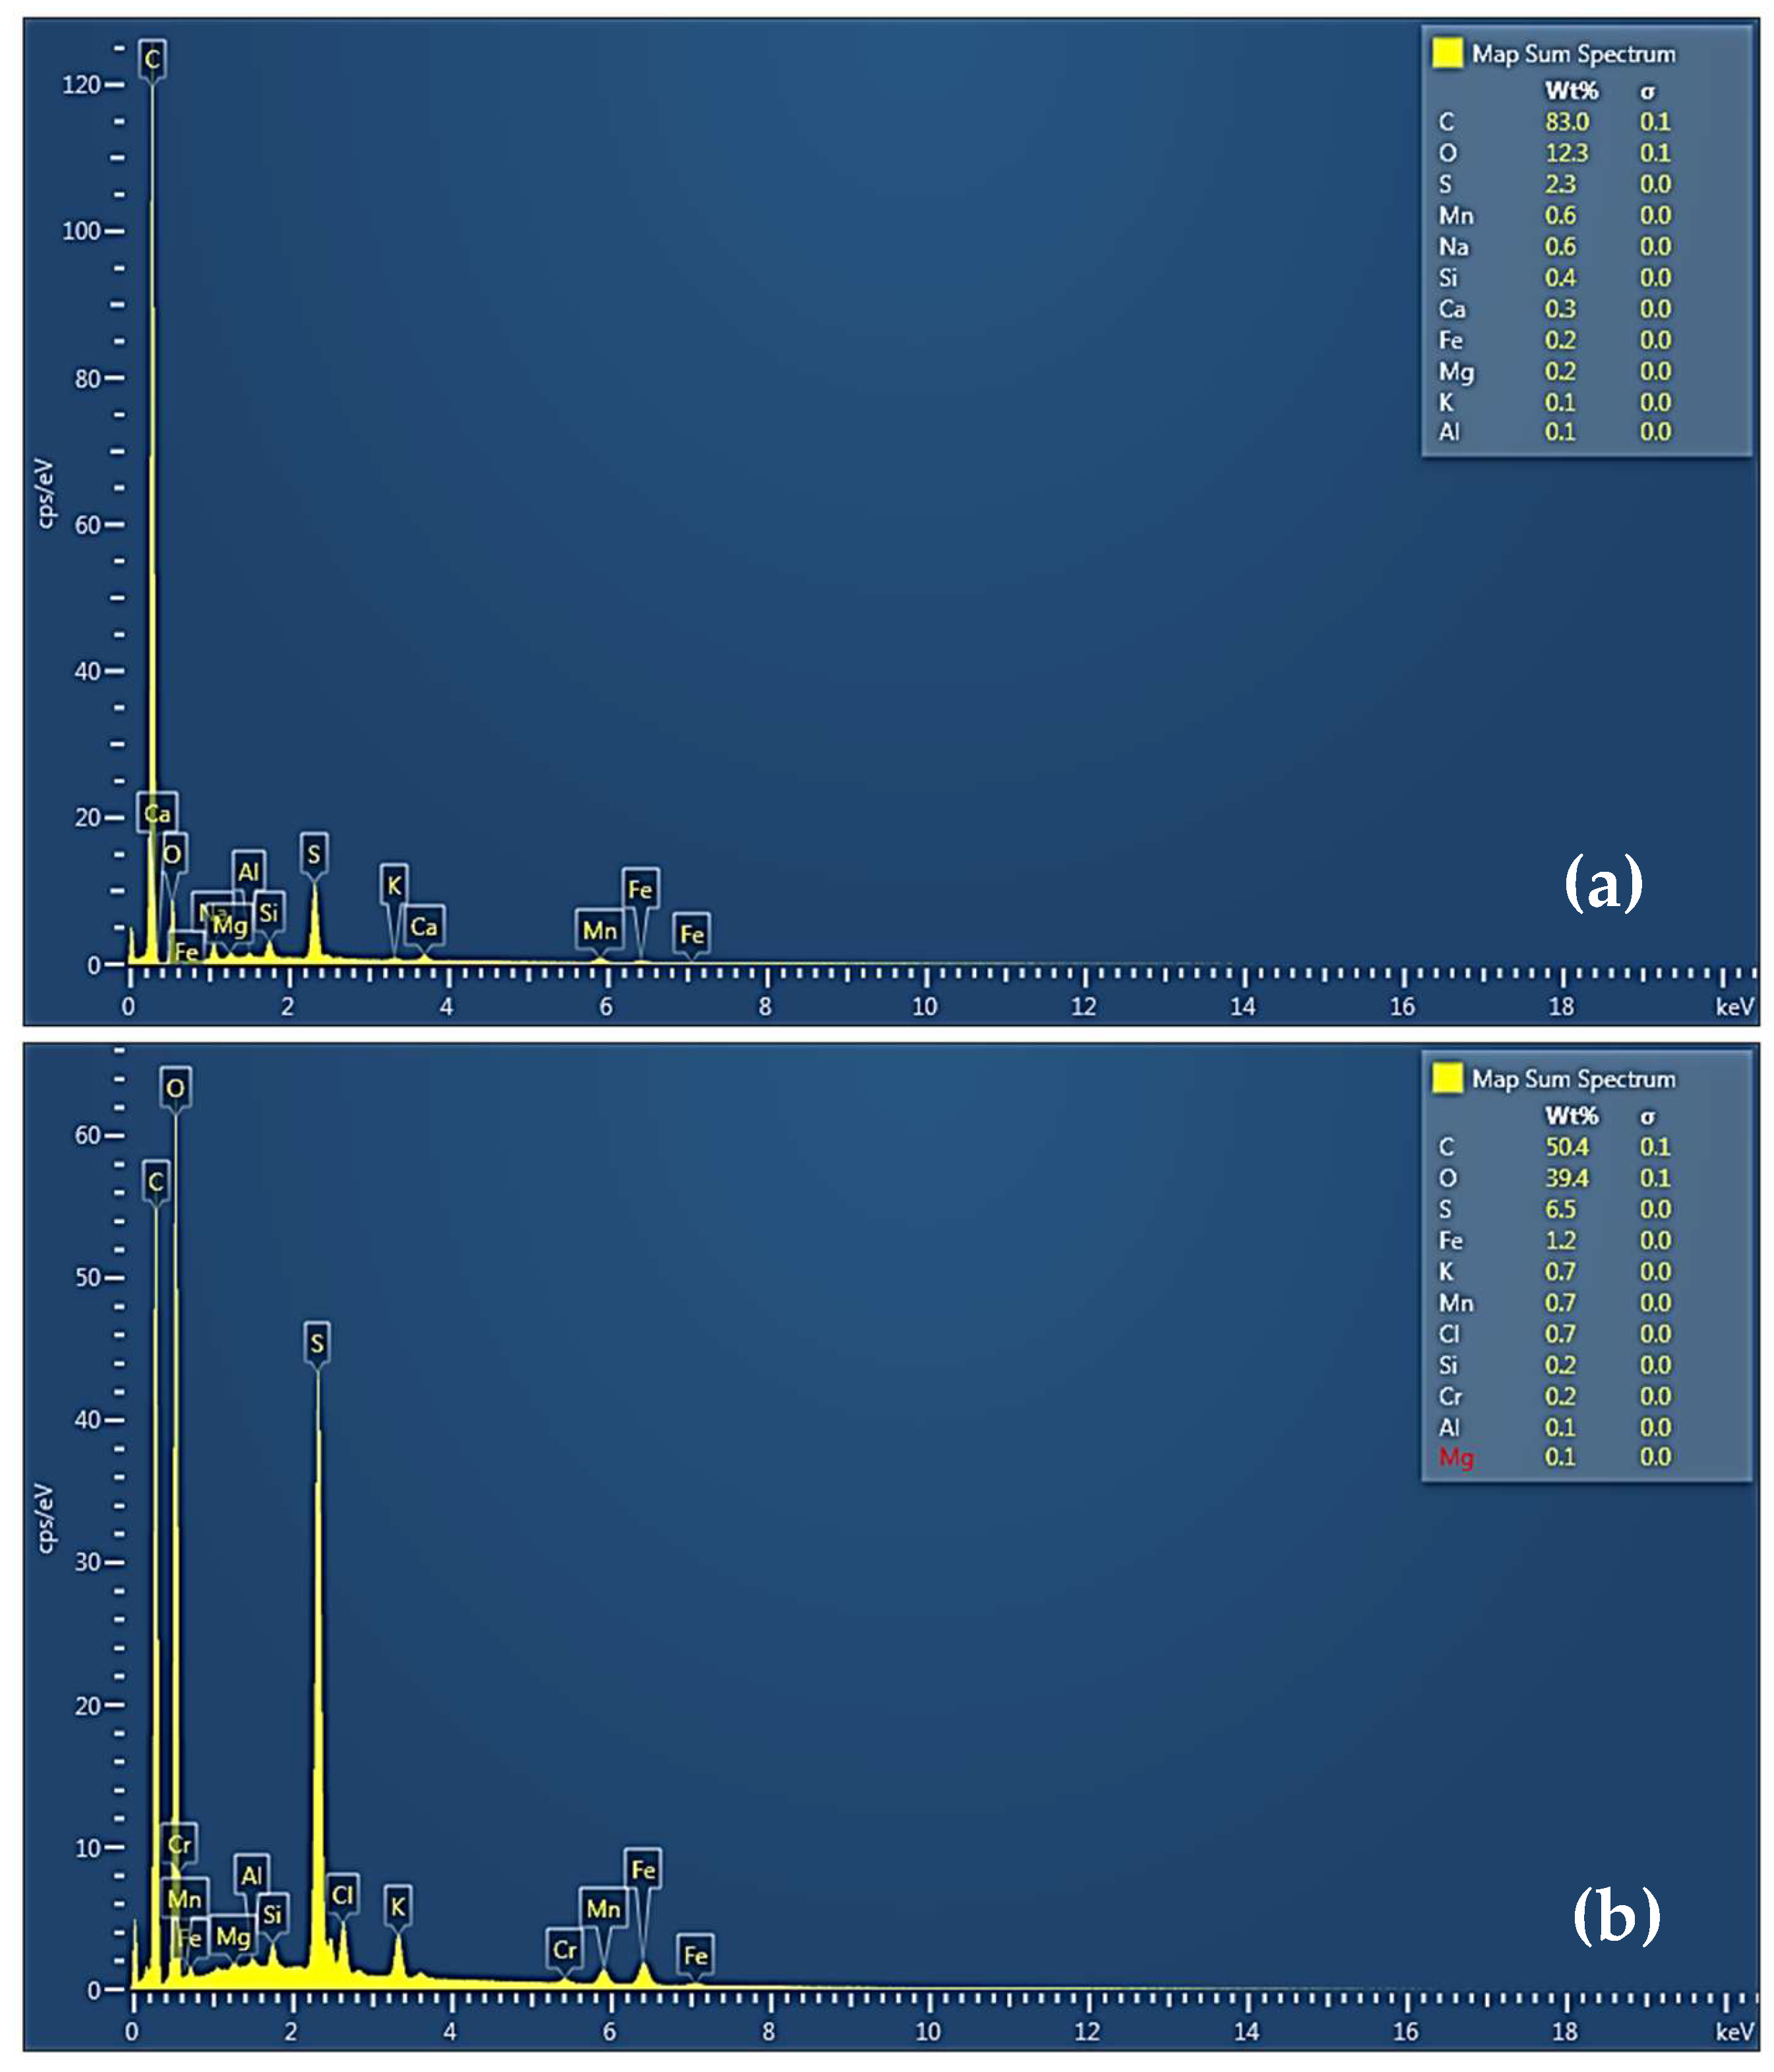
The EDS spectra (
Figure 4) supported morphological observations and confirmed the compositional changes that accompany the oxidation of EG to GO. The EG spectrum (
Figure 4a) exhibited a higher carbon content of approximately 83.0% and a minor oxygen content of 12.3%, due to its largely pure carbon composition and trace surface oxidation. In contrast, the GO sample (
Figure 4b) showed a significant increase in oxygen content to 39.4%, accompanied by a proportional decrease in carbon content to 50.4%. This increase confirms the incorporation of oxygen-containing groups such as hydroxyl, carbonyl, and carboxyl moieties onto the graphene layers during functionalization. The presence of these groups is in alignment with the structural disruptions observed in SEM micrographs and the interlayer expansion identified in XRD and FTIR analyses. Together, the SEM-EDS findings validate the successful oxidation and exfoliation of expandable graphite into graphene oxide.
3.4. SEM Analyses of the PLA/EVA Blends and PLA/EVA/GO Composites
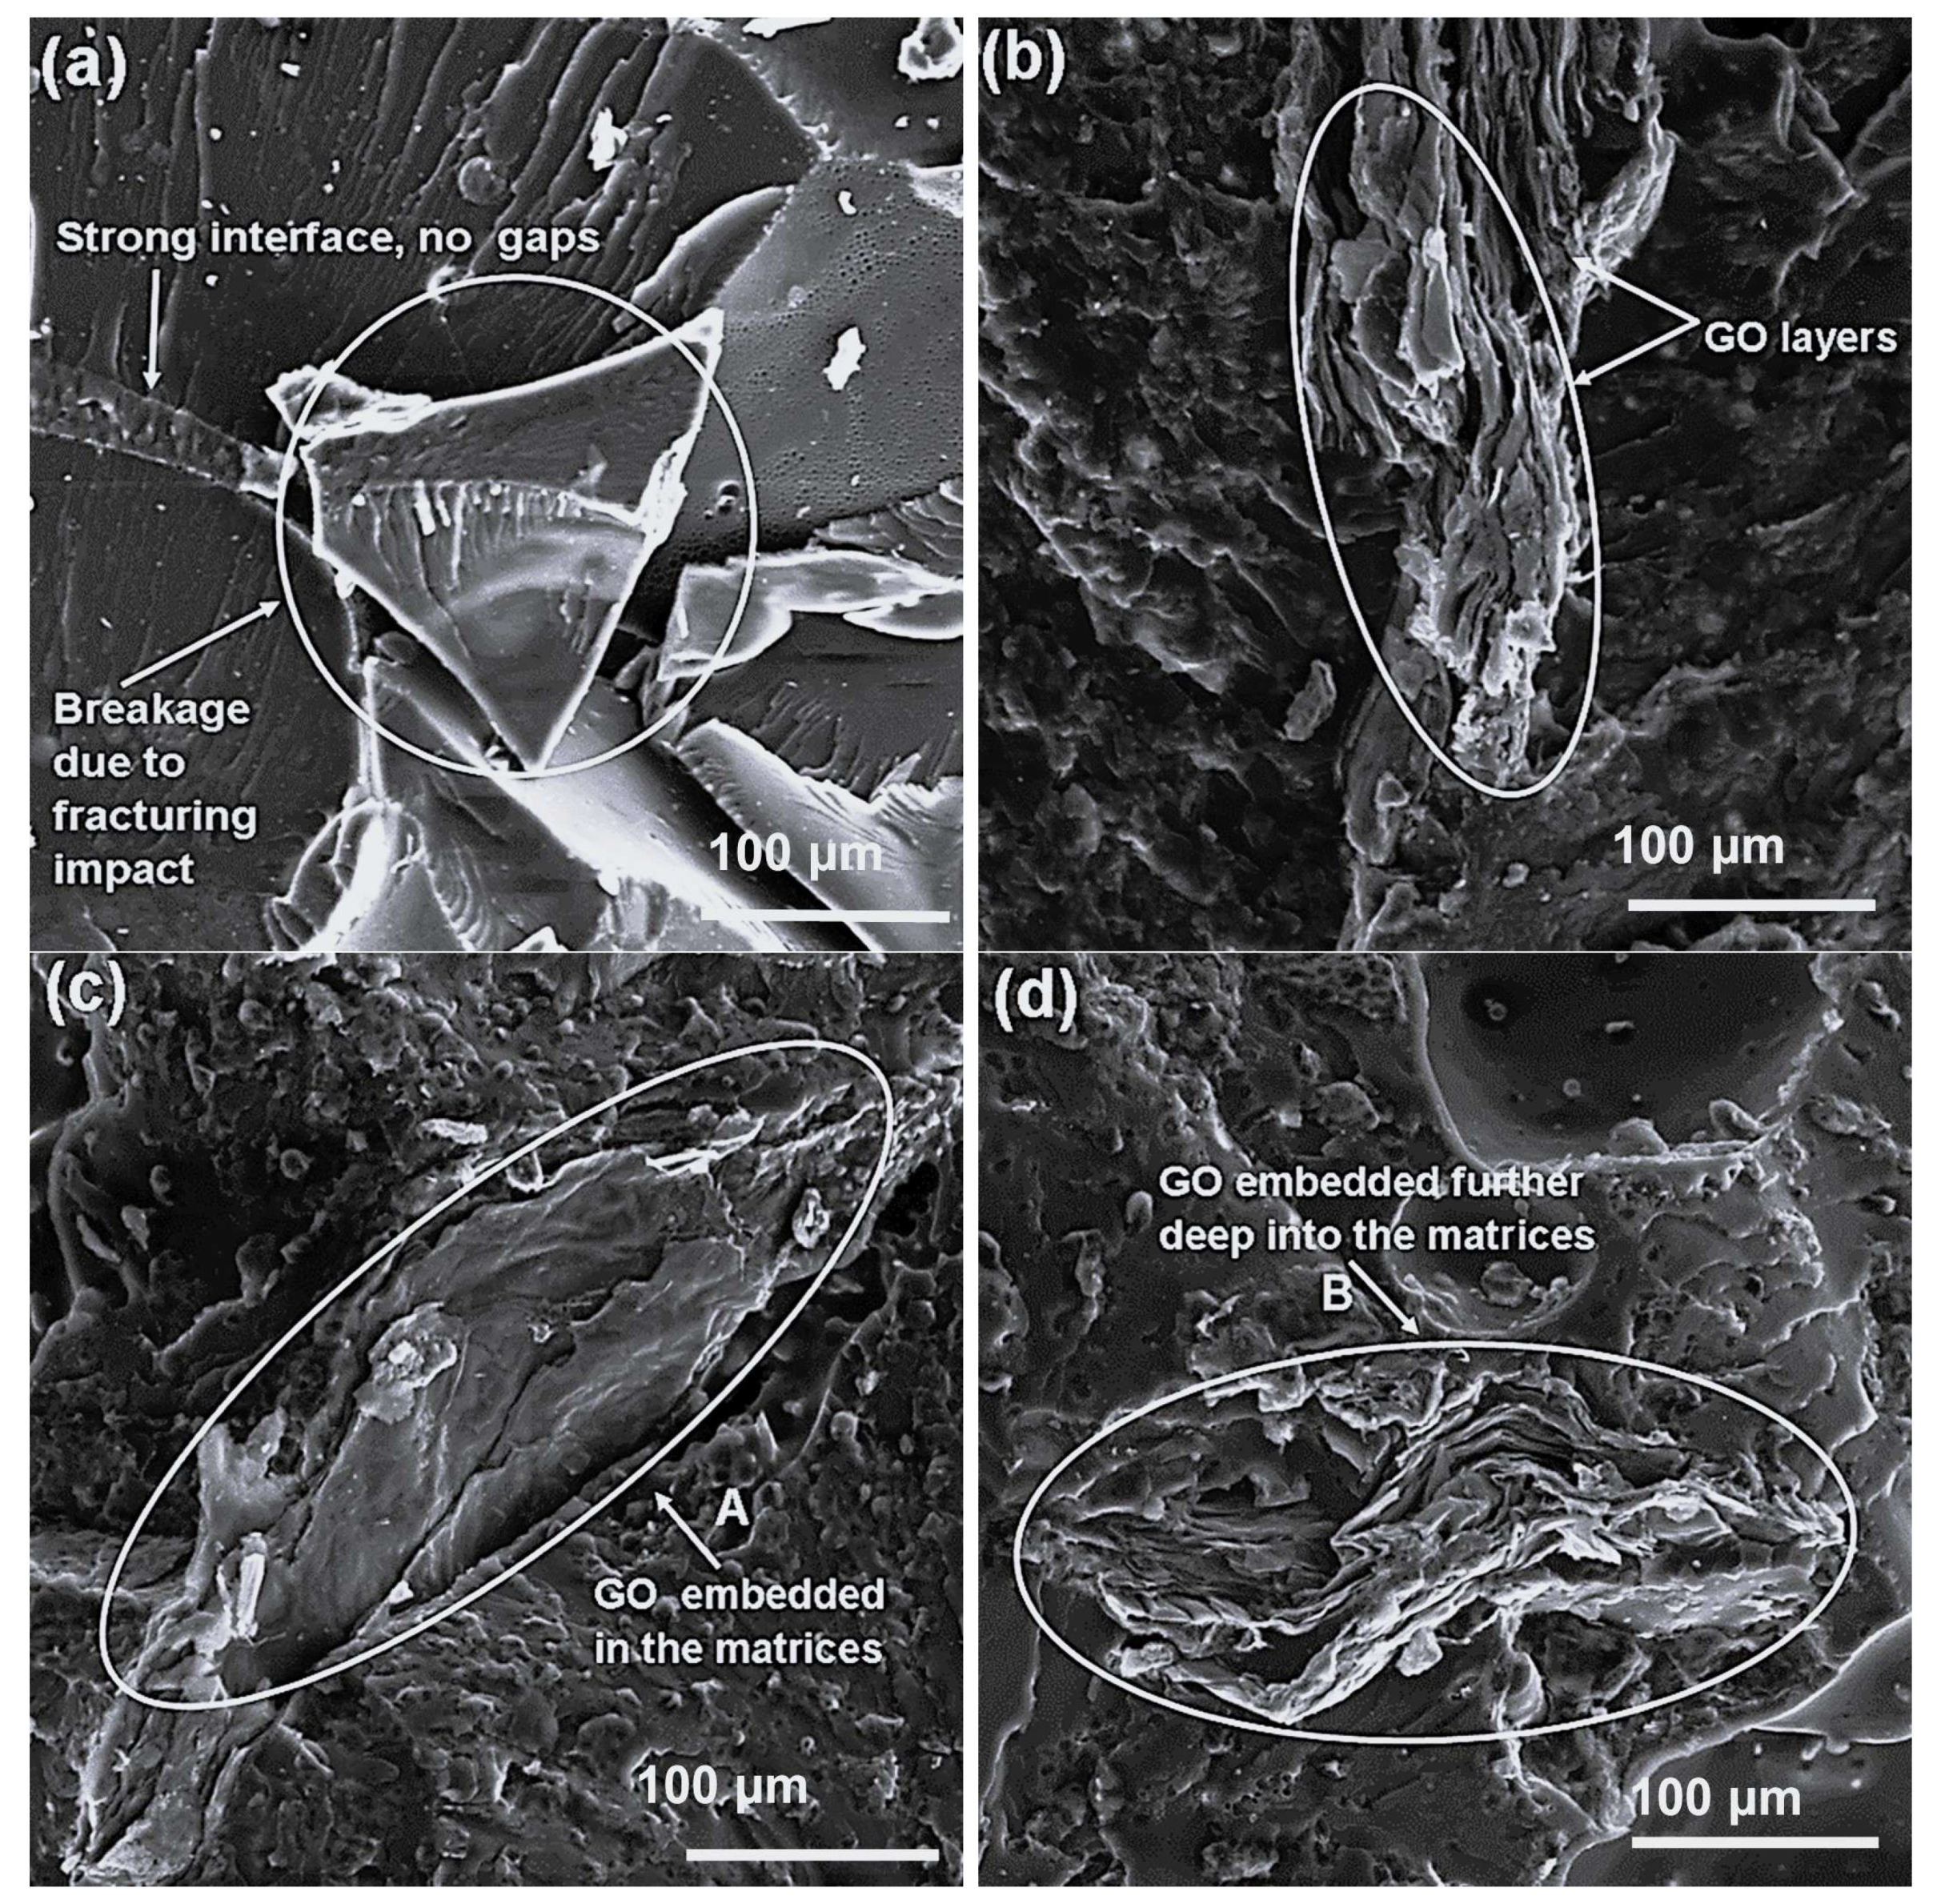
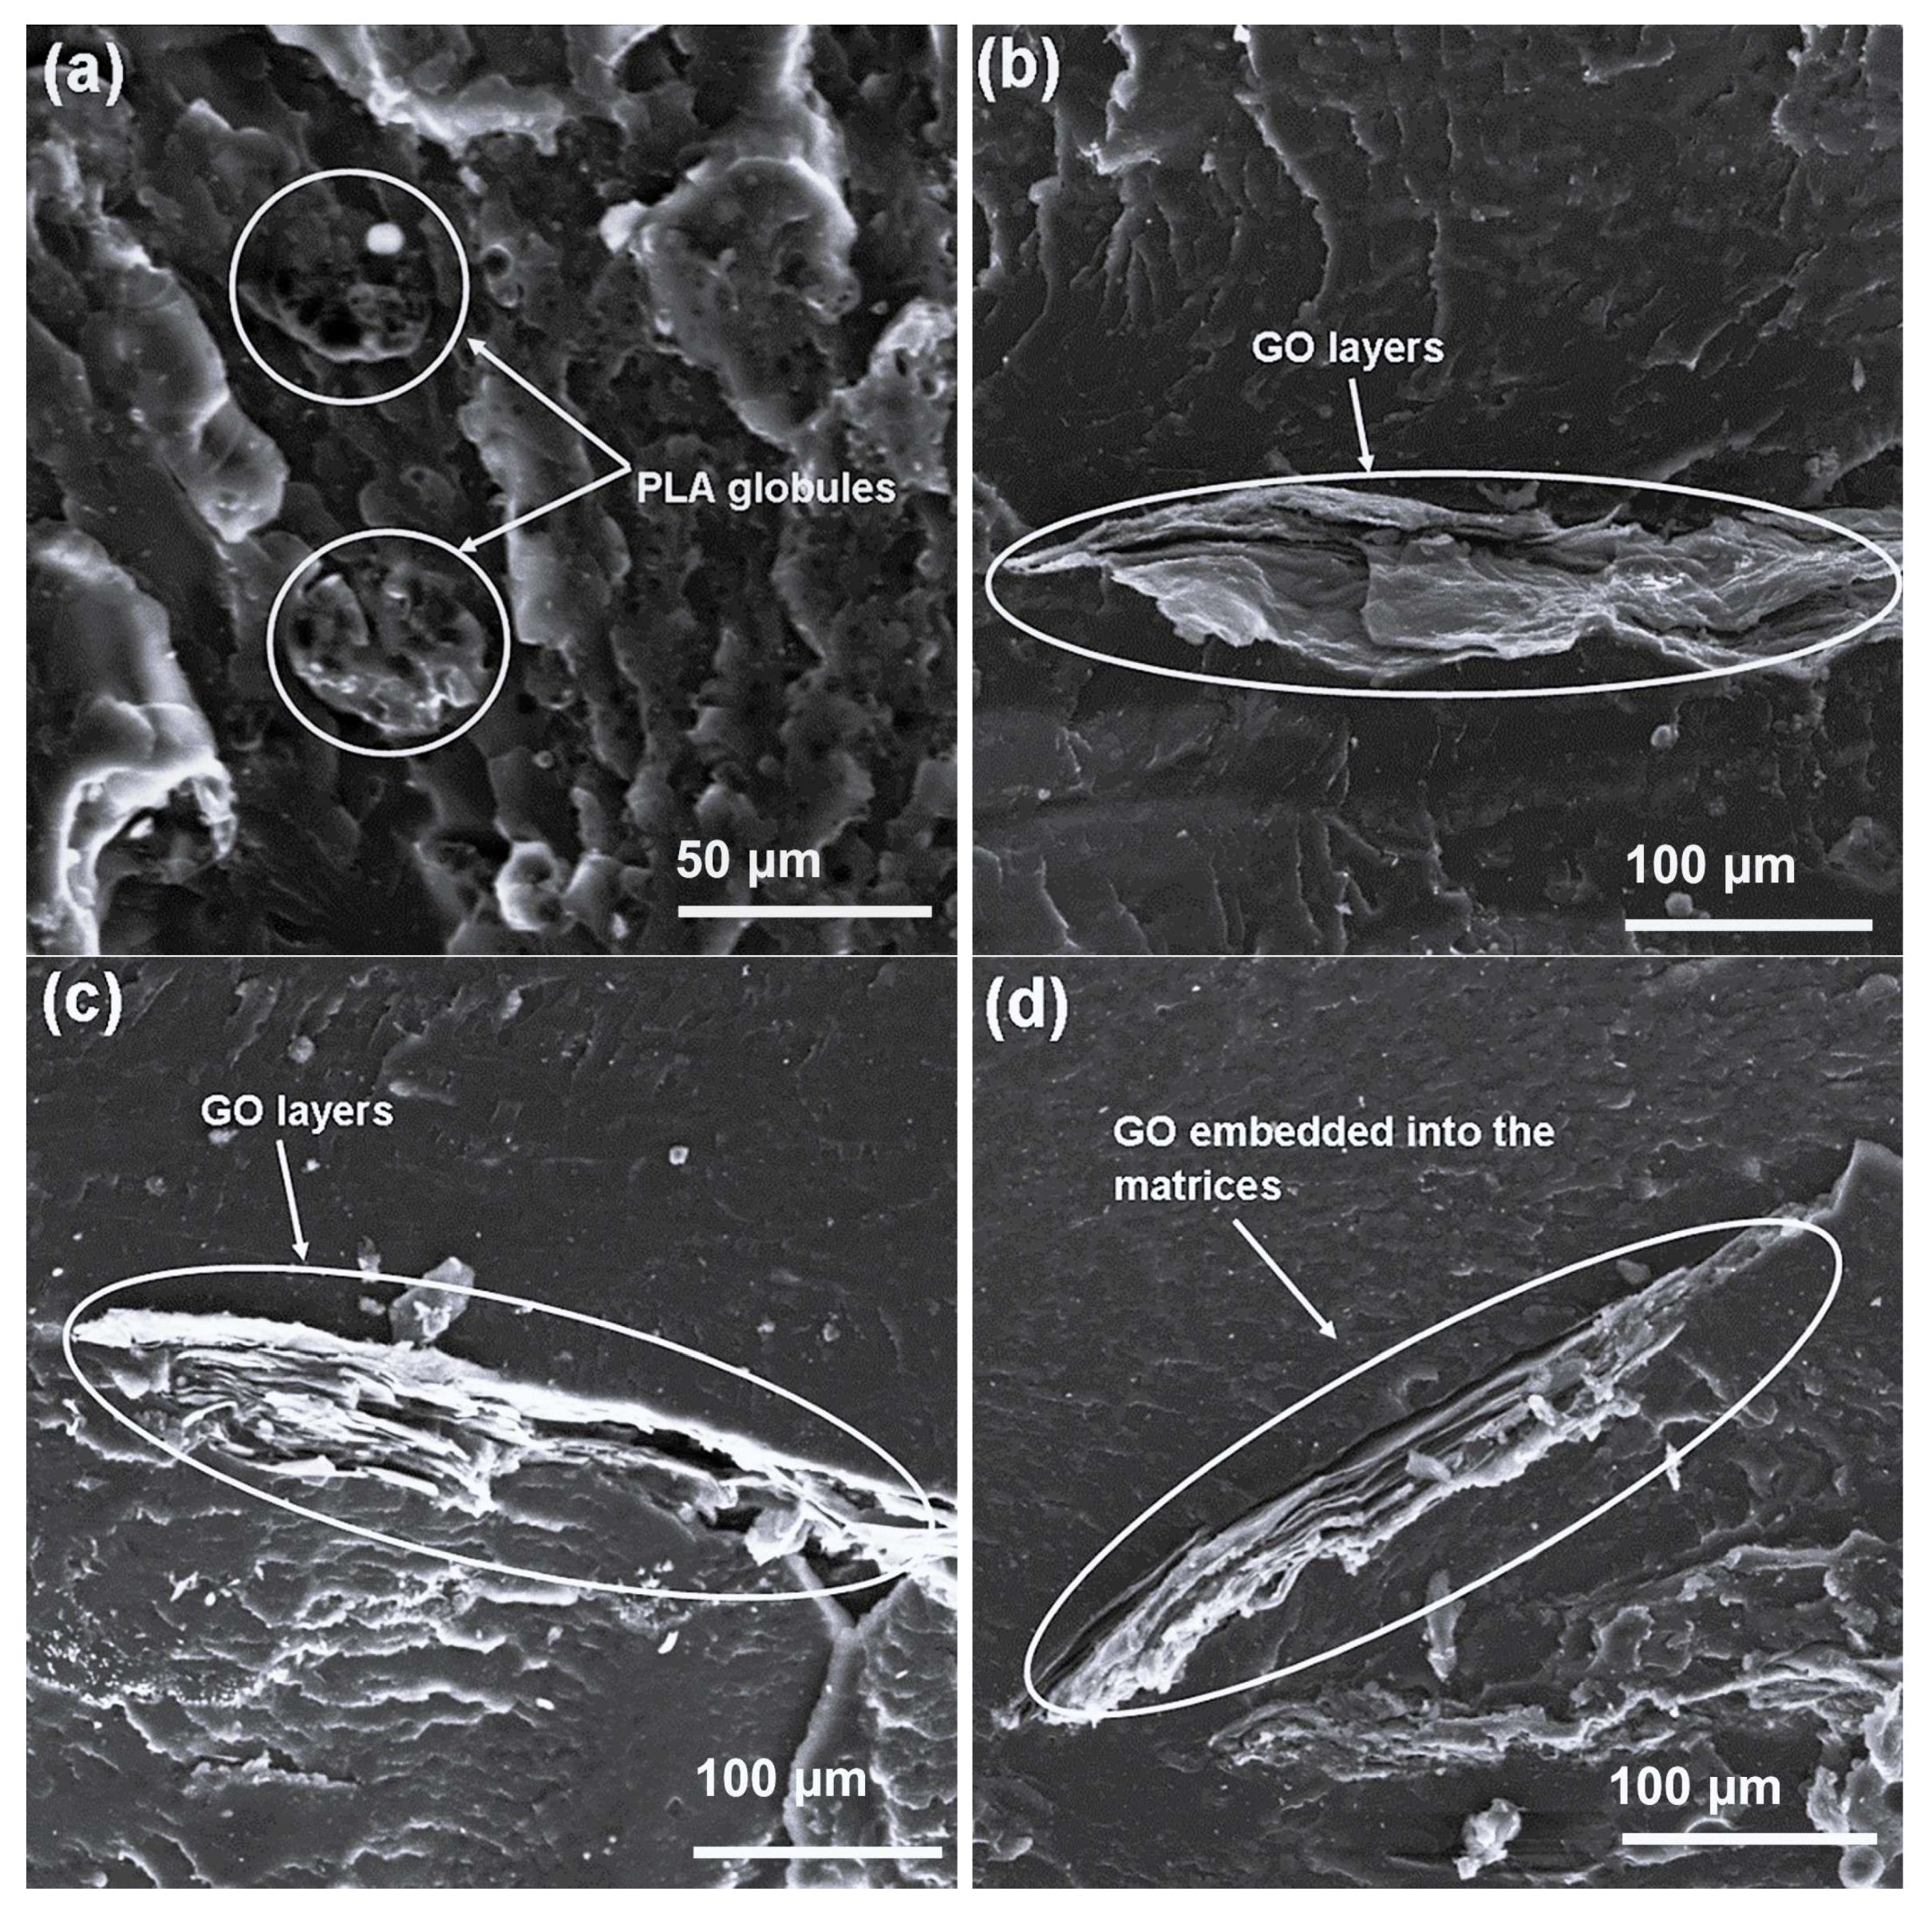
SEM analysis was carried out to examine the morphology, phase distribution, and interfacial interactions within the prepared PLA/EVA blends and their GO-reinforced composites. Micrographs were captured at magnifications of 200×, 500×, and 1000× to reveal both macro- and microscale features of the blend phases and the effect of GO incorporation.
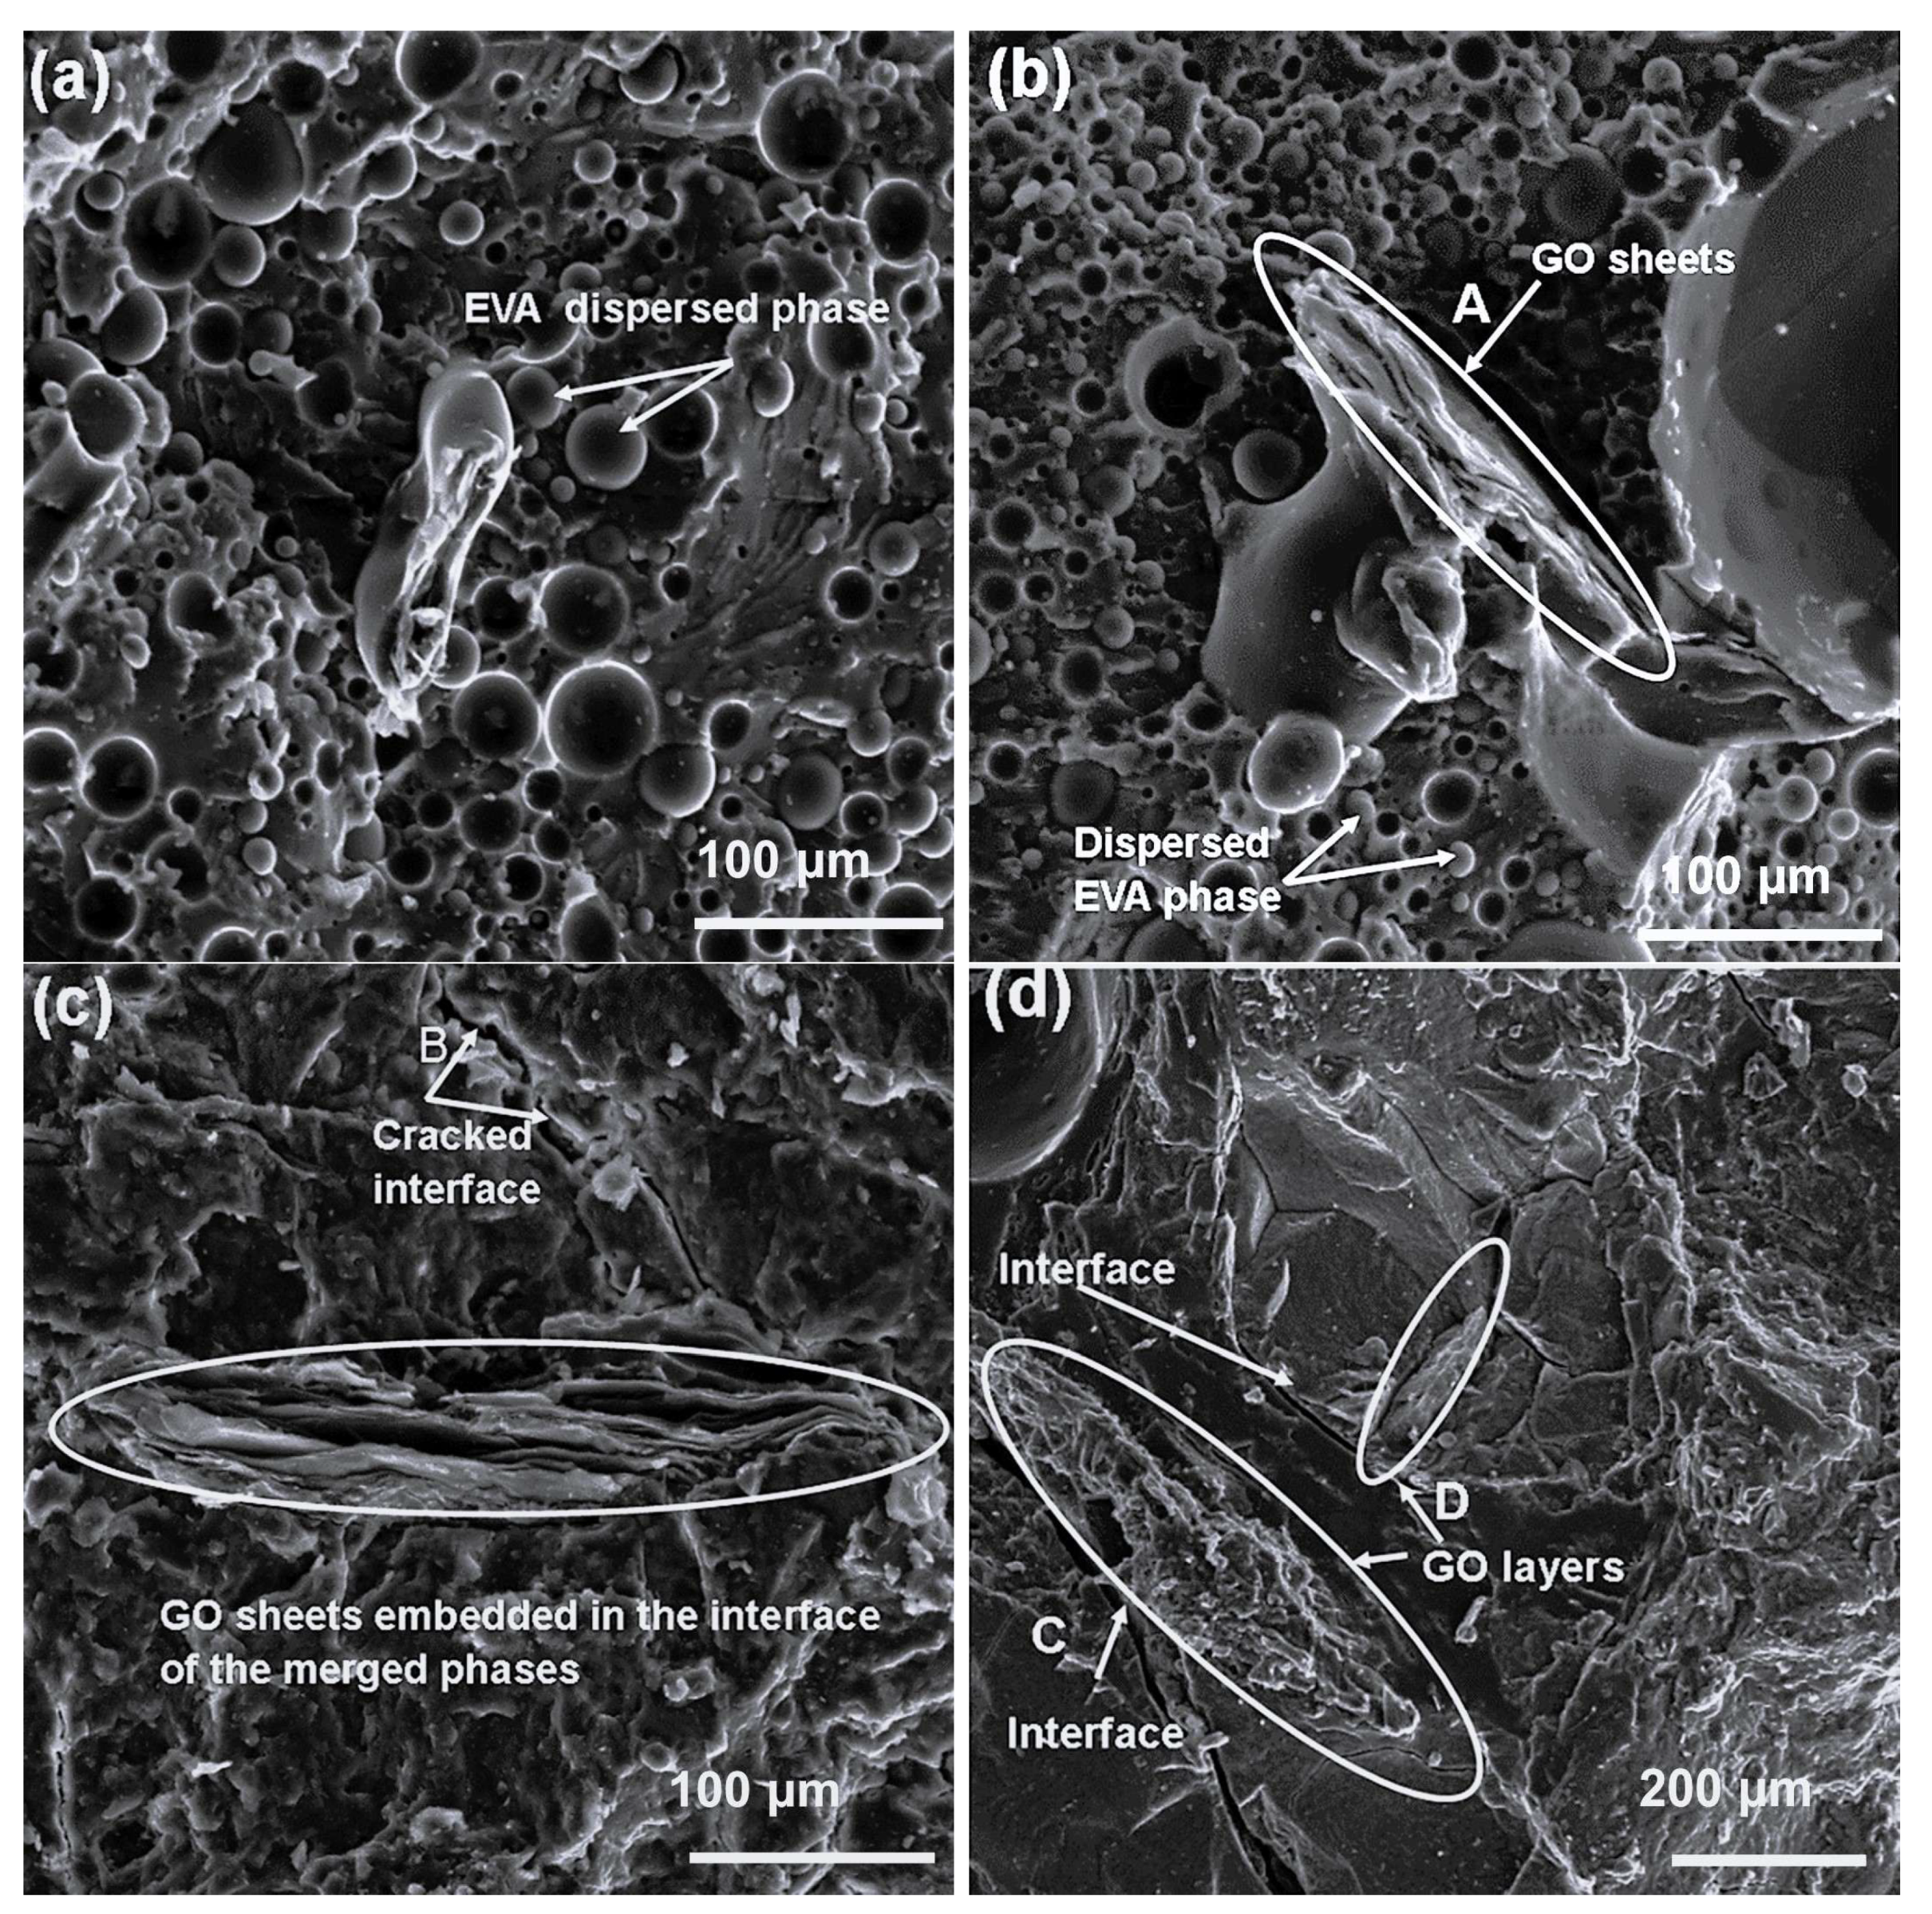
Figure 5,
Figure 6 and
Figure 7 display the respective SEM micrographs of 70/30 (
Figure 5), 50/50 (
Figure 6), and 30/70 (
Figure 7)
w/
w PLA/EVA blends and their composites with 1, 3, and 5 wt.% GO loadings.
The SEM image of the 70/30
w/
w PLA/EVA blend (
Figure 5a) showed a noticeable phase-separated morphology, where PLA formed the continuous matrix and EVA appeared as dispersed domains. This is consistent with the immiscible nature of the two polymers. Upon incorporation of 1 wt.% GO to this blend (
Figure 5b), graphene oxide platelets were visibly located along the interphase of the two polymers, as arrow A depicts. Such interfacial localization usually suggests that GO acts as a compatibilizer, working to reduce interfacial tension between PLA and EVA phases. At higher GO loadings of 3 and 5 wt.% (
Figure 5c and
Figure 5d, respectively), SEM images revealed more uniform dispersion of GO within the blend, with platelets embedded in the matrices, and an inability to distinguish between the polymer phases. Minor gaps and surface cracks (arrows B and C) were visible, which can be attributed to the inherent brittleness of PLA. However, the reduced visibility of distinct polymer phases at these loadings is an indicator of enhanced interfacial adhesion and improved compatibility, induced by GO addition. Although the cracks could suggest weak local bonding, their presence may facilitate water molecule diffusion during absorption tests, thereby influencing the composites’ performance in water purification applications.
The 50/50 PLA/EVA blend (
Figure 6a) exhibited a co-continuous morphology, where both polymers formed interpenetrating networks. The absence of noticeable interfacial gaps suggests improved miscibility at this blend ratio, possibly due to increased molecular interdiffusion facilitated by balanced phase viscosities. With the addition of 1–5 wt.% GO contents to this blend, the GO sheets appeared fully embedded within the matrices (
Figure 6b–d), and no cracks or voids were visible. The GO layers were discernible, which confirms the preservation of their exfoliated sheet structure. Arrows A and B mark the regions where GO platelets are homogeneously distributed and strongly anchored within the polymers, evidencing effective stress transfer bridges that are likely to improve mechanical cohesion.
For the 30/70 blend (
Figure 7a), SEM micrographs indicated a clear phase-separated morphology, with EVA forming the continuous phase and PLA appearing as dispersed globular regions (arrow A). This inversion of the phase structure relative to the 70/30 blend confirms that PLA’s phase behavior inverts with decreasing blend content. When GO was incorporated at 1–5 wt.% contents (
Figure 7b–d), its flakes were observed in a sheeted configuration embedded along the polymer interfaces. The absence of interfacial gaps or cracks, unlike in the 70/30 composition, demonstrates the ductile character of the EVA-rich matrix and further supports the compatibilizing effect of GO. Collectively, SEM analyses across all blend ratios highlight that GO not only disperses effectively but also promotes improved phase adhesion between PLA and EVA. This interfacial reinforcement effect becomes particularly pronounced at 50/50 and 30/70 compositions, where enhanced co-continuity and reduced brittleness were evident.
3.5. Water Absorption Behavior of PLA/EVA Blends and PLA/EVA/GO Composites
Water absorption analyses were conducted to evaluate the extent to which the prepared blends and their GO-filled composites absorbed water, as an indicator of their hydrophilicity and potential affinity toward aqueous lead ion environments.
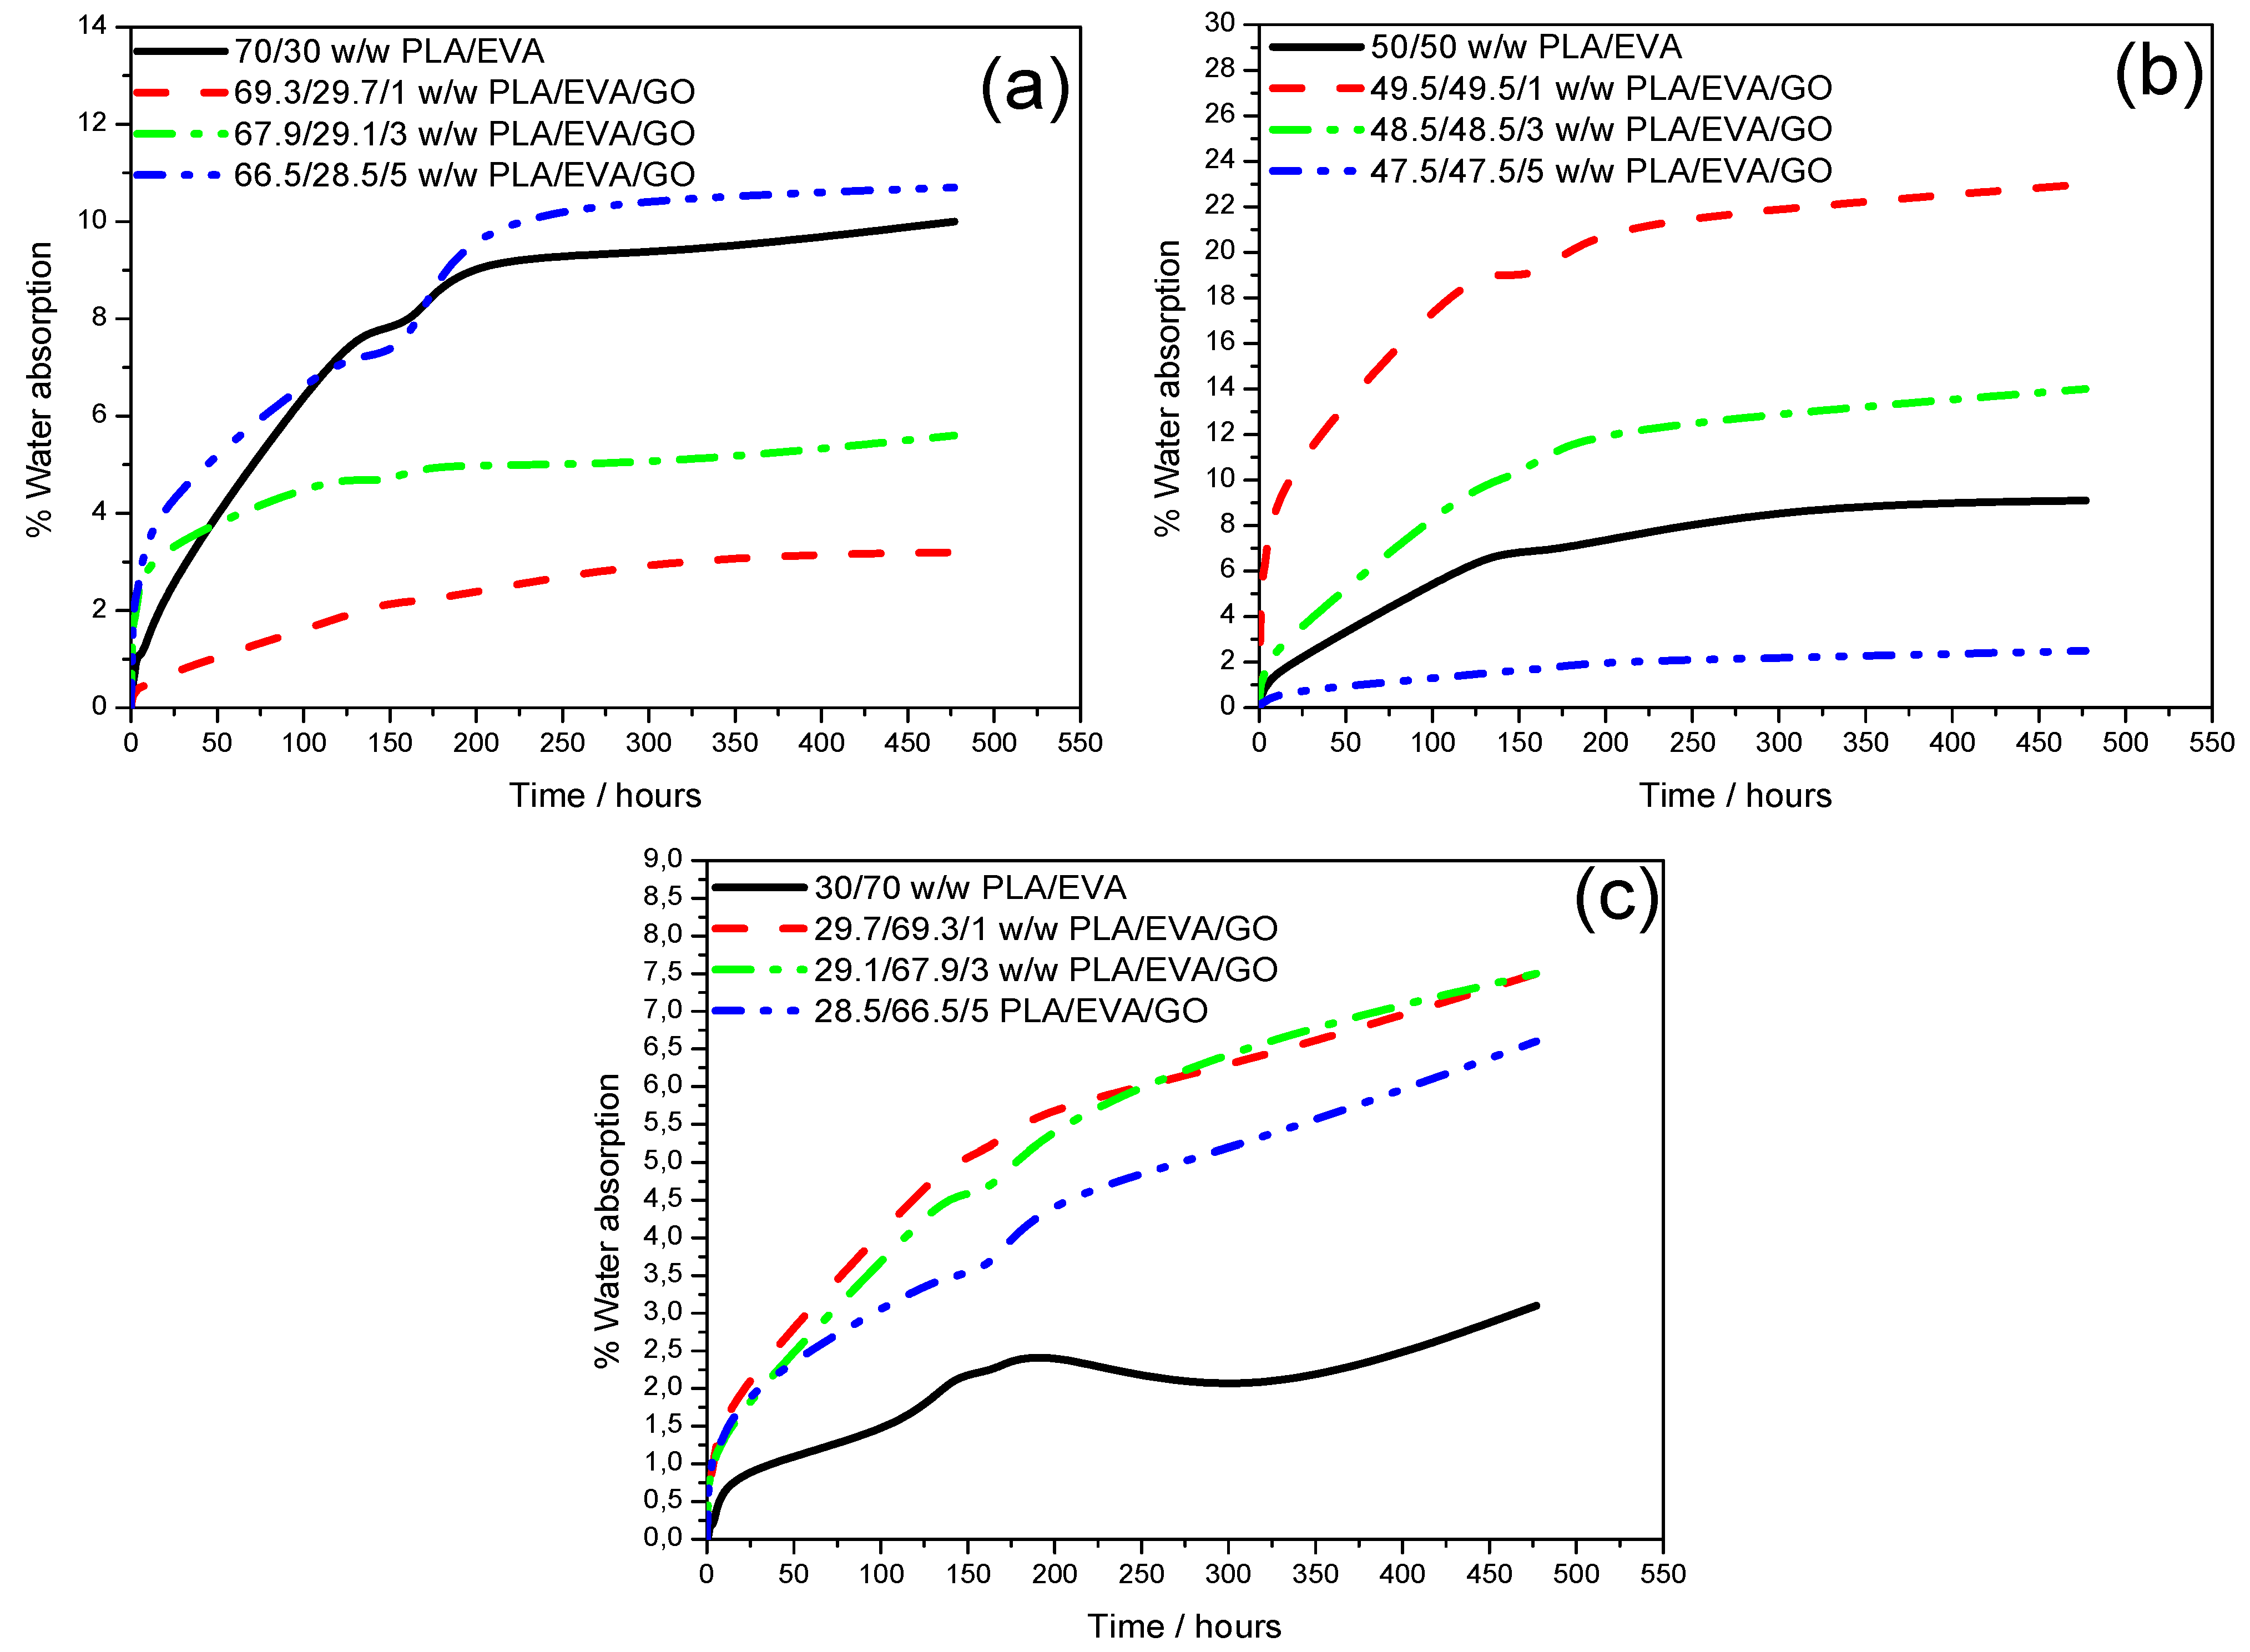
Figure 8 presents the water uptake curves for the 70/30 (
Figure 8a), 50/50 (
Figure 8b), and 30/70 (
Figure 8c)
w/
w PLA/EVA blends, and their corresponding GO-reinforced composites, while
Table 2 summarizes the percent water absorbed at selected time intervals and the recorded maximum uptake values.
The penetration of water into polymeric materials generally proceeds via diffusion into the free volumes, microcracks, or voids between phases, and capillary transport. In the current polymeric system, diffusion and micro-crack absorption mechanisms are considered dominant due to the partial hydrophilicity imparted by PLA and oxygenated GO functionalities, as well as the cracks and voids observed in SEM analyses. Across all samples, water absorption increased steadily over time and reached a saturation point, after which equilibrium was attained, indicating complete pore and interfacial filling.
The 70/30
w/
w PLA/EVA blend (
Figure 8a,
Table 2) exhibited a maximum water intake of approximately 10.0%. On initial GO addition (1 wt.%) to this blend, the maximum water uptake sharply decreased to around 3.2%, attributed to the uniform dispersion of GO along interfacial regions that effectively sealed microvoids (as confirmed by SEM). At 3 wt.% and 5 wt.% GO loadings, the maximum water absorption increased to 5.5% and 10.7%, respectively, exceeding that of the neat blend. This reversal is likely due to the formation of small interfacial cracks and voids at higher GO content, which facilitated water diffusion into the composite structure. Consequently, for the 70/30 blend, maximum water absorption was found to proportionally increase with an increase in GO loading. The 50/50
w/
w PLA/EVA blend (
Figure 8b,
Table 2) exhibited a maximum water absorption of 9.1%. Unlike in the 70/30
w/
w system, the addition of GO yielded an inverse correlation between GO loading and water uptake, with maximum values of 23.0%, 13.9%, and 2.5% for 1, 3, and 5 wt.% GO, respectively. The high water absorption at low GO loading (1 wt.%) likely stems from open GO layers and accessible interfacial sites that enable capillary water ingress, as seen from SEM results. The subsequent decline with increasing GO contents suggests that strong interfacial adhesion and polymer–GO interactions restricted free-volume diffusion. For the EVA-rich 30/70
w/
w PLA/EVA blend (
Figure 8c,
Table 2), the maximum water uptake of 3.1% was the lowest among all compositions, reflecting the hydrophobic and sealing nature of EVA, which restricts water passage through PLA’s amorphous phases. Adding GO to this blend generally increased the maximum water absorption to nearly 7.0% across 1–5 wt.% loadings. This rise may be associated with the inherent water-affinity of GO due to its oxygenated functional groups and its layered morphology, allowing intercalation of water molecules. Furthermore, SEM micrographs revealed well-embedded GO sheets and strong interfacial adhesion, implying that increased water interaction is mainly surface-driven rather than a result of structural weakness.
Comparing across all blend ratios, the highest maximum water intakes were recorded for the composites that contain 1 wt.% GO in the 50/50 blend (23.0%), 3 wt.% GO in the 50/50 blend (13.9%), and 5 wt.% GO in the 70/30 blend (10.7%). These results suggest that both blend morphology and filler concentration jointly influence water sorption. Systems with interfacial cracks or exposed GO layers absorb more water, whereas well-compatibilized systems exhibit restricted diffusion. The insights from water absorption testing are important for identifying composites most suitable for lead ion adsorption, whereby higher water-intake composites are expected to promote enhanced ion diffusion and overall adsorption efficiency in aqueous systems.
3.6. Adsorption of Pb(II) Heavy Metal Ions
Atomic Absorption Spectroscopy (AAS) was used to evaluate the adsorption efficiency of the synthesized GO and PLA/EVA/GO w/w composites toward Pb(II) ions in water. The analyses in this regard primarily focused on the compositions exhibiting high water uptake, which are 66.5/28.5/5, 49.5/49.5/1, 48.5/48.5/3, 47.5/47.5/5 w/w PLA/EVA/GO composites, as these were anticipated to provide higher active surface availability. Three parameters were systematically investigated: initial Pb(II) concentration, pH, and contact time. Their choice was to outline the adsorption mechanism and optimize conditions for maximum removal efficiency, as a stepwise approach to environmental remediation.
3.6.1. Effect of Initial Concentration
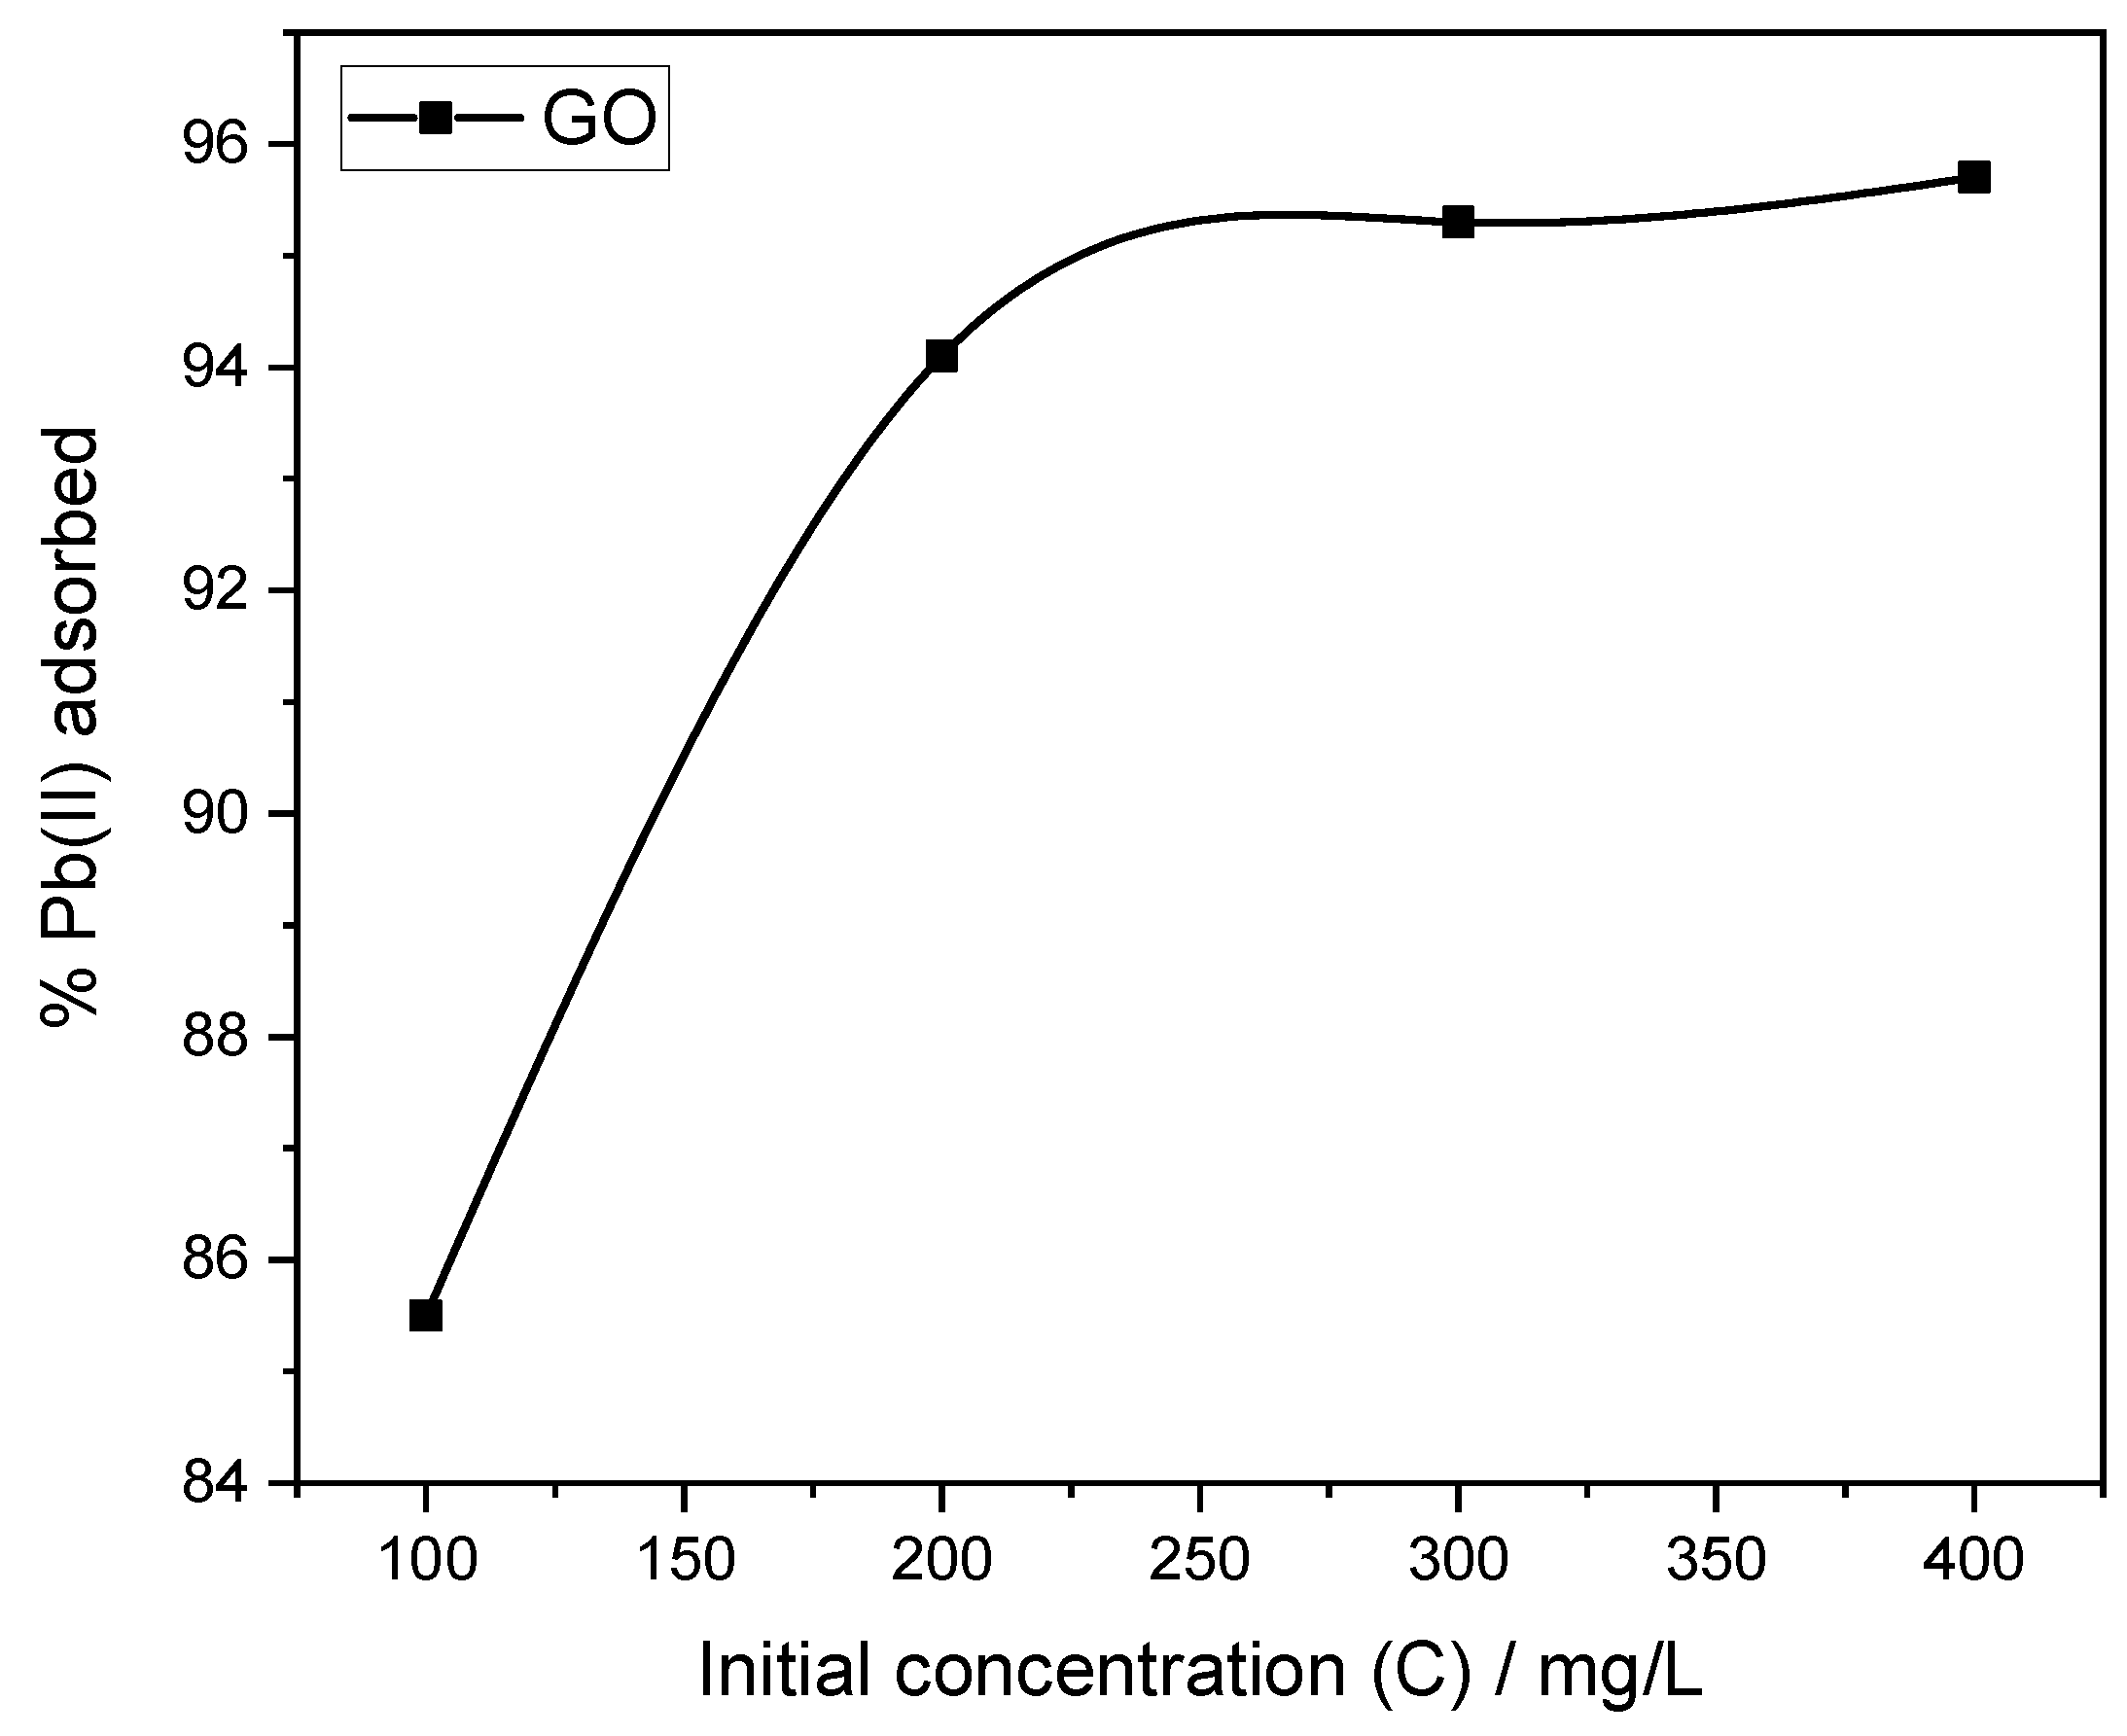
As GO is the main adsorbent in the system, the effect of initial Pb(II) concentration was evaluated using GO powder alone, at 100, 200, 300, and 400 mg L
−1 solutions, to allow for the isotherm modeling of the adsorption process. As
Table 3 shows, adsorption increased sharply with initial lead ion concentration, reaching 95.7% removal at 400 mg L
−1. The relationship between initial concentration and percentage adsorption followed a logarithmic growth trend (
Figure 9), indicating that as Pb(II) concentration increased, the number of available ions exceeded surface saturation thresholds, thereby promoting both chemisorption and physisorption processes. Our previous work [
18] on the effectiveness of neat GO in lead ion removal from water arrived at similar findings, where the chemical complexation of Pb(II) with GO’s hydroxyl and carboxyl sites dominated at higher ion concentrations. Accordingly, 400 mg L
−1 was selected as the standard concentration for subsequent pH and contact time analyses.
3.6.2. Effect of pH
The media in which adsorption took place profoundly influenced Pb(II) adsorption efficiency. Here, measurements were taken at acidic (pH 3) and basic (pH 12) conditions using the four target composites, and results are summarized in
Table 4. Additionally, one composite with low water absorption (69.3/29.7/1
w/
w PLA/EVA/GO) was tested as a control to discern the relationship between hydrophilicity and adsorption behavior, for these analyses only. In all cases, the adsorption capacity increased under basic conditions. For instance, the 66.5/28.5/5
w/
w PLA/EVA/GO composite achieved the highest removal efficiency of 97.5% at pH 12, and 94.9% at pH 3. Comparable improvements were also observed for the 49.5/49.5/1, 48.5/48.5/3, and 47.5/47.5/5
w/
w PLA/EVA/GO composites, with removal efficiencies ranging between 96.6 and 96.9% under basic conditions, and 93.6 and 94.9 in acidic media (ph3). The pH-dependent enhancement suggests that electrostatic interactions and complexation drive Pb(II) adsorption in basic media. To elucidate, there is a synergistic interaction between abundant hydroxyl (OH-) groups and oxygen-containing functional groups on GO, in basic media, creating additional binding sites. In contrast, under acidic conditions, dominating hydronium ions compete with Pb(II) for these sites by protonating the oxygen-containing groups, thereby reducing their metal binding efficiency. Interestingly, even the control composite (69.3/29.7/1
w/
w PLA/EVA/GO), which possessed the lowest water absorption, demonstrated high Pb(II) adsorption (96.9% at pH 12, 94.9 at pH 3). This brings the idea that while water uptake partakes in facilitating ion diffusion, other factors like the type and accessibility of oxygenated groups, interfacial surface exposure, and GO dispersion, play equal or greater roles in determining adsorption performance.
3.6.3. Effect of Contact Time
Table 5 shows the results obtained during the effect of contact time measurements, conducted over a 240 min period, and
Figure 10 shows the adsorption capacity versus time graphs. For all tested composites, there was an initial rapid increase in adsorption for 180 min before plateauing, reflecting the equilibrium phase typical of diffusion-controlled processes. The rate and capacity of adsorption were the highest within the first 180 min, where abundant active sites were still available. Beyond the 240 min mark, negligible further uptake occurred, implying that the adsorption sites were nearing saturation. Among the tested samples, the 66.5/28.5/5
w/
w PLA/EVA/GO composite had the highest final removal efficiency (97.5%) despite reaching saturation faster than others (lower adsorption capacity). This could be attributed to the GO content at this composition, which provides numerous binding sites through exposed GO flakes with surface cracks to promote enhanced adsorption. Overall, the influence of time was more pronounced on the adsorption rate than on capacity.
3.6.4. Isotherm Modeling of the Adsorption Process
To elucidate the adsorption mechanism, the equilibrium data were analyzed using the Freundlich and Langmuir isotherm models.
Freundlich Isotherm
The Freundlich plot for GO is shown in
Figure 11, and the calculated constants are presented in
Table 6. This plot displayed a fit with a correlation coefficient (R
2) value of 0.9506. Should the model provide a better fit, it would suggest a heterogenous adsorption process with differing adsorption site affinities. The calculated Freundlich constants, n = 1.760, 1/n = 0.5683, confirmed favorable adsorption behavior, consistent with surface coverage typical of partially oxidized GO adsorbents.
Langmuir Isotherm
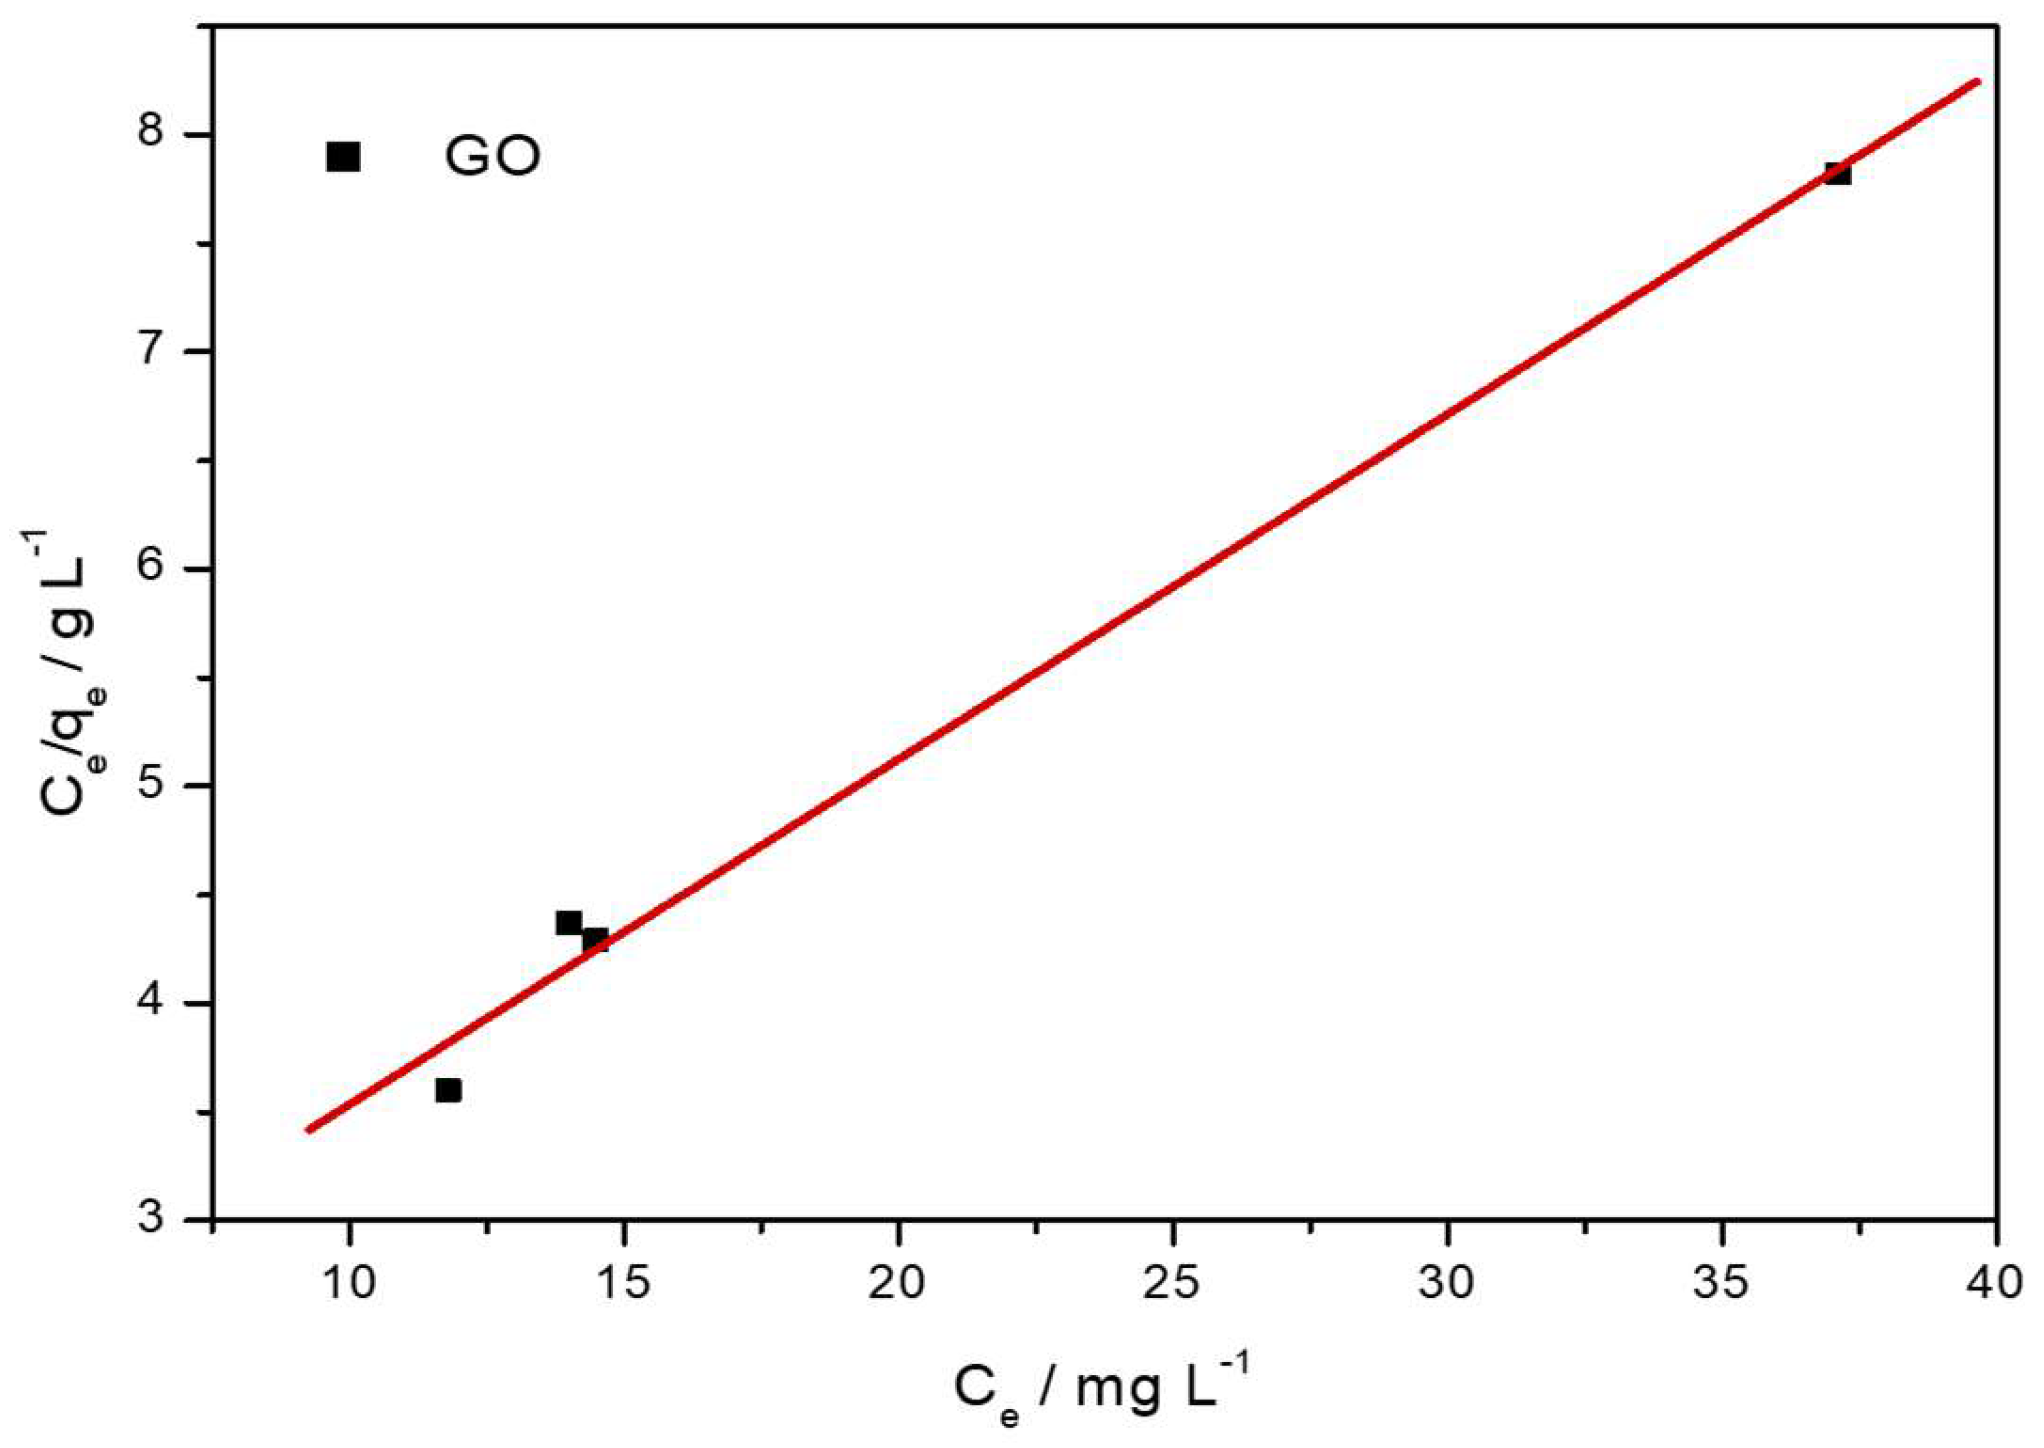
Figure 12 shows the fit for the Langmuir model, and the calculated constants for this isotherm are given in
Table 7. It is evident that this model exhibited a better fit and higher correlation coefficient (0.9958) than the Freundlich isotherm model, suggesting a predominant monolayer adsorption process on uniform sites. The calculated maximum adsorption capacity (Q
m) of 6.29 mg g
−1 and the separation factor (R
L) of 0.1089 provided further confirmation of the favorability of Pb(II) uptake under the studied conditions. Such a strong correlation with the Langmuir isotherm model usually implies a monolayer chemisorption process, where the surface interaction between Pb(II) ions and oxygen-containing functional groups is dominant.
GO thus acted as a primary active phase, with the PLA/EVA matrix providing structural support, hydrophilicity control, and diffusional pathways, ergo, prolonging adsorbent lifespan and effectiveness.
4. Conclusions
This study has successfully demonstrated the preparation and performance evaluation of graphene oxide (GO) filled polymer composites designed for the removal of lead from water. GO was synthesized from EG using Hummer’s method, and its successful oxidation and functionalization were comprehensively confirmed by FTIR, XRD, and SEM-EDS analyses. Findings from these analyses validated the formation of oxygenated functional groups and structural disorder characteristic of GO, essential for its metal ion binding efficacy.
PLA/EVA blends and PLA/EVA/GO composites were fabricated by melt mixing to enhance the processability, stability, and recyclability of GO as an adsorbent. Morphological analysis revealed that, while PLA and EVA were largely immiscible, the inclusion of GO improved interfacial interactions, imparting partial compatibilization and reducing distinct phase separation, particularly at balanced blend ratios. The localization of GO at the PLA/EVA interphase confirmed its dual role as a compatibilizing filler and functional adsorbent phase.
Water absorption studies emphasized the interplay between morphology, blend ratio, and GO loading. The 50/50 w/w PLA/EVA composition exhibited the highest and most stable water uptake without hydrolytic degradation, showing the structural durability of the system and superior potential for aqueous applications. In contrast, the 70/30 and 30/70 ratios displayed morphology-dependent water behavior, where increased cracks and voids boosted diffusivity and created additional pathways for water and metal ion penetration.
Pb(II) adsorption tests performed via AAS confirmed high removal efficiencies (>94%) across all composites under varying conditions of pH and contact time. Optimal performance (97.5%) was achieved with the 66.5/28.5/5 PLA/EVA/GO composite after 240 min in basic medium (pH 12). The superior result was attributed to a high GO content, the presence of cracks acting as active sorption sites, and accessible oxygenated functionalities enabling both physical and chemical adsorption. Isotherm modeling indicated that the adsorption process followed the Langmuir model (R2 = 0.9958), demonstrating monolayer adsorption on a homogenous surface.
Collectively, these findings establish PLA/EVA/GO composites as sustainable and efficient adsorbents for the remediation of lead-contaminated water. The work provides a strategic framework for extending the application lifespan of GO through polymer encapsulation, combining structural stability, reusability, and high adsorption capacity. Beyond environmental remediation, the design principles demonstrated here contribute valuable insights into the development of biodegradable polymer–nanocomposite systems for advanced water treatment processes. Future studies should expand on adsorption kinetics, regeneration performance, and applicability in real wastewater systems to validate large-scale deployment potential for eco-friendly water purification technologies.
