Article

Numerical Study of Pulsation-Controlled Droplet Generation in a Microfluidic T-Junction

by
Alibek Kuljabekov
1,*,
Darezhat Bolysbek
1,
Zhibek Akasheva
2 and
Zhumabek Zhantayev
1
1
Institute of Ionosphere, 117 “Ionosphere”, Almaty 050020, Kazakhstan
2
Laboratory “Modelling in Energy Sector”, Satbayev University, Almaty 050013, Kazakhstan
*
Author to whom correspondence should be addressed.
Processes 2025, 13(11), 3690; https://doi.org/10.3390/pr13113690 (registering DOI)
Submission received: 6 October 2025 / Revised: 2 November 2025 / Accepted: 10 November 2025 / Published: 15 November 2025
(This article belongs to the Section Process Control and Monitoring)

Abstract

Droplet generation in microfluidic T-junctions is a key process in various chemical and biomedical applications requiring precise size and frequency control. This study presents a numerical investigation of pulsation-controlled droplet formation using a two-phase incompressible laminar flow model with constant surface tension and defined wettability. Simulations were conducted in COMSOL Multiphysics employing the Level Set method, and the model was validated against the benchmark data of Bashir et al., accurately reproducing droplet pinch-off time and morphology under steady co-flow conditions. Pulsatile inlet velocity was then introduced to analyze its influence on droplet dynamics. Results show that at frequencies between 35 and 60 Hz, droplet generation becomes synchronized with the pulsation cycle, producing one droplet per period. Beyond 60 Hz, synchronization is lost, leading to irregular breakup and loss of droplet size control. The droplet length exhibited an approximately linear dependence on pulsation frequency, indicating predictable and tunable droplet formation. These findings demonstrate that simple modulation of the dispersed-phase velocity enables droplet-on-demand operation and robust control of droplet size and generation rate in standard microfluidic T-junctions.

1. Introduction

Droplet-based microfluidics has revolutionized the manipulation of small fluid volumes by enabling precise control over droplet formation, transport, mixing, and analysis. In such systems, discrete droplets of a dispersed phase are generated within a continuous carrier fluid, offering benefits such as reduced reagent consumption, high throughput, and isolation of reactions [1].
Among microfluidic droplet generators, T-junction geometries are among the simplest and most widely used due to their ease of fabrication and robust performance (Figure 1). In a typical T-junction, a dispersed-phase input meets a continuous-phase channel orthogonally; droplets form as the continuous-phase shear force overcomes interfacial tension and pinches off segments of the dispersed stream [2]. Despite their utility, T-junction systems under steady flow exhibit a coupling between droplet size and generation frequency; increasing dispersed-phase flow produces more droplets but usually larger ones, limiting flexibility for many applications [2].
To improve tunability, both passive and active control strategies have been developed. Passive methods include modulation of channel geometry (e.g., introducing grooves, narrowing channels, or using gutters) to locally alter shear or pressure. For example, introducing “junction gutters” in a T-junction can change local flow patterns and thus modify droplet formation behavior [3]. However, design changes are fixed and cannot respond dynamically to changing requirements.
Active methods introduce external actuation (electrical fields, acoustic waves, magnetic fields, thermal gradients, or mechanical pulsation) to manipulate droplet formation in real-time. Electrical modulation has been used to dynamically adjust interfacial stress and droplet behavior [1]. More recently, combining pulsatile flow with passive geometries has shown promise in stabilizing unsteady operations such as mixing and droplet breakup [4].
Among active strategies, the application of pulsatile or oscillatory flow is particularly appealing because it adds no extra components to the microchannel and directly modulates the hydrodynamics. Pulsatile flow can be characterized by its amplitude, frequency, and waveform superimposed on a time-averaged base flow. Dincau et al. (2020) reviewed the use of pulsatile forcing in microfluidic systems, including droplet generation, mixing enhancement, and clog mitigation [5]. They emphasize that in low-Reynolds-number flows, oscillatory components can increase effective transport lengths without requiring high pressures, and may enhance control over interfacial phenomena.
Some studies have already applied pulsatile forcing to droplet systems. Zhang et al. (2021) performed numerical simulations of a T-junction under sinusoidally varying continuous-phase flow and observed synchronization effects, sub-harmonic droplet patterns, and size modulation [6]. Kovalev et al. (2024) experimentally imposed sinusoidal pulsations of the dispersed-phase in a T-junction channel and demonstrated modulation of plug lengths (droplet lengths DL) and transitions from parallel flow to droplet formation depending on forcing conditions [7].
Droplet microfluidics relies on co-flowing immiscible fluids to generate uniform droplets or plugs within microchannels. In passive T-junction devices, for example, droplet breakup is governed by capillary and viscous forces, giving rise to well-known squeezing, dripping, and jetting regimes. In the low-capillary-number (squeezing) regime, Garstecki et al. (2006) showed that droplet length scales with the flow-rate ratio, independent of interfacial tension [2]. However, this passive operation inherently couples droplet size to the imposed flow conditions—one cannot independently tune droplet volume and generation frequency under steady inputs. As Kovalev et al. (2024) note, “with passive droplet generation methods, the control of droplet size and generation frequency independently is unattainable” [7]. In other words, in a fixed T-junction geometry under continuous flow, increasing throughput automatically reduces droplet size, since both are set by the same pressure or flow-rate conditions.
To overcome this limitation, active control methods have been developed to decouple droplet volume from production rate. For example, embedding a piezoelectric actuator on-chip can perturb the flow and pinch off droplets with high regularity: Bransky et al. (2009) used a piezoelectric diaphragm in a T-junction to produce highly uniform droplets by disturbing the flow of the dispersed phase [8]. Cheung and Qiu (2011) similarly applied ultrasonic vibration to a flow-focusing junction, showing that acoustic perturbations at the nozzle can actively trigger droplet breakup [9]. They found that increasing the continuous-phase viscosity dampens the effect of vibration and that the perturbation frequency itself influences the droplet-generation process. In short, active oscillatory forcing can “generate pulsations” that control droplet pinch-off dynamics (e.g., streamlining vortices in the neck) and synchronize droplet detachment with the actuation signal.
Pulsatile Inflow and Droplet Synchronization. Instead of embedding a piezo element, one can simply apply a pulsatile inflow via external pump signals or oscillatory devices to achieve on-demand droplet production. Early studies showed that a periodic modulation of one inlet’s pressure or flow rate can lock droplet formation to the pulsation [6,9]. In flow-focusing devices, Oléron et al. (2025) demonstrated that applying a positive pressure pulse at the dispersed-phase inlet produces a single droplet per pulse and “decouples volume and production rate” [10]. Their pulsed strategy allowed formation of elongated plugs by temporarily entering the jetting regime, and a simple hydraulic-resistance model captured the droplet volumes. Crucially, because the droplet generation is triggered by each pulse, the droplet frequency Sripadaraja can match the pulse frequency over a wide range.
The idea that pulsation frequency controls droplet ejection is echoed in T-junction studies. For instance, Sripadaraja et al. (2020) found via CFD that long pulse durations yielded two smaller droplets per period, whereas short pulses yielded one droplet per cycle [11]. Kovalev et al. (2024) experimentally studied sinusoidal pulsations of the dispersed-phase flow in a T-junction [7]. By tuning the pulse frequency relative to the natural droplet frequency, they observed a variety of droplet-size distributions: at low dimensionless frequencies (pulse frequency ≪ natural breakup frequency), the plug lengths became multi-modal, whereas at higher frequencies a “drop-on-demand” mode appeared with one drop per pulse. In other words, when the pulse frequency matches or exceeds the natural generation rate, each pulse cleanly pinches off one droplet, giving a uniform train. Kovalev et al. report that the pulsation effect was especially pronounced at low pulse-to-nat-frequency ratios and for high viscosity ratios. Thus, the pulsation frequency itself emerges as a critical parameter for controlling both droplet size and generation rate.
Continuous-Phase Pulsation. An alternative is to pulsate the continuous (carrier) phase instead of the dispersed phase. Zhang et al. (2019) showed that oscillating the continuous oil flow into a T-junction can similarly synchronize droplet formation and even allow droplets of very different viscosities to form in phase [12]. In their “pulsating continuous-phase flow” scheme, an elastic diaphragm created a single periodic perturbation in the oil flow, effectively gating the incoming dispersed fluid. This one-perturbation source “decouples droplet size, generation frequency, and fluid properties,” allowing droplet volume to vary linearly with flow rate across viscosities of 1–60 cP. Mudugamuwa et al. (2024) likewise note that in synchronous regimes the droplet frequency can be “entirely correspond[ed] to the external pulsation frequency,” producing highly monodisperse droplets over wide viscosity ranges [13]. In fact, Zhang et al. reported droplet ejection frequencies up to 3.3 kHz (104 Hz) by piezo actuation in a flow-focusing chip. These studies highlight that active pulsation of the continuous phase is an effective route to on-demand droplet generation: once synchronized, the droplet train simply follows the chosen pulse frequency [6].
Recent advances in intelligent control and data-driven modeling have also influenced microfluidic research. Sun et al. (2024) proposed a novel in situ calibration framework for complex thermal systems using virtual samples and an autoencoder-based neural model [14]. Their study demonstrated that integrating stochastic Monte Carlo sampling with machine-learning reconstruction enables accurate calibration under uncertain and nonlinear conditions. This approach represents a broader trend toward self-correcting, adaptive systems, in which real-time feedback and virtual-sample generation improve system reliability and energy efficiency.
Complementary to data-driven strategies, recent works have focused on multi-field coupling effects for active flow manipulation. For example, research on microreactors with ultrasonic control has revealed that combined acoustic and hydrodynamic fields can dynamically tune interfacial stresses and breakup behavior. Such multi-field coupling frameworks highlight how non-invasive actuation can be leveraged to achieve precise droplet manipulation and enhanced mixing at the microscale [15].
Frequency and Amplitude Effects. Prior work has explored how varying the pulsation parameters changes the droplets. Ziemecka et al. (2011) embedded a piezo disk at a T-junction and found that below ~20 Hz the droplets became irregular (polydisperse), but above ~20 Hz the system produced reproducible monodisperse drops (≤60 μm) [16]. They also noted that increasing pulse amplitude (voltage) had a relatively small effect compared to frequency. Sauret & Shum (2012) similarly used a mechanical vibrator to perturb a T-junction: they achieved uniform droplets at intermediate frequencies (5–9 Hz) and found that droplet size could be tuned by varying the pulse frequency, amplitude, and flow rates [17]. In practice, raising the pulse frequency tends to shrink droplet size and increase throughput (up to a point), since faster pulses pinch off droplets earlier. Mudugamuwa et al. (2024) emphasize that both the pulsation frequency and amplitude are “critical parameters to control droplet generation in microchannels” [13].
Droplet-on-Demand (DoD) Strategies. Microfluidic droplet-on-demand systems exploit these ideas to produce isolated droplets or programmable trains. Rather than a continuous stream, DoD methods often use active triggers—electric pulses, valves, lasers, acoustics, etc.—to release single droplets when needed. Pressure pulses are among the simplest DoD mechanisms. For example, Hamidović et al. (2020) used off-chip pneumatic pulses with a microvalve to dispense picolitre droplets for sample handling [18]. Oléron et al. (2025) specifically analyzed the regimes of droplet creation by discrete pressure pulses and confirmed that this approach can produce individual droplets of controlled size [10]. The fundamental advantage is that droplet size becomes set by the pulse characteristics (amplitude and duration), largely independent of the background flow rate. In practice, DoD allows one to “decouple size from generation frequency” entirely, enabling on-demand generation of single drops even with large inter-drop spacing.
Numerical and COMSOL Studies. Several modeling efforts have used interface-tracking simulations to understand pulsatile droplet flows. Meng et al. (2021) employed COMSOL’s laminar two-phase flow (level-set) solver to simulate droplet formation in a digital PCR chip, finding excellent agreement (within a few percent) with experiments under steady flows [19]. Similar level-set or phase-field simulations could be applied to time-varying inlet conditions. Indeed, Zhu et al. (2016) and others have used finite-element methods to study droplet pinch-off under oscillatory forcing [20]. For example, Sripadaraja et al. conducted 2D CFD of droplet breakup with a pulsatile dispersed inlet and identified subharmonic (period-n) formation modes. More recently, fluid–structure simulations have modeled compound droplets under pulsatile pressure in elastic channels [11]. These numerical studies generally confirm the experimental trend: low-frequency oscillations tend to produce complex multi-drop patterns, while high-frequency forcing yields one-droplet-per-cycle behavior.
Knowledge Gaps and the Present Work. The literature shows that pulsatile actuation can give precise control over droplet generation frequency and volume. However, most prior work has focused on flow-focusing geometries or on single-phase actuation methods. In particular, systematic studies of pulsatile two-phase flow in classic T-junctions are scarce. The complex interplay between pulsation frequency, fluid properties, and T-junction geometry remains underexplored. For example, it is not yet fully understood how a given pulsation frequency maps to droplet size in a confined two-phase flow when both phases can slip. Nor have models fully captured the transitions between one-drop, multi-drop, and continuous-jetting regimes under pulsation.
The present study addresses these gaps by examining two-phase pulsatile flows in a simple T-junction. We systematically vary the pulsation frequency of the inlet flow while observing the resulting droplet sizes and generation rates. By comparing experiments and numerical simulations, we aim to quantify how the pulse frequency alone can be used to tune droplet volume and throughput independently of mean flow rate. In doing so, this work extends the emerging paradigm of pulsatile control and droplet-on-demand towards a fundamental understanding of T-junction devices, potentially enabling new microfluidic components for programmable chemistry and assays.

2. Materials and Methods

2.1. Governing Equations and Flow Assumptions

The two-phase microfluidic flow is modeled by the incompressible Navier–Stokes equations for laminar flow, coupled with an interface tracking equation. The governing equations consist of the momentum balance and continuity equations for an incompressible, Newtonian fluid, together with a level set transport equation for the two-phase interface [21]. In the absence of any buoyancy effects (negligible Bond number at the microscale), gravitational body forces are omitted. Each fluid phase is treated as immiscible and incompressible, with constant density ρ and dynamic viscosity μ specified for the continuous and dispersed phases. These properties enter the Navier–Stokes equations as spatially varying coefficients determined by the local phase indicator: in practice, the fluid density and viscosity at any point are computed as smooth blends of the two phases’ values according to the level set function. For example, one can define ρ = ρ2 + (ρ1 − ρ2) ϕ and μ = μ2 + (μ1 − μ2) ϕ, where ϕ is the level set field varying from 0 in one fluid to 1 in the other. This interpolation creates a sharp but continuous transition in properties across the interface, helping to avoid numerical instability. The flow is assumed laminar (low Reynolds number) and isothermal, with no phase change or mass transfer between phases. The simulation is time-dependent to capture the periodic formation of droplets under pulsatile inlet flow conditions [21].

2.2. Level Set Method for Interface Tracking

To capture the moving gas–liquid interface, we employ a mass-conserving Level Set method as implemented in COMSOL’s two-phase flow interface. The level set method introduces an auxiliary scalar field ϕ(x,t) that identifies the fluid phases within a fixed Eulerian mesh. This field is defined to smoothly transition from ϕ ≈ 0 in one fluid to ϕ ≈ 1 in the other across a thin interfacial region [22]. The interface itself is implicitly represented by the 0.5 contour of ϕ. This approach effectively replaces the advection of a discontinuous fluid property with the advection of a smooth scalar field, which is more amenable to numerical solution. An important advantage of the level set formulation is that complex topological changes, like droplet breakup and coalescence, are handled naturally since the interface is not explicitly tracked but emerges from the ϕ field [22].
In our simulations, ϕ is governed by a convection–diffusion equation coupled to the flow field. The level set transport equation can be written in conservative form as:
∂ϕ/∂t + u⋅∇ϕ = γ ∇⋅(ϵ ∇ϕ − ϕ(1 − ϕ) ∇ϕ/(‖∇ϕ‖)) 
Here, u is the local fluid velocity, and the right-hand side contains two numerical stabilization terms [21]. The parameter ϵ controls the thickness of the diffuse interface region and is typically chosen based on the order of the mesh size. The first term, ∇⋅(ϵ ∇ϕ), adds a small isotropic artificial diffusion to keep the interface smooth and prevent unphysical oscillations or steep gradients. The second term, ¬∇·[−ϕ(1 − ϕ) (∇ϕ/|∇ϕ|)], is a reinitialization term that acts to sharpen the interface and counteract numerical diffusion. The coefficient γ is a reinitialization parameter that controls the balance between these effects; it is tuned to maintain a steady interface profile without affecting its physical motion. If γ is set too low, the interface thickness can grow or develop spurious oscillations, whereas an excessively large γ can overly convect the interface and distort the flow. In practice, a suitable choice for γ is on the order of the maximum fluid velocity magnitude in the system, which is consistent with recommendations for stable level set simulations [22].
This level set formulation is based on the conservative approach by Olsson and Kreiss, which improves mass conservation compared to the classical level set method. In conventional level set methods, the interface is represented by a signed distance function and advected, but there is no inherent volume conservation, leading to gradual mass loss or gain over time. The conservative level set method addresses this by treating ϕ as a smoothed characteristic function and including the compressive term that redistributes ϕ to preserve the total fluid volume of each phase. As a result, the method conserves mass more accurately, a critical requirement since the fluids are incompressible and no phase change occurs [23]. We periodically allow the level set function to reinitialize towards a signed-distance profile (implicitly via the γ-term) in order to maintain numerical robustness for high-density-ratio and high-surface-tension flows. The curvature of the interface is computed from the level set field as κ = ∇⋅n, where n = ∇ϕ/|∇ϕ| is the unit normal to the interface. This curvature is used in evaluating surface tension forces, as described next [24].

2.3. Surface Tension and Contact Angle Treatment

Surface tension at the gas–liquid interface is incorporated as a continuum force in the momentum equation. We assume a constant interfacial tension coefficient σ (no surfactant or Marangoni effects), which enters the Navier–Stokes equations via an extra source term acting only at the interface. In the “one-fluid” formulation, this is implemented by adding a volumetric force of the form F_st = σ κ δ(n) in the momentum equation. Here κ is the mean curvature of the interface and n is the unit normal (pointing into one of the fluids), while δ is a smoothed Dirac delta function that localizes the force to the interfacial region. This approach is equivalent to the continuum surface force model, ensuring that the pressure jump across the interface and the viscous stress balance are properly captured [25]. By smoothing δ over the thickness ϵ, the surface tension force is distributed over a few mesh cells, which improves numerical stability. We verified that our choice of ϵ (on the order of the mesh size) provides sufficient resolution of the capillary forces without unduly diffusing the interface.
Wettability and wall adhesion are accounted for by specifying a static contact angle at the channel walls. In our model, the walls are defined as wetted wall boundaries in COMSOL, which apply a contact angle boundary condition for the level set field. The contact angle θ_w is defined as the angle between the fluid-fluid interface and the solid wall, measured inside the more wetting fluid [26]. Physically, θ_w represents the equilibrium wetting preference of the two fluids on the solid surface. We set θ_w to a constant value (e.g., 135° for a hydrophobic wall with water as the dispersed phase [21]) based on experimental conditions, indicating that the dispersed phase fluid forms a non-wetting angle at the wall. Numerically, enforcing the contact angle entails adding a specialized boundary condition that adjusts the local interface normal at the wall so that the interface meets the wall at the specified angle. This is implemented via a boundary force term on the wall that balances surface tension in accordance with Young’s equation for the given θ_w. Additionally, to allow the contact line to move along the wall without singularities, a small slip length is introduced in the wall boundary condition. We use a slip length on the order of the mesh size (comparable to the element size) so that the no-slip condition is relaxed right at the contact line. This approach, provided by the Wetted Wall feature in COMSOL, enables dynamic contact line movement and is consistent with common hydrodynamic models for moving contact lines. Through these settings, the model captures the influence of wall wettability on droplet breakup and ensures that the interface shape at the walls is physically realistic.

2.4. Numerical Implementation

All the above equations and couplings are solved using the finite element method in COMSOL Multiphysics (version 5.x, CFD Module). We employ the built-in Laminar Two-Phase Flow, Level Set interface, which simultaneously solves the Navier–Stokes equations and the level set transport equation in a fully coupled manner. A sufficiently fine mesh is used to properly resolve the thin interface region and the small droplets. The interface thickness parameter ϵ is accordingly set equal to the maximum mesh element size in the domain to tie the numerical interface width to the grid resolution. At the start of each simulation, the initial distribution of ϕ is prescribed, and the flow is initially at rest. The inlet flow rates are imposed with a smooth pulsatile profile (sinusoidal or piecewise-constant in time) to generate periodic droplets; a gradual ramp-up of the inlet velocity from zero is applied to avoid initial transients. Time-step sizes are adjusted automatically by the solver to maintain convergence as the interface moves and droplets form. Throughout the simulation, the solver conserves mass of each phase to within a small tolerance—the conservative level set formulation ensures that any spurious loss of fluid volume is negligible. The methodology described above thus provides a robust framework for capturing the physics of pulsatile two-phase flow in a T-junction, including transient droplet formation [25].

2.5. Computational Domain and Assumptions

Although microfluidic channels are three-dimensional, the present simulations were carried out in a two-dimensional T-junction geometry. This simplification is justified by the low-Reynolds (Re < 1) and low-Capillary (Ca < 0.05) regime, in which the depth-wise velocity profile is nearly uniform and the droplet breakup process is controlled by planar pressure build-up and interfacial curvature in the mid-plane. Previous studies (Bashir et al., 2011) demonstrated that 2D Level-Set simulations can reproduce experimental droplet formation within about 10% deviation from 3D results [21].
Possible 3D effects—cross-sectional curvature, wall adhesion, and thin-film deposition (∼Ca23)—primarily influence the droplet aspect ratio but have a negligible impact on breakup frequency or synchronization behavior. Hence, the 2D model provides a physically consistent and computationally efficient basis for analyzing pulsation-controlled droplet generation.

3. Model Validation

To ensure that the numerical results were not affected by grid resolution, a mesh independence test was conducted by varying the number of elements from 2000 to 22,000 while monitoring the droplet breakup time (Figure 2). The breakup time was defined as the elapsed time between the initial interface deformation and the complete detachment of the dispersed phase from the junction.
As shown in Figure 2, the breakup time initially decreases with mesh refinement, stabilizing beyond approximately 10,000 elements. The relative deviation between the two finest grids (16,000 and 22,000 elements) is less than 2%, which confirms that the solution has reached grid convergence. This indicates that further refinement would not significantly alter the computed interfacial dynamics or pressure distribution but would increase computational cost substantially.
Therefore, a mesh with approximately 12,000–15,000 elements was selected for all subsequent simulations, providing a good compromise between accuracy and computational efficiency. The obtained convergence trend also demonstrates the robustness of the Level Set formulation and surface-tension implementation used in this study.
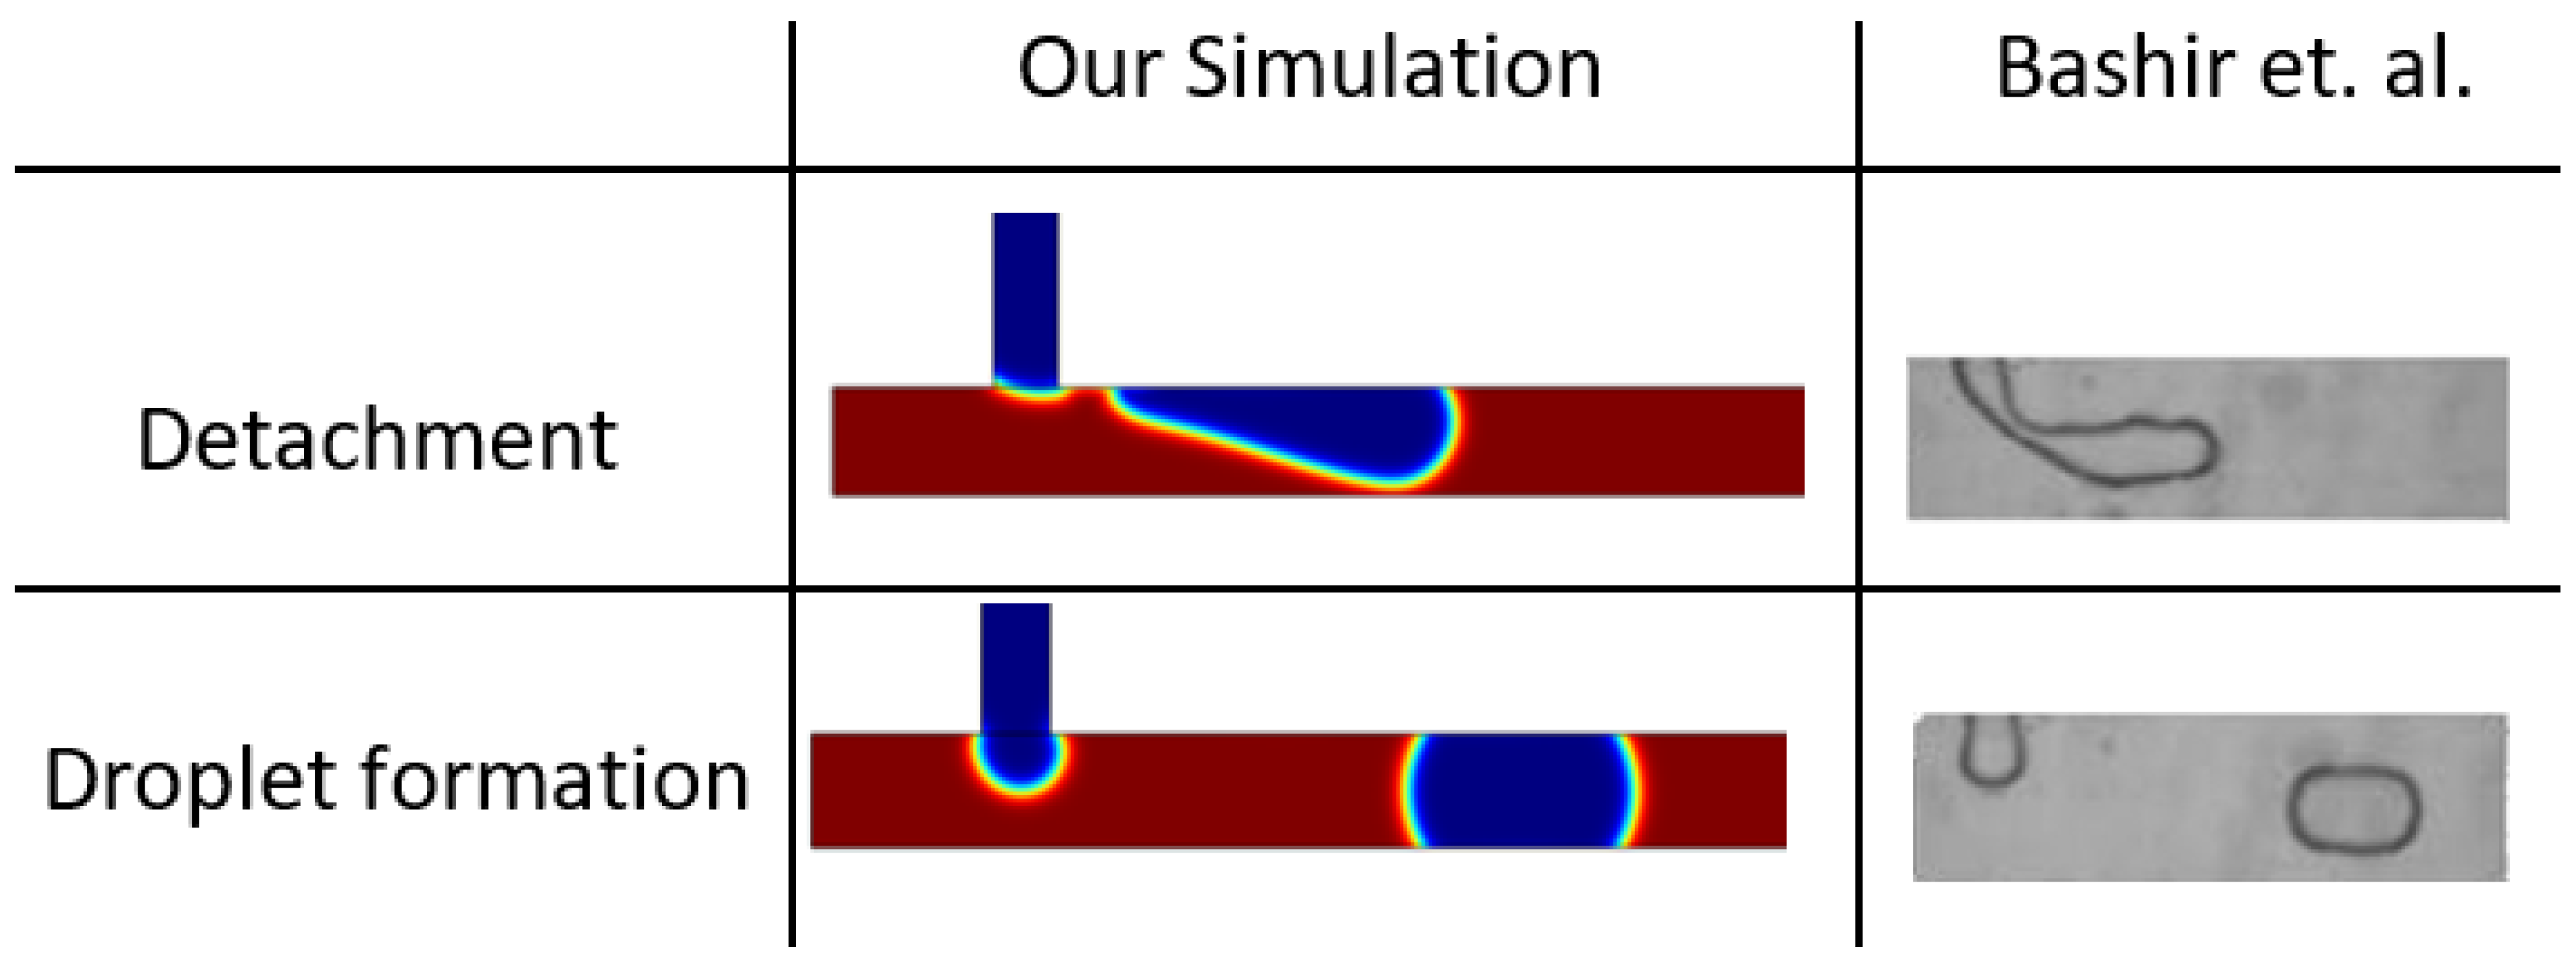
Figure 3 illustrates the T-junction geometry: the dispersed phase enters vertically through the side channel while the continuous phase flows horizontally (right-to-left) in the main channel. The fluid properties and inlet flow rates used in the simulation (Table 1) match those of the reference study. A transient two-phase simulation was conducted in COMSOL Multiphysics using the Level Set interface, with channel walls specified as hydrophobic (contact angle 135°) and an interfacial tension of 0.015 N/m. The complete droplet formation cycle was captured, and the predicted detachment time and final droplet shape were compared to the published results. The simulated detachment time closely matches the reference value, and the droplet morphology at pinch-off agrees with the reported profile (Figure 3). This close agreement in droplet shape and break-off timing confirms the validity of the numerical model.
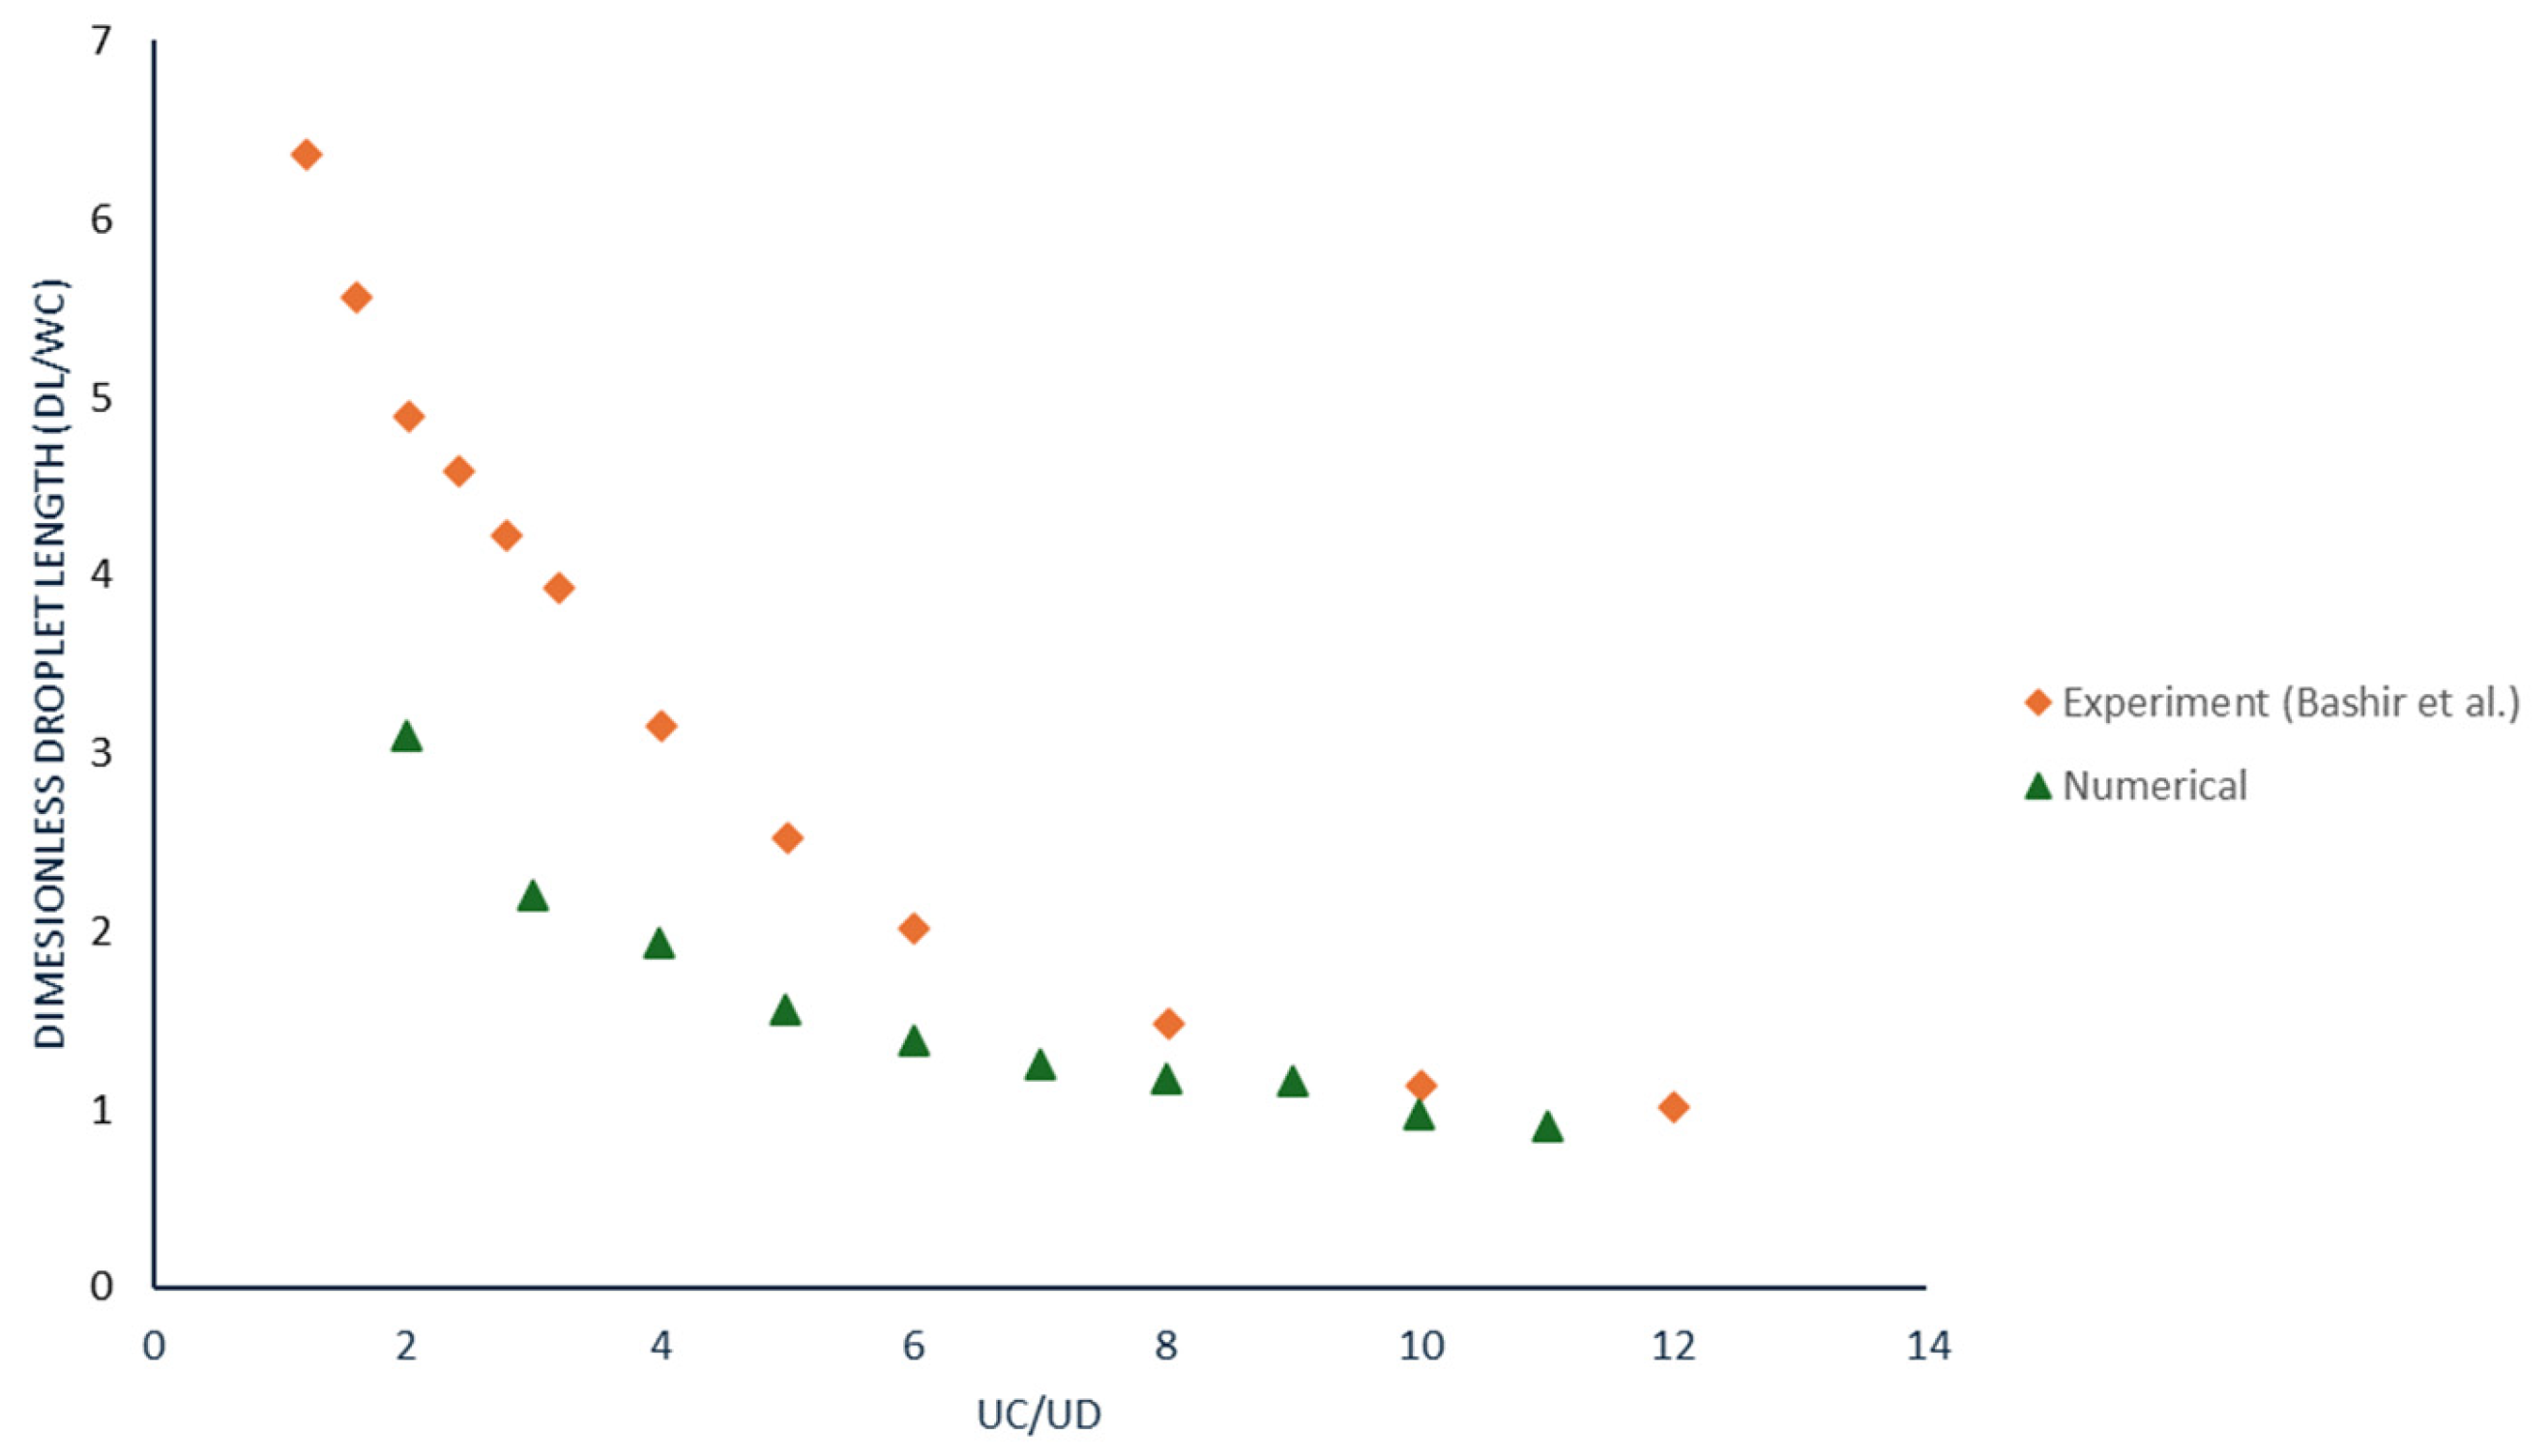
To further quantify the agreement between our numerical model and the benchmark data by Bashir et al. [21], the dimensionless droplet length DL/Wc was compared as a function of the flow-rate ratio U_c/U_d (Figure 4). The numerical predictions closely reproduce the experimental trend: droplet length decreases monotonically with increasing continuous-phase velocity, and the simulated values deviate by less than 10% from the reference data across the studied range. The resulting correlation coefficient R2 = 0.985 confirms strong quantitative consistency.
This level of agreement validates the numerical setup, including the Level Set formulation, wettability parameters, and surface-tension implementation. It also demonstrates that the 2D model accurately captures the essential physics of droplet breakup observed experimentally by Bashir et al., ensuring that subsequent pulsatile-flow simulations are based on a physically reliable foundation.
The temporal evolution of the phase field (Figure 5a–d) illustrates the interface dynamics between the continuous and dispersed phases during one complete formation cycle.
At t = 0.0021 s (Figure 5a), the dispersed phase begins to enter the main channel and deforms under the shear stress imposed by the crossflow.
By t = 0.0102 s (Figure 5b), the droplet elongates downstream, and a narrow neck starts to form due to increasing viscous drag.
At t = 0.0134 s (Figure 5c), the neck becomes critically thin, indicating the onset of capillary-driven pinch-off.
Finally, at t = 0.015 s (Figure 5d), the droplet detaches from the inlet and moves downstream while a new meniscus forms at the junction.
This sequence captures the classical squeezing-to-dripping transition characteristic of T-junction microchannels and confirms that the numerical model reproduces the experimentally observed breakup stages.
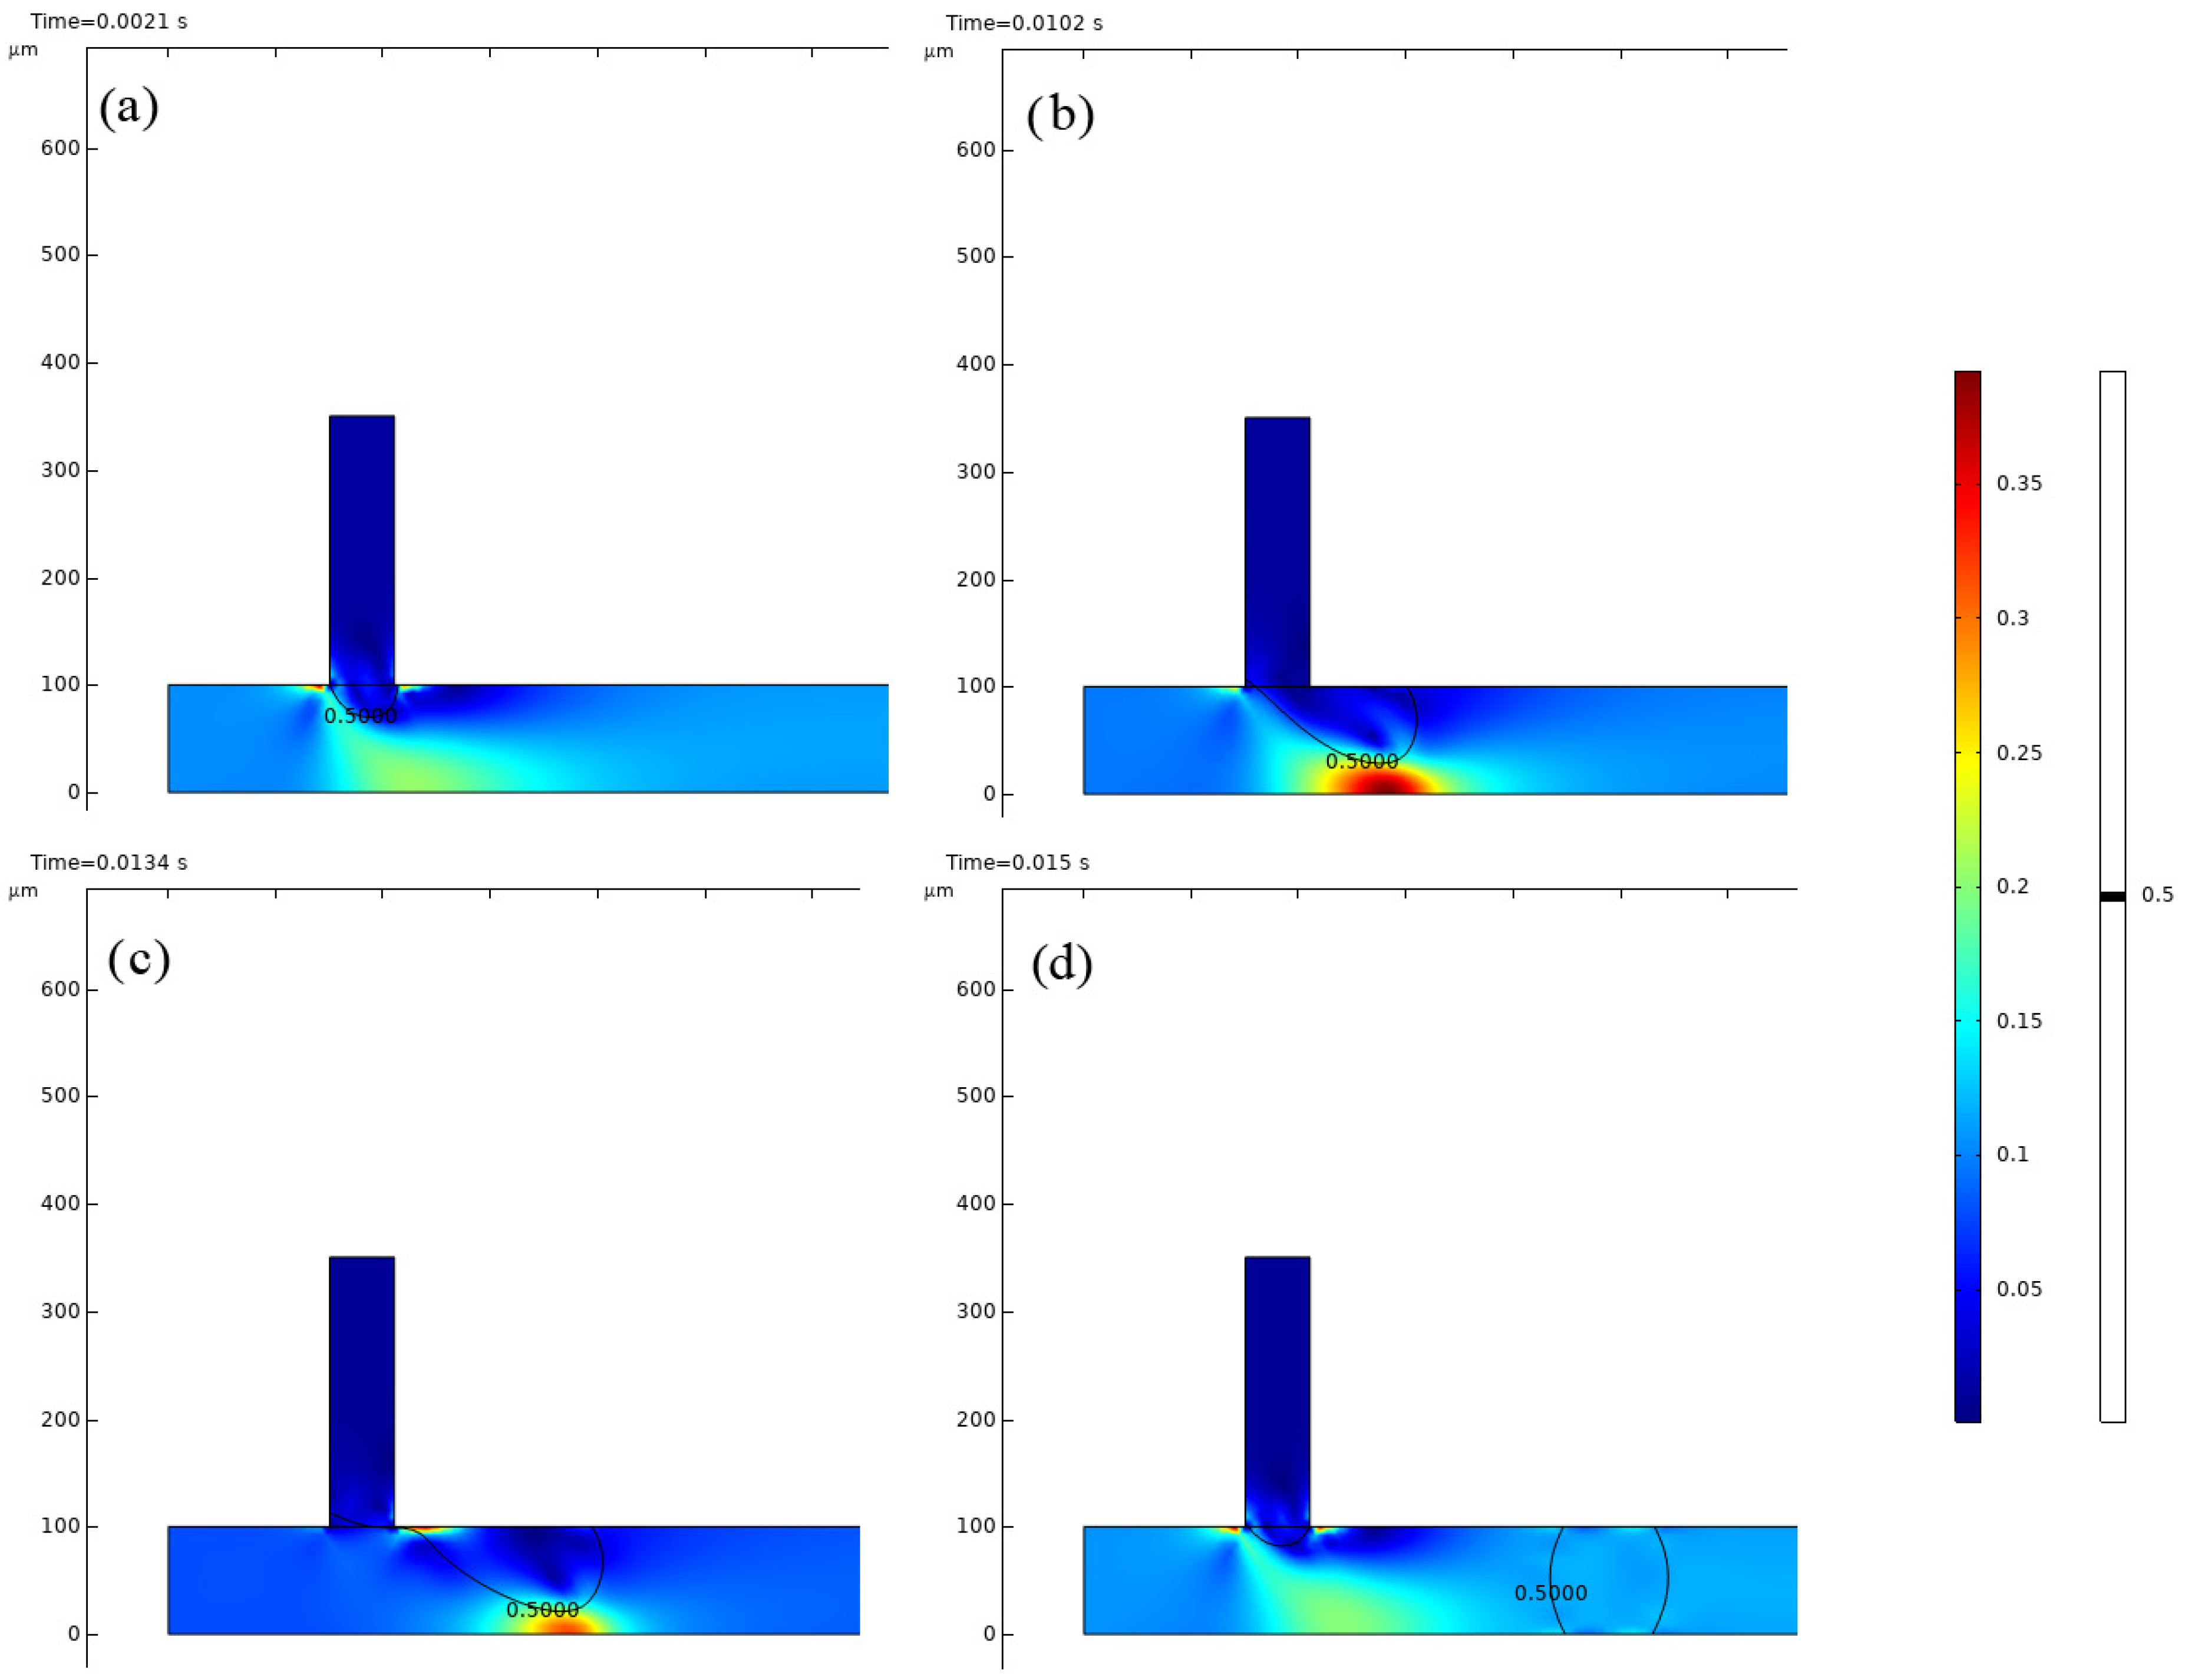
The corresponding pressure distribution (Figure 6a–d) reveals the driving mechanism of detachment.
At the early stage (Figure 6a), a strong pressure gradient is established across the junction as the continuous phase impinges on the forming droplet.
During elongation (Figure 6b), the pressure increases at the upstream side of the droplet while a low-pressure region develops downstream, generating a net force that stretches the interface.
Near the pinch-off point (Figure 6c), a pronounced pressure minimum occurs at the neck, accelerating the breakup process through capillary suction.
After detachment (Figure 6d), a rapid pressure recovery is observed, accompanied by a localized backflow toward the junction.
These oscillatory pressure variations explain how the imposed pulsation enhances periodic droplet generation and maintains high monodispersity within the 35–60 Hz regime.
The velocity field (Figure 7a–d) provides further insight into the interaction between the continuous and dispersed phases.
Initially (Figure 7a), the flow remains symmetric, with uniform velocity along the main channel and minor recirculation near the junction.
As the droplet grows (Figure 7b), the shear layer thickens and vortical structures appear near the upper interface, promoting interfacial stretching.
At t = 0.0134 s (Figure 7c), the maximum velocity occurs at the neck region, where the flow accelerates to maintain mass continuity, leading to the final detachment seen in Figure 7d.
After breakup, small vortices form downstream, gradually dissipating before the next cycle begins.
The alternating acceleration and deceleration phases demonstrate the synchronization between the pulsating inlet and droplet pinch-off dynamics, confirming that pulsation actively regulates the breakup timing.

4. Results and Discussion

4.1. Pulsation-Induced Droplet Generation in a Co-Flow System

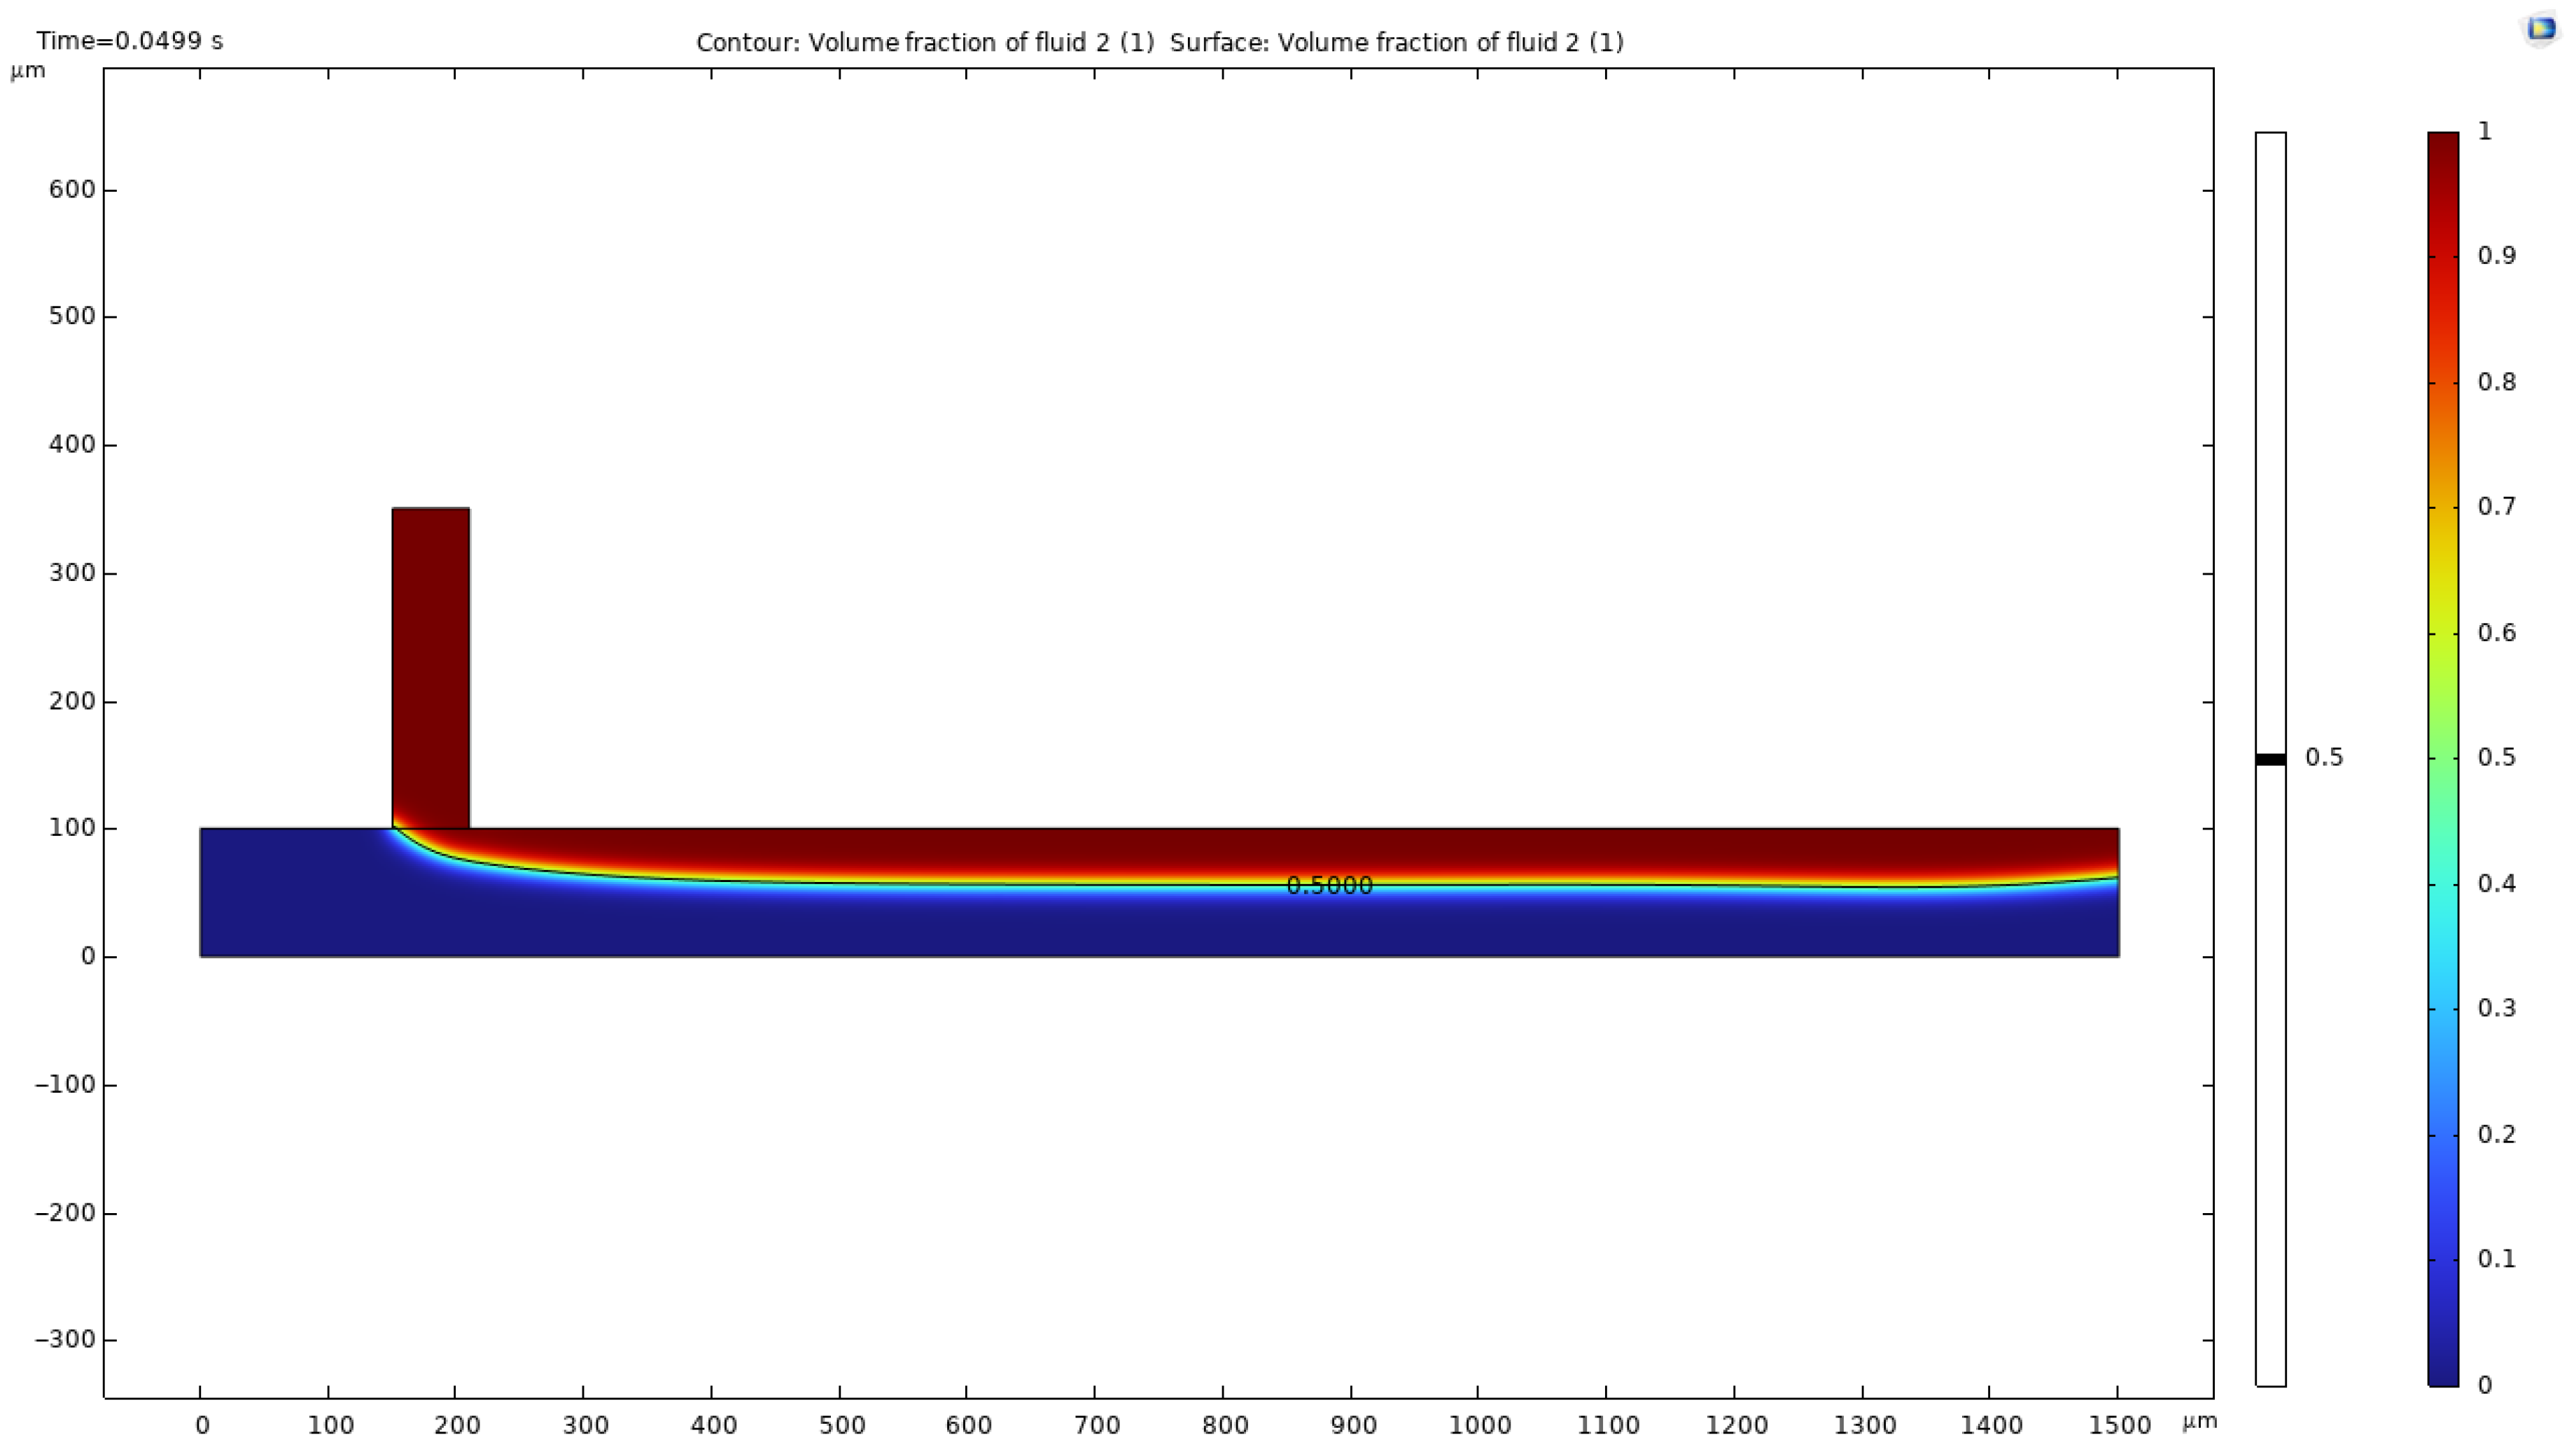
In a typical co-flow microfluidic configuration, two immiscible fluid phases flow coaxially: the dispersed (inner) phase is injected through an inner channel, while the continuous (outer) phase flows through a concentric outer channel [1]. By gradually increasing the velocity of the dispersed phase, we adjusted the flow until a steady co-flow regime was achieved (Figure 8). This occurred at a dispersed-phase velocity of U_d = 0.024 m/s. In this stable state, droplet formation did not yet occur spontaneously. (High dispersed-phase flow rates in co-flow systems typically lead to an unstable jetting regime and polydisperse droplets [27]). Once the steady co-flow was established, we introduced time-varying perturbations to the flow as described below.
  • Step 1: Increase dispersed-phase velocity to reach co-flow. We slowly ramped U_d to 0.024 m/s, corresponding to the transition to a co-flow regime (no jet break-up) as shown in Figure 8.
  • Step 2: Achieve steady-state flow. After reaching U_d = 0.024 m/s, we waited until flow parameters stabilized and no transient oscillations remained.
  • Step 3: Initiate pulsations in the dispersed phase. At this point, we applied a periodic perturbation to the velocity to disturb the co-flow regime according to the formula below.

4.2. Introducing Flow Pulsations

To disturb the steady co-flow and induce droplet break-up, we applied a sinusoidal pulsation to the dispersed-phase velocity using the following time-dependent law:
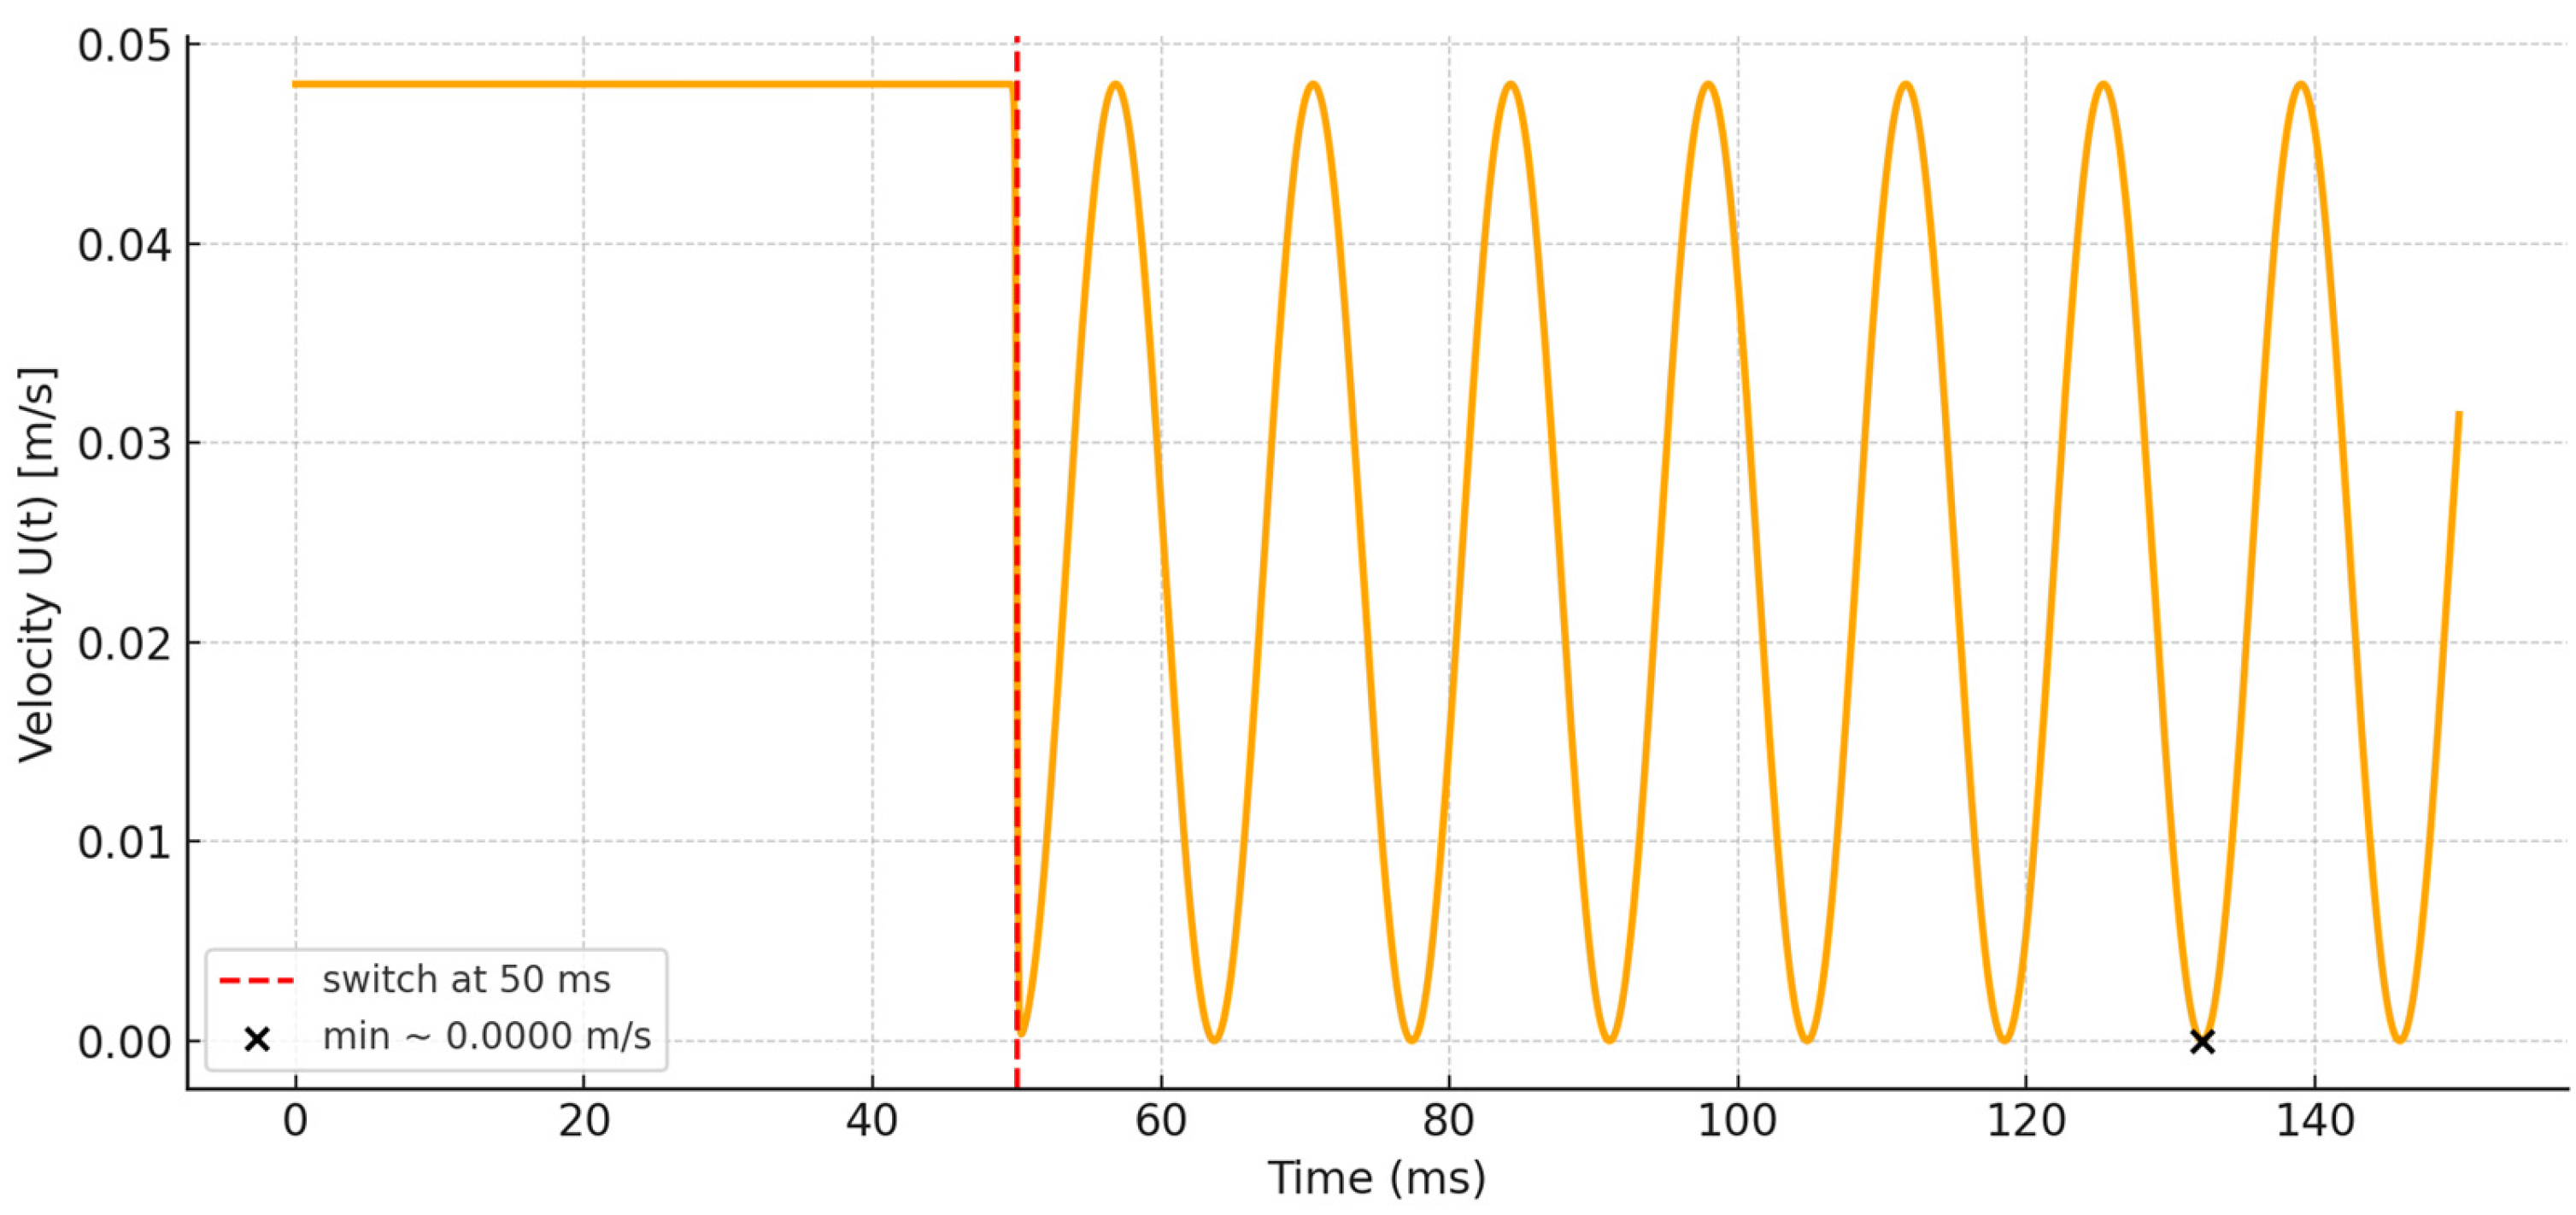
  • For t < 0.05 s: U(t) = U_d, (constant velocity, no perturbation).
  • For t ≥ 0.05 s: U(t) = U_d − A(1 − sin(ωt + Φ))
Here, the phase shift Φ = π/2 was chosen to ensure a smooth, non-abrupt transition (as depicted in Figure 9).
Here, A is the amplitude of the pulsation, ω is the angular frequency, and Φ = π/2 yields a gradual onset of oscillation. This form of active modulation is analogous to oscillatory strategies used in co-flow devices: for example, Khorrami & Rezai demonstrated that oscillating the nozzle of the dispersed phase can shorten the jet and produce smaller droplets [27]. By prescribing U(t) piecewise, we first allow the flow to remain steady until t = 0.05 s, then superimpose a sinusoidal variation on top of U_d.
The pulsation frequency was initiated from 35 Hz based on the characteristic time scale of droplet formation in the steady co-flow regime. In the validated reference case [19], the typical detachment or pinch-off time was approximately 0.026 s, corresponding to a natural breakup frequency of about 38–40 Hz. To ensure that the imposed pulsation would effectively interact with the droplet formation dynamics—neither too slow to cause negligible modulation nor too fast to exceed the capillary relaxation time—the lower bound of 35 Hz was chosen. This value lies close to the intrinsic hydrodynamic frequency of droplet pinch-off and thus provides a physically meaningful starting point for investigating frequency locking and droplet synchronization under pulsatile flow conditions.

4.3. Observations of Droplet Formation

Upon applying the pulsation, we observed that droplet formation (pinch-off) occurred only under certain conditions. Specifically, if the oscillation amplitude A was chosen such that the instantaneous velocity U(t) never crossed zero (i.e., the flow remained entirely forward), no droplet generation was observed. In contrast, when U(t) was allowed to reverse (dropping to zero and briefly negative), a breakup of the dispersed phase occurred and a continuous train of droplets formed. In other words, ensuring that the oscillating velocity waveform goes through zero was critical to trigger droplet detachment. Once pinch-off began, a steady regime of droplet generation ensued (see Figure 10 and Figure 11). This behavior is consistent with the idea that oscillatory forcing can break a stable jet into droplets [27]. Figure 10 and Figure 11 illustrate the detachment of droplets from the nozzle and the resulting steady droplet train.

4.4. Pulsatile Injection After Co-Flow Establishment

In the first set of simulations, the dispersed-phase flow was held constant (Ud = 0.024 m/s) until t = 0.05 s, after which a sinusoidal perturbation was applied according to the given switching function. This produced an inlet velocity that oscillates between 0 and 0.048 m/s. We observed that droplet pinch-off occurred only during the troughs of the velocity waveform (i.e., when U(t) approaches zero), consistent with the expectation that breakup is favored at low flow rates. Under these conditions a single drop was generated per pulsation cycle for moderate frequencies, while higher frequencies led to irregular breakup. In particular, as summarized in Table 2, stable one-drop-per-pulse generation was found in the 35–60 Hz range. Beyond ~60 Hz the droplet formation became erratic and multi-modal (i.e., multiple small droplets per cycle), indicating loss of size control and the onset of complex patterns. This transition to instability at high pulsation rate agrees with previous observations that pulsations near the natural breakup frequency produce multi-mode and “drop-on-demand” distributions [7].
  • Stable regime (35–60 Hz): Each pulse produced one droplet of nearly constant size.
  • High-frequency regime (>60 Hz): Breakup became chaotic (multiple drops or satellite droplets), and droplet volume varied widely.
Thus, the table shows a clear threshold near 60 Hz separating a regular, monodisperse regime from an unstable regime [7]. The ability to maintain a stable plug (droplet) flow over a wider range of conditions with pulsation is also consistent with prior work showing that flow-rate excitation can broaden the existence of segmented flow [7].

4.5. Full Pulsatile Injection from t = 0

In the second case, the dispersed-phase inlet followed a purely sinusoidal flow from the start (no co-flow initial condition), given by U(t) = A[1 + sin(2π ωt + Φ)] with A = 0.025 m/s, ω = 73 Hz, Φ = 3π/2. This waveform (illustrated in Figure 12) begins at U(0) = 0 and oscillates up to 0.05 m/s. As a result, droplets began forming immediately, one per pulse for moderate frequencies. The same stability trend with frequency was observed: one droplet per pulse for 35–60 Hz, and loss of regular breakup above ~60 Hz. The measured droplet diameters are listed in Table 3. For example, within the stable regime (35–60 Hz), the mean droplet diameter changed only slightly with frequency, whereas at 65 Hz no well-defined diameter could be assigned due to satellite formation. These findings reinforce that the pulsation frequency—not just average flow—governs droplet generation. In agreement with Zhang et al. [12], the droplet volume scales with the flow-rate parameters; in our case the fixed amplitude and frequency imposed a linear-like tunability of drop size across the stable range.

4.6. Droplet Size and Pulsation Frequency

Table 3 compiles the droplet sizes and generation frequencies for the two scenarios across 35–65 Hz. Key observations include the following:
  • One-to-one regime (35–60 Hz): For both starting conditions, each sinusoidal cycle produced exactly one droplet. The mean diameters in this range were nearly constant (within experimental scatter), indicating a decoupling of droplet size from time between pulses. This stable plug-flow regime is predicted by pulsatile flow models [7].
  • Beyond 60 Hz: The breakup became irregular. At 65 Hz and above, some pulses failed to produce any droplet or produced multiple satellite droplets. This loss of control is consistent with earlier studies showing that at pulsation frequencies comparable to the natural droplet frequency, multi-mode and chaotic droplet formation emerges [7].
To quantitatively assess the effect of pulsation frequency on droplet size and to evaluate the reproducibility of the generated droplets, two independent simulations were conducted for each frequency: one starting from the quiescent (zero-velocity) condition and the other from a co-flow regime. The resulting droplet sizes and statistical parameters are summarized in Table 4.
The mean droplet diameter exhibits a clear decreasing trend with increasing pulsation frequency—from 454.4 μm at 35 Hz to 237.1 μm at 60 Hz—indicating that higher frequencies enhance shear-driven detachment and promote the formation of smaller droplets. Importantly, the standard deviation (σ) and coefficient of variation (CV) remain very low across the studied range. The CV values drop from 8.82% at 35 Hz to below 3% for frequencies above 45 Hz, demonstrating that the droplet generation process becomes increasingly stable and monodisperse as the pulsation synchronizes with the natural breakup dynamics of the dispersed phase.
These results confirm that the pulsation-controlled regime between 45 and 60 Hz represents a “stable operating window”, in which the imposed oscillations effectively synchronize droplet formation cycles, minimize size dispersion, and maintain consistent breakup timing. The low variability in droplet size validates the numerical model’s ability to reproduce uniform droplet generation—an essential feature for practical microfluidic emulsification and encapsulation processes.
These results indicate that the pulsation frequency must be kept below a critical value to achieve reproducible single-droplet generation. Notably, within the stable regime the droplet diameter was essentially set by the pulse amplitude and fluid properties, rather than by the duty cycle of the pulsation.
At pulsation frequencies above 60 Hz, the droplet formation process becomes irregular, and control over both generation timing and droplet size is lost. The imposed oscillations no longer synchronize with the natural breakup dynamics of the dispersed phase, leading to unstable neck thinning and random detachment events. As a result, droplets of varying sizes are produced, indicating a transition from a controlled dripping regime to an irregular or unstable flow pattern.

4.7. Effect of Initial Flow Condition on Droplet Size

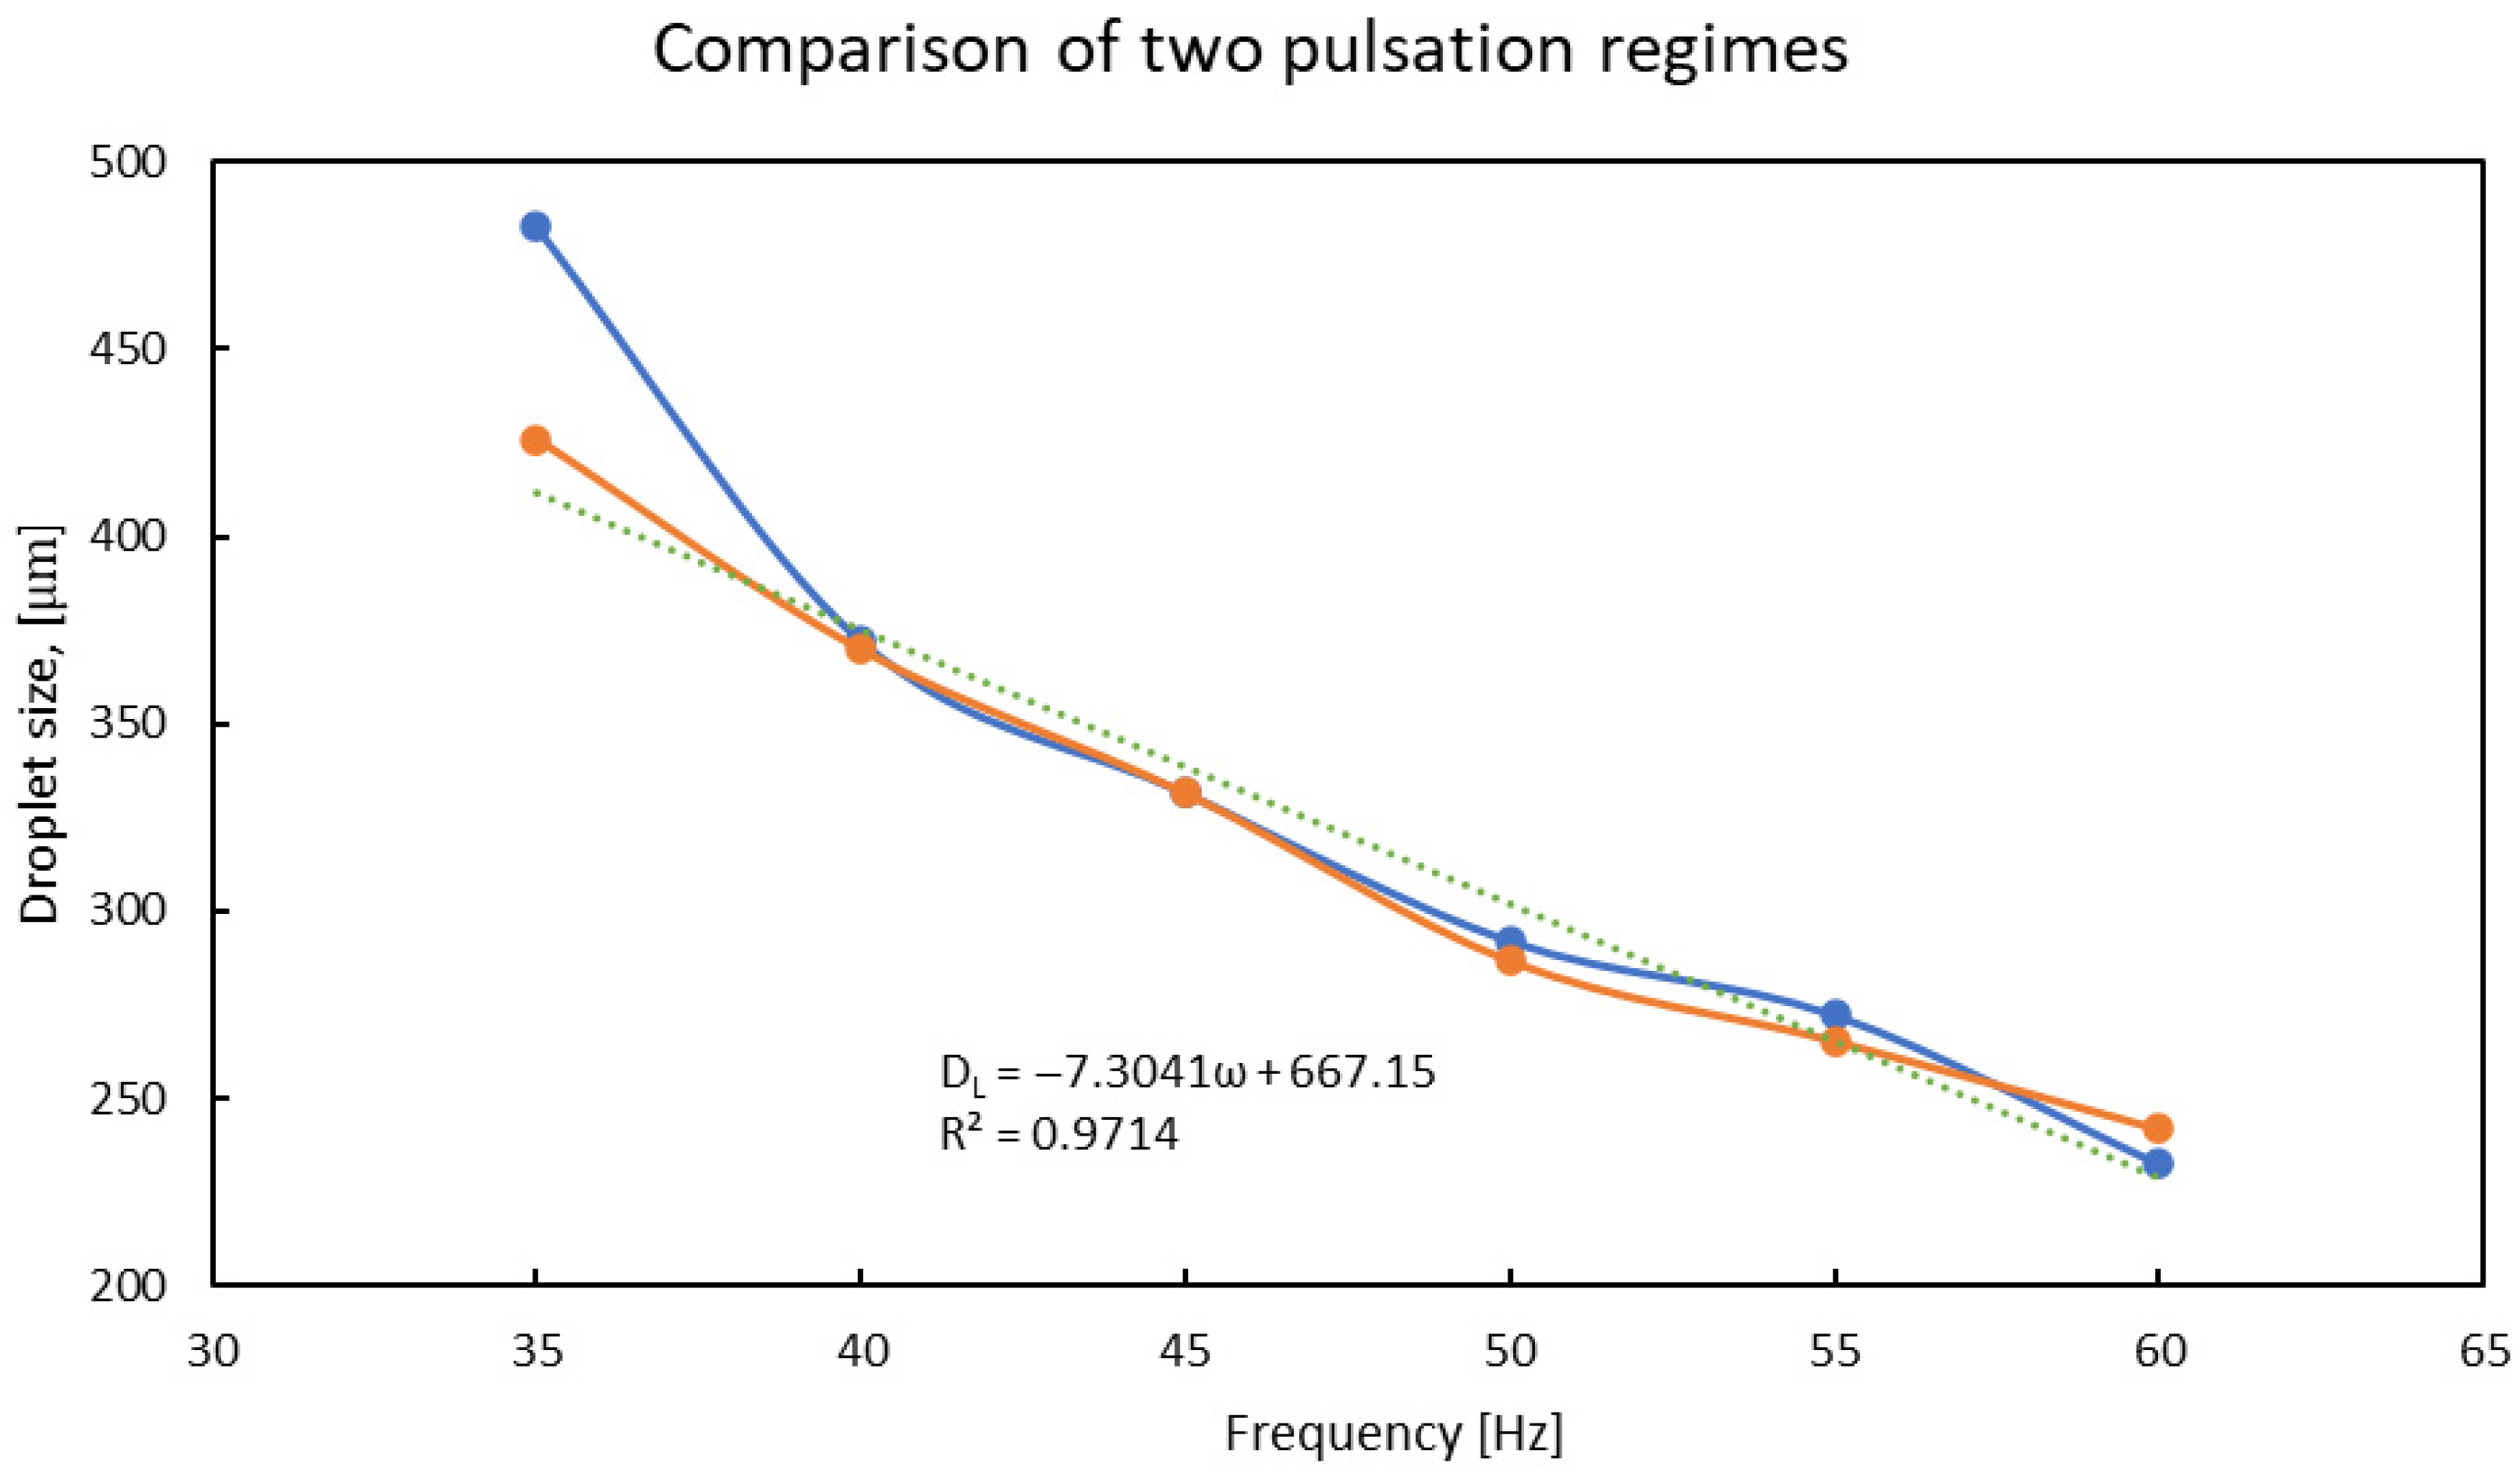
Figure 8 compares the droplet sizes for the two injection schemes (starting from zero velocity vs. starting from a steady co-flow). Across all tested frequencies, the droplets formed from the zero-velocity start were slightly larger in diameter than those from the co-flow start (on the order of 5–10% larger, as indicated by Figure 13). This trend is likely due to the initial transient: when pulsations start from U = 0, the fluid volume delivered in the first half-cycle is effectively larger (since the flow ramps up from rest), yielding a bigger initial droplet. Once each scheme reached its periodic regime, the continued one-drop-per-pulse generation preserved this size offset. These findings are consistent with the general principle that droplet volume is proportional to the total inflow per pulse. In practical terms, initiating flow from a quiescent state produces slightly larger droplets, but does not alter the overall stability window (the 35–60 Hz one-drop regime appears in both cases). Thus, as illustrated in Figure 8, the droplet length exhibits an approximately linear dependence on the pulsation frequency.
To characterize the observed synchronization regime, a dimensionless pulsation frequency can be defined using a Strouhal-type number, St = ω DL/U_d, where ω is the pulsation frequency, DL the characteristic droplet length, and U_d the average dispersed-phase velocity. Within the synchronized regime (35–60 Hz), St remains nearly constant, confirming that droplet generation is governed by a balance between the imposed oscillation period and the natural breakup time. A linear fit of normalized droplet length (DL/Wc) versus frequency yields DL/Wc ≈ 1.87 − 0.011 ω, with R2 = 0.96, indicating a strong and predictable correlation. This scaling approach quantitatively supports the experimental observation that the droplet size can be tuned directly through pulsation frequency rather than by modifying flow rates or channel geometry.

5. Conclusions

This study demonstrates that pulsatile injection of the dispersed phase provides an effective and simple mechanism for controlling droplet formation in microfluidic T-junctions. The validated Level Set model accurately captured the interface evolution and pinch-off dynamics, confirming its suitability for simulating transient two-phase flows. Within the pulsation range of 35–60 Hz, the flow exhibited strong frequency locking between the external forcing and the natural breakup cycle, resulting in highly uniform droplet generation. At higher frequencies, this synchronization deteriorated, producing irregular droplet sizes and loss of control. The approximately linear dependence of droplet length on pulsation frequency suggests that size tuning can be achieved by adjusting pulsation parameters rather than geometry or flow ratio. These results highlight pulsation-controlled microfluidics as a promising strategy for droplet-on-demand generation and process intensification in lab-on-a-chip systems.
The results of this study demonstrate that pulsation-controlled droplet generation offers an efficient, low-cost strategy for precise droplet size control without the need for additional external actuators. The observed synchronization between pulsation frequency and natural breakup time enables highly monodisperse droplet production, which is advantageous for practical applications such as micro-encapsulation, lab-on-a-chip diagnostics, and controlled emulsification processes

Author Contributions

Conceptualization, D.B. and A.K.; methodology, D.B. and A.K.; software, D.B.; validation, D.B. and Z.A.; formal analysis, D.B.; investigation, Z.A.; resources, Z.Z.; data curation, D.B.; writing—original draft preparation, D.B.; writing—review and editing, A.K. and Z.Z.; visualization, D.B.; supervision, A.K.; project administration, A.K.; funding acquisition, A.K. All authors have read and agreed to the published version of the manuscript.

Funding

This research was funded by the Science Committee of the Ministry of Science and Higher Education of the Republic of Kazakhstan (Grant No. AP19676964). The APC was funded by (Grant No. AP19676964).

Data Availability Statement

The original contributions presented in this study are included in the article. Further inquiries can be directed to the corresponding author.

Conflicts of Interest

The authors declare no conflicts of interest.

Abbreviations

LBMLattice Boltzmann method
VOFVolume of fluid
PINNPhysics-informed neural network
CaCapillary number
ReReynolds number
StStrouhal number
WeWeber number
CVCoefficient of variation
σStandard deviation
ρDensity (kg·m−3)
μDynamic viscosity (Pa·s)
νKinematic viscosity (m2·s−1)
σSurface tension (N·m−1)
ωAngular frequency (rad·s−1)
fFrequency (Hz)
AAmplitude of velocity oscillation
U0Base vselocity (m·s−1)
DLDroplet length (µm)
W_c, W_dWidths of continuous and dispersed channels (µm)
Q_c, Q_dFlow rates of continuous and dispersed phases (µL·min−1)
pPressure (Pa)
vVelocity (m·s−1)
ϕLevel-set phase field variable

References

  1. Fergola, A.; Ballesio, A.; Frascella, F.; Napione, L.; Cocuzza, M.; Marasso, S.L. Droplet Generation and Manipulation in Microfluidics: A Comprehensive Overview of Passive and Active Strategies. Biosensors 2025, 15, 345. [Google Scholar] [CrossRef]
  2. Garstecki, P.; Fuerstman, M.J.; Stone, H.A.; Whitesides, G.M. Formation of Droplets and Bubbles in a Microfluidic T-Junction—Scaling and Mechanism of Break-Up. Lab Chip 2006, 6, 437. [Google Scholar] [CrossRef]
  3. Viswanathan, H. The Effect of Junction Gutters for the Upscaling of Droplet Generation in a Microfluidic T-Junction. Microgravity Sci. Technol. 2022, 34, 43. [Google Scholar] [CrossRef]
  4. Jahangirifard, S.; Salomon, R.; Razavi Bazaz, S. Deformable Baffles Coupled with Pulsatile Flow Improve Mixing in Microfluidic Devices. Chem. Eng. Res. Des. 2024, 208, 588–598. [Google Scholar] [CrossRef]
  5. Dincau, B.; Dressaire, E.; Sauret, A. Pulsatile Flow in Microfluidic Systems. Small 2020, 16, e1904032. [Google Scholar] [CrossRef] [PubMed]
  6. Zhang, Y.; Zhang, J.; Tang, Z.; Wu, Q. Regulation of Gas-Liquid Taylor Flow by Pulsating Gas Intake in Micro-Channel. Chem. Eng. J. 2021, 417, 129055. [Google Scholar] [CrossRef]
  7. Kovalev, A.; Yagodnitsyna, A.; Bartkus, G.; Bilsky, A. Control of Plug Flow Dynamics in Microfluidic T-Junction Using Pulsations of Dispersed Phase Flow Rate. Int. J. Thermofluids 2024, 23, 100720. [Google Scholar] [CrossRef]
  8. Bransky, A.; Korin, N.; Khoury, M.; Levenberg, S. A Microfluidic Droplet Generator Based on a Piezoelectric Actuator. Lab Chip 2009, 9, 516–520. [Google Scholar] [CrossRef]
  9. Cheung, Y.N.; Qiu, H. Characterization of Acoustic Droplet Formation in a Microfluidic Flow-Focusing Device. Phys. Rev. E 2011, 84, 066310. [Google Scholar] [CrossRef]
  10. Oléron, M.; Clément, G.; Hidalgo-Caballero, S.; Gunny, M.; Box, F.; Labousse, M.; McGraw, J.D. Droplet-on-Demand Using a Positive Pressure Pulse. Eur. Phys. J. E Soft Matter 2025, 48, 35. [Google Scholar] [CrossRef]
  11. Sripadaraja, K.; Umesh, G.; Satyanarayan, M.N. Simulation Studies on Picolitre Volume Droplets Generation and Trapping in T-Junction Microchannels. SN Appl. Sci. 2020, 2, 1413. [Google Scholar] [CrossRef]
  12. Zhang, Y.Y.; Xia, H.M.; Wu, J.W.; Zhang, J.; Wang, Z.P. Synchronized Generation and Coalescence of Largely Dissimilar Microdroplets Governed by Pulsating Continuous-Phase Flow. Appl. Phys. Lett. 2019, 114, 073701. [Google Scholar] [CrossRef]
  13. Mudugamuwa, A.; Roshan, U.; Hettiarachchi, S.; Cha, H.; Musharaf, H.; Kang, X.; Trinh, Q.T.; Xia, H.M.; Nguyen, N.; Zhang, J. Periodic Flows in Microfluidics. Small 2024, 20, e2404685. [Google Scholar] [CrossRef]
  14. Sun, Z.; Yao, Q.; Jin, H.; Xu, Y.; Hang, W.; Chen, H.; Li, K.; Shi, L.; Gu, J.; Zhang, Q.; et al. A Novel In-Situ Sensor Calibration Method for Building Thermal Systems Based on Virtual Samples and Autoencoder. Energy 2024, 297, 131314. [Google Scholar] [CrossRef]
  15. Wang, Y.; Liu, F.; Li, J.; Chen, X. Multi-Field Coupling Particle Flow Dynamic Behaviors of the Microreactor and Ultrasonic Control Method. Powder Technol. 2025, 454, 120731. [Google Scholar] [CrossRef]
  16. Ziemecka, I.; van Steijn, V.; Koper, G.J.M.; Rosso, M.; Brizard, A.M.; van Esch, J.H.; Kreutzer, M.T. Monodisperse Hydrogel Microspheres by Forced Droplet Formation in Aqueous Two-Phase Systems. Lab Chip 2011, 11, 620–624. [Google Scholar] [CrossRef] [PubMed]
  17. Sauret, A.; Shum, H. Forced generation of simple and double emulsions in all-aqueous systems. Appl. Phys. Lett. 2012, 100, 154106. [Google Scholar] [CrossRef]
  18. Hamidović, M.; Marta, U.; Bridle, H.; Hamidović, D.; Fink, G.; Wille, R.; Springer, A.; Haselmayr, W. Off-Chip-Controlled Droplet-on-Demand Method for Precise Sample Handling. ACS Omega 2020, 5, 9684–9689. [Google Scholar] [CrossRef]
  19. Meng, X.; Yu, Y.; Jin, G. Numerical Simulation and Experimental Verification of Droplet Generation in Microfluidic Digital PCR Chip. Micromachines 2021, 12, 409. [Google Scholar] [CrossRef]
  20. Zhu, P.; Tang, X.; Tian, Y.; Wang, L. Pinch-off of Microfluidic Droplets with Oscillatory Velocity of Inner Phase Flow. Sci. Rep. 2016, 6, 31436. [Google Scholar] [CrossRef]
  21. Bashir, S.; Rees, J.M.; Zimmerman, W.B. Simulations of Microfluidic Droplet Formation Using the Two-Phase Level Set Method. Chem. Eng. Sci. 2011, 66, 4733–4741. [Google Scholar] [CrossRef]
  22. The Level Set Method (COMSOL Documentation). Available online: https://doc.comsol.com/6.0/doc/com.comsol.help.cfd/cfd_ug_math_levelset_phasefield.14.33.html (accessed on 1 January 2020).
  23. Olsson, E.; Kreiss, G. A Conservative Level Set Method for Two Phase Flow. J. Comput. Phys. 2005, 210, 225–246. [Google Scholar] [CrossRef]
  24. Sussman, M.; Smereka, P.; Osher, S. A Level Set Approach for Computing Solutions to Incompressible Two-Phase Flow. J. Comput. Phys. 1994, 114, 146–159. [Google Scholar] [CrossRef]
  25. COMSOL Multiphysics®, version 6.2; COMSOL AB: Stockholm, Sweden, 2023.
  26. Yin, J.; Kuhn, S. Numerical Simulation of Droplet Formation in a Microfluidic T-Junction Using a Dynamic Contact Angle Model. Chem. Eng. Sci. 2022, 261, 117874. [Google Scholar] [CrossRef]
  27. Shams Khorrami, A.; Rezai, P. Oscillating Dispersed-Phase Co-Flow Microfluidic Droplet Generation: Jet Length Reduction Effect. Soft Matter 2018, 14, 9870–9876. [Google Scholar] [CrossRef]
Figure 1. Illustration of a T-shaped microchannel, where the dispersed phase is injected from the vertical inlet, while the continuous phase flows from right to left through the horizontal channel.
Processes 13 03690 g001
Figure 2. Mesh independence study showing the variation in droplet breakup time with the number of mesh elements.
Processes 13 03690 g002
Figure 3. Validation of the numerical setup for droplet formation in a T-shaped microchannel (red is continuous phase, blue is dispersed phase) [21].
Processes 13 03690 g003
Figure 4. Comparison of dimensionless droplet length DL/Wc versus flow-rate ratio U_c/U_d between the present numerical results and the experimental data of [21].
Processes 13 03690 g004
Figure 5. Phase field evolution during droplet formation. (a) At t = 0.0021 s, (b) At t = 0.0102 s, (c) At t = 0.0134 s, (d) At t = 0.015 s.
Processes 13 03690 g005
Figure 6. Pressure field evolution during droplet formation. (a) At t = 0.0021 s, (b) At t = 0.0102 s, (c) At t = 0.0134 s, (d) At t = 0.015 s.
Processes 13 03690 g006
Figure 7. Velocity magnitude evolution during droplet formation. (a) At t = 0.0021 s, (b) At t = 0.0102 s, (c) At t = 0.0134 s, (d) At t = 0.015 s.
Processes 13 03690 g007
Figure 8. Establishment of the co-flow regime as the velocity of the dispersed phase is increased.
Processes 13 03690 g008
Figure 9. Illustration of the dispersed-phase inlet velocity profile; the injection remains constant up to t = 0.05 s, after which it transitions to a pulsating flow.
Processes 13 03690 g009
Figure 10. Detachment and formation of the first droplet.
Processes 13 03690 g010
Figure 11. Steady-state regime of continuous droplet generation.
Processes 13 03690 g011
Figure 12. Time-dependent pulsation of the dispersed-phase inlet velocity.
Processes 13 03690 g012
Figure 13. Comparison of two pulsation regimes: the brown line corresponds to the co-flow regime, while the blue line represents the regime with pulsation initiated from zero velocity at the beginning of the process. The dotted line represents the trend line derived from the simulation data.
Processes 13 03690 g013
Table 1. Fluid properties and flow parameters used for model validation (following Bashir et al.) [21]. The table lists the inlet velocities (U_d, U_c), densities ρ, viscosities μ for each phase, interfacial tension δ, contact angle θ, channel widths, and the resulting Capillary numbers.
ParameterValue
Dispersed phase velocity, U_d0.05 m/s
Continuous phase velocity, U_c0.10 m/s
Dispersed phase density, ρ _d1000 kg/m3
Continuous phase density, ρ _c900 kg/m3
Dispersed phase viscosity, μ _d1.0 × 10−3 Pa·s
Continuous phase viscosity, μ _c2.0 × 10−2 Pa·s
Interfacial tension, δ0.015 N/m
Contact angle, θ135°
Capillary number, Ca_c (continuous)0.133
Capillary number, Ca_d (dispersed)0.003
Main channel width W_c (horizontal)100 µm
Side channel width W_d (vertical)25 µm
Table 2. Results of pulsating flow initiated from the established co-flow regime.
Frequency [Hz]Phase [rad]Amplitude in %Droplet Length [μm]Droplet Formation Frequency [Hz]
35Pi/2100%4260.029
40Pi/2100%369.70.0249
45Pi/2100%331.50.025
50Pi/2100%286.70.02
55Pi/2100%265.410.018
60Pi/2100%241.890.016
65Pi/2100%Irregular droplet sizes
Table 3. Results of pulsating flow initiated from zero initial velocity.
Frequency [Hz]Phase [rad]Amplitude in %Droplet Length [μm]Droplet Formation Frequency [Hz]
353 Pi/20.024482.790.0285
403 Pi/20.024372.140.025
453 Pi/20.024331.590.022
503 Pi/20.024291.970.019
553 Pi/20.024272.230.018
603 Pi/20.024232.340.0145
653 Pi/20.024Irregular droplet sizes
Table 4. Statistical parameters of droplet size for different pulsation frequencies, including mean value, standard deviation, and coefficient of variation (CV).
Frequency (Hz)Droplet Size (Zero Velocity Start, µm)Droplet Size
(Co-Flow Start, µm)
Mean Droplet Size (µm)Standard Deviation σ (µm)Coefficient of
Variation CV (%)
35482.79426454.440.098.82
40372.14369.7370.921.730.47
45331.59331.5331.550.060.02
50291.97286.7289.343.731.29
55272.23265.41268.824.831.8
60232.34241.89237.126.752.85
Disclaimer/Publisher’s Note: The statements, opinions and data contained in all publications are solely those of the individual author(s) and contributor(s) and not of MDPI and/or the editor(s). MDPI and/or the editor(s) disclaim responsibility for any injury to people or property resulting from any ideas, methods, instructions or products referred to in the content.