Article

Research and Experimentation on Pneumatic Particle Transport in Confined Spaces of Offshore Oil and Gas Wells Based on DEM-CFD Coupling Method

1
CNOOC Ener Tech-Drilling & Production Co., Shenzhen 518067, China
2
School of Biological and Agricultural Engineering, Jilin University, Changchun 130022, China
*
Authors to whom correspondence should be addressed.
Processes 2025, 13(11), 3599; https://doi.org/10.3390/pr13113599
Submission received: 2 October 2025 / Revised: 27 October 2025 / Accepted: 31 October 2025 / Published: 7 November 2025

Abstract

To optimize the corrosion mitigation process in the annular space of oil and gas well pipelines, this study introduces a secondary acceleration pneumatic conveying device for particles within the confined spaces of offshore oil and gas wells. This approach addresses the limitations of traditional offshore hydraulic transportation, which can lead to corrosion failure of drug particles. The study investigates the motion mechanisms of drug particles within the pipeline and identifies the critical structural parameters that influence the smooth transport of these particles. A DEM-CFD coupled simulation methodology was employed to conduct single-factor experiments on the minimum air pressure and particle injection quantity required for stable transportation. The results demonstrate that at an air pressure of 0.25 MPa, no particle retention or accumulation occurs within the pipeline, thereby satisfying the engineering requirements. A Box–Behnken three-factor, three-level experimental design was used to perform response surface analysis on the pneumatic device. The findings reveal that the particle outlet velocity initially increases and then decreases with the air injection angle, while the outlet velocity progressively increases with the diameter of the conveying hole and the number of small holes. The maximum outlet velocity achieved is 8 m/s, with the optimal structural parameters identified as an air injection hole diameter of 2.96 mm, an air injection angle of 47°, and 24 small holes. The simulation model was calibrated and validated through fluidized bed experiments, and the simulation optimization was further confirmed via bench-scale particle transportation tests. This research provides a theoretical framework and engineering guidance for optimizing pneumatic particle transport in the confined spaces of offshore oil and gas wells.

1. Introduction

Economic development is intrinsically linked to the growth of energy demand, which in turn poses significant challenges to the long-term sustainability of global economic expansion [1,2,3]. The gradual depletion of terrestrial fossil fuel reserves is expected to inevitably slow economic growth. Offshore oil production, therefore, plays a crucial role in ensuring a stable petroleum supply. However, prolonged exposure to seawater and other corrosive media makes offshore oil and gas well pipelines highly susceptible to corrosion-induced failures, damage, and fractures [4,5,6]. Consequently, effective corrosion-prevention measures for offshore oil and gas pipelines are of great importance. In this study, solid slow-release corrosion inhibitor pellets independently developed by the research group were used as the research object. These solid inhibitors feature long-lasting slow release, high film-forming efficiency, convenient storage and transportation, and excellent safety and environmental friendliness. Nevertheless, due to the confined space and varying depths of offshore wellbores, the deployment of solid inhibitors remains challenging. The transport of inhibitor particles is influenced by both the supply and delivery stages. In previous work, our group analyzed the discharge process and mechanism of corrosion inhibitor particles within the casing annulus of oil and gas wells, providing theoretical insights for optimizing the design of annular anti-corrosion devices [7]. The delivery stage, which ensures that the inhibitor pellets successfully reach the designated position, is vital for corrosion prevention in offshore pipelines. Traditional offshore pellet transport typically relies on hydraulic conveying, yet this method suffers from water-induced corrosion during transport, which can compromise the inhibitor’s effectiveness. Building on our earlier research into pneumatic transport of pellets in confined wellbore spaces—which achieved standardized pellet supply technology—this study further investigates a pneumatic flexible-constrained particle delivery method and analyzes its underlying transport mechanism. The design of an apparatus capable of effectively conveying corrosion inhibitor pellets under offshore conditions is of great significance for realizing reliable corrosion protection in offshore oil and gas wells.
In recent years, extensive research has been devoted to understanding the flow mechanisms of coarse particles in hydraulic conveying pipelines. The core objective of studying gas–solid flow behavior is to analyze the interaction and dynamic coupling between gas flow and particles during fluidization and transport. The fluid–solid coupled simulation method allows simultaneous analysis of both fluid and particle motion and their interrelations and has been widely applied to two-phase flow problems [8,9,10]. Yang et al. [11] utilized a CFD–DEM coupled model to simulate the motion of coarse particles in vertical and horizontal pipelines, providing valuable insights for the design of deep-sea mineral hydraulic lifting systems. Ren et al. [12] investigated the effects of particle size and concentration on particle–fluid interactions in vertical pipelines, revealing that large particles and high concentrations tend to promote aggregation and clogging. Yang et al. [13] employed an Euler–Euler model to quantify the influence of inlet velocity, particle size, and concentration on sand deposition in multiphase pipelines. Xu et al. [14] examined the morphology and flow characteristics of deep-sea hydraulic conveying pipelines under dynamic marine environments. Schnorr Filho et al. [15] used high-resolution CFD–DEM simulations to study particle transport through narrow elbows, emphasizing the critical role of geometric constraints. Nossair et al. [16] conducted laboratory experiments to assess the effect of pipeline inclination on sand hydraulic conveying behavior. Although these studies have enhanced understanding of bulk or mineral particle transport in simplified geometries, they rarely address the unique conditions associated with offshore oil and gas wells—namely confined wellbore spaces, complex geometrical constraints, and coupled seawater–particle–structure interactions. Research on the pneumatic or hydraulic conveying of corrosion inhibitor pellets under such conditions remains scarce [17,18,19]. Therefore, this work focuses on the pneumatic transport of solid corrosion inhibitor particles in offshore wellbores, aiming to evaluate their conveying performance under seawater corrosion and varying pipeline geometries.
Pneumatic flexible-constrained particle conveying has been extensively applied in agriculture and mining industries. Lei et al. [20] employed a DEM–CFD coupled method to reproduce particle trajectories in centralized seed distribution systems. Gu et al. [21] applied gas–solid coupling theory to simulate straw particle transport in a pneumatic conveyor, revealing flow field variations under different parameters. Zhou et al. [22] studied the dynamic behavior and deposition of fine particles in rock fractures using a gas–solid coupling model. Furthermore, CFD–DEM techniques can accurately predict critical phenomena such as bubble formation, growth, and rupture in fluidized beds, and the accuracy of these models can be validated by comparing pressure drop or bed height [23,24,25]. As an efficient particle transport method, pneumatic conveying is widely used in seed sowing, harvesting, and rock or cuttings transportation. Its application in offshore environments for delivering self-developed corrosion inhibitor pellets is therefore of particular significance.
This paper presents a theoretical and mechanistic study of pneumatic particle transport within confined offshore oil and gas wellbores, aimed at achieving efficient pellet delivery. A CFD–DEM coupled simulation was developed to elucidate the airflow-assisted transport mechanism and particle dynamics. The accuracy and feasibility of the simulation were validated through fluidized bed experiments, followed by bench-scale experimental evaluation of the conveying performance. The findings provide both theoretical foundations and experimental evidence for understanding pneumatic particle transport processes in the confined spaces of offshore oil and gas wells, The overall research process flowchart is shown in Figure 1.

2. Materials and Methods

2.1. Working Principle

The machine structure is illustrated in Figure 2. The entire apparatus is divided into three main components. The first part is the discharge mechanism, which utilizes a spiral grooved wheel for material discharge, driven by a pneumatic motor. The pneumatic motor is mounted on one side of the hopper via a motor bracket. A transmission shaft is connected to the pneumatic motor and supported internally within the hopper by a bearing seat. The spiral grooved wheel is fixed to the transmission shaft, enabling the discharge process through rotational motion. The second part is the pneumatic conveying system, which employs hoses and two pneumatic generators to transport the medicinal pill particles. The pneumatic generators are connected to the hopper via one hose and to a guided steel pipe via another hose. The guided steel pipe is linked to the entrance of the casing annulus, achieving a conveying height of over 3 m. The third part is an adjustable support frame, designed to be detachable and height-adjustable. Its height can be adjusted within a range of 800 to 1200 mm. The conveying hose is made of PU polyurethane material and is reinforced with copper-plated steel wires. Both the support frame and the pneumatic generating device are made of stainless steel 316.
The schematic diagram of the pneumatic generator, a core component for pill particles transport, is shown in Figure 3. After the system is officially initiated, the air supply is connected to both the pneumatic motor and the pneumatic generator. All connections employ 8 mm quick-connect hose fittings. The air supply provides a pressure exceeding 500 kPa. Up to 20 kg of pill particles are loaded into the hopper, upon which the machine commences the discharge operation according to its pre-set program. The airflow enters the annular chamber through the air inlet and subsequently proceeds into the conveyance pipeline via the airflow delivery orifices, thereby achieving flexible pill particles-airflow transport.
The geometric parameters of the pneumatic generator include the conveying pipeline diameter Φd, annular chamber diameter ΦD, inlet diameter Φh1, air delivery orifice diameter Φh2, and jet angle θ. Among these parameters, the conveying pipeline diameter Φd and annular chamber diameter ΦD are determined by the fixed spatial constraints of offshore oil transportation systems, while the inlet diameter Φh1 is specified by the pneumatic conveying device itself. The position of the air delivery orifice resembles that of a sudden contraction in a pipe, where its size significantly affects the airflow characteristics. Moreover, the jet angle θ influences the trajectory of particle transport. Therefore, in this study, a multi-factor analysis and optimization are primarily conducted for the air delivery orifice diameter Φh2 and the jet angle θ to improve pneumatic conveying performance.

2.2. Mathematical Model for Pill Particles Transport

2.2.1. Gas–Solid Coupled Simulation Mathematical Model

To analyze the transport mechanisms of pill particles within the pipeline, a fluid–structure interaction numerical simulation was employed to investigate the motion characteristics of the pill particles flow under flexible pneumatic conveying. The airflow in the pipeline is primarily composed of air, which is treated as an incompressible fluid. The motion of the pill particles follows Newton’s second law of motion. The fluid phase is governed by the fundamental principles of fluid mechanics—mass conservation, momentum conservation, and energy conservation—corresponding to the Navier–Stokes equations, which describe the fluid motion. The expressions are given as follows [26]:
( ε g ρ l v g ) t + · ( ε g ρ g v g v g ) = ε g P + ε g · τ l + ε g ρ g g R g p
where ε g is the gas-phase volume fraction, ρ g ; is the density of the gas phase, kg·m−3; v g   represents the gas-phase velocity vector, m·s−1; P denotes the static pressure of the gas phase, Pa; τ g is the viscous stress tensor of the gas phase Pa.
In Fluent, the total momentum exchange is constituted by the integral of forces—including drag force, lift force, and other fluid-induced resistances—over the fluid mesh volume. This can be expressed by the following equation:
R t = i = 1 n m F t / Δ V t
where F t is the total force acting on the particle, N; nm is the number of particles within the mesh element; Δ V t is the volume of the mesh element, m3.
Given that the volume fraction of pill particles within the conveyance pipeline is less than 10%, this study employs a Euler-Lagrange one-way coupling approach to investigate the dynamic behavior of the particles under the influence of the airflow. The force analysis yields:
m p d υ p d t = F g + F G + F S + F M
I p d ω d t = T g
where F g is the fluid drag force, N; F G is the resultant force of gravity and buoyancy, N; F S ( F M ) is the Saffman lift forc (or Magnus lift force), N; I p is the moment of inertia of the particle, kg·m2; ω is the angular velocity of the pill particles, rad/s; T g is the torque acting on the pill particles, N·m.
The fluid drag force is generated by the relative motion between the particles and the fluid. Given that the airflow velocity is significantly greater than the particle velocity, this drag force acts as the driving force propelling the particles forward. It is commonly expressed as follows [27,28]:
F D = 1 2 C D ρ A v Δ 2
where F D is the fluid drag force, N; C D is the drag coefficient, dimensionless; ρ is the fluid density, kg/m3; A is the maximum cross-sectional area of the particle, m2; v Δ 2 is the relative velocity between the particle and the fluid, m/s.
For the flow past a particle, the drag coefficient CD is calculated as follows [29,30]:
C D = 24 R e R e 0.5 24 1.0 + 0.15 R e 0.687 R e 0.5 < R e < 1000 0.44 R e > 1000
where the Reynolds number (Re) is defined as follows:
Re = ρ v d u
where Re is Reynolds number; ρ is density of the fluid, kg·m−3; v characteristic velocity of the flow, m·s−1; d is characteristic length, m; μ is dynamic viscosity of the fluid, Pa·s.

2.2.2. Analysis of the Pill Particles Acceleration Process in the Pipeline

Considering the contact between the pill particles and the pipe wall, the pill particles are subjected to their own gravity, the buoyancy force opposite to the direction of motion exerted by the airflow, and the flow resistance. Under the combined action of the thrust from the high-speed airflow and gravity, the pill particles move through the pipeline. Based on Newton’s second law of motion, the acceleration equation of the pill particles can be derived.
F D + G = 4 3 π r m 3 d v m d t × 10 9
where F D is the drag force acting on the pill particle in the airflow, N; G is the gravity acting on the pill particle, N; r m is the theoretical radius of the pill particle, m; v m is the velocity of the pill particle in the airflow, m/s.
By combining Equations (5), (6), and (8), the equation describing the pill particle acceleration process in the conveyance pipeline can be derived as follows [31]:
d v m d t = 3 C D ρ g Δ V 2 8 ρ m r + G 8 π r m 3 ρ m
Equation (9) is the differential equation of motion describing the pill particles acceleration process within the conveyance chamber. It demonstrates that the acceleration of the particles is positively correlated with the airflow velocity in the stable acceleration zone. Since the pneumatic force required for the pill particles conveying process is primarily supplied by the pneumatic generator, the optimization of its structural parameters therefore plays a pivotal role in the efficiency of particle transport.

2.3. Verification of the Simulation Model

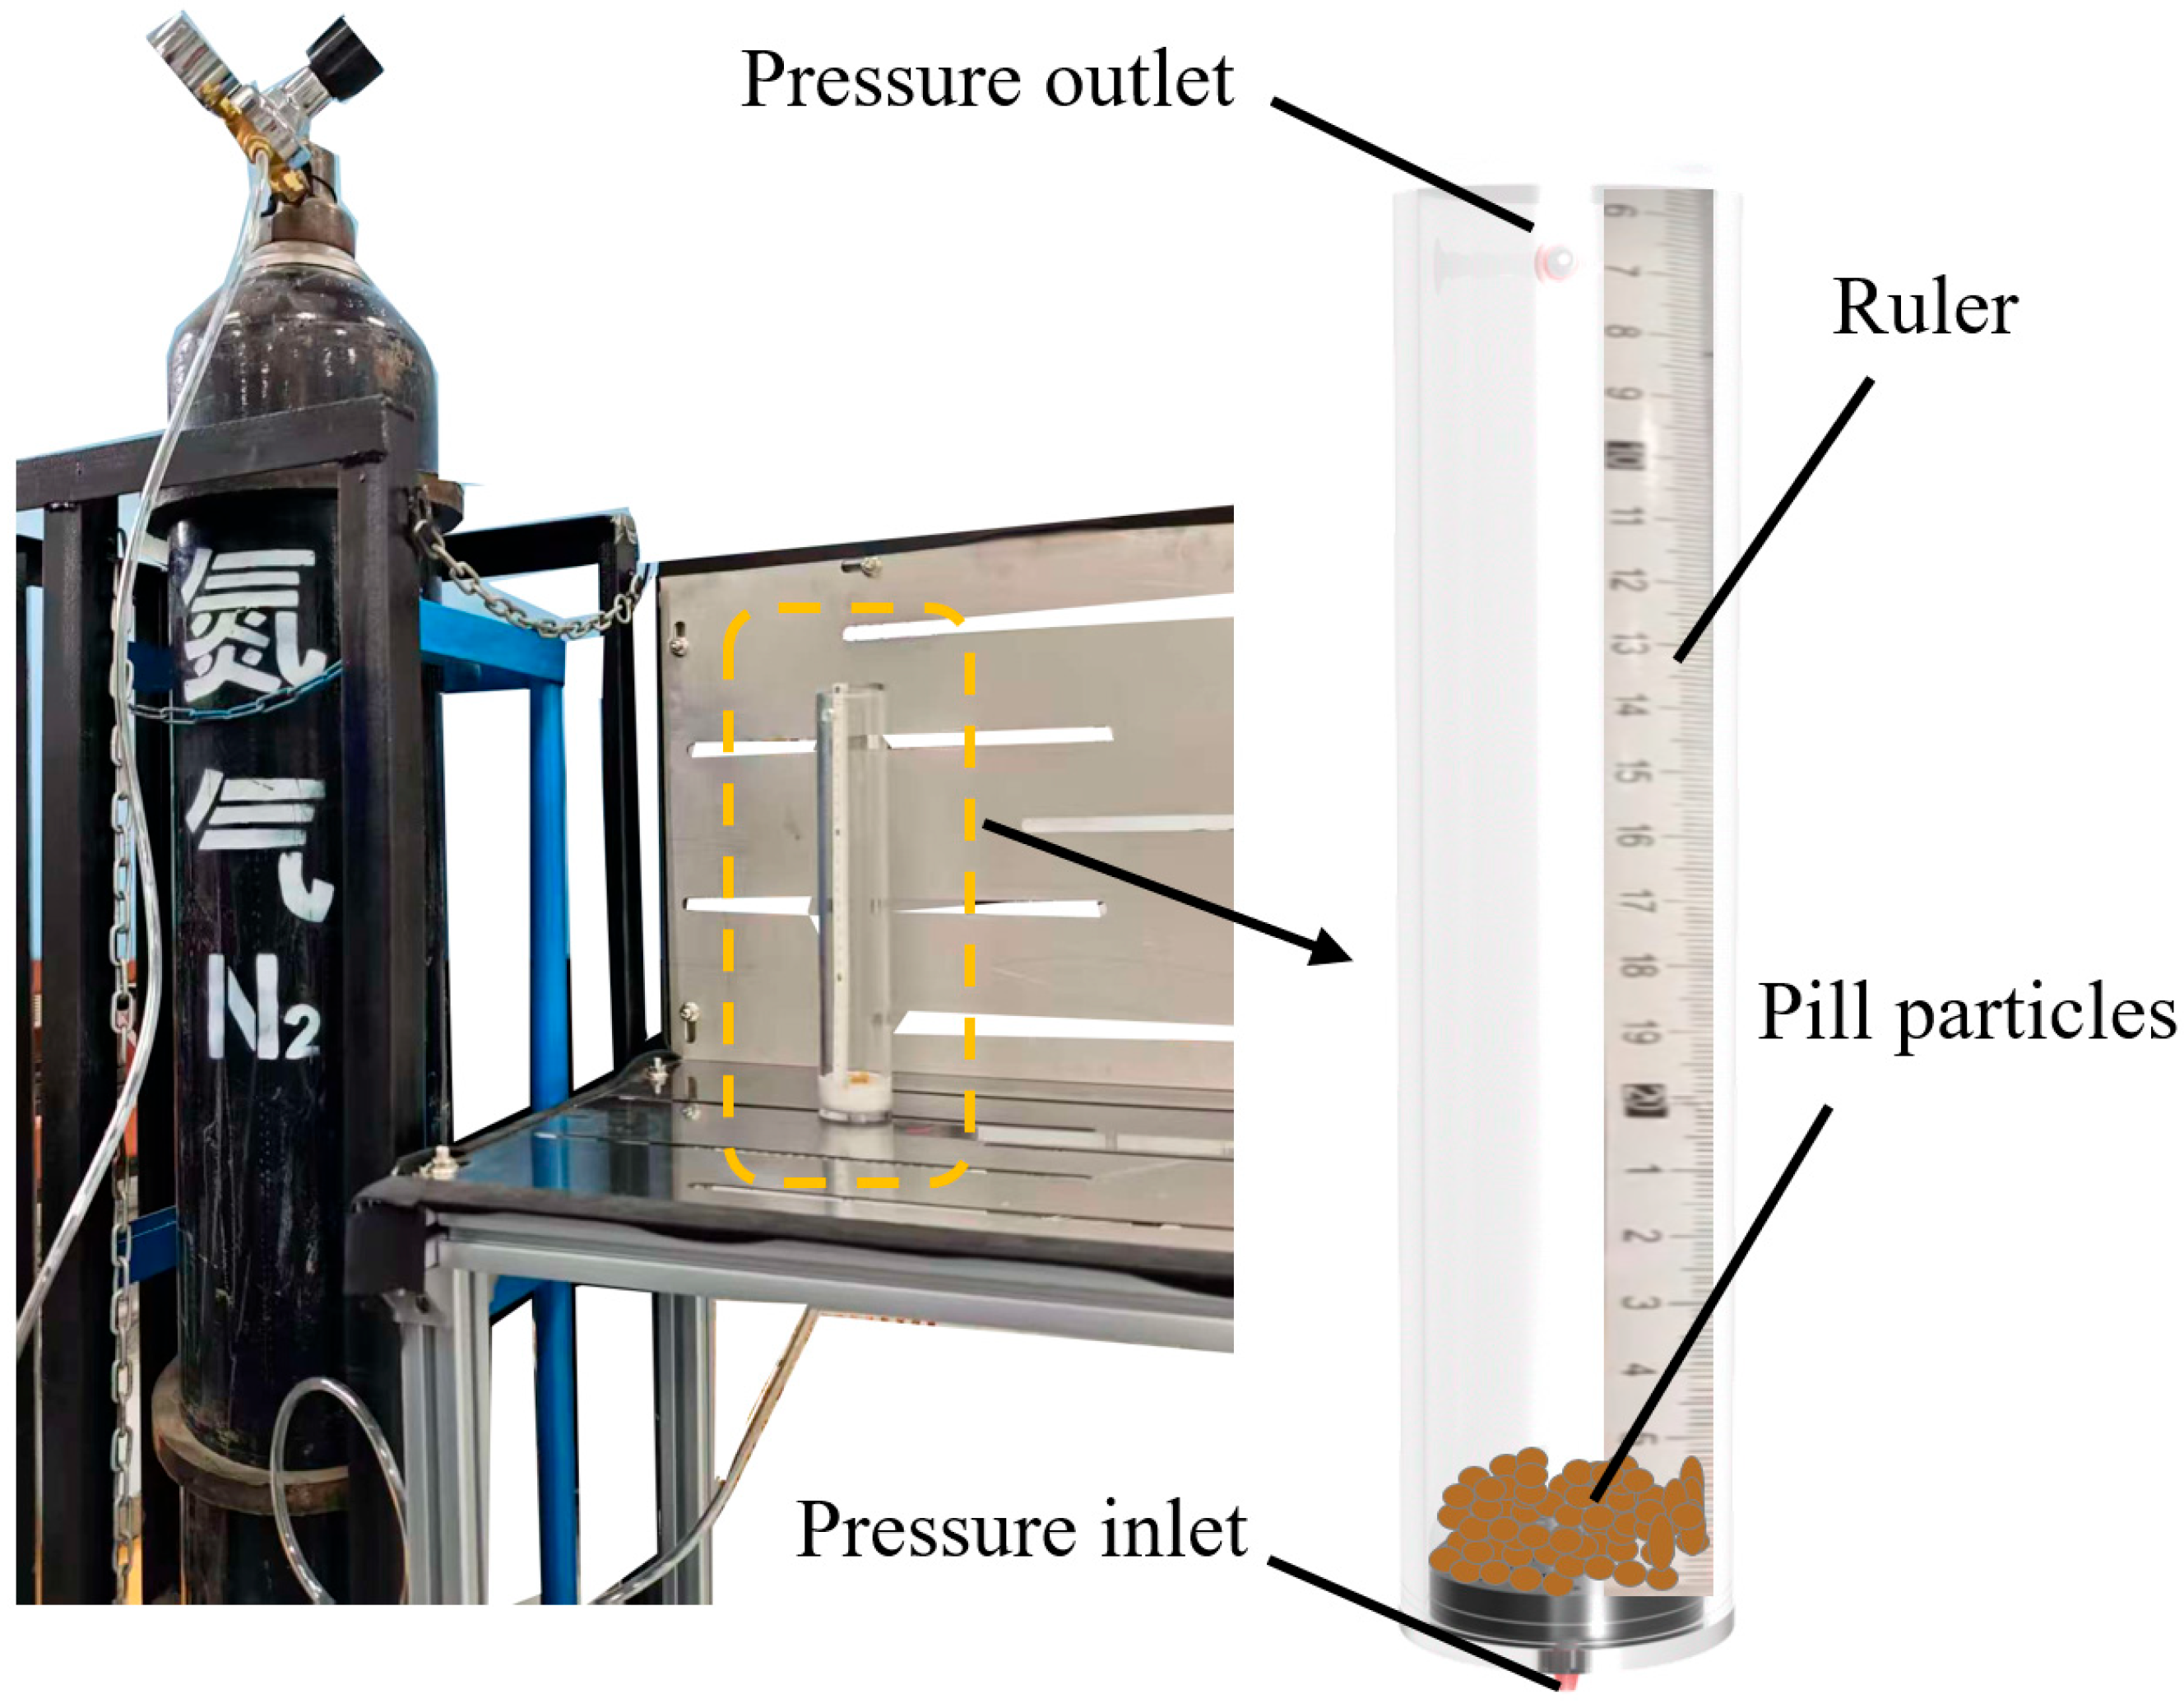
This study employs an approximate fluidized bed experiment to validate the accuracy of the simulation model. The experimental setup is shown in Figure 4. The drug particles are evenly distributed inside the test tube device, forming a solid bed layer. Airflow enters the pipeline from the lower section, and as the flow velocity increases, the drug particles begin to move, causing the bed to expand. As the flow velocity further increases, the particles separate from each other and move disorderly in the fluid. The greater the flow velocity, the more intense the particle movement, and the particles move in all directions throughout the bed layer. Some researchers have used fluidized bed experiments to validate DEM-CFD coupled simulation models, with evaluation indicators such as particle sulfidation height and pressure drop. This study, however, uses the visualized particle rise height for qualitative validation of the accuracy of the simulation model developed in this research.

3. Numerical Simulation Analysis of a Pneumatic Feeding Device for Pill Particles

The anti-corrosion particle system employed in this study consists of a corrosion inhibitor as the primary component (mass fraction: 65–72%), a synergistic composite additive (8–12%), an inert mineral filler serving dual functions of filling and density regulation (15–20%), and an organic binder facilitating particle formation (≤5%). The low binder content results in insufficient mechanical strength of the particles, making them susceptible to plastic deformation and brittle fracture during transportation. Consequently, a pneumatic conveying method is adopted. This research utilizes both single-factor and multi-factor DEM-CFD coupled simulations to analyze the flow field distribution of pneumatic conveying devices with different structural parameters and the kinetic behavior of the pill particles.

3.1. Model Processing and Boundary Conditions Definition

(1)
Mesh Generation for the Pneumatic Conveying Device
The 3D model of the pneumatic conveying device was imported into Ansys Design modeler (Ansys, Canonsburg, PA, USA) to extract the internal flow domain as the computational fluid region. The mesh of the computational fluid domain. The global minimum mesh size was set to 3 mm, and the global maximum mesh size was 5 mm, with a polyhedral mesh type. Local refinement was applied to the mesh at the airflow conveying orifice. The orthogonal mesh quality achieved a value of 0.97, meeting the requirements for simulation.
(2)
Determination of Boundary Conditions for DEM-CFD Simulation
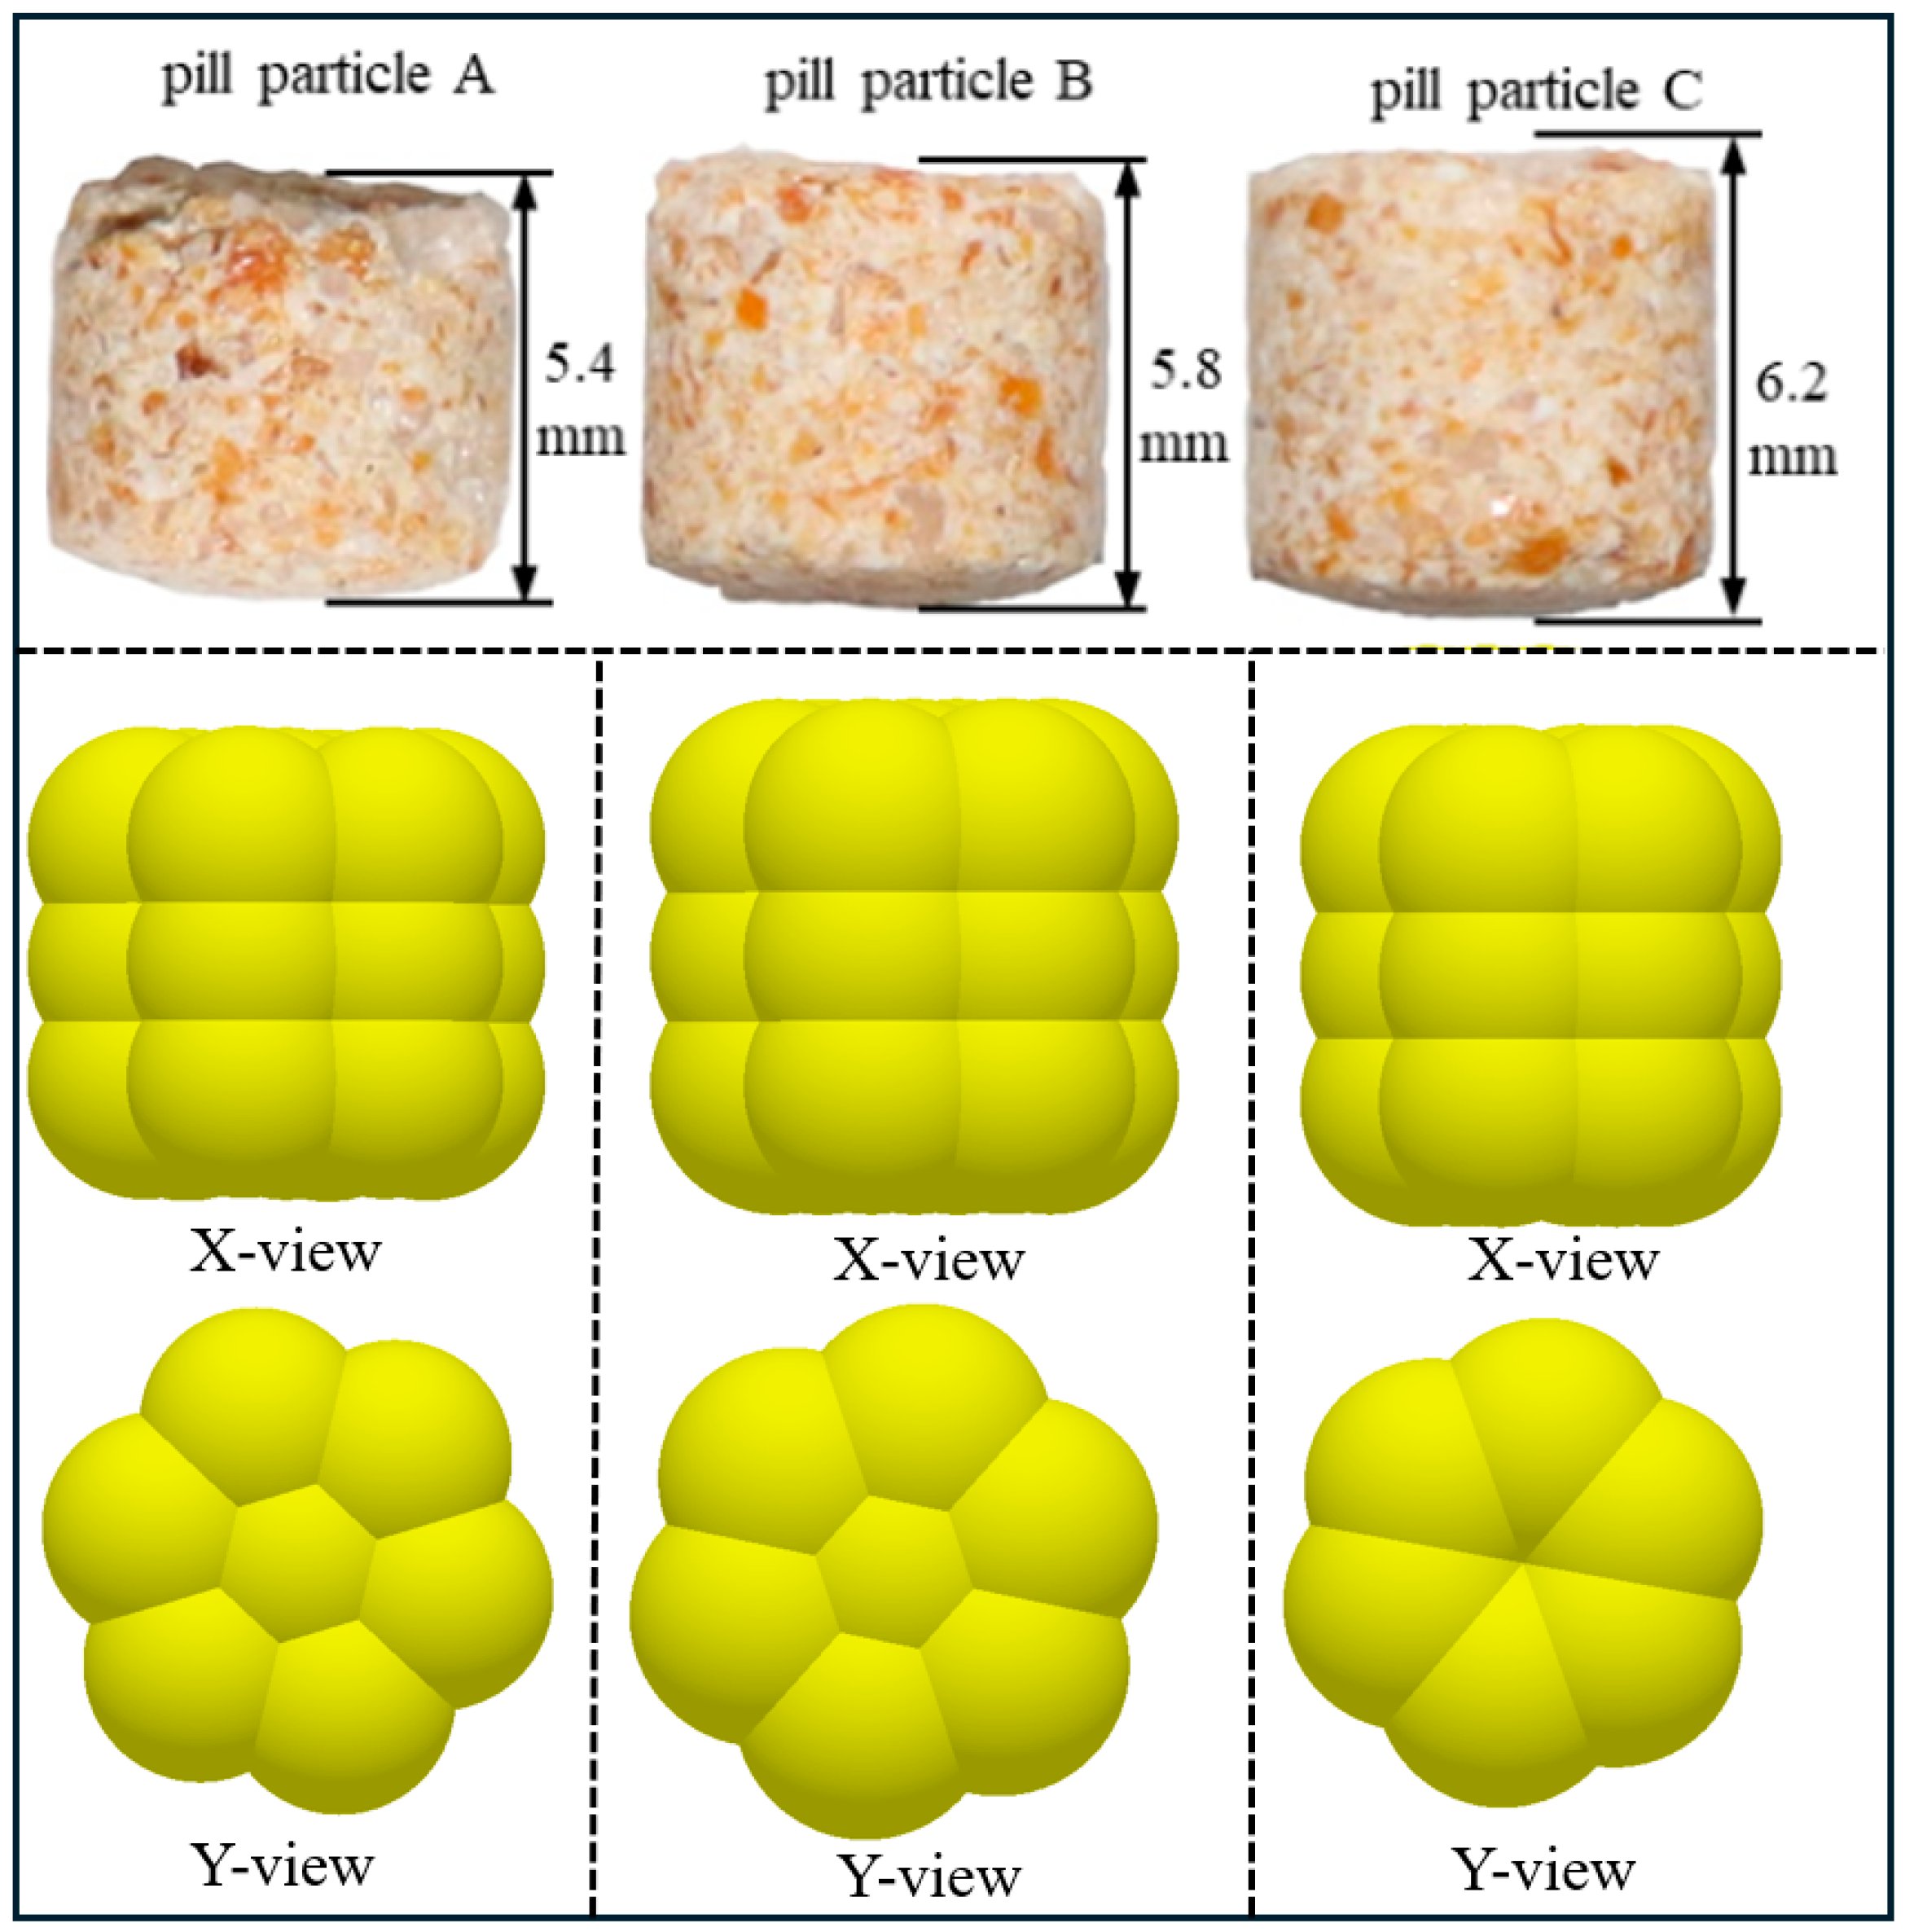
Using independently developed annular corrosion inhibitor particles as the research object, and based on geometric characteristic tests and analysis, the particles were categorized into three types according to their heights: 5.4 mm, 5.8 mm, and 6.2 mm, with mass percentages of 35%, 35%, and 30%, respectively. A population model method for the particles based on the EDEM 2022 was proposed. Accordingly, numerical models for the three types of particles were established using an 18-sphere model, as shown in Figure 5. Based on physical property tests and analysis, parameters such as density, elastic modulus, and static friction coefficient were measured. The rolling friction coefficient was calibrated through repose angle experiments and simulation analysis [32].
The simulation model is shown in Figure 6, and the mechanical parameters used are as shown in Table 1. In this problem, the corrosion inhibitor particles developed by the research team have a diameter ranging from 5 to 6 mm. Due to the local grid refinement, the grid of the airflow delivery holes is approximately 0.5 mm. Even if the pipeline grid exceeds 6 mm, it will not capture the fluid details properly. However, for the entire transport model in this paper, the volume is large, and the number of grids is extensive. The use of bidirectional coupling means that the interaction between the fluid and particles involves not only the forces from the fluid on the particles (such as drag force, collision force, etc.), but also the reaction forces from the particles on the fluid, which significantly increases the computational load. Referring to other scholars’ papers on pneumatic conveying of particles, and considering both the time cost and computational accuracy, the DEM-CFD coupling interface adopts Euler–Lagrange coupling method. When DEM-CFD coupling is required, Fluent 19.2 is typically 50 to 100 times larger than EDEM’s Fluent. Therefore, the time steps for EDEM and CFD are set to 9 × 10⁻⁶ s and 9 × 10⁻⁴ s, respectively, and the calculation step is set to 10,000. The total simulation time is 9 s, with data recorded every 0.005 s in both EDEM and Fluent.

3.2. Simulation Test Contents and Methods

To optimize the overall structure of the pneumatic generator, a DEM-CFD coupled simulation was performed based on the aforementioned theoretical analysis to investigate the pressure gradient distribution in the airflow field and the kinetic behavior of the pill particles. The particles undergo three stages within the conveying pipeline: free-fall stage, initial acceleration stage, and ascent stage. The overall structure is determined by six parameters: the conveying pipeline diameter Φd, the annular cavity diameter ΦD, the inlet diameter Φh1, the airflow conveying orifice diameter Φh2, the injection angle θ, and the number of orifices N. Among these, the conveying pipeline diameter, annular cavity diameter, and inlet diameter are constrained by external structural design. Therefore, a response surface experiment was conducted with the airflow conveying orifice diameter Φh2 and the injection angle θ as variables, and the particle outlet velocity at outlet N as the evaluation index, to optimize the structure of the pneumatic generator. The experimental design is presented in Table 2.

3.3. Validation of the Discrete Element Model for Pill Particles

This experiment uses fluidized bed testing to calibrate the simulation model and validate its accuracy. The inlet air pressure is 0.6 MPa, and approximately 20 to 30 drug particles are used. Figure 7 shows the motion of the drug particles in both the simulation model and the bench experiment. Due to instrumental and observational measurement errors, as well as the interactions between particles and the unevenness of the airflow, the experimental results often show fluctuations. However, the results indicate that the bench experiment and simulation results are generally consistent, qualitatively validating the accuracy of the DEM-CFD model.

4. Results and Discussion

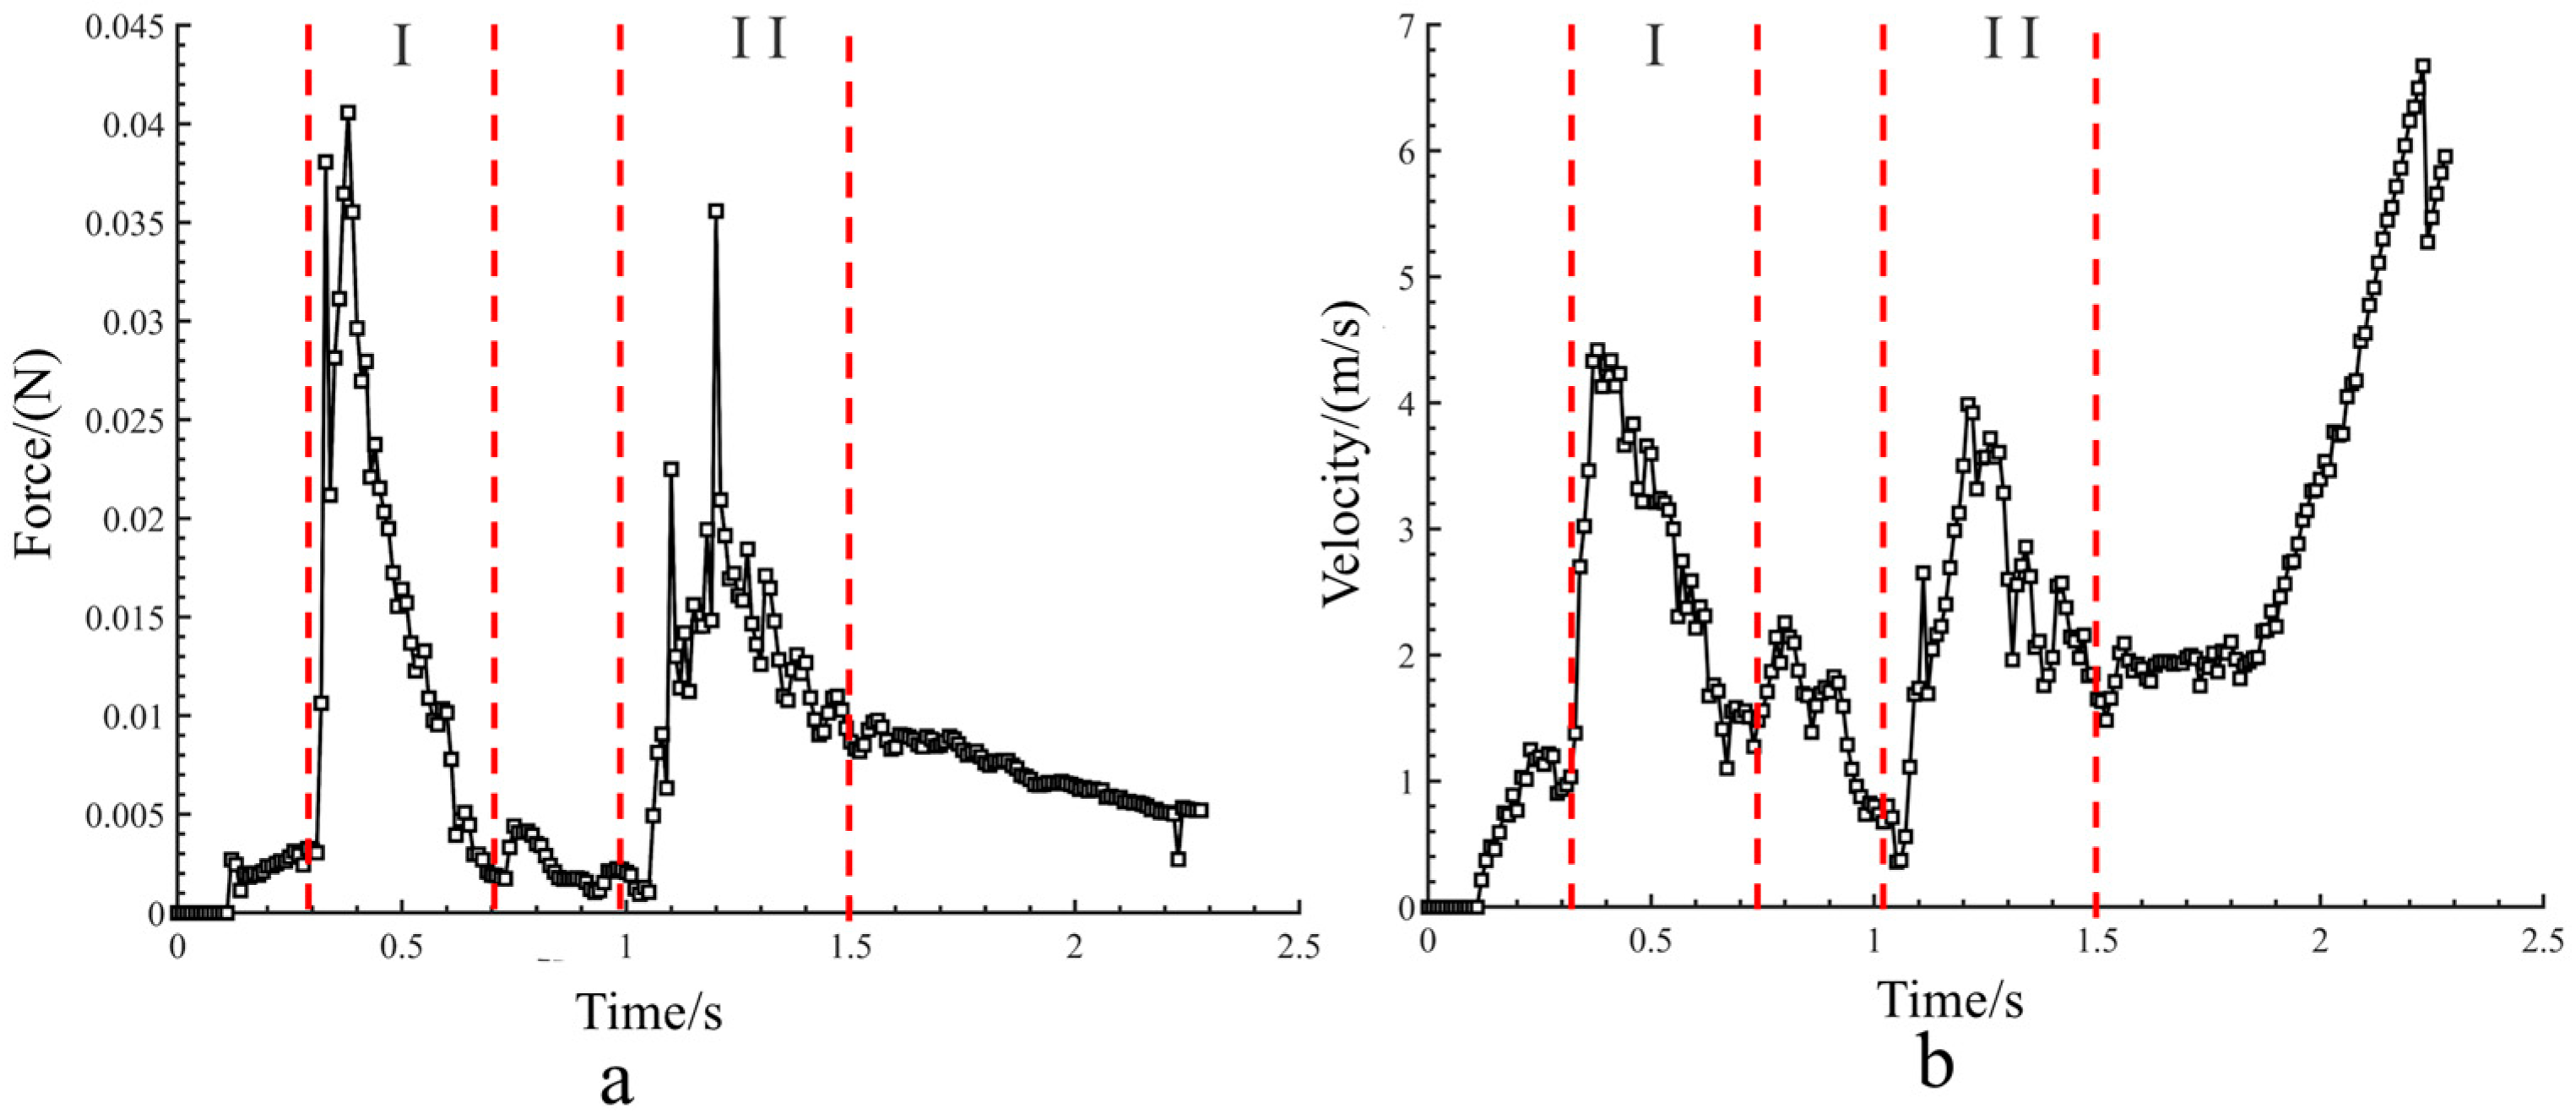
As shown in Figure 8, under a conveying pressure boundary condition of 0.25 MPa, the velocity variation and the forces acting on the pill particles in the pneumatic additive device for solid corrosion inhibitors are presented. Figure 8a,b illustrate that, in Stage I, under the influence of positive pressure airflow, the pill particles enter the pneumatic generator from the particle reservoir. After undergoing an annular airflow acceleration process, both the particle velocity and the magnitude of the coupled force increase rapidly. Subsequently, the particles enter a transition stage where due to frictional losses along the flow path, the coupled force on the particles decreases, and their velocity stabilizes. After passing through a bent pipe, the particles move into the height ascent stage. In Stage II, the particles undergo secondary acceleration by the annular airflow within the pneumatic generator. As shown in Figure 9, during the ascent stage of the pill particles, the airflow distribution remains stable, the coupled force acting on the particles is relatively consistent, and the particle velocity increases steadily, enabling stable upward transport.

4.1. Single-Factor Simulation Analysis of Conveying Pressure

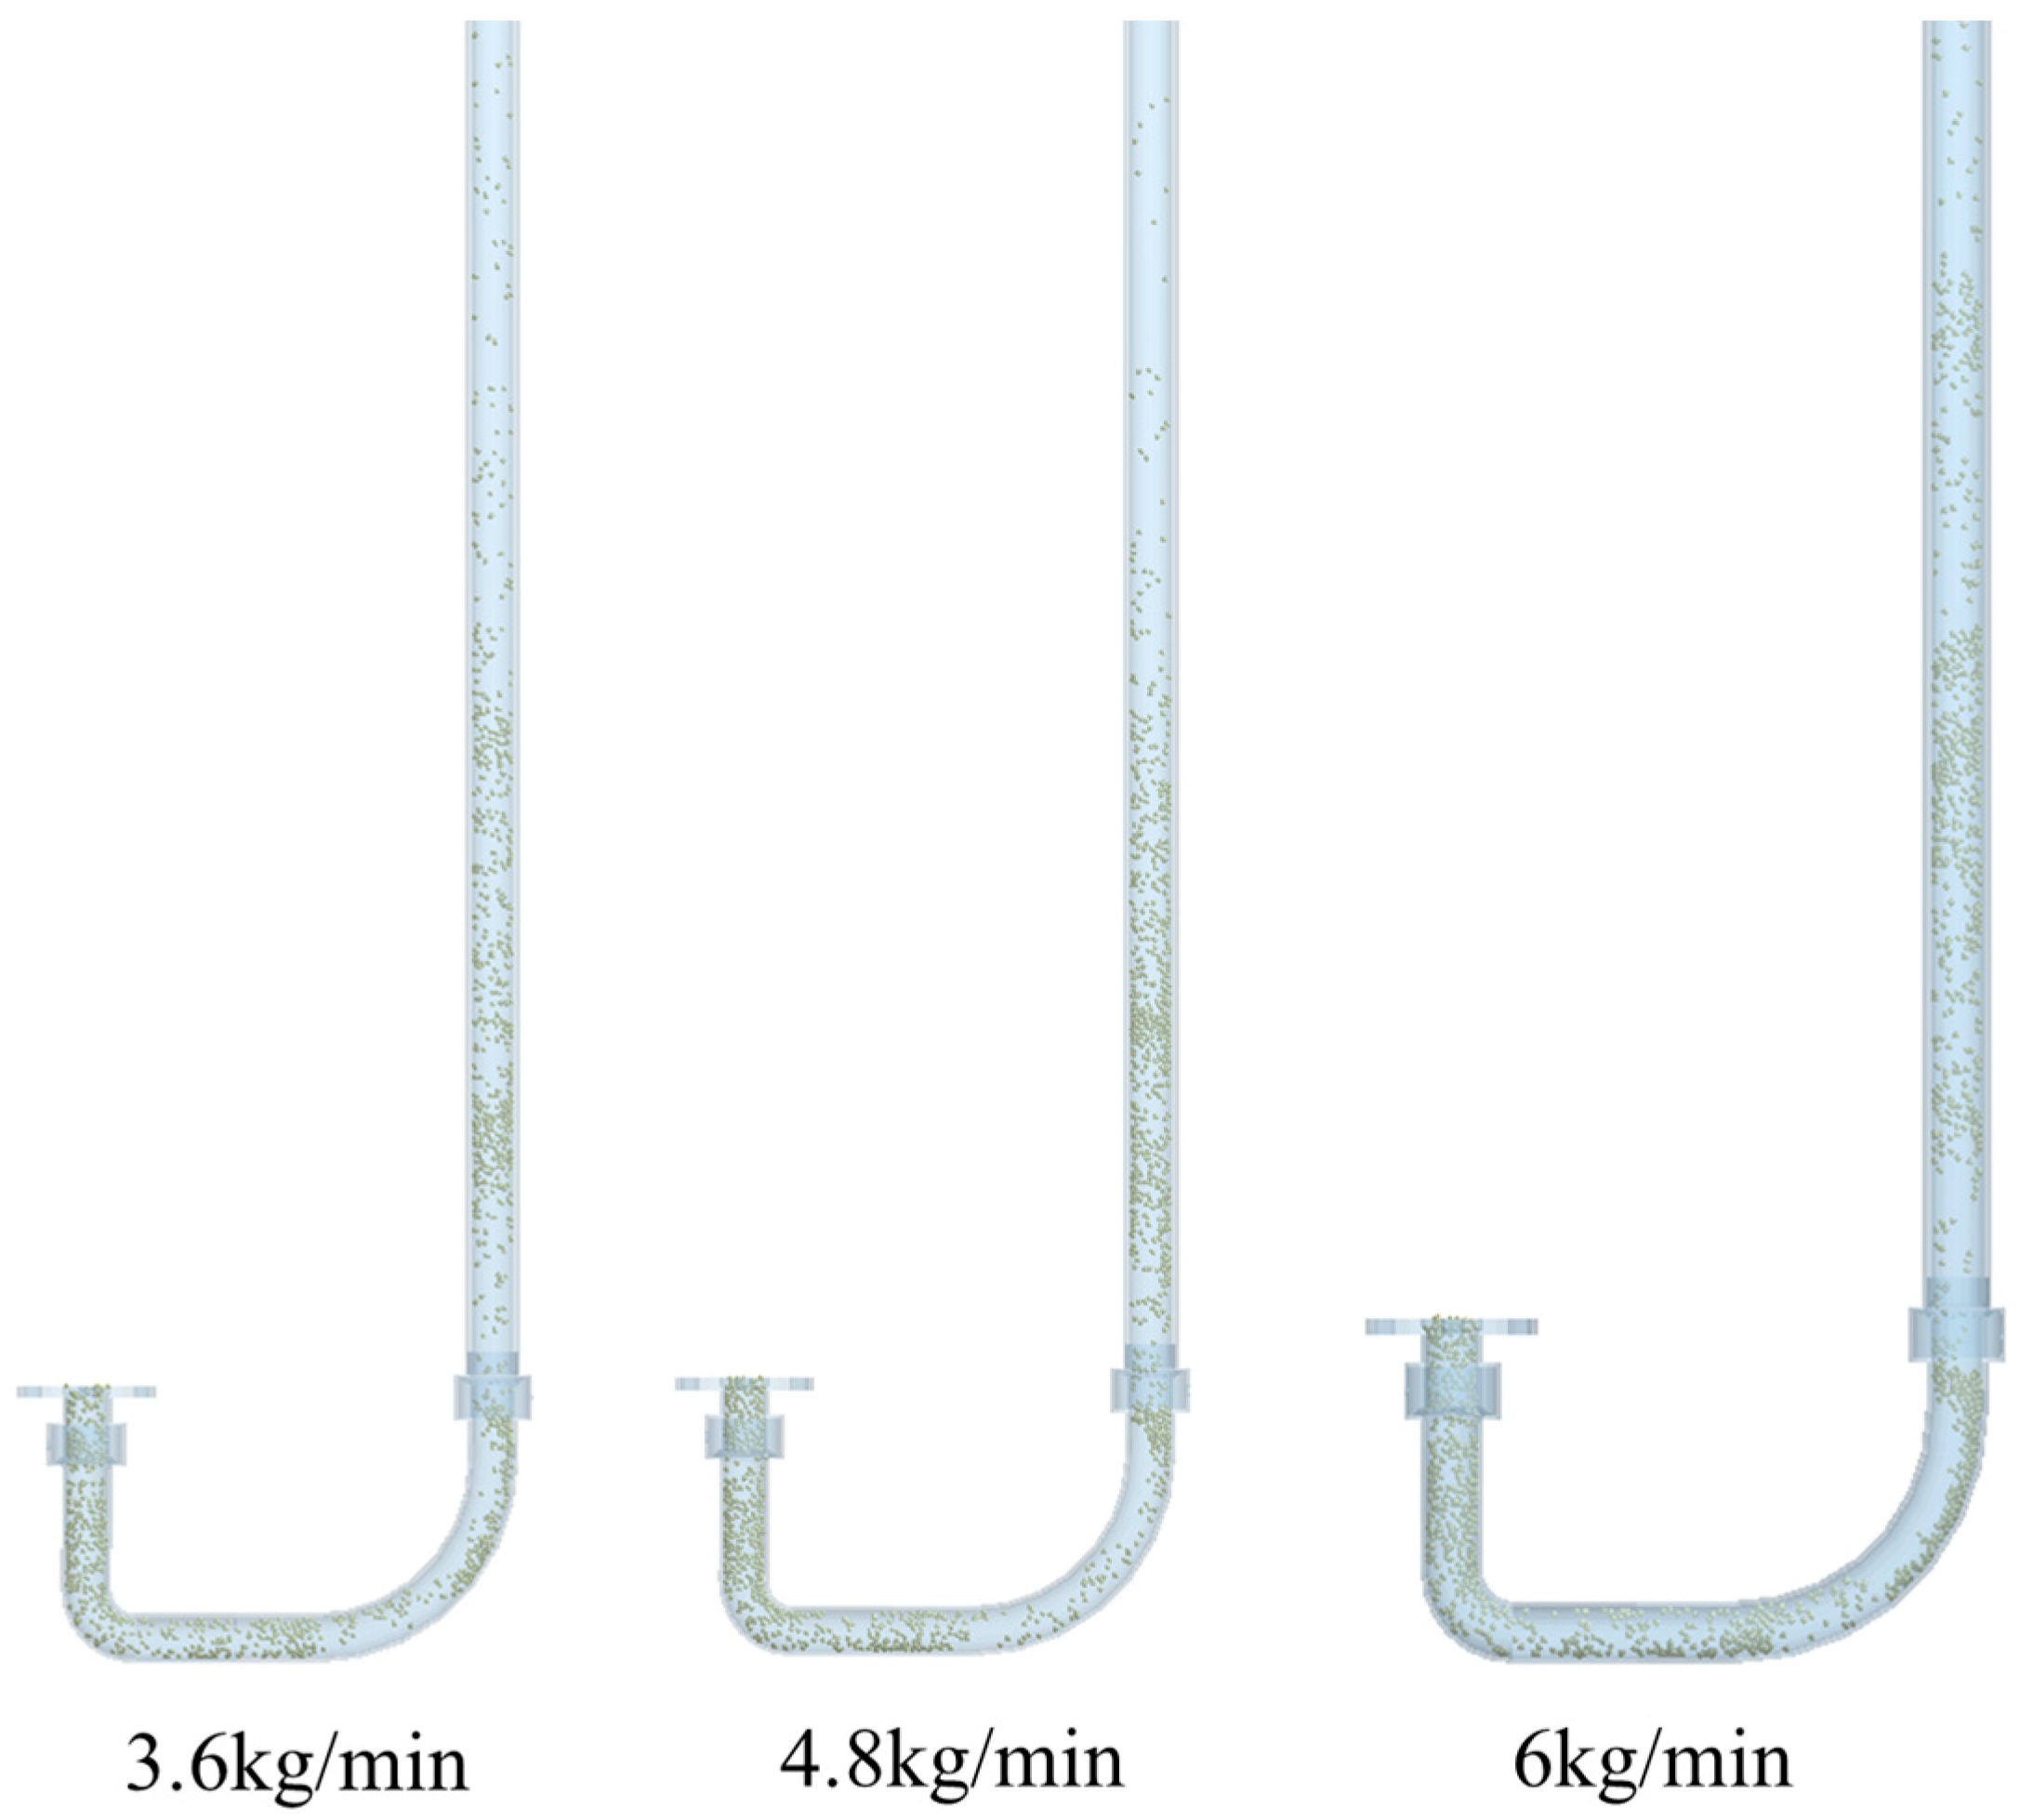
To investigate the particle conveying behavior in the pipeline at different feeding rates, gas–solid coupled simulation tests were conducted at feeding rates of 3.6 kg/min, 4.8 kg/min, and 6.0 kg/min, with a conveying pressure of 0.20 MPa. The results are shown in Figure 10. At feeding rates of 3.6 kg/min and 4.8 kg/min, the pill particles were transported stably through the pipeline. However, at a feeding rate of 6.0 kg/min, particle accumulation occurred at the bend, accompanied by disordered and chaotic collisions. To determine the minimum suitable conveying pressure, simulations were performed at pressures of 0.15 MPa, 0.20 MPa, and 0.25 MPa. Based on the project requirement of 5 kg/min, the simulation was configured with a discharge time of 50 s for 5 kg of pill particles. As shown in Figure 11, at lower pressure levels, particles tended to accumulate at the bend. In the curved section, centrifugal forces induced a pressure gradient across the cross-section, resulting in uneven airflow distribution. This effect also promoted secondary flows and vortex formation, leading to significant energy loss. Regarding particle motion, the centrifugal force required a centripetal force from the outer wall of the bend to facilitate particle turning, which contributed to particle accumulation in this region. When the conveying pressure was increased incrementally by 0.05 MPa, at 0.25 MPa, the particle velocity was sufficient to overcome gravity and allow particles to enter the secondary pneumatic generator for re-acceleration. Under this condition, the particles ascended steadily.

4.2. Multi-Factor Coupled Simulation Analysis

The key component of the pneumatic conveying process in the confined space of offshore oil and gas wells is the pneumatic generator. The diameter and number of the airflow conveying orifices not only influence the airflow distribution but also play a role in seawater corrosion protection, as required for offshore conveying. The interior of the pneumatic generator functions similarly to a sudden contraction tube in fluid mechanics, resulting in pressure loss. When the orifice diameter is small and the number of orifices is low, although pressure loss is relatively high and the airflow is reduced, higher backpressure can be achieved. The pneumatic generator is connected to the pipeline through sealed threaded holes, and the backpressure effectively prevents seawater from entering the pipeline, protecting the conveying device. Therefore, the orifice diameter and the number of orifices are critical structural parameters for enabling efficient particle conveyance in the pneumatic generator.
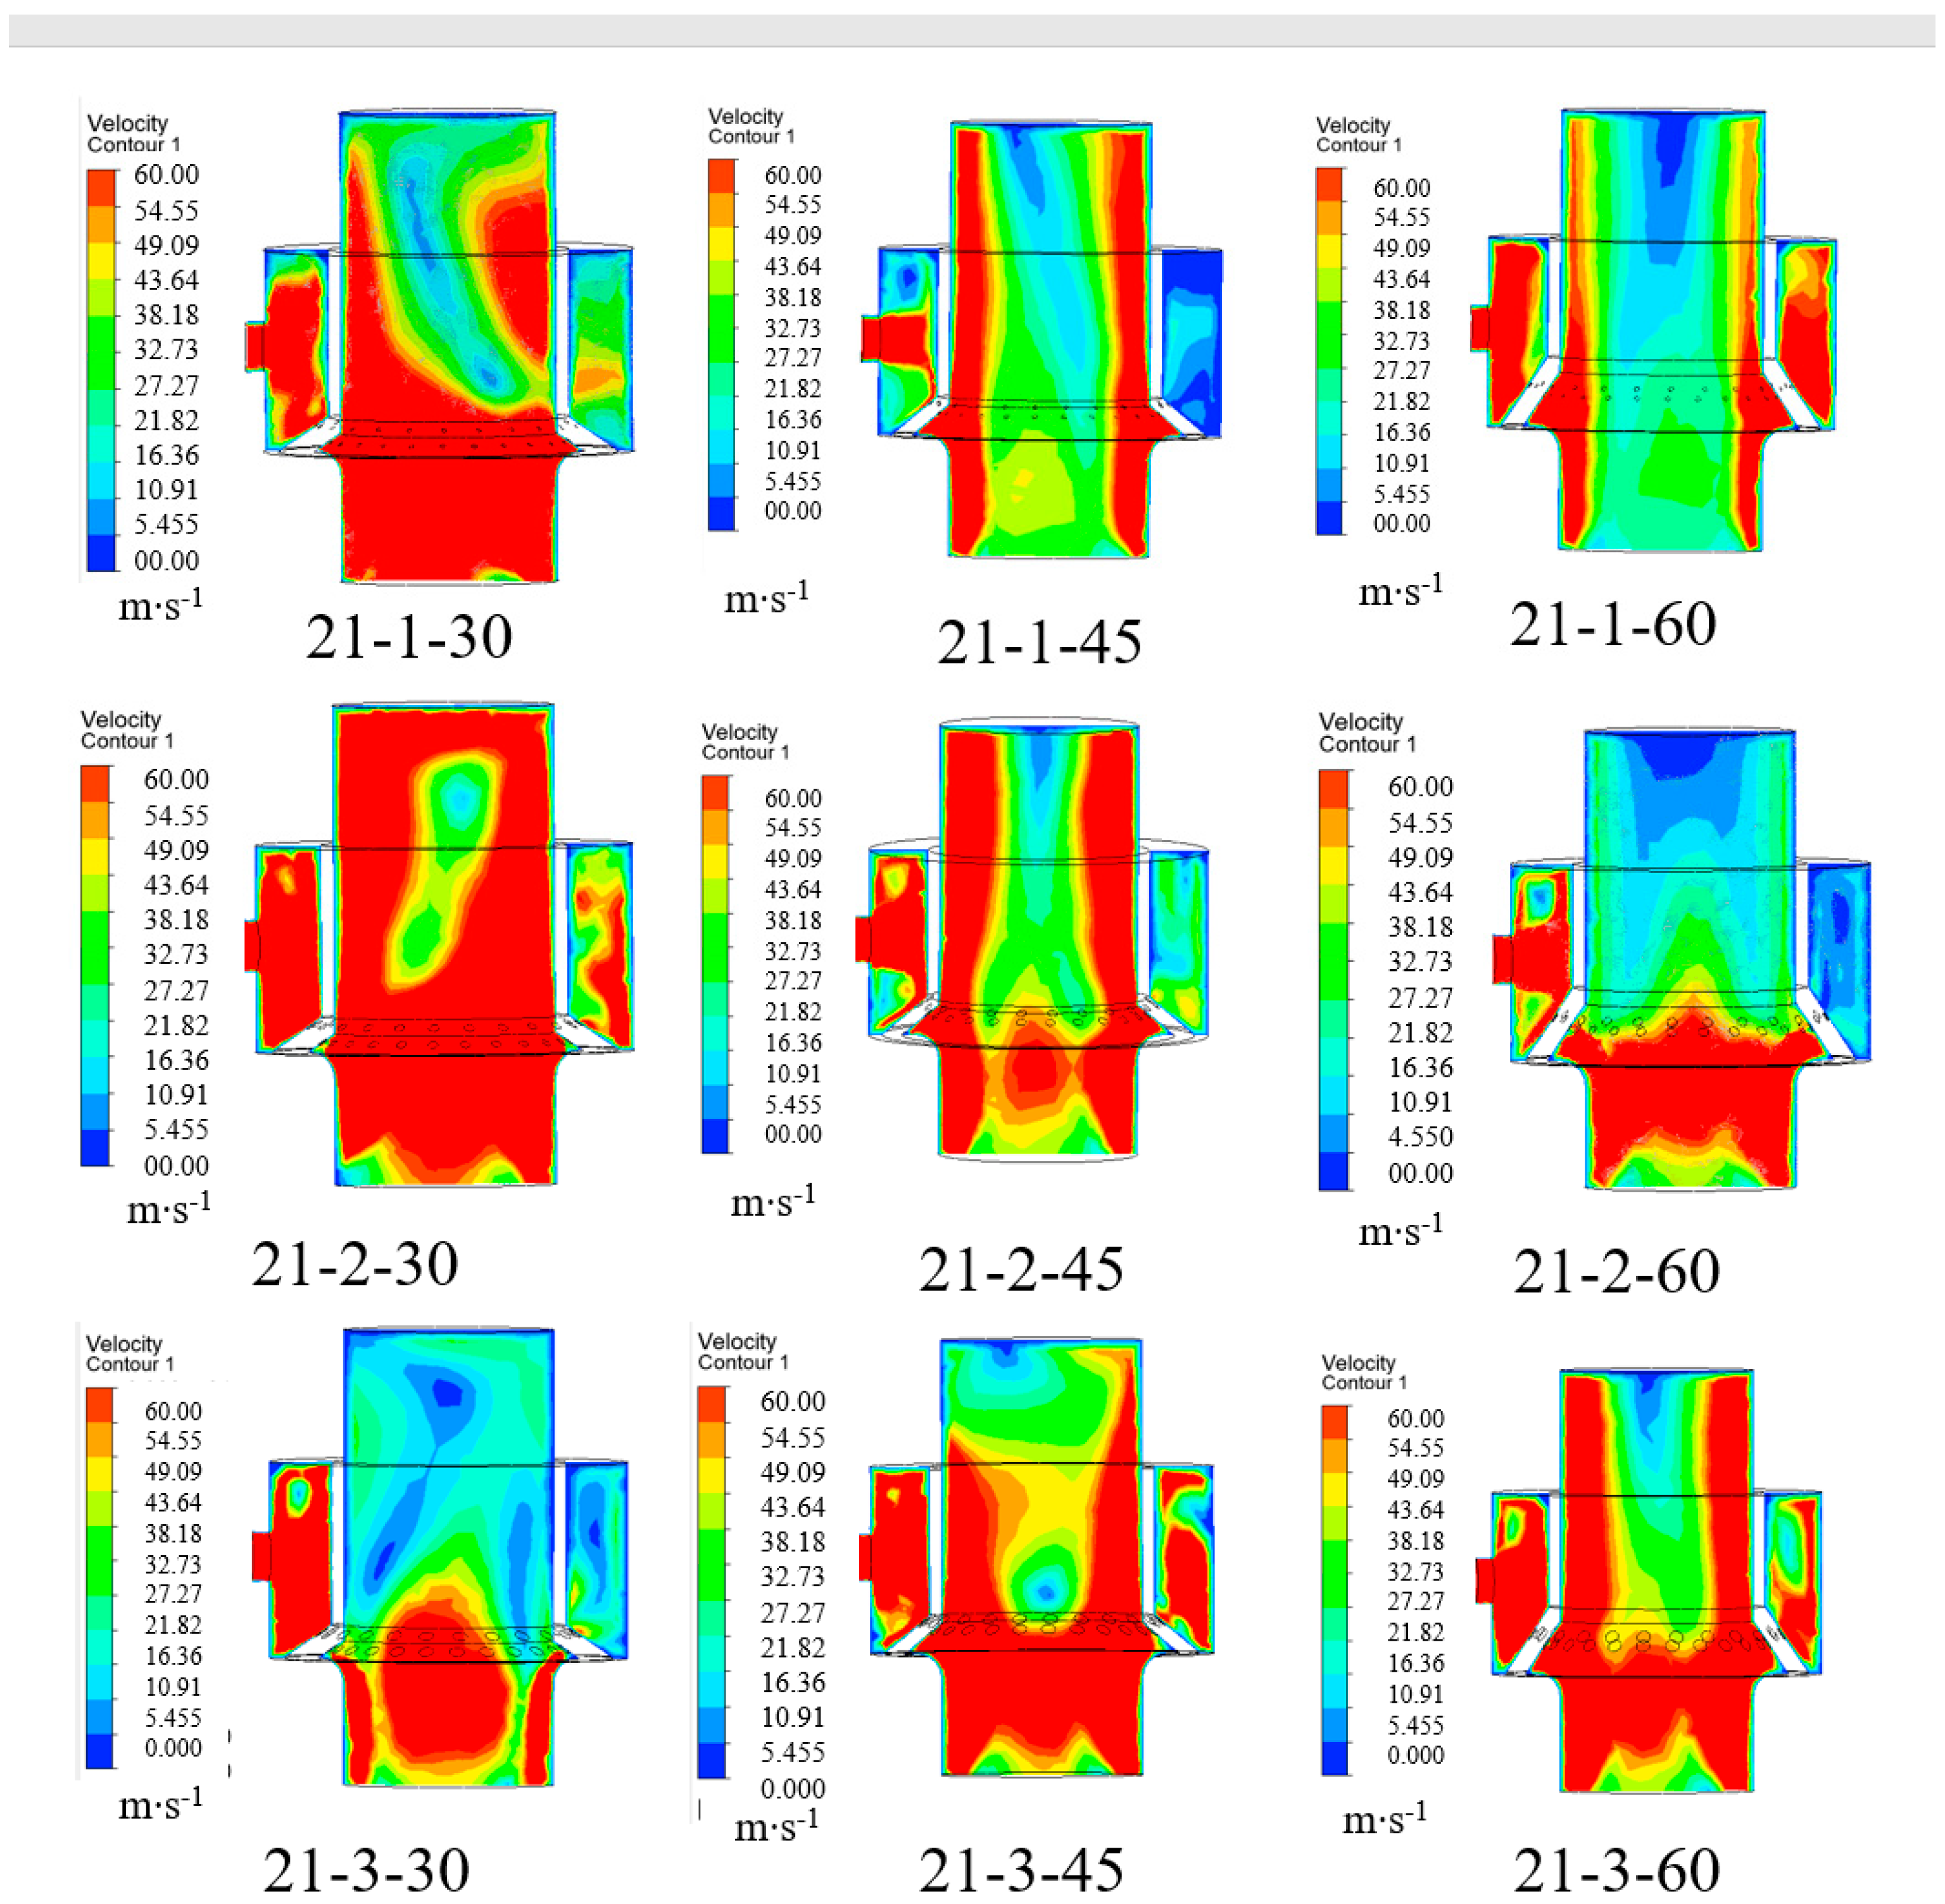
Figure 12 shows contour plots of the velocity flow field distribution in the pneumatic generator under varying conditions. A horizontal comparison reveals that, for the same number and diameter of orifices, the airflow distribution is more stable with a larger inclination angle. The airflow can be ideally treated as infinitesimal micro-elements. When the inclination angle is small, the jets emitted from the orifices converge and collide in the central region, resulting in a disordered airflow distribution and significant energy loss. Conversely, when the inclination angle is excessively large, the airflow intensity in the central part of the pipeline decreases, which reduces the conveying velocity provided to the particles. A vertical comparison indicates that, for the same number of orifices and inclination angle, a larger orifice diameter increases the airflow volume but reduces the airflow velocity, due to the principle of flow conservation.
The results of the Box–Behnken three-factor, three-level experiment are presented in Table 3. The model showed a highly significant difference (p < 0.0001), while the lack-of-fit term was not significant (p = 0.0390), indicating that the regression equation fits the experimental data with good accuracy and reliability. Unknown factors had relatively minor interference with the experimental results, confirming that the model is suitable for analyzing and predicting the effects of the three factors on particle exit velocity. The analysis of variance (ANOVA) results are presented in Table 4. ANOVA was performed using Design-Expert software to evaluate the applicability and significance of the model. The experimental data were subjected to variance analysis and quadratic polynomial regression fitting, yielding the following quadratic polynomial equation:
Y = 0.5512 A + 0.1625 B + 0.4438 C + 0.1050 A B + 0.0750 B C 0.0954 A 2 + 7.20
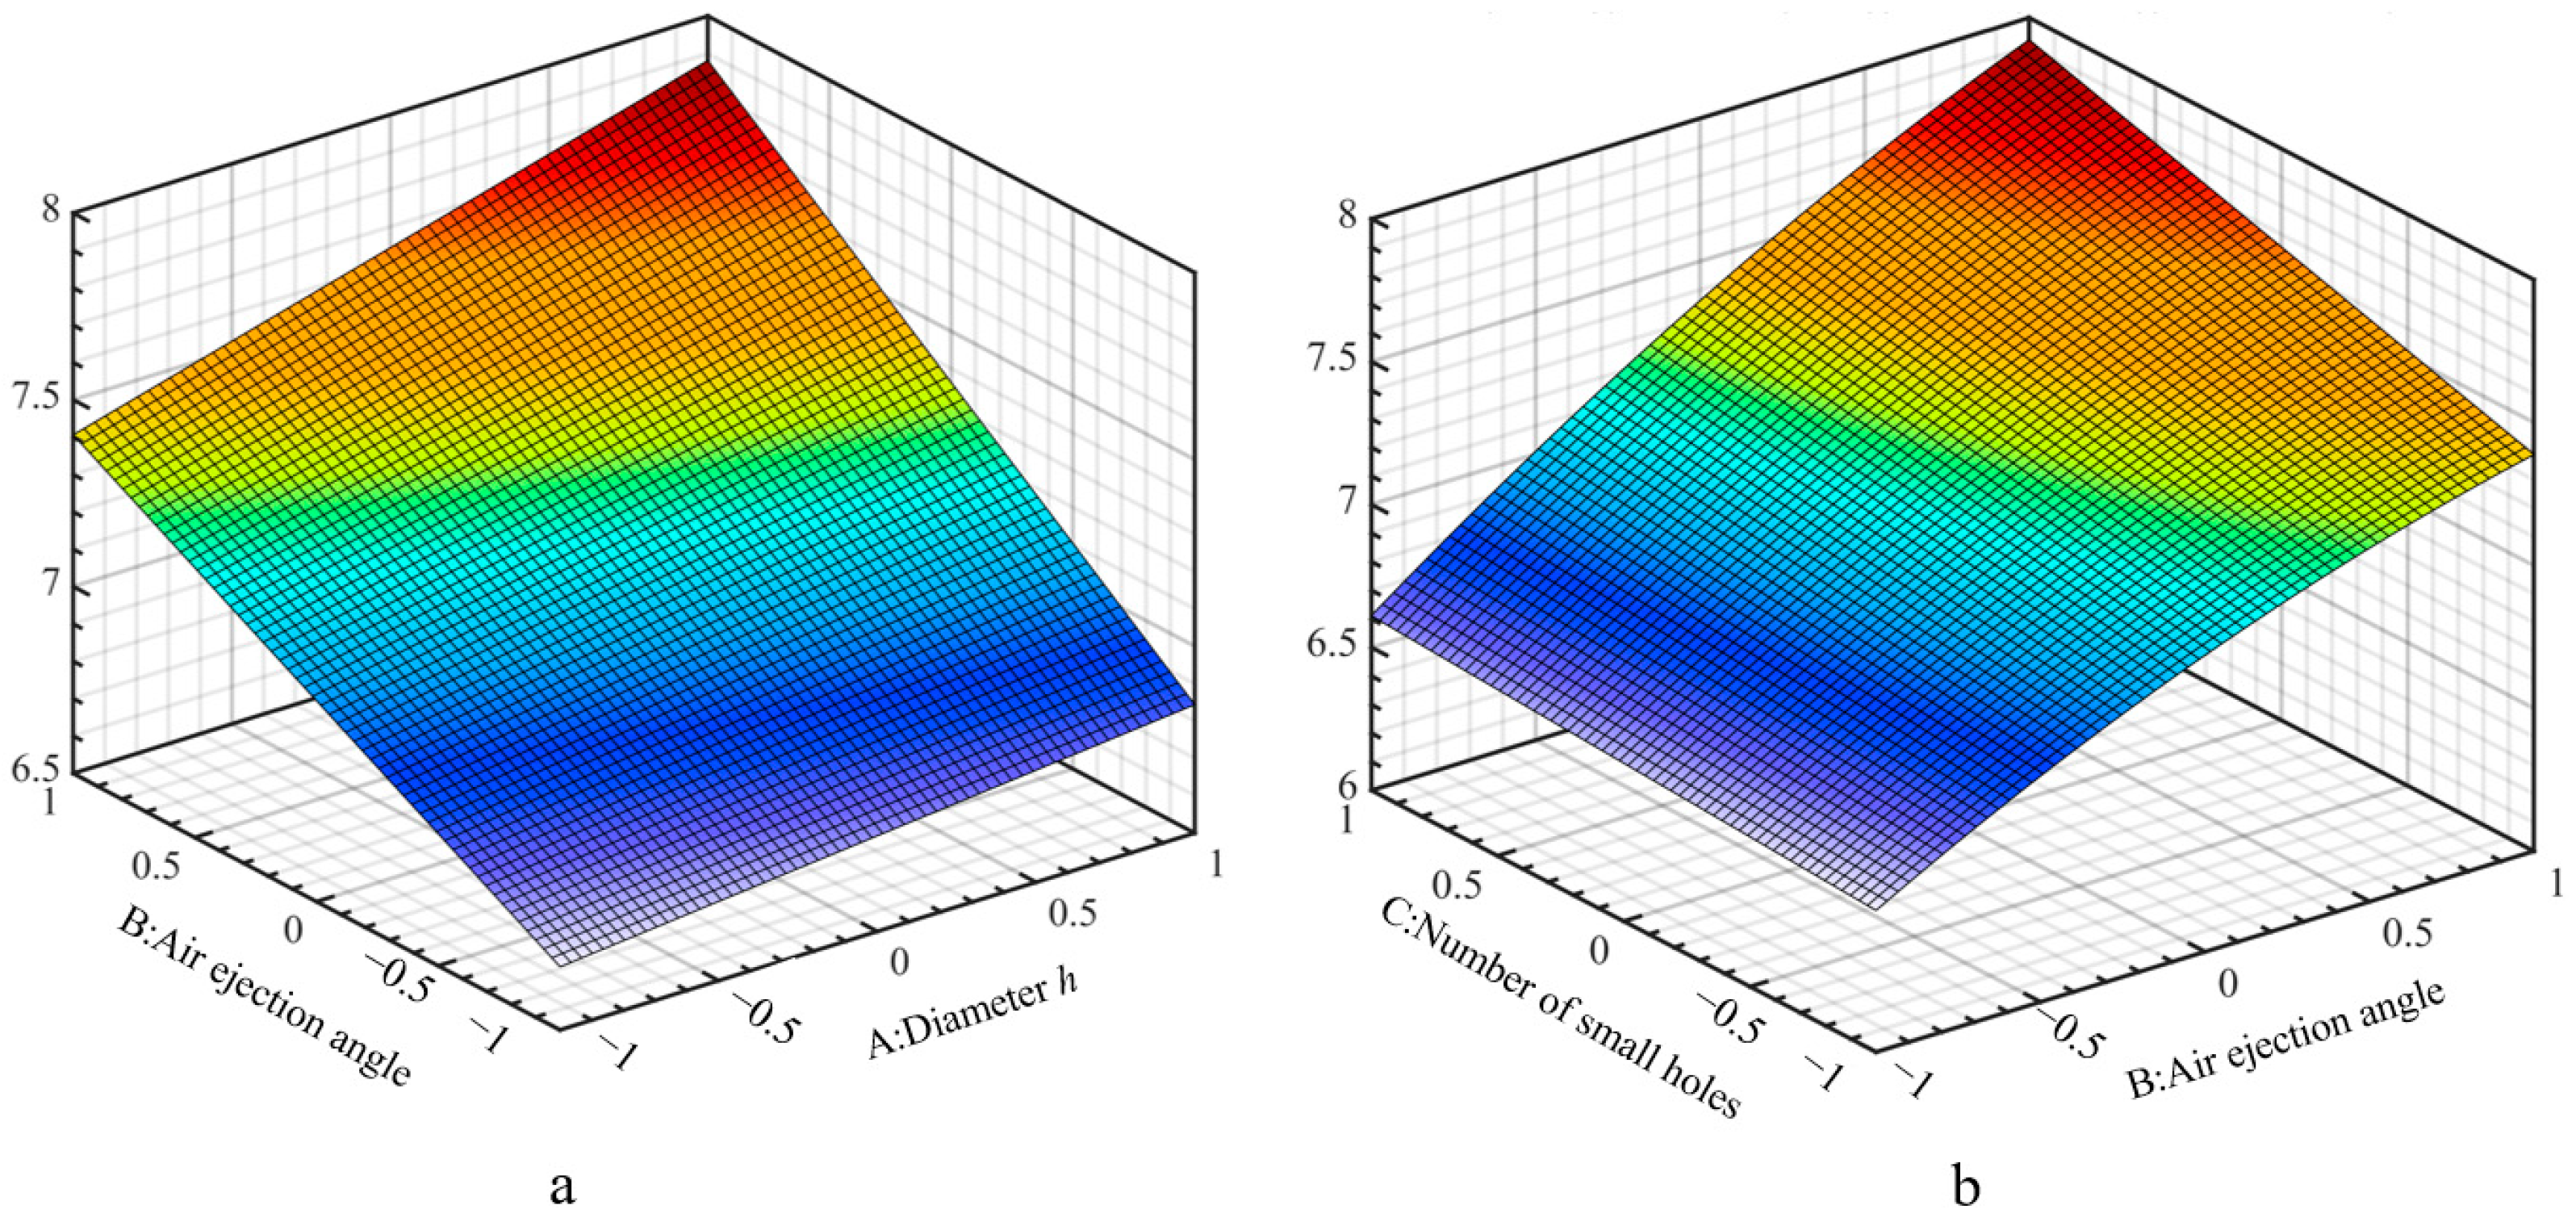
Based on the results of the regression analysis, 3D response surface plots were generated to illustrate the interactive effects of orifice diameter, injection angle, and number of orifices on particle exit velocity within the conveying pipeline. As shown in Figure 13a, which depicts the interaction between the injection angle and orifice diameter, the particle outlet velocity increases with a larger injection angle. The injection angle directly influences the motion of particles in the acceleration region of the pipeline. A smaller injection angle results in a greater horizontal velocity component of the particles, which reduces their vertical velocity and intensifies collisions with the pipeline wall, thereby hindering smooth particle transport. In contrast, the particle outlet velocity increases gradually with a larger orifice diameter. Figure 13 also shows that the particle exit velocity improves slowly as the number of orifices increases. Parameter optimization analysis was conducted on the developed model using Design Expert 8.0.6 software. The optimal parameters were determined to be an orifice diameter of 2.96 mm, an injection angle of 47°, and 24 orifices.

4.3. Bench Test Results

The optimized model parameters were used for 3D printing to construct a bench test setup, as shown in Figure 14. The conveying test simulated the particle feeding and conveying process on an offshore platform. After the system was officially started, the air source was connected to the pneumatic motor, the flange-thread generator, and the thread-thread generator, respectively. The air source was then activated to initiate airflow. During operation, up to 20 kg of pill particles were loaded into the hopper. The system then began operating and discharging according to the preset program, successfully achieving the intended functionality of the device.
The pneumatic conveying system, as illustrated in Figure 14d, consisted of two independent gas supply lines. The primary line utilized a DL8060 pneumatic pump (Dongguan Delong Automation Equipment Co., Ltd., Dongguan, China) coupled with a pneumatic motor to generate the conveying airflow. A separate V-1.05/12.5 air compressor (Shanghai Hongwuhuan Machinery Equipment Co., Ltd., Shanghai, China) was employed to provide a continuous gas supply to pneumatic generator 1. Simultaneously, an MC2-15 pneumatic pump (Shenzhen Maike Vacuum Technology Co., Ltd., Shenzhen, China) supplied gas to pneumatic generator 2, ensuring a stable and controlled operating environment for the test. The mass of pill particles conveyed during the test was 5 kg/min. The process was closely monitored to observe whether any clogging occurred.

5. Conclusions

This study utilized a self-designed pneumatic generator as the research platform to investigate the pneumatic conveying process of particles in the confined spaces of offshore oil and gas wells using a DEM-CFD fluid–solid coupling approach. The interaction between the pill particles and the airflow in the conveying pipeline was analyzed. The accuracy of the simulation results was validated through bench-scale tests, leading to the following conclusions:
  • Theoretical Analysis and Single-Factor Experiments: Theoretical analysis revealed that particle acceleration is positively correlated with airflow velocity in the stable acceleration zone. Single-factor experiments on feeding rate and minimum conveying pressure demonstrated that particles were transported stably at feeding rates of 3.6 kg/min and 4.8 kg/min with a conveying pressure of 0.20 MPa. However, at a feeding rate of 6.0 kg/min, particle accumulation and disordered collisions occurred at bends. The minimum pressure required for stable transport was determined to be 0.25 MPa.
  • Response Surface Methodology (RSM) Optimization: A Box–Behnken three-factor, three-level experimental design was conducted based on response surface methodology, with airflow orifice diameter (Φh2) and injection angle (θ) as variables, and the particle exit velocity at the outlet (N) as the evaluation index. The main and secondary factors affecting the performance of the discharging device were evaluated, and the optimal parameter combination was identified. Parameter optimization using Design Expert 8.0.6 software determined the optimal values for the orifice diameter (Φh2), injection angle (θ), and number of orifices (N).
  • Simulation and Physical Model Validation: Through simulation-based design and optimization, a physical model was constructed. No clogging occurred during the test, and the discharge behavior of the pill particles met practical production requirements.
This paper primarily addresses the effective transport of particles. Given that the corrosion inhibitor particles contain organic binders (≤5%), the low binder content leads to insufficient mechanical strength, making the particles susceptible to plastic deformation and brittle fracture during transportation. Future studies could utilize a bonding model to explore the damage caused by random collisions during particle transport.

Author Contributions

Conceptualization and methodology, J.S., Y.L. and D.L.; software and validation, Y.L., D.L., Q.X. and K.D.; formal analysis and data curation, Y.L., D.L., X.W. and H.Z.; writing—original draft preparation, Y.L., D.L. and Y.Y., writing—review and editing, H.Z., J.S., K.D., and Y.Y. All authors have read and agreed to the published version of the manuscript.

Funding

The research was financially supported by Scientific Research Project of the CNOOC EnerTech-Drilling & Production Co., grant number GCJSXMHT-T2101.

Institutional Review Board Statement

Not applicable.

Informed Consent Statement

Not applicable.

Data Availability Statement

If necessary, the data can be obtained from the corresponding author.

Conflicts of Interest

The authors declare that this study received funding from the CNOOC EnerTech-Drilling & Production Co. The funder was not involved in the study design, collection, analysis, interpretation of data, the writing of this article or the decision to submit it for publication.

Abbreviations

The following abbreviations are used in this manuscript:
DEMDiscrete Element Method
EDEMDEM Software
CFDComputational Fluid Dynamics
CFD–DEMComputational Fluid Dynamics–Discrete Element Method
PUPolyurethane

References

  1. Wang, F.; Kobina, F. The Influence of Geological Factors and Transmission Fluids on the Exploitation of Reservoir Geothermal Resources: Factor Discussion and Mechanism Analysis. Reserv. Sci. 2025, 1, 3–18. [Google Scholar] [CrossRef]
  2. Wu, J.; Ansari, U. From CO2 Sequestration to Hydrogen Storage: Further Utilization of Depleted Gas Reservoirs. Reserv. Sci. 2025, 1, 19–35. [Google Scholar] [CrossRef]
  3. Li, Q. Reservoir Science: A Multi-Coupling Communication Platform to Promote Energy Transformation, Climate Change and Environmental Protection. Reserv. Sci. 2025, 1, 1–2. [Google Scholar] [CrossRef]
  4. Chasemi, M.F.; Mehrpooya, M.; Chiasi, M.M.; Mohammadi, A.H.; Zendehboudi, S. Regional tectonic state and poro-thermolasticity analysis of near wellbore zone in field development plan: Utilization of an uncoupled approach. J. Nat. Gas Sci. Eng. 2017, 46, 615–636. [Google Scholar] [CrossRef]
  5. Lu, Y.; Liu, D.; Song, J.; Xiao, Q.; Du, K.; Wei, X.; Dang, L.; Yu, Y.; Zhao, H. Coating Process of Oil and Gas Well Pipeline Preventive Repair Materials Inspired by Remora Suckerfish Structure. Biomimetics 2025, 10, 436. [Google Scholar] [CrossRef] [PubMed]
  6. Zhou, H.; Chen, Y.; Li, H.; Xu, Z.; Dong, H.; Wang, W. Effect of particles micro characteristics destroyed by ball milling on fly ash electrostatic separation. Adv. Powder Technol. 2022, 33, 103449. [Google Scholar] [CrossRef]
  7. Liu, D.; Lu, Y.; Lin, H.; Qiao, C.; Song, J.; Chen, S.; Yao, Z.; Du, K.; Yu, Y. Study on the Discharge Process and Mechanism of Anti-Corrosion Pill Particles in the Oil and Gas Field Wellbore Casing Annulus Based on the Discrete Element Method. Processes 2022, 10, 1737. [Google Scholar] [CrossRef]
  8. Lavrinec, A.; Orozovic, O.; Rajabnia, H.; Williams, K.; Jones, M.G.; Klinzing, G. Velocity and porosity relationships within dense phase pneumatic conveying as studied using coupled CFD-DEM. Powder Technol. 2020, 375, 89–100. [Google Scholar] [CrossRef]
  9. Musango, L.; John, S.; Lloyd, M. Comparison of CFD-DEM and TFM approaches for the simulation of the small scale challenge problem. Powder Technol. 2021, 378, 85–103. [Google Scholar] [CrossRef]
  10. Kuang, S.B.; Li, K.; Zou, R.P.; Pan, R.H.; Yu, A.B. Application of periodic boundary conditions to CFD-DEM simulation of gas-solid flow in pneumatic conveying. Chem. Eng. Sci. 2013, 93, 214–228. [Google Scholar] [CrossRef]
  11. Yang, L.; Luo, L.; Chen, X.; Wu, X.; Jing, F. Hydraulic transportation of non-spherical coarse particles in deep-sea mining: Impact of particle shape on flow dynamics. Ocean. Eng. 2025, 323, 120652. [Google Scholar] [CrossRef]
  12. Ren, W.; Zhang, X.; Zhang, Y.; Lu, X. The impact of particle size and concentration on the characteristics of solid–fluid two-phase flow in vertical pipe under pulsating flow. Chem. Eng. J. 2024, 500, 156398. [Google Scholar] [CrossRef]
  13. Yang, Y.; Peng, H.; Wen, C. Sand Transport and Deposition Behaviour in Subsea Pipelines for Flow Assurance. Energies 2019, 12, 4070. [Google Scholar] [CrossRef]
  14. Xu, H.; Chen, W.; Li, L.; Yang, F. Morphology of Deep-Sea Mining Hydraulic Conveying Pipeline and Its Influencing Laws in Marine Dynamic Environment. J. Cent. South Univ. 2023, 30, 3790–3807. [Google Scholar] [CrossRef]
  15. Schnorr Filho, E.A.; Lima, N.C.; Franklin, E.M. Resolved CFD–DEM Simulations of the Hydraulic Conveying of Coarse Grains through a Very-Narrow Elbow. Powder Technol. 2022, 385, 811–821. [Google Scholar] [CrossRef]
  16. Nossair, A.; Rodgers, P.; Goharzadeh, A. Influence of Pipeline Inclination on Hydraulic Conveying of Sand Particles. In Proceedings of the ASME International Mechanical Engineering Congress and Exposition 2012, Houston, TX, USA, 9–15 November 2012; ASME: New York, NY, USA; pp. 1–9. [Google Scholar] [CrossRef]
  17. Huang, C.; van Oijen, J.; Deen, N.; Tang, Y. Incorporation of flamelets generated manifold method in coarse-grained Euler-Lagrange simulations of pulverized coal combustion. Chem. Eng. Sci. 2022, 260, 117838. [Google Scholar] [CrossRef]
  18. Leporini, M.; Marchetti, B.; Corvaro, F.; Giovine, G.; Polonara, F.; Terenzi, A. Sand transport in multiphase flow mixtures in a horizontal pipeline: An experimental investigation. Petroleum 2019, 5, 161–170. [Google Scholar] [CrossRef]
  19. Yao, R.; Wang, Z.; Huang, X. Design Parameters Investigation on Sand Transportation Characteristics of V-Inclined Pipe Based on Eulerian–Eulerian Two-Phase Flow Model. Water 2023, 15, 4266. [Google Scholar] [CrossRef]
  20. Lei, X.; Liao, Y.; Zhang, Q.; Wang, L.; Liao, Q. Numerical simulation of seed motion characteristics of distribution head for rapeseed and wheat. Comput. Electron. Agric. 2018, 150, 98–109. [Google Scholar] [CrossRef]
  21. Gu, F.; Zhao, Y.; Wu, F.; Hu, Z.; Shi, L. Simulation analysis and experimental validation of conveying device in uniform rushed straw throwing and seed-sowing Machines using CFD-DEM coupled approach. Comput. Electron. Agric. 2022, 193, 106720. [Google Scholar] [CrossRef]
  22. Zhou, F.; Hu, S.; Liu, Y.; Liu, C.; Xia, T. CFD-DEM simulation of the pneumatic conveying of fine particles through a horizontal slit. Particuology 2014, 16, 196–205. [Google Scholar] [CrossRef]
  23. Zhang, S.; Tekeste, M.; Li, Y.; Gaul, A.; Zhu, D.; Liao, J. Scaled-up rice grain modelling for DEM calibration and the validation of hopper flow. Biosyst. Eng. 2020, 194, 196–212. [Google Scholar] [CrossRef]
  24. Mansourpour, Z.; Karimi, S.; Zarghami, R.; Mostoufi, N.; Sotudeh-Gharebagh, R. Insights in hydrodynamics of bubbling fluidized beds at elevated pressure by DEM–CFD approach. Particuology 2010, 8, 407–414. [Google Scholar] [CrossRef]
  25. Gu, C.; Zhao, H.; Xu, B.; Yang, J.; Zhang, J.; Du, M.; Liu, Y.; Tikhankin, D.; Yuan, Z. CFD-DEM simulation of distribution and agglomeration characteristics of bendable chain-like biomass particles in a fluidized bed reactor. Fuel 2023, 340, 127570. [Google Scholar] [CrossRef]
  26. Saidi, M.; Tabrizi, H.B.; Grace, J.R.; Lim, C.J. Hydrodynamic investigation of gas-solid flow in rectangular spout-fluid bed using CFD-DEM modeling. Powder Technol. 2015, 284, 355–364. [Google Scholar] [CrossRef]
  27. El-Emam, M.; Zhou, L.; Shi, W.; Han, C.; Bai, L.; Agarwal, R. Theories and Applications of CFD–DEM Coupling Approach for Granular Flow: A Review. Arch. Comput. Methods Eng. 2021, 28, 4979–5020. [Google Scholar] [CrossRef]
  28. Wang, Z.; Teng, Y.; Liu, M. A semi-resolved CFD–DEM approach for particulate flows with kernel-based approximation and Hilbert curve-based searching strategy. J. Comput. Phys. 2019, 384, 151–169. [Google Scholar] [CrossRef]
  29. Nan, X.; Hou, J.; Shen, Z.; Tong, Y.; Li, G.; Wang, X.; Kang, Y. CFD-DEM coupling with multi-sphere particles and application in predicting dynamic behaviors of drifting boats. Ocean Eng. 2022, 247, 110368. [Google Scholar] [CrossRef]
  30. Brazhenko, V.; Mochalin, I. Terminal Velocity and Drag Coefficient of a Smooth Steel Sphere Moving in Water-Filled Vertical and Inclined Glass Pipes (Newton Regime). Powder Technol. 2024, 446, 120120. [Google Scholar] [CrossRef]
  31. Li, Z.; Zhang, H.; Huang, J.; Lou, C.; Chen, Y.; Liu, L.; Zhang, T.; Chen, L. Design and parameter optimization of air-delivery auxiliary seed guide for pneumatic plate precision rapeseed metering device. Comput. Electron. Agric. 2025, 230, 109840. [Google Scholar] [CrossRef]
  32. Liu, D.; Qiao, C.; Wan, J.; Lu, Y.; Song, J.; Yao, Z.; Wei, X.; Yu, Y. Modelling method and application of anti-corrosion pill particles in oil and gas field wellbore casing annulus based on the discrete element method. Processes 2022, 10, 1164. [Google Scholar] [CrossRef]
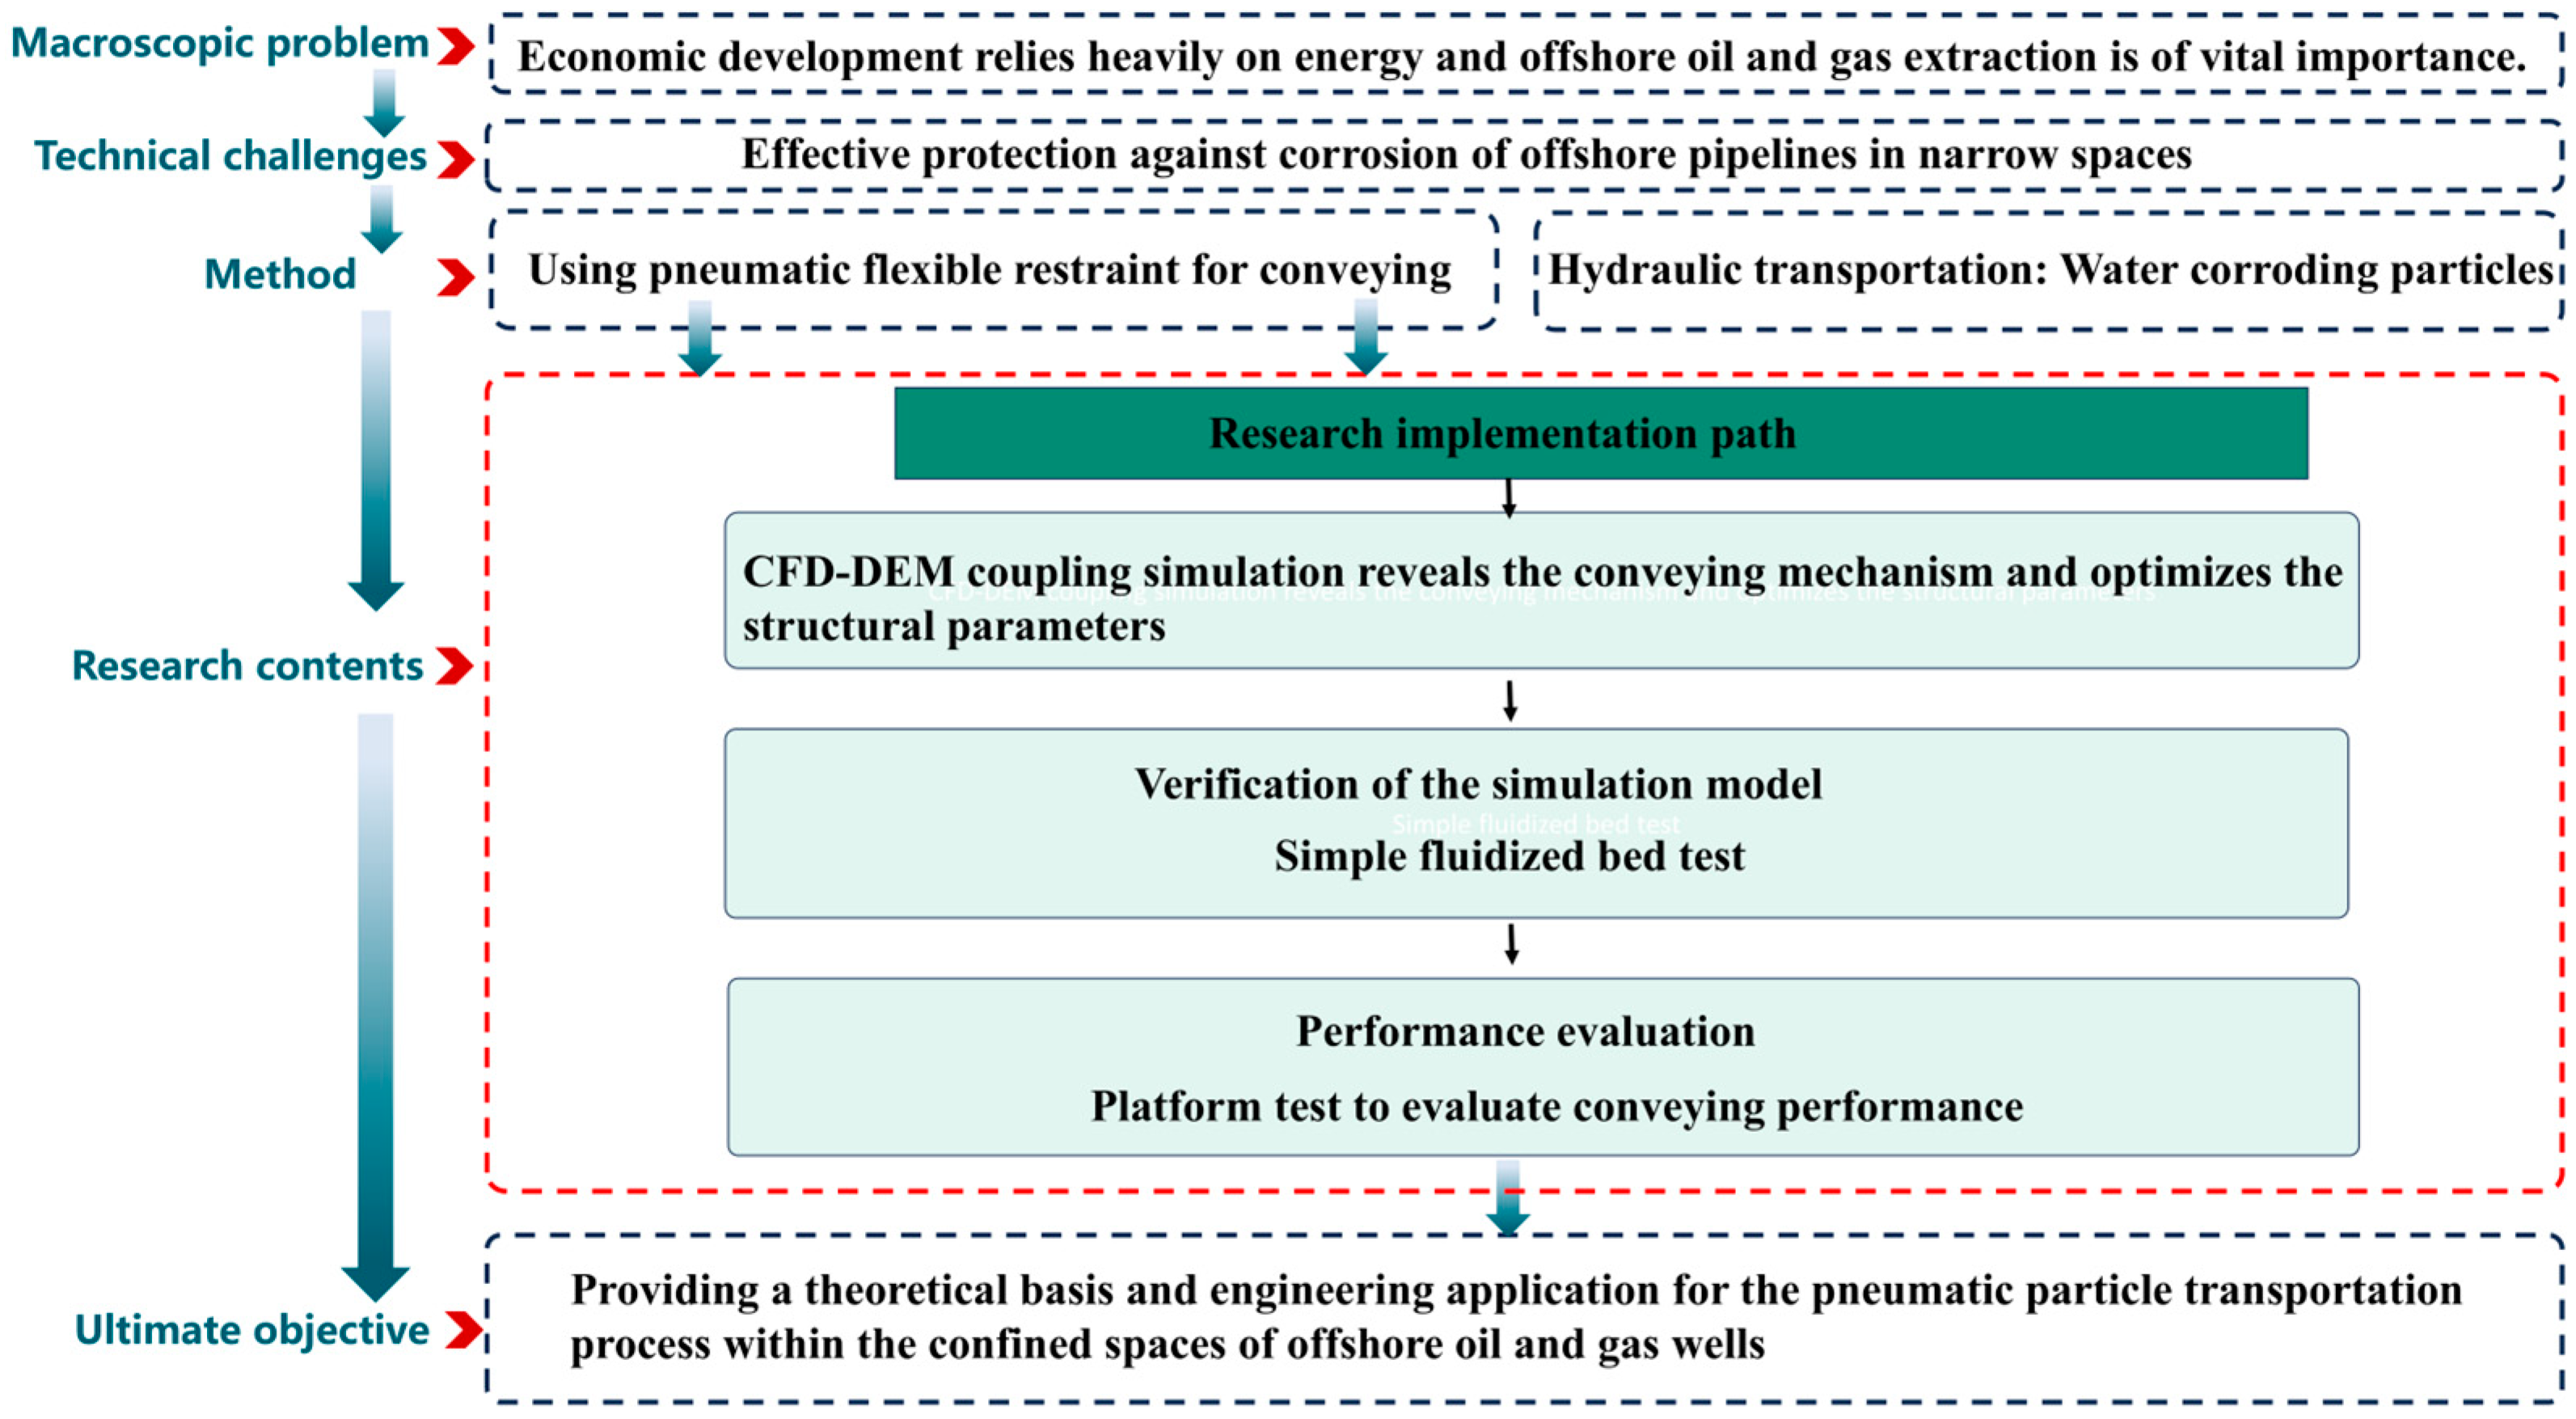
Figure 1. Research process flowchart.
Processes 13 03599 g001
Figure 2. Pneumatic solid corrosion inhibitor addition device.
Processes 13 03599 g002
Figure 3. Pneumatic generator of the solid corrosion inhibitor addition device.
Processes 13 03599 g003
Figure 4. Schematic diagram of the fluidized bed model validation.
Processes 13 03599 g004
Figure 5. Schematic of the pill particle model.
Processes 13 03599 g005
Figure 6. Simulation model processing: (a) solid domain; (b) fluid domain.
Processes 13 03599 g006
Figure 7. Validation of the fluidized bed simulation model.
Processes 13 03599 g007
Figure 8. (a) Coupled force acting on the pill particles; (b) velocity of the pill particles.
Processes 13 03599 g008
Figure 9. (a) Contour of velocity flow field in the conveying pipeline; (b) conveying of pill particles.
Processes 13 03599 g009
Figure 10. Motion of pill particle populations under different feeding rates.
Processes 13 03599 g010
Figure 11. Motion of pill particle populations under different conveying pressures.
Processes 13 03599 g011
Figure 12. Contour of velocity flow field distribution in the pneumatic generator under different factors.
Processes 13 03599 g012
Figure 13. (a) Air ejection angle and diameter response surface plot; (b) Air ejection angle and number of small holes response surface plot.
Processes 13 03599 g013
Figure 14. Pill particle conveying performance test rig: (a) internal view of the grooved wheel; (b) hopper and support frame; (c) external overview; (d) Model MC2-15 pneumatic pump.
Processes 13 03599 g014
Table 1. DEM-CFD parameters used in the simulations.
MaterialParameterValue
Pill particlesDensity of Pill particles (kg/m3)1380
Poisson’s ratio of pill particles0.25
Engineering plasticsShear modulus of pill particles (Pa)2500.00
Density of engineering plastics (kg/m3)1350
Poisson’s ratio of engineering plastics1 × 108
Pill particles and Pill particlesShear modulus of engineering plastics (Pa)0.50
Coefficient of restitution0.50
Coefficient of static friction0.05
Pill particles to engineering plasticsCoefficient of rolling friction0.5
Coefficient of restitution0.5
Coefficient of static friction0.01
Gas phaseCoefficient of rolling frictionAir
Fluid/air1.225
Density (kg/m3)1.7894 × 10−5
Viscosity (kg/(m·s))9.81
Gravitational acceleration (m/s2)9 × 10−6
Fixed time step of EDEM (s)9 × 10⁻⁴
Fixed time step of Fluent (s)9
Table 2. Factors and levels for Box–Behnken design.
FactorLevel
−101
Airflow conveying orifice diameter h2123
Injection angle θ304560
Number of orifices N162024
Table 3. Experimental results data.
NOAirflow Conveying Orifice Diameter h1 (mm)Injection Angle θ (°)Number of Orifices NOutlet Velocity
(m/s)
1130206.52
2330207.43
3245207.22
4230247.36
5145246.98
6160206.58
7245207.24
8260166.78
9145166.12
10345167.25
11360207.91
12230166.55
13260247.89
14245207.19
15345248.02
16245207.26
17245207.28
Table 4. Regression analysis of experimental results.
SourceSum of SquaresdfMean SquareF-Valuep-Value
Model4.3260.7205164.07<0.0001significant
A-Airflow conveying orifice diameter2.4312.43553.60<0.0001
B- Injection angle0.211210.211248.11<0.0001
C-Number of orifices1.5811.58358.74<0.0001
AB0.044110.044110.040.0100
BC0.022510.02255.120.0471
A20.038610.03868.780.0142
Residual0.0439100.0044
Lack of Fit0.039060.00655.330.0636not significant
Pure Error0.004940.0012
Disclaimer/Publisher’s Note: The statements, opinions and data contained in all publications are solely those of the individual author(s) and contributor(s) and not of MDPI and/or the editor(s). MDPI and/or the editor(s) disclaim responsibility for any injury to people or property resulting from any ideas, methods, instructions or products referred to in the content.