1. Introduction
The development of electric vehicles has led to a surge in demand for battery-related products and services, while the emergence of new energy technologies has also driven significant advancements in battery applications. Lithium-ion batteries are being employed on a large scale in the electric vehicle industry due to their extended cycle life, high energy density, and stable performance [
1,
2]. Battery management systems (BMS), which are integral to electric vehicles, are designed to ensure the smooth operation of batteries under complex and harsh operating conditions. The primary concerns that BMS addresses are key issues, such as state of charge (SOC) estimation, state of health (SOH) evaluation and remaining useful life (RUL) evaluation [
3]. These elements are intimately associated with the state of the lithium-ion battery. Among these indicators, SOC is regarded as the most crucial in the context of BMS. Accurate SOC estimation provides the basis for various monitoring metrics of the BMS, including its SOH and RUL. Moreover, the SOC supports a range of control schemes, such as equalization management. SOC is defined as the percentage of charge currently contained in a battery relative to its maximum charge capacity [
4,
5]. Its existence is analogous to the fuel gauge function in traditional fuel vehicles. However, due to the complex electrochemical characteristics of lithium batteries, accurate SOC estimation is critical for BMS. This is because overcharging or over discharging can lead to shortened battery life or even permanent damage.
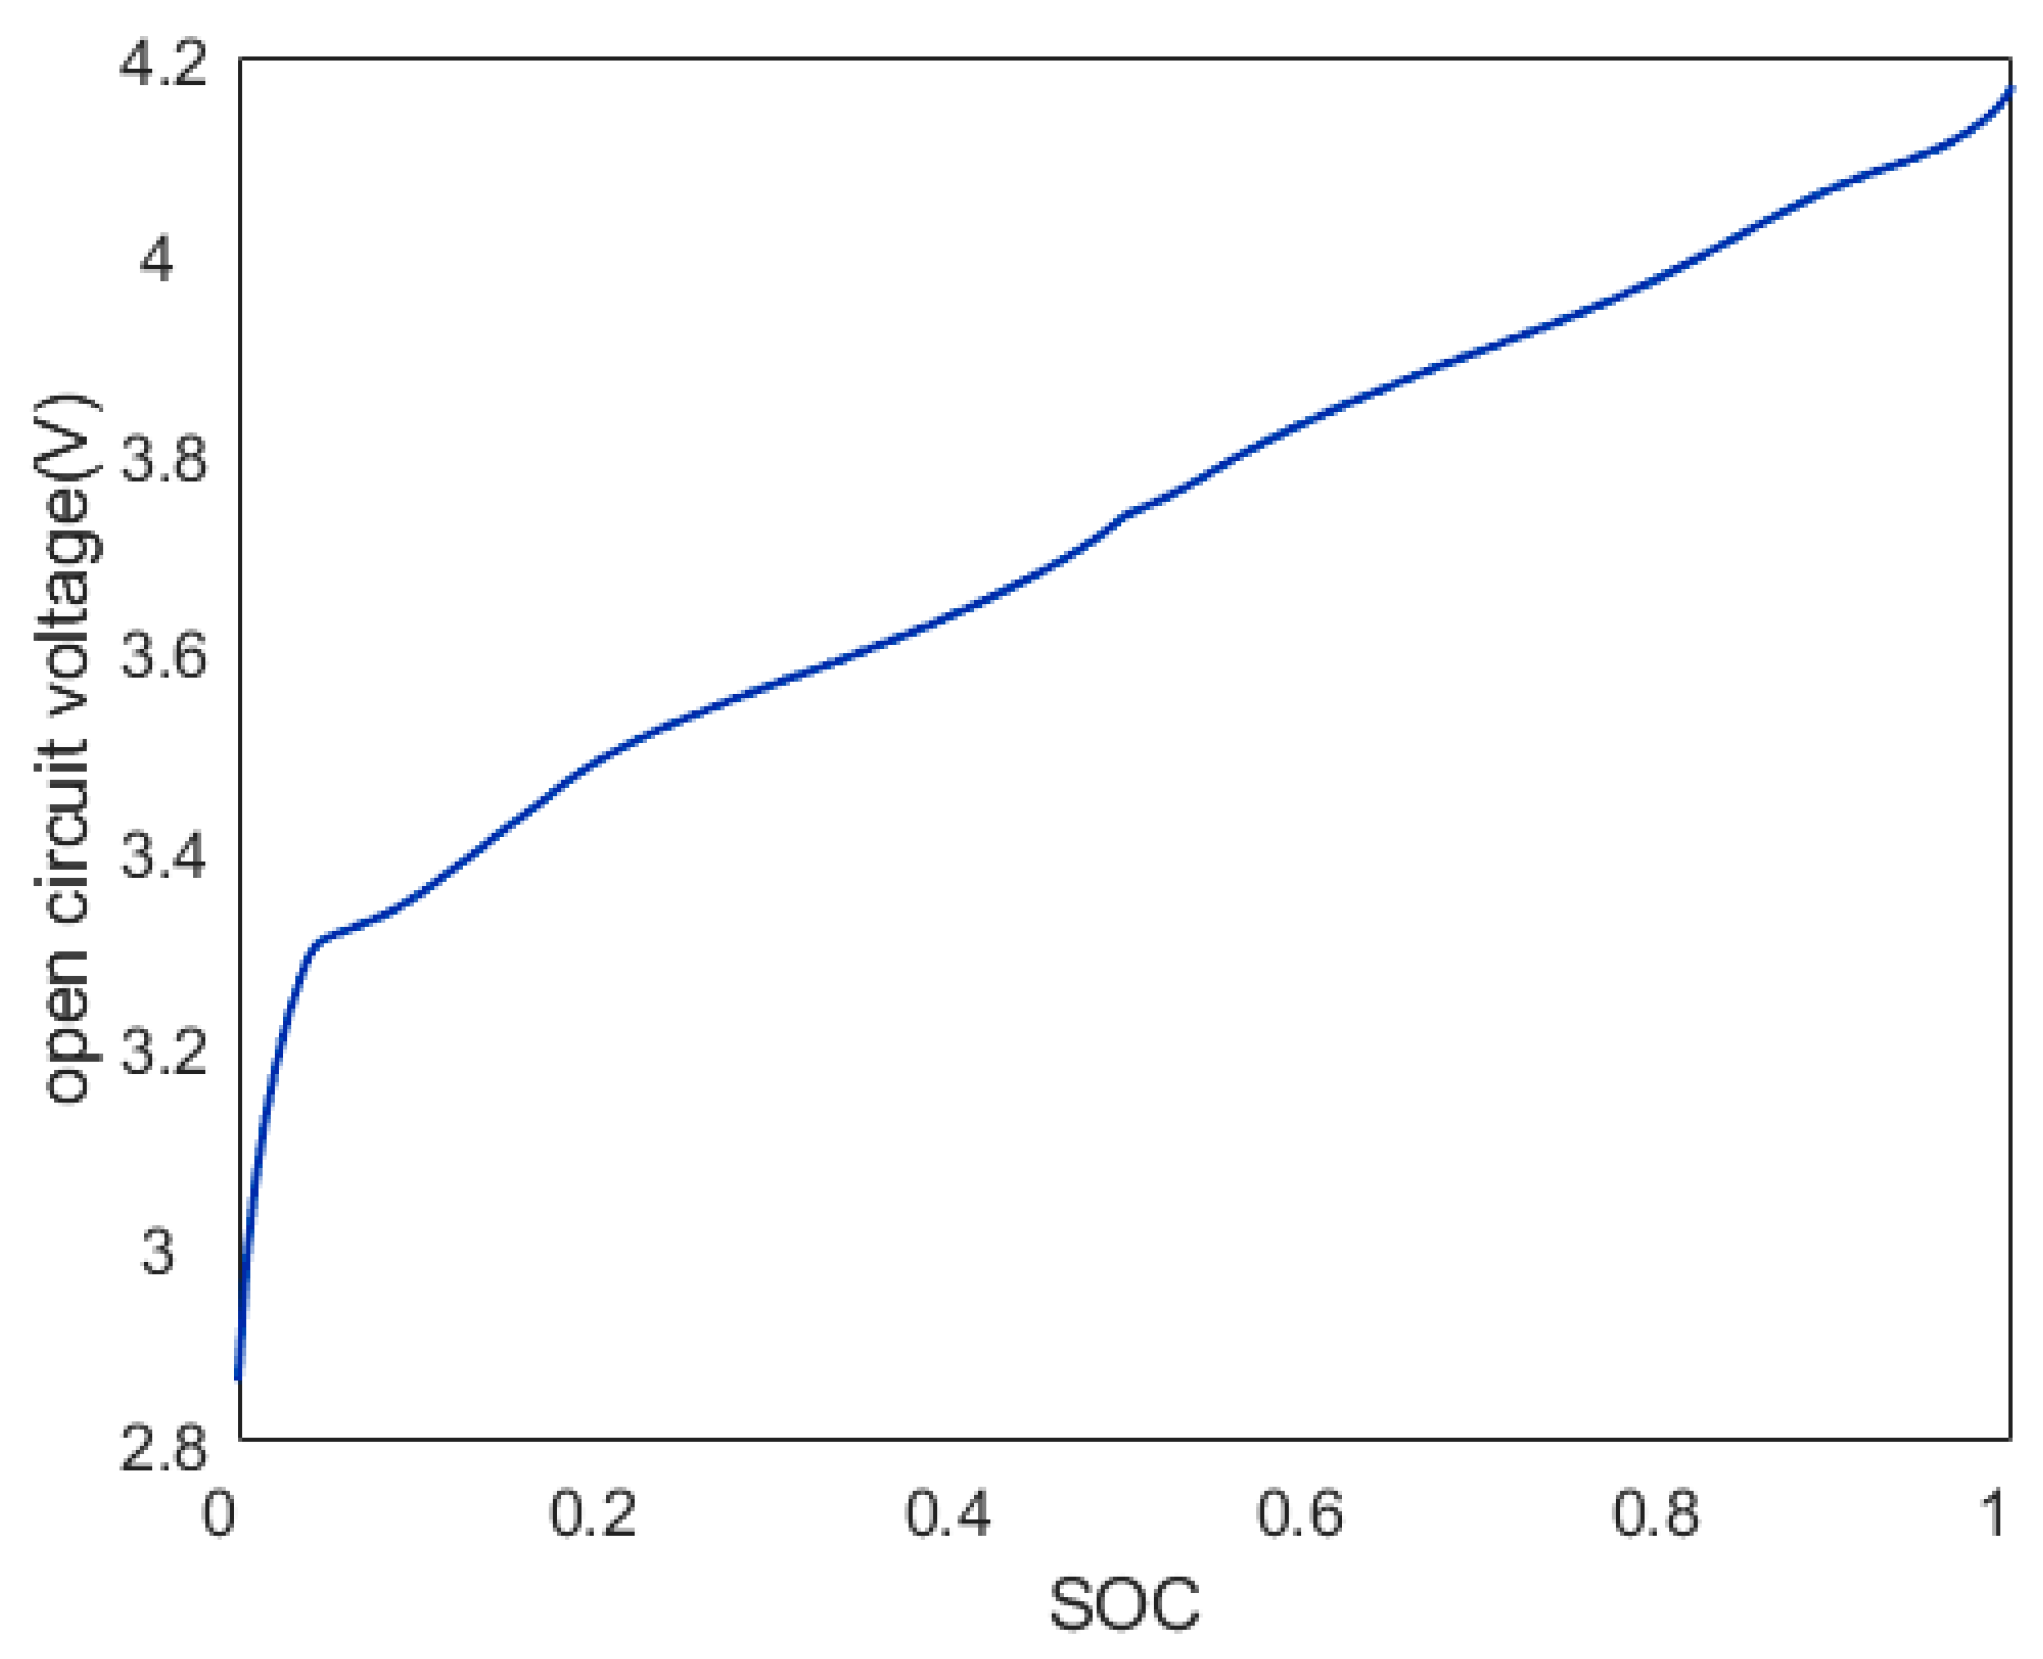
In recent years, research on methods for SOC estimation has primarily focused on four categories: the open-circuit voltage method [
6,
7], the ampere-hour integration method (Ah-I method) [
8,
9], mechanism modeling-based methods, and data-driven methods. The open-circuit voltage method establishes a look-up table relationship through the measurement of the mapping between the open-circuit voltage and the SOC of the battery. This method necessitates precise experimental measurements to obtain an accurate mapping relationship; moreover, the voltage must be maintained at a constant level throughout the measurement interval to eliminate overpotential effects, which renders each measurement time-consuming. These issues contribute to the conclusion that the method is not readily implementable in practical applications. The Ah-I method calculates the change in battery capacity to obtain the battery SOC by calculating the integral of the discharge current. This method is characterized by ease of calculation and high efficiency. However, despite its continuous nature, the method requires frequent calibration due to the low efficiency of the energy conversion and the change in the battery discharge rate. This results in cumulative errors over time, necessitating the use of other methods in practice.
Mechanism-based approaches include electrochemical modeling (EM) and equivalent circuit modeling (ECM). The most widely used EMs for SOC estimation are the single-particle model (SPM) [
10] and the pseudo-two-dimensional model (P2D) [
11]. This approach involves the utilization of partial differential equations, which incorporate a substantial number of unknown parameters, consequently leading to elevated computational complexity. The ECM is predicated on the theory of porous electrodes and concentrated solutions [
12], and it describes the battery mechanism by equating the internal current process of the battery to an electronic circuit process and performing circuit analysis to establish a mathematical model. These models are often combined with state observers in practical applications [
13].
Advances in computer technology have accelerated the development of data-driven SOC estimation methods, which have attracted increasing attention. This method employs detectable indicators such as voltage, current, and temperature of the battery cells to directly model the SOC, circumventing the intricate modeling process of battery behavior. This approach ensures reasonable accuracy and practicality. Chemall et al. [
14] used a Long Short-Term Memory Neural Network (LSTM-RNN) to map the current, voltage, and temperature directly to the SOC, thus avoiding filters and inference algorithms used in the mechanism modeling process and achieving accurate SOC estimation. To further enhance the SOC estimation accuracy and capture the information of the up and down data before and after capturing in the sequence, Yang et al. [
15] employed a bidirectional LSTM (BiLSTM) to improve the model’s ability to process input sequences bidirectionally. However, there is room for improvement as deep learning methods require substantial computational resources and training data. The estimation of battery state can be further realized with greater efficiency and precision through the enhancement of data quality [
16].
These methods have yielded a multitude of sophisticated designs with regard to network structure and algorithm design. The SOC estimation methods based on these designs are both powerful and straightforward to implement; however, there is still a need to enhance their accuracy. Li-ion batteries are intricate systems that exhibit significant nonlinearity. On the one hand, if relevant information is not fully taken into account, the performance will be suboptimal [
17]. On the other hand, if an excessive number of factors are considered, it may result in overfitting. Furthermore, the incorporation of excessive dimensions has been shown to compromise the accuracy and stability of the algorithm [
18]. The prevailing deep learning-based methods are predicated on a data-driven approach, overlooking the electrochemistry of the battery. Consequently, these methodologies fail to adequately consider pertinent information, resulting in suboptimal performance. Research in disparate domains has demonstrated that the incorporation of mechanism-related knowledge into machine learning can enhance performance [
19]. For instance, Fangfang Yang et al. [
20] incorporated LSTM into SOC estimation and leveraged LSTM to rectify the original UKF estimation, thereby attaining enhanced SOC estimation relative to the utilization of solely the LSTM model. In a similar vein, Jinpeng Tian et al. [
21] proposed a novel model-based approach to deconstruct the measured voltage and current sequences into open circuit voltage (OCV), ohmic response, and polarization voltage, among other parameters. This approach aims to expand the scope of DNNs, thereby facilitating more efficient learning of the mapping between measurable signals and SOC. The proposed methodology incorporates the mechanism information of the simplified RC model as a data enhancement input to the DNN. The outcomes demonstrate the efficacy of this approach in enhancing the performance of SOC estimation. These methods illustrate that augmenting the input variables with more relevant data can lead to substantial improvements in prediction accuracy. However, it should be noted that such methods necessitate a more extensive processing flow and lack the integration of the comprehensive information regarding the battery operation mechanism within the deep learning model.
To address these challenges, we propose a neural network model that integrates mechanistic information for accurate SOC estimation. This model integrates domain expertise from the battery field into a data-driven SOC estimation method. The method utilizes a straightforward and effective ECM and the Ah-I method, enhancing the mapping between input variables and SOC. This approach necessitates only a modest increase in computational cost to achieve enhanced SOC estimation performance. Furthermore, we ascertain the proportion of influence exerted by the two mechanistic information types within the loss function, which can result in optimal SOC estimation performance. A number of these statistical metrics have been significantly reduced. Ultimately, the proposed method was successfully applied to a range of operational conditions through experimentation, thereby substantiating its applicability in a fusion model context. The primary innovations and contributions of this paper are as follows: A novel method for estimating the SOC of physical information neural networks is proposed. This method utilizes ECM and the Ah-I method, enhancing the prediction performance of the fused model in the battery domain. The proposed method integrates the ECM, Ah-I method, and the deep learning model, leveraging the valuable insights offered by these models. Specifically, the mechanism model is employed to constrain the input and output data of the deep learning model, thereby enhancing its efficacy. The efficacy of the proposed method is substantiated by a comparison with the estimation results of other types of deep learning models, and the fusion model used has been shown to yield superior estimation results. This comparison provides a solution for the study of SOC estimation under different operating conditions.
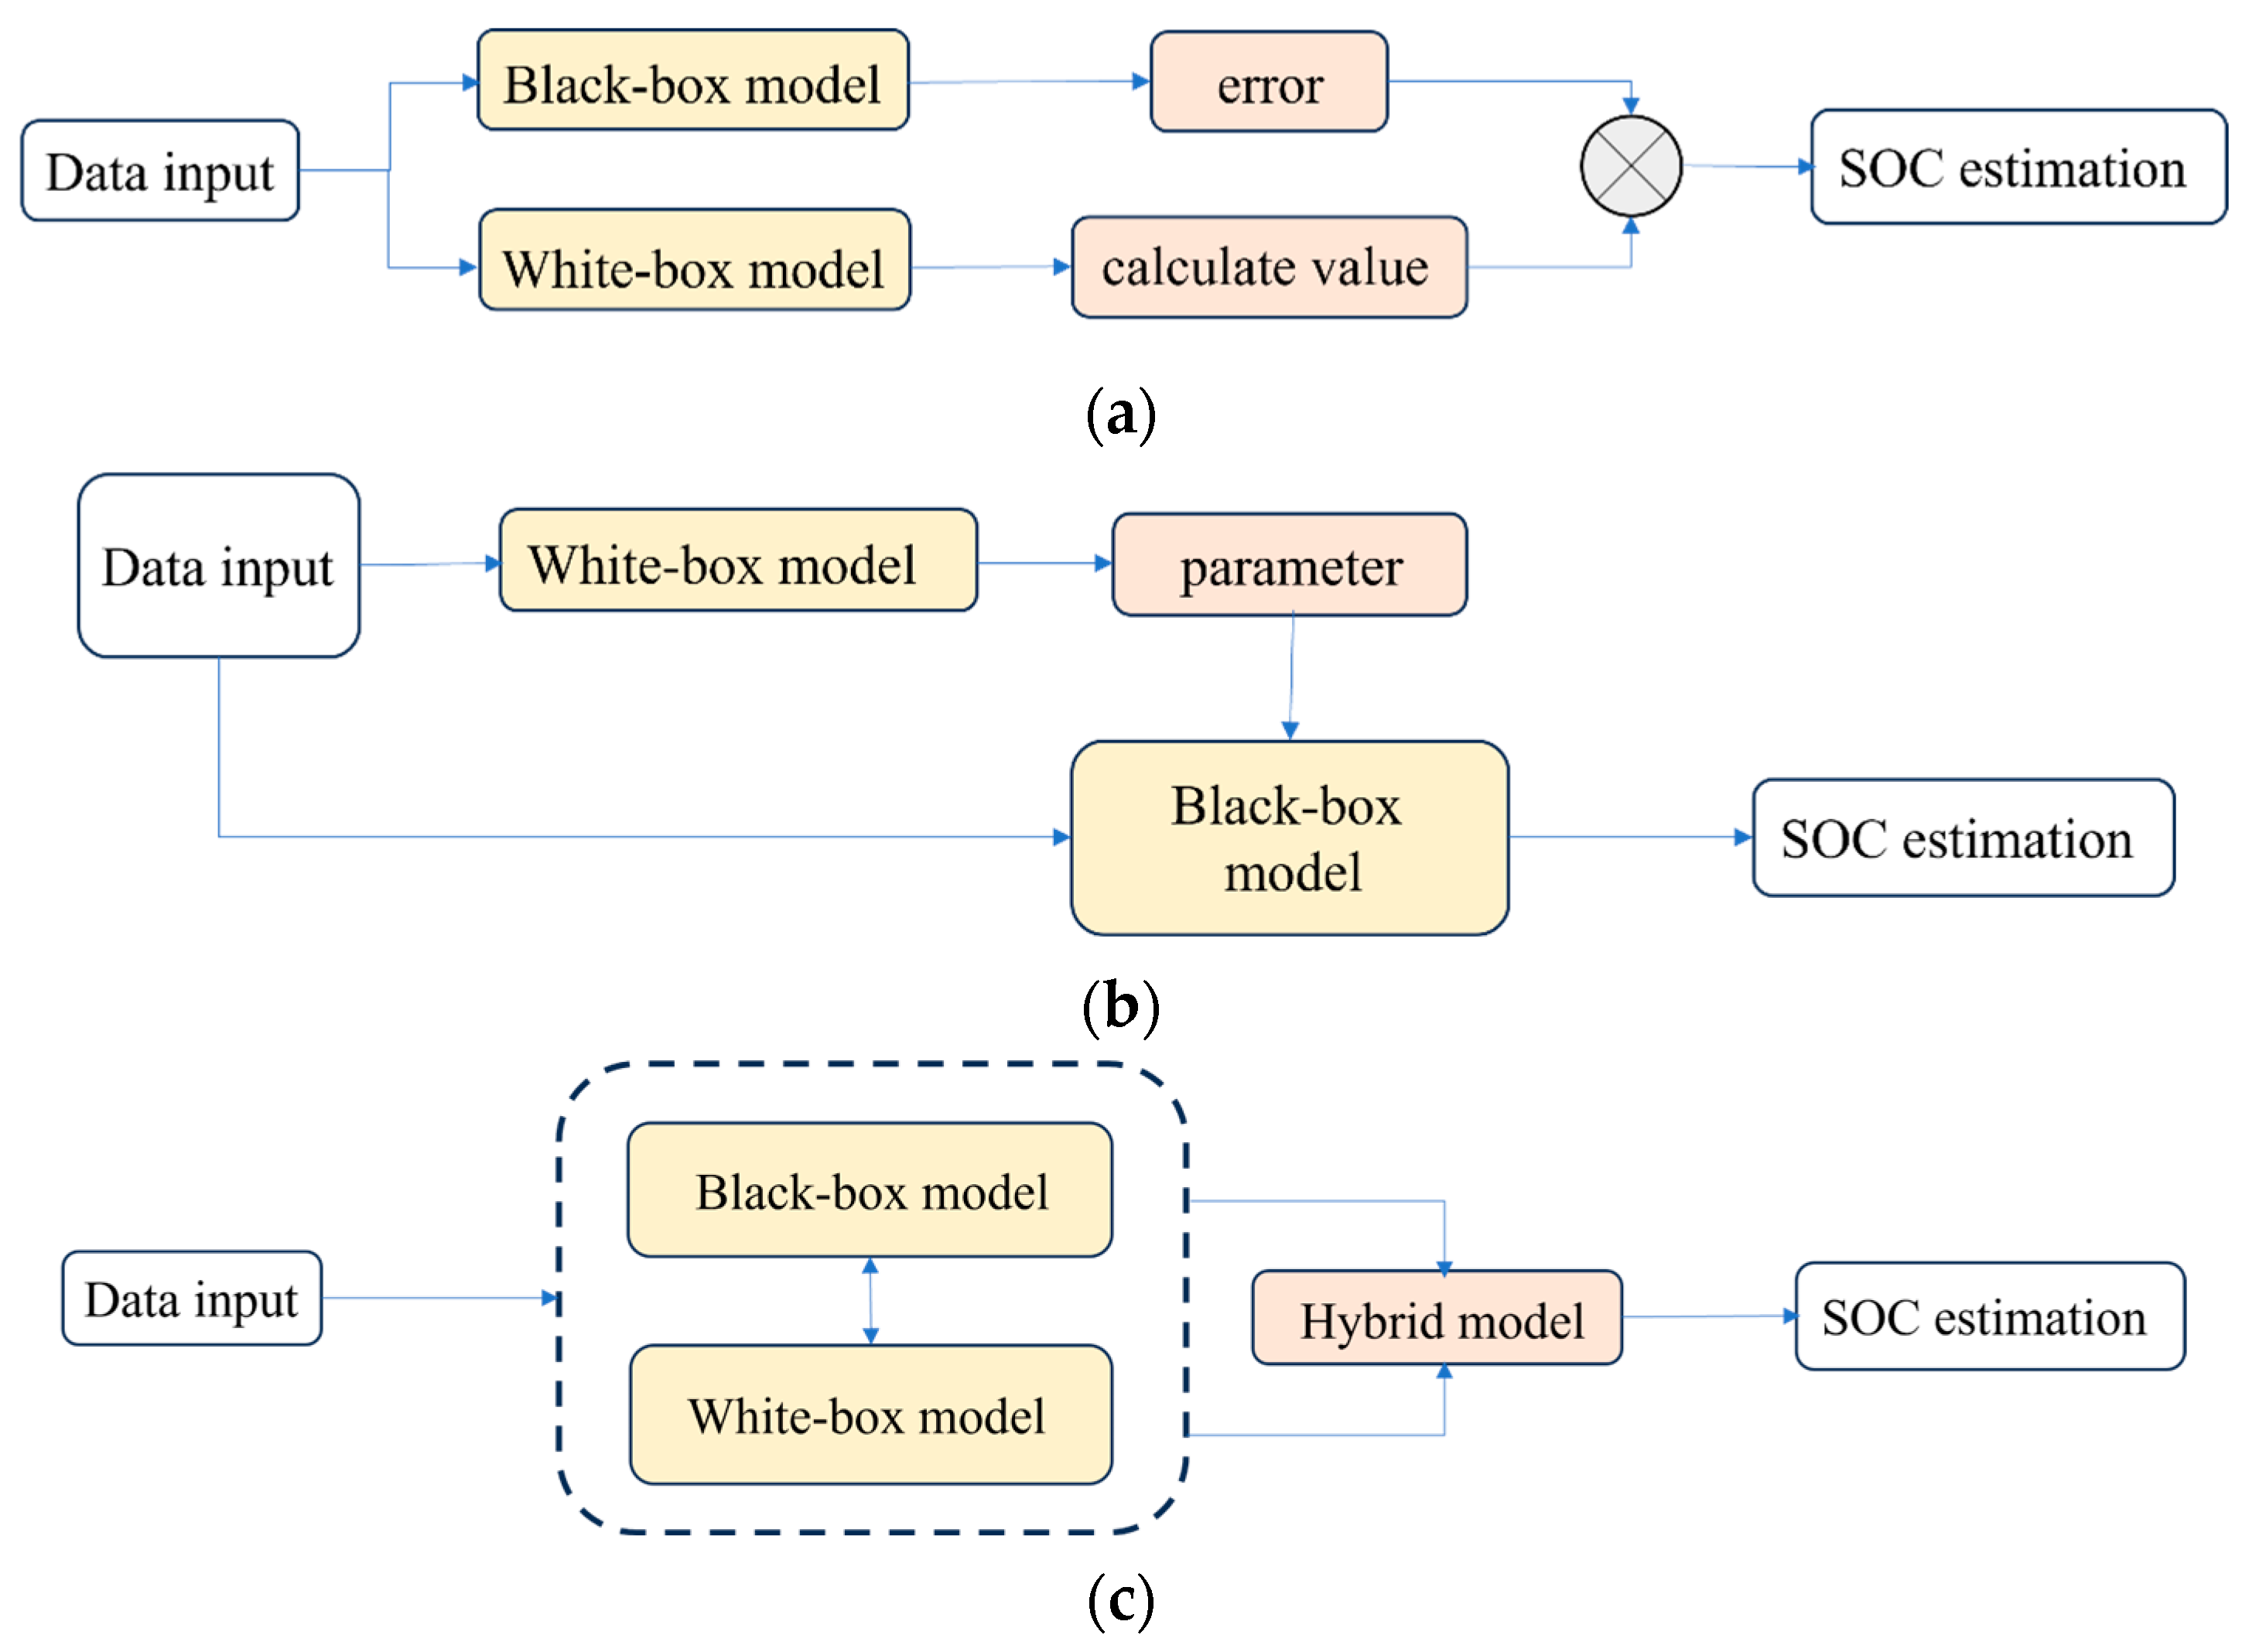
The contribution of this work lies in the deep fusion of mechanistic models with data-driven approaches to obtain more accurate SOC estimation models. Existing hybrid models consist of two categories, one is the mechanism model in parallel with the data model, and the mechanism model calculates the base values and the data-driven maps the error values, which are subsequently combined. The other category is data-driven and mechanistic models in series. The data-driven model maps the parameters to be brought into the mechanistic model to obtain the SOC estimates. Existing hybrid methods assist SOC estimation with data and mechanism separately, without achieving tight binding, whereas this study tightly combines the two types of information so that the data process contains mechanism information, and is therefore inconsistent with both existing methods.
4. Results and Discussion
This section commences with a discussion of the evaluation of SOC methods with data collected at 25 °C, followed by a calibration of the percentage of data loss and physical information loss in SOC estimation by PINN. The subsequent section explores the impact of ambient temperature on the estimator under varying operating conditions. Ultimately, the section concludes with a comparative analysis of the SOC estimation outcomes derived from alternative methods. The hyperparameters is set as layer:4, units:5120, batch_size: full batch, epochs: 2000, optimizer: Adam.
4.1. SOC Estimation Results at 25 °C
In this study, the focus will be on the estimation of the SOC for 25 °C. The equivalent circuit model and the ampere-time integration method are incorporated into the PINN as two physical information, respectively. The effect of the input of the two mechanistic information on the SOC estimation will be discussed. As illustrated in
Figure 8, the network without mechanistic information is denoted as NN. The network with the equivalent circuit model information added is denoted as PINN-1. The network with the anharmonic integration information added is denoted as PINN-2. The network containing both mechanistic information is denoted as PINN-1&2.
As previously mentioned in
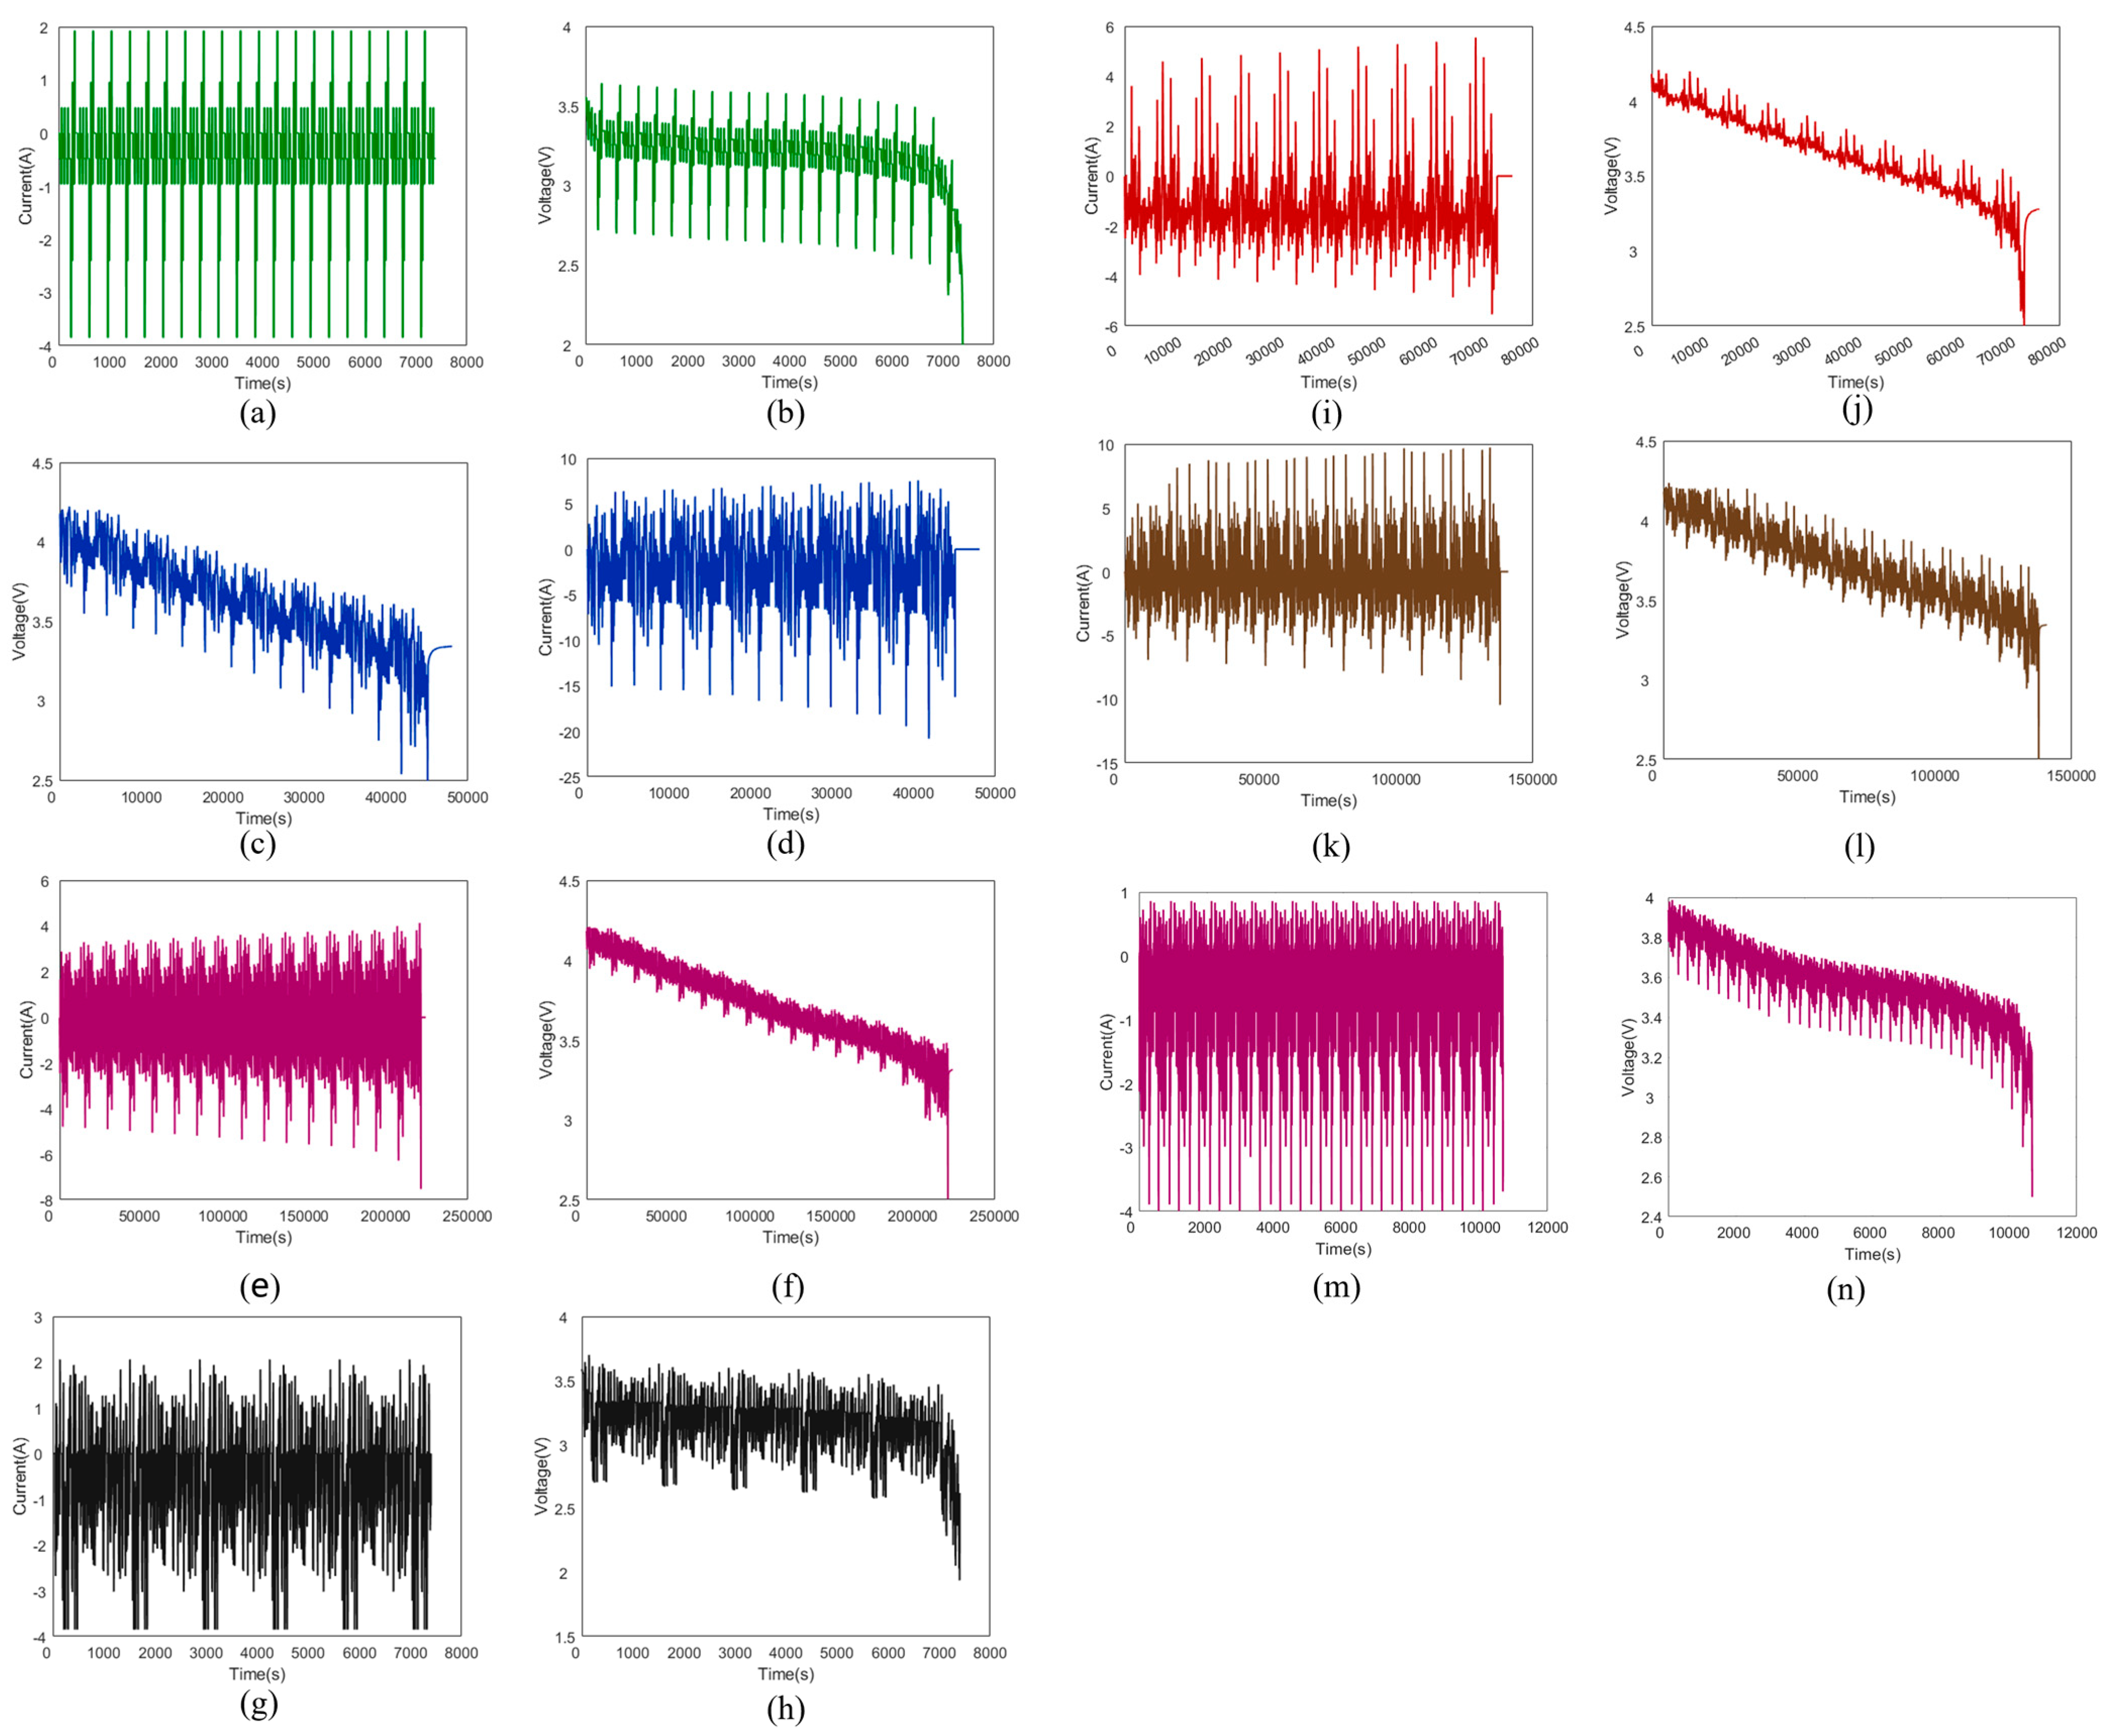
Section 2, the dataset utilized in this section is the Panasonic 18650PF dataset from the University of Wisconsin, wherein the training and validation sets are designated as cycle1~cycle4, and the test conditions are NN conditions. As illustrated in
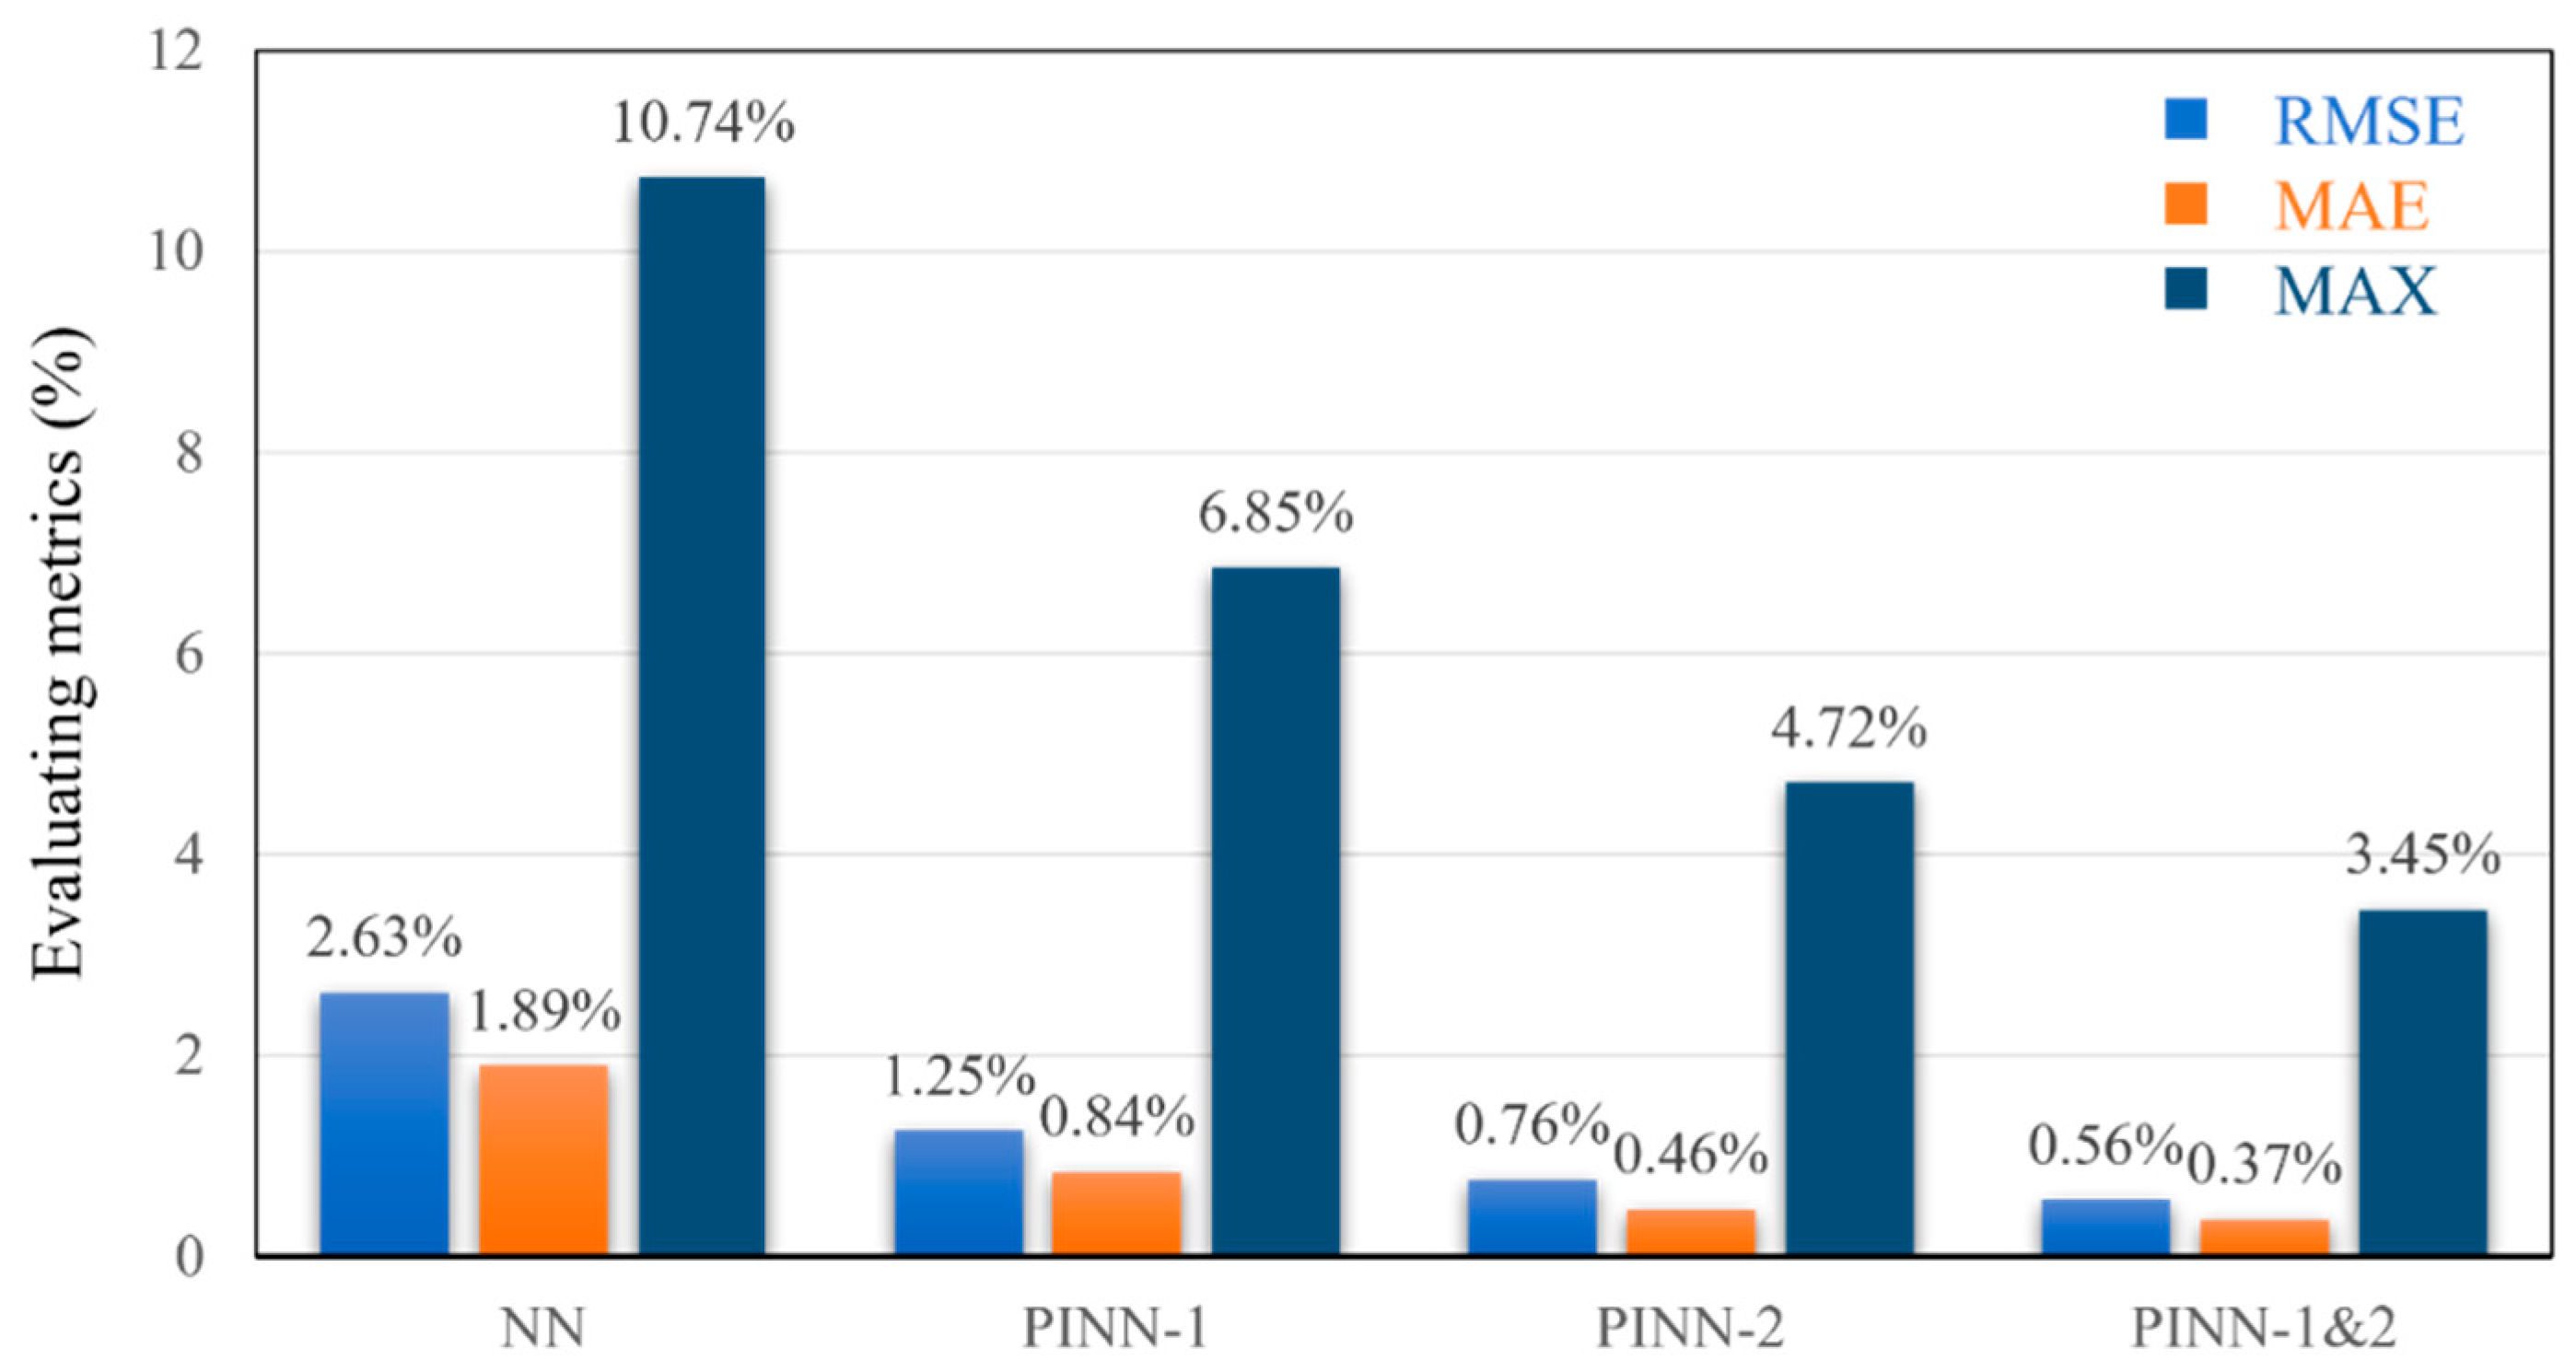
Figure 9, the evaluation metrics for the SOC estimation results are presented. The traditional artificial neural network-based approach to SOC estimation achieves an RMSE of 2.63%, and it is intuitively obvious from
Figure 8 that the estimation fluctuates greatly, with a maximum error of 10.74% at a time series of 70,000. The proposed mechanistic information models incorporating the equivalent circuit model and the ampere-time integral, respectively, have been shown to enhance the estimation of SOC when compared to the initial network. The RMSE of the estimation result of PINN-1 has been demonstrated to decrease from 2.63% to 1.25% (a relative reduction of 52.47%), with the maximum error being reduced to 3.89%. A similar trend has been observed in the estimation result of PINN-2, which also decreased in all three indexes. The RMSE of PINN-1&2 of the proposed method in this paper is further reduced to 0.56%, which is a 78.71% reduction, and the maximum error is also reduced to 3.45%. These results reflect the efficacy of the proposed method and demonstrate that the integration of the Rint model of the equivalent circuit and the two types of mechanism information of the anharmonic integration method into the neural network can effectively reduce the estimation error of the SOC and enhance the SOC estimation accuracy.
The aforementioned results can be explained in terms of the mechanistic information incorporated. Firstly, the Rint model contains information regarding the internal physical change process of the battery, which describes the dynamic change process of the battery during the charging and discharging process. For example, the change of the SOC of the battery during the discharging process is correlated with the change of the ideal voltage source in the Rint model. Furthermore, an equivalent equation has been demonstrated to reveal a relationship between current and voltage during the battery discharge process. This is coupled to the neural network through a PINN to facilitate the learning of a part of the intrinsic connection between the input signal and the output signal, thus enhancing the performance of SOC estimation. The ampere–time integral information embedded in PINN-2 directly reveals the relationship between the battery SOC and the input current. This intrinsic relationship is learnt by the neural network to enhance the estimation performance of the network. The PINN-1&2, which integrates these two types of information, restricts the inputs to two components of mechanistic information, thereby attaining optimal estimation outcomes. Of particular note is the strict constraint imposed on the maximum error part, which is instrumental in mitigating the risk of hazardous battery discharge arising from an erroneous SOC estimation.
In conventional PINN applications, both data-driven and physical information losses are frequently treated in an equivalent manner, i.e., there is no differentiation between the two types of losses in terms of their proportion to the total losses. This is reasonable for most applications under physical rules, as the rules described are harsh physical laws such as heat diffusion equations and fluid flow equations. However, when these physical laws are integrated into the neural network, a rigidity feature is formed, which can result in the model seeking a local rather than a global optimum [
33]. The two types of laws proposed in this paper bear a strong resemblance to each other; consequently, the variable weighting strategy is employed in the practical application, and the optimal ratio of the two types of losses is determined by comparing and analyzing the SOC estimation results of the two types of losses with different assigned weights in the PINN.
As demonstrated in Equation (14), the ratio of the two components of the composition of the total loss is represented by
and
. For the purposes of the experiment, the following assumption is made:
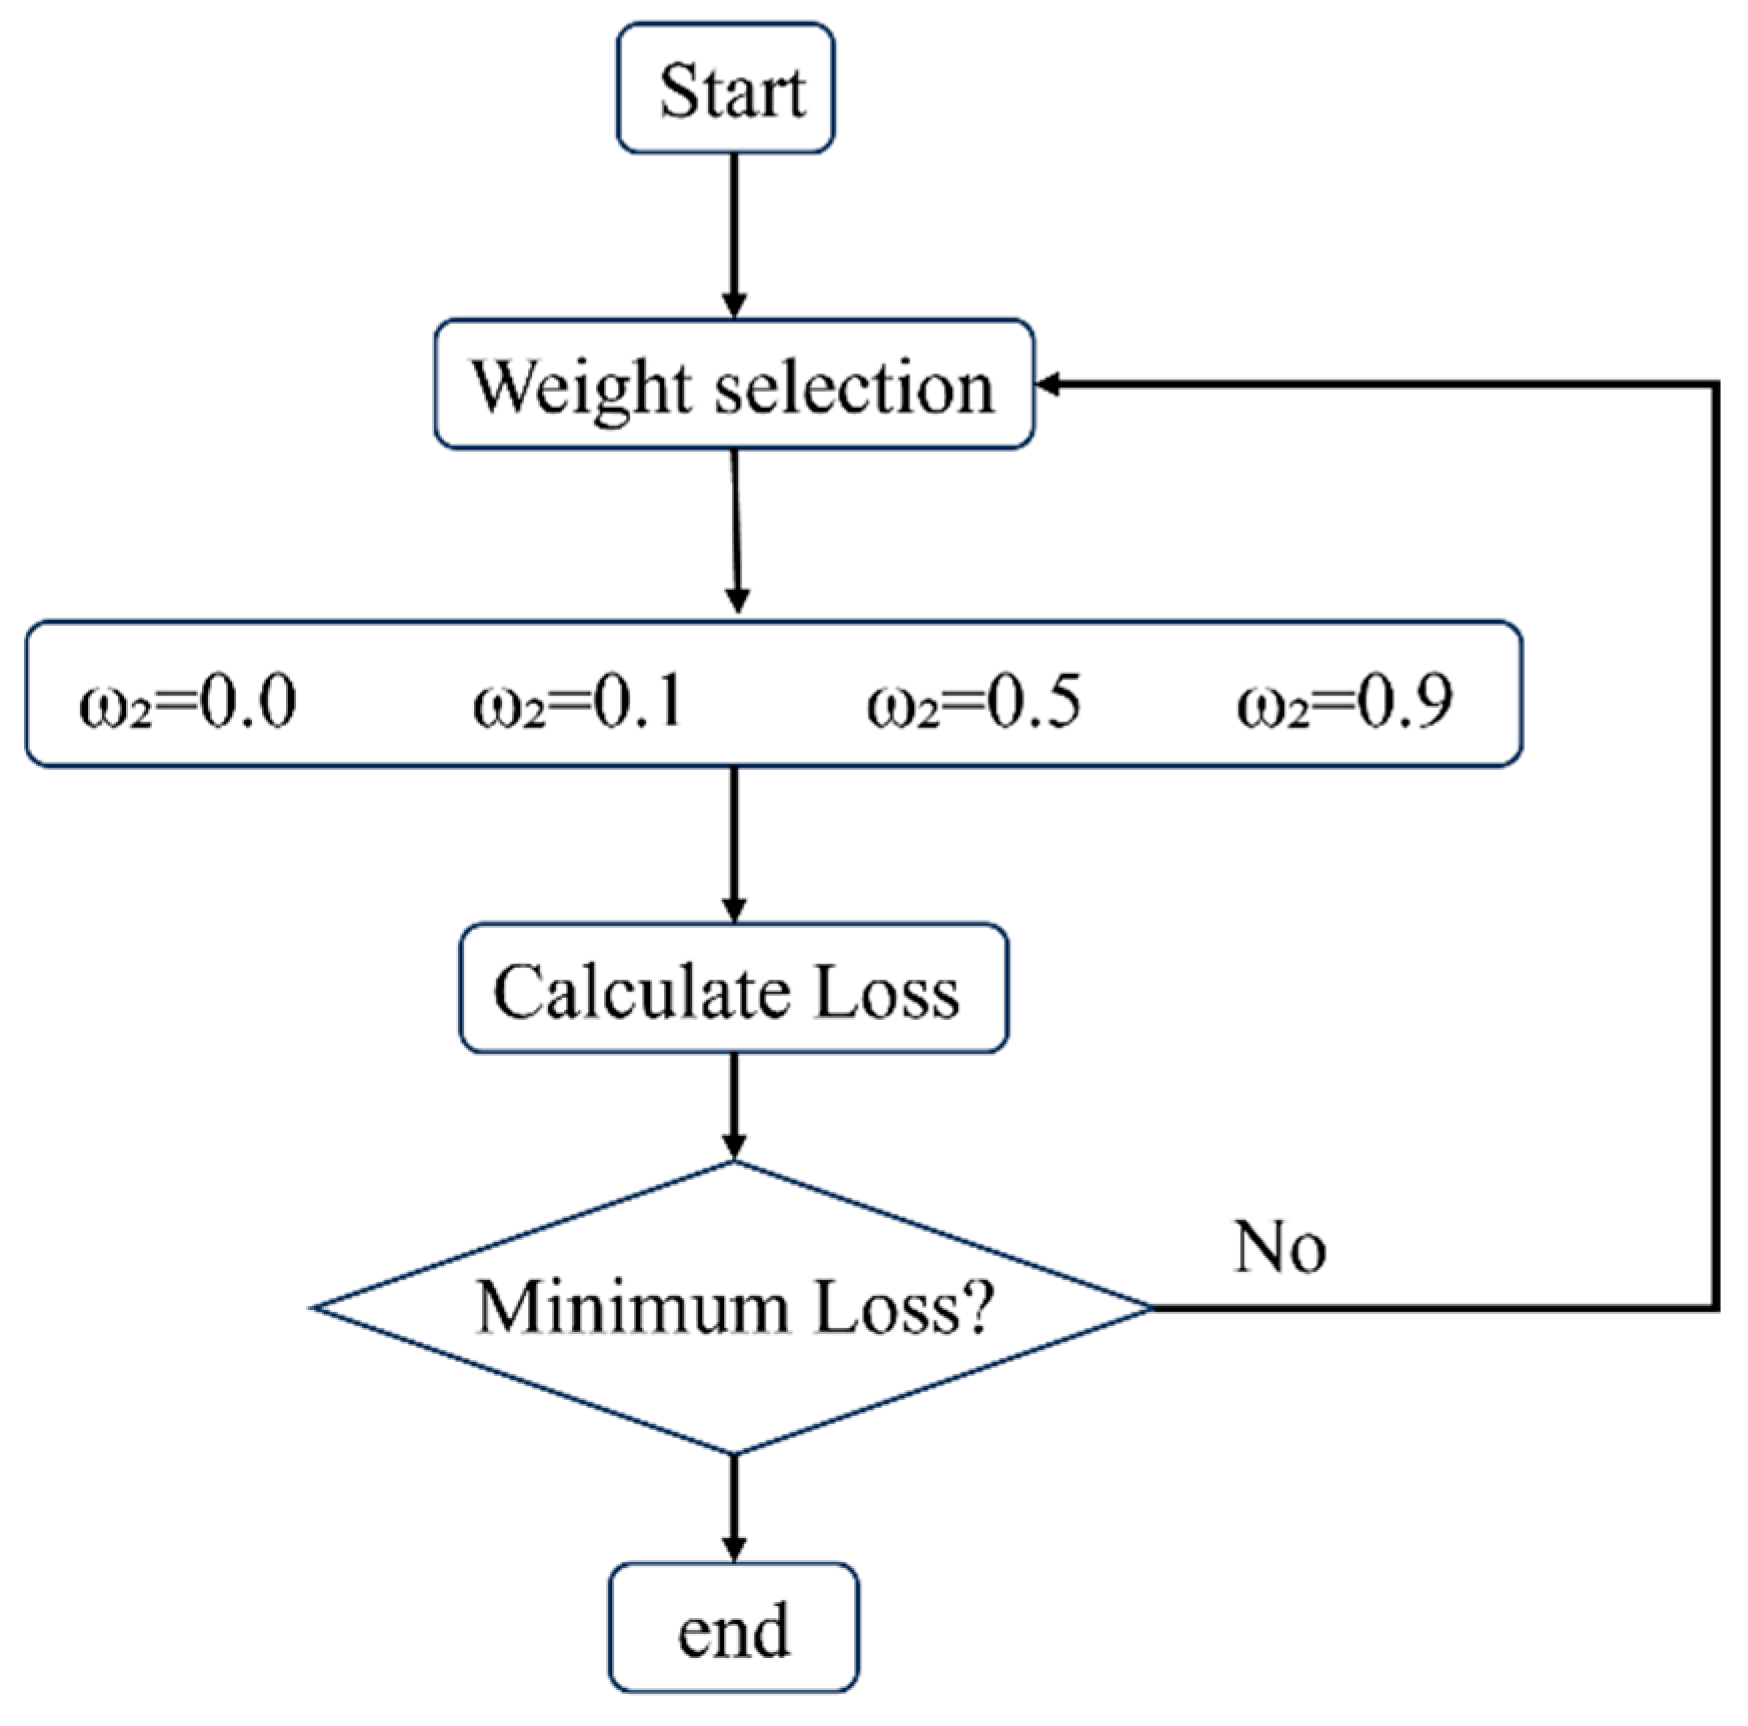
Subsequently, four different ratios of
were selected for estimation validation: 0, 0.1, 0.5, and 0.9. These ratios correspond to estimation using only data-driven loss (A), data loss dominance (B), equal distribution of the two (C), and physical information loss dominance (D), respectively. In order to evaluate the strengths and weaknesses of the four ratios, they are integrated into a dynamic optimization option within the weight adjustment mechanism and incorporated during model training. The specific illustration is shown in
Figure 10.
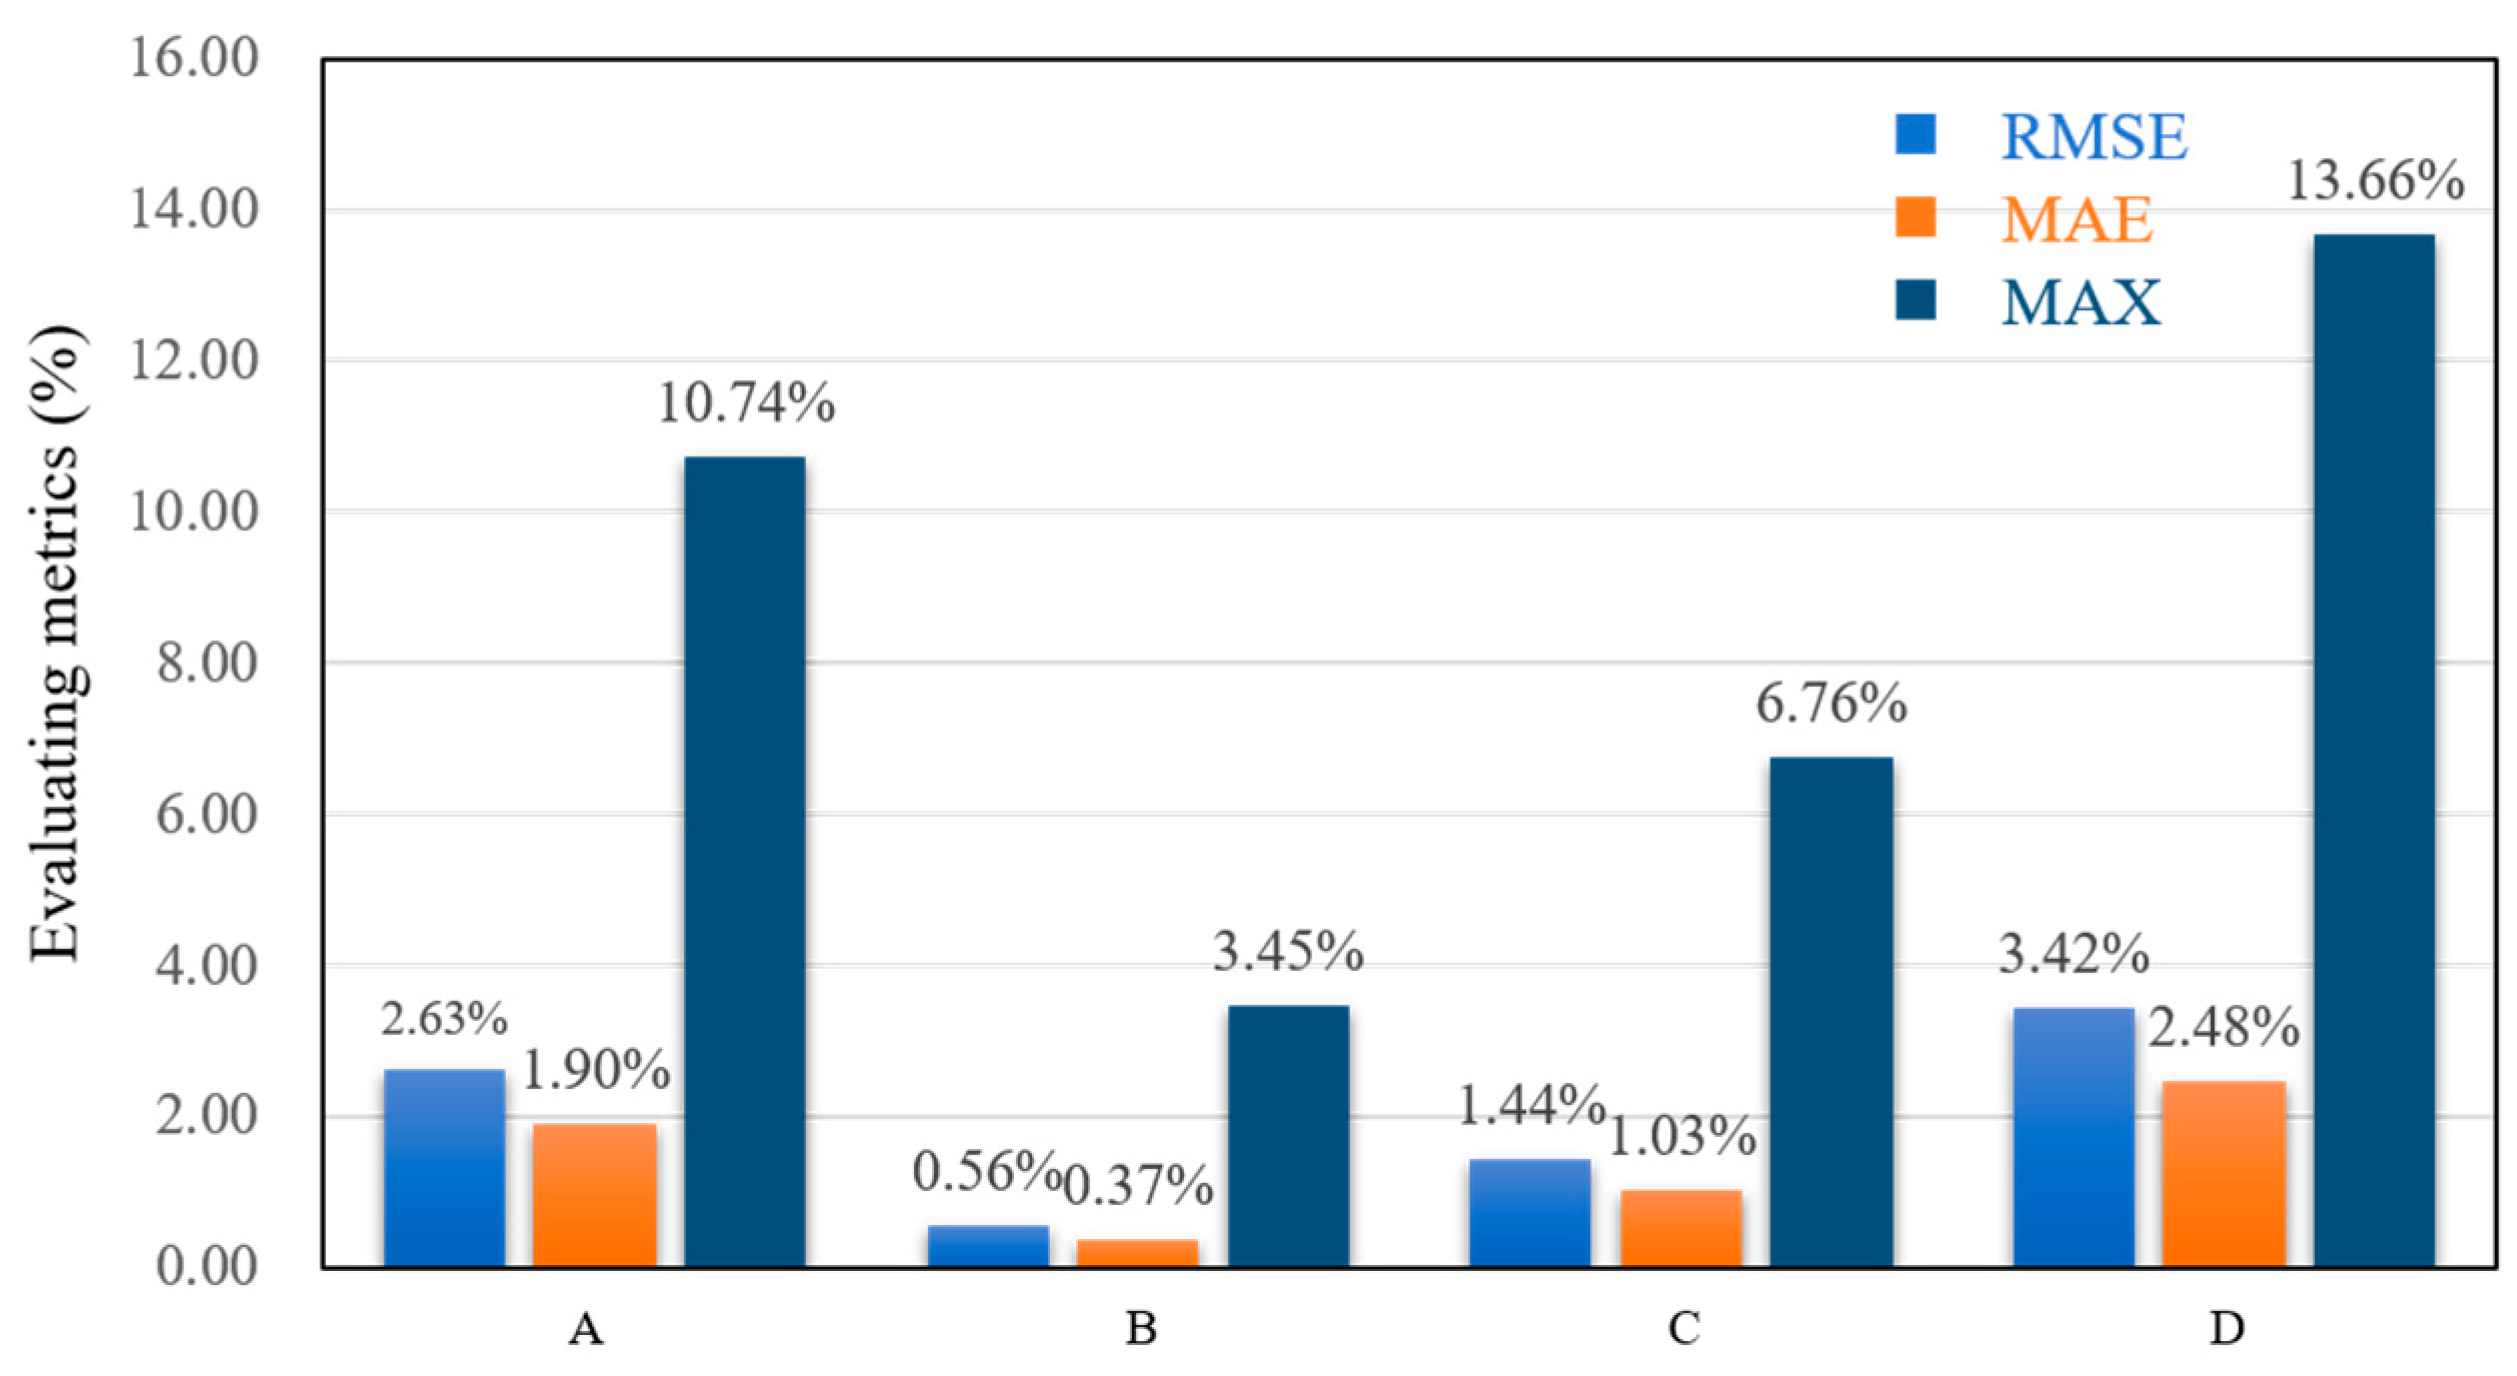
The corresponding results are displayed in
Figure 11. The estimation indexes of the model exhibit a unidirectional trend of change, whereby an alteration in
is observed to initially diminish the estimation performance, subsequently leading to an enhancement. The figure indicates that with the alteration of
, the model’s estimation indexes demonstrate a consistent trend of alteration, i.e., the estimation performance initially decreases and subsequently increases. The estimation results where data loss dominates is the optimal value, with an RMSE of only 0.56%. Conversely, the RMSE when the two losses are equally distributed is 1.44%, while the RMSE when the physical information loss dominates is 3.42%. The subsequent analysis will demonstrate how, utilizing A as the baseline, the network with solely data-driven losses does not priorities the internal operating mechanism of the battery. Instead, it relies on a black-box model to establish the mapping between the input signals and the SOCs. Consequently, the estimation is mediocre. However, when the two losses are equally distributed, the model incorporates both the connectivity between the data and the constraints of the battery mechanism model, thereby attaining superior results in comparison to A. The existence of results B and D can be attributed to the non-rigid nature of the information contained within the physical domain. This component of the mechanistic information is capable of attaining a more precise estimation as an auxiliary data-driven one. To illustrate this point, consider the Rint model, which delineates the current–voltage relationship within a Li-ion battery. However, this model lacks a component that delineates the direct relationship between current-voltage and SOC. Consequently, it necessitates additional access to the relationship between open-circuit voltage and SOC for a more precise estimation of SOC. Consequently, reliance on this component of the information is inadequate for accurate SOC estimation. The data loss dominated approach, on the other hand, is capable of incorporating this part of the mechanistic information to assist in addressing the limitations of the data-driven black box approach without compromising its dominance, in accordance with the non-direct mapping relationship of the Rint model. Consequently, in this particular data set as well as in the test form, the data loss-dominated approach consistently yields more accurate estimation results.
4.2. Estimation Results of SOC at Other Temperatures
In addition to differing working conditions, the dynamic characteristics of lithium-ion batteries are also susceptible to the influence of other environmental factors. Indeed, changes in ambient temperature have been shown to have a significant impact on the electrochemical reactions within the battery [
34]. The accuracy with which the BMS can estimate the SOC of Li-ion batteries under extreme temperature conditions is a critical factor that will affect the longevity of Li-ion batteries. In severe cases, this inaccuracy may even result in damage to the batteries and potentially hazardous accidents, such as explosions [
35]. Consequently, it is imperative to verify the estimation outcomes of the proposed method under diverse temperature conditions. In this subsection, the proposed method is evaluated at temperatures such as −20 °C, −10 °C, 0 °C, 25 °C, and 40 °C (A123 dataset).
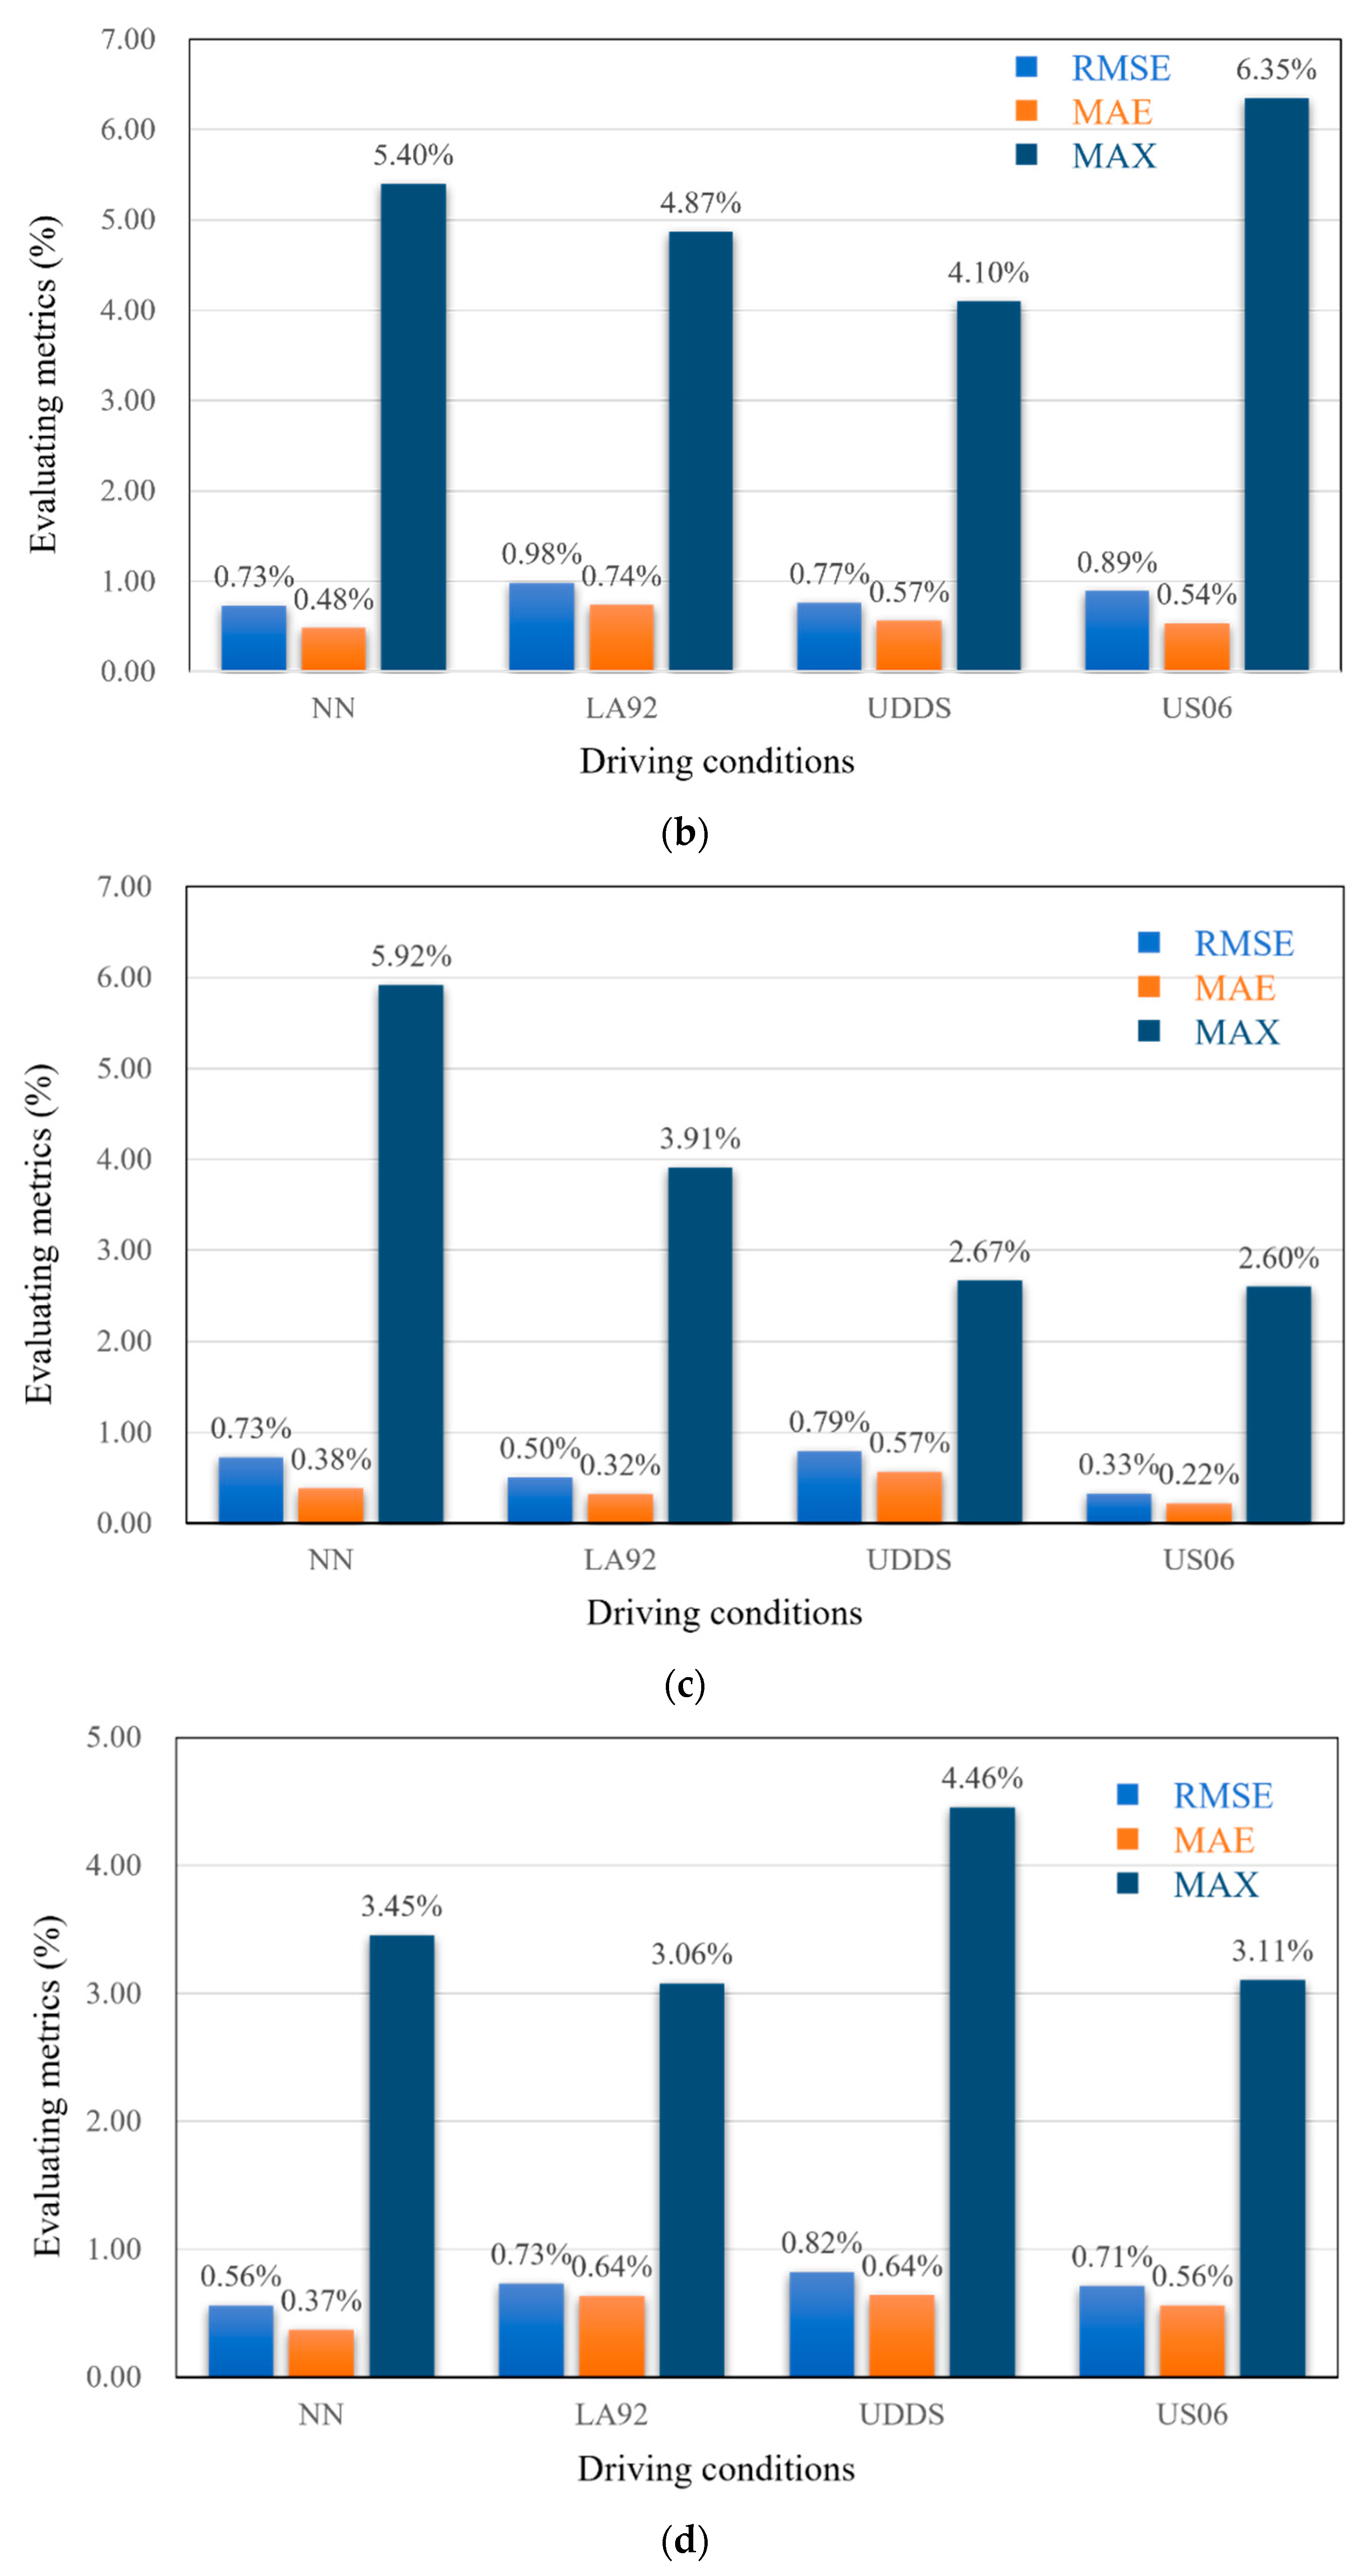
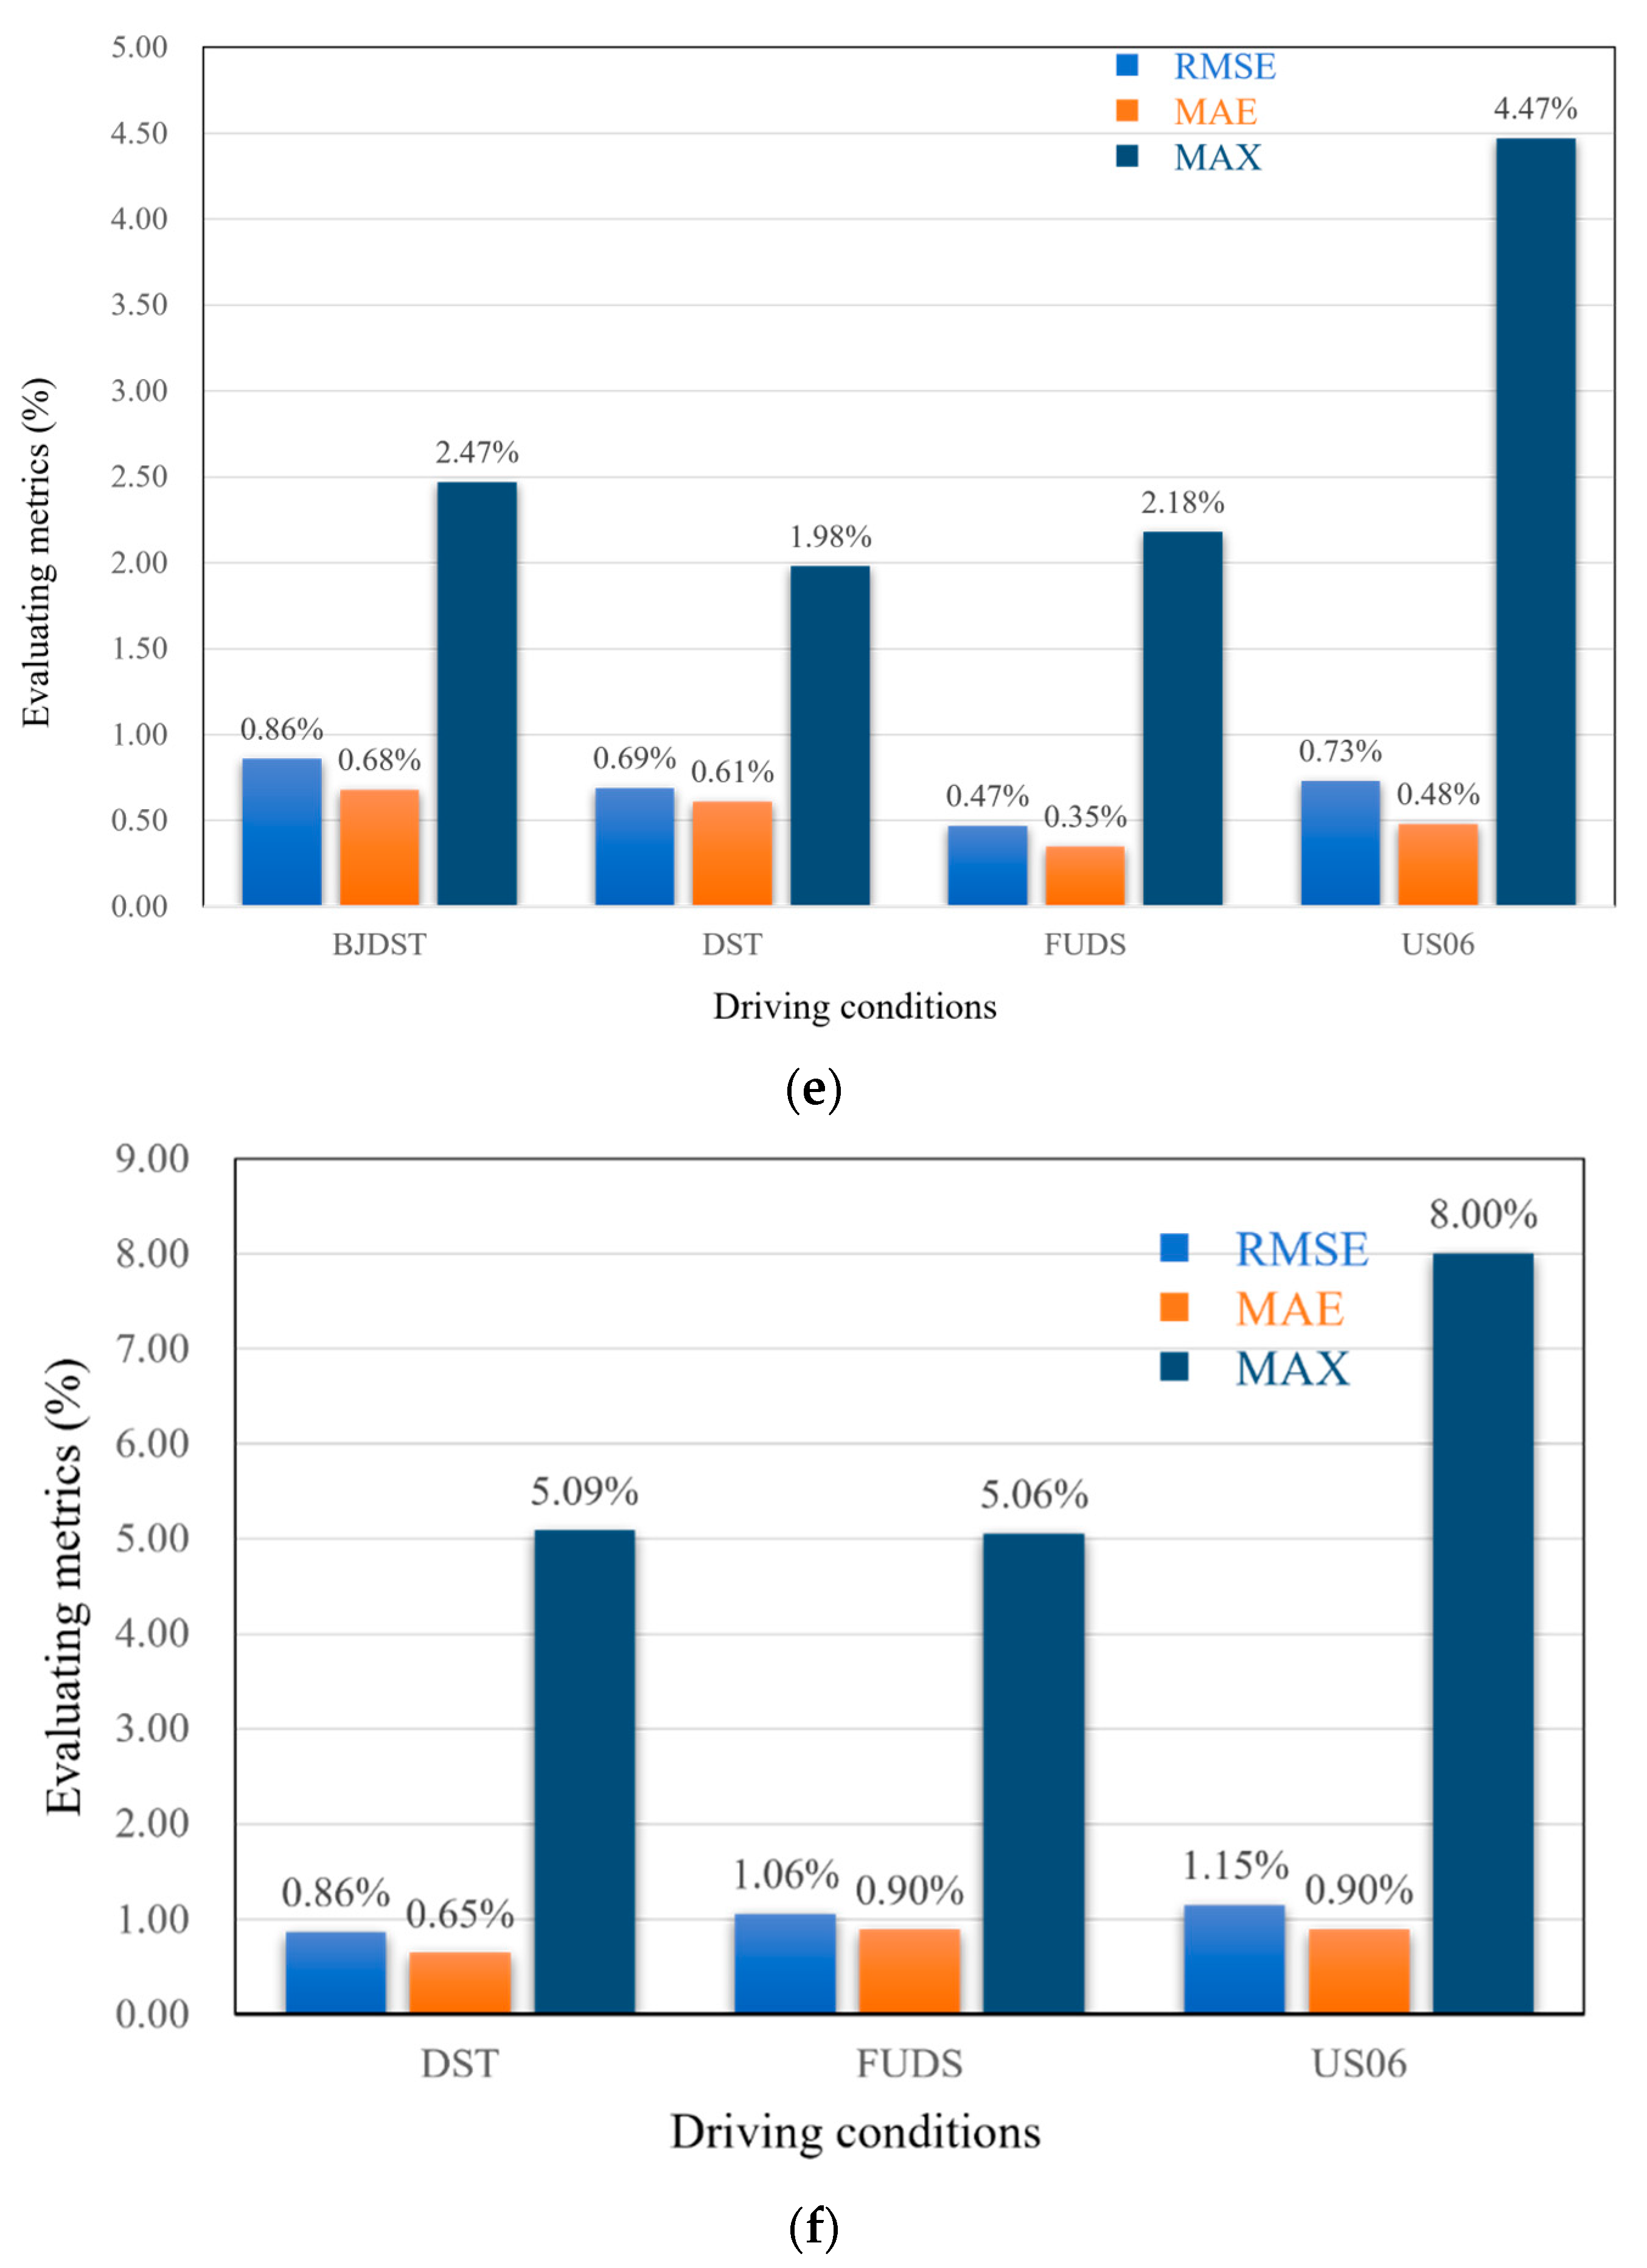
The training set employed for the aforementioned evaluation of temperatures ranging from −20 °C to 25 °C encompasses cycles 1 to 4, while the test set comprises a total of four working conditions, namely NN, LA92, UDDS, and US06. The A123 dataset was utilized for 40 °C, incorporating DST, FUDS, and US06, necessitating the implementation of the leave-one-out method for training and testing purposes (two conditions were allocated for training, while the remaining condition was designated for testing). The estimation results of the SOC obtained by the proposed method in this paper are shown in
Figure 12.
The present study investigates the estimation of the SOC at varying temperatures and driving conditions. This approach facilitates a more comprehensive evaluation and validation of the SOC estimation method. As illustrated in
Figure 11 and substantiated by
Table 2, the proposed method exhibits consistent estimation accuracy across all temperature ranges, with the MAE remaining within 1%. The overall error of the estimation demonstrates a downward trend as the temperature increases from −20 °C (low temperature) to 25 °C (room temperature). The mean maximum error across the four working conditions is shown in
Figure 11. Furthermore, the three indicators demonstrate an upward trend as the temperature varies from 25 °C (ambient) to 40 °C (high), with the maximum estimation error occurring at 40 °C for the US06 condition.
Both excessively high and low ambient temperatures are incompatible with optimal battery operation, thereby aligning with the temperature-affected effect on the battery’s internal electrochemical environment. From the perspective of an equivalent circuit model, the modelled internal resistance of a lithium battery is a quantity that is affected by temperature. For instance, a decrease in temperature can impede the embedding of lithium ions within the electrode. The aggregation of lithium ions around the carbon anode can precipitate lithium metal, lithium deposition, or plating on the electrode’s surface. This, in turn, can diminish the transfer rate of active lithium ions and the activity of the internal electrochemical reaction. Consequently, the charge transfer resistance can be elevated. Whilst elevated temperatures have been shown to accelerate the migration of ions and thus facilitate the embedding kinetics of lithium ions, they concomitantly promote the occurrence of undesirable side reactions such as dissolution and corrosion of the solid electrolyte interface (SEI) membrane. This, in turn, can lead to degradation of the carbon anode performance due to the poor stability of the SEI membrane. Furthermore, at elevated temperatures, the inactive materials within the cell (e.g., binders) may become ineffective. Consequently, this may result in bias in circuit modelling quantities influenced by elevated temperatures. This component of the variation can also be elucidated from the perspective of the ampere-time integration method. It is evident that fluctuations in temperature have a direct impact on both the maximum battery charge and the discharge coulombic efficiency. As the temperature is reduced, the charge transfer resistance increases significantly. It is a well-established fact that the charge transfer resistance of a discharging battery is usually much higher than that of a rechargeable battery. Consequently, the Coulombic efficiency of a battery is reduced at low temperatures. The lithium plating effect at low temperatures leads to the deposition of lithium ions on the surface of the electrodes, resulting in a reduction in battery capacity. Furthermore, at elevated temperatures, the distribution of ions becomes uneven during operation of the lithium-ion battery, whether charging or discharging. This may lead to the mixing of ions and produce thermal effects during mixing, affecting the battery Coulombic efficiency. Additionally, elevated temperatures can contribute to lithium battery ageing. This phenomenon is not only detrimental to the performance of the battery, but also precipitates a reduction in its service life. Concurrently, the capacity undergoes a substantial decline following the ageing process.
The results of the SOC estimation under different operating conditions demonstrate the robustness of the proposed method and its ability to adapt to the battery’s varying conditions at different temperatures. This is attributable to the incorporation of battery mechanism information in the proposed method, with the Rint module and Ah-I module serving as the abstracted information of battery operation. These modules facilitate the adaptation of the SOC estimation method to complex operating conditions.
4.3. Comparison with Other Different Methods
In order to verify the superiority of the proposed methods, a range of data-driven and hybrid models were selected for comparison, including Support Vector Regression (SVR), Long Short-Term Memory Neural Networks (LSTM), Hybrid Models [
32], Position-encoded Attention LSTM (PALSTM) [
36], Transformers and XGboost models [
37]. To ensure fairness, the same preprocessing method is adopted for all comparison methods, and the first three use the Panasonic dataset with US06 as the test set. The PALSTM comparison method employs the CALCE dataset for the purpose of comparison. The Transformer and XGboost models were compared using the Panasonic dataset. The hyperparameter of Transformer is set as follows: Attention Head Size: 64, Number of Attention Head: 4, Feed-Forward Dimension: 256, Number of Transformer Layers: 2, Batch Size: 32. And the hyperparameter of XGBoost is set as: Max Depth: [3, 5, 7], Number of Estimators: [100, 150, 200], Learning Rate: [0.01, 0.1, 0.2], Random State: 42, Cross-Validation: TimeSeriesSplit (n_splits = 5).
The comparison effect of the methods in the Panasonic dataset is demonstrated in
Figure 13.
As demonstrated in
Figure 13, the proposed method is the most effective among several methods, both in terms of intuitive SOC estimation results and SOC estimation errors. The local zoomed-in plot of SOC estimation reveals that the SVR estimation error has the largest deviation, followed by the LSTM method, and the proposed method’s estimation curve closely mirrors the reference value. The SOC estimation error plot demonstrates that the proposed method’s error falls within the ±2% range, with only a minor increase beyond this limit during the final estimation period. Significant errors are evident in both the initial and final stages of the SVR, while the LSTM method exhibits minor errors during the initial phase, but significant fluctuations in the latter stages of estimation.
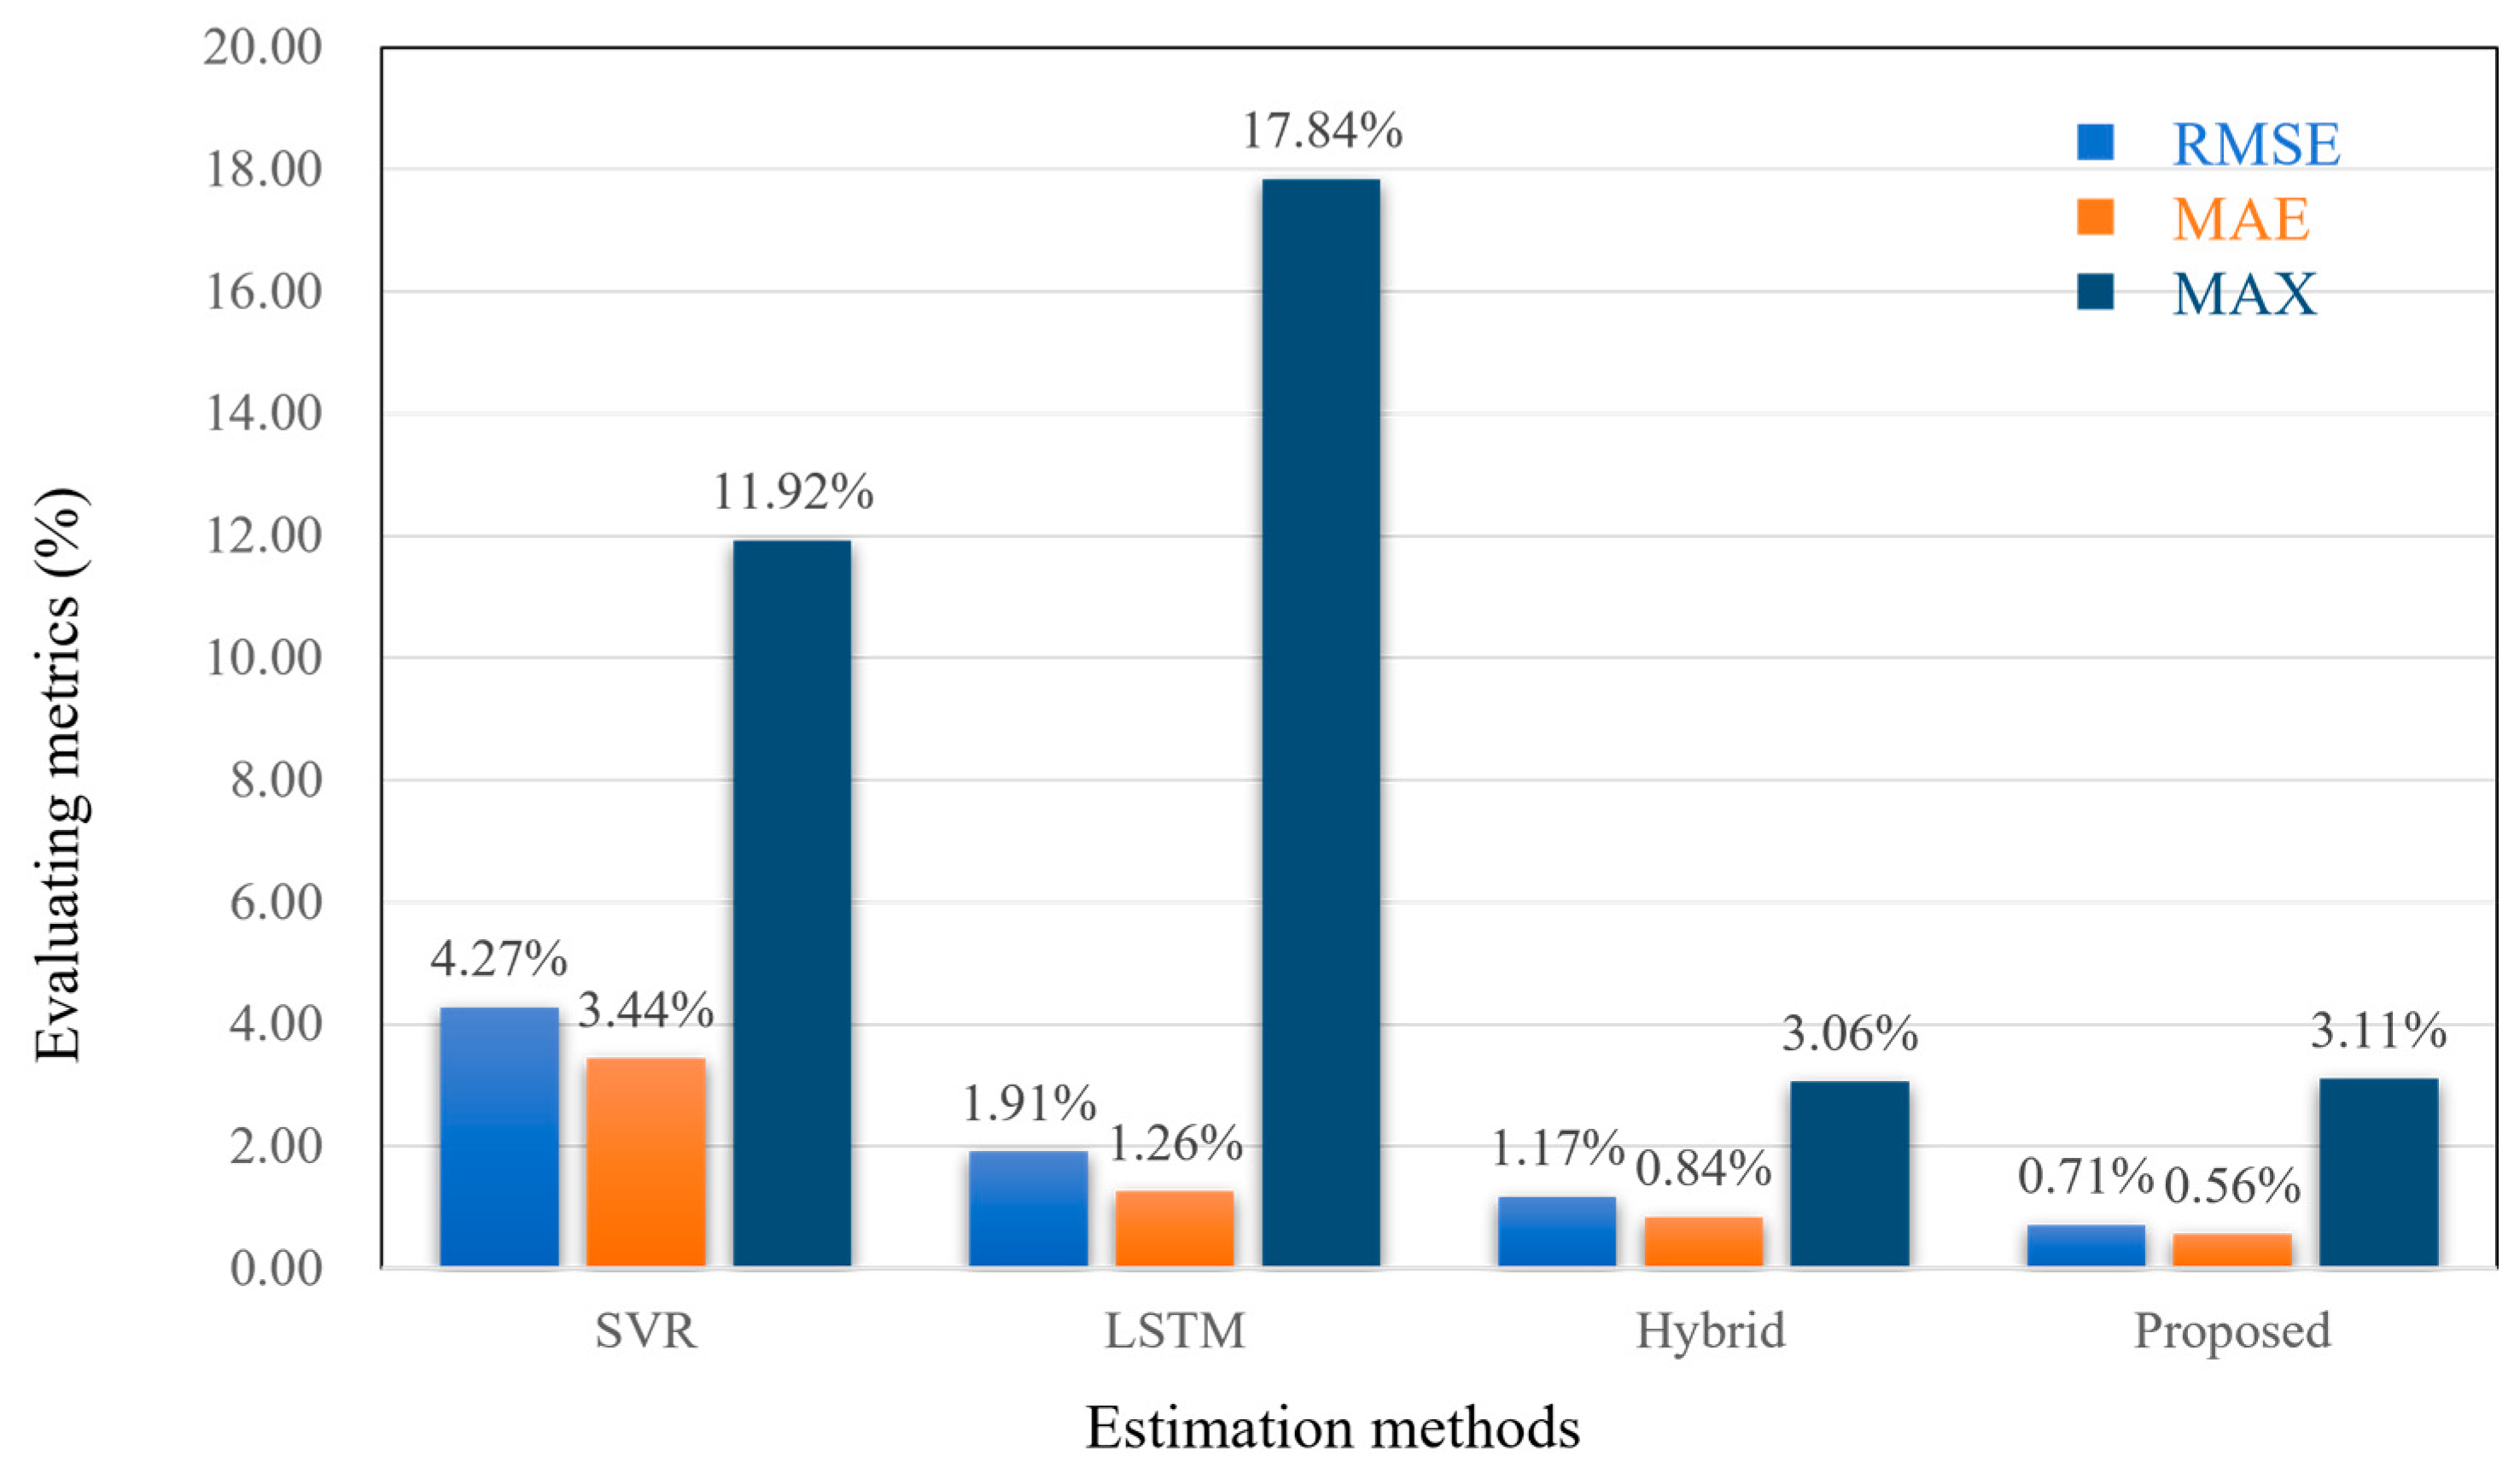
Figure 14 provides a more detailed evaluation of the estimation results. The overall errors of the basic methods, such as SVR and LSTM, are substantial, with the maximum error of LSTM reaching 17.84%. In contrast, the errors of the proposed hybrid method and the method presented in the literature are reduced, and the values of the RMSE and MAE of the proposed method are lower than those of the hybrid method in the literature [
32]. Conversely, the maximum errors observed in the case of the maximum likelihood method are marginally higher than those of the hybrid method, yet they are all less than 5%.
A detailed comparison with another method in the literature is presented in the CALCE dataset, which encompasses the results of the three test conditions. As illustrated in
Table 3, the RMSE of the proposed method demonstrates superior performance in all test cases when compared to the PALSTM. In the FUDS case, the MAE of the proposed method is marginally higher than that of the PALSTM, but for the MAX metrics, the proposed method consistently yields lower values. The findings indicate that the proposed method demonstrates superior performance in all three cases.
The performance of the Transformer model and the XGBoost model [
37] is demonstrated in
Figure 15 and
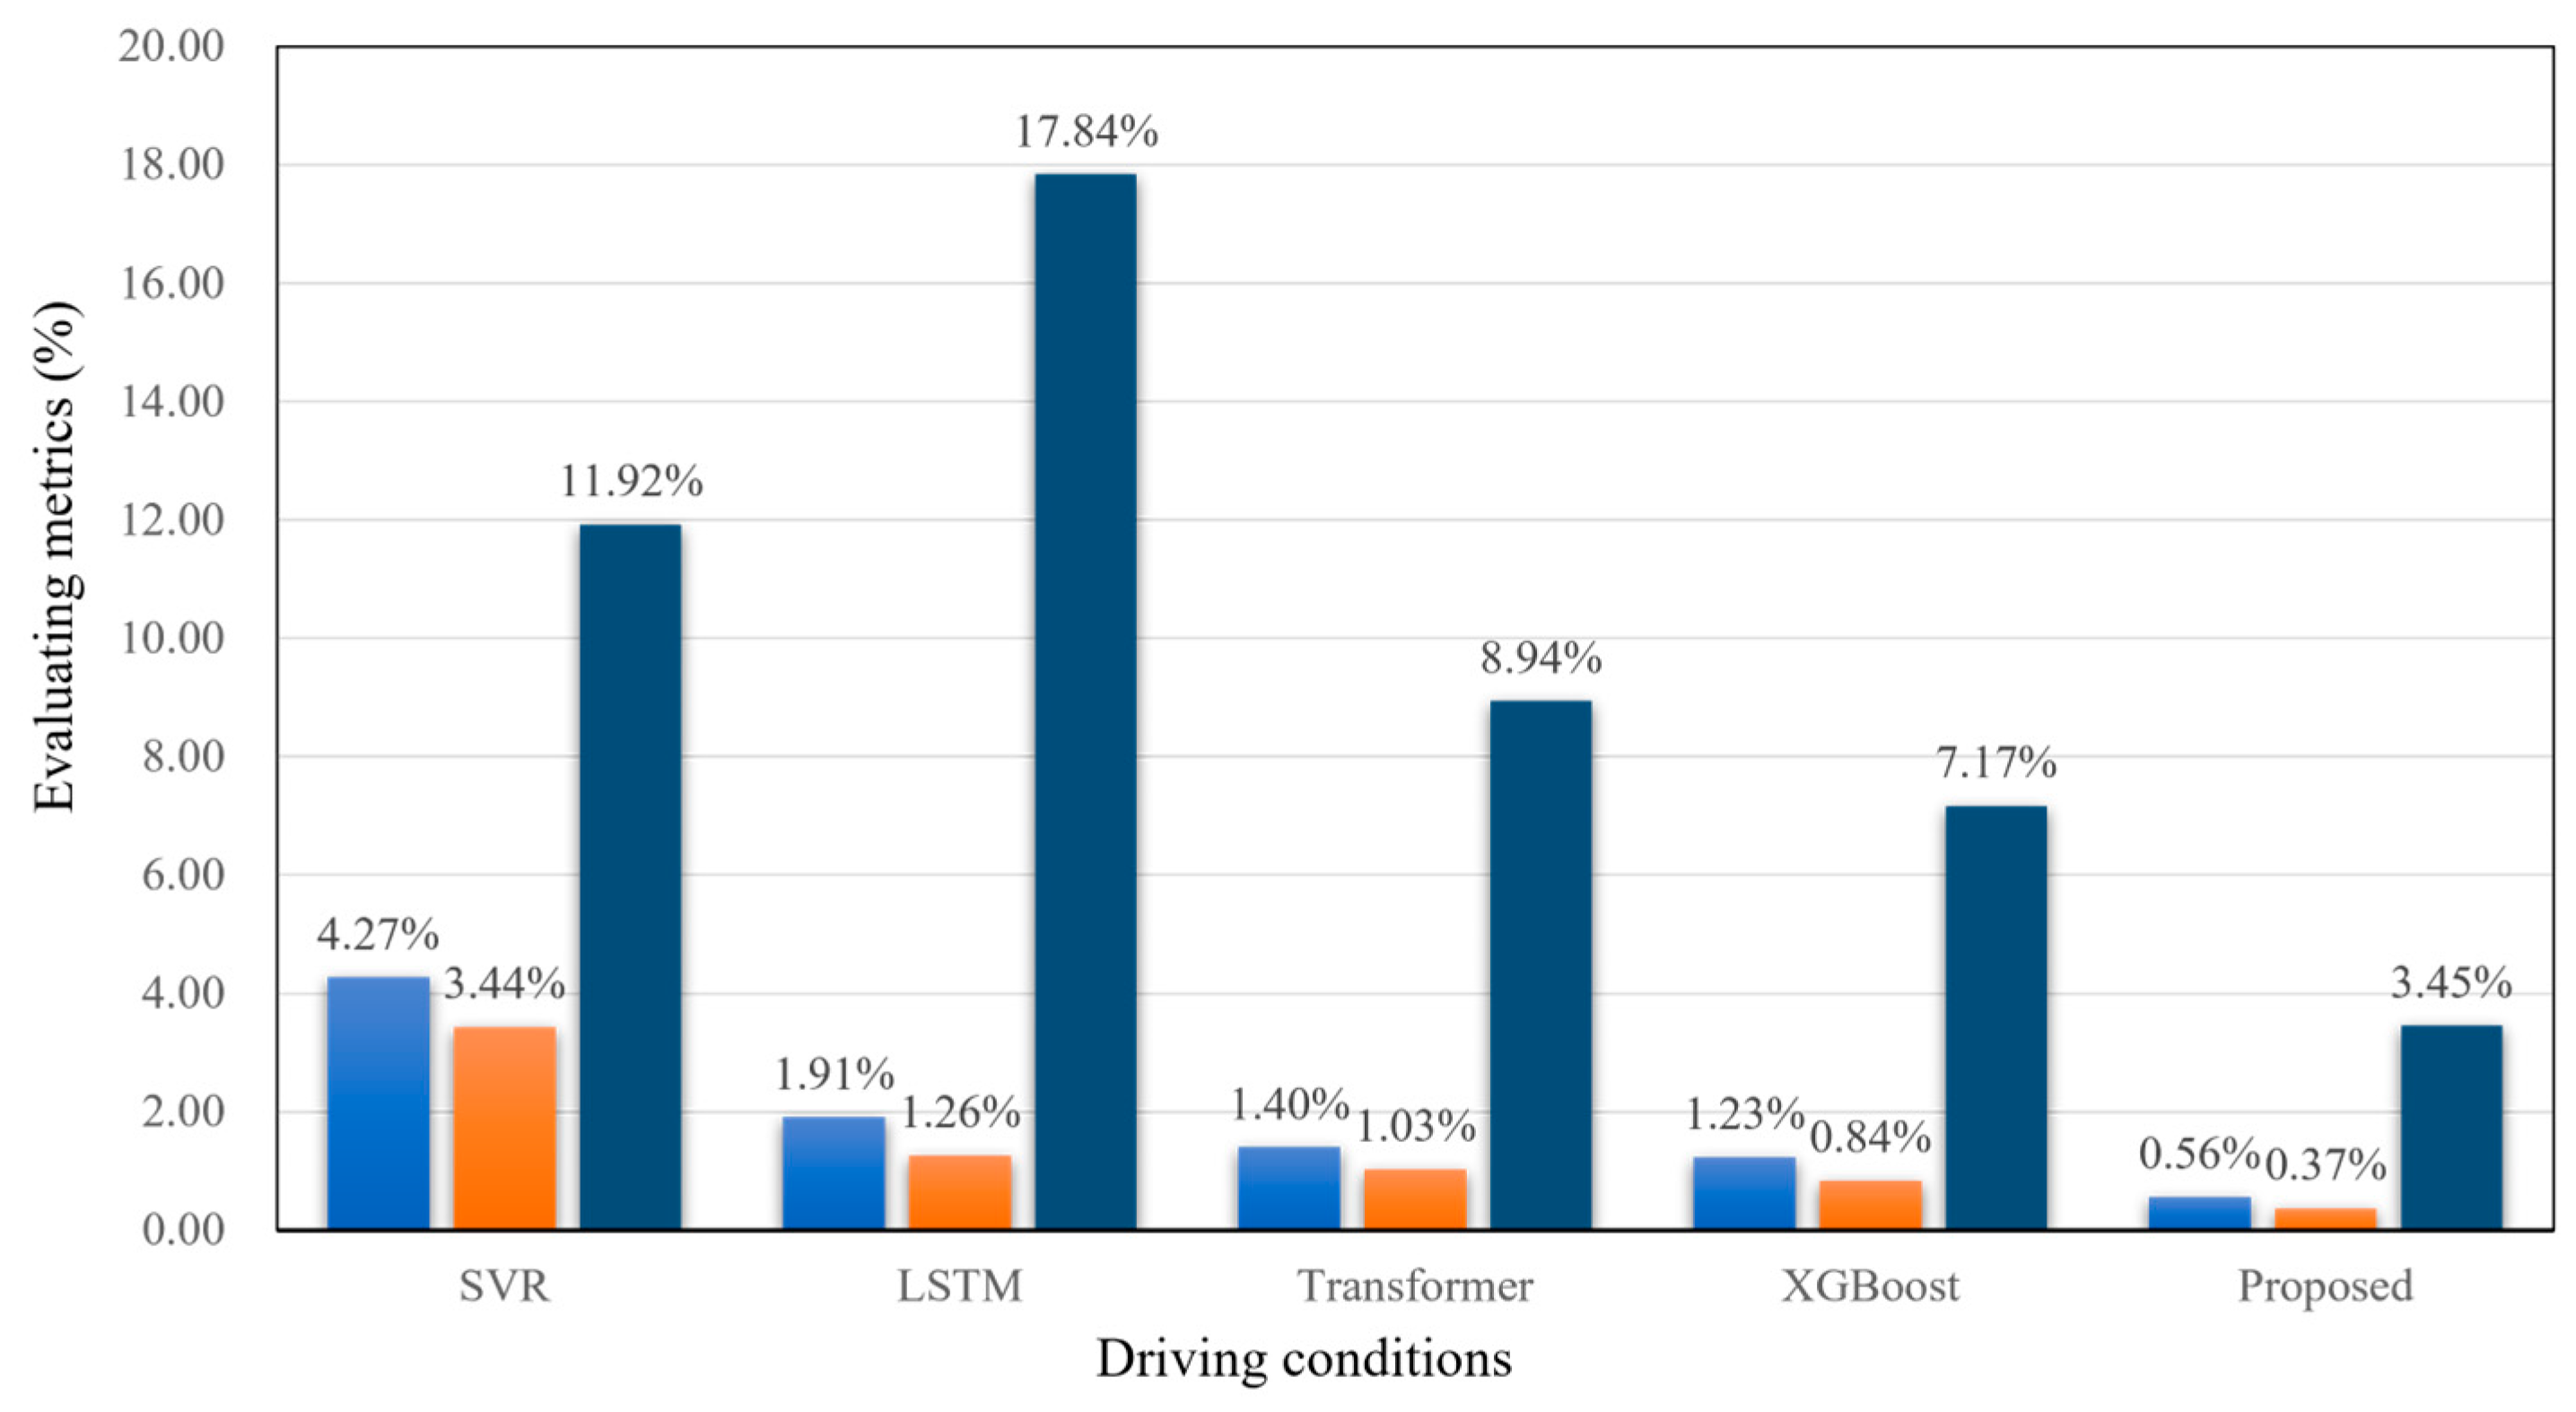
Figure 16, respectively, on the Panasonic dataset. The results of the overall comparison are presented in
Figure 17. It can be observed that, on the same dataset, both the Transformer and XGBoost models exhibit inferior performance compared to the method proposed in this paper. The Transformer model demonstrates the poorest performance, and the XGBoost model also exhibits similar deficiencies. The method proposed in this study demonstrates optimal performance under all four operational conditions.
In order to further explore and validate the practical value of this study, the computational time for methods other than the Hybrid and PALSTM models was calculated. For further details, please refer to
Table 4.
The findings presented herein are derived from the Panasonic dataset. In the present study, the training time of the model under investigation has been found to be directly proportional to the size of the dataset. The training of the Panasonic dataset, which contains approximately 100,000 data points, requires an average of approximately 13 min, while the validation and testing phases require less than 0.1 s. In contrast, both the A123 dataset and the INR 18650-20R (NCM) dataset contain approximately 10,000 samples. Consequently, the training time is approximately 2.5 min, while the validation test set takes approximately 0.012 s. Consequently, the proposed method in this study fulfils both performance and time requirements for practical application in automotive environments.
5. Conclusions
The proposed PINN model in this paper entails the integration of the battery mechanism with the data-driven model, thereby facilitating the acquisition of more precise SOC estimates during the training process. Data from two mechanisms are incorporated into the data-driven model independently, and the estimates of the SOC are then compared with the results of the original model. The findings indicate that both modules enhance the SOC estimation performance of the model. The MAE, RMSE and MAX were reduced by 78.71%, 80.42% and 67.88%, respectively, compared to the initial model. The impact of the model on the estimation effect with varying constraint ratios was further investigated, and the optimal constraint ratio was ultimately determined. Furthermore, the model performance was assessed under diverse operating conditions, encompassing different temperature ranges, and a comparative analysis was conducted with other methodologies. This study demonstrates that a hybridized approach, integrating battery mechanistic information with data-driven models, enhances the efficacy of the BMS in estimating the SOC, leading to enhanced performance.
Despite these promising results, several aspects warrant further investigation. Incorporating temperature dependent electrochemical reactions and long-term aging mechanisms could improve the robustness and adaptability of the model. Moreover, real-time implementation and validation under complex driving or charging conditions remain important directions for future research. These efforts would further strengthen the applicability of the proposed method in practical battery management systems.
