Article

The Technological Quality of New Wheat Varieties Grown in the Southern Region of the Central Andes in Perú

by
Fredy Taipe-Pardo
1,2,*,
Mirian E. Obregón-Yupanqui
2,
Herson Arone-Palomino
3,
Félix Terán-Hilares
4,
Beatriz Núñez-Espinoza
5 and
Isaias Ramos-Quispe
5
1
Agroindustrial Research Laboratory, Universidad Nacional José María Arguedas, Andahuaylas 03701, Peru
2
Department of Agroindustrial Engineering and Technology, Universidad Nacional José María Arguedas, Andahuaylas 03701, Peru
3
Chemistry Laboratory, Universidad Nacional José María Arguedas, Andahuaylas 03701, Peru
4
Agroindustrial Engineering, Universidad Nacional Autónoma Altoandina de Tarma, Tarma 12701, Peru
5
Professional School of Agroindustrial Engineering, Universidad Nacional José María Arguedas, Andahuaylas 03701, Peru
*
Author to whom correspondence should be addressed.
Processes 2025, 13(11), 3577; https://doi.org/10.3390/pr13113577
Submission received: 16 August 2025 / Revised: 24 September 2025 / Accepted: 11 October 2025 / Published: 6 November 2025

Abstract

The growing demand of the cereal market, which demands quality products at low cost, has driven the development of new, more accessible wheat varieties. This study evaluated the technological quality of flours obtained from three new wheat varieties produced in Andahuaylas: Espigón de Oro (EOVF), the Gavilón (GVF), and the Andino (AVF) varieties, comparing them with a widely used plain flour (PF). Their proximate parameters, rheological, thermal, and structural properties, elemental composition, and functional groups were analyzed. The local flours (EOVF, GVF, and AVF) presented similar carbohydrate and fat contents, but higher ash, and lower moisture and protein content than plain flour. The rheology and thermal stability showed limitations associated with a less consistent dough and a more fragile structure, indicating lower gluten quality. Differential scanning calorimetry found gelatinization temperatures between 53.42 °C and 57.12 °C, with energy requirements (ΔH) of 1.08 to 1.23 J/g, while thermographic analysis revealed that component degradation began at 150 °C. Scanning electron microscopy micrographs revealed starch granules with varied shapes and a trimodal distribution. Elemental analysis showed a good energy contribution, with 47.9–54.6% carbon and 45.2–51.5% OH. The FT-IR spectra showed similar functional profiles among all the flours. These results suggest that flours from new wheat varieties have a low energy requirement for cooking, making them ideal for extrusion processes and for products with a soft and light texture. They also represent an excellent alternative to commercial flour for developing functional, infant, and easily digestible foods.

1. Introduction

Cereals, especially wheat (Triticum aestivum), represent the basis of the global diet, providing around 20% of the calories consumed by the human population [1]. However, their production and availability have been affected by factors such as climate change, which has altered rainfall patterns, temperatures, and water availability, and by international crises, such as geopolitical conflict, which has caused disruptions in global supply chains [2]. As a result, the price of wheat has increased by approximately 8% year-on-year between 2021 and 2023, particularly affecting developing countries with a high dependence on imports [3].
In the case of Peru, although per capita wheat consumption exceeds 60 kg per year, national production covers only between 12% and 15% of domestic demand, increasing both economic and food vulnerability in response to fluctuations in the international market [4]. In this context, the development and adoption of local wheat varieties with good agronomic performance and low production costs becomes a key strategy. In the province of Andahuaylas, located in the southern region of the central Andes, new wheat varieties, such as Gabilón, Andino, and Espigón de Oro, have been recently introduced. These varieties show good agroecological adaptation and acceptable field yields, in some cases exceeding 3.5 t/ha [5]. However, to ensure their viability and specific industrial applications, it is essential to evaluate the technological quality of local wheat. This includes physico-chemical properties (protein content, moisture, and ash) and rheological characteristics (gluten strength, water absorption, and elasticity), which directly influence the quality of baked products [6].
Since the quality of wheat flour depends on both the genotype and the edaphic conditions as well as the growing environment, proper technological characterization enables targeted industrial use, enhances competitiveness, and facilitates integration into value chains [7,8]. In particular, wheat’s gluten content plays a fundamental role in the structure of dough and the formation of a cohesive system used in the production of bread, pastries, cookies, cereals, pasta, and noodles [9]. Among wheat species, Triticum aestivum is primarily used for bread and noodle production, while T. durum is typically used for spaghetti and macaroni. Ancient species, such as T. monococcum, T. dicoccum, and T. spelta, commonly known as einkorn, emmer, and spelt, respectively, are used in products like breakfast cereals, whole grains, farro, and salads [10,11]. This diversity in wheat industrial applications has driven breeders to develop new varieties with grain characteristics tailored to emerging uses and evolving market demands [10]. In the case of newly introduced local varieties, there remains a significant knowledge gap regarding their technological properties, making it difficult to determine whether they are comparable, superior, or inferior to the commercial flours of the older wheat varieties.
Therefore, the technological characterization of flour from new wheat varieties is a strategic tool for boosting the local economy, as it adds value to the product, strengthens the regional agroindustry, and supports the development of sustainable agrifood value chains.

2. Materials and Methods

2.1. Materials

The Gabilon, Andino, and Espigon de Oro varieties, all of Triticum aestivum L., were grown under the same conventional agronomic practices, supplied by the Huampica crop fund (13°30′37′′ S 73°25′48′′ W) belonging to the province of Andahuaylas, located in the south–central region of the Peruvian Andes. The samples, taken in triplicate, correspond to the second year of production and were harvested in May 2022. They were subsequently processed to obtain flour in October of the same year. After grinding, the samples were stored at 20 °C in airtight bags until analysis. In addition, common flour from the Nicolini brand (Alicorp, Lima, Peru) was purchased for comparisons.

2.2. Process of Obtaining Flour

The wheat grains were pre-screened to remove impurities and those showing mechanical damage. They were then milled using a hammer mill equipped with 0.3 mm conical mesh screens. The granulometry of the local flours was adjusted to the same particle size as the commercial (plain) flour, using a 120 mesh sieve with an opening of 125 µm (according to ASTM E11). The larger particles from the first milling were reprocessed until the desired particle size was achieved, and the samples were stored in airtight bags at room temperature (20 ± 5 °C) until analysis. Nicolini brand plain flour, produced by the Peruvian company Alicorp and widely used throughout the country, was used as a commercial reference. In all cases, both the processed and plain flours had a particle size of 125 µm.

2.3. Proximate Composition of Flour

Proximate analysis of flours obtained from the new wheat varieties was conducted using the standard AOAC methods. The humidity was determined by oven drying (SLW-115STD, EE. UU), 925.10 [12], and the proteins were quantified using the Kjedhal method 955.04 90 [13]. For the fats, direct Soxhlet extraction 920.39C was used [13], with the dietary fiber (AOAC 985.29) using the method cited by McCleary [14]. The ashes were determined by gravimetry 942.05 [15], and the carbohydrates were determined by difference and expressed as carbohydrate content = 100 − (% Protein + % Fat + % Ash + % Fiber + % Moisture) [16].

2.4. Amylographic and Farinographic Properties

The rheological properties of the dough were evaluated in an amylograph (Bradender, model 800250, Germany), according to the AACC method 22-10 [17]. The analysis was performed with 50 g of flour corrected to 14% moisture content in the farinograph (Bradender, model 810161.001, Germany) according to AACC method 54-21 [17]. A total of 300 g of flour corrected to 14% moisture content was used in this analysis.

2.5. The Determination of the Thermal Stability of the Flours

The thermal stability characteristics of the flours were evaluated using a differential scanning calorimeter (DSC 2500, TA Instruments, USA), following the methodology by Jhan [18] with some modifications. Previously, the sample was hydrated with distilled water in a 1:2 ratio, the mixture was homogenized for 2 min in a vortex (Isolab, Germany) at 3000 rpm, and subsequently, 7 mg of each hydrated flour was weighed into an aluminum crucible and hermetically sealed. The operating temperature range was 25 to 150 °C, at a heating rate of 5 °C/min. To control the local environment around the sample, N2 gas (50 mL/min) was used.
The thermal decomposition of the wheat varieties into the flours was determined by using a Thermogravimetric Analyzer (TGA550, USA). Briefly, the degradation temperature was carried out with 10 mg of the samples at temperatures of 25 to 600 °C, at a heating rate of 10 °C/min. The weight loss of the samples was recorded as a function of temperature, indicating the decomposition or volatilization of the different components contained in the samples [19].

2.6. Structural Analysis of Flours

The surface structure of the samples was evaluated by using a scanning electron microscope (SEM) (Quanta 200, USA) at 25 kV and a magnification of 1000×, using Oxford Inca 350 X-ray energy dispersion microanalysis (EDAX). For the analysis, the samples were mounted on aluminum sample holders with 12 mm of carbon tape. Images were obtained under low vacuum conditions using ABS and LVD detectors at an operating pressure of 0.07 Torr.

2.7. Determination of Functional Groups by Infrared Spectrophotometry

The functional groups of the wheat flours were analyzed using an ATR-FTIR instrument (Nicolet IS50, Waltham, MA, USA), following Zhao [19] with some modifications. The instrument was adjusted to a resolution of 8 cm−1, and it performed 32 scans, using advanced correction for the diamond crystal. The angle of incidence was 45 degrees, and the refractive index was 1.50. The analysis focused on the mid-infrared range (4000–4001 cm−1), commonly used to identify functional groups in organic and food matrices.

2.8. Statistical Analysis

Determinations were performed in triplicate, and the data were expressed as means and standard deviations. The data were analyzed using analysis of variance (ANOVA) and their interactions. For this purpose, Fisher’s least significant difference (LSD) procedure, with a confidence level of 95% (p-value ≤ 0.05), was used. The Pearson correlation coefficient and principal component analysis (PCA) were used to evaluate associations and patterns of variation among the flour technological quality properties. Statistical and graphical analyses were performed using Origin Pro 2025 (OriginLab Corp., Northampton, MA, USA).

3. Results and Discussion

3.1. Proximate Analysis

The diversity of the wheat varieties makes them suitable for different types of products, offering certain functional attributes [5]. The results of the proximate composition of the wheat flours (GVF, EOVF, AVF, and PF) are presented in Table 1.
The flour from each sample showed a significant difference (p < 0.05) in moisture, ash, protein, and carbohydrate content. The moisture content in the new wheat varieties (Gabilón, Espigón de Oro, and Andino) was slightly lower than that in common wheat flour. Furthermore, the values obtained were lower than those reported by Mir [20] for Tatar and common buckwheat flours, which had moisture values of 10.46% and 11.03%, respectively. Moisture values lower than 14% are recommended for flour storage [20]. Since a lower moisture content reduces the possibility of microbial growth, it favors the stability of the flour during storage and prolongs its shelf life [21]. Previous studies have confirmed that wheat protein plays a fundamental role in food structure, nutritional value, and its multiple industrial applications, particularly in the formation of dough in baked goods, which is a key indicator of wheat quality [16], and the results express that the protein content in plain flour (PF) was higher than in the wheat flours (GV, EOV, and AV) (p < 0.05) (Table 1). In this sense, our results were lower than those reported in a study conducted in Germany, where average crude protein values of 9.8% were observed in local varieties and 9.6% in modern varieties over a three-year period [22]. Similarly, Siddiqi [23] reported flour protein contents ranging from 9.03% to 12.33% in northern India, depending on the cultivar analyzed. However, the studied samples presented a higher protein content than common buckwheat flour (7.73%) [20], similar to that reported by Skendi [24], who identified flours with more than 9% protein as ideal for baking due to their better gluten-forming capacity. Increased protein leads to better dough processing capabilities, water absorption, and overall quality in the case of biscuits [25]. No significant differences were observed in fat content (1.25–1.26%) (p ≥ 0.05) (Table 1), consistent with the findings of Arriaga [26], who observed minimal variation in this parameter among different wheat flours. The GVF sample presented the highest ash content (1.32%), indicating lower refinement compared to plain flour (PF) (0.68%), consistent with the findings of Sujka [27], who associated higher ash content with less refined flours. The sample (EOV) presented the highest fiber content (1.05%), very similar to the findings of Owheruo [16] for plain flour (crude fiber: 1.18%), which is beneficial for functional foods, according to Tripathi [28], who highlighted the importance of dietary fiber for digestive health. GVF showed the highest carbohydrate content (79.32%), followed by EOVF and AVF, which could be advantageous for the formulation of new food products with high caloric demand (for athletes, children, and others) as suggested by Tsegay and Stellingwerff [29,30], but less desirable in low-carbohydrate products.

3.2. Rheological Properties Associated with Amylographies and Farinography

The amylographic properties of flour make it a versatile and valuable component for various applications [31]. This measurement is useful for evaluating the behavior of flour starch during heating and cooling, which is key in the production of bread, pastries, sauces, noodles, baby products, and other industrial processes [32]. The GVF, EOVF, AVF, and PF samples showed a significant difference in amylographic properties (p < 0.05), as shown in Table 2.
Flours with a higher proportion of amylose, such as PF, tend to gelatinize at higher temperatures, since their chains form helical structures in both single- and double-stranded polymorphs [31], which can be attributed to the formation of more stable complexes. This is consistent with our results, where the EOVF flour, with the lowest gelatinization initiation value (59.4 °C) (Table 2), may have a lower amylose content or a more fragile structure, making it more susceptible to heat. In contrast, the GVF and AVF flour exhibited similar gelatinization initiation parameters, implying similar starting points for baking and structural development of baked goods [25]. In Tharise’s [21] studies, variations in the onset of gelatinization were monitored to be related to the starch composition and its interaction with other components, such as lipids and proteins. K. Wang’s [33] analysis on the thermal stability of starch supports these findings. In that study, it was identified that flours with higher peak gelatinization temperatures, such as PF, have a greater capacity to withstand high-temperature baking processes without disintegrating. In contrast, the EOVF flour showed the lowest temperature, suggesting a lower thermal resistance.
The EOVF, with a significantly lower temperature compared to the GVF and AVF (p < 0.05) (Table 2), might not be suitable for products requiring higher thermal stability, such as breads with long baking times. According to Zhao [19], the maximum gelatinization peak directly correlates with the starch’s ability to absorb water and form a stable structure during heating. Higher peak values, as observed in PF, suggest a higher capacity of starch to retain water, which is crucial for baked goods where a firm crumb is desired. In contrast, the EOVF sample, with a considerably lower value compared to the other samples (Table 2), would produce products with a softer texture, which could be suitable for cakes or lighter products. According to Owheruo and Y.Wang [16,31], a high amylograph quality score is associated with flours with good gelatinization capacity and structural stability, characteristics observed in the PF. The poor performance of the EOVF in the different parameters analyzed (Table 2) indicates a lower functional quality, which could limit its use in formulations that require a stable structure and firm texture.
Regarding the farinograph properties of wheat flour, it is one of the main reference parameters, including water absorption, dough development time, dough stability, and degree of softening [34], and its application is widely established in the industry for quality control and as a complementary tool in monitoring the production process. In all cases, the farinograph properties showed a significant difference between the samples studied (p < 0.05) (Table 3).
The GVF, due to its high water absorption, may contain a higher proportion of globulin proteins than the other studied samples, making it particularly suitable for the production of larger volume baked goods. Di Cairano [35] showed that water absorption is closely related to both the protein content and the quality of the gluten present in the flour. In this sense, the studied samples (GVF, EOF, and AVF) showed higher absorption values than those recorded in flours from France, China, and Canada (55.7%, 61.6%, and 62.8%, respectively) [36], although previous studies were comparable to those of the PF sample. As pointed out by Sarker and Wrigley [37,38], both the wheat variety (cultivar) and the environmental conditions significantly influence farinographic parameters, such as water absorption and dough development time. Flours with higher DTT, such as the GVF flour, are preferred for baking processes that require longer kneading and gluten development time, which, in turn, is an indicator of protein quality. The studied samples showed similarities with bread wheat (4.22 min) [39] and with flours used for the production of sweet biscuits (3 min) [38], and showed superiority over waxy wheat flour [40]. Variations in dough development time, in general, are affected by the interaction between the circulating water temperature and the kneading speed [41], being critical to achieve a good bread structure [34]. The low S value and high MTI in the AVF flour may limit its use in automated production processes that require long mixing times, MTI values higher than 100 BU and farinographic stability time correlate with the resistance of the flour by the starch that would be damaged at the time of milling [39], and among the samples studied, the EOVF would have less damaged starch after milling, which would favor the production of cakes, as long stability times are usually more suitable for the production of various breads and generally require longer kneading times [42]. The stability of the GVF, EOVF, and AVF was in line with the reports of Aydogan [39] for bread wheat, ranging from 0.50 to 16.11 min. Studies, such as Ktenioudaki’s [43], have pointed out that a high DC, as observed in the GVF, is ideal for baked goods requiring a firm structure, although it might be less suitable for softer products, such as biscuits. The generally accepted consistency corresponds to a curve centered on the 500 BU line [39]. The parameters in Table 3 confirm that wheat flour (GVF) presents a lower farinographic quality (48.66 ± 2.51 min) and decreases further in the EOVF and AVF samples, compared to common flour, which presents a significantly higher FQN (167.00 ± 2.64 min) and is comparable to French wheat flour [36]. Hruskova [44] indicated that a high FQN, as in common flour, indicates a more versatile flour, suitable for various bakery and pasta products due to its balance between water absorption, development time, and stability. The values obtained for the different farinographic parameters of the analyzed flours suggest their suitability for the production of pastry products, biscuits, and noodles made with soft wheat. In fact, it is common for many millers to blend this type of flour with very hard wheat flours to improve the functional balance in different applications.

3.3. Thermal Characteristics and Gelatinization Degree of Flour

Thermal stability is essential for understanding flour behavior during processing and storage, helping to optimize baking and preservation processes [19]. It also allows for identifying optimal temperatures for different processing stages, such as kneading and baking, minimizing flour degradation [45]. Figure 1 shows the thermal behavior of flour obtained from the new wheat varieties.
The TGA/DTG weight loss curves analyzed with temperatures ranging from 25 to 600 °C showed similar behavior between the AVF, EOVF, and GVF versus the PF (Figure 1), where two well-defined regions associated with the most relevant mass losses were identified. The first zone (S1), between 25 and 150 °C, corresponds to the loss of moisture and the release of low molecular weight compounds present in the samples, resulting in a mass decrease of 12.13%. This loss is mainly attributed to the evaporation of free water and water bound to starch and gluten [46]. Similar behavior has been reported in wheat flours grown in China and Italy, where the release of water and volatile substances was also observed within this thermal range [19,47]. The most significant mass loss is observed in Zone 2, which extends up to 471.58 °C, with a maximum processing peak at 310.00 °C. At this stage, the samples AVF, EOVF, and GVF recorded a weight loss of 70 to 73%. According to the information obtained, and considering the chemical composition of the new wheat varieties (Table 1), this loss is attributed to the pyrolytic decomposition of biopolymers [19], mainly proteins by denaturation, aggregation, and rearrangement of secondary structures (α-helices to β-sheets and disulfide bonds), and lipids and carbohydrates attributed to the rupture of their crystalline structure and polysaccharide chains [48]. This irreversible thermal heat causes the loss of the mechanical and functional stability of the food matrix (loss of elasticity, extensibility, and gas retention). In the final phase, close to 600 °C, an additional loss of 14.87% is evident, related to the revision of ashes and other thermosetting compounds [49]. Thus, the results of the thermogravimetric analysis (TGA) indicate that the AVF, EOVF, GVF, and PF flours showed similar TG curves and were thermally stable at temperatures below 150 °C, the range in which thermal degradation begins. Therefore, the local wheat varieties (GVF, EOVF, and AVF) present technological limitations for crust formation in crispy products, since this attribute requires higher temperatures than those previously mentioned. Consequently, their application would be more appropriate for products that do not depend on Maillard reactions or long fermentation processes (breads).
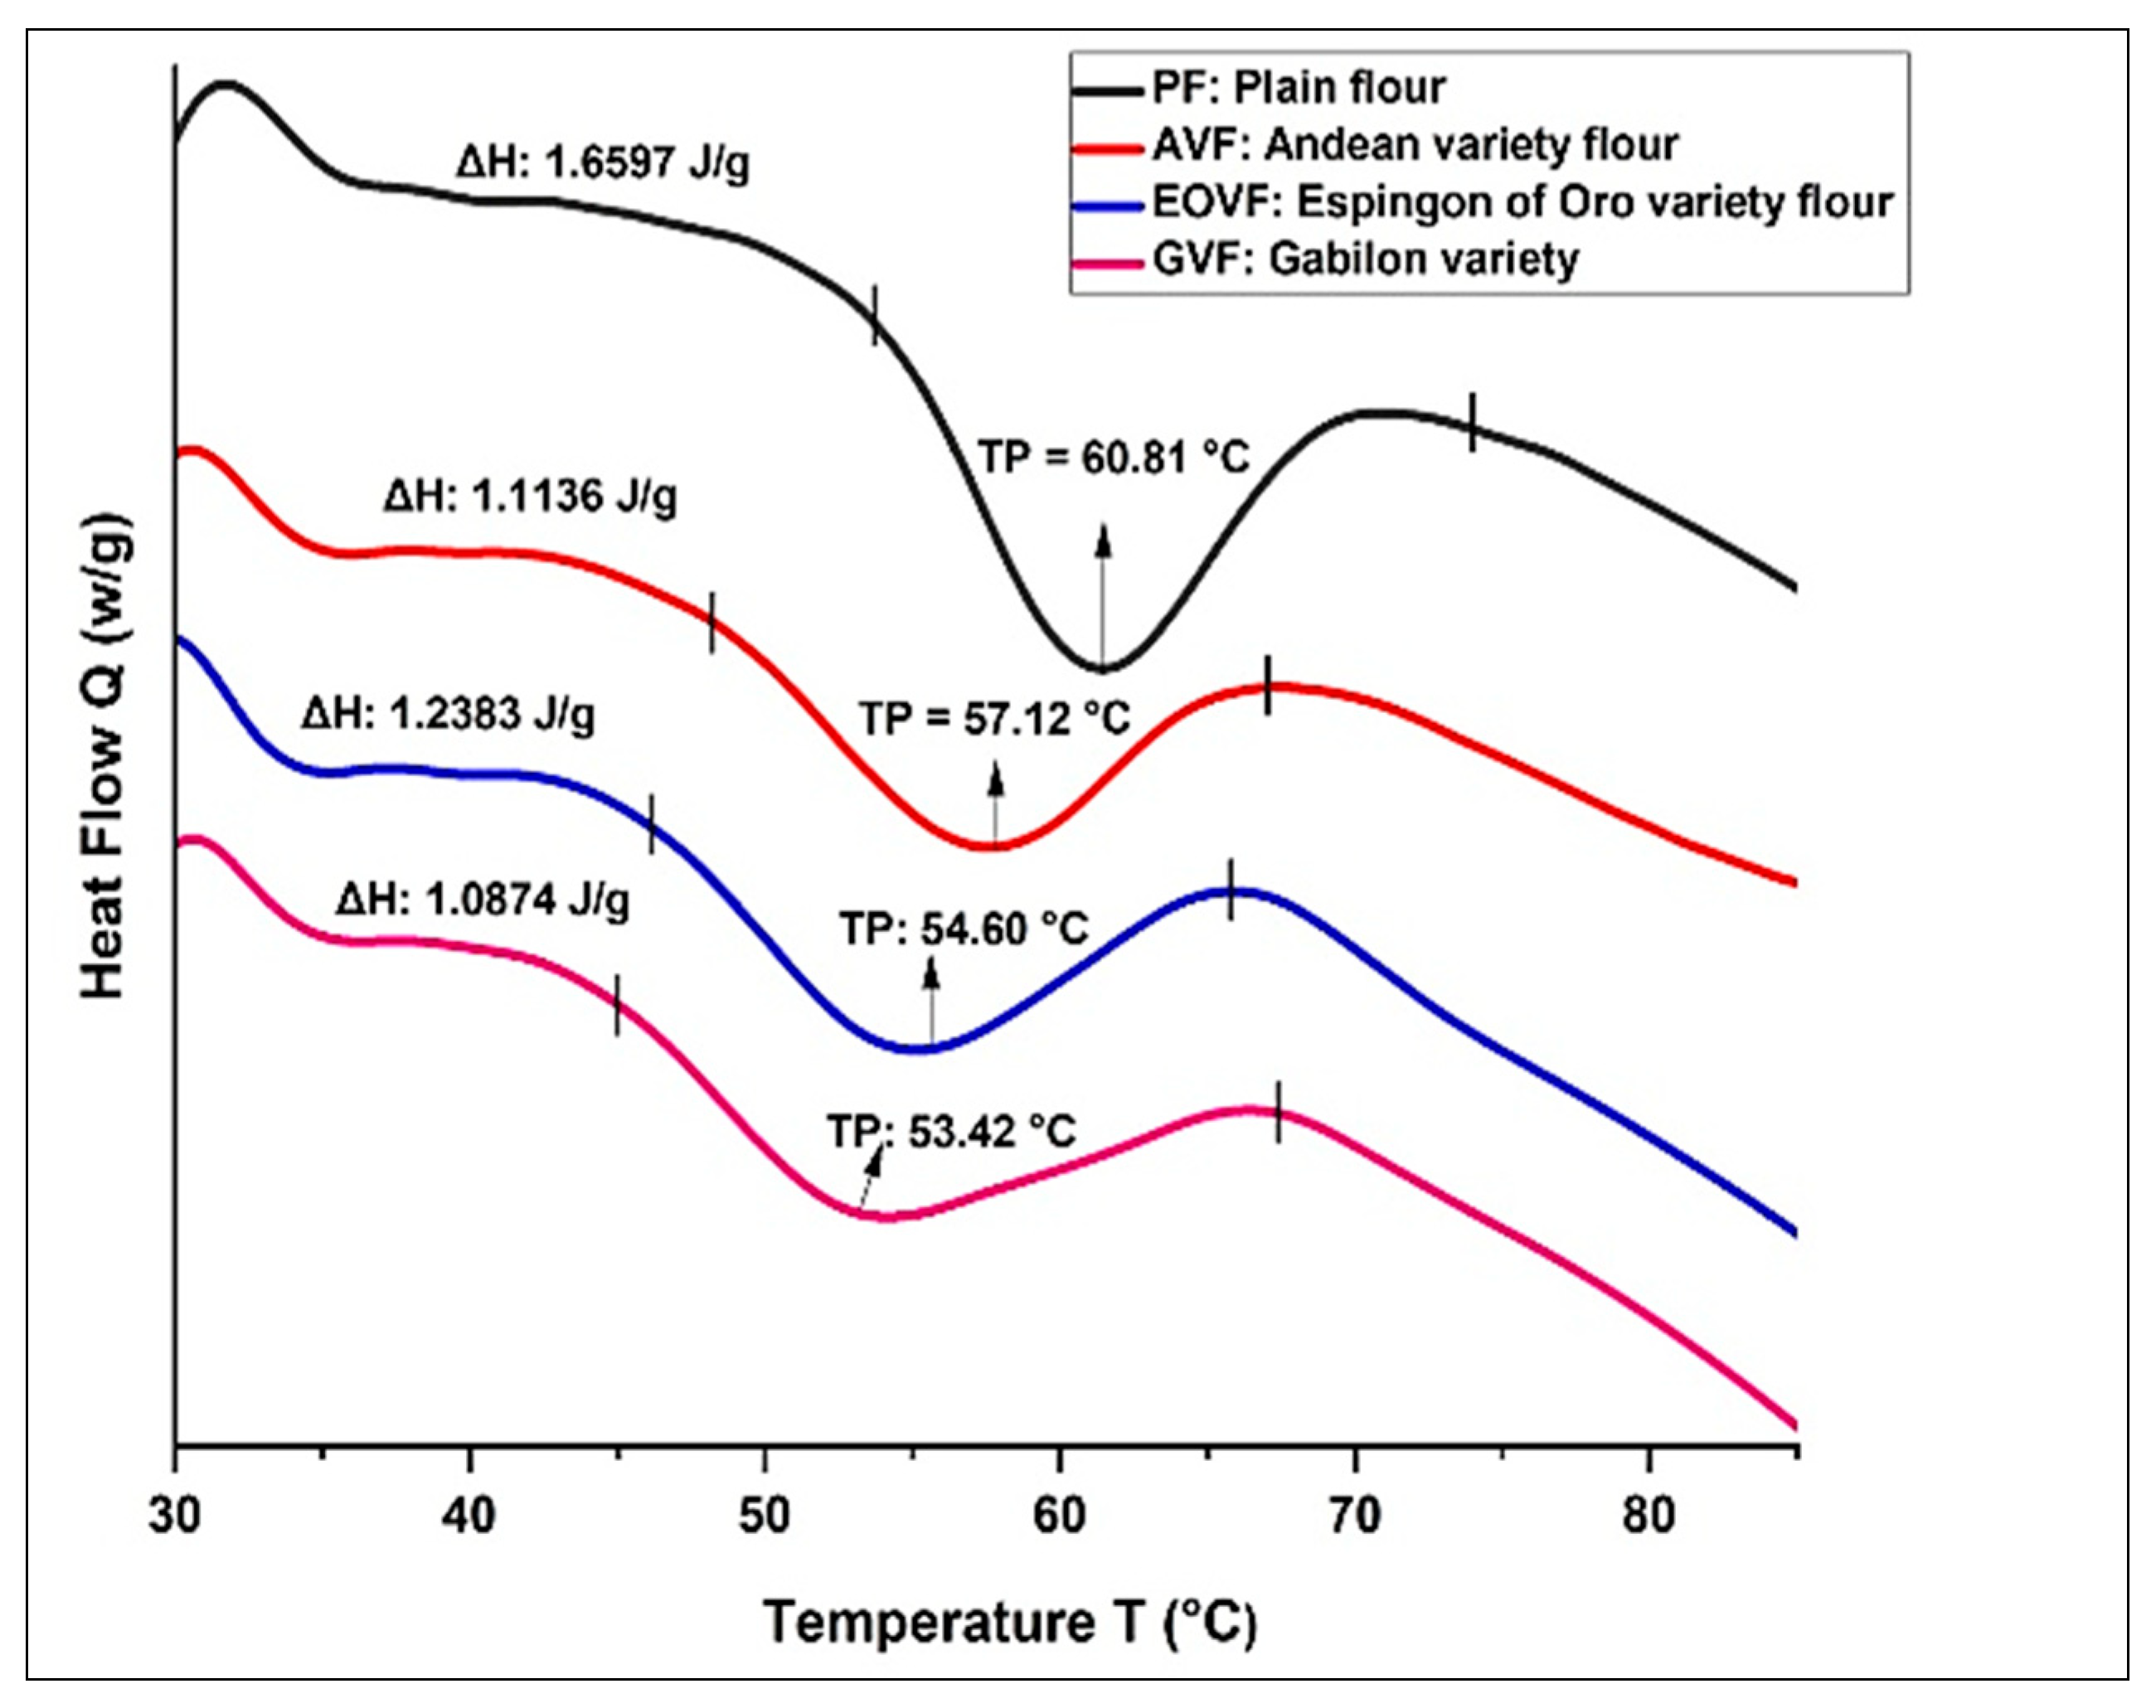
Figure 2 shows the DSC thermogram and data obtained from the samples of AVF, EOVF, and GVF, where the gelatinization thermal transition occurs, starting with a mild endothermic peak above the thermogram baseline.
The thermal gelatinization process of the GVF, EOVF, and AVF samples started at lower onset temperatures (45, 46, and 48 °C, respectively) compared to the plain flour (54 °C), as shown in Figure 2, highlighted by points at the beginning of the endothermic curve. It is at this point that the starch present in the flour begins to gelatinize [50]. This is consistent with the results of the amylographic properties presented in Table 2, where the local flour would have a structure with greater susceptibility to heat. Higher values for the start of starch gelatinization were reported for waxy wheat flour [34,46]. The peak temperature (Tp), which is the temperature where the highest heat absorption values are recorded for the GVF, EOVF, and AVF flours, was recorded between 53.42, 54.60, and 57.12 °C (Figure 2), being lower than the Tp of the plain flour (60.8 °C). In other words, local wheat flours exhibit easy gelatinization, rapid gel structure formation, and lower energy consumption. The final gelatinization temperature (Tc) was between 65 and 67 °C, corresponding to the final phase of the gel formation process [51]. Precisely, the PF reached a Tc of 73.9 °C, showing a pronounced peak, indicating greater gel formation than would be associated with the presence of both single- and double-stranded helical structures [31]. In contrast, local flours presented broader peaks, which is attributed to the heterogeneity in the size of the starch granules and the distribution of amylose and amylopectin, responsible for a semi-crystalline arrangement within the granule [52]. The energy required to complete the process is known as gelatinization enthalpy, and it mainly characterizes the loss of the double helix structure and the melting of the crystalline structure within the starch [19]. For the studied flours, the values were 1.08 to 1.23 J/g; the plain flour required more energy to complete its gelatinization process (Figure 2), which could be related to the higher amylose content compared to the new flour varieties studied, as described in Table 2. However, the GVF presented a lower enthalpy differential and peak temperature, which is associated with a faster conversion of the gels into their structure and lower energy expenditure. These results are consistent with the information presented in Table 3, and could be suitable for the formulation of higher-volume cakes [34]. In general, the local wheat varieties, by forming the gel at lower temperatures, may produce a less firm crumb if the process is not properly controlled. Furthermore, early gelatinization could limit the starch’s involvement in other thermal reactions, such as the Maillard reaction. However, this characteristic is suitable for products that require mild thermal treatments, as it allows for faster and more efficient cooking.

3.4. Structural Properties of Flour Particles

The structural micrographs of the flours (Figure 3) reveal morphological variations between the local wheat flours and the commercial flour. Figure 3A shows the SEM analysis at 1000× of the GVF. The microphotograph shows very small spherical granules in low quantities; on the other hand, a greater quantity of lenticular, ovoid, and amorphous granules can be seen. Agglomerations of particles are seen that may be associated with the hygroscopicity of the granules. Larger particles with fissures in their structure are also seen. This occurs in the milling, generating the rupture of the particles from larger to smaller size, leaving some larger granules with dents. Three different sizes and shapes of granules were observed: spherical-small, lenticular-medium, and large, which varied according to the maturity stage of the commercial wheat grain [53], being similar to our result for the local flour obtained from mature wheat grains. In Figure 3B, the AVF displays very small spherical granules, a greater presence of lenticular and amorphous granules, and the presence of agglomerations of granules is also observed. The larger granules show fissures due to their rupture during milling. It is noteworthy that, compared to the previous microphotograph, this flour presents more defined and less agglomerated granules. In Figure 3C, the EOVF presents small, lenticular, and amorphous granules. The smallest granules tend to be spherical, while the granules present in greater numbers are those with a lenticular shape. On the other hand, dents are clearly observed in the larger granules due to their milling. It is also important to note that the granules tend to agglomerate due to hygroscopicity. Compared to the previous ones, it presents a greater number of lenticular granules and granules with fissures. In Figure 3D, the PF micrograph is characterized by spherical and lenticular granules, greater agglomeration, and larger granules with fissures, which could indicate that the milling process needs to be improved and that they are more hygroscopic. These results are consistent with reports by Kim [10], who described the presence of lumps and fissured granules in wheat flour. This characteristic is associated with the hardness of the endosperm and the firm texture of the granules, factors that contribute to the heterogeneous formation of sizes and shapes in the flour. Microphotographs of the observed samples (GVF, EOVF, and AVF) revealed large, medium, and small trimodal morphologies or fragments, typical of some cereals, with a predominance of medium-sized lenticular granules, a characteristic attributable to the type of endosperm of durum wheat. This type of wheat generates a dough with high gluten resistance, due to a higher proportion of polymeric glutenins, β-sheets, and β-twists [42], in addition to presenting a higher affinity for water. Due to these properties, local wheat flours with these characteristics could have wide use in the production of fresh and sheet pasta, couscous, bulgur, and soft-textured baked goods [54]. On the other hand, the PF sample, due to its bimodal typology, is associated with long-fermented baked goods, as well as dough with extensible characteristics or with swelling capacity.

Surface Analysis of Flour by SEM-EDS

Chemical analysis of the wheat flour surfaces would allow us to identify and predict which of the studied varieties will contribute important nutritional elements to the diet [45,46].
Table 4 shows the surface elemental analysis of the wheat flour varieties, which allows for the identification of the predominant elements on the surface of the particles. This information is of great importance, since many physicochemical reactions, such as interactions with water or enzymes, occur on the surface, facilitating the establishment of links with the functional and nutritional properties of the product [55,56]. In this analysis, the samples evaluated presented a carbon content ranging from 47.9% to 54.6%, reflecting a relatively lower content in the EOVF compared to the PF. Although few studies have been conducted on the surface chemical composition of wheat flour. The relative contents of C, O, N, P, and S in eight wheat flour samples from China were 71.50–74.14%, 20.08–22.63%, 4.89–5.53%, 0.22–0.42%, and 0.29–0.37%, respectively [57]. However, the new varieties studied exceeded the values obtained by Czaja [58], who reported for wheat flours of fifteen cultivars from Poland that the contents of carbon, hydrogen, nitrogen, oxygen, and sulfur ranged between 40.9–42.6%, 6.0–7.2%, 1.9–3.0%, 47.8–50.2%, and 0.07–0.14% (w/w), respectively. The higher carbon content observed in the samples studied suggests a possible improvement in technological and functional properties, such as viscosity and texture-forming capacity, fundamental aspects of the quality of baked products. The hydrogen-bonded oxygen content ranged from 45.2% to 51.5%, being lower in the PF variety compared to the new wheat varieties. This difference suggests that the local flours have greater hydration capacity and better emulsion stability due to the greater presence of polar functional groups capable of interacting with water. In turn, the presence of carbon and oxygen is due to the fact that this cereal is rich in carbohydrates, and they are concentrated in the range of 50 to 70%, and within its structure, there is the presence of starch [19] in which energy is stored [59]. For this reason, there is a high presence of carbon and oxygen, with a greater presence of these elements in the surface analysis, which is consistent with the report by Golea [60], who deduced the vibration of the carbonyl group related to the presence of starch. The differences in the content of chemical elements on the surface can be attributed to varietal differences, environmental factors, and the growing and harvesting region [20].

3.5. Analysis of Functional Groups

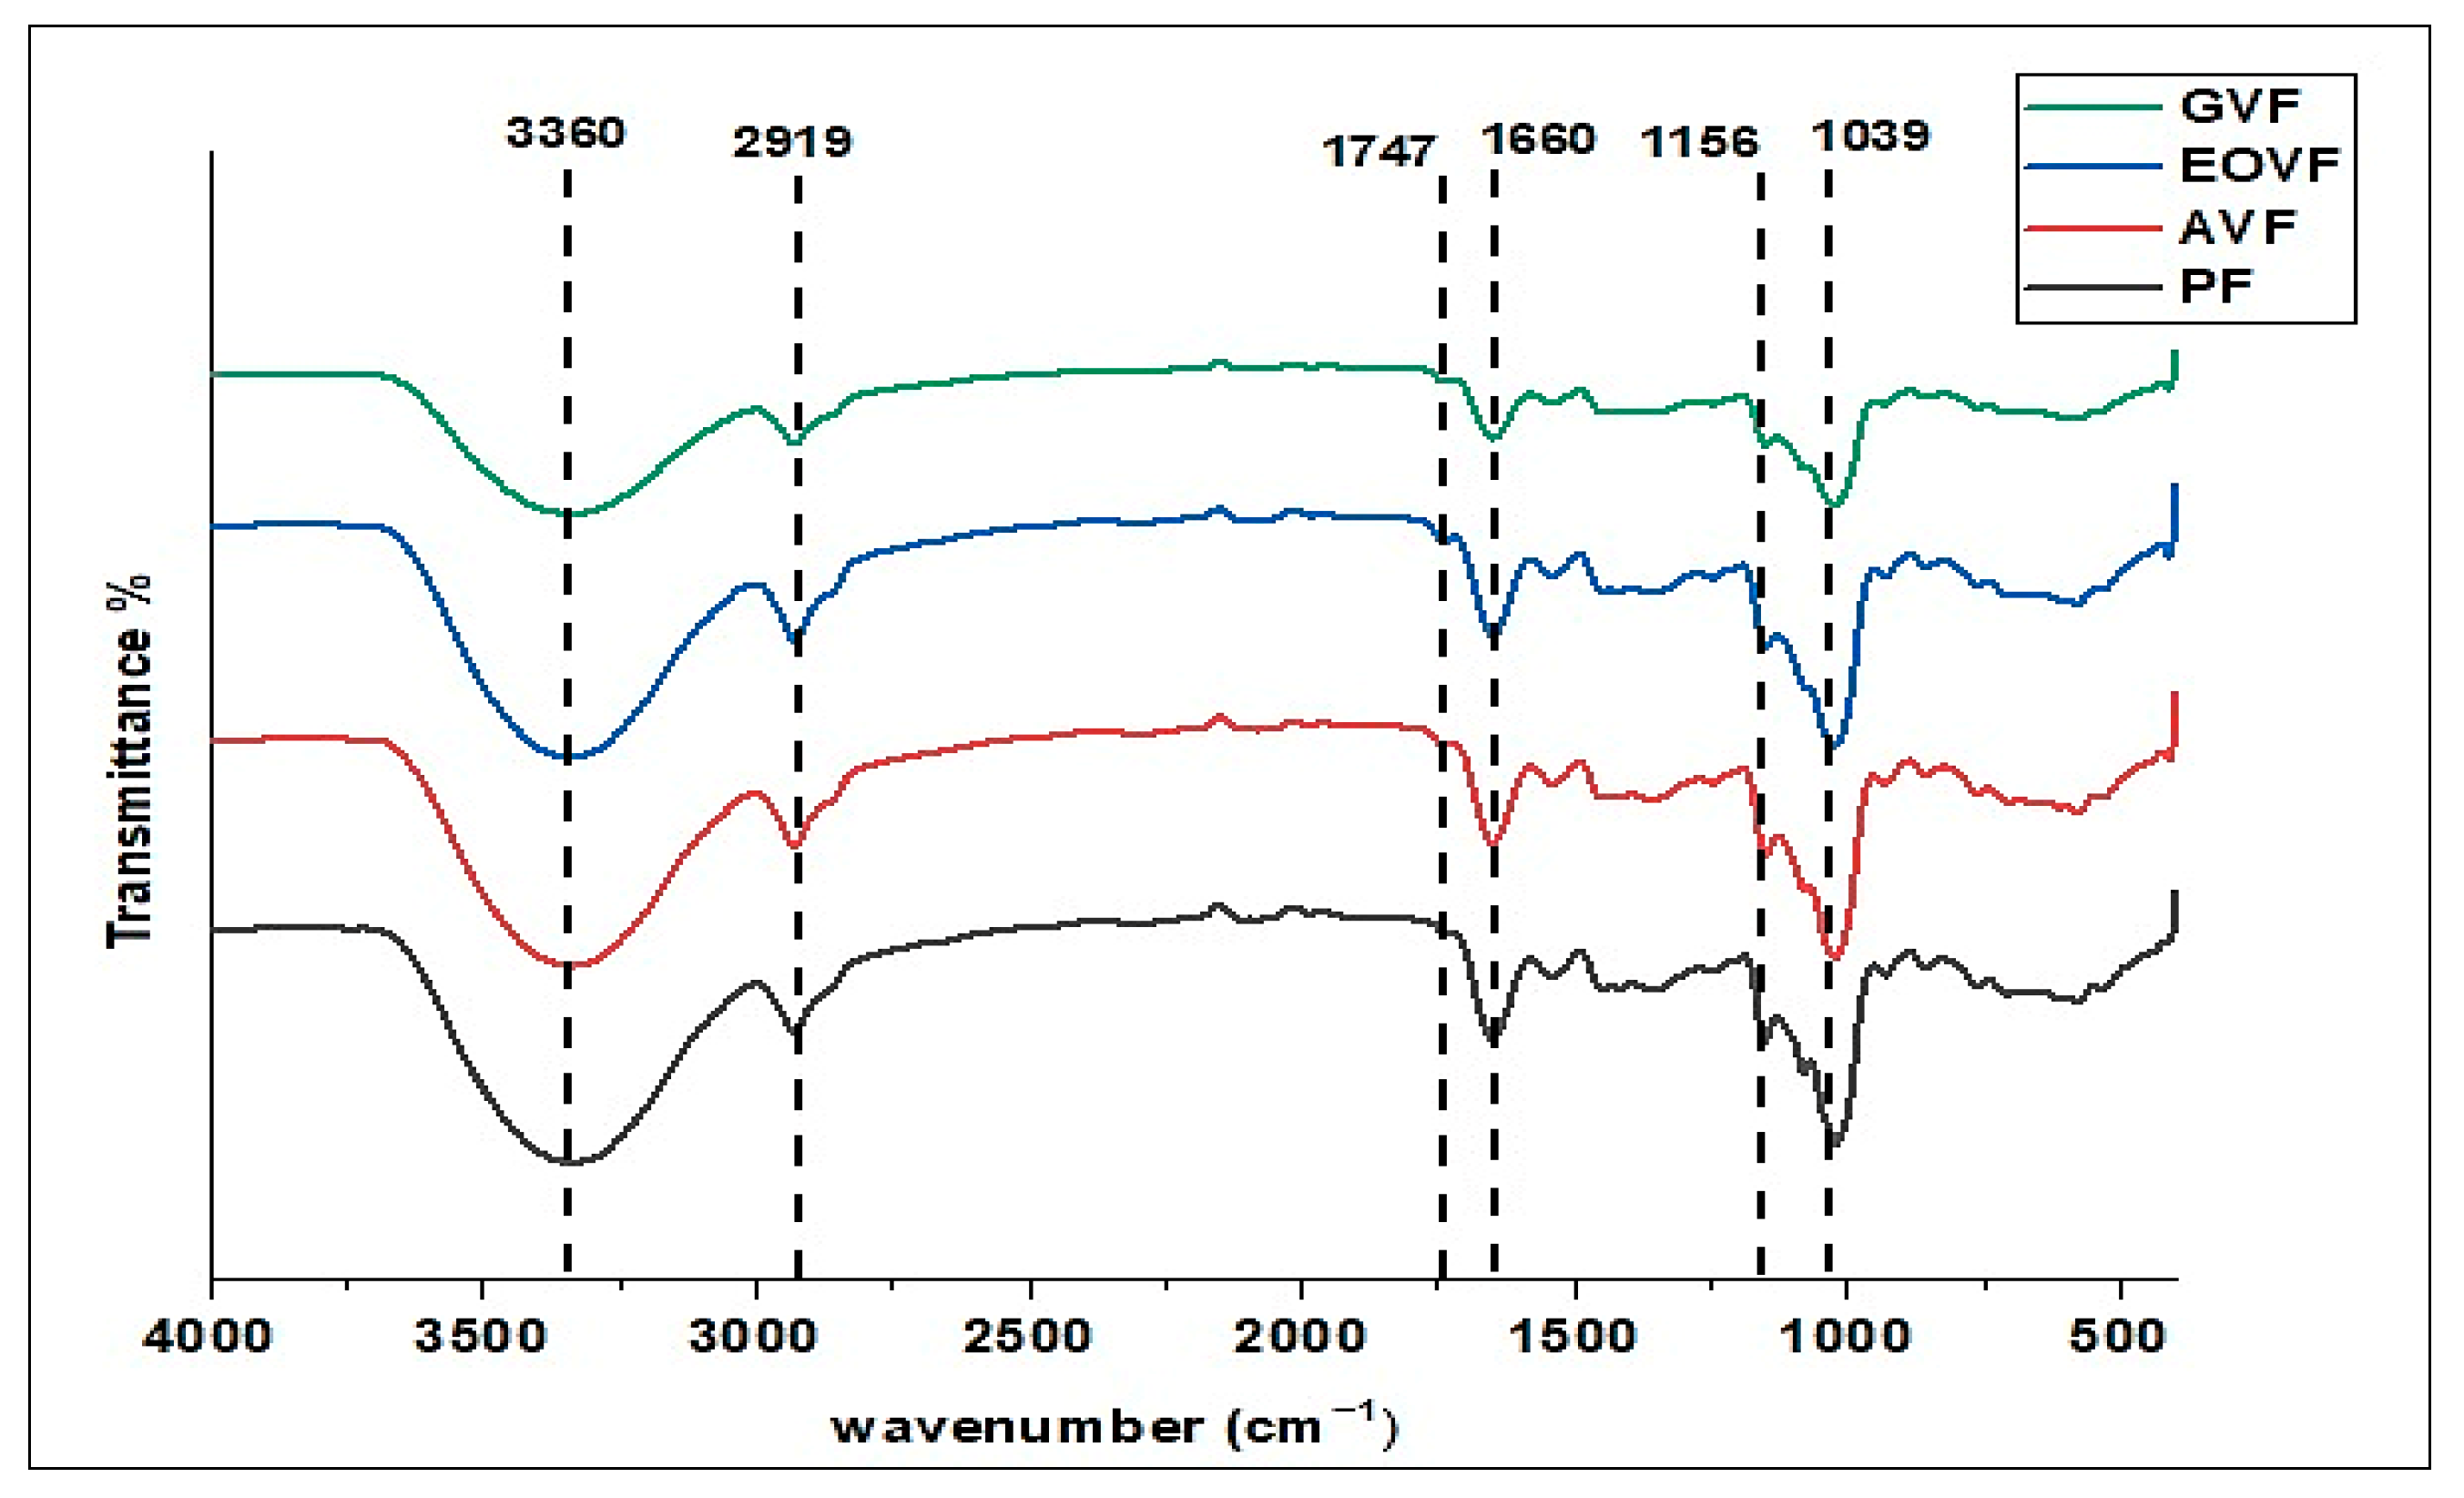
The ATR-FTIR spectra obtained for the PF, GVF, EOVF, and AVF flours revealed similar spectral profiles (Figure 4), with intense peaks in the range of 3360 to 1039 cm−1, suggesting a comparable chemical composition between the samples. The absence of significant differences in the infrared signals between the local flours and the PF indicates the presence of common functional groups, mainly associated with carbohydrates, water, lipids, and proteins. In particular, the band observed at 3360 cm−1 corresponds to stretching vibrations of the –OH group, associated with the presence of water and the soluble structure of carbohydrates [61], although its interpretation may be influenced by the spectral interference of the structure of alcohols, phenols, and hydroperoxides [60]. In the 2919 cm−1 region, this is attributed to the dominant vibration of the carbonyl group -CH-, which is related to the presence of starch (especially amylose and amylopectin) [61], as well as the presence of lipids in the 1772 cm−1 region [60]. These results are comparable with spelt variety wheat flour [27]. The 1660 cm−1 band length was characteristic of the C=O carboxylic group, which is associated with the presence of proteins [62], while the 1156 and 1039 cm−1 bands reflected the presence of primary and tertiary amines, sensitive to protein secondary structure [54,55]. These findings are consistent with those reported for spelt and buckwheat flours [20,26] and support previously obtained proximate composition data (Table 1), reinforcing the nutritional importance of local flours as potential ingredients in agri-food products.

3.6. Pearson Correlation

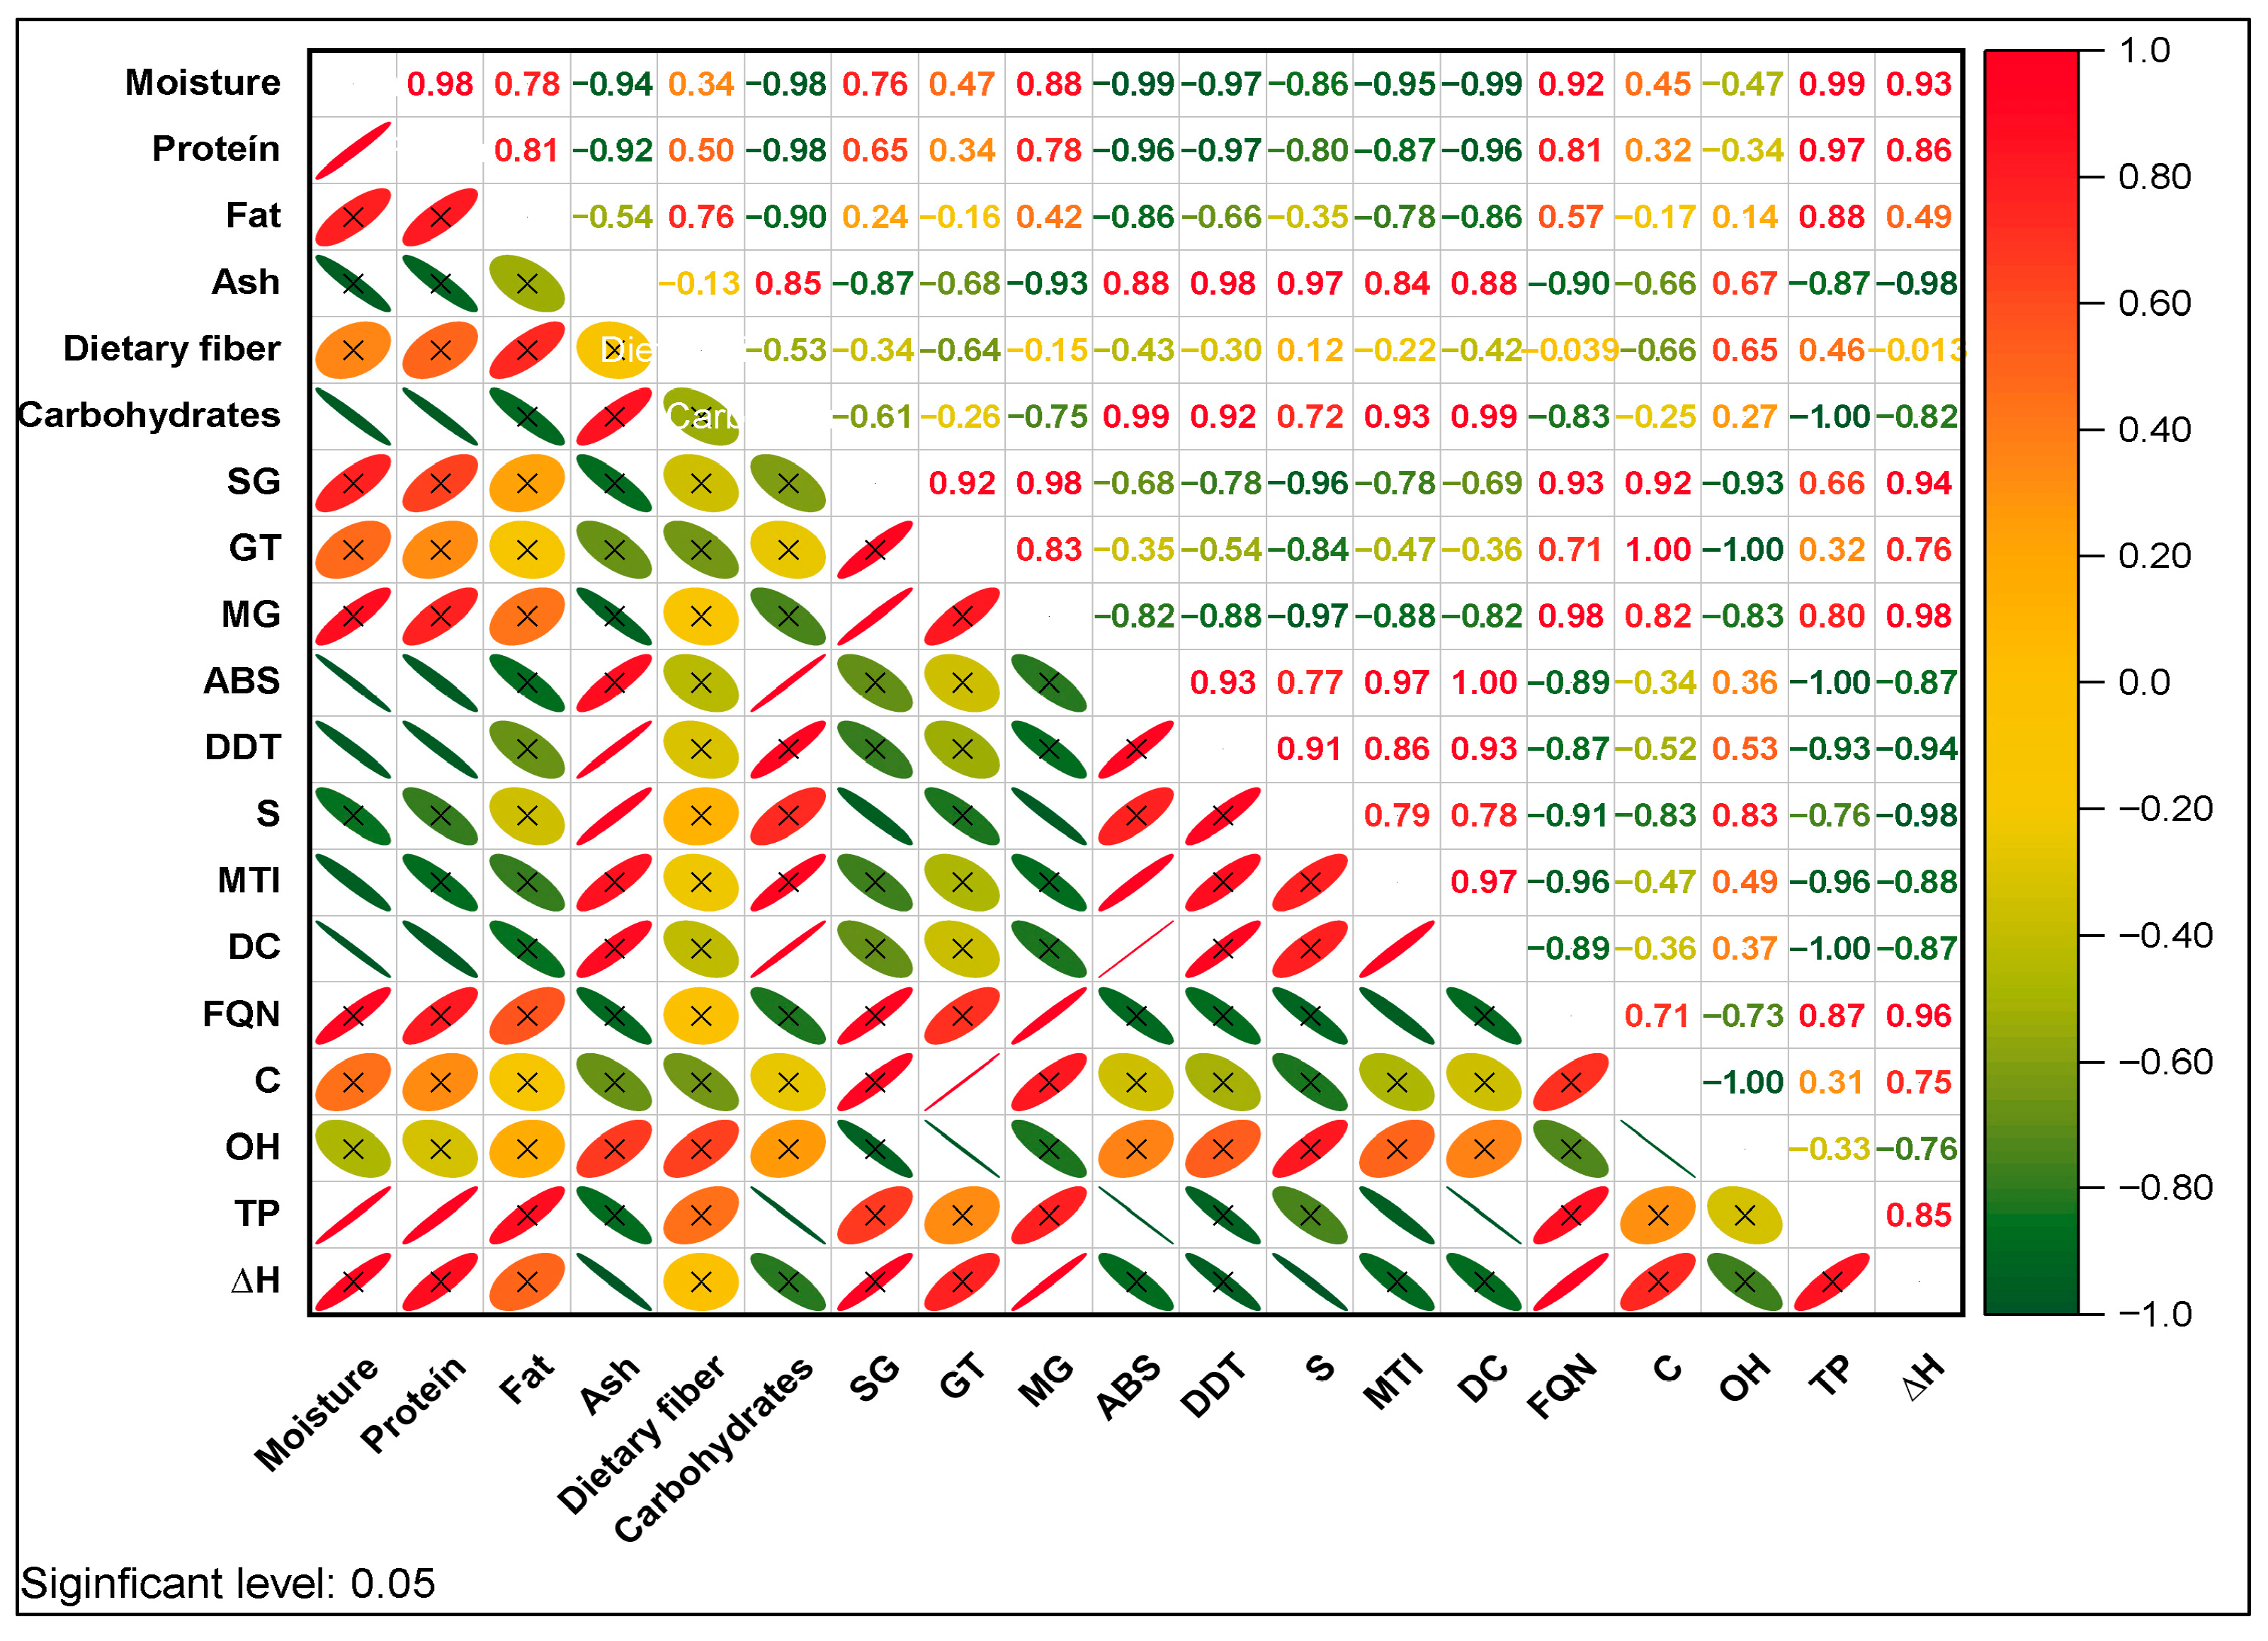
Pearson’s correlation analysis (Figure 5) showed relationships between the technological quality properties of the flours from the different wheat varieties. Variables, such as carbohydrates and ash, with the values of consistency-corrected water absorption (ABS), dough development time (DDT), stability (S), mixing tolerance index (MTI), and dough consistency (DC) showed a significant positive limitation, reflecting the importance of starch on farinographic properties (good dough behavior), useful for specific products (bread, biscuits, and pasta) [63,64]. In contrast, protein and moisture showed negative correlations with farinographic properties, suggesting that the functional activity of glutenins and/or gliadins might be deficient and that the pentosan content is possibly low [65] or possibly damaging to the protein structure due to the grinding effect [5].
A positive correlation was also observed between protein content and amylographic properties, specifically at the start of gelatinization (SG), peak temperature (PT), gelatinization temperature (GT), and maximum gelatinization (MG). A moderate correlation was also identified with lipid content. These correlations suggest that both proteins and lipids influence the thermal behavior of starch during gelatinization [19,40]. The presence of proteins can form a physical barrier around starch granules, limiting water absorption, and raising the temperatures necessary for gelatinization [19]. Lipids can form complexes with amylose, stabilizing the granule structure and also contributing to the increase in these temperatures [66,67].
The elemental composition of the C and OH functional groups showed positive and negative correlations, respectively, with the enthalpy of gelatinization (∆H) and other related parameters. These correlations could be associated with the structural characteristics of the compounds: a higher carbon content is related to denser and less polar structures, and a higher thermal resistance, which increases the ∆H. Conversely, a higher content in the hydroxyl (OH) groups, due to their high affinity for water, facilitates the gelatinization process, resulting in a lower ∆H.

3.7. Principal Component Analysis

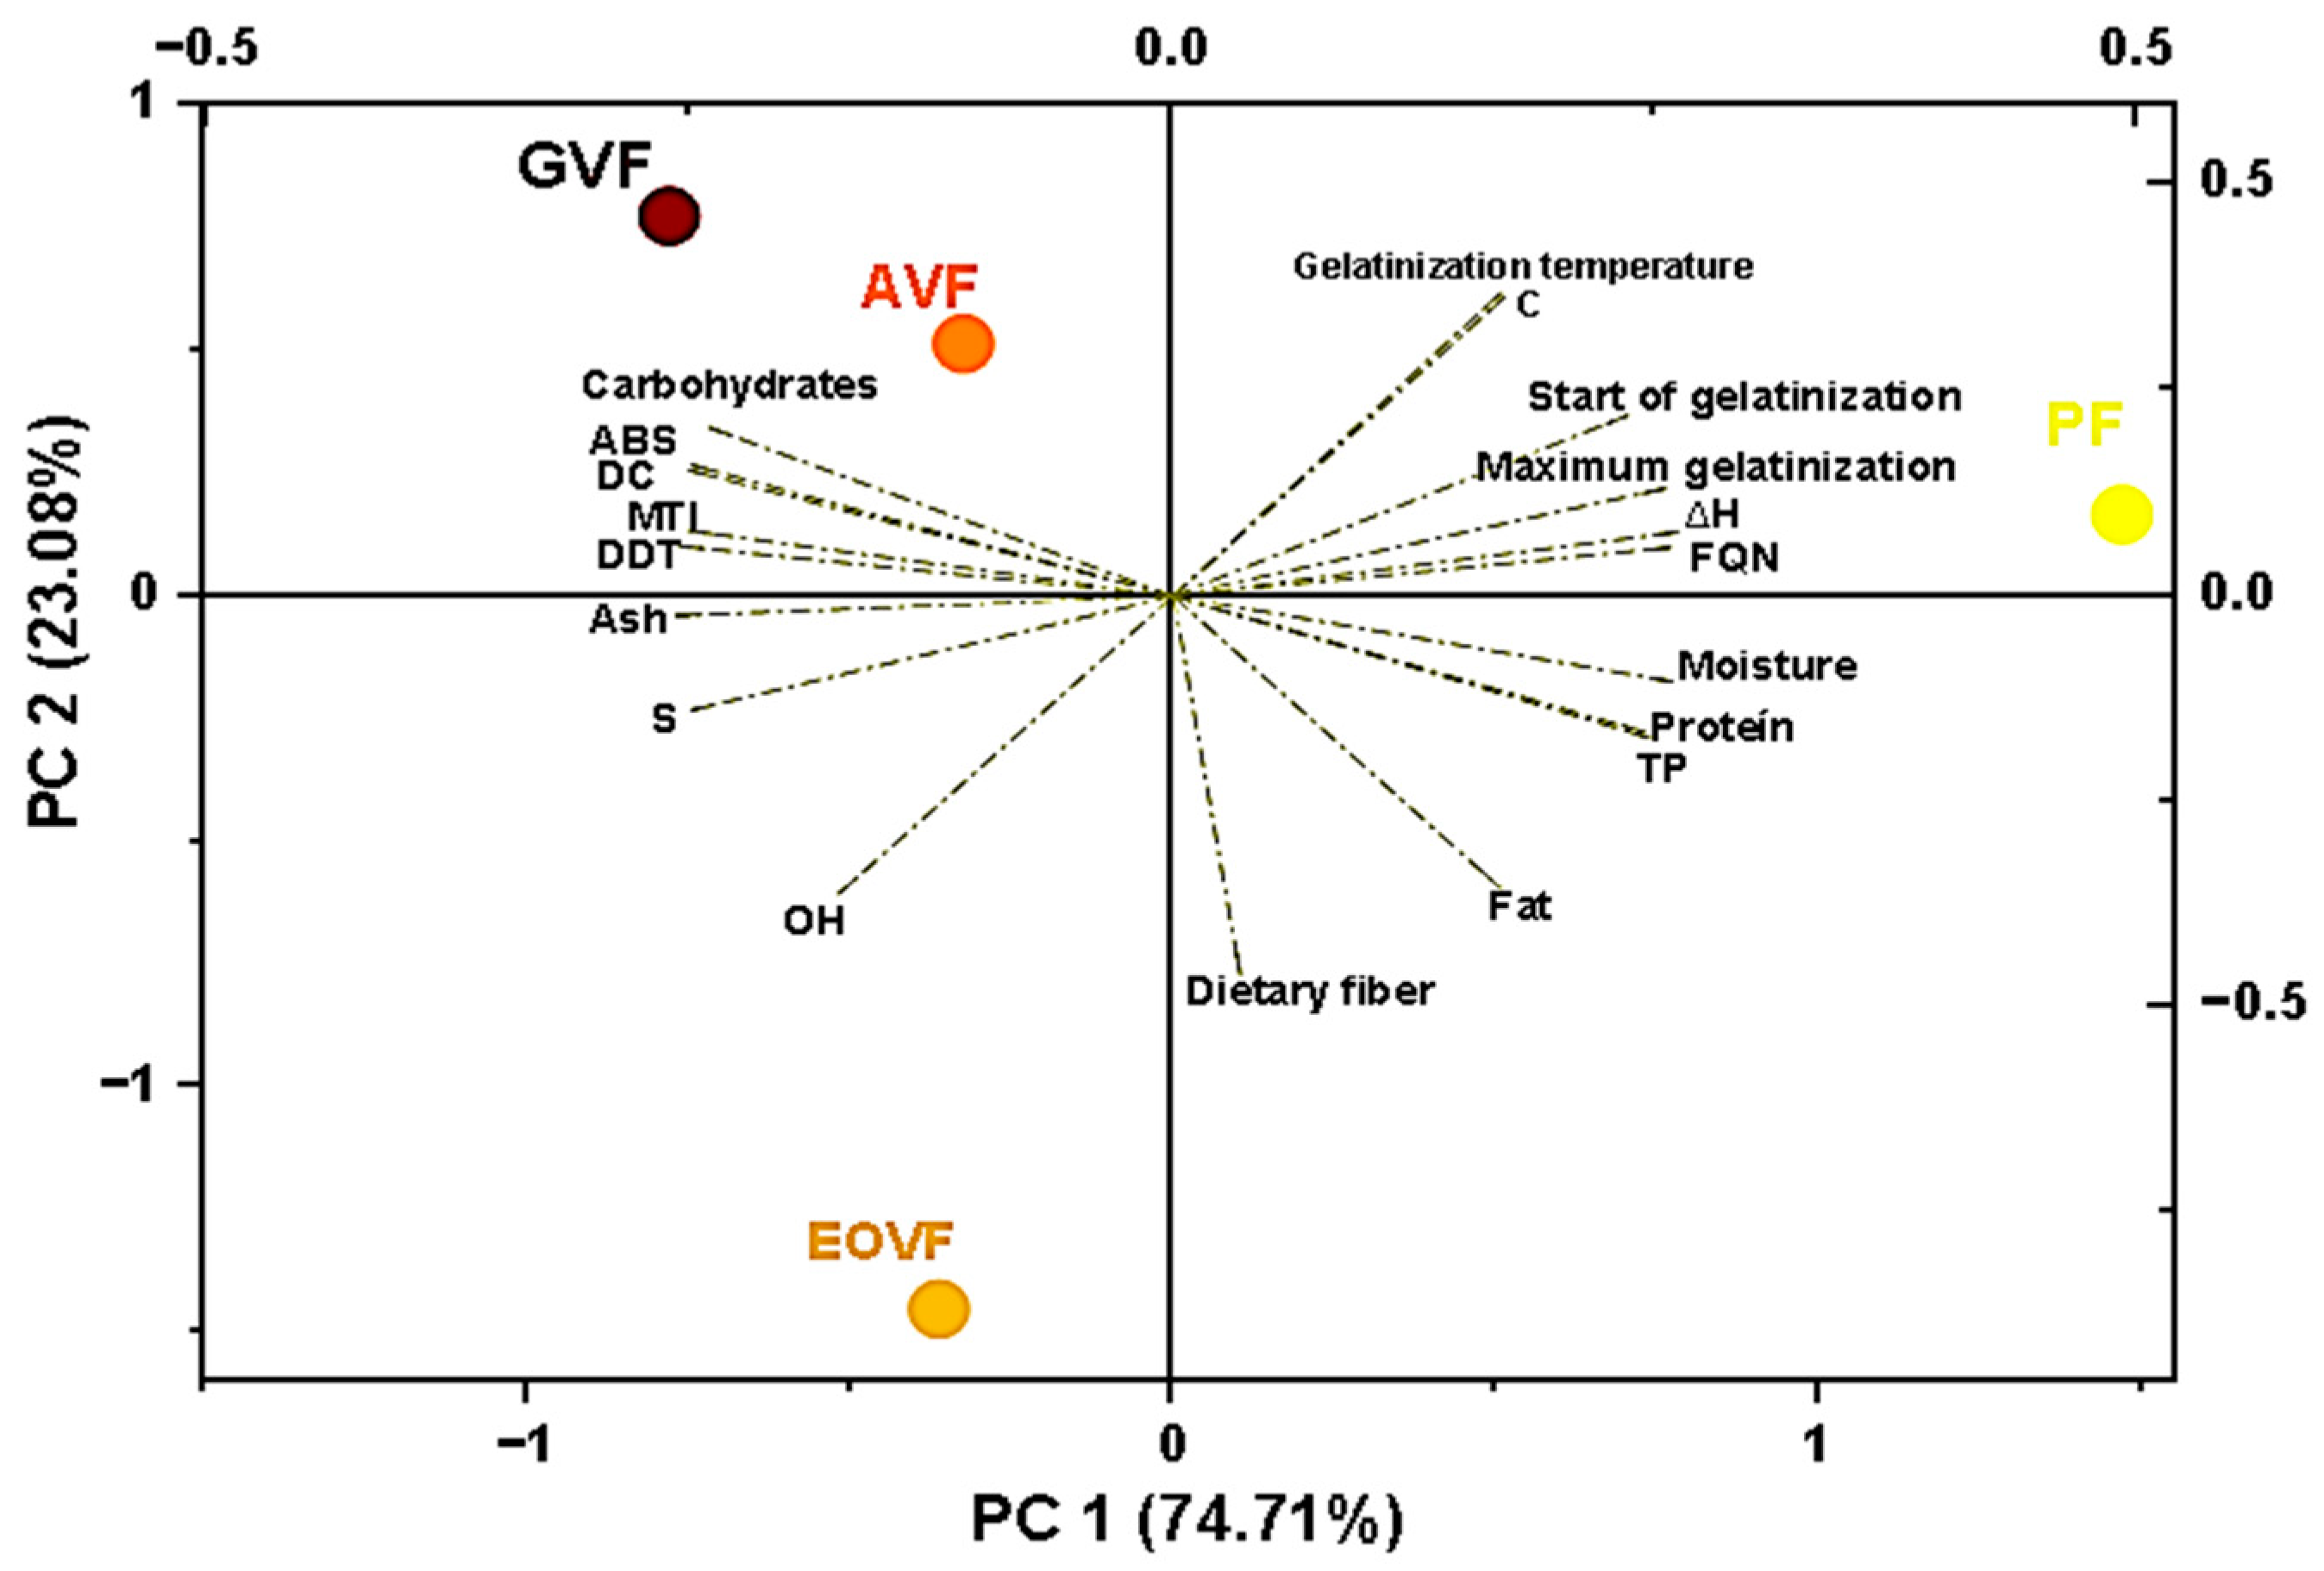
Principal component analysis (PCA), represented in Figure 6, provided a comprehensive view of the technological properties of the local wheat flours. The first principal component (PCA1), which explains 74.71% of the total variance, primarily distinguished flours based on their thermal, amylographic, and dough strength properties. The variables most positively associated with this component were the start, maximum, and final gelatinization temperatures (To, Tp, and Tc), enthalpy change (∆H), and farinograph quality number (FQN). The PF sample was located at the positive end of this axis, indicating that it has a more ordered and thermally stable starch structure, requiring more energy for granule rupture, reflected in a higher ∆H. This behavior suggests a high-quality baking flour with excellent ability to form elastic and resistant doughs [44,68]. On the other hand, the GVF and AVF samples were at the negative end, along with variables such as total carbohydrates, corrected water absorption (ABS), development time (DDT), mixing tolerance index (MTI), and dough consistency (DC). This suggests that these flours have good hydration capacity and useful rheological properties, but with a less stable starch structural network and lower gelatinization energy, which could negatively influence the final quality of baked goods [69]. At this same negative end, the EOVF sample is associated with higher ash values and the presence of OH functional groups, which reflects a more integral and polar profile, probably with greater interaction with water and less molecular order, which translates into a lower ∆H and, therefore, lower thermal resistance [50,70].
The PCA2, which explained 23.08% of the variance, allowed samples to be differentiated according to their proximate values of protein, fiber, lipids, and moisture, and the content of OH in the functional groups, as well as dough stability (S). At the negative end of the PCA2 (lower quadrants), the proximate composition variables were located, which, while not directly related to baking performance, influence the nutritional and technological quality of the flours. These variables, which were grouped in the lower right quadrant, were not associated with any specific sample, suggesting that none of the evaluated flours simultaneously combine a high nutritional profile with outstanding thermal behavior. Previous studies have indicated that an excess of lipids and proteins can form complexes with starch, raising the gelatinization temperature, but also interfering with dough extensibility [21,71]. In the lower left quadrant, the EOVF sample showed a greater association with the ash and OH groups, which coincides with greater polarity, the possible presence of insoluble fiber, and a tendency to require less energy for gelatinization.
This analysis reveals that the PF sample maintains overall technological superiority, linked to its thermal and structural behavior. The GVF and AVF varieties have good rheological properties but lower thermal stability, and the EOVF variety displayed characteristics more associated with whole-grain or functional flours, given its nutritional profile. Thus, PCA demonstrates how the interaction between molecular structure (OH and C), thermal composition, and nutritional functionality directly influences the technological quality of wheat flours. This approach demonstrates that the interaction between nutritional composition, thermal properties, and molecular structure is key to defining the technological quality of flours.

4. Conclusions

Wheat flours of the Gavilón, Andino, and Espigón de Oro varieties, grown in the province of Andahuaylas, presented distinct technological properties compared to common flour. The local wheat varieties stood out for their higher carbohydrate content, better water absorption, and a more defined granular structure observed through SEM, which reflects reduced gluten quality, associated with lower extensibility and elasticity compared to the typical gluten found in bread flours (common wheat flour). Additionally, they exhibited relatively low gelatinization profiles, lower mixing resistance, and thermal behavior similar to that of durum wheat flour.
The technological properties of the new local wheat varieties (EOVF, GVF, and AVF) suggest their suitability for industrial products with a soft texture or low extensibility, in which Maillard reactions or prolonged fermentation processes are not required. The incorporation of these varieties into the production chain not only represents a viable technological alternative but also contributes to the achievement of the Sustainable Development Goals (SDGs), such as alleviating hunger with local products (SDG 2), by diversifying wheat sources adapted to local conditions (SDG 9), and by encouraging the development of new agro-industrial products with more resilient local genetic resources (SDGs 12 and 13)

Author Contributions

Conceptualization, F.T.-P. and M.E.O.-Y.; data curation, F.T.-P. and F.T.-H.; formal analysis, M.E.O.-Y. and F.T.-H.; funding acquisition, F.T.-P.; investigation, H.A.-P., B.N.-E. and I.R.-Q.; methodology, H.A.-P. and F.T.-H.; project administration, F.T.-P.; supervision, F.T.-H.; validation, F.T.-P.; writing—original draft, H.A.-P. and B.N.-E.; writing—review and editing, F.T.-P. and M.E.O.-Y. All authors have read and agreed to the published version of the manuscript.

Funding

This research was funded by the Universidad Nacional Jose Maria Arguedas, Peru, under contract No. 456-2022-CO-UNAJMA, within the framework of the call for research projects in the teaching category.

Data Availability Statement

The data are available in this article, and further inquiries can be directed to the corresponding authors.

Acknowledgments

The authors express their gratitude to the Agroindustrial Research Laboratory of the Universidad Nacional José María Arguedas.

Conflicts of Interest

The authors declare no conflicts of interest.

Abbreviations

The following abbreviations are used in this manuscript:
ATRAttenuated Total Reflectance
AVFAndino Variety flour
DSCDifferential Scanning Calorimetry
EDSEnergy Dispersive X-ray Spectroscopy
EOVFEspigon de Oro variety flour
FTIRFourier transform infrared spectroscopy
GVFGavilon variety flour
PFPlain flour
TGAThermogravimetric Analysis
SEMScanning Electron Microscopy

References

  1. Borghi, E.; Domínguez, G.G.; Humphreys, A. The State of Food Security and Nutrition in the World 2022; FAO: Rome, Italy, 2022. [Google Scholar] [CrossRef]
  2. Guo, X.; Zhang, P.; Yue, Y. Prediction of global wheat cultivation distribution under climate change and socioeconomic development. Sci. Total Environ. 2024, 919, 170481. [Google Scholar] [CrossRef]
  3. McCloud, N. What has inflation targeting done for household consumption? Int. Rev. Financ. Anal. 2024, 95, 103499. [Google Scholar] [CrossRef]
  4. Gracia, B. Diseño de Harinas a Partir de Variedades de Trigo (Triticum aestivum), Para la Industria Panificadora, Zaragoza, España. 2015. Available online: https://zaguan.unizar.es/record/31749?ln=eshttps://zaguan.gpt.c (accessed on 20 August 2025).
  5. Marti, A.; Ulrici, A.; Foca, G.; Quaglia, L.; Pagani, M.A. Characterization of common wheat flours (Triticum aestivum L.) through multivariate analysis of conventional rheological parameters and gluten peak test indices. LWT-Food Sci. Technol. 2015, 64, 95–103. [Google Scholar] [CrossRef]
  6. De la Horra, A.E.; Seghezzo, M.L.; Molfese, E.; Ribotta, P.D.; León, A.E. Indicadores de calidad de las harinas de trigo: Índice de calidad industrial y su relación con ensayos predictivos. Agriscientia 2012, 29, 81–89. [Google Scholar] [CrossRef]
  7. Cuniberti, M.B.; Menella, D. Requerimientos Industriales de Trigo en la Argentina. IDIA 2004, 21, 16–20. [Google Scholar]
  8. Zhou, S.; Reddy, C.K.; Du, B.; Xu, B. Pasting, thermal, and functional properties of wheat flour and rice flour formulated with chestnut flour. Bioact. Carbohydrates Diet. Fibre 2021, 26, 100290. [Google Scholar] [CrossRef]
  9. Shewry, P.R.; Halford, N.G.; Belton, P.S.; Tatham, A.S. The structure and properties of gluten: An elastic protein from wheat grain. Philos. Trans. R. Soc. B Biol. Sci. 2002, 357, 133–142. [Google Scholar] [CrossRef] [PubMed]
  10. Kim, K.-H.; Kim, J.-Y. Understanding Wheat Starch Metabolism in Properties, Environmental Stress Condition, and Molecular Approaches for Value-Added Utilization. Plants 2021, 10, 2282. [Google Scholar] [CrossRef]
  11. Chan, H.-W.; Pong, V.; Tam, K.-P. Cross-National Variation of Gender Differences in Environmental Concern: Testing the Sociocultural Hindrance Hypothesis. Environ. Behav. 2017, 51, 81–108. [Google Scholar] [CrossRef]
  12. AOAC. Solids (Total) and Moisture in Flour, Method 925.10. In Official Methods of Analysis, 18th ed.; AOAC International: Rockville, MD, USA, 2005; p. 800. [Google Scholar]
  13. AOAC. Official Methods of Analysis, 22nd Edition 2023; Association of Official Analytical Chemists AOAC: Washington, DC, USA, 1990. [Google Scholar]
  14. McCleary, B.V. Measurement of Dietary Fiber: Which AOAC Official Method of AnalysisSM to Use. J. AOAC Int. 2023, 106, 917–930. [Google Scholar] [CrossRef]
  15. AOAC. Official Method 942.05/90 Ash of Animal Feed. Official methods of analysis of the Association of Official Analytical Chemists. Assoc. Off. Anal. Chem. 1990, 857, 2000. [Google Scholar]
  16. Owheruo, J.O.; Edo, G.I.; Makia, R.S.; Gaaz, T.S.; Okolie, M.C.; Nwaogu, M.U.; Faturoti, A.O.; Akpoghelie, P.O.; Yousif, E.; Isoje, E.F.; et al. Nutritional qualities of cookies made from wheat/cashew nut composite flour. Food Humanit. 2024, 3, 100452. [Google Scholar] [CrossRef]
  17. AACC, American Association of Cereal Chemestry. (Ed.) St Paul, MN, USA, 2000; p. 4000. Available online: https://www.cerealsgrains.org/resources/Methods/tools/Pages/ArchivedMethods.aspx (accessed on 20 August 2025).
  18. Jhan, F.; Shah, A.; Gani, A.; Ahmad, M.; Noor, N. Nano-reduction of starch from underutilised millets: Effect on structural, thermal, morphological and nutraceutical properties. Int. J. Biol. Macromol. 2020, 159, 1113–1121. [Google Scholar] [CrossRef]
  19. Zhao, H.; Zhang, H.; Xu, Q.; Zhang, H.; Yang, Y.Y. Thermal, Rheological, Structural and Adhesive Properties of Wheat Starch Gels with Different Potassium Alum Contents. Molecules 2023, 28, 6670. [Google Scholar] [CrossRef]
  20. Mir, S.A.; Farooq, M.; Naseem, Z.; Mugabi, R. Techno-functional, nutritional, antioxidant and prebiotic potential of underutilized buck wheat flour from Western Himalayas of Jammu and Kashmir. Appl. Food Res. 2025, 5, 100723. [Google Scholar] [CrossRef]
  21. Tharise, N.; Julianti, E.; Nurminah, M. Evaluation of physico-chemical and functional properties of composite flour from cassava, rice, potato, soybean and xanthan gum as alternative of wheat flour. Int. Food Res. J. 2014, 21, 1641–1649. [Google Scholar]
  22. Jahn, N.; Konradl, U.; Fleissner, K.; Geisslitz, S.; Scherf, K.A. Protein composition and bread volume of German common wheat landraces grown under organic conditions. Curr. Res. Food Sci. 2024, 9, 100871. [Google Scholar] [CrossRef] [PubMed]
  23. Siddiqi, R.A.; Singh, T.P.; Rani, M.; Sogi, D.S.; Bhat, M.A. Diversity in Grain, Flour, Amino Acid Composition, Protein Profiling, and Proportion of Total Flour Proteins of Different Wheat Cultivars of North India. Front. Nutr. 2020, 7, 141. [Google Scholar] [CrossRef]
  24. Skendi, A.; Papageorgiou, M.; Varzakas, T. High protein substitutes for gluten in gluten-free bread. Foods 2021, 10, 1997. [Google Scholar] [CrossRef]
  25. Al-Marazeeq, K.; Saleh, M.; Angor, M.; Lee, Y. Cookie dough functional properties of partially replaced all-purpose wheat flour with powdered fruit skins and the hedonic perception of the resulting cookies. Front. Sustain. Food Syst. 2024, 8, 1445206. [Google Scholar] [CrossRef]
  26. Montiel, N.I.A.; Lira, B.M.R.; Ortega, J.A.A.; Moreno, E.R. Alternativas nutricionales y beneficios a la salud: Harinas de trigo (Triticum) y avena (Avena sativa L.) en contraste con polvos de chapulín (Sphenarium purpurascens) y huitlacoche (Ustilago maydis) Nutritional alternatives and health benefits. South Fla. J. Dev. 2024, 5, e4825. [Google Scholar] [CrossRef]
  27. Sujka, K.; Koczoń, P.; Ceglińska, A.; Reder, M.; Ciemniewska-Żytkiewicz, H. The Application of FT-IR Spectroscopy for Quality Control of Flours Obtained from Polish Producers. J. Anal. Methods Chem. 2017, 2017, 4315678. [Google Scholar] [CrossRef]
  28. Tripathi, A.; Iswarya, V.; Singh, N.; Rawson, A. Chapter 4—Chemistry of pulses—Micronutrients. In Pulse Foods, 2nd ed.; Tiwari, B.K., Gowen, A., McKenna, B., Eds.; Academic Press: Cambridge, MA, USA, 2021; pp. 61–86. [Google Scholar]
  29. Tsegay, N.; Admassu, H.; Zegale, B.; Gosu, A. Nutritional and functional potentials of wheat, cowpea, and yam composite flours on bread formulations: Effect of blending ratio and baking parameters. J. Agric. Food Res. 2024, 18, 101294. [Google Scholar] [CrossRef]
  30. Stellingwerff, T.; Cox, G.R. Systematic review: Carbohydrate supplementation on exercise performance or capacity of varying durations. Appl. Physiol. Nutr. Metab. 2014, 39, 998–1011. [Google Scholar] [CrossRef] [PubMed]
  31. Wang, Y.; Ou, X.; Al-Maqtari, Q.A.; He, H.-J.; Othman, N. Evaluation of amylose content: Structural and functional properties, analytical techniques, and future prospects. Food Chem. X 2024, 24, 101830. [Google Scholar] [CrossRef]
  32. Delcour, J.A.; Bruneel, C.; Derde, L.J.; Gomand, S.V.; Pareyt, B.; Putseys, J.A.; Wilderjans, E.; Lamberts, L. Fate of starch in food processing: From raw materials to final food products. Annu. Rev. Food Sci. Technol. 2010, 1, 87–111. [Google Scholar] [CrossRef]
  33. Wang, K.; Li, M.; Wang, Y.; Liu, Z.; Ni, Y. Effects of extraction methods on the structural characteristics and functional properties of dietary fiber extracted from kiwifruit (Actinidia deliciosa). Food Hydrocoll. 2021, 110, 106162. [Google Scholar] [CrossRef]
  34. Cui, C.; Caporaso, N.; Chen, J.; Fearn, T. Farinograph characteristics of wheat flour predicted by near infrared spectroscopy with an ensemble modelling method. J. Food Eng. 2023, 359, 111689. [Google Scholar] [CrossRef]
  35. Cairano, M.D.; Condelli, N.; Caruso, M.C.; Marti, A.; Cela, N.; Galgano, F. Functional properties and predicted glycemic index of gluten free cereal, pseudocereal and legume flours. LWT 2020, 133, 109860. [Google Scholar] [CrossRef]
  36. Wrigley, C.W.; Tömösközi, S.; Békés, F.; Bason, M. The Farinograph: Its origins. In The Farinograph Handbook; Advances in Technology, Science, and Applications; Woodhead Publishing: Cambridge, UK, 2022; pp. 3–21. [Google Scholar] [CrossRef]
  37. Sarker, Z.I.; Yamauchi, H.; Kim, S.-J.; Matsumura-Endo, C.; Takigawa, S.; Hashimoto, N.; Noda, T. A farinograph study on dough characteristics of mixtures of wheat flour and potato starches from different cultivars. Food Sci. Technol. Res. 2008, 14, 211–216. [Google Scholar] [CrossRef]
  38. Wrigley, C.W.; Corke, H.; Seetharaman, K.; Faubion, J. Encyclopedia of Food Grains. 2015. Available online: https://books.google.com/books?hl=es&lr=&id=ce7tBgAAQBAJ&oi=fnd&pg=PP1&ots=Lk-gbvyFW6&sig=nOW5InoTFtBNUdApDWrDBsHAvu8 (accessed on 20 August 2025).
  39. Aydogan, S.; Sahin, M.; Akcacik, A.G.; Hamzaoglu, S.; Taner, S. Relationships between Farinograph Parameters and Bread Volume, Physicochemical Traits in Bread Wheat Flours. Bahri Dağdaş Bitkisel Araştırma Derg. J. Bahri Dagdas Crop Res. 2015, 3, 2148–3205. Available online: https://api.semanticscholar.org/CorpusID:237158064 (accessed on 20 August 2025).
  40. Zhang, H.; Zhang, W.; Xu, C.; Zhou, X. Studies on the rheological and gelatinization characteristics of waxy wheat flour. Int. J. Biol. Macromol. 2014, 64, 123–129. [Google Scholar] [CrossRef]
  41. Deng, L.; Hou, G. Farinograph Applications for Whole Wheat Flour: Exploring the Influence of Circulating Water Temperature and Mixing Speed on Dough Mixing Properties in the Farinograph, 4th ed.; Elsevier Inc.: Amsterdam, The Netherlands, 2022. [Google Scholar]
  42. Shevkani, K.; Katyal, M.; Singh, N. A comparative review of protein and starch characteristics and end-use quality of soft and hard wheat. Food Chem. Adv. 2024, 4, 100613. [Google Scholar] [CrossRef]
  43. Ktenioudaki, A.; Crofton, E.; Scannell, A.G.; Hannon, J.A.; Kilcawley, K.N.; Gallagher, E. Sensory properties and aromatic composition of baked snacks containing brewer’s spent grain. J. Cereal Sci. 2013, 57, 384–390. [Google Scholar] [CrossRef]
  44. Hruskova, I.S.M. Characteristics of Bread and Biscuit Made With Wheat and Rice Flour Composites. J. Food Technol. Res. 2014, 1, 156–163. [Google Scholar] [CrossRef]
  45. Badjona, A.; Bradshaw, R.; Millman, C.; Howarth, M.; Dubey, B. Structural, thermal, and physicochemical properties of ultrasound-assisted extraction of faba bean protein isolate (FPI). J. Food Eng. 2024, 377, 112082. [Google Scholar] [CrossRef]
  46. Ballesteros-Vivasaa, D.; Ibáñezbb, E.; Cifuentesbb, A.; Parada-Alfonsoa, F. Aprovechamiento de Subproductos Agroalimentarios y de Biomasas no Convencionales en América Latina; Centro de Formación de la Cooperación Española: La Antigua, Spain, 2020. [Google Scholar]
  47. Dominici, F.; Luzi, F.; Benincasa, P.; Torre, L.; Puglia, D. Biocomposites based on plasticized wheat Flours: Effect of bran content on thermomechanical behavior. Polymers 2020, 12, 2248. [Google Scholar] [CrossRef]
  48. van Rooyen, J.; Simsek, S.; Oyeyinka, S.A.; Manley, M. Holistic View of Starch Chemistry, Structure and Functionality in Dry Heat-Treated Whole Wheat Kernels and Flour. Foods 2022, 11, 207. [Google Scholar] [CrossRef] [PubMed]
  49. Osorio-Ruiz, A.; Avena-Bustillos, R.J.; Chiou, B.-S.; Rodríguez-González, F.; Martinez-Ayala, A.-L. Mechanical and Thermal Behavior of Canola Protein Isolate Films As Improved by Cellulose Nanocrystals. ACS Omega 2019, 4, 19172–19176. [Google Scholar] [CrossRef]
  50. Carvajal, E.Á.; Castaño, V.D.Q.; Aguirre, J.C.L. Determinación de las propiedades térmicas y composicionales de la harina y almidón de chachafruto (erytina edulis triana ex micheli). Temas Agrar. 2013, 18, 21–35. [Google Scholar] [CrossRef]
  51. Badjona, A.; Bradshaw, R.; Millman, C.; Howarth, M. Faba Bean Processing: Thermal and Non-Thermal Processing on Chemical, Antinutritional Factors, and Pharmacological Properties. Molecules 2023, 28, 5431. [Google Scholar] [CrossRef]
  52. Saho, V.T.N.; Njintang, Y.N. Morphological, textural analysis and freeze-thaw stability of starches from legume grow in Cameroon. Braz. J. Biol. 2024, 84, e269844. [Google Scholar] [CrossRef] [PubMed]
  53. Ranathunga, R.A.A.; Suwannaporn, P. Young cereal grains as a new source of healthy and hypoallergenic foods: A review. J. Food Sci. Technol. 2022, 59, 3336–3348. [Google Scholar] [CrossRef] [PubMed]
  54. Sissons, M. Durum Wheat Products—Recent Advances; MDPI AG: Basel, Switzerland, 2024; pp. 11–13. [Google Scholar] [CrossRef]
  55. Lappi, J.; Selinheimo, E.; Schwab, U.; Katina, K.; Lehtinen, P.; Mykkänen, H.; Kolehmainen, M.; Poutanen, K. Sourdough fermentation of wholemeal wheat bread increases solubility of arabinoxylan and protein and decreases postprandial glucose and insulin responses. J. Cereal Sci. 2010, 51, 152–158. [Google Scholar] [CrossRef]
  56. Fernández-Canto, M.N.; García-Gómez, M.B.; Boado-Crego, S.; Vázquez-Odériz, M.L.; Muñoz-Ferreiro, M.N.; Lombardero-Fernández, M.; Pereira-Lorenzo, S.; Romero-Rodríguez, M.Á. Element Content in Different Wheat Flours and Bread Varieties. Foods 2022, 11, 3176. [Google Scholar] [CrossRef]
  57. Lin, J.; Gu, Y.; Bian, K. Bulk and Surface Chemical Composition of Wheat Flour Particles of Different Sizes. J. Chem. 2019, 2019, 5101684. [Google Scholar] [CrossRef]
  58. Czaja, T.; Sobota, A.; Szotak, R. Quantification of Ash and Moisture in Wheat Flour by. Foods 2020, 9, 280. [Google Scholar] [CrossRef]
  59. Chen, L.; Wang, J.; Huang, J.; Tu, T.; Li, L. Cost-trivial material contributes greatly: A review of the application of starch in energy storage systems. J. Energy Storage 2023, 73, 109060. [Google Scholar] [CrossRef]
  60. Golea, C.M.; Codină, G.G.; Oroian, M. Prediction of wheat flours composition using fourier transform infrared spectrometry (FT-IR). Food Control. 2023, 143, 109318. [Google Scholar] [CrossRef]
  61. Gunarathne, R.; Marikkar, N.; Yalegama, C.; Mendis, E. FTIR spectral analysis combined with chemometrics in evaluation of composite mixtures of coconut testa flour and wheat flour. J. Food Meas. Charact. 2022, 16, 1796–1806. [Google Scholar] [CrossRef]
  62. Chinma, C.E.; Abu, J.O.; Adedeji, O.E.; Aburime, L.C.; Joseph, D.G.; Agunloye, G.F.; Adebo, J.A.; Oyeyinka, S.A.; Njobeh, P.B.; Adebo, O.A. Nutritional composition, bioactivity; starch characteristics, thermal and microstructural properties of germinated pigeon pea flour. Food Biosci. 2022, 49, 101900. [Google Scholar] [CrossRef]
  63. Pasqualone, A.; Summo, C. Qualitative and nutritional improvement of cereal-based foods and beverages. Foods 2021, 10, 338. [Google Scholar] [CrossRef]
  64. AACC. Farinograph Method for Flour. In AACC Approved Methods of Analysis; AACC International: St. Paul, MN, USA, 2009; pp. 1–7. [Google Scholar] [CrossRef]
  65. Cerezal, P.M.; Urtuvia, V.G.; Ramírez, V.Q.; Arcos, R.Z. Desarrollo de producto sobre la base de harinas de cereales y leguminosa para niños celíacos entre 6 y 24 meses; II: Propiedades de las mezclas. Nutr. Hosp. 2011, 26, 161–169. [Google Scholar] [CrossRef]
  66. Bravo, A.P.M. Valoración de la Cáscara de Vicia Faba (Haba) Para la Obtención de una Lámina de Plástico Biodegradable Para el uso en Alimentos. Bachelor’s Thesis, Escuela Superior Técnica de Chimborazo, Riobamba, Ecuador, 2021. Available online: http://dspace.espoch.edu.ec/handle/123456789/15310 (accessed on 20 August 2025).
  67. Kaur, G.; Sharma, S.; Singh, B.; Dar, B.N. Comparative Study on Functional, Rheological, Thermal, and Morphological Properties of Native and Modified Cereal Flours. Int. J. Food Prop. 2016, 19, 1949–1961. [Google Scholar] [CrossRef]
  68. Badia-Olmos, C.; Laguna, L.; Haros, C.M.; Tárrega, A. Techno-Functional and Rheological Properties of Alternative Plant-Based Flours. Foods 2023, 12, 1411. [Google Scholar] [CrossRef] [PubMed]
  69. Hrušková, M.; Švec, I.; Jurinová, I. Chemometrics of wheat composites with hemp, teff, and chia flour: Comparison of rheological features. Int. J. Food Sci. 2013, 2013, 30–32. [Google Scholar] [CrossRef]
  70. Tapia, M.S. Contribución al Concepto de Actividad del Agua (aw) y su Aplicación en la Ciencia y Tecnología de Alimentos en Lati-noamérica y Venezuela. Boletín la Acad. Ciencias Físicas, Matemáticas y Nat., Volume LXXX, pp. 18–40. 2020. Available online: https://acfiman.org/boletines_articulos/contribucion-al-concepto-de-actividad-del-agua-aw-y-su-aplicacion-en-la-ciencia-y-tecnologia-de-alimentos-en-latinoamerica-y-venezuela/ (accessed on 20 August 2025).
  71. Scott, G.; Awika, J.M. Effect of protein–starch interactions on starch retrogradation and implications for food product quality. Compr. Rev. Food Sci. Food Saf. 2023, 22, 2081–2111. [Google Scholar] [CrossRef] [PubMed]
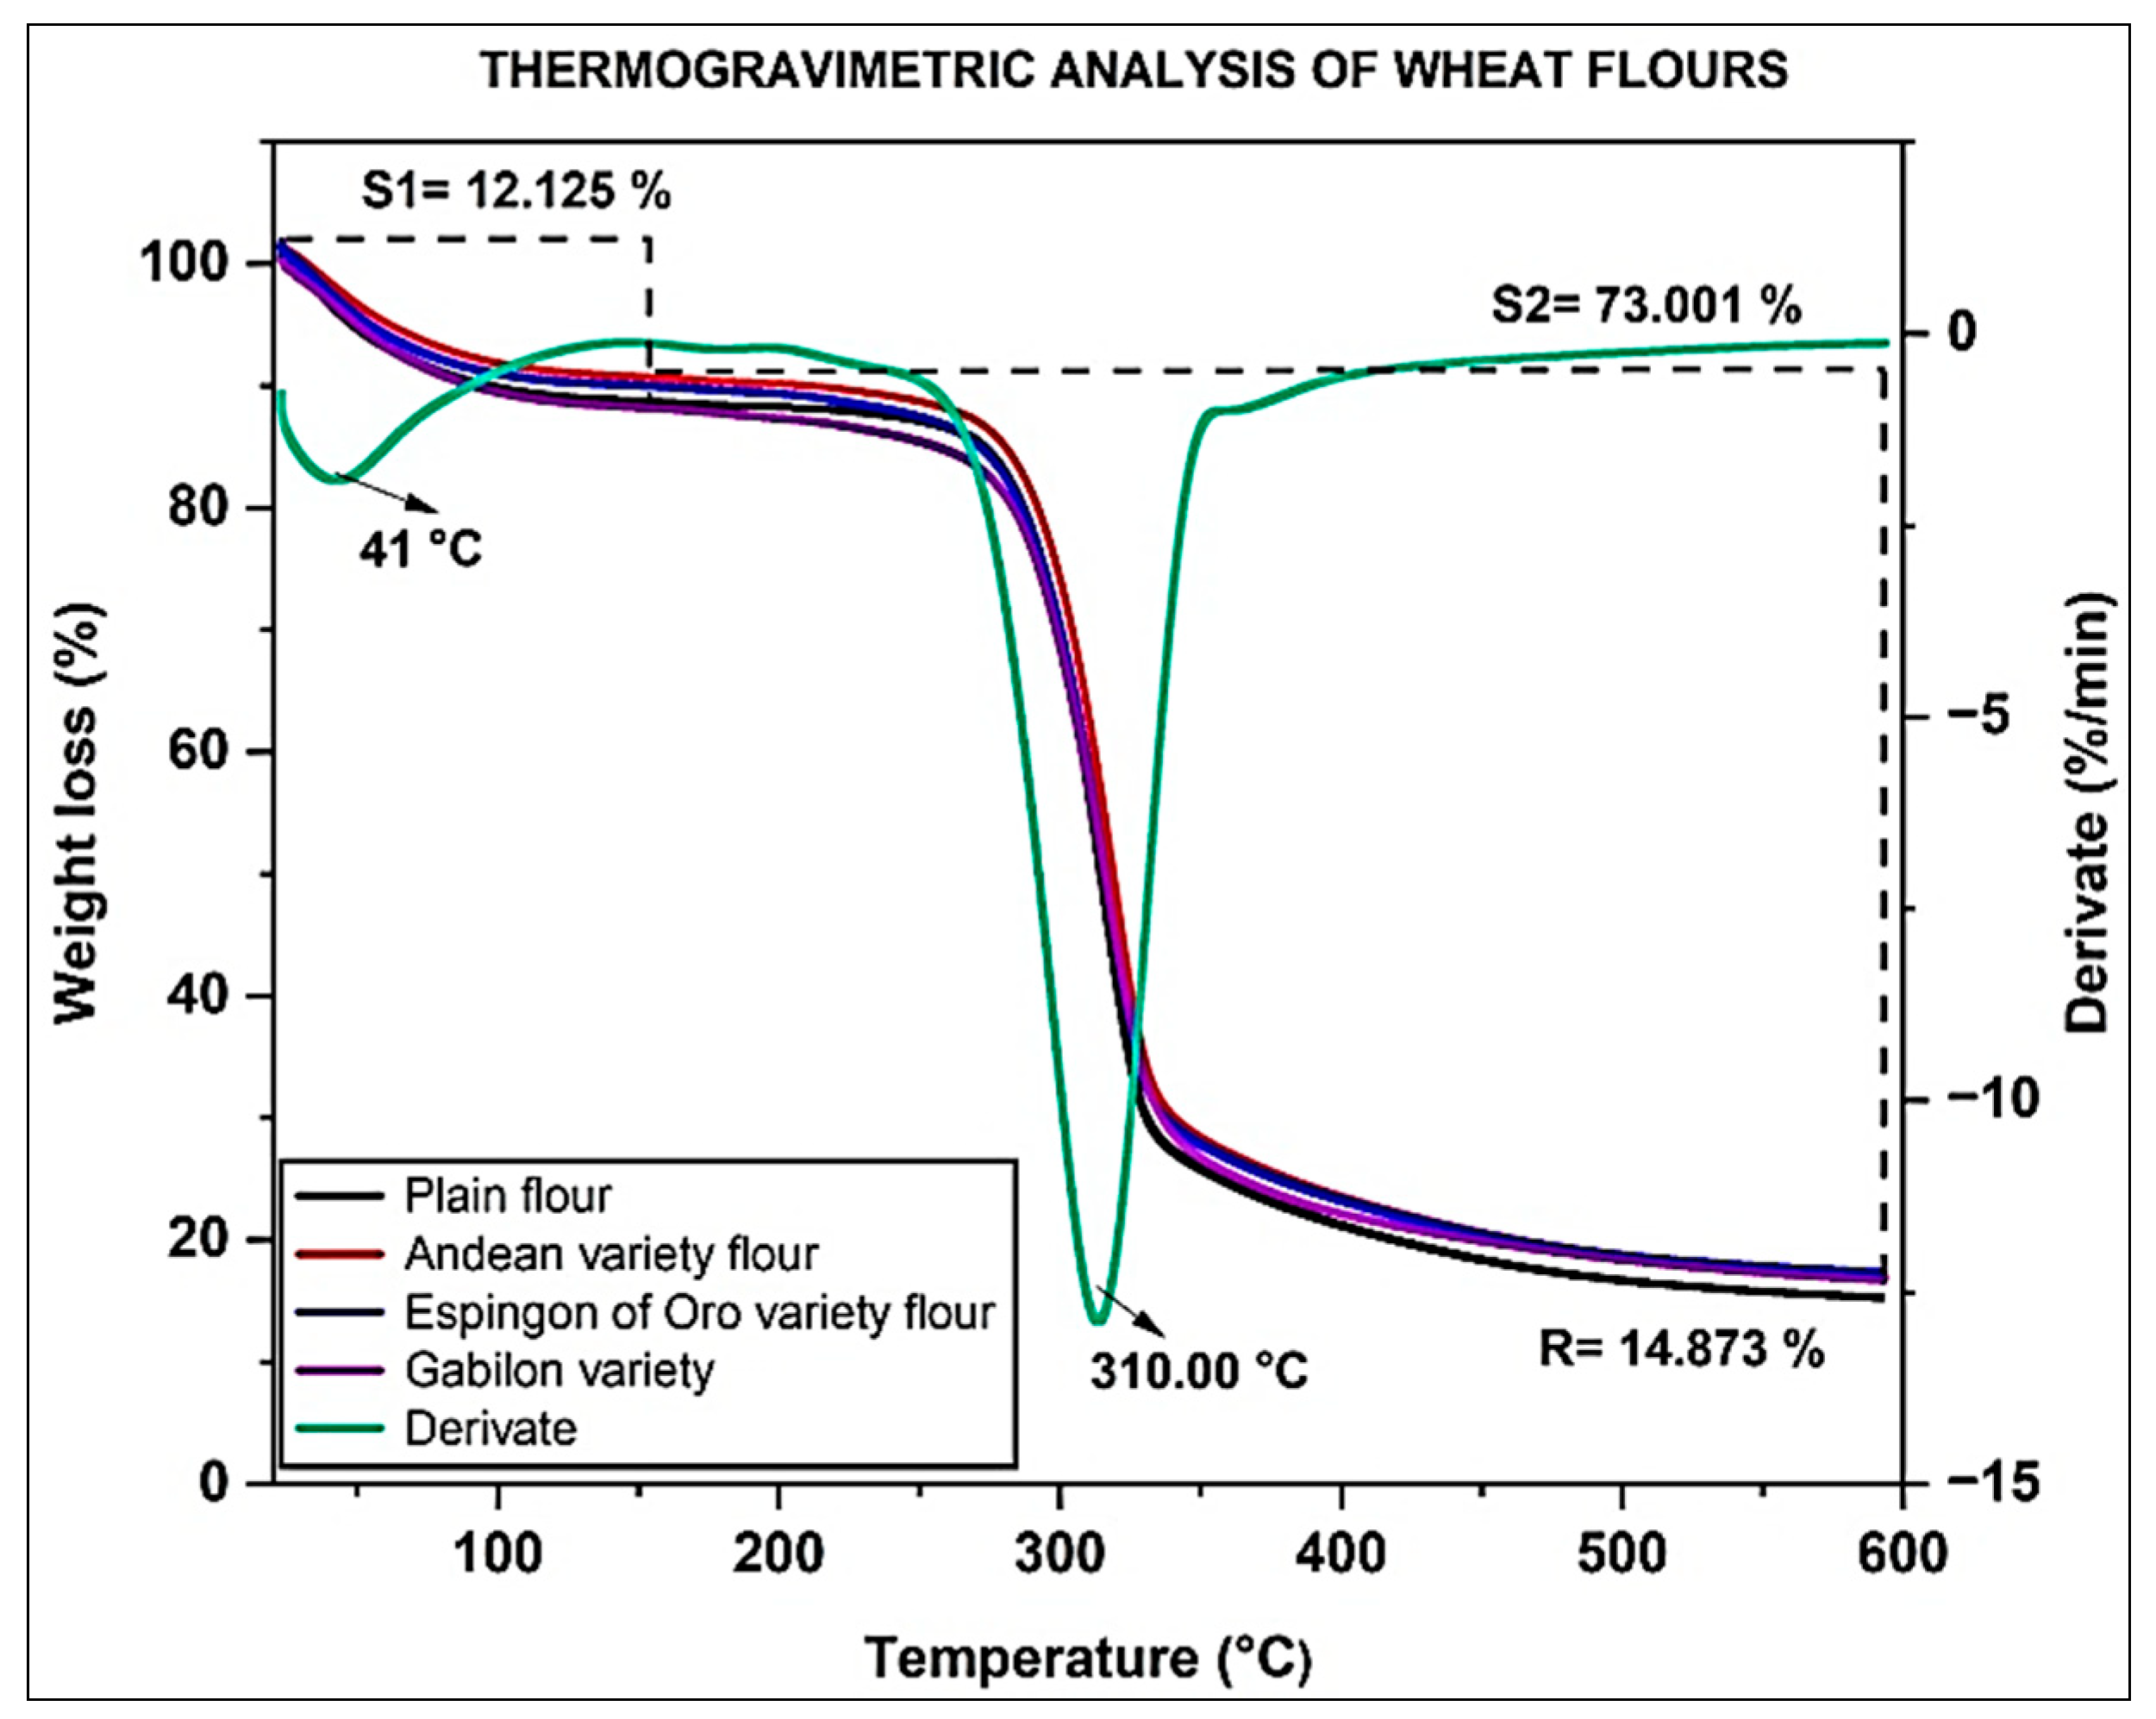
Figure 1. Thermogravimetric analysis curve and its derivative for wheat flour varieties. S1: Zone 1; S2: Zone 2; and A: residue.
Processes 13 03577 g001
Figure 2. Differential scanning calorimetry (DSC) curves of flours from new wheat varieties and plain flour. TP: peak temperature, ∆H: enthalpy of gelatinization, DSC: differential scanning calorimetry.
Processes 13 03577 g002
Figure 3. Structural micrograph of wheat flour varieties (A) gabilon variety flour, (B) Andino variety flour, (C) Espigon de Oro variety flour, and (D) plain flour.
Processes 13 03577 g003
Figure 4. Fourier Transform Infrared Spectroscopy. (FTIR) spectra of flours from new wheat varieties and plain flour. PF: plain flour, GVF: Gabilon variety flour, EOVF: Espigon de Oro variety flour, AVF: Andino variety flour.
Processes 13 03577 g004
Figure 5. Pearson correlation between the parameters of the flours from the studied wheat varieties. SG: start of gelatinization, GT: gelatinization temperature, MG: maximum gelatinization, ABS: consistency-corrected water absorption (%), DDT: dough development time (min), S: stability (min), MTI: mixing tolerance index (BU), DC: dough consistency (FE), FQN: farinograph quality number (min), C: carbon, OH: hydroxyl group, TP: peak temperature, and ∆H: enthalpy of gelatinization.
Processes 13 03577 g005
Figure 6. Principal Component Analysis (PCA) of flours from new wheat varieties and plain flour, based on their evaluated components. SG: start of gelatinization, GT: gelatinization temperature, MG: maximum gelatinization, ABS: consistency-corrected water absorption (%), DDT: dough development time (min), S: stability (min), MTI: mixing tolerance index (BU), DC: dough consistency (FE), FQN: farinograph quality number (min), C: carbon, OH: hydroxyl group, TP: peak temperature, ∆H: enthalpy of gelatinization, PF: plain flour, GVF: Gabilon variety flour, EOVF: Espigon de Oro variety flour, and AVF: Andino variety flour.
Processes 13 03577 g006
Table 1. Proximate analysis of new wheat varieties.
SampleMoisture (%)Protein (%)Fat (%)Ash (%)Dietary Fiber (%)Carbohydrates %
PF10.78 ± 0.09 a9.10 ± 0.04 a1.26 ± 0.06 a0.68 ± 0.12 c0.92 ± 0.03 b78.16 ± 0.03 c
GVF9.70 ± 0.11 d8.39 ± 0.04 d1.25 ± 0.04 a1.32 ± 0.14 a0.82 ± 0.03 b79.32 ± 0.25 a
EOVF10.12 ± 0.03 b8.78 ± 0.03 b1.26 ± 0.03 a1.18 ± 0.06 ab1.05 ± 0.12 a78.65 ± 0.03 b
AVF9.95 ± 0.06 c8.67 ± 0.04 c1.25 ± 0.01 a1.05 ± 0.04 b0.90 ± 0.06 b79.07 ± 0.12 b
LSD0.00010.00010.960.00030.02410.0001
PF: plain flour, GVF: Gabilon variety flour, EOVF: Espigon de Oro variety flour, AVF: Andino variety flour, LSD: least significant difference. The superscript letters a, b, and c show a significant difference (p ≤ 0.05).
Table 2. Amylographic properties.
SamplesStart of Gelatinization (°C)Gelatinization Temperature (°C)Maximum Gelatinization (AU)
PF65.13 ± 0.49 c90.20 ± 0.55 c1284.67 ± 8.50 d
GVF61.10 ± 0.30 b85.26 ± 0.30 b431.33 ± 4.16 b
EOVF59.40 ± 0.46 a78.56 ± 0.15 a314.33 ± 4.72 a
AVF61.46 ± 0.40 b86.20 ± 0.55 b526.33 ± 3.51 c
LSD0.00110.00110.0001
PF: plain flour, GVF: Gabilon variety flour, EOVF: Espigon de Oro variety flour, AVF: Andino variety flour, LSD: least significant difference. Superscripts with letters a, b, and c show significant difference (p ≤ 0.05).
Table 3. Farinographic properties of wheat flour.
Type of FlourABS (%)DDT (min)S (min)MTI (BU)DC (FE)FQN (min)
PF58.67 ± 0.15 a2.3 ± 0.02 a0.00 ± 0.00 a14.67 ± 2.08 a611.00 ± 2.64 a167.00 ± 2.64 b
GVF72.00 ± 0.36 d4.15 ± 0.04 c2.32 ± 0.02 c267.67 ± 3.51 c1133.00 ± 4.58 d48.66 ± 2.51 a
EOVF65.73 ± 0.21 b3.46 ± 0.03 b2.42 ± 0.02 d204.66 ± 6.03 b893.67 ± 4.04 b44.67 ± 2.08 a
AVF70.06 ± 0.21 c3.36 ± 0.75 b1.45 ± 0.03 b293.33 ± 4.04 d1057.00 ± 3.00 c43.00 ± 3.60 a
LSD0.00010.00110.00010.00120.00110.0001
ABS: consistency-corrected water absorption (%), DDT: dough development time (min), S: stability (min), MTI: Mixing Tolerance Index (BU), DC: dough consistency (FE), FQN: farinograph quality number (min). PF: plain flour, GVF: Gabilon variety flour, EOVF: Espigon de Oro variety flour, AVF: Andino variety flour. Superscripts with letters a, b, and c show significant difference (p ≤ 0.05).
Table 4. Surface analysis of wheat flour varieties.
Variety of Wheat FlourGVFAVFEOVFPF
ElementCOHCOHCOHCOH
Atómic (%)51.947.852.247.647.951.554.645.2
Atomic error (%)0.10.10.10.20.10.20.10.1
Weight (%)44.654.744.954.540.55847.452.2
Weight error (%)0.10.10.10.20.10.20.10.2
C: carbon, O: oxygen, OH: hydroxyl group, PF: plain flour, GVF: Gabilon variety flour, EOVF: Espigón de Oro variety flour, AVF: Andino variety flour.
Disclaimer/Publisher’s Note: The statements, opinions and data contained in all publications are solely those of the individual author(s) and contributor(s) and not of MDPI and/or the editor(s). MDPI and/or the editor(s) disclaim responsibility for any injury to people or property resulting from any ideas, methods, instructions or products referred to in the content.