Article

Geological Evaluation and Favorable Area Optimization for In Situ Pyrolysis of Tar-Rich Coal: A Case Study from the Santanghu Basin, NW China

1
PetroChina Research Institute of Petroleum Exploration & Development, Beijing 100083, China
2
CNPC Key Laboratory of Coal-Rock Gas, Langfang 065007, China
3
National Energy Shale Gas R&D (Experiment) Center, Langfang 065007, China
4
PetroChina Tuha Oilfield Company, Hami 839000, China
*
Author to whom correspondence should be addressed.
Processes 2025, 13(11), 3575; https://doi.org/10.3390/pr13113575
Submission received: 11 October 2025 / Revised: 30 October 2025 / Accepted: 3 November 2025 / Published: 5 November 2025
(This article belongs to the Special Issue Data-Driven Analysis and Simulation of Coal Mining)

Abstract

Tar-rich coal (with a tar yield ≥ 7%), as a special coal-based oil and gas resource, is of great significance for ensuring national energy security and promoting the clean conversion of coal. The selection of suitable geological sites represents a core challenge for the safe and efficient application of its in situ pyrolysis technology. Focusing on the tar-rich coal seams in the Santanghu Basin, this study constructed a comprehensive geological evaluation system for site selection by integrating numerical simulation, data mining, and laboratory experiments. The Analytic Hierarchy Process (AHP) and a fuzzy comprehensive evaluation method were employed to achieve a quantitative assessment and identify favorable areas within the study region. The results indicate that resource scale, coal seam conditions, and the properties of the roof and floor strata are the key controlling factors. One optimally comprehensive Class I favorable area (Tiao IV block) was successfully identified. This block exhibits a large resource scale, favorable coal seam conditions, a high tar yield, excellent geological sealing, and superior engineering compatibility, making it the recommended priority target for pilot testing. The evaluation system developed in this study can provide a theoretical basis and technical reference for the geological site selection of in situ pyrolysis of tar-rich coal in similar mining areas and advance its industrialization.

1. Introduction

China is the world’s largest carbon emitter and energy importer. In 2024, its external dependence on crude oil and natural gas reached 71.9% and 43.6%, respectively. Driven by the dual imperatives of achieving the “Dual Carbon” goals (namely, carbon peak and carbon neutrality) and ensuring national energy security, in situ coal pyrolysis, as a new type of unconventional development technology for artificial oil and gas reservoirs, provides new ideas for the low-carbon development of fossil energy and the increase in oil and gas production in China. The technical concept of in situ coal pyrolysis was initially proposed by Shell USA, and in 2004, it obtained the authorization of a U.S. invention patent titled “In Situ Thermal Processing of Coal for Producing Hydrocarbon Liquids and Gases” [1]. Between 2004 and 2014, the University of Utah conducted a research project on Underground Coal Thermal Treatment (UCTT), funded by the U.S. Department of Energy, with the project number DENT0005015. During this project, three sets of experimental apparatuses for coal pyrolysis were developed. Experiments were performed on coal samples of varying sizes, with the largest block measuring 15 cm in length. Additionally, numerical simulations were employed to investigate heat and mass transfer mechanisms within full-scale coal seams. ZHANG et al. [2] emphasized that fundamental research should focus on the pyrolysis of lump coal under in situ stress constraints and master the evolution of pore-fracture structures and the characteristics of heat and mass transfer of lump coal under authentic geological conditions. KELLY et al. [3] pointed out that the greenhouse gas emissions from in situ coal pyrolysis fall within the range of those from in situ oil shale conversion, and its net energy return ratio lies within the range of oil sands (approximately 2.8) and oil shale (ranging from 0.48 to 2.60). They further identified key parameters governing the technical and economic feasibility of the process, including oil and gas yields, heating temperature, the number of heating wells, and the moisture content of the coal seam [4].
Tar-rich coal is a special type of coal resource characterized by a tar yield (Tar, d) ranging between 7% and 12%. Coal with a tar yield exceeding 12% is classified as high-tar coal [5]. This resource possesses a composite nature of coal, oil, and gas attributes, making it a significant unconventional energy resource [6]. In recent years, China has achieved a groundbreaking advancement in this field, marked by the successful extraction of in situ coal tar from the pilot test of in situ pyrolysis of tar-rich coal in Northern Shaanxi. This milestone signifies a critical transition of the technology from theoretical research to practical application. The eastern basins of Xinjiang in China host substantial tar-rich coal resources, with proven reserves exceeding 550 billion tons. Notably, the Santanghu Basin is exceptionally rich in tar-rich coal, exhibiting significant potential for in situ pyrolysis development of mid-deep tar-rich coal resources. This basin is characterized by simple geological structures and high coal tar yields, making it highly promising for in situ pyrolysis to produce coal tar. The in situ pyrolysis technology of tar-rich coal provides a new path for alleviating the shortage of oil and gas resources in China. However, the large-scale application of this technology still faces many challenges, among which geological site selection is a key link. The geological conditions in different regions are complex and diverse, exerting a significant influence on heat transfer, hydrocarbon generation and migration, as well as the stability of the subsurface system during the in situ pyrolysis process. Inappropriate geological site selection may lead to problems such as low heating efficiency, low oil and gas production, and increased engineering safety risk. Macroscopic geological processes govern the characteristics of coal reservoir pore structures, thereby influencing the efficiency of in situ pyrolysis of tar-rich coal [7,8]. Therefore, establishing a scientific and reasonable geological site selection indicator system for in situ pyrolysis of tar-rich coal is of great significance for identifying favorable areas and ensuring the safe and efficient implementation of this technology.
Currently, research on geological site selection for in situ pyrolysis of tar-rich coal remains relatively underdeveloped, and a comprehensive evaluation indicator system has yet to be established. In particular, studies focusing on the optimization of favorable target areas in potential regions such as the Santanghu Basin are nearly absent. From the perspective of resource attributes, tar-rich coal fundamentally falls within the category of coal resources [9]. Consequently, its evaluation methodology can be integrated into the conventional coal resource assessment system. To achieve a more geologically realistic grading and evaluation of reservoirs, scholars domestically and internationally have developed various evaluation methods [10,11,12,13,14,15]. These methods have evolved from early qualitative analyses to quantitative evaluations based on data mining technologies. The factors considered have become increasingly comprehensive, and the evaluation results have tended to be more accurate and refined. In reservoir evaluation, data mining methods have gained extensive application. The grey correlation method transforms the evaluation process into a systematic mathematical calculation, enabling quantitative evaluation of reservoirs. However, its analysis of reservoir genesis and controlling factors is sometimes insufficient, which may lead to deviations in the evaluation conclusions. The Analytic Hierarchy Process (AHP) decomposes complex problems into multiple components using relatively simple mathematical tools [16,17], analyzes the relationships between various factors, and determines their relative weights. It is suitable for structuring and hierarchizing intricate evaluation systems. Furthermore, commonly employed methodologies include artificial neural networks [18,19], cluster analysis [20,21], and fuzzy mathematics [22,23,24]. Among them, the fuzzy mathematics method can effectively handle the uncertainty and fuzziness in hydrocarbon-bearing potential evaluation and improve the objectivity of the evaluation results. The aforementioned methods have collectively driven the transformation of reservoir evaluation from traditional qualitative analysis toward a quantitative and systematic direction. Compared with traditional qualitative analysis and planar overlay map technology, these methods exhibit distinct advantages in terms of scientific rigor and accuracy.
This study takes the tar-rich coal of the Badaowan Formation in the Santanghu Basin, Xinjiang, as the research subject. By comprehensively considering its resource enrichment characteristics and development feasibility, a geological site selection indicator system is constructed, which includes 8 first-level indicators (resource scale, coal seam conditions, coal petrology and quality, process performance, structural conditions, hydrogeological conditions, roof and floor conditions, and surface conditions) and 16 s-level indicators. By integrating numerical simulation with core experimental data, the quantitative grading thresholds of key parameters have been established. Based on this foundation, a fuzzy mathematics method is introduced to establish an evaluation model for the geological site selection of in situ tar-rich coal pyrolysis. This model is applied to optimize favorable target areas for in situ development of tar-rich coal in the PetroChina mining areas of the Santanghu Basin, Xinjiang, aiming to provide a scientific basis for the selection of target areas for in situ pyrolysis of tar-rich coal and support its safe and efficient development.

2. Geological Background

2.1. Regional Geological Setting

The Santanghu Basin is an elongated and irregular intermountain basin, trending NW-SE. It is adjacent to the Junggar Basin to the west and faces the Turpan-Hami Basin across mountains to the south [25]. The basin is surrounded by mountains, bounded by the Maiquen Wula Mountain to the north and the Suhait Mountain to the south [26]. It extends approximately 500 km from Jiangkuduke in the west to Xiamaya Township in the east, with a width ranging from 40 to 70 km, covering a total area of approximately 23,000 km2. The Santanghu Basin exhibits a structural framework characterized by N-S zoning and E-W blocking. The first-order tectonic units can be categorized into a thrust-uplift belt in the north, a central depression belt, and a thrust-nappe belt in the south. The central depression belt of the basin can be subdivided into nine secondary tectonic units, comprising five sags—Hanshuiquan, Tiaohu, Malang, Naomaohu, and Suluke—and four uplifts—Shitoumei, Xixiagou, Fangfangliang, and Weibei—as shown in Figure 1.

2.2. Stratigraphic Characteristics

The stratigraphy in the Santanghu Basin is relatively well-developed, with the Carboniferous System, Permian System, Triassic System, Jurassic System, Cretaceous System, and Cenozoic Erathem exposed in ascending order from bottom to top [27]. The coal-bearing strata in the Santanghu Basin comprise the Xishanyao Formation of the Middle Jurassic Series and the Badaowan Formation of the Lower Jurassic Series. Among them, the Xishanyao Formation contains 1 to 22 coal seams, while the Badaowan Formation contains 1 to 12 coal seams [28]. The coal seams in the Xishanyao Formation are characterized by the prevalence of multiple thin seams and individual thick seams, with a cumulative thickness ranging from 14 to 38.5 m. The coal seams of the Badaowan Formation are primarily distributed in the northern and eastern parts of the study area. These seams are characterized by the predominance of multiple thin layers and individual, extremely thick layers, with single-layer thicknesses ranging from 1 to 31 m and cumulative thicknesses varying between 4 and 34 m. The No. 1 coal seam serves as the primary mineable seam, characterized by a simple structure. It is classified as an extremely thick coal seam, with an average thickness exceeding 20 m and a maximum recorded thickness of 31 m. The tar yield of coal samples from the primary seam of the Badaowan Formation ranges from 2.12% to 23.70%, with an average value of 11.48%, indicating that the coal is generally classified as tar-rich coal [29]. In terms of potential hazards, in situ underground pyrolysis technology significantly differs from traditional surface mining. It establishes injection and production channels through drilling, eliminating the need for large-scale excavation or underground personnel operations. This fundamentally avoids common underground safety risks associated with traditional mining, such as rockbursts and coal and gas outbursts.

3. Methods

3.1. Laboratory Experiments

Systematic tests of vitrinite reflectance, proximate analysis, tar yield, and caking index were conducted on coal rock samples from 4 cored wells in the Badawan Formation of the Santanghu Basin, Xinjiang. All experiments were carried out in strict compliance with the National Standards of the People’s Republic of China (GB/T).

3.1.1. Vitrinite Reflectance of Coal

Vitrinite reflectance measurements were conducted in accordance with the Chinese National Standard GB/T 6948-2008 [30]. Utilizing a coupled polarizing microscope and photometer system, this instrument is made in Germany and its model is MSP200 (Figure 2), under an oil immersion objective lens (λ = 546 nm), no fewer than 50 random measurements were tested on vitrinite particles in the pulverized coal polished section. The average value of the reflectance was taken as the basis for coal rank evaluation to reflect the degree of coalification and thermal evolution history [31].

3.1.2. Proximate Analysis of Coal

The proximate analysis of the coal samples was conducted in accordance with the Chinese National Standard GB/T 212-2008 [32]. The moisture content (by mass loss after drying at 105–110 °C), ash conducted (by mass of residue after combustion at 815 °C), volatile matter (by mass loss after pyrolysis in the absence of air at 900 °C), and fixed carbon (calculated by the difference method) of coal samples were determined sequentially. This provides a quantitative characterization of the industrial composition and combustion-related properties of the coal [33].

3.1.3. Tar Yield of Coal

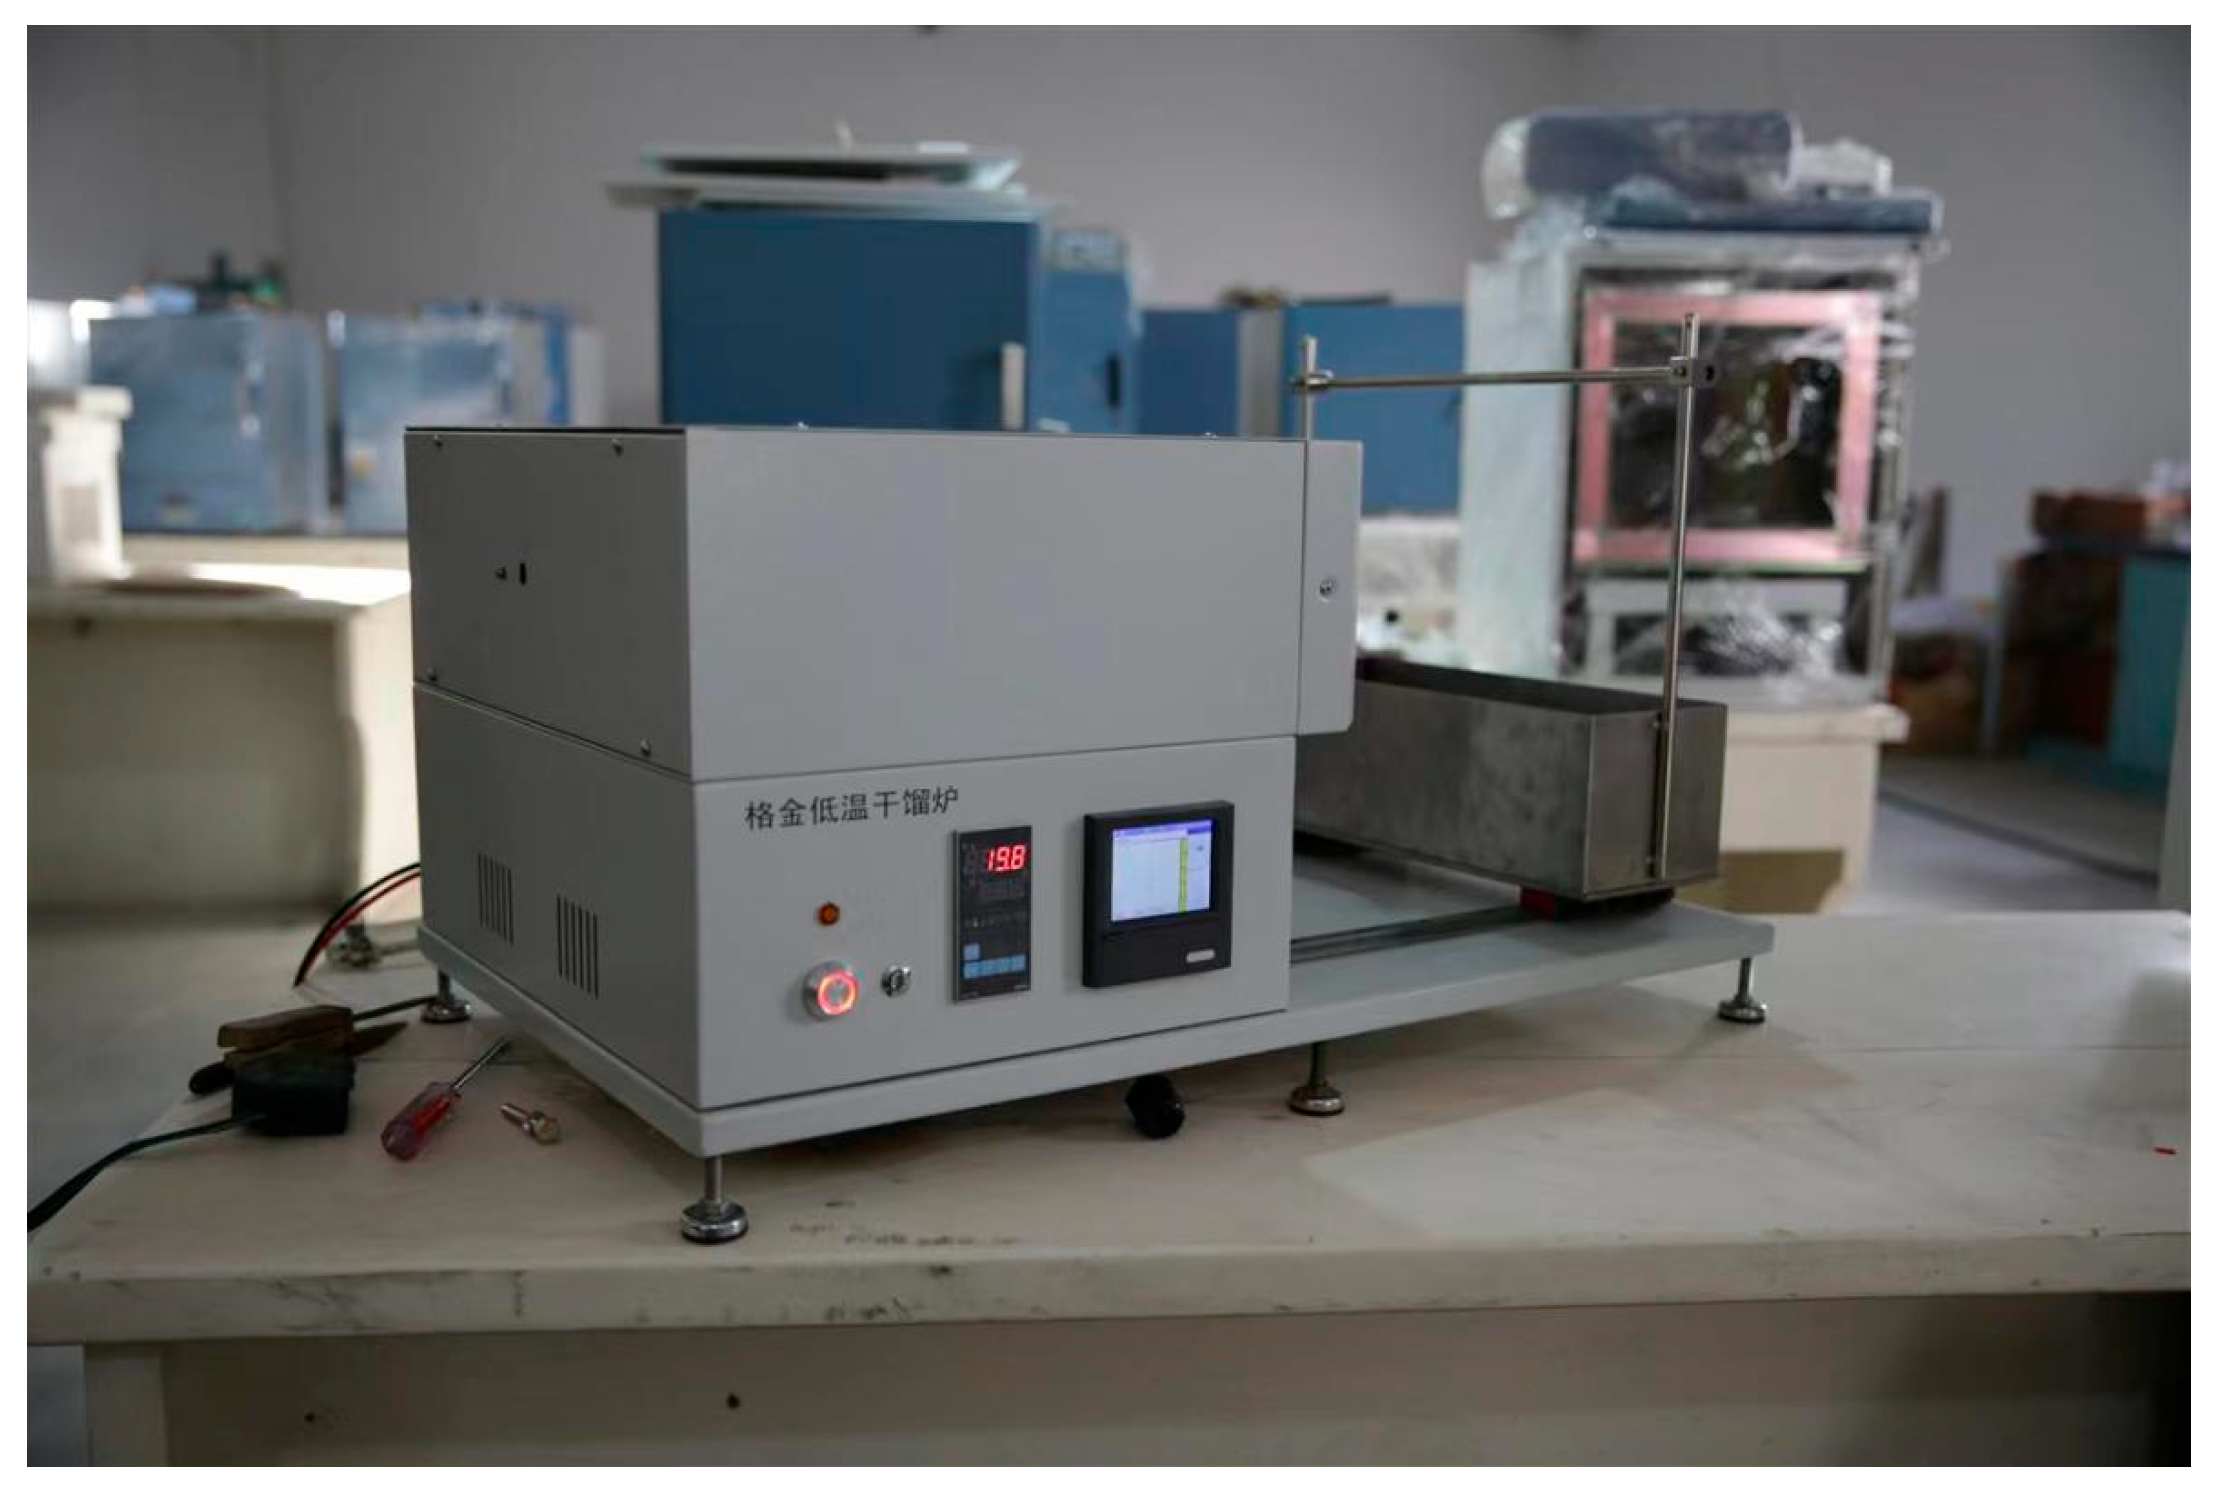
The tar yield was determined by a low-temperature pyrolysis test conducted in accordance with the Chinese National Standard GB/T 480-2000 [34]. The experimental equipment is a Gekin dry distillation furnace, model GJ-6, and it is produced in China (Figure 3). The procedure involved heating a coal sample sealed within an aluminum retort to a final temperature of 510 °C following a specific temperature program. The tar vapors generated during thermal decomposition were condensed and collected, and the tar yield was calculated as the mass percentage of the collected tar relative to the dry basis coal sample. This metric serves as a key indicator for evaluating the oil and gas potential of tar-rich coal [35].

3.1.4. Caking Index of Coal

The caking index (G index) was determined in accordance with the Chinese National Standard GB/T 5447-2014 [36]. The experimental setup is a bonding index tester, model NJ-2, and the place of origin is China. This method involves heating a mixture of the coal sample and a specific anthracite in a specified ratio to form a coke lump, which is then subjected to a drum strength test. The G value is calculated based on the mass of the residue retained on the sieve after the test, serving as a key metric for evaluating the caking capacity and coking property of the coal [37].

3.2. Numerical Modeling of In Situ Pyrolysis for Tar-Rich Coal

Currently, software commonly used for simulating pyrolysis includes CMG Stars (2020 Version) based on the finite difference algorithm and ANSYS Fluent (2020 R1 Version) based on the finite volume algorithm [38]. In this study, COMSOL Multiphysics (6.2 Version) based on the finite element algorithm was applied to conduct numerical simulation research on in situ pyrolysis of tar-rich coal [39,40]. To establish a thermo-hydro-mechanical multiphysics coupling model for the in situ pyrolysis of tar-rich coal, the following fundamental assumptions were adopted in this study. ① Component and Phase Assumptions. Pyrolysis yields semi-coke, coal gas, moisture, and tar. Coal and semi-coke are treated as solid phases; coal gas and tar are modeled as ideal gases. ② Porous Medium Structure and Component Transformation. The initial moist coal unit comprises moisture, inert coal ash, and a non-porous dry coal matrix, with pores saturated by liquid water. Liquid water evaporates above boiling point; dry coal pyrolyzes into semi-coke at pyrolysis temperature. Post-pyrolysis, only semi-coke and ash remain. ③ Thermal Equilibrium Assumption. Instantaneous thermal equilibrium is assumed between fluids and solids, ensuring uniform temperature across phases at any location. ④ Flow Simplification Assumption. Fluid flow is treated as single-phase; gravitational and buoyancy effects on gases are neglected. ⑤ Mechanical and Porosity Change Assumptions. Thermal expansion and cracking are ignored; chemical reactions are considered the primary driver of porosity changes. Coal permeability is assumed isotropic. These assumptions enable a tractable yet physically representative framework for simulating coupled THM processes during in situ pyrolysis.

3.2.1. Mass Conservation Equation

The transport of tar and coal gas within the coal seam is governed by a combination of convective flow and diffusion. Accordingly, the mass balance equation for the gas phase is expressed as [41,42]
( ϕ C g i ) t ( C g i k μ g P g ) ( D g i C g i ) = S i r p
where t is the time (s), Φ is the porosity of the coal, k is the permeability (m2), μg is the dynamic viscosity of the gas (Pa·s), and Pg is the gas pressure (Pa). Cig is the molar concentration of the i-th component at time t (mol/m3), Dig is the effective diffusion coefficient of the i-th component (m2/s), Si is the stoichiometric coefficient for the i-th component, and rp is the pyrolysis reaction rate (s−1).
During the pyrolysis process, the molar concentrations of coal and semi-coke vary dynamically. The mass conservation equation for the solid phase is expressed as
C coal t = ( 1 ϕ 0 ϕ a ) S coal r p C char t = ( 1 ϕ 0 ϕ a ) S char r p
ϕ 0 = x w ρ coal ρ w ϕ a = x ash ρ coal ρ ash
where Φ0 and Φa are the volume fractions of moisture and coal ash in the moist coal, respectively (%); Ccoal and Cchar are the molar concentrations of coal and semi-coke at time t, respectively (mol/m3); Scoal and Schar are the stoichiometric coefficients of coal and semi-coke in the pyrolysis reaction equation, respectively; xw and xash are the mass fractions of moisture and coal ash, respectively (%). ρw and ρcoal are the densities of water and moist coal, respectively (kg/m3).

3.2.2. Energy Conservation Equation

The energy conservation equation, considering heat conduction, heat convection, and the enthalpy change in pyrolysis reactions, is given by [42,43]
[ ( 1 - ϕ ) C s γ s T + ϕ C g γ g T ] t C g γ g k μ g P g T [ [ ( 1 - ϕ ) λ s + ϕ λ g ] T ] = Δ H r p
where T is the temperature (K); Cs and Cg are the comprehensive molar concentrations of the solid and gas phases, respectively (mol/m3); γs and γg represent the comprehensive molar heat capacities of the solid and gas phases, respectively (J/mol·K); λs and λg are the thermal conductivities of the solid and gas phases, respectively (W/m·K); and ΔH is the enthalpy change in the pyrolysis reaction (kJ/mol).

3.2.3. Governing Equations for Deformation

The governing equation for deformation, which incorporates both thermal stress and effective stress, is formulated as follows [44]:
G u i , jj + G 1 2 v u j , j i α T K T , i α P g + f , i = 0
where G is the shear modulus of the coal (GPa); υ is Poisson’s ratio; αT is the thermal expansion coefficient of the coal (1/K); K is the bulk modulus; α is the Biot coefficient; and f,i represents the component of the body force vector.

3.2.4. Physical Property Models of Coal

  • Porosity and Permeability
The release of moisture and volatiles during pyrolysis creates additional pore space. The pore system continuously evolves through nucleation, expansion, and interconnection, leading to significant alterations in the coal’s microstructure. Consequently, both the porosity and permeability of coal are markedly enhanced during the pyrolysis process. The porosity can be calculated using the following formula [43,45]:
ϕ = ϕ c ( 1 ϕ a ϕ 0 ) ( 1 C coal C coal 0 ) + ϕ 0
where Φ0 and Φ are the initial porosity and current porosity of coal, respectively (%); Φc is the inherent porosity of semi-coke (%); x ash is the mass fraction of ash in coal (%); ρ coal is the apparent density of coal (kg/m3); and Ccoal0 and Ccoal are the initial molar concentration and current molar concentration of coal, respectively (mol/m3).
The permeability of coal is calculated using a semi-empirical formula [45]:
k = k 0 exp [ k mul ( ϕ ϕ 0 1 ϕ 0 ) ]
where k0 is the initial permeability of the coal (mD) and kmul is a multiplication factor, which is typically assigned a value between 4 and 10.
2.
Thermophysical Parameters
The thermophysical parameters of coal are crucial for heat transfer simulation, and their accuracy directly affects the reliability of the simulation results. This study reviewed and analyzed the relevant achievements published by predecessors, and established the variation laws of thermophysical parameters of coal and mudstone with temperature. The empirical formulas are as follows [46]:
λ s / λ s 0 = 0.3422 e T 268.1831 + 0.1806 γ s / γ s 0 = 2.696 1.672 1 + e ( T 261.2368 ) / 36.1994 α s / α s 0 = 1.2645 e T 604.3882 0.1542
λ sm / λ sm 0 = 0.3335 e T 269.7829 + 0.7180 γ sm / γ sm 0 = 0.4652 + 0.6028 1 + e ( T 260.8801 ) / 93.7767 α sm / α sm 0 = 6.9803 e T 482.1928 + 7.3418
where Cs and Cs0 represent the specific heat capacity of coal at temperature T and room temperature, respectively (J/(kg·K)); Csm and Csm0 are the specific heat capacity of mudstone at temperature T and room temperature, respectively (J/(kg·K)); λs and λs0 represent the thermal conductivities of the coal at temperature T and at ambient temperature, respectively (W/(m·K)); λsc and λsc0 are the thermal conductivity of mudstone at temperature T and room temperature, respectively, in W/(m·°C); αs and αs0 signify the coefficient of thermal expansion of coal at temperature T and room temperature, respectively in 1/°C; αsm and αsm0 are the coefficient of thermal expansion of mudstone at temperature T and room temperature, respectively, in 1/°C; and T is the test temperature (°C).

3.3. Geological Target Selection Evaluation

3.3.1. Evaluative Parameter Analysis

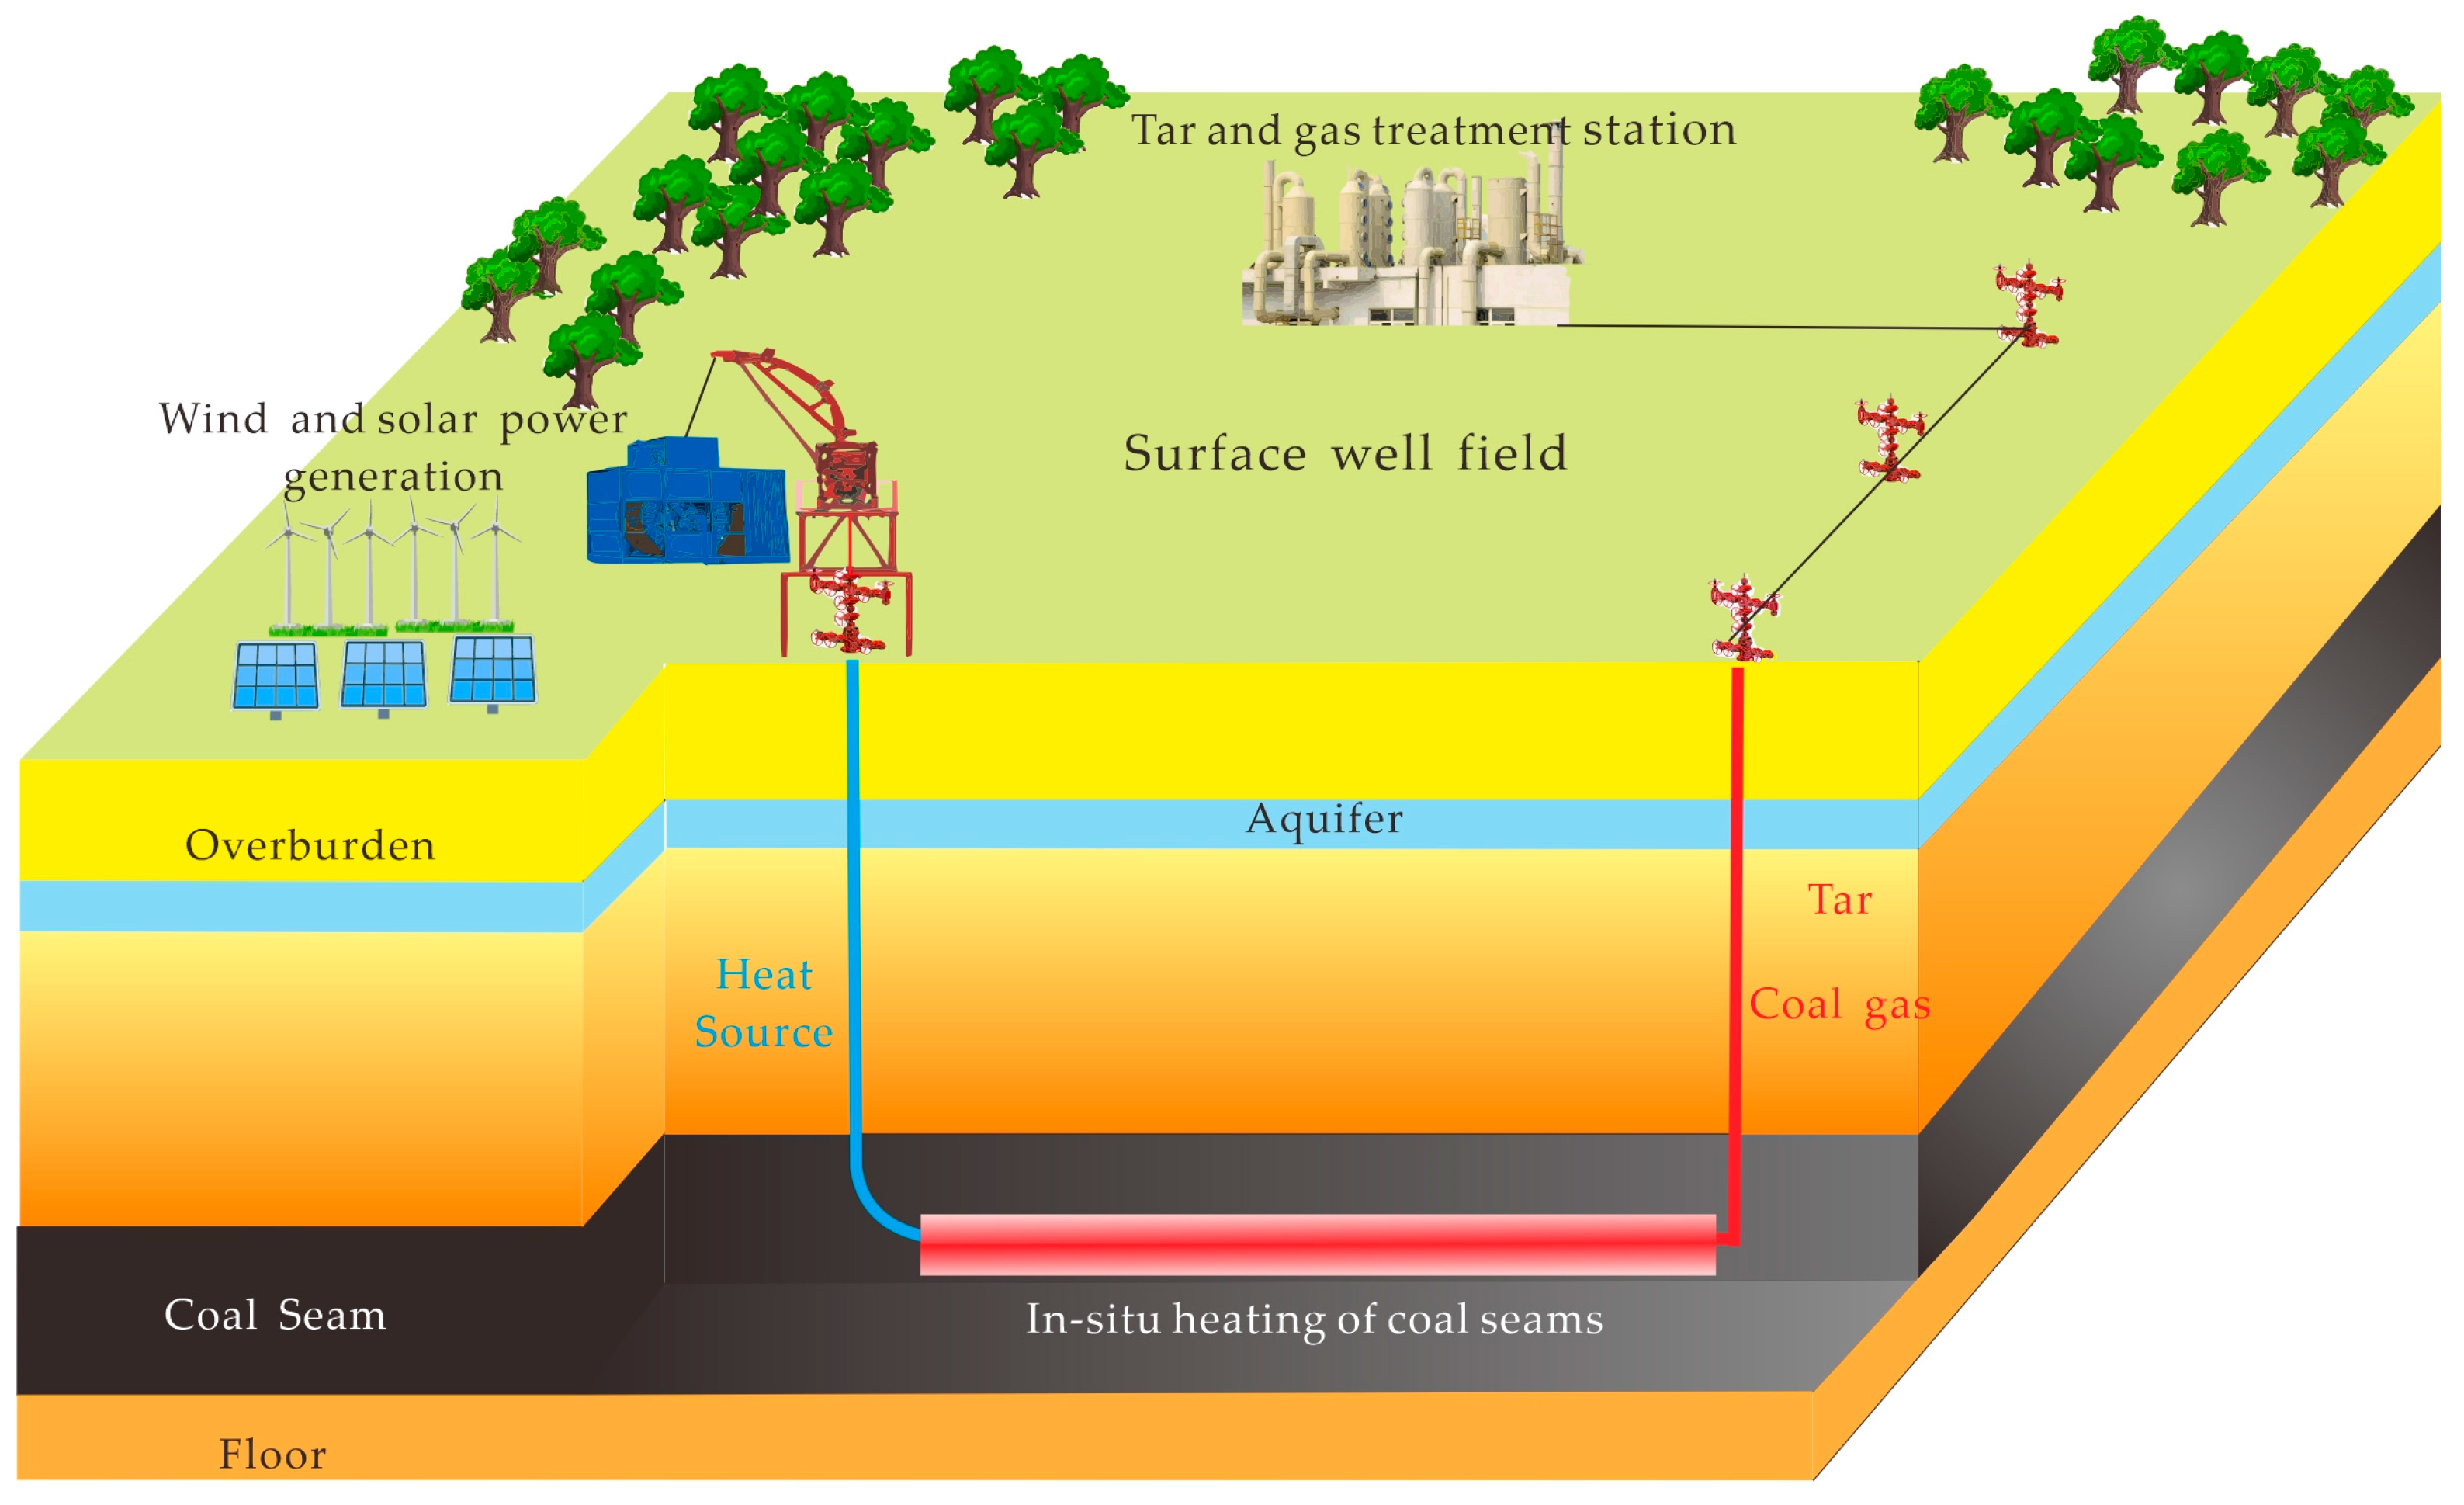
In situ coal pyrolysis refers to the establishment of heat injection and product extraction channels in underground coal seams, enabling coal to undergo in situ pyrolysis reactions. This process generates liquid hydrocarbons (tar and water) and gaseous hydrocarbons (primarily composed of CH4 and H2), while retaining the carbon elements in coal in the form of semi-coke underground. Through the mechanism of “hydrogen extraction and carbon retention” (with carbon retained as semi-coke and CO2), the clean conversion of coal resources is achieved (Figure 4). Geological site selection is a critical link in the in situ pyrolysis of tar-rich coal. Specifically, the evaluation parameters for the geological site selection of in situ coal pyrolysis are mainly proposed in terms of two dimensions: resource abundance and technical feasibility.
1.
Resource Scale
Coal reserves determine the operation time and production scale of in situ pyrolysis of tar-rich coal, which in turn affects economic benefits. The accuracy of resource evaluation is associated with the degree of exploration: the higher the degree of exploration and the more detailed the well data and 3D seismic data, the more favorable it is for site selection. Based on a literature review, it is considered that the coal resource scale should be greater than 100 million tons (calculated based on a favorable area of 10 square kilometers). As shown in Table 1, the coal resources of the Badaowan Formation in the Santanghu Basin are significantly higher than the 100 million-ton standard, providing a very good resource basis for tar-rich coal.
2.
Coal Seam Conditions
(1)
Burial Depth of Coal Seams
Coal seam depth exhibits a positive correlation with engineering implementation difficulty, and its reasonable range is crucial for the safe and efficient implementation of the in situ pyrolysis technology of tar-rich coal. Regarding the lower limit of the burial depth of tar-rich coal seams, if the burial depth is too shallow, the overlying strata tend to collapse under stress and form a fracture zone, which may directly connect to the ground surface and cause leakage of pyrolysis products. Meanwhile, to avoid spatial conflicts with shallow coal mining (the depth of conventional coal mining is mostly less than 500 m) and prevent damage to the pyrolysis zone by shallow groundwater, the burial depth of coal seams should be controlled >800 m.
Currently, there is no unified standard for the upper limit of the burial depth of tar-rich coal seams. However, directly restricted by the technical parameters of downhole electric heaters, the burial depth in practical engineering needs to be <2000 m. As shown in Figure 5, the high-power, high-temperature electric heater is developed by PetroChina Baoji Petroleum Steel Pipe Co., Ltd. in October 2023. The total length of the electric heater is 2500 m (with an effective heating section length of 500 m), which can achieve a heating temperature of 650 °C at a total power of 1000 kW (with a linear power of 2 kW). It features high temperature and high pressure resistance, and has a safe operation life of more than 5 years. These technical parameters determine that the upper limit of coal seam burial depth should not exceed 2000 m; otherwise, it will be difficult to meet the requirements of efficient heating and engineering safety.
 (2)
Thickness of Coal Seams
At present, no quantitative conclusions exist on the influence of coal seam thickness on the in situ pyrolysis of tar-rich coal; however, the negative impacts caused by insufficient thickness have been clearly verified. When the coal seam is relatively thin, it not only limits the coal-controlling volume (resulting in a shortened production cycle) but also intensifies the ineffective heat loss to the roof and floor strata due to the short heat conduction path. Thus, defining a minimum coal seam thickness standard is necessary.
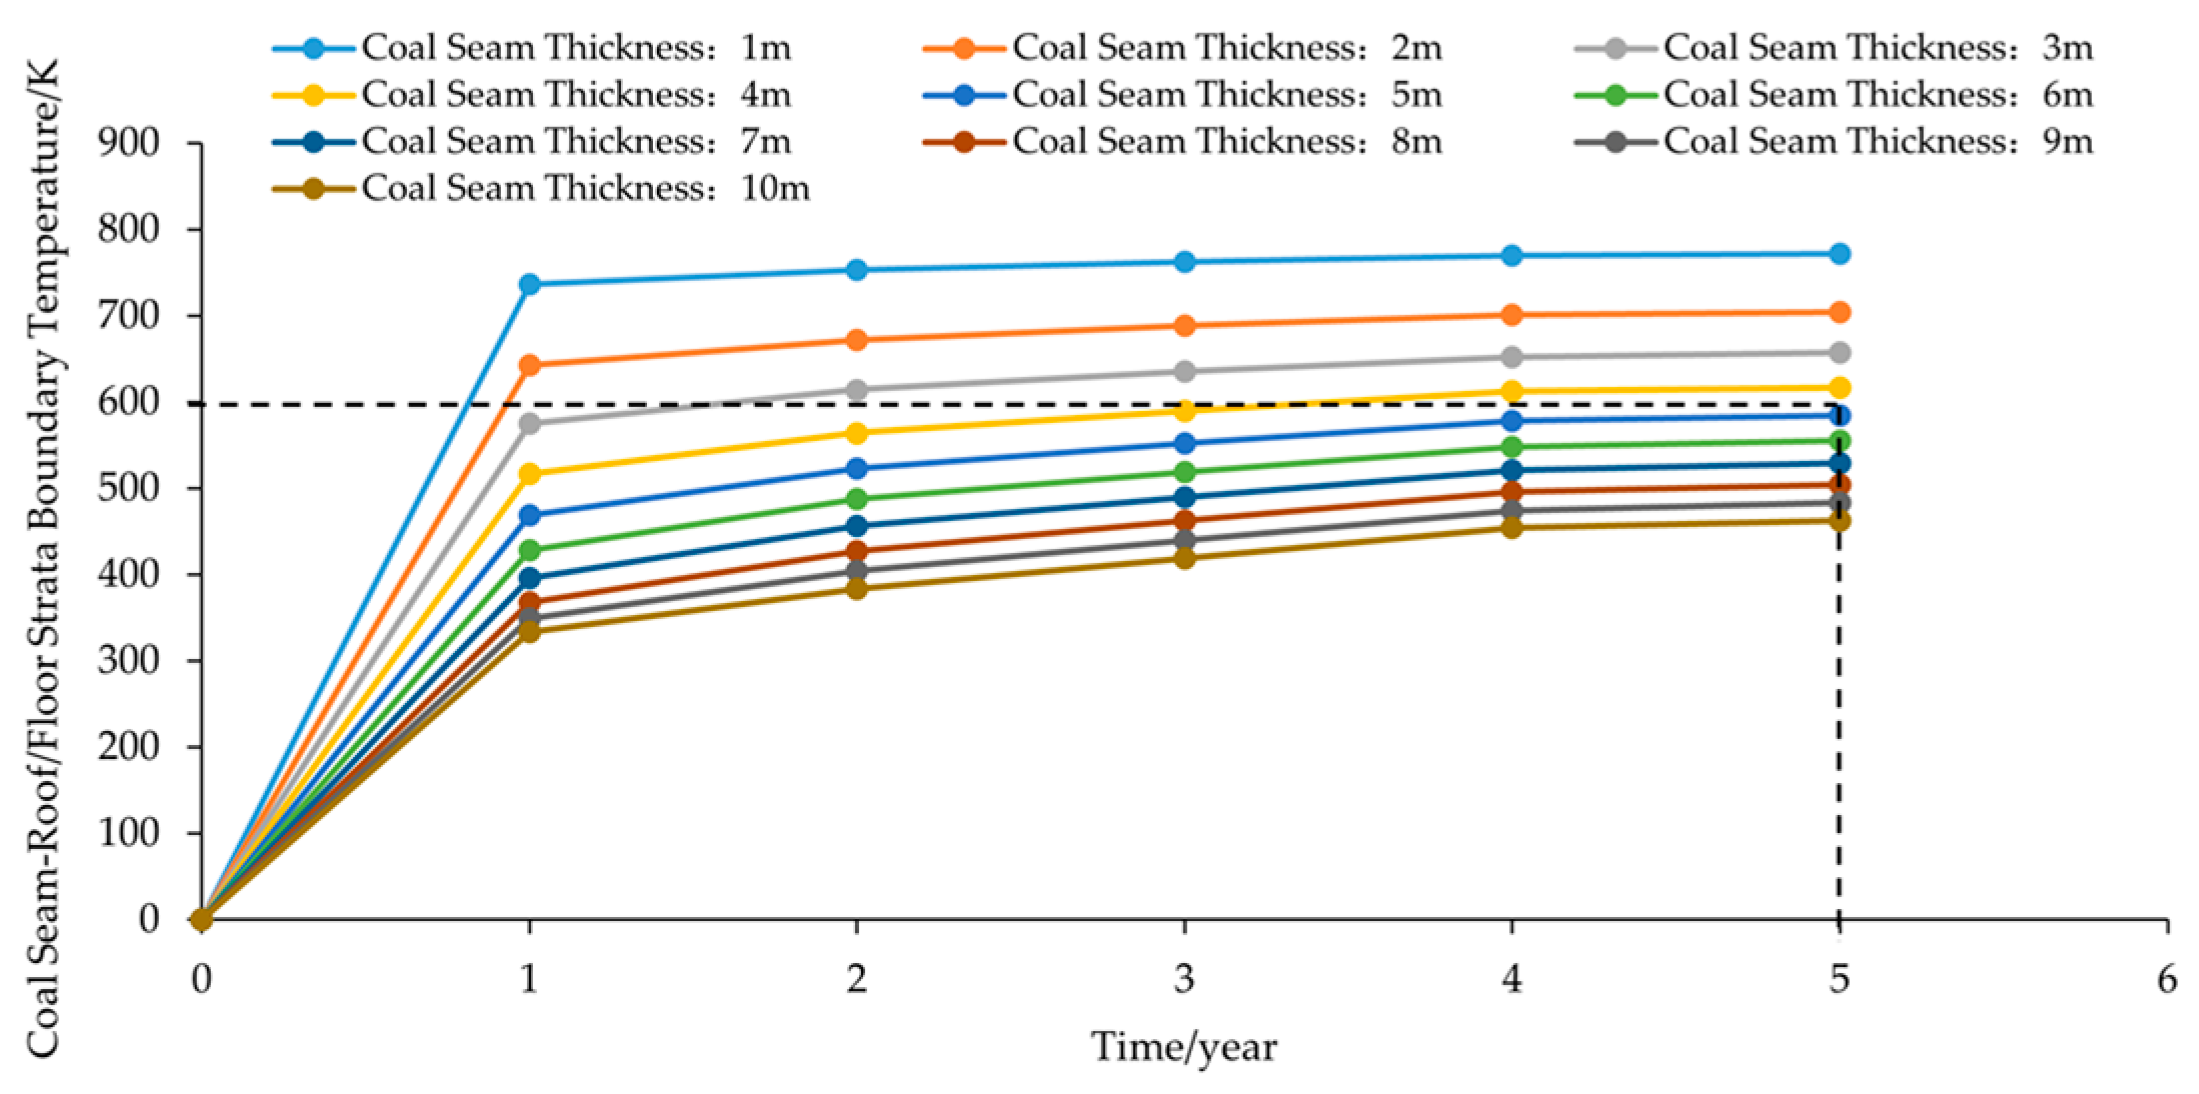
This study analyzed the minimum coal seam thickness limit via numerical simulation. A 2D model (50 m × 50 m) was established using COMSOL Multiphysics, with a heat source placed in the middle of the coal seam for heating (parameters in Table 2). As shown in Figure 6, the coal seam was assumed homogeneous, with uniform heat source temperature diffusion. After heating, if the coal seam boundary temperature exceeded the effective pyrolysis temperature of tar-rich coal (300 °C), excess heat would dissipate to the roof/floor, causing energy waste. Therefore, the core criterion was “coal seam thickness must cover the 300 °C effective pyrolysis range” (to maximize thermal utilization and minimize heat loss). Based on simulation parameters for the electric heater’s maximum 5-year service life, results showed that after 5 years of operation, the coal seam thickness corresponding to the 300 °C pyrolysis temperature line was 5 m (Figure 7). Accordingly, to ensure full coverage of the coal seam’s effective pyrolysis area throughout the heating cycle, the minimum coal seam thickness for tar-rich coal in situ pyrolysis is recommended to be >5 m.
 (3)
Dip Angle of Coal Seams
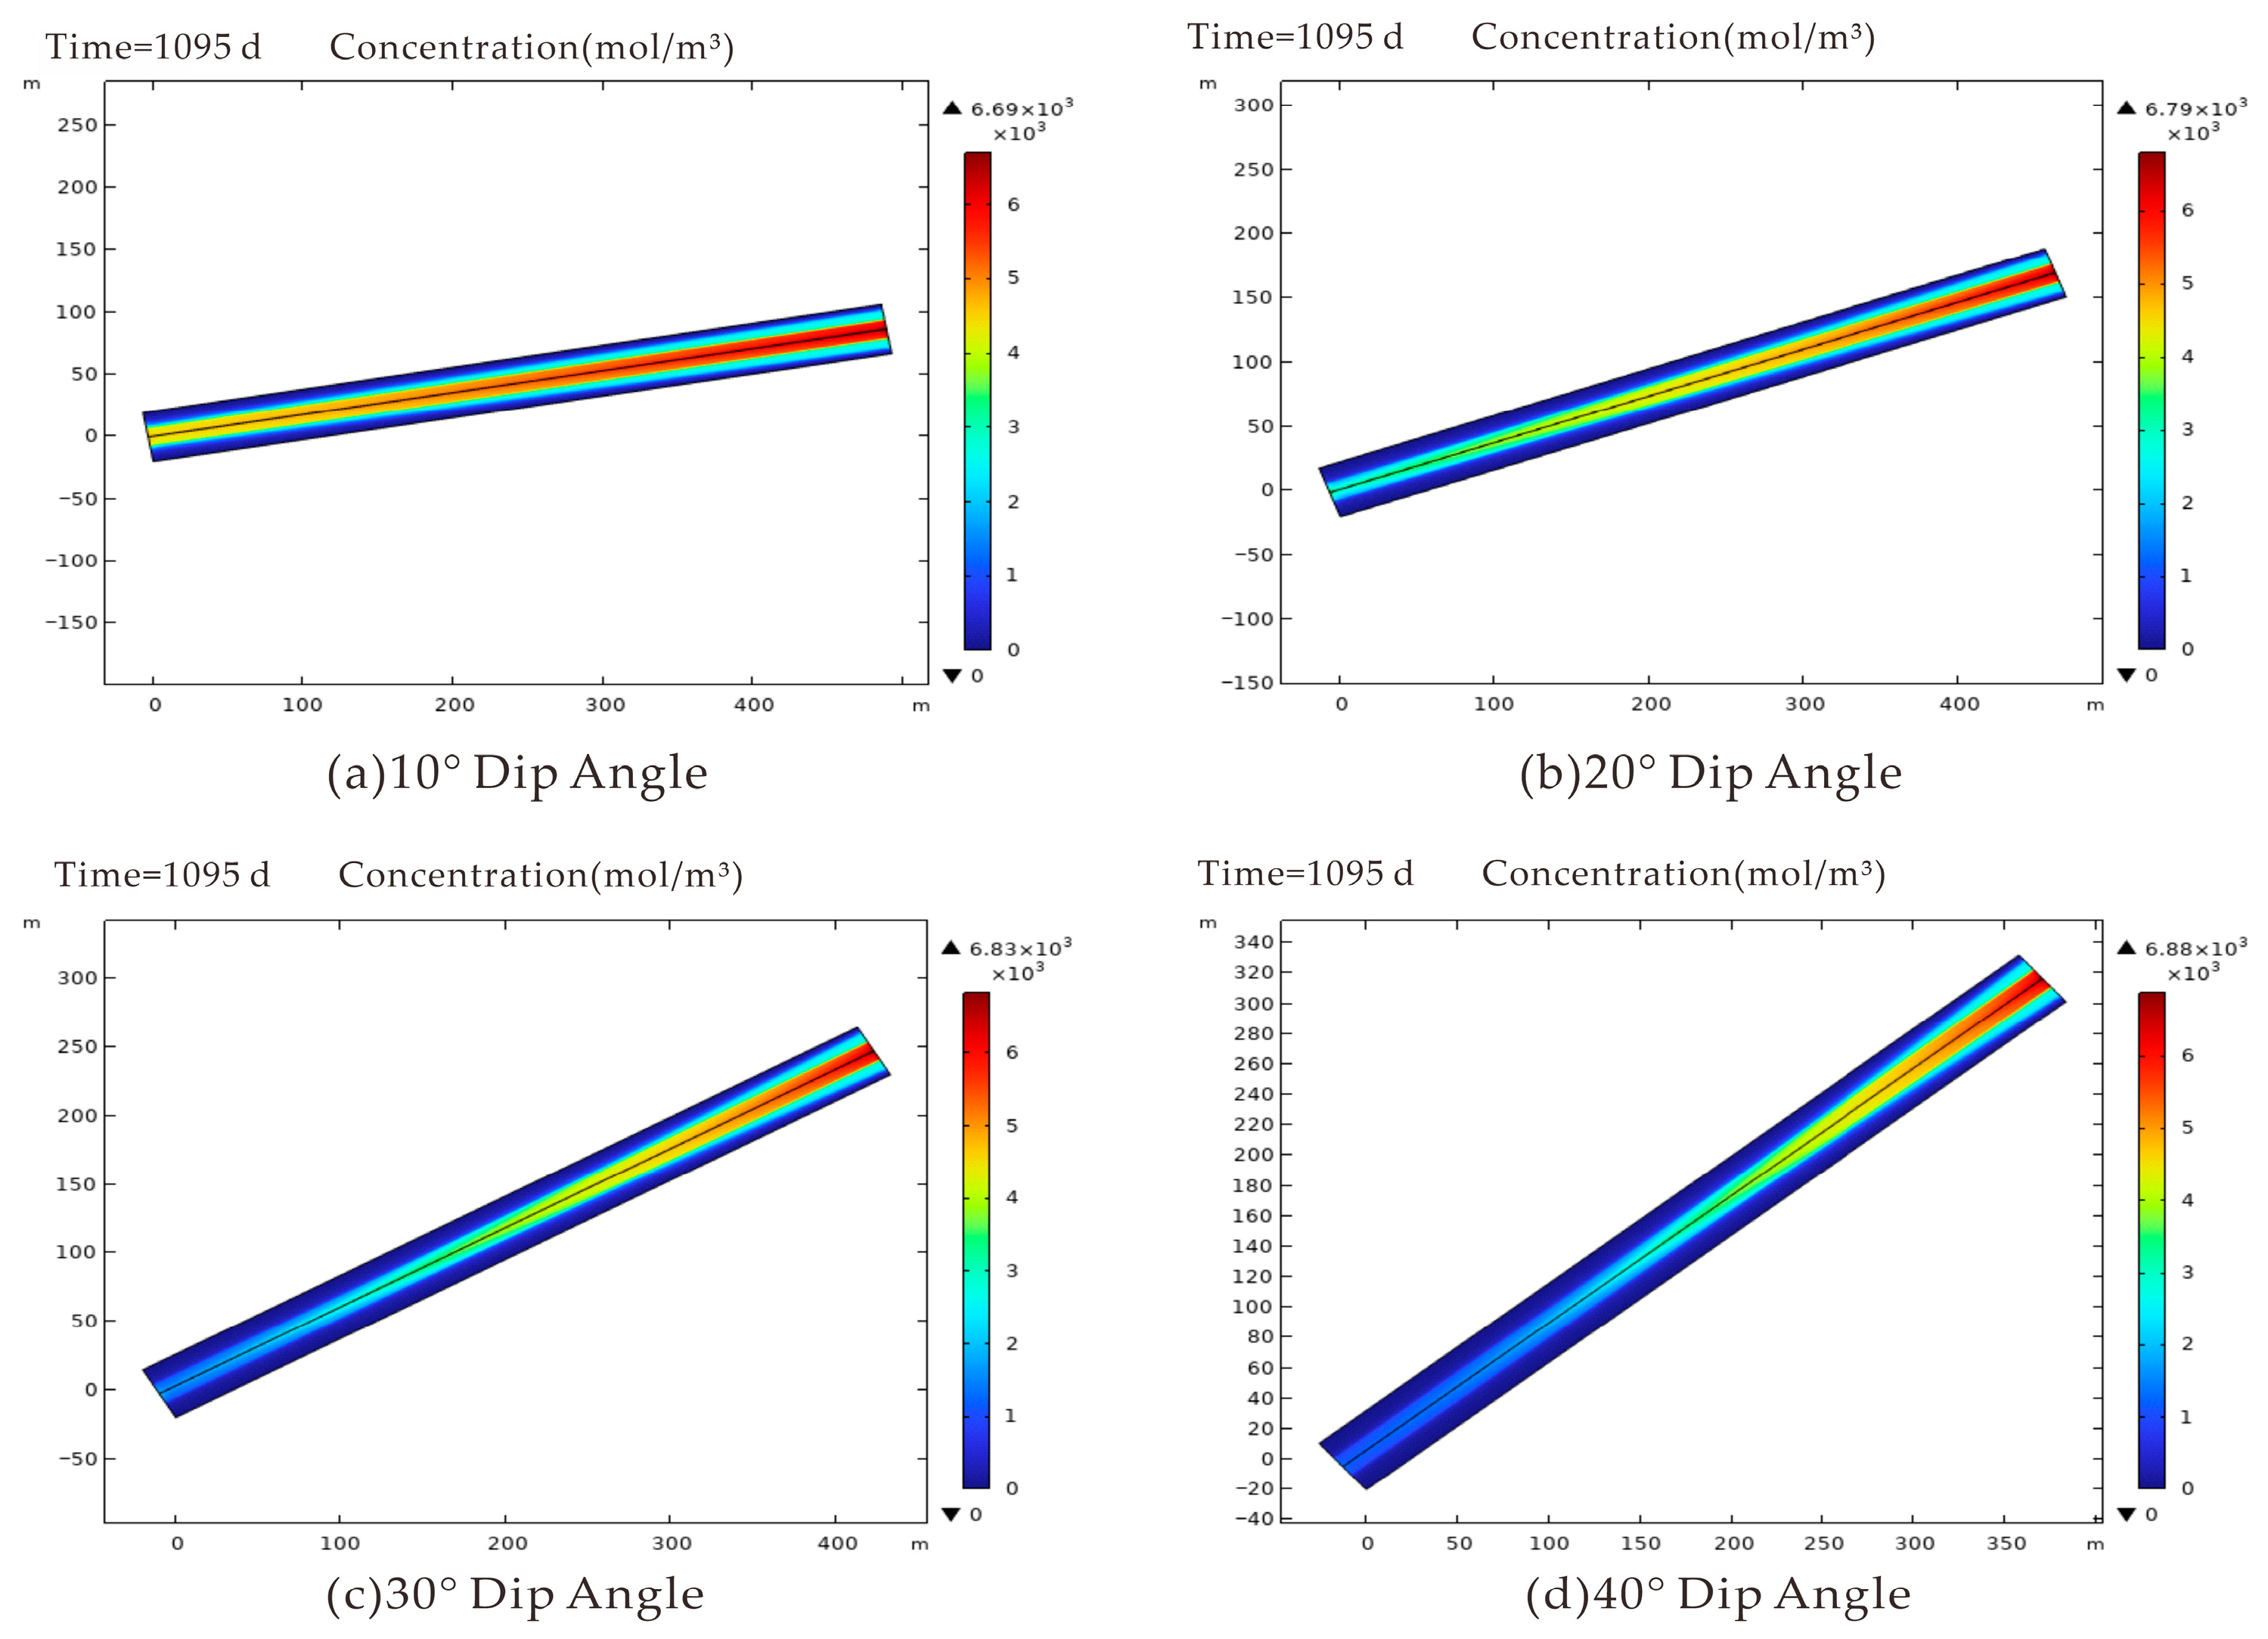
Theoretically, under the condition that other factors remain the same, an increase in the dip angle of the coal seam will lead to a corresponding rise in the resultant force acting on pyrolysis products along the wellbore direction, which is beneficial for enhancing tar yield. However, research on the tar output under different coal seam dip angles via numerical simulation has yielded slightly different results. A 2D numerical model (Figure 8) was established using COMSOL software (6.2 version), with a length of 500 m and a width of 40 m. For this model, the horizontal well had a diameter of 0.1 m and a length of 500 m; additionally, the heating temperature was set as a constant value of 650 °C, the simulation duration was 6 years, the burial depth of the coal seam was 1000 m, the pore pressure was set to 10 MPa, and the bottom-hole flowing pressure was defined as 1 MPa. The horizontal wellbore is approximated as a channel with high permeability. Assuming the flow behavior follows Darcy’s Law, the permeability of the wellbore is set to 500,000 times that of the coal seam, and the porosity of the wellbore is set to 0.99. Other relevant numerical simulation parameters are shown in Table 3. The numerical simulation results of this study (Figure 9 and Figure 10) show that when the coal seam dip angle exceeds 20°, the growth rate of tar yield exhibits a significant attenuation trend; meanwhile, an increase in the dip angle also leads to a rise in the construction difficulty of directional drilling, which increases the complexity and cost of project implementation. Comprehensively considering tar production efficiency and engineering feasibility, it is recommended that the coal seam dip angle for the in situ pyrolysis of tar-rich coal should be controlled within 30°.
3.
Coal Quality
(1)
Coal Rank
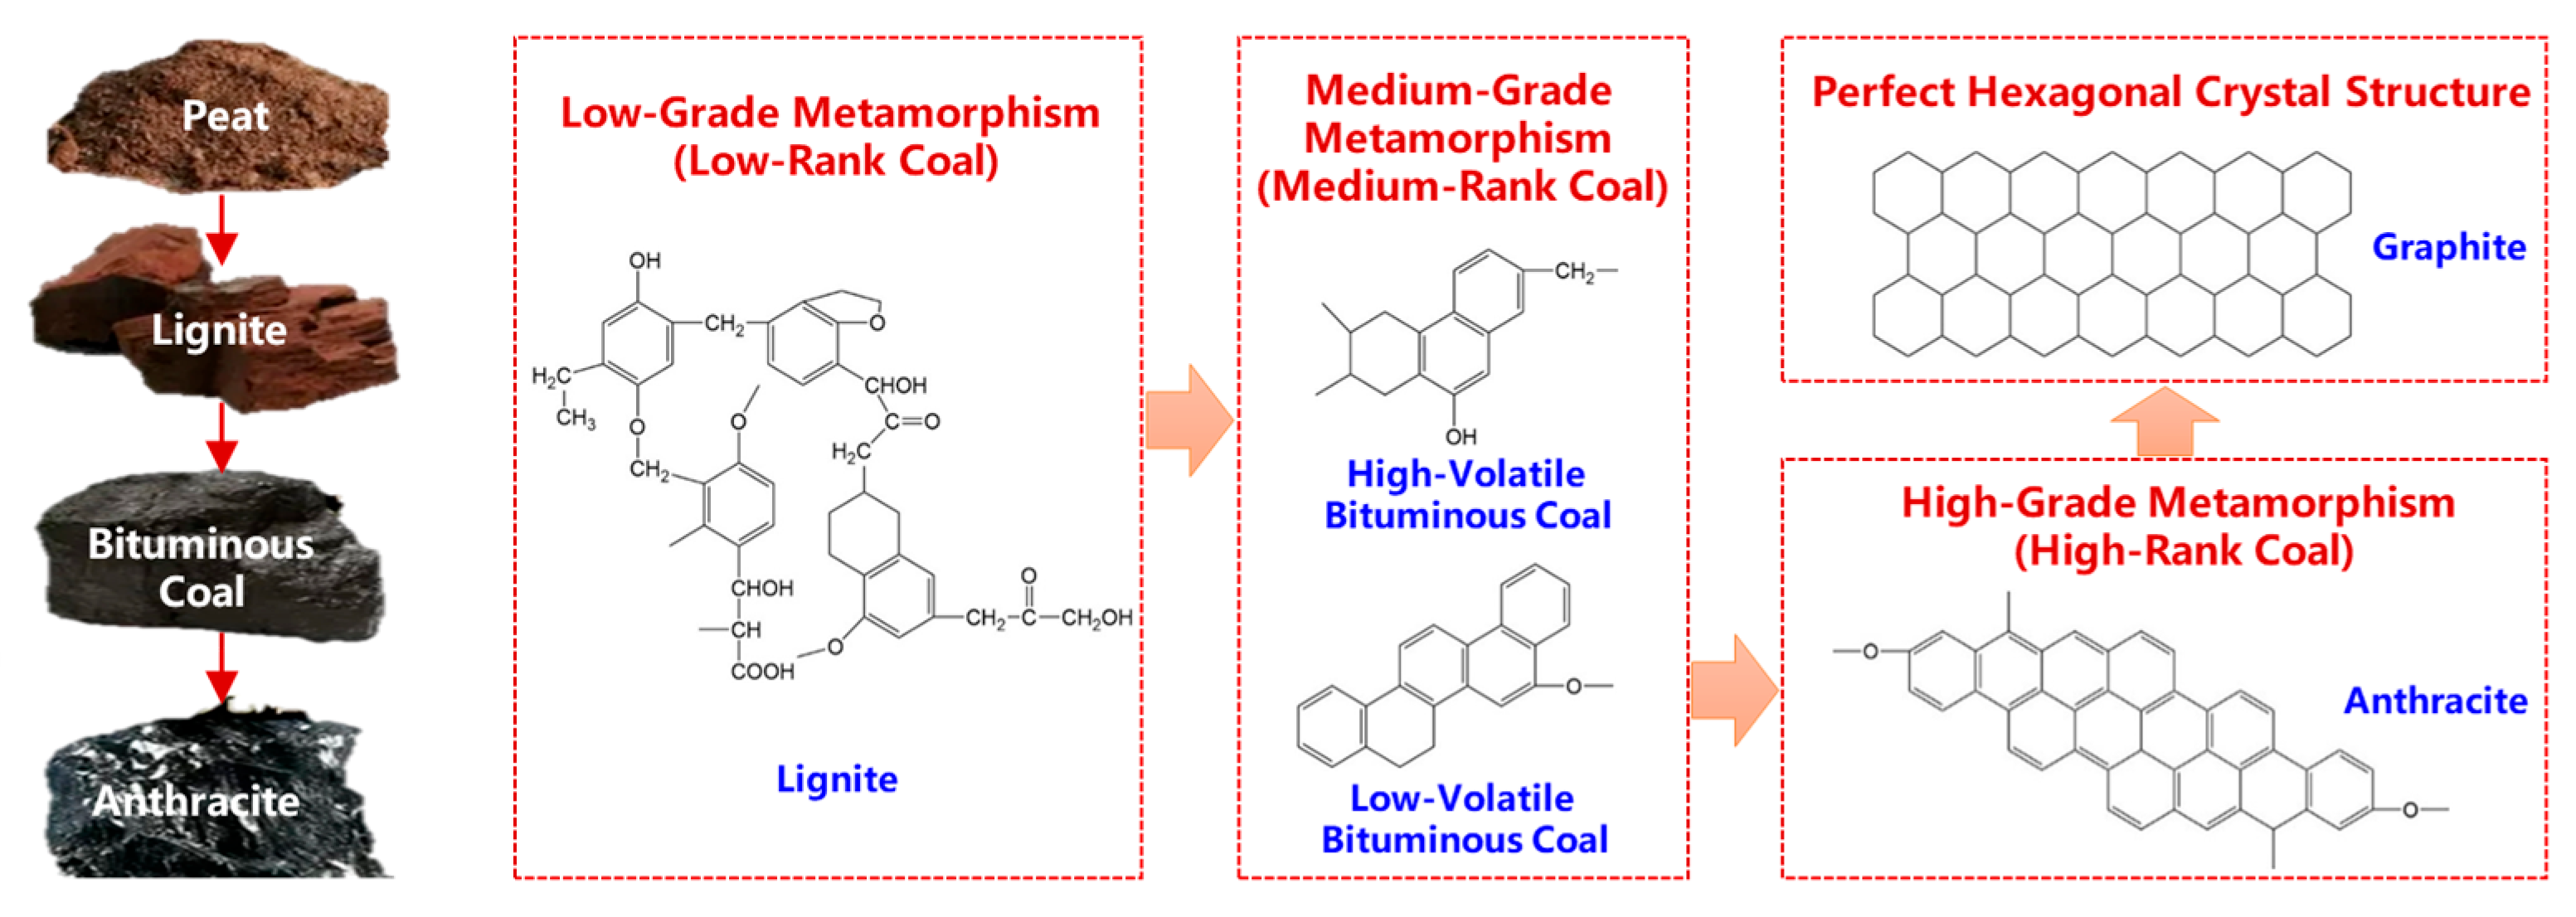
From the perspective of the molecular structural characteristics of coal (Figure 11), during the in situ pyrolysis of tar-rich coal, the formation of oil, gas, and semi-coke tar-rich coal lies in the cleavage of unstable chemical bonds (including bridge bonds between aromatic clusters, aliphatic side chains, small aliphatic molecular phases, and aromatic heteroatoms) and the formation of free radical fragments. During this process, the degree of coal metamorphism has a significant impact on the molecular structure: for coal types with high metamorphism degrees (such as bituminous coal and anthracite), their molecular structure is dominated by tightly connected aromatic rings, and the proportion of easily cleavable small-molecule compounds (e.g., aliphatic side chains) is low. This makes it difficult for them to generate a large amount of oil and gas through chemical bond cleavage during pyrolysis, which is not conducive to oil and gas production from in situ pyrolysis [53].
 (2)
Moisture Content
A certain amount of moisture exists naturally in raw coal. Since moisture evaporation is an endothermic reaction, it consumes a large amount of thermal energy. If the moisture content of coal is excessively high, it will directly lead to a decrease in heating efficiency and difficulty in reaching the ideal pyrolysis temperature, which in turn impairs the oil and gas production efficiency of in situ pyrolysis. According to China National Coal Industry Standard “MT/T 850-2000 Classification of Total Moisture in Coal” (Table 4), the in situ pyrolysis of tar-rich coal should prioritize the use of low-moisture coal types, i.e., the total moisture content must be controlled below 12%. This measure aims to reduce ineffective heat loss and ensure the thermal efficiency of the carbonization process as well as the product conversion rate.
4.
Process Properties of Coal
(1)
Tar yield
According to the definition in “Handbook of Industrial Requirements for Mineral Resources” (2014 Revised Edition), coal with a tar yield greater than 7% is classified as tar-rich coal, and coal with a tar yield greater than 12% as high-tar coal. Tar yield is the core indicator for measuring the development value of in situ pyrolysis of tar-rich coal. Only when the tar yield of coal is ≥7% does it possess the basic properties of tar-rich coal and the material basis for in situ pyrolysis development.
 (2)
Caking Index
The caking property of coal poses a key technical challenge faced in the in situ pyrolysis of tar-rich coal, particularly in the processes of horizontal drilling and artificial fracturing. This challenge is mainly reflected in terms of four aspects: ① After the coal seam is heated, the plastic mass generated by coal melting tends to flow into fissures and boreholes under the action of gravity. When it cools and solidifies, it directly blocks the channels. If the plastic mass has poor gas permeability, its expansion process will further exacerbate channel blockage, impeding the continuous injection of heat-carrying medium and the extraction of products. ② The liquid-phase plastic mass solidifies under the action of surface tension, forming a continuous “honeycomb-like” semi-coke layer on the coal seam surface. Although this layer contains abundant macropores internally, its poor pore connectivity significantly reduces the permeability of the semi-coke layer, making it difficult for pyrolytic volatiles to escape. ③ Excessive caking property leads to an increased proportion of heavy components in pyrolytic tar, which not only raises the difficulty of extraction but also tends to cause secondary blockage of channels after the condensation of these heavy components. ④ The thermal conductivity of the “honeycomb-like” semi-coke layer is significantly reduced, which impedes the transfer of heat to the interior of the coal seam. This results in a reduction in the effective heating area, directly increasing process energy consumption.
According to the China National Coal Industry Standard “MT/T 596-2008 Classification of Coal Caking Index” (Table 5), the in situ pyrolysis of tar-rich coal should prioritize the use of non-caking coal, i.e., coal with a caking index (G) ≤ 5, to avoid the aforementioned technical risks.
5.
Tectonic Conditions
(1)
Fracture Structures
The nature, displacement, and spatial distribution characteristics of faults have a significant impact on the drilling engineering design and the preservation of pyrolysis products during the in situ pyrolysis of tar-rich coal. On the one hand, they increase the complexity of well trajectory design; on the other hand, they may serve as leakage pathways for pyrolytic oil and gas, leading to product loss. Therefore, for the site selection of in situ pyrolysis of tar-rich coal, it is necessary to prioritize avoiding complex structural areas with developed faults and select areas with relatively simple geological structures. Specifically, the target coal seam should not contain faults with a fracture distance greater than half of the average thickness of the coal seam, and the distance from the faults should be between 50 and 150 m. This study more conservatively chose to maintain a safe distance of more than 200 m. This ensures that no connection is established with faults and their associated fracture zones during the mining process, guaranteeing the sealing of the pyrolysis system [54].
 (2)
Fold Structures
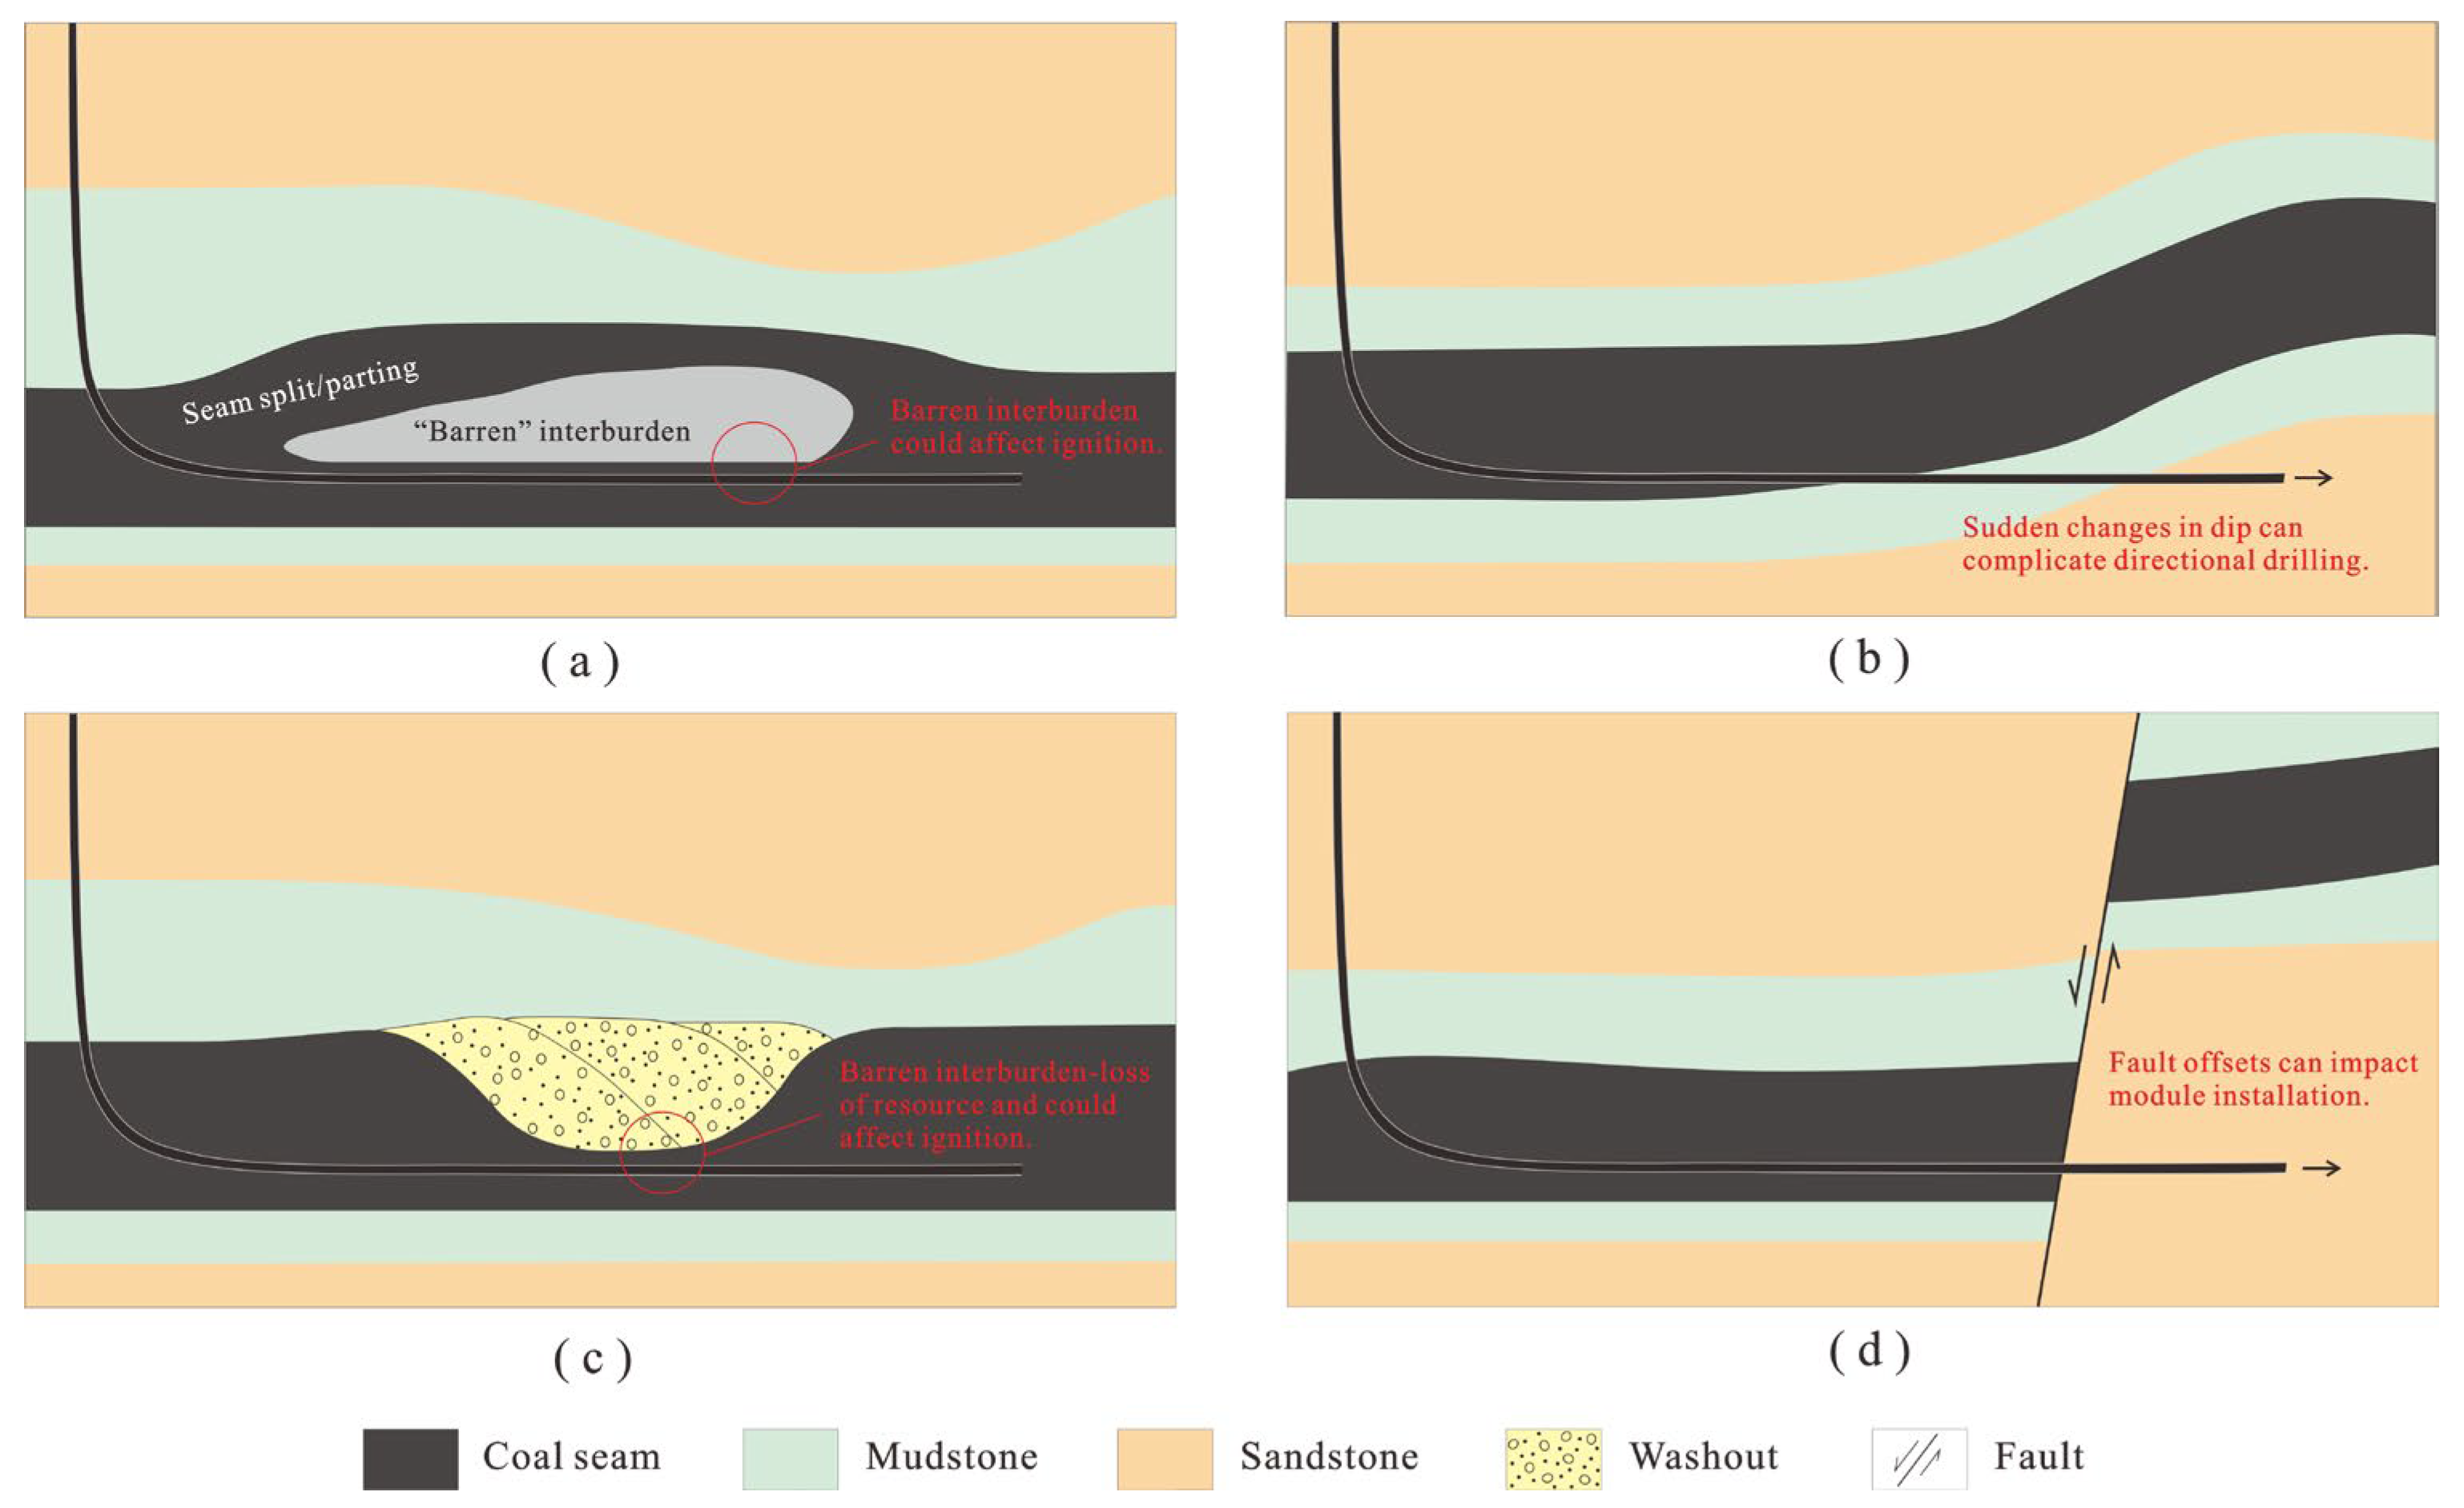
As shown in Figure 12, geological structures such as coal seam splitting and fold structures directly damage the continuity and integrity of coal seams. Such structures not only interfere with the layout design of production modules for the in situ pyrolysis of tar-rich coal, resulting in increased difficulty in engineering arrangement, but also significantly increase the complexity of trajectory control during directional drilling. This is not conducive to the accurate implementation of drilling operations and exerts an adverse impact on the efficient implementation of in situ pyrolysis technology [55].
6.
Coal Seam Partings
Partings are important adverse factors affecting the in situ pyrolysis effect of tar-rich coal. Their existence not only directly reduces the available amount of effective coal resources and lowers resource utilization efficiency, but also weakens the heat transfer efficiency inside the coal seam due to differences in thermophysical properties between partings and the coal seam, resulting in uneven heat distribution. Meanwhile, partings physically block the migration paths of pyrolysis products, hindering the smooth production of pyrolysis products such as oil and gas, and exerting multiple adverse impacts on the economy and efficiency of in situ pyrolysis.
7.
Hydrogeological Conditions
(1)
Groundwater Hydrological Environment
Groundwater is a key hydrological factor requiring focused attention during the in situ pyrolysis of tar-rich coal, and its presence poses potential impacts on both engineering effectiveness and environmental safety. On the one hand, if groundwater infiltrates into the pyrolysis zone, it will consume a large amount of thermal energy due to water’s high heat capacity characteristic. This significantly reduces heating efficiency, directly affecting the adequacy of pyrolysis reactions. On the other hand, pollutants generated by in situ pyrolysis may permeate or migrate with groundwater, causing contamination of the groundwater environment. To avoid the aforementioned issues, the site selection for the in situ pyrolysis of tar-rich coal should prioritize areas with poor groundwater recharge-runoff-discharge conditions. This ensures that the pyrolysis zone is in a relatively closed groundwater circulation environment, reducing interference from external groundwater recharge and safeguarding engineering efficiency and environmental safety.
 (2)
Aquifer Distribution
The ideal condition for the in situ pyrolysis zone of tar-rich coal is the absence of aquifer development. If aquifers exist in the area, an aquiclude of a certain thickness must develop between the aquifers and the target coal seam. This aquiclude can effectively block the hydraulic connection between aquifers and the coal seam, prevent the upper and lower aquifers from connecting through fractures and other channels, and avoid groundwater seeping into the coal seam to interfere with the pyrolysis process, thus ensuring that heating efficiency is not affected by water bodies.
8.
Roof and Floor Conditions of Coal Seams
The permeability of the roof and floor lithology is the core factor determining geological tightness, and the permeability characteristics are mainly determined by the surrounding rock type. Impermeable mudstone is the ideal lithology for the roof and floor of tar-rich coal in situ pyrolysis, while porous and permeable sandstone will damage the tightness of the pyrolysis zone, which is not conducive to the stable progress of the in situ pyrolysis process. Therefore, in the site selection of tar-rich coal in situ pyrolysis, the roof and floor should preferably select compact rock formations with low permeability and high mechanical strength. In practical engineering, compact lithologies such as mudstone or argillaceous siltstone are preferred, which can effectively ensure the tightness of the pyrolysis system.
After being heated, the roof and floor rock layers are prone to thermal damage, which leads to increased permeability and poses a potential threat to the tightness of the pyrolysis zone. Therefore, it is necessary to define a reasonable range for the thickness of the coal seam roof and floor. This study adopted the numerical simulation method to conduct roof and floor thickness analysis. Specifically, a 2D numerical model was established using COMSOL software, with a length of 50 m and a width of 50 m. As shown in Figure 13, it is assumed that the roof and floor rocks are mudstone, and the heat source was placed at the contact boundary between the coal seam and the roof or floor. The model parameters are listed in Table 2. After a period of heating, the areas of the coal seam roof/floor adjacent to the coal seam will suffer from thermal damage and develop fractures. If the thickness of the coal seam roof/floor is less than the height of the potential high-temperature thermal damage zone, channels connecting the coal seam to the outside will form. These channels will cause pyrolysis products and harmful gases to escape into other rock formations, thereby exerting adverse effects on the economic efficiency and environmental performance of the in situ pyrolysis of tar-rich coal. Therefore, only when the thickness of the coal seam roof/floor is greater than the height of the high-temperature thermal damage zone can the tightness of the pyrolysis zone be effectively ensured, and the loss of pyrolysis products be prevented.
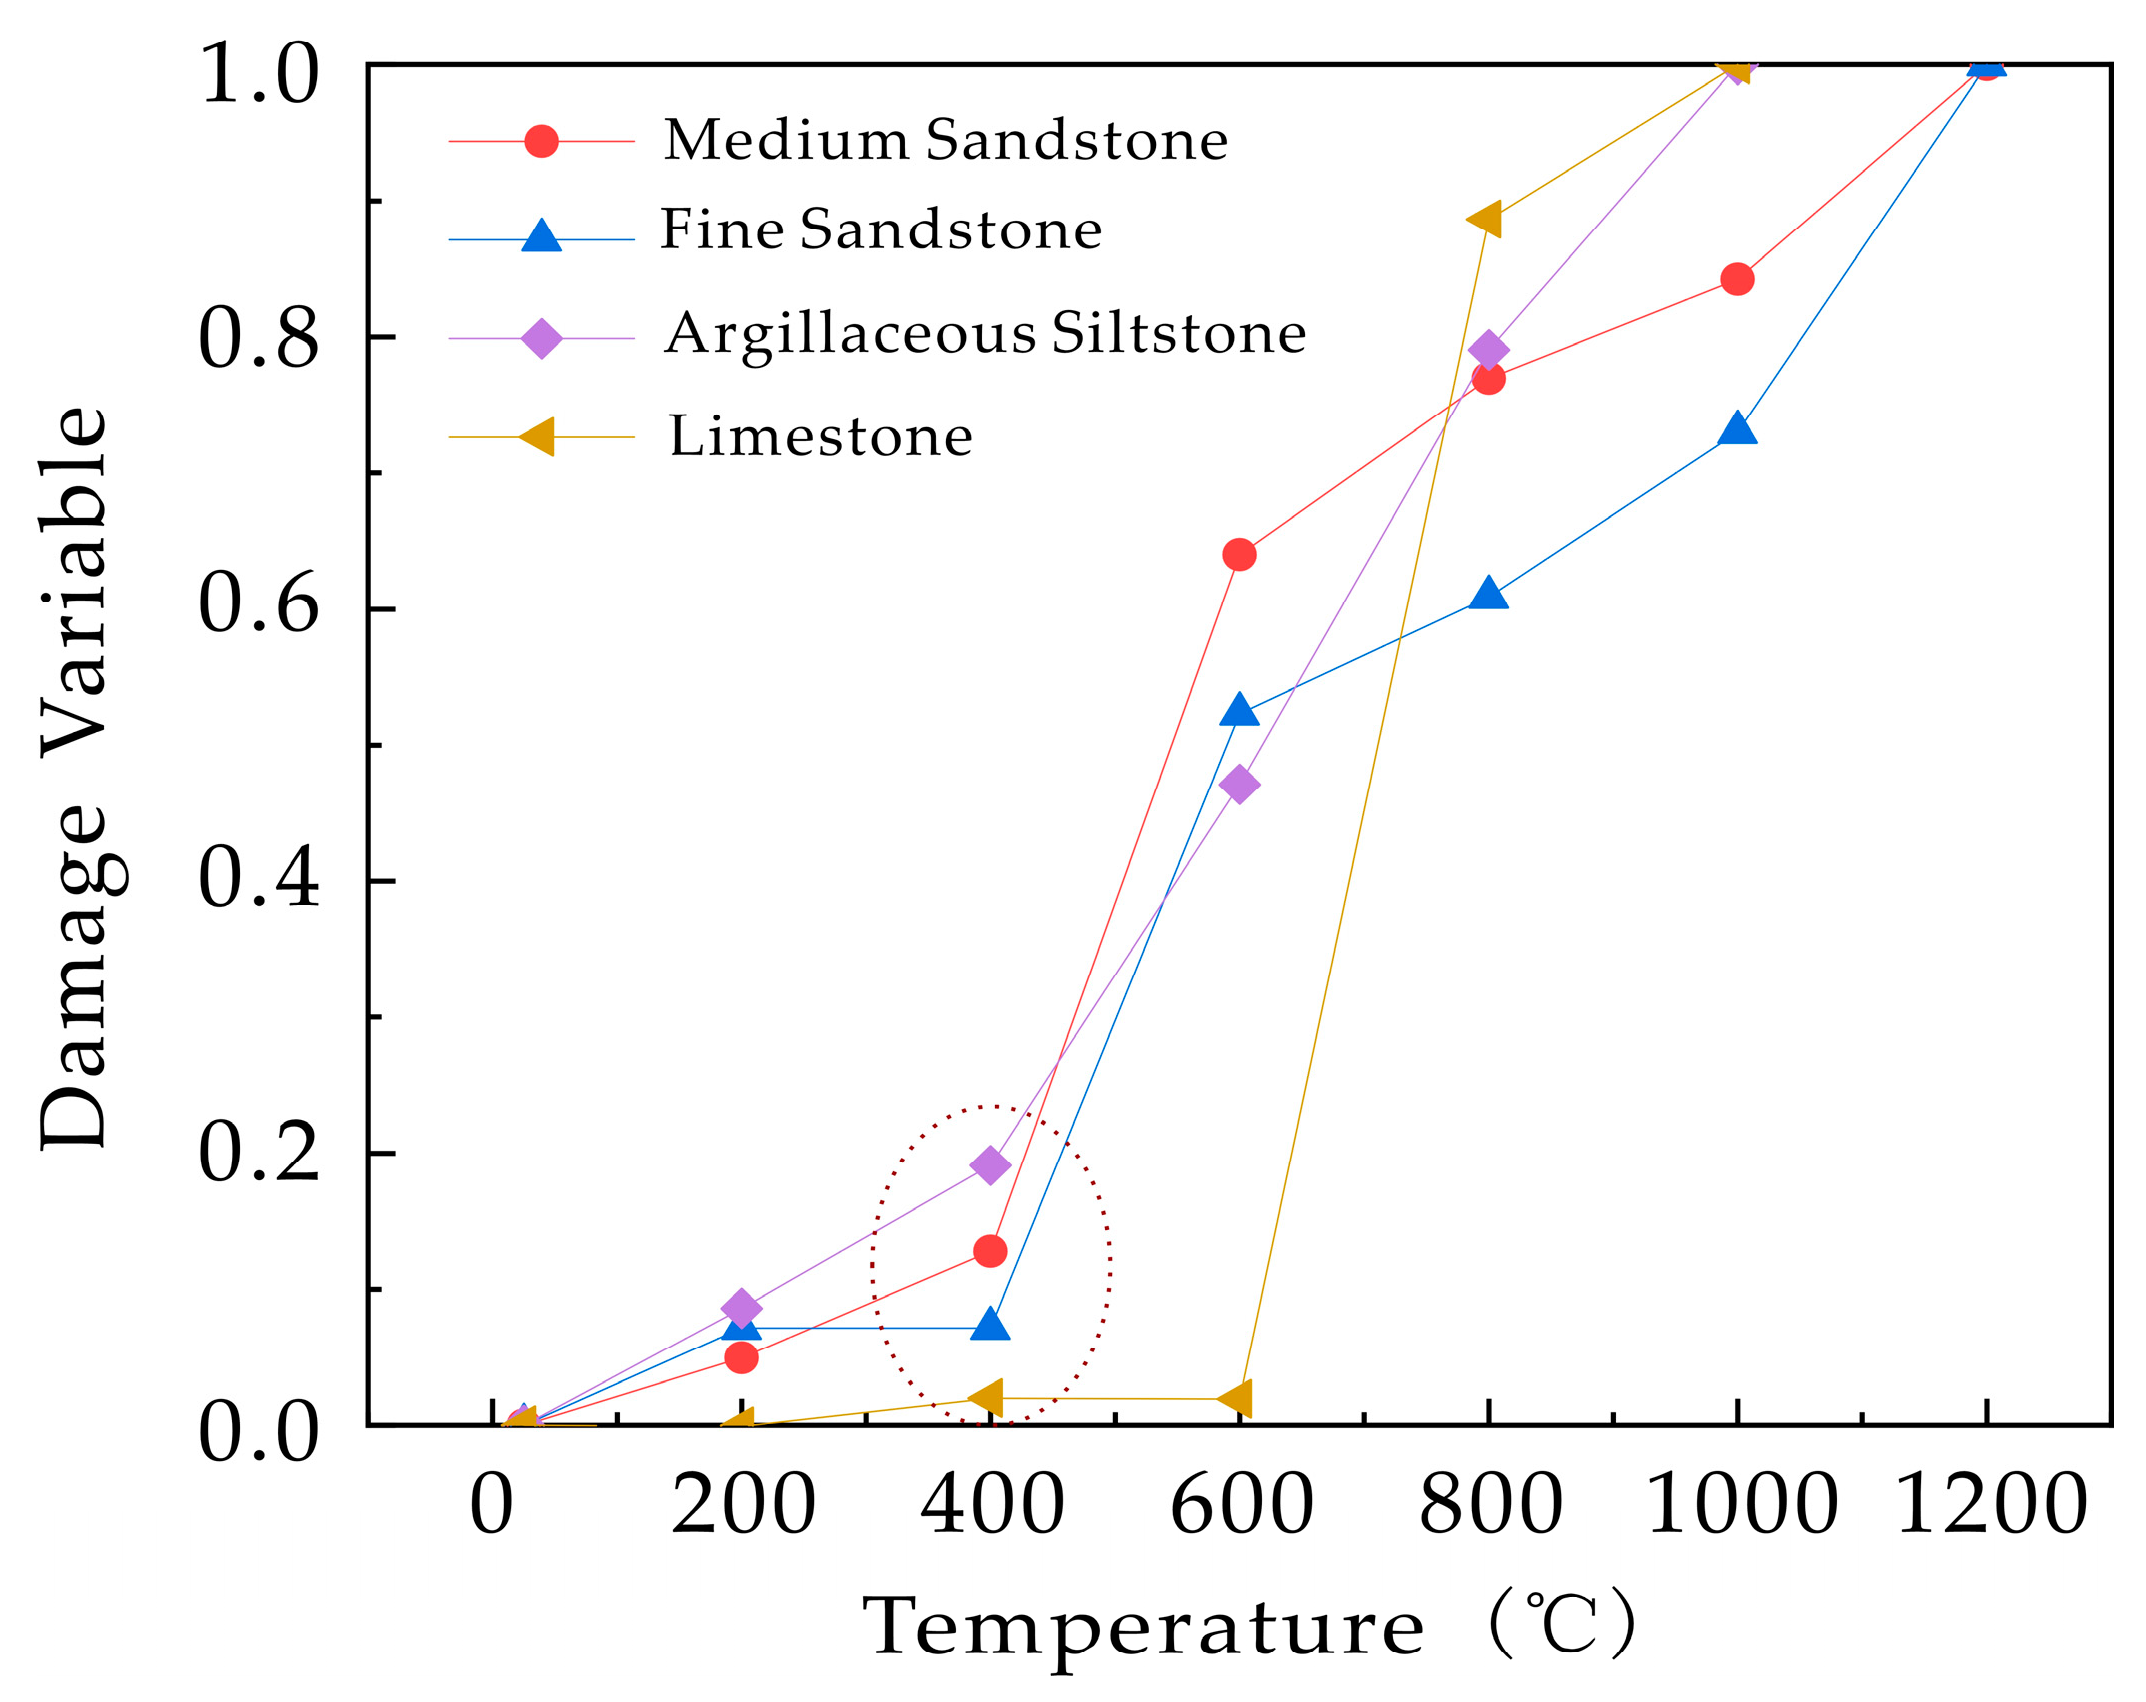
From the thermal damage law of different lithologies with temperature changes (Figure 14 and Table 6), it can be seen that 400 °C is the threshold temperature at which rock thermal damage significantly intensifies. Based on this, the screening condition for the thickness of the coal seam roof/floor is determined as “the thickness of the roof/floor is greater than the corresponding height of the high-temperature damage zone at 400 °C” (Figure 15). It is verified via numerical simulation: with the mudstone roof as the research object, under the heating condition of 650 °C for a duration of 5 years, the development height of the potential high-temperature thermal damage zone corresponding to 400 °C is 10 m. Therefore, during site selection for the in situ pyrolysis of tar-rich coal, the thickness of the roof or the floor should be greater than 10 m, and it is necessary to ensure that no aquifers develop in the roof and floor areas, so as to safeguard the long-term tightness of the pyrolysis zone.
9.
Surface Conditions
From the perspective of multiple dimensions, including ground construction feasibility, safety and environmental protection management, and industrial supporting integration, the surface conditions for the in situ pyrolysis of tar-rich coal need to focus on the following 7 aspects: ① Topographic conditions: Flat to slightly undulating terrain is preferred, as it can reduce the difficulty of ground engineering construction and facilitate construction layout; ② Traffic accessibility: Unobstructed traffic must be ensured to meet the needs of equipment and material transportation as well as personnel access; ③ Electricity supply guarantee: Convenient power supply conditions should be available to provide stable energy support for construction and subsequent operation; ④ Safety protection distance: The distance from residential concentration areas and nature reserves should be >1.6 km to avoid safety accident risks and environmental pollution; ⑤ Coal mine boundary isolation: To prevent interference from mining activities, the distance from abandoned coal mines should be >1.6 km, and the distance from active coal mines should be >3.2 km; ⑥ Policy and environmental protection compatibility: Priority should be given to areas where local policies are supportive and environmental protection requirements are compatible, so as to reduce resistance to project implementation; ⑦ Industrial integration conditions: Areas with convenient access to clean energy such as wind, solar, and electric power are preferred, and proximity to industrial facilities such as coal chemical plants is advantageous, which is conducive to realizing resource recycling and industrial synergy.

3.3.2. Determination of the Classification Rating

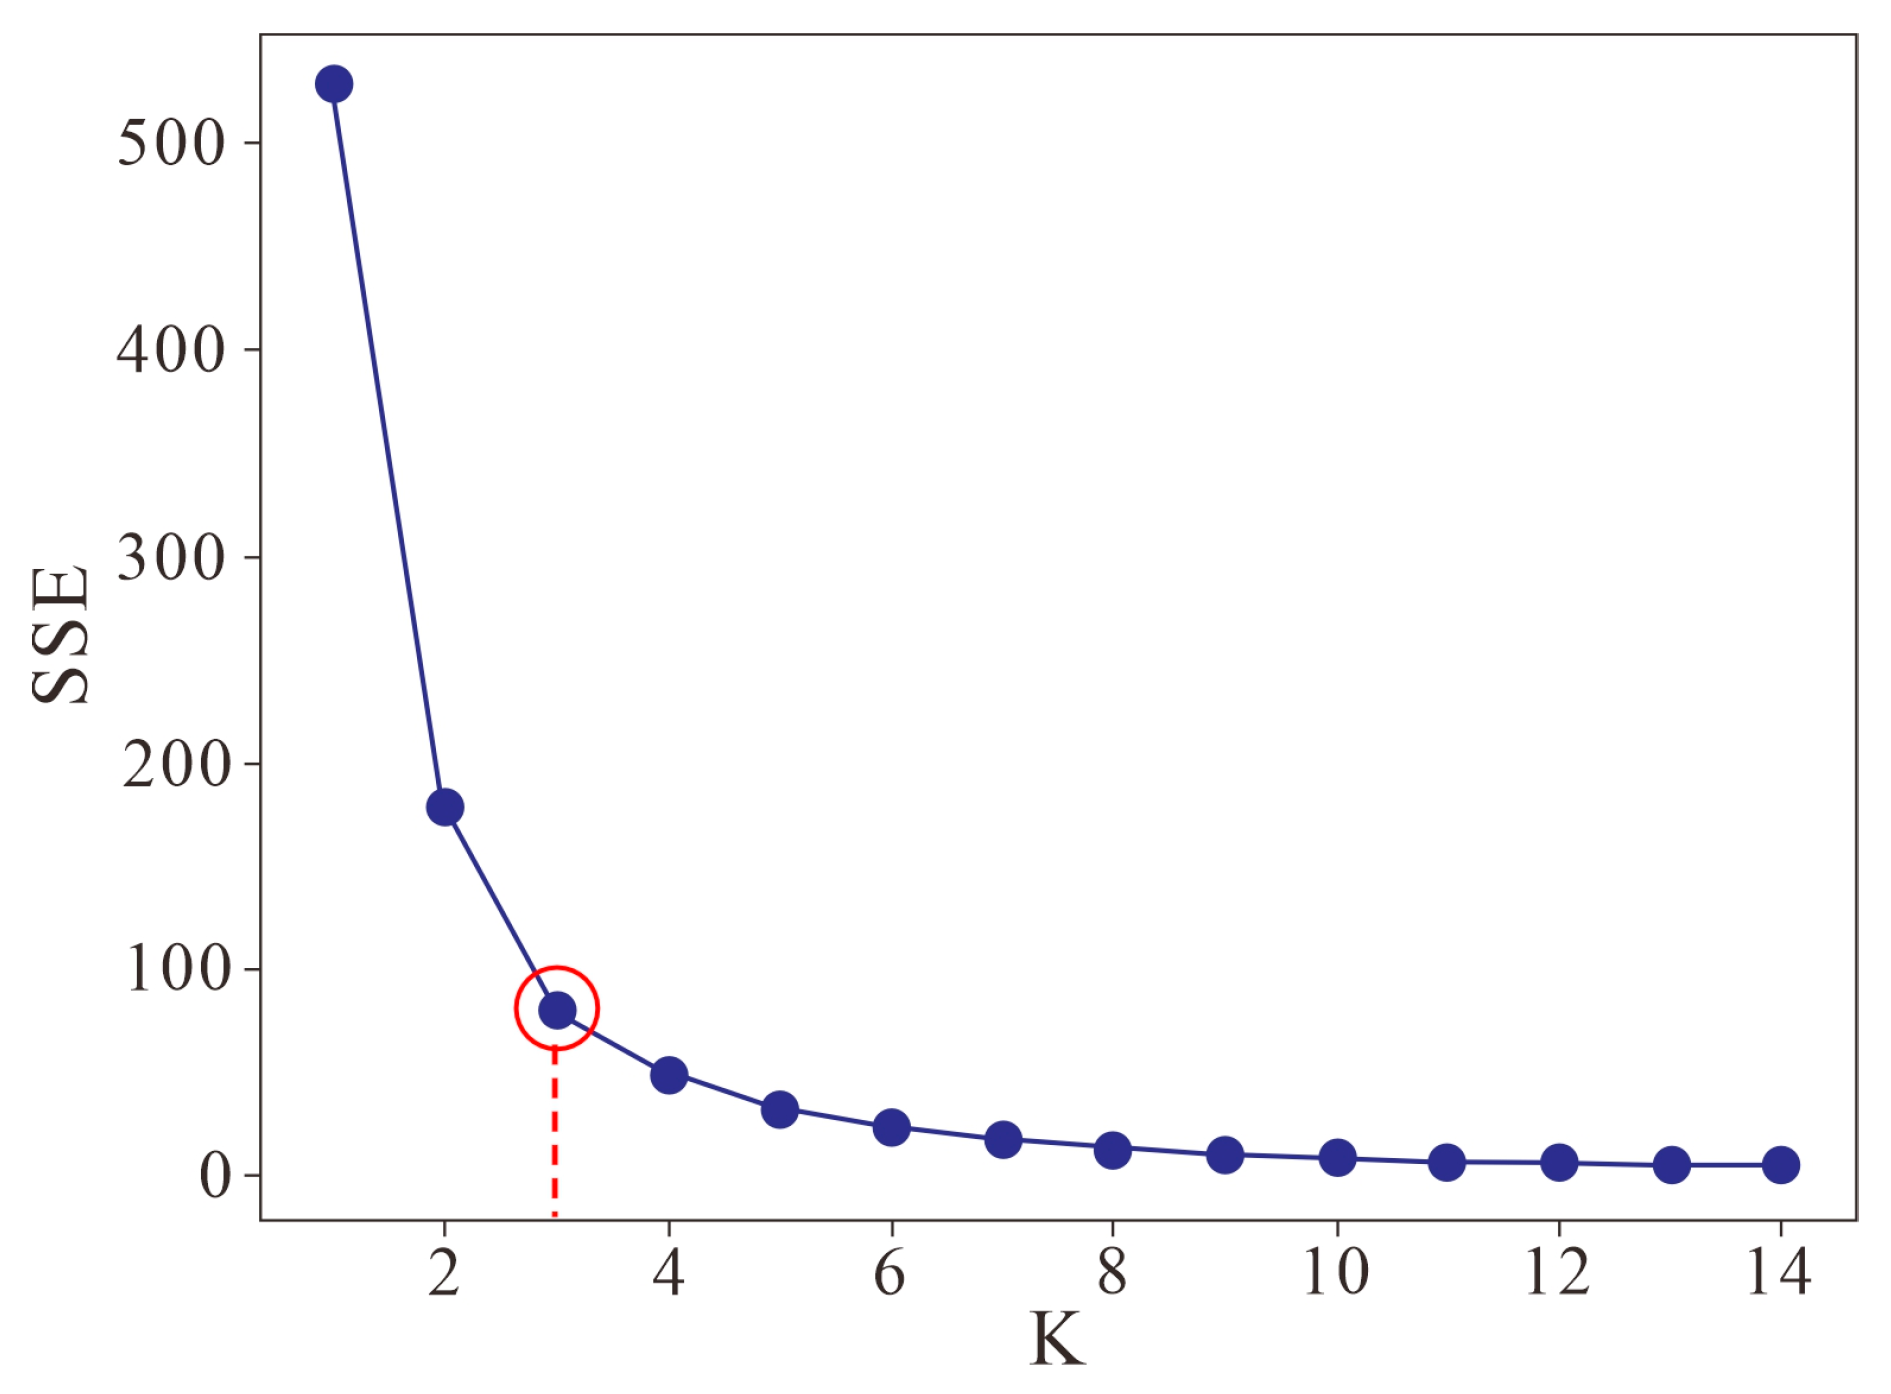
To objectively determine the most rational number of classification grades for the geological target selection evaluation of in situ pyrolysis of tar-rich coal, this study employed the Elbow Method for analysis. This method calculates the Sum of Squared Errors (SSE) corresponding to different preset numbers of clusters (K values) and plots the curve of SSE against K values.
S S E = i = 1 n ( y i y ^ i ) 2
where y i is the true actual observed value; and y ^ i denotes the fitted value.
The elbow point of the SSE curve was distinctly identified at K = 3 (Figure 16). Before this point, the SSE decreased sharply; beyond it, the decline rate slowed significantly. This indicates that dividing the evaluation system into three grades (Grade I, Grade II, and Grade III) ensures a balance between classification discriminability and model complexity avoidance, thereby providing a clear and rational hierarchical framework for subsequent geological target selection.

3.3.3. Establishment of a Geological Evaluation System

It is evident that the in situ pyrolysis of tar-rich coal is influenced by a wide variety of geological factors, with an even greater number of secondary parameters, which poses significant challenges to the systematic analysis of site selection criteria. Therefore, conducting reasonable comprehensive statistical analysis and scientific hierarchical quantification of these geological indicators is not only the foundational work but also the core content of evaluating favorable areas for the in situ pyrolysis of tar-rich coal.
Based on the two core elements of geological conditions and mining conditions, this study constructs an indicator system for site selection of in situ pyrolysis of tar-rich coal, comprising eight first-level indicators—resource scale, coal seam conditions, coal petrology and quality, process performance, structural conditions, hydrogeological conditions, roof and floor conditions, and surface conditions—along with a total of 16 s-level indicators. Using the clustering optimization results derived from the Elbow method, the classification evaluation grades for geological target selection of in situ pyrolysis of tar-rich coal in the study area (Table 7) are further divided into Class I (Excellent), Class II (Moderate), and Class III (Poor). This framework not only provides a comprehensive and systematic analytical basis for subsequent target evaluation but also establishes a data and methodological foundation for standardizing the evaluation process.

3.3.4. Determination of Evaluation Parameter Weights

Based on the established hierarchical evaluation system, the Analytic Hierarchy Process (AHP) was employed to calculate the weights of control factors at various levels, enabling their quantitative prioritization. The relative importance of each evaluation factor concerning the upper-level objective was assessed quantitatively using an expert scoring method. Pairwise comparisons were conducted (Table 8), and the ratio values were used to construct a judgment matrix (Table 9).
Subsequently, the eigenvector and eigenvalue of the judgment matrix were computed. The eigenvector represents the weight coefficients, while the eigenvalue was used to check the consistency of the results. The weight vector was calculated using the Root Method (nth root method): first, the product of the eight elements in each row of the judgment matrix was calculated; then, the 8th root of each product was taken to obtain Xi; finally, normalization was performed by dividing each Xi value by the sum of all eight Xi values, yielding the final weight vector.
This study invited a total of 20 experts from institutions including the School of Energy Sciences at China University of Geosciences (Beijing), China University of Mining and Technology, Xinjiang University, Northeast Petroleum University, the National Energy Administration, and PetroChina to participate in the weighting evaluation. The experts’ professional backgrounds cover fields such as geology, reservoir engineering, and general engineering, with research directions including coal underground gasification, oil and gas field development, unconventional oil and gas exploration, and new energy. During the opinion collection process, a combination of on-site meetings and questionnaire surveys was used to invite experts to evaluate the importance of various geological indicators.
The weight coefficients for both the primary and secondary indicator layers in the geological target selection evaluation for in situ pyrolysis of tar-rich coal were calculated using the Analytic Hierarchy Process (AHP). The consistency index (CI) was 0.0377, and the consistency ratio (CR) was 0.0268. Since CR < 0.10, the judgment matrix satisfied the consistency check, indicating acceptable reliability of the weighting results. The comprehensive weight of each secondary factor was obtained by multiplying its weight within the secondary layer by the weight of its corresponding primary indicator (Table 10).
The results demonstrate that the order of primary controlling factors affecting the geological target selection for in situ pyrolysis of tar-rich coal, ranked by their weight coefficients from high to low, is as follows: Resource Scale > Coal Seam Conditions > Structural Conditions > Roof & Floor Properties > Lithotype and Coal quality > Processability > Hydrologic condition > Surface Conditions.

4. Results and Discussion

4.1. Division of Geological Assessment Units

This study adopts the following principles for block division:
First, tar-rich coal is widely developed in the study area, and its tar yield mostly reaches over 7%. Thus, tar yield is not adopted as the division principle in the Sangtanghu Basin.
Second, clarify the designated areas for coal mining rights and exploration rights to ensure the selected blocks are within the mining rights area of PetroChina, as shown in Figure 17.
Third, fault zones are excluded, with the coal seam burial depth ranging from 800–1000 m and coal seam thickness greater than 10 m used as the criteria for defining block boundaries.
As shown in Figure 18, the main coal seam of the Badaowan Formation is divided into 7 blocks. Based on the well-logging interpretation curves and core analysis data from nine wells (H2, TC2, HD1, T1, T21, T2, T13, TYC1, and TYC2), a quantitative evaluation of the geological assessment indicators for the aforementioned seven blocks was conducted by integrating the fuzzy mathematics comprehensive evaluation method. The objective of this analysis is to identify favorable target areas for the in situ pyrolysis of tar-rich coal.

4.2. Membership Function for Geological Index

Fuzzy comprehensive evaluation (FCE), grounded in fuzzy mathematics, is a method for quantitatively evaluating objects subject to multiple constraints. It calculates the membership degree of each evaluation grade and ultimately determines the overall evaluation grade for each object [56]. The membership degree is primarily determined by a membership function, which can be categorized into linear and nonlinear types. Common membership function curves include trapezoidal, matrix, k-parabolic, Gamma (Γ), normal, and Cauchy types [57]. This study employs the trapezoidal membership function. According to the influence characteristics of each type of second-class geological index on the in situ pyrolysis of tar-rich coal in the study area, they are classified into three types, cost type, intermediate type and benefit type, as shown in Figure 19.
This study employs three evaluation categories: favorable area, moderately favorable area, and unfavorable area. Each type of indicator corresponds to three membership functions, as detailed in Table 11.
Based on the membership function A ( x ) and fuzzy grade division values (denoted as u 1 , u 2 , and u 3 , respectively), the membership degrees corresponding to the three grades can be calculated separately. There are 16 secondary evaluation indicators in the study area, and fuzzy grade division is adopted for value assignment.
Ten of these secondary indicators are numerical indicators, including coal resource quantity, coal seam depth, coal seam thickness, coal seam dip angle, coal seam moisture content, tar yield, caking index, distance to faults, roof and floor thickness, and distance to coal mines, residential areas, and protected areas. These numerical indicators are assigned values according to their original units.
The remaining six secondary indicators are descriptive indicators, namely gangue layer, coal seam stability, coal rank and type, groundwater flow system, roof and floor lithology, topographic conditions, and integration conditions of water-electricity supply and chemical industry. These descriptive indicators are first quantified using a 100-point scale before value assignment, and then converted into benefit-type or cost-type membership functions based on their indicator properties [58].
Combined with the weight coefficient table of evaluation factors, a fuzzy hierarchical comprehensive system (Table 12) is established, with the controlling factors for the geological site selection of in situ pyrolysis of tar-rich coal as the target layer.

4.3. Optimization Results of Favorable Target Areas

After the classification thresholds were determined, the membership degrees for the three grades (i.e., favorable, moderate, and unfavorable) were calculated using the corresponding membership functions, thereby constructing the indicator judgment matrix R (Table 13). The weight matrix W was then multiplied by the judgment matrix R to obtain the comprehensive evaluation result B ( i . e . , B = W × R ) . Finally, based on the principle of maximum membership degree, the grade corresponding to the highest value in the resulting vector B was assigned as the final evaluation level for each development unit. The detailed results are presented in Table 14.

4.3.1. Class I: Preferred Target Area

Block Tiao-IV demonstrates a significantly higher membership degree for the favorable zone (0.693) compared to other blocks, exceeding its own membership degree for the moderately favorable zone, while its membership degree for the unfavorable zone (0.04) is lower than the regional average. Key parameters such as coal seam thickness, burial depth, and oil content have been reliably confirmed through existing drilling data. The immediate roof and floor of the coal seam consist of an approximately 20-m-thick stable mudstone layer with excellent impermeability and mechanical stability, effectively reducing the risks of water inrush and formation deformation during development.
The block contains substantial coal resources of 7.69 × 10⁸ tonnes at a burial depth of 1200 m, indicating favorable economic potential. A safe distance of over 2 km from major faults ensures enhanced engineering safety. Furthermore, its proximity to existing coal chemical plants and wind power facilities allows for the integration of clean wind energy with the coal chemical industry, providing reliable energy supply and industrial synergy for the pilot test. Therefore, Block Tiao-IV is recommended as the preferred pilot test area. Furthermore, this study compares the Tiao IV Block with the in situ pyrolysis block of tar-rich coal in northern Shaanxi, China [51]. The northern Shaanxi Block is the first pilot test of underground in situ pyrolysis of tar-rich coal at home and abroad, and it is the only successful case that can be used for reference. The comparison shows that, in terms of coal composition and hydrocarbon generation potential, the coal in the Tiao IV Block of the Santanghu Basin in Xinjiang has a higher volatile content and a more favorable proportion of oil-generating parent materials such as vitrinite and exinite, and its tar yield and TOC (Total Organic Carbon) are significantly higher than those of the northern Shaanxi Block. Thus, it has more prominent in situ pyrolysis hydrocarbon generation potential for tar-rich coal. In terms of process feasibility, due to the greater burial depth of the Tiao IV Block, its porosity and permeability are slightly reduced, but this problem can be solved by optimizing drilling technology and fracturing technology (Table 15).
In conclusion, the Tiao IV Block in the Santanghu Basin, Xinjiang, possesses excellent potential for conducting pilot tests on in situ pyrolysis of tar-rich coal. This not only verifies the development value of the block itself but also proves the scientific validity of the geological target selection method and evaluation system proposed in this study, which can provide a reliable technical reference for the selection of tar-rich coal development areas in similar regions.

4.3.2. Class II: Alternative Target Areas

The membership degrees of the favorable area for Blocks Tiao-I, Tiao-II, and Tiao-III are all greater than 0.55. Among them, Block Tiao-II has a relatively higher membership degree of the unfavorable area, mainly due to its relatively weak coal resource reserves, which limits the potential for sustainable resource development.
Meanwhile, the immediate roof and floor of the coal seams in these blocks are composed of tight sandstone or weakly water-bearing sandstone, where the irreducible water saturation in the rock layers is relatively high. This exerts a certain inhibitory effect on pyrolysis efficiency. Considering the resource conditions and development feasibility comprehensively, these three blocks are designated as alternative areas for in situ pyrolysis of tar-rich coal.

4.3.3. Class III Areas Pending Verification

The membership degrees of the favorable area for Blocks Han-I and Han-III are at a low level, with two key shortcomings.
First, the number of drilled exploration wells in these blocks is insufficient, resulting in a lack of systematic geological data support. Basic parameters such as coal seam occurrence characteristics and resource endowment have not been fully identified, which increases the risk of development.
Second, these blocks are located in areas with weak energy infrastructure, and the convenience of electricity supply is poor, making it difficult to meet the continuous and stable high-power electricity demand during in situ pyrolysis development.
Based on the current conditions, these two blocks are temporarily designated as to-be-verified areas for in situ pyrolysis. Further assessment of development potential can only be conducted after supplementary drilling projects are implemented to improve geological data and power supply conditions are optimized in conjunction with regional energy planning.

5. Conclusions

(1)
This study systematically analyzed the main controlling factors for the geological site selection of in situ pyrolysis of tar-rich coal. Taking “geological conditions—mining conditions” as the core framework, an 8-unit evaluation system was constructed, covering resource scale, coal seam conditions, coal petrology and quality, process performance, structural conditions, hydrogeological conditions, roof–floor conditions, and surface conditions, with 16 supporting evaluation parameters, thus forming a hierarchical comprehensive evaluation system. Combined with numerical simulation and core experimental data, the quantitative division thresholds of each parameter for Class I, Class II, and Class III sites were clarified. Finally, a practically guiding evaluation standard system for the geological site selection of in situ pyrolysis of tar-rich coal was established, providing a theoretical basis and technical support for the optimization of regional development target areas.
(2)
To ensure the objectivity and accuracy of evaluation results, this study adopted the fuzzy comprehensive evaluation method as the core mathematical evaluation approach and used the combined weighting method to determine weights, thereby calculating the subjective weights of first-level and second-level geological indicators. For 10 numerical second-level indicators (e.g., coal seam thickness, dip angle, and burial depth), values were directly assigned based on their original units; for 6 descriptive second-level indicators (e.g., coal seam stability, coal rank and type, and roof–floor lithology), values were assigned after quantification via a 100-point scale. Combined with the weight coefficient table of geological condition evaluation factors, a multi-level fuzzy evaluation index system was built, realizing the quantification and standardization of the evaluation process.
(3)
By integrating the results of quantitative evaluation and qualitative classification, a general process for optimizing favorable areas for in situ pyrolysis of tar-rich coal was proposed, which enables priority ranking and comprehensive classification of site selection results: Block Tiao-IV was recommended as the preferred field test area, Blocks Tiao-I, Tiao-II, and Tiao-III as alternative areas, and Blocks Han-I and Han-III as to-be-verified areas. Thus, a complete technical system for optimizing favorable areas for in situ pyrolysis of tar-rich coal was formed, providing a referable technical process for the selection of development target areas in similar coal mining areas.

Author Contributions

M.Z.: methodology, investigation, data curation, writing—original draft, writing—review and editing, and visualization. Z.D.: conceptualization, methodology, validation, formal analysis, investigation, resources, data curation, writing—review and editing. Y.C.: supervision, project administration, and funding acquisition. Y.Z.: visualization, software, and investigation experiment. X.W.: visualization, software, and funding acquisition. Z.C.: investigation, resources, data curation, and Formal analysis. J.X.: investigation. H.C.: software. All authors have read and agreed to the published version of the manuscript.

Funding

This research was funded by CNPC Youth Science and Technology Program (Grant Number: 2024DQ03221), Strategic Research and Consulting Project of CNPC science and technology committee (Grant Number: 2025DQ0728), RIPED Basic Research Program (Grant Number: 101001cq0b52394) and In Situ Pyrolysis of Deep Coal-Measure Hydrocarbons in Santanghu: Key Technology Development and Field Trial (Grant Number: 2025ZS61).

Data Availability Statement

The original contributions presented in the study are included in the article; further inquiries can be directed to the corresponding author.

Conflicts of Interest

The authors Mengyuan Zhang, Zhen Dong, Yanpeng Chen, Yufeng Zhao, Junjie Xue and Hao Chen were employed by the PetroChina Research Institute of Petroleum Exploration & Development. The authors Xinggang Wang and Zhixiong Cao were employed by the PetroChina Tuha Oilfield Company. The remaining authors declare that the research was conducted in the absence of any commercial or financial relationships that could be construed as potential conflicts of interest.

References

  1. Chen, M.; Wang, C.A.; Yuan, T.; Ning, X.; Huang, X.; Deng, L.; Che, D. Experimental investigation on gas-liquid–solid tri-phase product distributions during the simulated in-situ pyrolysis of tar-rich coal. Fuel 2025, 381, 133465. [Google Scholar] [CrossRef]
  2. Zhang, H.R.; Li, S.; Kelly, K.E.; Eddings, E.G. Underground in situ coal thermal treatment for synthetic fuels production. Prog. Energy Combust. Sci. 2017, 62, 1–32. [Google Scholar] [CrossRef]
  3. Kelly, K.E.; Wang, D.; Hradisky, M.; Silcox, G.D.; Smith, P.J.; Eddings, E.G.; Pershing, D.W. Underground coal thermal treatment as a potential low-carbon energy source. Fuel Process. Technol. 2016, 144, 8–19. [Google Scholar] [CrossRef]
  4. Skrzypkowski, K.; Zagórski, K.; Zagórska, A. Determination of the Extent of the Rock Destruction Zones around a Gasification Channel on the Basis of Strength Tests of Sandstone and Claystone Samples Heated at High Temperatures up to 1200 °C and Exposed to Water. Energies 2021, 14, 6464. [Google Scholar] [CrossRef]
  5. Ju, Y.; Zhu, Y.; Zhou, H.; Ge, S.; Xie, H. Microwave pyrolysis and its applications to the in situ recovery and conversion of oil from tar-rich coal: An overview on fundamentals, methods, and challenges. Energy Rep. 2021, 7, 523–536. [Google Scholar] [CrossRef]
  6. Wang, Z.; Yang, F.; Fu, D.; Ma, L.; Duan, Z.; Wang, Q.; Kang, S.; Guo, W. Economic and heating efficiency analysis of double-shell downhole electric heater for tar-rich coal in-situ conversion. Case Stud. Therm. Eng. 2023, 41, 102596. [Google Scholar] [CrossRef]
  7. Quan, F.; Lu, W.; Song, Y.; Sheng, W.; Qin, Z.; Luo, H. Multifractal Characterization of Heterogeneous Pore Water Redistribution and Its Influence on Permeability During Depletion: Insights from Centrifugal NMR Analysis. Fractal Fract. 2025, 9, 536. [Google Scholar] [CrossRef]
  8. Quan, F.; Lu, W.; Song, Y.; Wei, C.; Ma, J. Direct Quantification of Coal Pore Dynamics during Methane Depletion via Low-Field Nuclear Magnetic Resonance. Energ. Fuel 2025, 39, 12538–12550. [Google Scholar] [CrossRef]
  9. Jing, G.; Gao, X.; Feng, S.; Li, X.; Wang, W.; Zhang, T.; Li, C. Geological Evaluation of In-Situ Pyrolysis Development of Oil-Rich Coal in Tiaohu Mining Area, Santanghu Basin, Xinjiang, China. Energies 2025, 18, 4034. [Google Scholar] [CrossRef]
  10. Wang, Z.; Tang, H.; Hou, Y.; Shi, H.; Li, J.; Yang, T.; Feng, Y.; Meng, W. Quantitative evaluation of unconsolidated sandstone heavy oil reservoirs based on machine learning. Geol. J. 2023, 58, 2321–2341. [Google Scholar] [CrossRef]
  11. Wang, Z.; Tang, H.; Cai, H.; Hou, Y.; Shi, H.; Li, J.; Yang, T.; Feng, Y. Production prediction and main controlling factors in a highly heterogeneous sandstone reservoir: Analysis on the basis of machine learning. Energy Sci. Eng. 2022, 10, 4674–4693. [Google Scholar] [CrossRef]
  12. Wang, Z.; Tang, H.; Yang, J.; Huang, L. Reservoir Pore Characteristics Based on Depositional Microfacies Control in the Neogene Guantao Formation, Bohai Bay Basin, China. Energies 2022, 15, 2870. [Google Scholar] [CrossRef]
  13. Li, M.; Wang, H.; Wang, D.; Shao, Z.; He, S. Risk assessment of gas explosion in coal mines based on fuzzy AHP and bayesian network. Process Saf. Environ. Prot. 2020, 135, 207–218. [Google Scholar] [CrossRef]
  14. Paraskevis, N.; Roumpos, C.; Stathopoulos, N.; Adam, A. Spatial analysis and evaluation of a coal deposit by coupling AHP & GIS techniques. Int. J. Min. Sci. Technol. 2019, 29, 943–953. [Google Scholar] [CrossRef]
  15. Chun, Y.; Zhang, J.; Han, Y. Green development level assessment and obstacle analysis of China’s coal-resource-based regions. Heliyon 2023, 9, e22495. [Google Scholar] [CrossRef]
  16. Moharir, K.N.; Pande, C.B.; Gautam, V.K.; Singh, S.K.; Rane, N.L. Integration of hydrogeological data, GIS and AHP techniques applied to delineate groundwater potential zones in sandstone, limestone and shales rocks of the Damoh district, (MP) central India. Environ. Res. 2023, 228, 115832. [Google Scholar] [CrossRef]
  17. Xiang, W.; Sang, S.; Han, S.; Liu, S.; Zhou, X.; Wang, D. Assessment of CO2 geological sequestration potential in the Northern Jiangsu-Southern yellow Sea Basin via AHP-CRITIC methodology. Int. J. Greenh. Gas Control. 2025, 142, 104321. [Google Scholar] [CrossRef]
  18. Naseer, Z.; Ehsan, M.; Ali, M.; Amjad, M.R.; Latif, M.A.U.; Abdelrahman, K. Lithofacies and sandstone reservoir characterization for geothermal assessment through artificial intelligence. Results Eng. 2025, 26, 105173. [Google Scholar] [CrossRef]
  19. Wang, Z.; Yin, H.; Tang, H.; Hou, Y.; Yu, H.; Liu, Q.; Tang, H.; Jia, T. Damage Evaluation of Unconsolidated Sandstone Particle Migration Reservoir Based on Well–Seismic Combination. Processes 2024, 12, 2009. [Google Scholar] [CrossRef]
  20. Wu, B.; Xie, R.; Xiao, L.; Guo, J.; Jin, G.; Fu, J. Integrated classification method of tight sandstone reservoir based on principal component analysis– simulated annealing genetic algorithm–fuzzy cluster means. Petrol. Sci. 2023, 20, 2747–2758. [Google Scholar] [CrossRef]
  21. Ali, N.; Chen, J.; Fu, X.; Hussain, W.; Ali, M.; Iqbal, S.M.; Anees, A.; Hussain, M.; Rashid, M.; Thanh, H.V. Classification of reservoir quality using unsupervised machine learning and cluster analysis: Example from Kadanwari gas field, SE Pakistan. Geosyst. Geoenviron. 2023, 2, 100123. [Google Scholar] [CrossRef]
  22. Baouche, R.; Nabawy, B.S. Permeability prediction in argillaceous sandstone reservoirs using fuzzy logic analysis: A case study of triassic sequences, Southern Hassi R’Mel Gas Field, Algeria. J. Afr. Earth Sci. 2021, 173, 104049. [Google Scholar] [CrossRef]
  23. Ren, Q.; Zhang, H.; Zhang, D.; Zhao, X. Lithology identification using principal component analysis and particle swarm optimization fuzzy decision tree. J. Petrol. Sci. Eng. 2023, 220, 111233. [Google Scholar] [CrossRef]
  24. ARTUN, E.; KULGA, B. Selection of candidate wells for re-fracturing in tight gas sand reservoirs using fuzzy inference. Pet. Explor. Dev. 2020, 47, 413–420. [Google Scholar] [CrossRef]
  25. Yu, M.; Gao, G.; Liu, M.; Liang, H.; Kang, J.; Xu, X.; Zhao, X. Sedimentary environment shift and organic matter enrichment mechanism in response to volcanic ash influence: A case study of the Permian Lucaogou Formation, Santanghu Basin, NW China. J. Palaeogeogr. 2024, 13, 793–822. [Google Scholar] [CrossRef]
  26. Liang, H.; Li, X.; Ma, Q.; Liang, H.; Luo, Q.; Chen, X.; Bai, G.; Zhang, Q.; Meng, Y. Geological features and exploration potential of Permian Tiaohu Formation tight oil, Santanghu Basin, NW China. Pet. Explor. Dev. 2014, 41, 616–627. [Google Scholar] [CrossRef]
  27. Lei, X.; Sun, P.; Wang, J.; Dang, H.; Tian, X.; Luan, Z.; Wang, Z. Origin and provenance of Lower Jurassic clastic rocks in the Badaowan Formation, Dachanggou Basin, Northern Xinjiang, China: Constraints on Early Jurassic weathering and depositional processes. Palaeogeogr. Palaeoclimatol. Palaeoecol. 2025, 679, 113293. [Google Scholar] [CrossRef]
  28. Zhang, L.; Yan, D.; Yang, S.; Li, B.; Fu, H.; Wang, G.; Yang, X.; Zhang, B.; Liang, W.; Zhang, J. Evolution of the Middle Jurassic paleoclimate: Sedimentary evidence from coal-bearing strata in the Santanghu Basin, NW China. J. Asian Earth Sci. 2023, 242, 105495. [Google Scholar] [CrossRef]
  29. Shi, Q.; Geng, X.; Wang, S.; Cai, Y.; Zhao, H.; Ji, R.; Xing, L.; Miao, X. Tar yield prediction of tar-rich coal based on geophysical logging data: Comparison between semi-supervised and supervised learning. Comput. Geosci. 2025, 196, 105848. [Google Scholar] [CrossRef]
  30. GB/T 6948-2008; Determination of Vitrinite Reflectance of Coal by Microscope. General Administration of Quality Supervision, Inspection and Quarantine of the People’s Republic of China (AQSIQ) and Standardization Administration of the People’s Republic of China (SAC): Beijing, China, 2008.
  31. Lupoi, J.S.; Fritz, L.P.; Hackley, P.C.; Solotky, L.; Weislogel, A.; Schlaegle, S. Quantitative evaluation of vitrinite reflectance and atomic O/C in coal using Raman spectroscopy and multivariate analysis. Fuel 2018, 230, 1–8. [Google Scholar] [CrossRef]
  32. GB/T 212-2008; Proximate Analysis of Coal. General Administration of Quality Supervision, Inspection and Quarantine of the People’s Republic of China (AQSIQ) and Standardization Administration of the People’s Republic of China (SAC): Beijing, China, 2008.
  33. Li, Y.; Li, X.; Zhang, Y.; Deng, J.; Zhang, Y.; Guo, Q.; Zhang, X.; Li, H. Influences of surface active-groups on the exothermic properties and oxidation of coal molecules. Case Stud. Therm. Eng. 2024, 63, 105367. [Google Scholar] [CrossRef]
  34. GB/T 480-2000; Low-Temperature Carbonization Test of Coal by Aluminum Retort. General Administration of Quality Supervision, Inspection and Quarantine of the People’s Republic of China (AQSIQ) and Standardization Administration of the People’s Republic of China (SAC): Beijing, China, 2000.
  35. Zhao, J.; Shi, Q.; Wang, S.; Mi, Y.; Zhao, H.; Ji, R.; Cui, S. Study on molecular structural heterogeneity of tar-rich coal based on micro-FTIR. Spectrochim. Acta A 2025, 330, 125749. [Google Scholar] [CrossRef] [PubMed]
  36. GB/T 5447-2014; Determination of Caking Index of Bituminous Coal. General Administration of Quality Supervision, Inspection and Quarantine of the People’s Republic of China (AQSIQ) and Standardization Administration of the People’s Republic of China (SAC): Beijing, China, 2014.
  37. Kumar, D.; Kumar, D. Chapter 3-Evaluation of Coking Coal Resources and Reserves. In Management of Coking Coal Resources; Kumar, D., Kumar, D., Eds.; Elsevier: Amsterdam, The Netherlands, 2016; pp. 61–112. [Google Scholar]
  38. Dong, G.; Zhu, C.; Li, J.; Xu, S.; Guo, W. Numerical simulation on development effect of tar-rich coal through in-situ conversion by convective heating in Huangling Mining Area. Meitiandizhi Yu Kantan/Coal Geol. Explor. 2023, 51, 57–67. [Google Scholar] [CrossRef]
  39. Yang, F.; Cheng, X.; Li, M.; Wu, Z.; Wei, J.; Cao, H. Numerical simulations of the evolutionary patterns of multi-physical fields during the in-situ pyrolysis of tar-rich coals. Meitiandizhi Yu Kantan/Coal Geol. Explor. 2024, 52, 25–34. [Google Scholar] [CrossRef]
  40. Dong, Z.; Chen, Y.; Zhang, M.; Wang, X.; Jiao, L.; Feng, S.; Ren, B.; Chen, H.; Xue, J.; Zhao, Y.; et al. Production capacity prediction of U-shaped horizontal wells for in-situ pyrolysis of tar-rich coal: Experimental and numerical simulation study. Meitan Xuebao/J. China Coal Soc. 2025, 50, 1168–1184. [Google Scholar] [CrossRef]
  41. Sun, W.; Fish, J. Coupling of non-ordinary state-based peridynamics and finite element method for fracture propagation in saturated porous media. Int. J. Numer. Anal. Methods Geomech. 2021, 45, 1260–1281. [Google Scholar] [CrossRef]
  42. Yang, F.; Cheng, X.; Li, M.; Wei, J.; Duan, Z.; Ma, L. Numerical Investigation of the Heat and Mass Transfer during the In Situ Pyrolysis Process of Oil-Rich Coal. Processes 2023, 11, 3226. [Google Scholar] [CrossRef]
  43. Ye, Q.; Li, M.; Hao, J.; Huang, Z.; Wei, J. Multi-Physics Simulation of Tar-Rich Coal In Situ Pyrolysis with a Multiregion Homogenization Treatment. Acs Omega 2023, 8, 32565–32579. [Google Scholar] [CrossRef] [PubMed]
  44. Akbarzadeh Kasani, H.; Chalaturnyk, R. Influence of High Pressure and Temperature on the Mechanical Behavior and Permeability of a Fractured Coal. Energies 2017, 10, 854. [Google Scholar] [CrossRef]
  45. Xie, S.; Zhou, H.; Jia, W.; Gu, Y.; Zhao, W.; Zhao, J.; Chen, W. Modeling Approaches to Permeability of Coal Based on a Variable-Order Fractional Derivative. Energ. Fuel 2023, 37, 5805–5813. [Google Scholar] [CrossRef]
  46. Liu, X.P. Study on High Temperature Burnt Surrounding Rock Movement and Failure Mechanism in UCG. Ph.D. Thesis, China University of Mining and Technology, Xuzhou, China, 2019. [Google Scholar]
  47. Tian, H.; Li, N.; Wang, S.; Wu, H.; Feng, Z.; Wang, K.; Wang, G. A log-based method for evaluating the tar yield of tar-rich coal. Meitiandizhi Yu Kantan/Coal Geol. Explor. 2024, 52, 97–107. [Google Scholar] [CrossRef]
  48. Wang, M.; Wang, C.; Ning, X.; Chen, M.; Huang, X.; Xue, X.; Mao, Q.; Deng, L.; Che, D. Research progress of in-situ pyrolysis technology for tar-rich coal. Meitan Xuebao/J. China Coal Soc. 2024, 49, 3969–3984. [Google Scholar] [CrossRef]
  49. Dong, Z.; Chen, Y.; Xu, H.; Zhao, Y.; Ren, B.; Chen, H.; Wang, F. Thermal deformation and failure mechanism of surrounding rock in underground gasification cavity of medium-deep coal. Yanshilixue Yu Gongcheng Xuebao/Chin. J. Rock. Mech. Eng. 2025, 44, 74–88. [Google Scholar]
  50. Zhi, D.; Li, J.; Zhou, Z.; Jiao, L.; Fan, T.; Li, B.; Liang, H.; Wang, X. New fields, new types and resource potentials of oil-gas exploration and development in Santanghu Basin. Shiyou Xuebao/Acta Pet. Sin. 2024, 45, 115–132. [Google Scholar] [CrossRef]
  51. Duan, Z.; Yang, F.; Wang, Z.; Ma, L.; Duan, X.; Cao, H.; Chen, L. Pilot experiment for underground in-situ pyrolysis of tar-rich coal in the northern Shaanxi Province. Meitiandizhi Yu Kantan/Coal Geol. Explor. 2024, 52, 14–24. [Google Scholar] [CrossRef]
  52. Li, M.; Cheng, X.; Hao, J.; Lu, Z.; Wei, J. Experimental and numerical investigation on the heat and mass transfer performance of tar rich coal in-situ pyrolysis. Int. J. Heat Fluid Flow 2024, 107, 109412. [Google Scholar] [CrossRef]
  53. Shi, Q.; Zhao, B.; Wang, S.; Li, X.; Li, C.; Han, B.; Mi, Y.; He, Y.; Cai, Y.; Zhang, Z.; et al. Characteristics and sedimentary environment control of Jurassic tar-rich coal in Santanghu Basin. Shiyou Xuebao/Acta Pet. Sin. 2024, 45, 787–803. [Google Scholar] [CrossRef]
  54. Jiang, X.; Wu, C. A review: Geological feasibility and technological applicability of underground coal gasification. Meitiandizhi Yu Kantan/Coal Geol. Explor. 2022, 50, 2. [Google Scholar] [CrossRef]
  55. Sarhosis, V.; Lavis, S.; Mostade, M.; Thomas, H.R. Towards commercialising underground coal gasification in the EU. Environ. Geotech. 2016, 4, 113–122. [Google Scholar] [CrossRef]
  56. Yang, C.; Zheng, X.; Dai, C.; Li, D.; Liu, L.; Fang, L.; Tian, H.; Shao, T.; Zhang, J. Risk assessment of coal supply chain based on analytic hierarchy process and fuzzy comprehensive evaluation. Heliyon 2025, 11, e42629. [Google Scholar] [CrossRef]
  57. Huang, W.; Zhang, S.; Lu, X.; Wu, S.; Huang, J. Residual coal distribution in China and adaptability evaluation of its resource conditions to underground coal gasification. Sustain. Energy Technol. Assess. 2022, 49, 101654. [Google Scholar] [CrossRef]
  58. Lozynskyi, V. Multi-criteria assessment of coal seams suitability for co-gasification using the preference selection index. Heliyon 2025, 11, e43368. [Google Scholar] [CrossRef]
Figure 1. Simplified map of the structural framework and composite stratigraphic column of the Jurassic System in the Santanghu Basin.
Processes 13 03575 g001
Figure 2. Vitrinite reflectance testing device.
Processes 13 03575 g002
Figure 3. Gejin low-temperature dry distillation furnace.
Processes 13 03575 g003
Figure 4. In situ pyrolysis of oil-rich coal: schematic diagram.
Processes 13 03575 g004
Figure 5. Schematic Diagram of the Heating Cable.
Processes 13 03575 g005
Figure 6. 2D Model Side View.
Processes 13 03575 g006
Figure 7. Under Different Coal Seam Thicknesses: Heating Boundary Temperature Variation with Time.
Processes 13 03575 g007
Figure 8. Front View of the 2D Tar-Rich Coal In Situ Pyrolysis Model.
Processes 13 03575 g008
Figure 9. Tar Concentration Field Distribution of In Situ Pyrolysis of Tar-rich coal at Different Dip Angles (with higher positions connected to production wells and lower positions connected to heat injection wells).
Processes 13 03575 g009
Figure 10. Tar Yield Variation in In Situ Pyrolysis of Tar-rich coal at Different Dip Angles (with pressure difference = 1 kPa).
Processes 13 03575 g010
Figure 11. Schematic Diagram of the Influence of Coal Metamorphism Degree on Coal Structure.
Processes 13 03575 g011
Figure 12. Impacts of Geological Structures on Coal Seam Continuity. (a) Splitting: division of a single seam into multiple layers separated by non-coal-bearing strata. (b) Folding: original peat layers deformed to high angles or even overturned. (c) Washouts (floor roll): local erosion of the coal seam by paleo-river action. (d) Faulting: displacement of the seam by hundreds of meters, depending on fault throw.
Processes 13 03575 g012
Figure 13. Two-Dimensional Numerical Model (Side View).
Processes 13 03575 g013
Figure 14. Graph of the Law of Rock Damage Degree Variation with Temperature. Red circle indicates the sudden temperature of thermal damage to rocks.
Processes 13 03575 g014
Figure 15. Graph of Thermal Damage Zone Height Variation with Time Under Different Temperatures.
Processes 13 03575 g015
Figure 16. Elbow Method Plot. The red circle indicates the mutation position of the SSE value.
Processes 13 03575 g016
Figure 17. Distribution Map of Mining Rights, Exploration Rights, and Oil-Gas Concessions in the Santanghu Basin.
Processes 13 03575 g017
Figure 18. Coal Seam Thickness vs. Depth of the Badaowan Formation in the Santanghu Basin.
Processes 13 03575 g018
Figure 19. Trapezoidal Membership Function Distribution in Fuzzy Mathematics.
Processes 13 03575 g019
Table 1. Coal Resource Volume of the Badaowan Formation in the Santanghu Basin.
BasinBlockTypeArea
(km2)
Thickness
(m)
Dip Angle
(°)
Density
(g/cm3)
Resource
(×108 t)
Santanghu
basin
HanshuiquanSteep Slope Zone with Moderate Oil1098.5551.3512.51
1619.6351.3420.71
Gentle Slope Zone with Moderate Oil2436.8111.3522.31
52710.2121.3472.03
HandongGentle Slope Zone with Moderate Oil32113.2141.3557.20
TiaohuForward Structural Zone with High Oil7121.281.3119.72
25818.6101.3564.78
36318.3101.3287.69
Negative Structural Zone with High Oil6612.361.3611.04
Gentle Incline Zone with Moderate Oil19211.5151.3529.81
Total area2311Total resource volume397.80
Table 2. Numerical Simulation Parameters of 2D Model.
Physical ParameterValueData Source
Coal Density/kg/m31400[47]
Thermal Conductivity of Coal/W/(m·K)0.3[48]
Specific Heat Capacity of Coal/J (kg·K)1200[48]
Mudstone Density/kg/m32500[49]
Thermal Conductivity of Mudstone/W/(m·K)1.5[48]
Specific Heat Capacity of Mudstone/J (kg·K)900[48]
Specific Heat Capacity of Fluid/J (kg·K)1039NIST Chemistry WebBook
Gas Density/kg/m31.25NIST Chemistry WebBook
Thermal Conductivity of Gas/W/(m·K)0.024NIST Chemistry WebBook
Gas Viscosity/Pa·s1.60 × 10−5NIST Chemistry WebBook
Table 3. Numerical Simulation Parameters.
Physical ParameterValueData Source
Coal Seam Permeability/m21.00 × 10−15[50]
Coal Seam Porosity0.05[51]
Wellbore Permeability/m25.00 × 10−10
Wellbore Porosity0.99
Universal Gas Constant J/mol/K8.314[52]
Pre-exponential Factor of Pyrolysis Reaction/s−16.91[52]
Activation Energy of Pyrolysis Reaction/kJ/mol72.35[52]
Initial Coal Concentration/mol/m39407.3[52]
Initial Temperature of Coal Seam/K300[40]
High-Temperature Nitrogen Temperature/K923[40]
Table 4. Classification of Total Moisture in Coal.
ItemLevel NameClassification Range/Mt,%
1Specially low moisture coal ≤6.0
2Low moisture coal >6.0~8.0
3Medium moisture coal>8.0~12.0
4Medium high moisture coal >12.0~20.0
5High moisture coal>20.0~40.0
6Specially high moisture coal>40.0
Table 5. Grading Table of Caking Index for Bituminous Coal.
ItemLevel NameCaking Index/%
1Non-caking Coal ≤5
2Slightly Caking Coal >5~20
3Weakly Caking coal>20~50
4Medium Caking Coal >50~80
5Strongly Caking Coal>80
Table 6. Table of Temperature Range of Abrupt Increase Without Rock Thermal Damage.
LithologyTemperature Range of Abrupt Thermal Damage Increase
Medium-grained sandstone400 °C~600 °C
Fine-grained sandstone400 °C~600 °C
Argillaceous siltstone400 °C~1000 °C
Limestone600 °C~800 °C
Table 7. Site selection evaluation and classification for in-situ pyrolysis of oil-rich coal.
CategoryFirst Level IndicatorsSecond Level
Indicators
Weight
Comprehensive Weight
I (Excellent)II (Moderate)III (Poor)
Geological
Conditions
Resource Scale
U1
Coal resources (×108 t)
U11
≥101~10≤1
Coal seam Conditions
U2
Burial depth (m)
U21
800~12001200~15001500~2000
Coal thickness (m)
U22
>107~105~7
Dip angle (°)
U23
≤2020~30≥30
Parting layer properties U24NoneFew partings, single parting thickness < 0.2 mRelatively few partings, 0.2 m < single parting thickness < 0.3 m
Coal seam stability
U25
Good ContinuityFair ContinuityPoor Continuity
Coal Quality
U3
Coal rank
U31
Long-flame coal, gas coal, fat coalLignite, coking coalLean coal, poor coal, anthracite
Moisture content (%)
U32
≤66~88~12
Process Properties
U4
Tar yield (%)
U41
>1210~127~10
Caking index (%)
U42
≤55~2020~50
Mining
Conditions
Tectonic Conditions
U5
Distance to fault (m)
U51
>1000300~1000200~300
Hydrologic Condition
U6
Groundwater circulation conditions
U61
Poor Recharge-Runoff-Discharge ConditionsFair Recharge-Runoff-Discharge ConditionsModerate Recharge-Runoff-Discharge Conditions
Roof & Floor Properties
U7
Lithology
U71
Mudstone, siltstoneFine sandstoneMiddle-fine sandstone
Thickness (m)
U72
>3020~3010~20
Surface Conditions
U8
Distance to Mines, Residences, and Protected Areas (m)
U81
>105~103.2~5
Terrain Conditions and Infrastructure Availability (Water, Power, Chemical Supply)
U82
Favorable: Flat terrain, well-developed utilities, excellent industrial integration.Moderate: Gently undulating terrain, moderately available utilities, fair industrial integration.Unfavorable: Significantly rolling terrain, poorly available utilities, poor industrial integration.
Table 8. AHP Importance Rating Scale.
ScaleMeaning
1Equal importance
3Moderate importance
5Strong importance
7Very strong importance
9Extreme importance
2,4,6,8Intermediate values
Table 9. The expert scoring results of the first-level indicators.
IndicatorResource
Scale
Coal Seam ConditionsStructure
Conditions
Roof & Floor PropertiesCoal QualityProcess
Properties
Moisture
Content
Surface
Conditions
Resource Scale12233345
Coal Seam Conditions1/21223334
Structure Conditions1/21/2122334
Roof & Floor Properties1/31/21/212233
Coal quality1/31/31/21/21223
Process Properties1/31/31/31/21/2122
Hydrologic condition 1/41/31/31/31/21/212
Surface Conditions1/51/41/41/31/31/21/21
Table 10. Weight Coefficients for Geological Evaluation Indicators.
CategoryFirst Level IndicatorsWeightSecond Level
Indicators
WeightComprehensive
Weight
Geological
Conditions
U10.269U1110.269
U20.203U210.244 0.050
U220.386 0.078
U230.079 0.016
U240.119 0.024
U250.172 0.035
U30.090U310.641 0.058
U320.359 0.032
U40.068U410.552 0.038
U420.448 0.031
Mining
Conditions
U50.161U5110.161
U60.053U6110.053
U70.118U710.584 0.069
U720.414 0.049
U80.038U810.702 0.027
U820.298 0.011
Table 11. Trapezoidal fuzzy function.
Function TypeFavorableModerateUnfavorable
Benefit-type Index A ( x ) = 0 x u 2 x u 2 u 3 u 2 u 2 < x < u 3 1 x u 3 A ( x ) = 0 x u 1 x u 1 u 2 u 1 u 1 < x < u 2 u 3 x u 3 u 2 u 2 < x < u 3 0 x u 3 A ( x ) = 1 x u 1 u 2 x u 2 u 1 u 1 < x < u 2 0 x u 2
Cost-type Index A ( x ) = 1 x u 1 u 2 x u 2 u 1 u 1 < x < u 2 0 x u 2 A ( x ) = 0 x u 1 x u 1 u 2 u 1 u 1 < x < u 2 u 3 x u 3 u 2 u 2 < x < u 3 0 x u 3 A ( x ) = 1 x u 1 u 2 x u 2 u 1 u 1 < x < u 2 0 x u 2
Middle-type Index A ( x ) = 0 x u x u u 2 u u < x u 2 u x u u 2 u 2 < x < u 0 x u A ( x ) = 0 x u 1 x u 1 u u 1 u 1 < x < u u 2 x u 2 u u < x u 2 x u 2 u u 2 u 2 < x u u 3 x u 3 u u < x < u 3 0 x u 3 A ( x ) = 1 x u 1 u x u u 1 u 1 < x u 0 u < x u x u u 3 u u < x < u 3 1 x u 3
Table 12. Classification Criteria for Geological Indicators.
Serial
Number
Evaluation
Indicator
Type
Function
Graded Defined ValueNote
u1U′u2u″u3
1U11Benefit-type1 5 10A larger resource volume is preferable, with an optimal threshold of >1.0 × 10⁹ tons
2U21Middle-type8001100140017002000A burial depth of >800 m to <2000 m is recommended
3U22Benefit-type567810The coal seam thickness should be greater than 5 m.
4U23Middle-type010152030A coal seam dip angle of less than 30° is recommended.
5U24Cost-type30 50 70Scoring was based on the number of partings and the thickness of individual partings.
6U25Benefit-type30 50 70Scoring was based on the continuity of the coal seam.
7U31Cost-type30 50 70Scoring was performed based on the types of coal: lignite, bituminous coal, and anthracite.
8U32Cost-type6 8 12A lower moisture content is preferable.
9U41Benefit-type7 10 12A tar yield greater than 7% is required.
10U42Cost-type5 20 50A lower caking index is preferable, with a value of ≤5 being optimal.
11U51Cost-type200 300 1000A minimum distance of 200 m from faults should be maintained.
12U61Cost-type30 50 70Scoring was based on the degree of confinement of the groundwater circulation system.
13U71Benefit-type30 50 70Scoring was based on the lithology types: mudstone, siltstone, and fine sandstone.
14U72Benefit-type10 20 30A roof/floor thickness greater than 10 m is required.
15U81Cost-type3.2 5 10A lower number of impacted mining rights in the surrounding area is preferable for scoring.
16U82Benefit-type30 50 80Scoring was based on terrain flatness, distance from chemical plants, and utility accessibility of water and electricity.
Table 13. Indicator Judgment Matrix R for Geological Site Selection of In Situ Pyrolysis of Tar-rich coal.
BlockTypeU1U2U3U4U5U6U7U8
U11U21U22U23U24U25U31U32U41U42U52U61U71U72U81U82
Tiao IValue6.480 16003014NoneGood/6.212~160>3000Sealing70Roof/Floor Thickness: 13 m/12 mNoneConvenient power supply; lacks integration capability (50).
Favorable0.296 0.333 10.810.510.911111010
Moderately
Favorable
0.704 0.667 00.200.500.1000000.201
Unfavorable00000000000000.800
Tiao IIValue1.890 15001014NoneGood/6.514~180>1000Sealing70Roof/Floor Thickness: 13 m/12 mNoneConvenient power supply; lacks inte-gration capability (50).
Favorable00.667 10.810.510.7511111010
Moderately
Favorable
0.223 0.333 00.200.500.25000000.201
Unfavorable0.778 0000000000000.800
Tiao IIIValue4.320 12502011NoneBetter/5.816~180>1000Sealing60Roof/Floor Thickness: 13 m/7 mNoneConvenient power supply; lacks inte-gration capability (50).
Favorable00.510.2111111110.5010
Moderately
Favorable
0.830 0.500.8000000000.5001
Unfavorable0.170 000000000000100
Tiao IVValue7.690 1200306NoneBetter0.415.4515.40>2000Sealing90Roof/Floor Thickness: 20 m/21 mNoneFavorable integration: Coal chemical plant (S), Wind farm (E) (95).
Favorable0.538 0.333 10111111111011
Moderately
Favorable
0.462 0.667 00.6000000000100
Unfavorable0000.4000000000000
Han IValue5.270 17001510NoneAverage/7.314~160>2000Sealing//NonePoor power supply; no integration potential (20).
Favorable0.054 0101010.3511110.5010
Moderately
Favorable
0.946 1010100.6500000.5100
Unfavorable0000000000000001
Han IIIValue2.700 1750258NoneAverage/7.114~160>1000Sealing40Roof/Floor Thickness: 20 m/30 mNonePoor power supply; no integration potential (20).
Favorable00101010.4511110010
Moderately
Favorable
0.425 0.833 00.80100.5500000.5100
Unfavorable0.575 0.167 00.2000000000.5001
Table 14. Comprehensive Evaluation Results of Geological Target Selection.
BlockFavorableModerateUnfavorable
Tiao I0.6930.2680.039
Tiao II0.6250.1260.249
Tiao III0.5980.3070.095
Tiao IV0.7770.2160.006
Han I0.5290.4600.011
Han III0.4830.3050.212
Table 15. Comparative Characteristics of Coal Seams in Block Tiao-IV and the Northern Shaanxi Pilot Site.
BlockXinjiang Uygur Autonomous RegionShaanxi Province
Target Coal SeamBadaowan Formation of
Jurassic System
Yanan Formation of
Jurassic System
Ro (%)0.410.58
Proximate Components
of Coal
Volatile Matter (%)48.6637.56
Moisture (%)5.378.04
Ash (%)5.464.46
Maceral of CoalVitrinite (%)64.454.9
Liptinite (%)22.80.8
Inertinite (%)12.842.2
Burial Depth of Coal Seam (m)1000–15001000–1500
Thickness of Coal Seam (m)31.831.8
Tar Yield (%)15.415.4
TOC (%)61.861.8
Physical Properties of Coal SeamPorosity (%)3.345.8
Permeability (mD)0.054.21
Disclaimer/Publisher’s Note: The statements, opinions and data contained in all publications are solely those of the individual author(s) and contributor(s) and not of MDPI and/or the editor(s). MDPI and/or the editor(s) disclaim responsibility for any injury to people or property resulting from any ideas, methods, instructions or products referred to in the content.