1. Introduction
A steam turbine is a type of rotary machinery for converting thermal energy into mechanical work in power plants, and its efficiency directly impacts both generation costs and environmental footprint [
1]. The regulating stage, as the first stage, plays a critical role in load adjustment via nozzle-controlled steam admission [
2]. Operating under extreme temperature and pressure, often with partial admission, this stage exhibits lower efficiency and generates circumferentially non-uniform excitation forces, which are key drivers of turbine vibration. Furthermore, its performance directly influences downstream stages and overall turbine efficiency, necessitating consideration of its aerodynamic characteristics and stability across variable loads during design [
3].
Variable operating conditions also induce significant fluctuations in the axial thrust generated by the steam flow, critically affecting the rotor’s force balance. In multi-stage turbines, excessive or reversed axial thrust can lead to bearing wear, rotor displacement, and even catastrophic failure [
4,
5]. However, direct measurement of this thrust is impractical, and its accurate prediction remains challenging. This is primarily due to: (1) the evolution of regulating stage design towards higher reaction degrees, which renders traditional thrust calculation methods—developed for near-zero reaction designs—inaccurate [
6]; and (2) the complex, circumferentially non-uniform flow field under partial admission at part-load conditions, which complicates aerodynamic parameter prediction.
Consequently, current engineering practice relies on monitoring indirect parameters (e.g., axial displacement, bearing temperature) to infer thrust trends. A direct and accurate method for quantifying axial thrust in multi-stage turbines under off-design conditions is therefore a significant unmet need in the field.
Numerical studies have analyzed heat transfer in turbine valves [
7] and hydraulic thrust in various turbomachinery [
8,
9]. Investigations into regulating stage aerodynamics have employed 2D models [
10] and explored partial admission mechanisms [
11,
12]. Studies on components like steam ejectors have also highlighted the importance of geometry, such as the mixing chamber, on performance [
13]. Meanwhile, axial thrust has been investigated indirectly via bearing temperatures [
14]. It was found that during different startup stages, variations in the steam pressure at the turbine inlet and within the flow passages caused corresponding changes in the thrust bearing temperature as well as in the magnitude and direction of the axial thrust. David Stasenko and Narzary et al. [
15,
16] developed a full-scale, full-speed axial turbine test rig capable of measuring turbine thrust and static pressure in rotor–stator cavities. However, this test rig was limited to single-stage turbines, and in practical engineering applications, sensors are rarely installed to measure axial thrust and related parameters in multistage turbines. CFD simulations have proven effective in analyzing thrust in other turbomachinery, such as hydraulic turbines [
17] and expanders [
18].
In summary, under partial admission conditions, the inlet flow of the turbine regulating stage exhibits significant non-uniformity. The flow structure is complex, and the prediction accuracy is limited, and the effect on the overall efficiency is considerable. However, a critical research gap persists. While many studies have modeled isolated sections of steam turbines, no research has been found employing a full-scale, 1:1 CFD (Computational Fluid Dynamics) multi-stage turbine model that encompasses both the regulating stage and several subsequent pressure stages to simulate the internal flow and axial thrust characteristics of a multi-stage steam turbine. This holistic approach is necessary to capture the critical stage-to-stage interactions and provide a truly accurate quantification of the axial thrust under variable loads. Furthermore, the influence of key geometries like the mixing chamber on the flow field and losses under these conditions remains underexplored.
To address this gap, this study establishes a full-scale, 1:1 CFD model of a multi-stage steam turbine, incorporating the regulating stage and multiple pressure stages. The primary objectives are as follows: (1) to systematically investigate the internal flow field and axial thrust distribution across various operating conditions; (2) to identify the dominant sources of axial thrust and elucidate their response mechanisms to load changes; and (3) to evaluate the impact of the mixing chamber geometry on stage performance and propose an effective optimization strategy.
2. Computational Method
2.1. Computational Model
Figure 1 shows the 2D schematic of the computational model. The steam turbine primarily consists of a regulating stage and three pressure stages, incorporating components such as rotor blades, stationary blades, steam seals, balance holes, and steam inlet chambers. The blade profiles for each stage are shown in
Figure 2. From left to right, the profiles correspond to the regulating stage, followed by the second, third, and fourth pressure stages. The pink and blue curves represent the rotor and stationary blades, respectively.
The regulating stage plays a critical role in converting high-temperature, high-pressure stationary steam into a supersonic flow. It also regulates the mass flow rate through partial admission. The influence of steam admission is largely confined to the regulating stage, with minimal impact on the subsequent pressure stages.
To conserve computational resources while preserving the actual steam admission pattern, a hybrid modeling approach was adopted. Full-annulus modeling was applied to the rotor and stationary blades of the regulating stage and to the stationary blades of the second stage. The remaining blades were modeled using a single-passage approach.
It should be noted that steam turbines operate under variable conditions. Daily fluctuations in grid electrical load and seasonal variations in condenser efficiency necessitate a flexible control strategy. For this reason, nozzle-group admission was implemented in the regulating stage. The nozzles were divided into four independent groups (#1 to #4), each connected to a corresponding inlet chamber, as shown in
Figure 3.
It significantly reduces throttling losses at low loads, helping maintain high operational efficiency across the load spectrum. Furthermore, it contributes to a more uniform steam flow, thereby improving the loading conditions and working environment of the regulating stage rotor blades.
This study investigates four typical operating conditions: Valve Wide Open (VWO) condition, Turbine Heat Acceptance (THA) condition, 75% THA condition and 50% THA condition. The corresponding valve configurations are: all four nozzle groups (#1, #2, #3, #4) open under VWO condition; groups #1, #2, and #4 open under THA condition; and only groups #1 and #4 open under both 75% and 50% THA conditions. The single-valve admission mode was excluded from this study as it induces highly asymmetric flow and significant aerodynamic excitation forces, which pose operational risks and are typically avoided in practice.
2.2. Mesh Generation
The computational domain consists exclusively of fluid regions.
Figure 4 presents the detailed mesh distribution of the seals and blades. An unstructured mesh was generated for the sealing flow domain using the sweeping method, as this region rotates around the rotor axis and can be treated as a swept volume. Similarly, the steam admission chamber was discretized with an unstructured mesh, employing the default meshing strategy to facilitate efficient data transfer between adjacent elements. In contrast, structured meshes were applied to the blade passages. These were constructed by defining hub and shroud contours and adjusting the number of mesh layers and boundary-layer thickness within the preprocessing software. After the meshing process, all domains were assembled in CFX-Pre to form the complete turbine models for each operating condition, as shown in
Figure 5.
In engineering simulations, grid-independence verification is a critical step to ensure the reliability and accuracy of numerical results. This process assesses whether the solution stabilizes as the grid is refined, thereby confirming that the results are independent of the discretization scheme and minimizing errors introduced by spatial resolution. In general, grid density significantly affects simulation accuracy: as the mesh is refined, the numerical solution converges toward the physical reality. However, increasing the number of grid cells inevitably prolongs computation time and substantially raises computational resource requirements. Therefore, conducting a systematic grid-independence analysis for turbine numerical models is essential to achieve a reasonable balance between computational efficiency and solution accuracy.
Due to the high structural complexity of the entire fluid domain, conducting a grid-independence verification for all operating conditions would be prohibitively time-consuming. Therefore, only the VWO condition was selected for detailed analysis in this study, and the grid number was determined by comparing the error between the numerical calculation of the inlet flow rate and the actual inlet flow rate. By changing the number of grid layers (25, 37, 49, 57) of the blades and the corresponding boundary layer thicknesses of 0.05 mm, 0.02 mm, 0.01 mm, and 0.005 mm, four sets of grids with 22.91 million, 28.06 million, 33.73 million, and 39.11 million, Respectively, were obtained. The results show that at lower grid densities, the calculation error was relatively high, reaching 2.06%. As the grid resolution increased to 33.73 million cells, the error decreased to 0.56%.
Table 1 summarizes the grid independence verification results, listing the variations in isentropic efficiency, axial thrust on the regulating stage, and total regulating stage losses with increasing grid count. Beyond 33.73 million cells, these parameters stabilized, indicating that the results became insensitive to further mesh refinement. Consequently, a grid of 33.73 million cells—corresponding to 49 blade mesh layers and a boundary layer thickness of 0.01 mm—was adopted for the present study.
2.3. Numerical Methods
The Reynolds-averaged Navier–Stokes (RANS) approach is the most widely used turbulence modeling method in engineering applications. It significantly reduces computational cost while maintaining reasonable accuracy, making it suitable for a broad range of engineering problems. The unsteady RANS (URANS) model extends RANS by resolving time-dependent flow variations, enabling the capture of transient phenomena. However, as this study focuses on steady-state behavior, URANS was not adopted. Large-eddy simulation (LES) can accurately resolve turbulent details—such as flow separation and vortex structures—by directly simulating large eddies and modeling smaller ones Via a subgrid-scale model. Nevertheless, given the large grid count and rotational effects in the present model, LES would lead to prohibitively high computational cost. After comprehensive evaluation, the RANS model was selected for this work [
19].
Among the commonly used RANS turbulence models is the Shear Stress Transport (SST) model, originally developed by Menter [
20]. The SST model combines the advantages of the k–ω model in the near-wall region and the k–ε model in the far field, improving the prediction of flow separation under adverse pressure gradients [
21]. Therefore, the SST model was employed in this study, and all simulations were performed using the commercial solver Ansys CFX.
The formula for SST turbulence model is
In the formula, is the time derivative of turbulent kinetic energy; is the convective transport of turbulent kinetic energy; is the restricted production term of turbulent kinetic energy; is the dissipation term of turbulent kinetic energy; is the diffusion term of turbulent kinetic energy; is the time derivative of the specific dissipation rate; is the convective transport of the specific dissipation rate; is the production term of the specific dissipation rate; is the dissipation term of the specific dissipation rate; is the diffusion term of the specific dissipation rate; is the cross-diffusion term.
The total energy formulation was selected for heat transfer. A second-order high-resolution scheme was used for discretization. The RMS convergence criterion was set to 10
−5, with a maximum of 5000 iterations. Walls were defined as adiabatic, no-slip, and smooth, while other settings were kept as default. The entire physical domain was divided into rotating and stationary regions, with the rotating domain operating at a speed of 3000 r/min, the
z-axis defined as the axis of rotation, and a reference pressure of 0 MPa. The working fluid was modeled as a mixture of dry steam and water vapor, based on the high-accuracy IAPWS-IF97 steam property database embedded in the software, ensuring close consistency with the real operating environment. Boundary conditions were configured based on actual operating conditions: a total temperature and total pressure inlet was defined at the intake of the steam inlet chamber, mass flow outlets were set at the exits of the front shaft seal and diaphragm gland seals, and a static pressure outlet was specified at the outlet of the fourth-stage rotor blades, the specific values are consistent with the actual unit operating parameters. The detailed boundary conditions for the four operating cases are summarized in
Table 2. The main steam pressure and temperature were measured using high-accuracy industrial transmitters and thermocouples installed on the main steam line. In contrast, parameters that are not feasible to measure directly on an operational multi-stage turbine, specifically the pressure after the fourth stage and the seal leakage flow rates, were sourced from the original equipment manufacturer’s (OEM) design specifications. These specifications are based on established empirical models and seal clearances, and provide the accepted industry reference for defining these critical internal boundary conditions in high-fidelity simulations.
It is important to note the limitations associated with the chosen numerical approach. The present study employs a steady-state RANS framework, which provides solutions for the time-averaged flow field. While this approach is computationally efficient and well-suited for predicting global performance parameters like time-averaged axial thrust and efficiency, it does not resolve the inherent unsteady fluctuations caused by the partial admission condition. Consequently, all results presented herein, including pressure distributions and resultant forces, must be interpreted as time-averaged values. The model effectively captures the mean effects of the flow non-uniformity but cannot be used to assess dynamic peaks, spectral characteristics, or high-frequency loading cycles on the blades. Future investigations utilizing transient simulation methods (e.g., LES or Transient RANS) would be required to elucidate these important dynamic aspects.
2.4. Data Analysis
The formula for calculating mid-span reaction degree is
In the formula, is mid-span reaction degree; is static pressure at inlet of regulating stage; is interstage static pressure of regulating stage; is static pressure at outlet of regulating stage.
The formula for calculating tip reaction degree is
In the formula, is mid-span reaction degree; is static pressure at inlet of regulating stage; is static pressure before blade top steam seal; is static pressure after blade top steam seal.
The formula for calculating reaction degree of upper wheel hub is
The formula for calculating reaction degree of lower wheel hub is
In the formula,
is reaction degree of upper wheel hub;
is degree of lower wheel hub;
is static pressure at inlet of regulating stage;
is upper static pressure of interstage hub;
is lower static pressure of interstage hub;
is static pressure of rear wheel hub.
The formula for calculating stationary blade loss is
In the formula, is rotor blade loss; is stationary blade loss; is static enthalpy at outlet of stationary blade region; is isentropic enthalpy at the outlet of stationary blade region; is absolute total enthalpy at the outlet of stationary blade region; is static enthalpy at outlet of rotor blade region; is isentropic enthalpy at the outlet of rotor blade region; is absolute total enthalpy at the outlet of rotor blade region. The enthalpies mentioned above can be obtained as part of the CFD post-processing results.
3. Result Analysis and Comparison
3.1. Isentropic Efficiency Analysis
The isentropic efficiency of a steam turbine quantifies how closely its actual operation approaches an ideal isentropic process. It is defined as the ratio of the actual enthalpy drop to the isentropic enthalpy drop between the inlet total enthalpy and the outlet static enthalpy. Isentropic efficiency is a core performance indicator for evaluating the design level, manufacturing processes, operational conditions, and economic benefits of a steam turbine. It directly determines the economic viability and environmental impact of a power plant, serves as a diagnostic tool for equipment health, and is a key objective driving technological advancement.
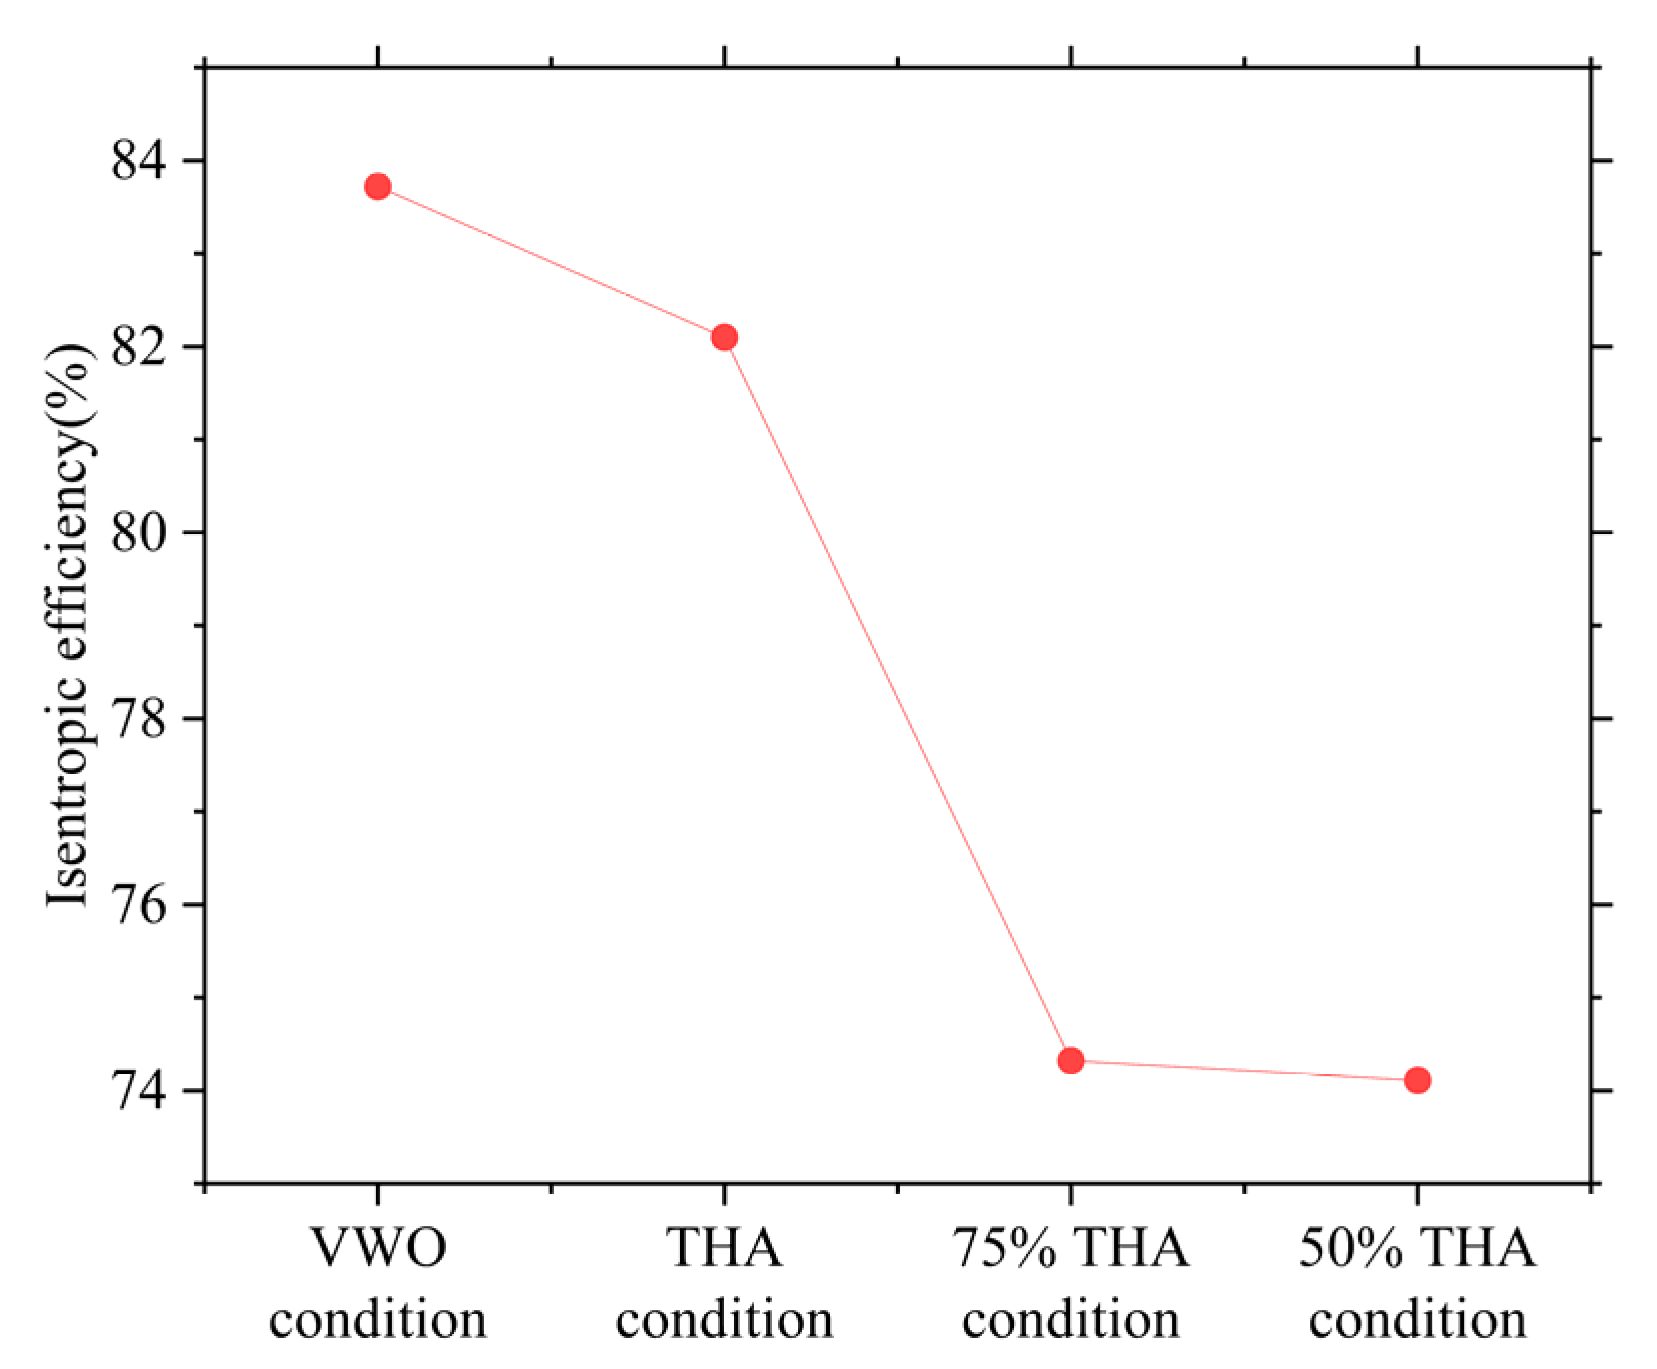
Figure 6 shows the isentropic efficiency of the steam turbine under different operating conditions obtained through numerical calculations. It can be seen from the figure that the isentropic efficiency under the VWO condition is higher than that under the THA condition. This is primarily because, in the VWO condition, all control valves are fully opened, resulting in the maximum steam flow rate and significantly reduced throttling losses; consequently, its theoretical isentropic efficiency can even exceed that of the rated condition. Moreover, as the unit load decreases, the steam flow rate declines, leading to increased throttling and leakage losses, while the flow field within the blade passages deviates from the optimal design condition. These effects collectively manifest as a reduction in isentropic efficiency with decreasing load, which is consistent with general engineering practice. However, the efficiency drop from the 75% THA condition to the 50% THA condition is relatively small. This is because, despite the further reduction in load, the inlet steam pressure exerts a comparably strong influence on efficiency—the inlet pressure at 50% THA condition decreases substantially relative to that at 75% THA condition, thereby mitigating a significant change in efficiency.
3.2. Reaction Degree Analysis
In steam turbines, a long-blade stage is characterized by a relatively large blade height compared to its diameter. In such stages, particularly in axial-flow turbines, the radius from hub to tip varies considerably, leading to a non-uniform distribution of steam flow parameters along the blade height. To more accurately describe and analyze the working characteristics at different blade heights, it is insufficient to consider only the stage’s reaction degree. Therefore, the concepts of mid-span reaction degree, tip reaction degree, and hub reaction degree were introduced. Understanding and controlling the reaction degree distribution at these three locations is crucial for designing efficient and reliable long-blade stages, as it directly impacts the turbine’s efficiency, flow capacity, and operational safety.
The mid-span reaction degree is defined at the mid-radius section—typically at half the blade height or the arithmetic mean diameter between the hub and tip. It is calculated as the ratio of the static pressure drop across the rotor to the total static pressure drop across the stage.
The tip reaction degree is evaluated at the outermost blade section near the cylinder wall. It is expressed as the ratio of the static pressure drop across the blade tip seal to the total static pressure drop from the stage inlet to the region after the tip seal.
The hub reaction degree is determined at the innermost blade section adjacent to the rotor hub. It is defined as the ratio of the static pressure drop across the hub region to the total static pressure drop from the stage inlet to the downstream hub location. In this study, the hub reaction degree is further divided into upper and lower hub reaction degrees based on hub geometry.
Since the effect of steam on the degree of reaction is primarily concentrated in the regulating stage, the reaction degree of the regulating stage is only studied in this article. Using parameters obtained from numerical simulations, the mid-span, tip, and hub reaction degrees of the regulating stage under different operating conditions were calculated Via Equations (3)–(6), with results summarized in
Table 3. Overall, the reaction degree is highest at the tip of the regulating stage and lowest at the hub. The mid-span reaction degree corresponds to the overall regulating stage reaction and meets the design requirement of 0–20% for the regulating stage during unit operation. It can be observed that the mid-span and tip reaction degrees of the regulating stage are highest under the VWO condition and lowest under the 50%THA condition, decreasing as the load is reduced. This is primarily due to the significant decrease in downstream pressure of the regulating stage as the unit flow decreases. This leads to a relatively higher pressure drop and enthalpy drop across the stator, while the rotor performs less expansion work during this process, resulting in a reduction in reaction degree. However, the hub reaction degree of the regulating stage, calculated by dividing the hub into upper and lower sections, does not follow the same trend. This provides a reference for the calculation of actual reaction degrees in engineering applications.
3.3. Axial Thrust Analysis
Figure 7 presents the axial thrust acting on different components of the regulating stage under various operating conditions. These findings provide a new perspective for evaluating axial thrust in practical turbine engineering. The axial thrust of a steam turbine is primarily composed of three components: the rotor blades, the blade root hub, and the blade tip shroud. Due to the inclusion of balance holes in the pressure stage, the use of these holes generates a highly vortical gap flow, which reduces the static pressure on the back of the rotor disk. This significantly decreases the axial force generated by the pressure difference across the rotor blades. Therefore, the calculation of axial thrust primarily focuses on the regulating stage [
22]. The axial thrust on these three components is calculated numerically in this article.
As shown in Figure, the axial thrust on the blade root hub is the largest, representing the primary contributor to the total axial thrust. Under different operating conditions, the total axial thrust is greater under the VWO and THA conditions compared to the 75% THA and 50% THA conditions, with the 50% THA condition exhibiting the smallest axial thrust. Overall, the axial thrust decreases as the load decreases. This is due to the decrease in reaction degree at the regulating stage, which reduces the pressure difference across the rotor, leading to a sharp reduction in the counteracting force. Meanwhile, the forward thrust remains relatively unchanged, resulting in a significant increase in axial thrust. This is consistent with the conclusion of Reference [
14]. It showed that, the temperature of the thrust bearing pads is driven by the HP steam flow; specifically, a higher flow rate generates increased axial thrust, directly elevating the pad temperature. The calculation of axial thrust of steam turbines in engineering practice has provided a new analytical approach in this study.
3.4. Internal Flow Field Analysis
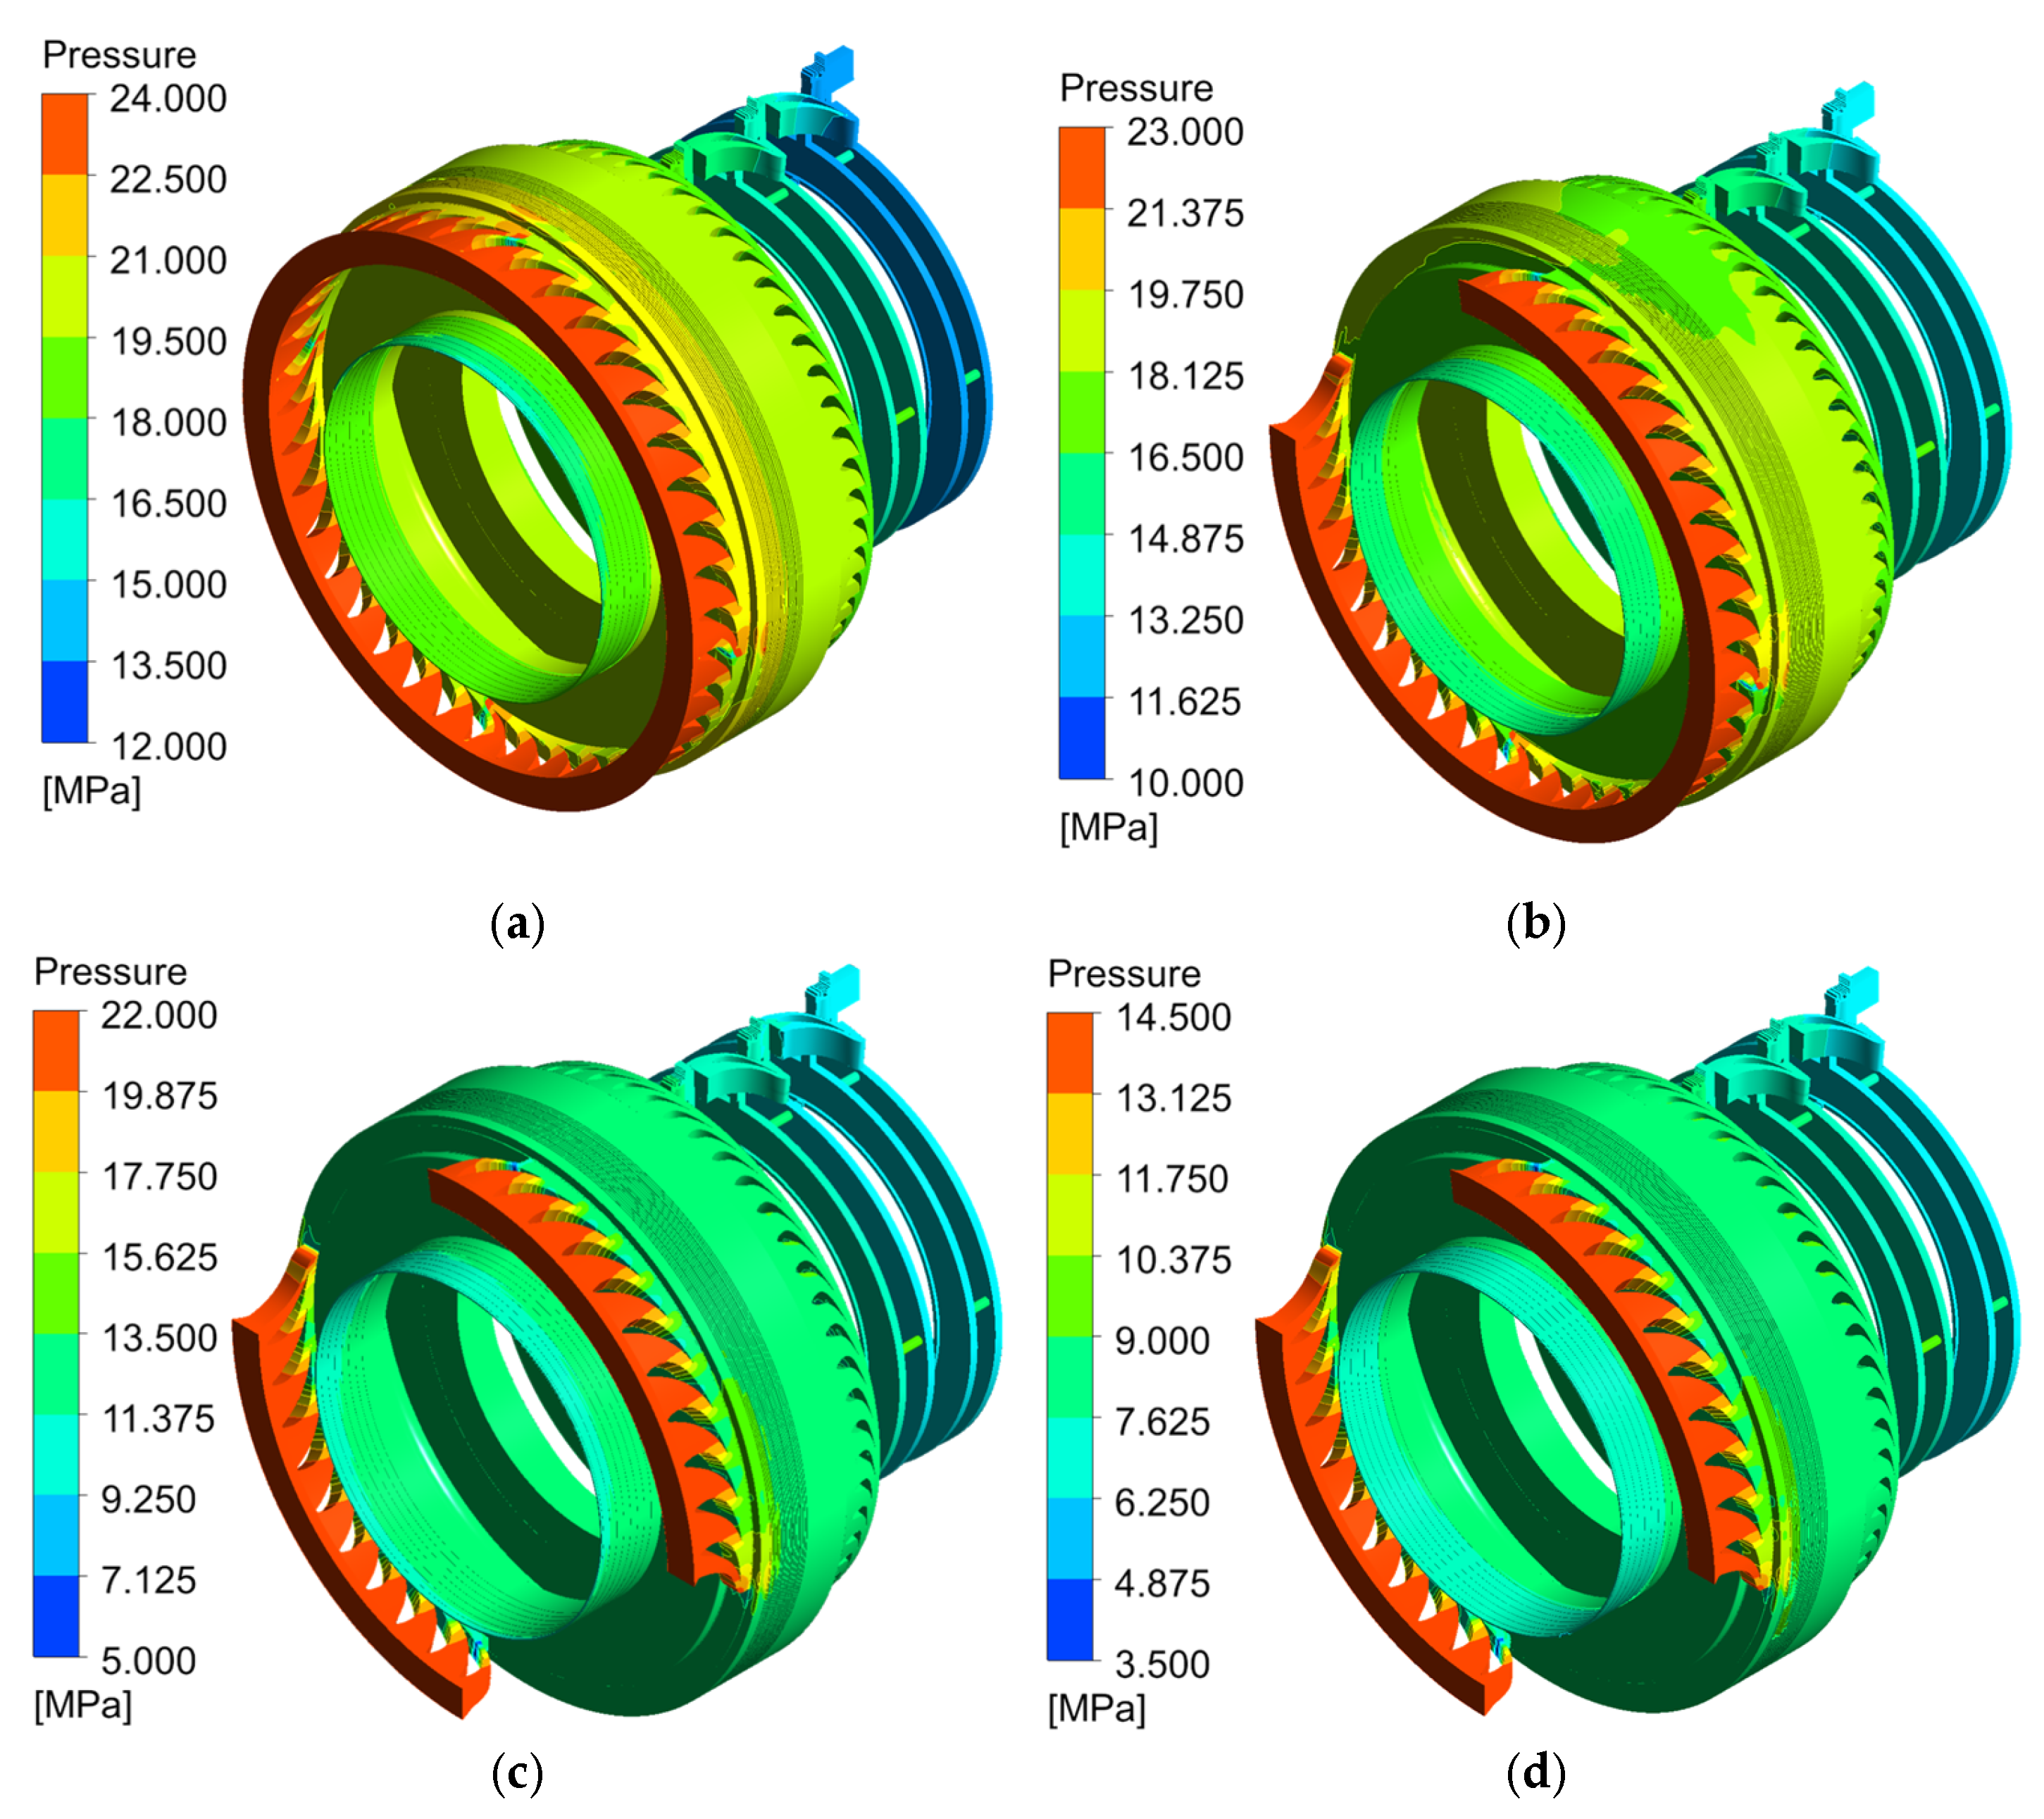
Figure 8 illustrates the pressure distribution contours of the steam turbine under different operating conditions. The highest pressure regions are mainly concentrated in the regulating stage, while the pressure in subsequent stages is lower and decreases progressively. This pattern occurs because the regulating stage initiates the energy conversion process, transforming high-temperature, high-pressure stationary steam into a supersonic flow while also regulating the mass flow Via partial admission. To achieve such a substantial energy conversion, an equally large pressure drop is required as the driving force. Each passage of steam through a rotor–stator pair results in expansion and work output, leading to a corresponding reduction in pressure. This further confirms the central role of the regulating stage in turbine research. Moreover, when compared with the VWO condition, the pressure distribution on the blades exhibits more pronounced circumferential non-uniformity under the THA, 75% THA and 50% THA conditions. Under the 75% THA and 50% THA conditions, as the unit load decreases, the steam mass flow correspondingly reduces, lowering the steam velocity through the blade passages. This leads to a gradual reduction in the pressure difference between the two sides of the blades, resulting in a more uniform pressure distribution.
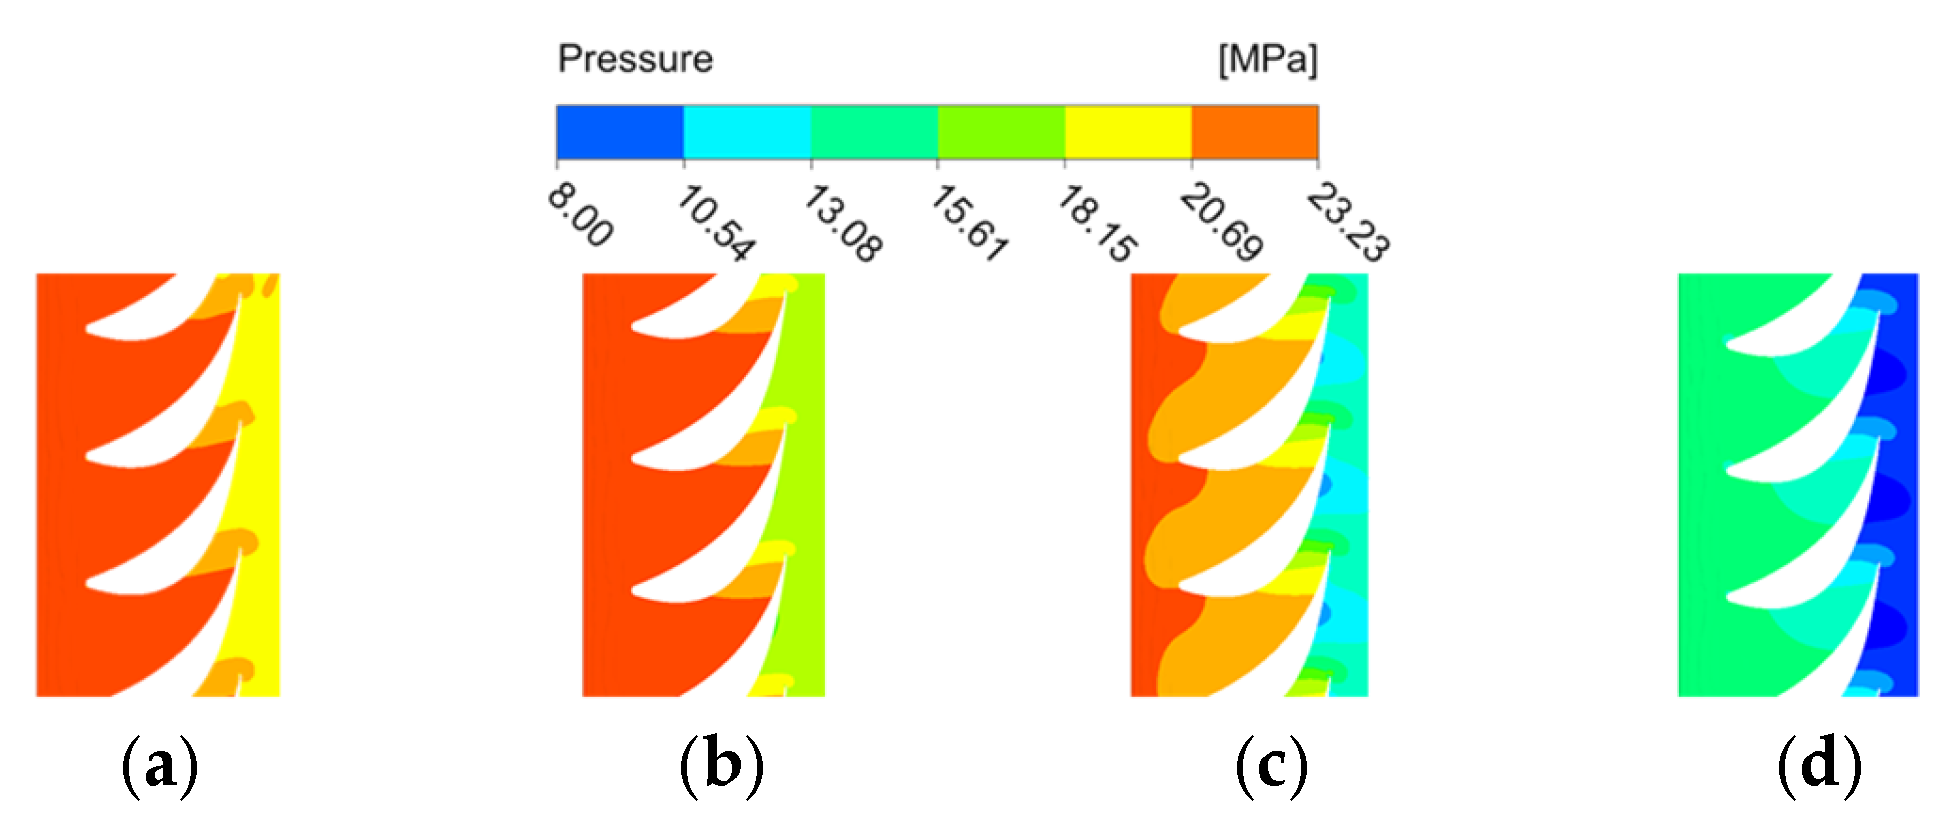
To elucidate the underlying flow mechanisms governing performance variation under partial admission, the internal flow characteristics of the regulating stage were scrutinized. The pressure and velocity distributions within the stator passage (
Figure 9 and
Figure 10) confirm the expected steam expansion and acceleration. More importantly, the analysis reveals a counter-intuitive phenomenon: the nozzle outlet velocity is lowest under the full-admission (VWO) condition, even though the total mass flow rate is highest.
This trend is attributed to the fundamental difference in admission modes. Under VWO condition, the total mass flow is highest, but it is distributed across the entire annulus, resulting in a relatively low mass flow per nozzle and a modest pressure drop. In contrast, under partial admission conditions (THA, 75% THA, and 50% THA conditions), a smaller total mass flow is forced through a significantly reduced number of open nozzles due to valve closure. This leads to a substantial increase in the mass flow rate and pressure drop per active nozzle. Since the nozzle outlet velocity is primarily governed by this pressure drop, it increases progressively as the load decreases. The most noticeable increase occurs between 75% THA and 50% THA conditions, as the downstream pressure drops markedly while the upstream pressure is maintained by valve throttling, creating a larger expansion ratio.
This finding provides a critical mechanistic insight into the turbine’s operational dynamics. The localized, high-velocity jets generated under partial admission are a direct source of increased circumferential non-uniformity and unsteady rotor excitation. This analysis, therefore, establishes a direct causal link from the admission mode to the internal nozzle flow, and finally to the rotor system dynamics. It explains the physical origin of the more severe dynamic loads and axial thrust fluctuations observed at part-load conditions, underscoring the importance of considering these admission-mode effects in turbine design and monitoring strategies. This enhances the interpretation of earlier axial thrust trends and provides novel engineering insight beyond model validation.
3.5. Mixing Chamber Analysis
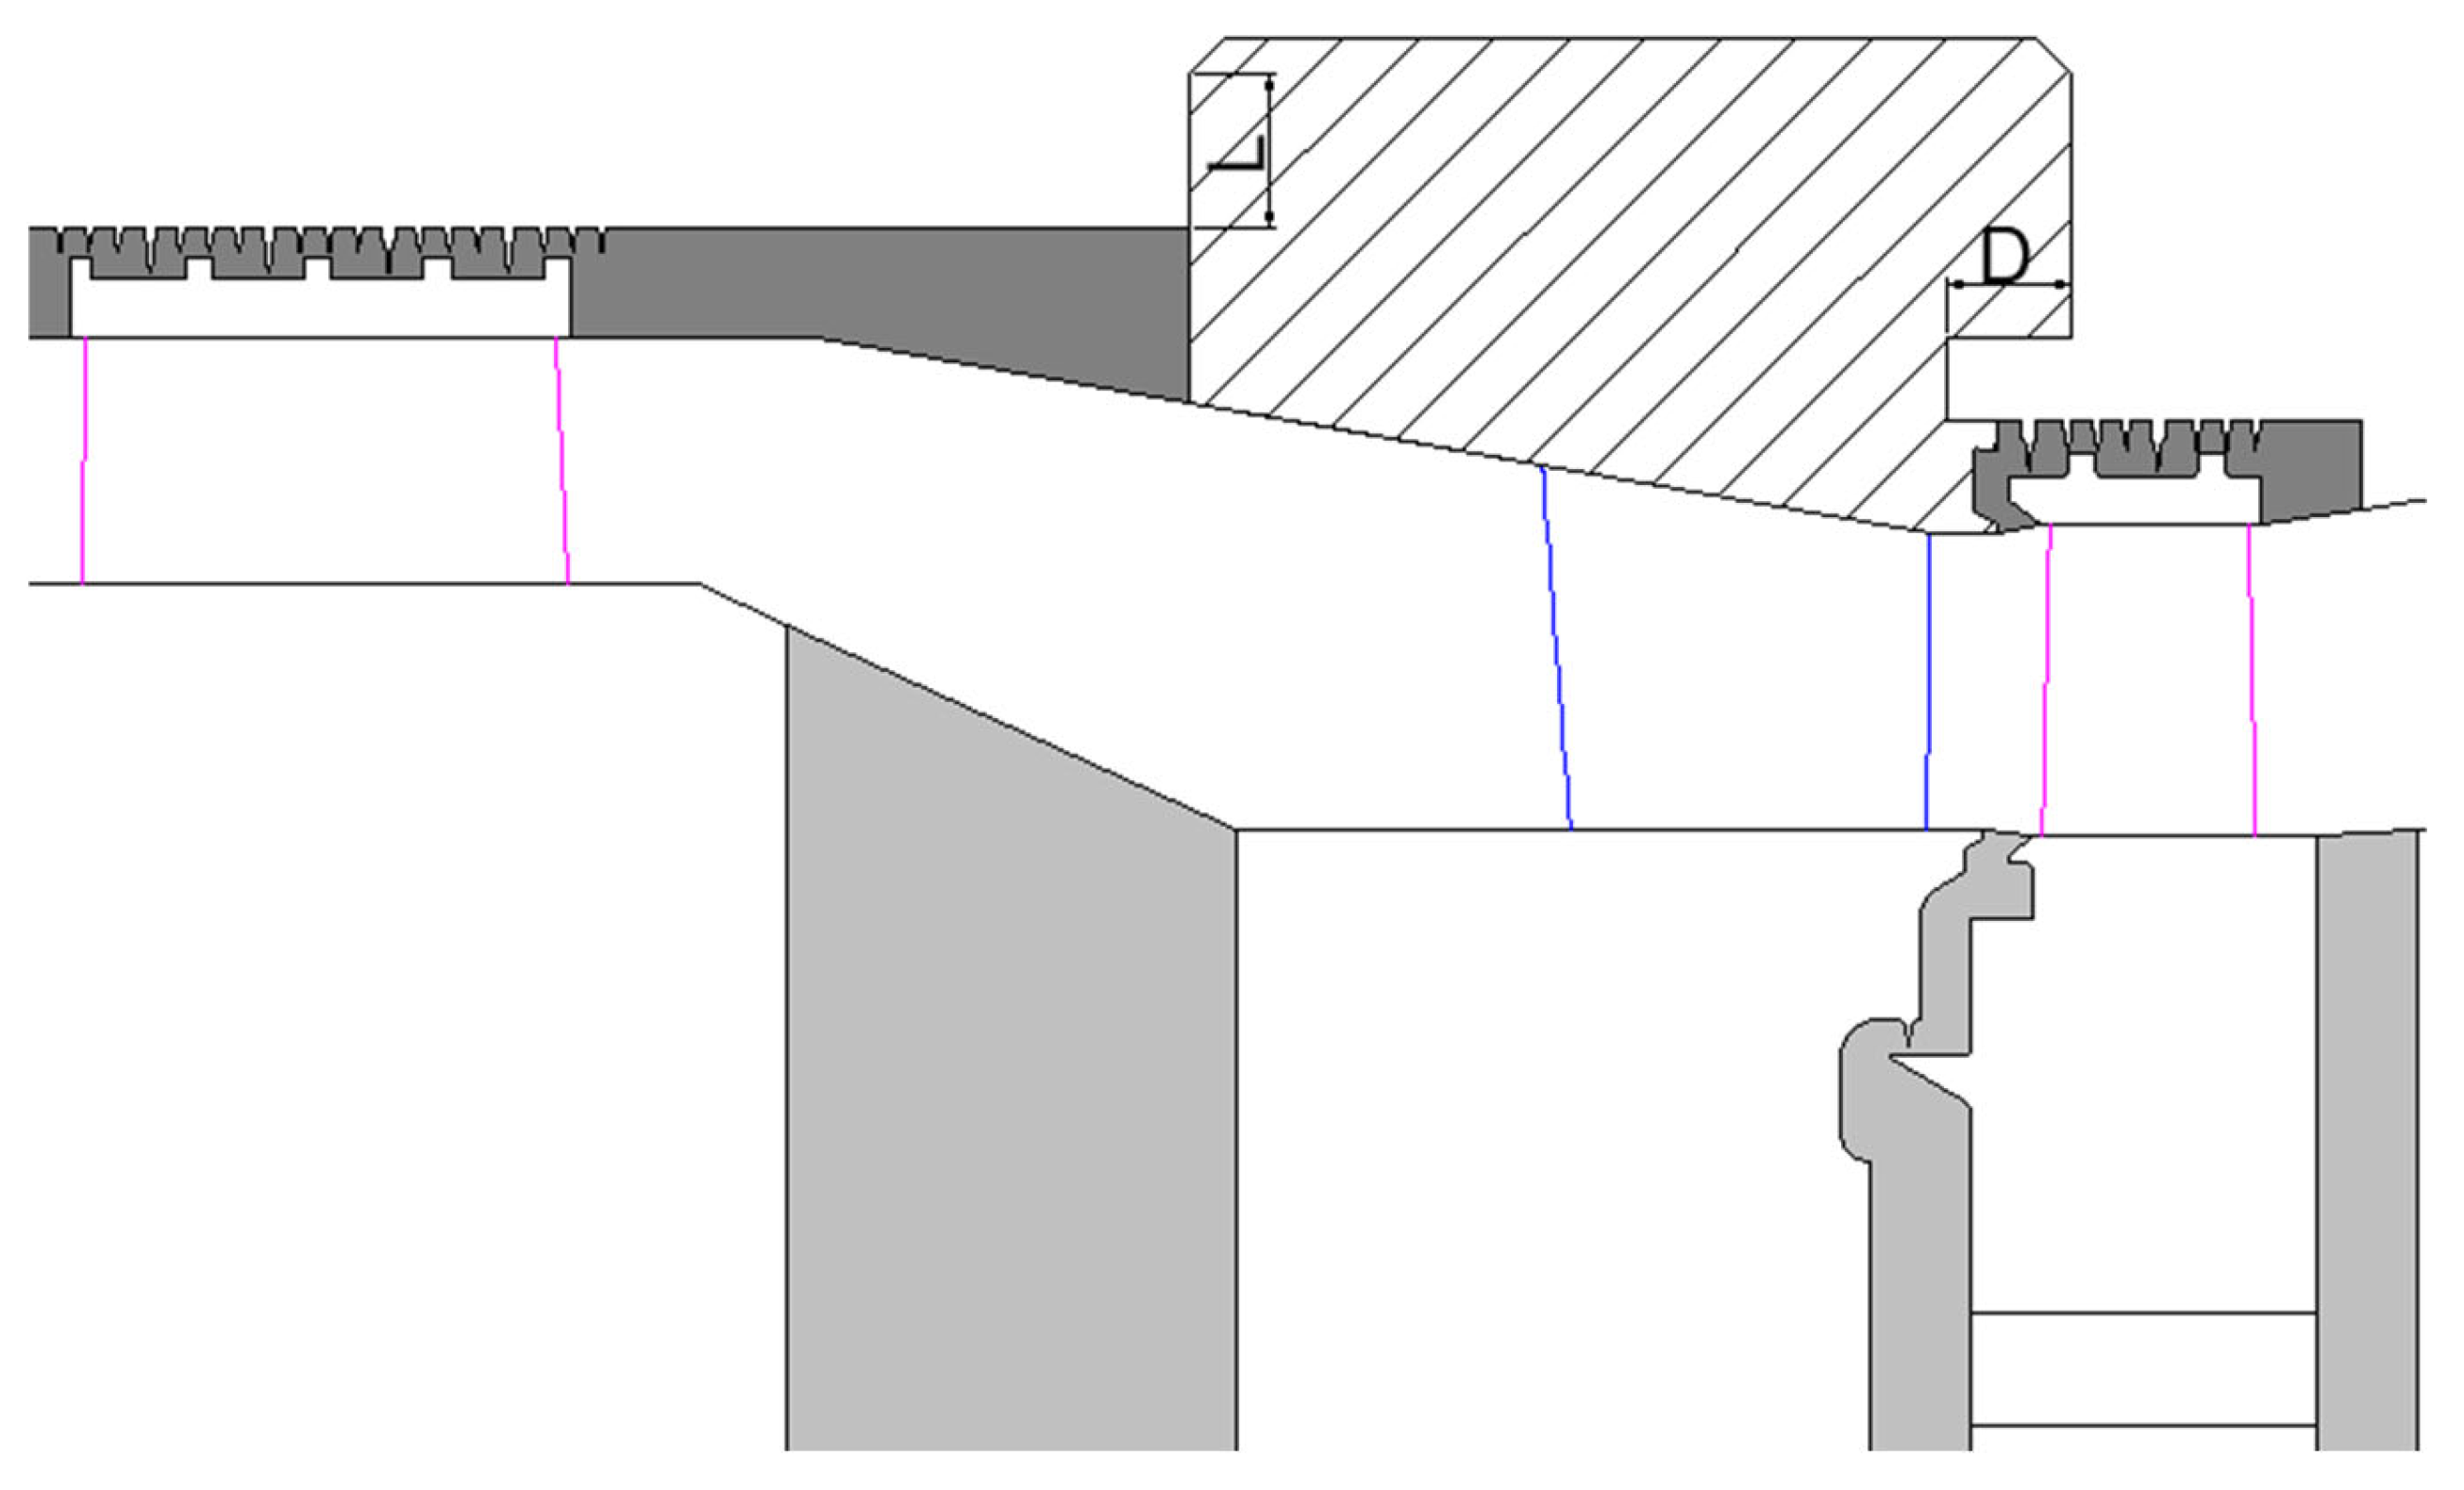
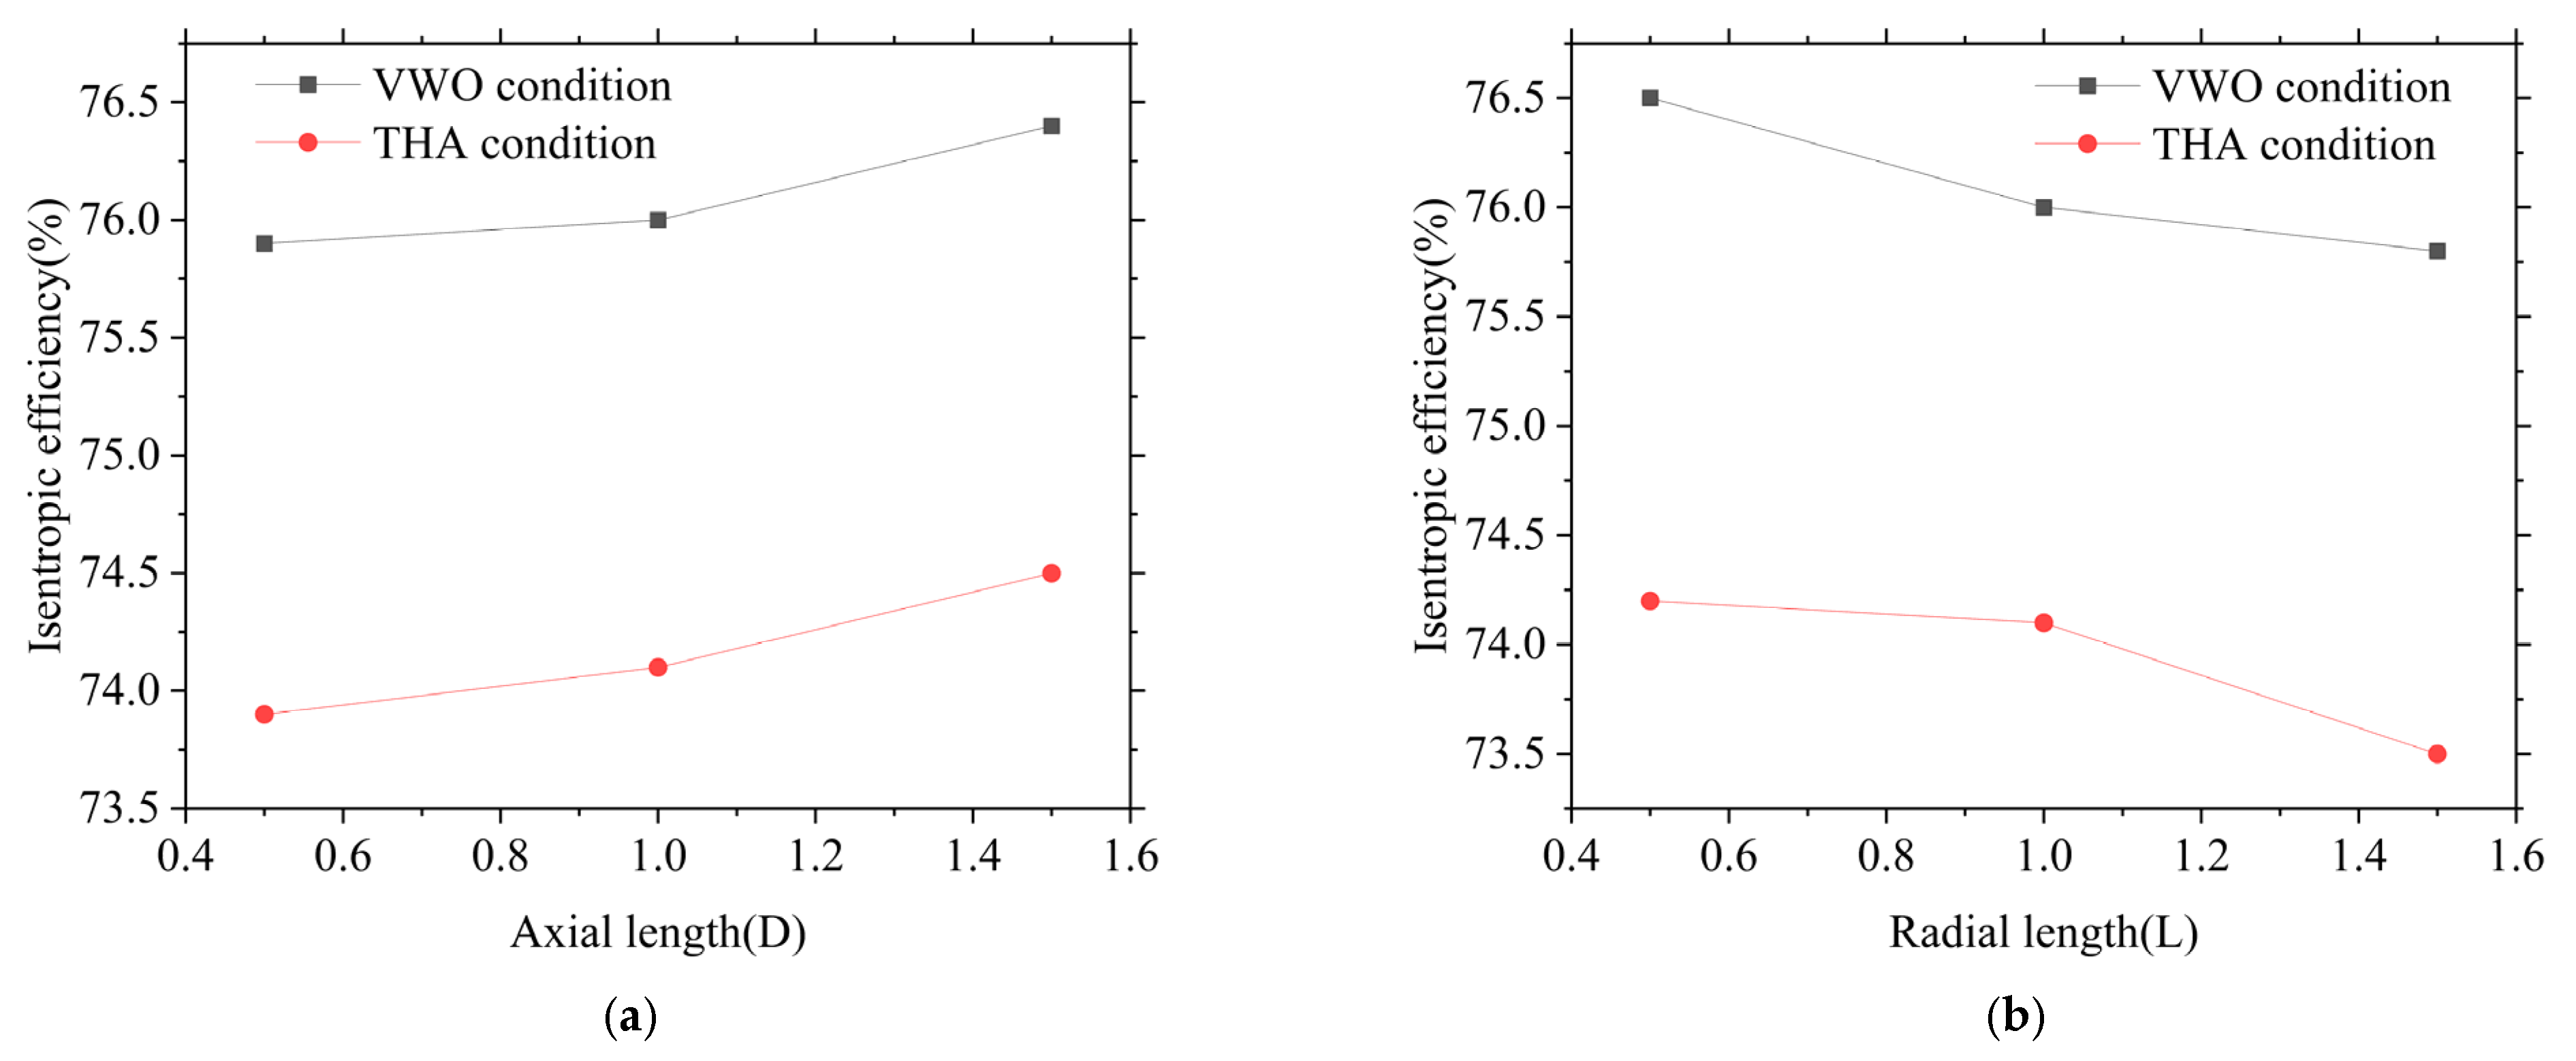
Given that parameters such as the root diameter and blade height of the regulating and pressure stages are fixed, the axial dimensions of the mixing chamber allow only limited variation. The structure is primarily controlled by the radial-dimensions, and the size of the narrow gap on the exhaust side also has a certain influence on the structure of the mixing chamber. Accordingly, this study examines the radial dimension L and the axial dimension D of the narrow exhaust-side gap under VWO and THA conditions. As illustrated in
Figure 11, D refers to the axial length of the protruding structure on the right side of the mixing chamber, with a baseline value of 27.3 mm. L denotes the radial height above the blade-tip seal on the upper side, with a baseline value of 22 mm. The original design corresponds to L and D. Using this baseline, scaling factors of 0.5, 1, 1.5, and additionally 0, 1, and 2 were applied to these dimensions while keeping the rest of the geometry unchanged.
Figure 12 shows the variation in the isentropic efficiency of the entire unit with changes in L and D under the VWO and THA conditions. It can be observed that as D increases, the isentropic efficiency gradually increases, while as L increases, the stage efficiency gradually decreases. This indicates that unit performance can be improved by increasing the axial length of the exhaust-side gap while reducing the radial height of the mixing chamber. These results offer valuable guidance for practical engineering design.
Blade loss in steam turbines, comprising both stationery and rotor blade loss, refers to the reduction in steam enthalpy as the flow passes through the blade passages. This energy is not converted into useful mechanical work but is instead dissipated as heat. Minimizing these losses is essential for improving turbine efficiency, which in turn enhances the economic and environmental performance of the power plant.
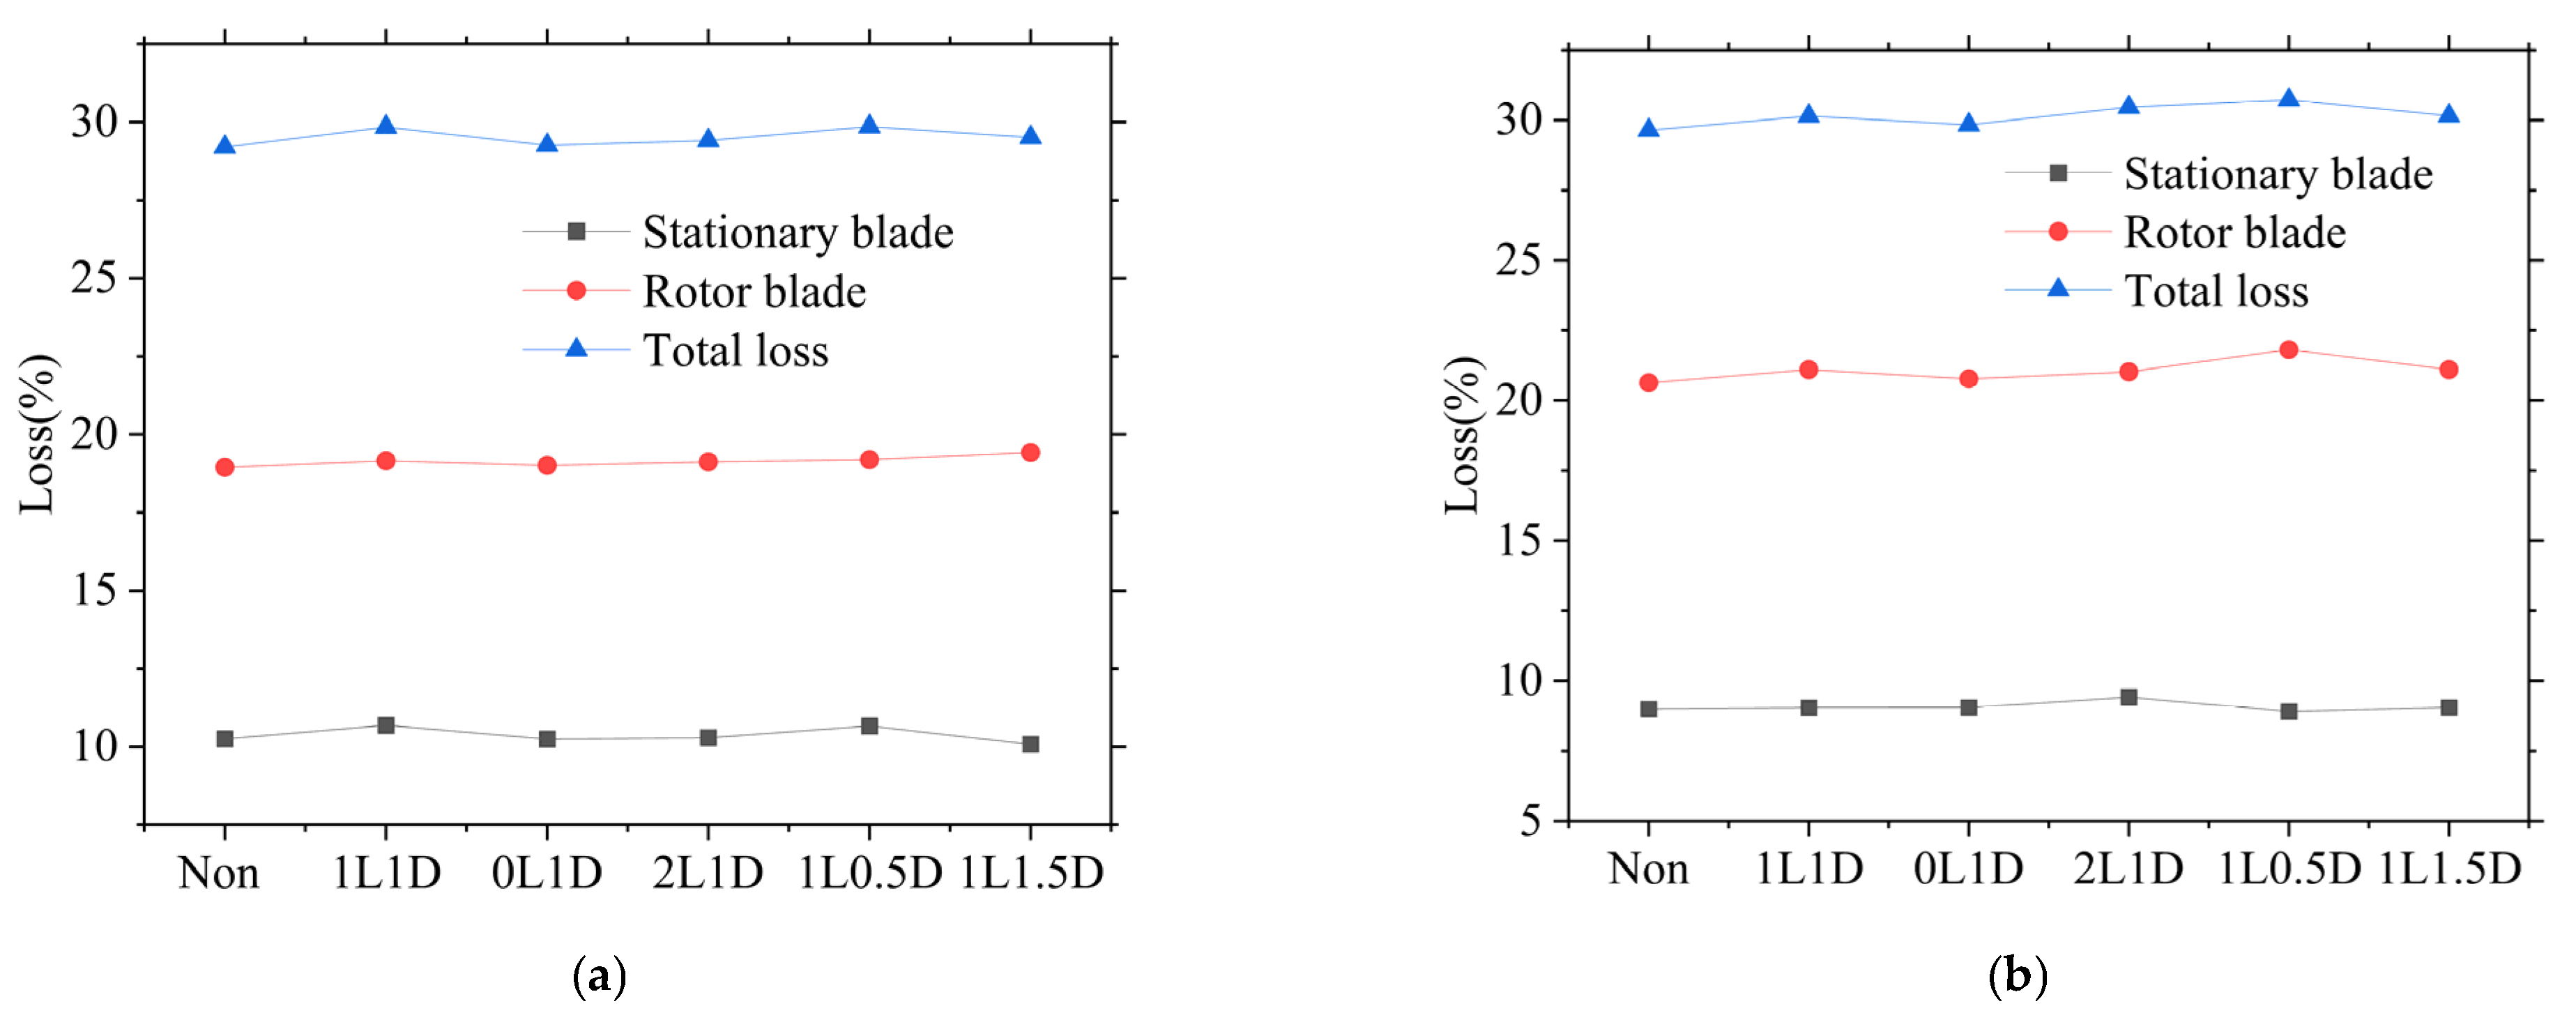
Using numerical simulation, the parameters required by Equations (7) and (8) were obtained, and the corresponding blade losses under two operating conditions were calculated, as shown in
Figure 13. For convenience, different operating conditions were designated by scaling factors. For example, the original design is labeled as 1L1D, and when the scaling factor for D is 0.5, it is labeled as 1L0.5D. Overall, the impact of the mixing chamber on the performance of the regulating stage is not significant. Under the VWO and THA conditions, the total losses in the stationary and rotor blades are 29.85% and 30.15%, respectively. Compared to a configuration without a mixing chamber, the presence of the mixing chamber results in a slight increase in the total losses, primarily due to friction losses between the steam and the mixing chamber wall. The minimum total loss is achieved with the 0L1D configuration, reaching 29.26% under the VWO condition and 29.84% under the THA condition. This corresponds to a reduction in regulating stage loss of 0.59% and 0.31%, respectively, indicating that appropriately reducing the radial dimension of the mixing chamber can improve turbine efficiency.
It should be noted that the numerical simulations in this study require further validation with experimental data. Additional measurements of parameters such as axial thrust are needed, along with the design of different mixing chamber structures to verify the accuracy of the numerical simulations. In the next stage, the staff of Dongfang Electric Corporation Dongfang Turbine Co., Ltd. is preparing to add relevant sensors for actual measurement in the actual unit. Then the parameters including isentropic efficiency, axial thrust and other parameters of the unit will be measured.


