Article

Experimental and Modeling Study of the Thermodynamic Behavior and Solubility of the NH4NO3–D-Sucrose–Water Ternary System at 298.15 K

1
Equipe de Thermodynamique et Energétique, Centre de Recherches en Energie, Département de Physique, Faculté de Sciences de Rabat, Université Mohammed V, Rabat 10090, Morocco
2
Ecole Royale Navale, Groupement de Recherche et Développement, Laboratoire de Thermodynamique et Energétique, Boulevard Sour Jdid, Casablanca 20000, Morocco
3
Laboratoire Matériaux, Procédés, Environnement et Qualité (LMPEQ), Ecole Nationale des Sciences Appliquées ENSA-Safi, Université Cadi Ayyad Marrakech, Route Sidi Bouzid, Safi 46000, Morocco
4
Institut Supérieur des Professions Infirmières et Techniques de Santé Marrakech, Rue Abdelouahab Derraq, Marrakech 40000, Morocco
*
Author to whom correspondence should be addressed.
Processes 2025, 13(11), 3438; https://doi.org/10.3390/pr13113438 (registering DOI)
Submission received: 26 August 2025 / Revised: 17 October 2025 / Accepted: 23 October 2025 / Published: 26 October 2025
(This article belongs to the Special Issue Applied Thermodynamics in Chemical Engineering)

Abstract

In this study, thermodynamic properties such as water activity, osmotic coefficient, and saturation points of the aqueous mixture in the system D-Sucrose + Water + ammonium nitrate (AN) were determined at 298.15 K. The measurements were carried out on the mixtures of concentrations of NH4NO3 (ranging from 0.1 to 6 mol·kg−1) and D-sucrose (from 0.1 to 4 mol·kg−1) using our hygrometric method. Powder X-ray diffraction (XRD) and attenuated total reflection–Fourier transform infrared (ATR-FTIR) spectroscopy were used to characterize the solid phases crystallized during the supersaturation of the solution. Other thermodynamic quantities such as the solute activity coefficients, excess Gibbs energies, transfer energies, and solute solubilities were calculated using the Pitzer–Simonson–Clegg (PSC) model. The results obtained indicate that at an AN concentration lower than 1 mol·kg−1, the system exhibits increasingly negative deviations from ideality, and that NH4NO3 promotes the salting-out effect of sucrose.

1. Introduction

Electrolytic and nonelectrolytic solutions are of great fundamental and theoretical interest in many scientific and industrial fields, including biology, pharmacy, chemistry, biochemistry, and the food industry [1,2,3,4,5]. In this study, we chose the compounds NH4NO3 (ammonium nitrate) and sucrose, which see high demanded in different industries. Ammonium nitrate is widely used in agriculture as a fertilizer [6], and under controlled conditions, as an explosive, and is also a reagent in chemical synthesis. Sucrose is widely employed in the food industry as a sweetener and preservative, contributing to both energy supply and microbial inhibition. Our objective in this study is to provide, for the first time, new physicochemical properties of the mixture of these two compounds in aqueous solution NH4NO3 + sucrose that do not exist in the literature and to deduce the influence of the properties of one on the other in this mixture which may be of great practical interest in the industrial fields mentioned above. Illustrating this relevance, Zhang et al. [6] examined the effects of ammonium nitrate and sucrose on enzyme activity (phosphoenolpyruvate carboxylase and ribulose-1,5-bisphosphate carboxylase/oxygenase), Nitrogen content and grain mass in wheat. The study concluded that the enzyme activities and the Nitrogen accumulation increased with higher C and N supplies. Grain Nitrogen concentration rose with NH4NO3 but decreased with sucrose.
Other authors have studied the different properties and interactions between solvent and solute in the mixture of salt(aq) − sugar(aq) [7,8,9,10,11,12,13,14]. However, there is no bibliographic data for the properties and saturation limits of aqueous NH4NO3(aq) + D-sucrose(aq)systems.
In this context, we studied the thermodynamic properties and saturation points of the aqueous NH4NO3–sucrose–water system using the hygrometric method designed in our laboratory [10,14,15]. Relative humidity data for the mixtures were measured at 298.15 K for various sucrose concentrations (0.1- 0.3- 0.5- 1.0- 2.0- 3.0 and 4.0 mol·kg−1) and different molalities of NH4NO3 (0.10, 0.50, 1.00, 2.00, 3.00, 4.00, 5.00, and 6.00 mol·kg−1).
From the experimental results obtained on relative humidities, we deduced other quantities, such as the water activities and osmotic coefficients of the studied ternary system NH4NO3 + D-sucrose + H2O. Other thermodynamic quantities (solute activity coefficients, excess Gibbs energies, transfer energies, and solute solubility) were calculated using the Pitzer–Simonson–Clegg model [16,17,18]. In addition, the XRPD and ATR-FTIR techniques were employed to identify the crystallized solid phases.

2. Experimental Section

Water activities were obtained from measurements of relative humidity above aqueous solutions containing non-volatile electrolytes. Experiments were performed at 298.15 K (±0.02 K) and at 0.1 MPa (±0.002 MPa).
For preparing the NaCl, NH4NO3, and sucrose solutions, we used anhydrous Merck and Fluka products from France (Table 1), and deionized water (its conductivity is about 5.10−6 S.cm−1). Standard uncertainties of molalities were determined using error propagation techniques with u(m) = 0.01 mol·kg−1 (Appendix A).
Using a camera and diameter measurement software, an average of the hundreds of droplet diameters was determined with a relative uncertainty of approximately ur = 0.0025. The relative uncertainty of relative humidity measurements was then deduced using error propagation (see Appendix A). Accurate measurement of relative humidity required temperature stability and thermodynamic equilibrium (which is achieved after 1 h, unlike the isopiestic method, which takes a few days). Therefore, the standard uncertainty, calculated at a confidence level of 0.68, depended on the relative humidity hr (equivalent to aw) level. More precisely, the standard uncertainties ranged from u(aw) = 0.0002 for dilute solutions to u(aw) = 0.005 for concentrated solutions (Appendix A).

Hygrometric Method

The water activity in electrolyte solutions can be evaluated by relative humidity. The relative humidity above the solution was measured using the set of devices described in Figure 1. This method of measuring relative humidity, called the hygrometric method, was designed in our laboratory and had been used for the study of thermodynamic properties of several aqueous systems of electrolytes and aqueous mixtures containing several electrolytes and it has shown its effectiveness in several publications. We provide a brief description of this method and the set of accessories used, which are illustrated in Figure 1.
Reference droplets, usually aqueous NaCl or LiCl, are sprayed onto a fine thread formed by small spiders so as not to distort the spherical shape of the drops. The thread containing the drops is fixed to a support by vacuum grease. Then, this support is placed above a small cup containing a few cubic centimeters of the solution to be studied. A digital microscope equipped with software allows the drops, with diameters of a few hundred microns, to be accurately measured. The cups are then placed in a thermostatically controlled chamber at a regulated temperature below the microscope objective, equipped with an extension on which a camera is fixed, which allows for viewing the captured image of the diameters on a computer screen. The diameters of several drops on the thread are measured several times, and their averages are determined to deduce their growth ratios (Figure 1).
Concept of the hygrometric method:
Assuming thermodynamic equilibrium between the liquid phase of water and its vapor, the activity of water aw is expressed by:
aw = Pw/P0w,
The practical identification of relative humidities (hr) of solutions is closely associated with the aw water activities as expressed by:
hr = aw,
The literature gives the physico-chemical properties for the NaCl(aq) and LiCl(aq) reference solutions. Based on the given data, we deduce the formulation between molar concentration of solutions and the relative humidity, and consequently, the variation in drop diameters of the reference solutions with the surrounding hr.
Generally, the drop has a spherical appearance with a diameter D, and its volume V is:
V= (4/3)π(D/2)3,
The volume of the drop changes due to water evaporation from or condensing onto the solution. Consequently, the diameter of the drop increases or decreases during these processes. The growth ratio K expresses the variation in droplet diameter relative to the diameter of the same droplet measured above the reference solution at 0.84.
K = D(aw)/D(aref),
where D(aref) and D(aw) denote the droplet diameters above the solution at reference aref = 0.84 or 0.98 and at unknown aw, respectively.
The relationship between ratio K and concentration is:
C = n/V,
where n represents the solute mole number in droplet and C denotes solute molar concentration in this droplet. Consequently, the following relationship is obtained:
K = [C(aref)/C(aw)]1/3,
where C(aw) and C(aref) represent concentrations of solutions at unknown relative humidity aw and at aref = 0.84 (or 0.98), respectively. The calibration procedure consists of correlating the droplet diameter D(0.84) or D(0.98) with the relative humidity. A (D(aw)) above the studied solution is measured. The aw is then deduced by calculating the ratio K. If the relative humidity is above 0.75, we use the NaCl reference solution. Conversely, the LiCl solution is employed for aw below 0.75.
The saturation points of the water/D-sucrose/ammonium nitrate (NH4NO3) system were determined through the hygrometric technique. This approach involved gradually adding small amounts of sucrose or NH4NO3 to pre-prepared D-sucrose-H2O or NH4NO3-H2O until the diameter no longer varied. We characterized a solid phase using a LABXXRD-6100 Shimadzu powder X-ray diffractometer equipped with Cu radiation, operated at 40 kV and 25 mA. Diffraction patterns were recorded by scanning the samples over a 2θ range of 10° to 70°, with a scanning speed of 2.4° min−1 and a step size of 0.02°.
The FT-IR-ATR spectra of the composites were collected at a resolution of 4 cm−1 using a Jasco FT/IR 4600 spectrometer equipped with a Pro One type attenuated total reflectance (ATR) accessory.

3. Thermodynamic Formwork

3.1. Estimation of Thermodynamic Properties

Within the McMillan–Mayer framework, the total Gibbs free energy of a considered solution consisting of 1 kg of solvent (water, W), a molality mN of sucrose (N), and a molality mE of ammonium nitrate (E)–dissociating into νE ions–is expressed on the molality scale as [19]:
G m N , m E = G W ° R T m N ν E   m E + μ N ° m N + R T m N ln m N + μ E °   m E + R T   m E l n   m E + G E X m N 2 + G E X ( m E 3 / 2 )   +   2 ν E   m E m N g E N + m N 2 g N N + 3 ν E m E m N 2 g E N N + 3 ν E 2 m E 2 m N g E E N
where G W ° represents the free energy of 1 kg of pure water, μ N ° and μ E ° denote the standard chemical potentials of sucrose and NH4NO3, respectively. G E X m N 2 and G E X ( m E 3 / 2 ) correspond to the excess free energies of the binary systems sucrose–water and NH4NO3–water. The coefficients gEN, gNN, gENN, gENN, …, are the pair interaction and triplet interaction parameters. The data on the Gibbs energy of transfer of NH4NO3 from water to sucrose–water mixtures were used for optimization of these interaction parameters.
The free energy of transfer of NH4NO3 from water to sucrose–water mixtures correspond to the difference between the chemical potential of NH4NO3 in aqueous solutions of NH4NO3–sucrose–water and in pure water. Under conditions of constant temperature and pressure, this relation is expressed as:
Δ G tr E W W + N   =   G m N , m E / m E m N     G m E / m E m N = 0 = 2 ν E m N g EN   +   3 ν E m N 2 g ENN   +   6 ν E 2 m N m E g EEN +
The triplet interaction terms can be neglected for the low-electrolyte and non-electrolyte species concentrations, and the salting coefficients are calculated from the pair interaction parameter [20]. In this present work, the salting coefficient ηs is:
R T η s = 2   υ E   g E N
where ηs is the salting constant of NH4NO3, expressing the phenomena of salting-out and salting-in. The Gibbs energy of transfer of NH4NO3 from water to mixtures of sucrose–water is calculated using the expression [21]. For the Gibbs energy of transfer for electrolyte AN (E = NH4NO3):
Δ G t r E W W + N = μ E W , E , N μ E W , E = υ E   R T ln γ E W , E , N γ E 0 W , E
To calculate the excess properties and activity coefficients in the solutions of the studied binary and ternary systems, we used the PSC (Pitzer–Simonson–Clegg) model [16,17,18]. This model, using the mole-fraction scale, was developed to describe highly concentrated aqueous mixtures of ions with symmetrical charges. Within this framework, the excess Gibbs free energy is expressed as the sum of a long-range Debye–Hückel term and short-range interaction terms, allowing for the determination of both solvent and solute activity coefficients. In the present work, the PSC model is employed to calculate osmotic coefficient, activity coefficient, excess Gibbs free energy, and solubility of D-sucrose and NH4NO3 in the NH4NO3/D-sucrose/water system at 298.15 K. The PSC equations, recognized as one of the most reliable approaches for mixed electrolytes, have been successfully applied in our previous studies to reproduce the non-ideal behavior of ternary electrolyte–D-sucrose–water systems over a wide concentration range. In this model, the excess Gibbs free energy is partitioned into long-range and short-range electrostatic contributions. For the ammonium nitrate (AN)–D-sucrose (2)–water (1) system, the long-range interaction term can be expressed as:
g P S C e x R T = x 1 x 1 . W 1 . M X + x 2 . W 2 . M X + x 1 2 x 1 . U 1 . M X + x 2 . U 2 . M X + x I 2 x 1 2 V 1 . M X + x 2 2 V 2 . M X + x 1 x 2 W 12 + u 12 x 1 x 2 + x 1 ( Y 1,2 , M X ( 0 ) + Y 1,2 , M X ( 1 ) x I 2 4 )
x1, x2, and x I x I = 1 x 1 x 2 represent the mole fractions of D-sucrose, water, and ions, respectively. R denotes the universal gas constant, and T is the absolute temperature. The model parameters BMX, W1.MX, U1.MX, and V1.MXwere optimized using experimental data for the single NH4NO3–water system, whereas the interaction parameters w12 and u12 were adjusted based on data from the D-sucrose–water binary system. The parameters W2.MX, U2.MX, and V2.MX describe the interactions between NH4NO3 and D-sucrose, while Y 1.2 . M X ( 0 ) and Y 1.2 . M X ( 1 ) are the mixing parameters characterizing the behavior of mixtures containing both ionic and non-ionic species. The long-range Pitzer–Debye–Hückel term is expressed as:
g P D H e x R T = 4 A x I x ρ ln 1 + ρ I x 1 2 + ( x I 2 4 ) B M X g ( α I x 1 2 )
Ax is the Debye–Hückel constant, with a value of 2.917 [11]. The symbol ρ denotes the closest approach parameter, set at 14.0292 [11], and α is the standard value, typically taken as 13 [13]. BMX represents the Pitzer interaction parameter for the MX ion pair, while Ix refers to the ionic strength I x = 1 2 i = 1 z i 2 x i . The function ( g y = α I x ) is:
g y = 2 y 2 1 1 + y e x p ( y )
The differentiation of Equations (12) and (13) allows for the determination of mean activity coefficients of solutes and solvents. The water activity coefficient is given by:
ln γ 1 = 2 A X I X 3 / 2 1 + ρ I X 1 / 2 I X 2 B M X exp α I x 1 / 2 + x I 1 x 1 W 1 , M X x 2 W 2 , M X + x I 2 1 2 x 1 U 1 , M X 2 x 2 U 2 , M X + x I 2 x 1 2 3 x 1 V 1 , M X 3 x 2 2 V 2 , M X + 2 x 2 I x 1 2 x 1 Y 1 , 2 , M X 0 + x I 3 4 x 2 1 4 x 1 Y 1 , 2 , M X 1 + x 2 1 x 1 w 12 + 2 x 1 x 2 1 x 1 + x 2 u 12
The D-sucrose activity coefficient is expressed as
The ionic mean activity coefficient of AN in D-sucrose/Water system is:
ln γ 2 = 2 A X I X 3 / 2 1 + ρ I X 1 / 2 I X 2 B M X exp α I x 1 / 2 + x I 1 x 2 W 2 , M X x 1 W 1 , M X + x I 2 1 2 x 2 U 2 , M X 2 x 1 U 1 , M X + x I 2 x 2 2 3 x 2 V 2 , M X 3 x 1 2 V 1 , M X + 2 x 1 I x 1 2 x 2 Y 1 , 2 , M X 0 + x I 3 4 x 1 1 4 x 2 Y 1 , 2 , M X 1 + x 1 1 x 2 w 12 + 2 x 1 x 2 1 x 2 x 1 u 12 w 12 + u 12
ln γ ± = A X 2 ρ ln 1 + ρ I x 1 / 2 + I x 1 / 2 1 2 I x 1 + ρ I x 1 / 2 + I x 2 B M X g α I x 1 / 2 + exp α I x 1 / 2 1 x I + 1 x I x 1 W 1 , M X + x 2 W 2 , M X + 2 x I 1 x I x 1 U 1 , M X + x 2 U 2 , M X + x I 2 3 x I x 1 2 V 1 , M X + x 2 2 V 2 , M X + x 1 x 2 1 4 I x Y 1 , 2 , M X 0 + 3 I x 2 x I 3 Y 1 , 2 , M X 1 x 1 x 2 w 12 + 2 x 1 x 2 u 12 W 1 , M X
The excess Gibbs free energy of the ternary water–D-sucrose–ammonium nitrate (AN) is given by:
g e x R T = i = 1 x i ln γ i = x 1 ln γ 1 + x 2 ln γ 2 + x I ln γ ±
The total excess Gibbs free energy G e x is given by:
G e x = i n i g e x
where ni represents the number of moles of component i.

3.2. Estimation of Solubility Data

3.2.1. D-Sucrose Solubility

The D-sucrose solubility ( m s ) in a mixture containing a salt is determined from its saturation molality ( m s 0 ) in pure water. Therefore, the equilibrium expression can be written as:
m s γ s = m s 0 γ s 0 ,
m s 0 and γ s 0 represent the molality and activity coefficient of D-sucrose at the saturation point in the binary D-sucrose–water system, respectively, with their values at 298 K taken from the literature [22].   m s   and γ s denote the molality and activity coefficient of D-sucrose in the studied ternary system, respectively.

3.2.2. Electrolyte Solubility

The dissolution of NH4NO3 in the ternary system H2O–D-sucrose–ammonium nitrate (AN) can be represented by:
k s p = m N H 4 + γ N H 4 + m N O 3 γ N O 3 = m N H 4 N O 3 2 γ ± , N H 4 N O 3 2 ,
here γ ± N H 4 N O 3 is the mean ionic activity coefficient of NH4NO3, while m N H 4 N O 3 denotes its molality. The reported value of the solubility product, ksp, is given in our earlier work [23].

3.3. Optimization of Model Parameters

The measured data of ϕ (osmotic coefficient) and given mean ionic activity coefficient data for the binary NH4NO3–water and D-sucrose–water subsystems, as well as data of ternary water–D-sucrose–NH4NO3 system, were utilized to optimize the interaction parameters. The Marquardt algorithm [24] was applied to minimize the objective function, S ϕ , given as:
S = 1 N p i = 1 N ( i e x p i c a l ) 2 + 1 N γ p i = 1 N γ ( ln γ i e x p ln ( γ i c a l ) ) 2
and Nγ correspond to the total number of experimental measurements employed, while p is the count of fitted parameters.

4. Results and Discussion

Experimental determinations were carried out to evaluate the aw and ϕ of sucrose and NH4NO3 at various molalities. The molalities investigated for D-sucrose ranged from 0.1 to 4 mol·kg−1, whereas for NH4NO3, the tested molalities ranged from 0.1 mol·kg−1 to 6 mol·kg−1. For the ϕ, the uncertainty is about u(ϕ) = 0.009.
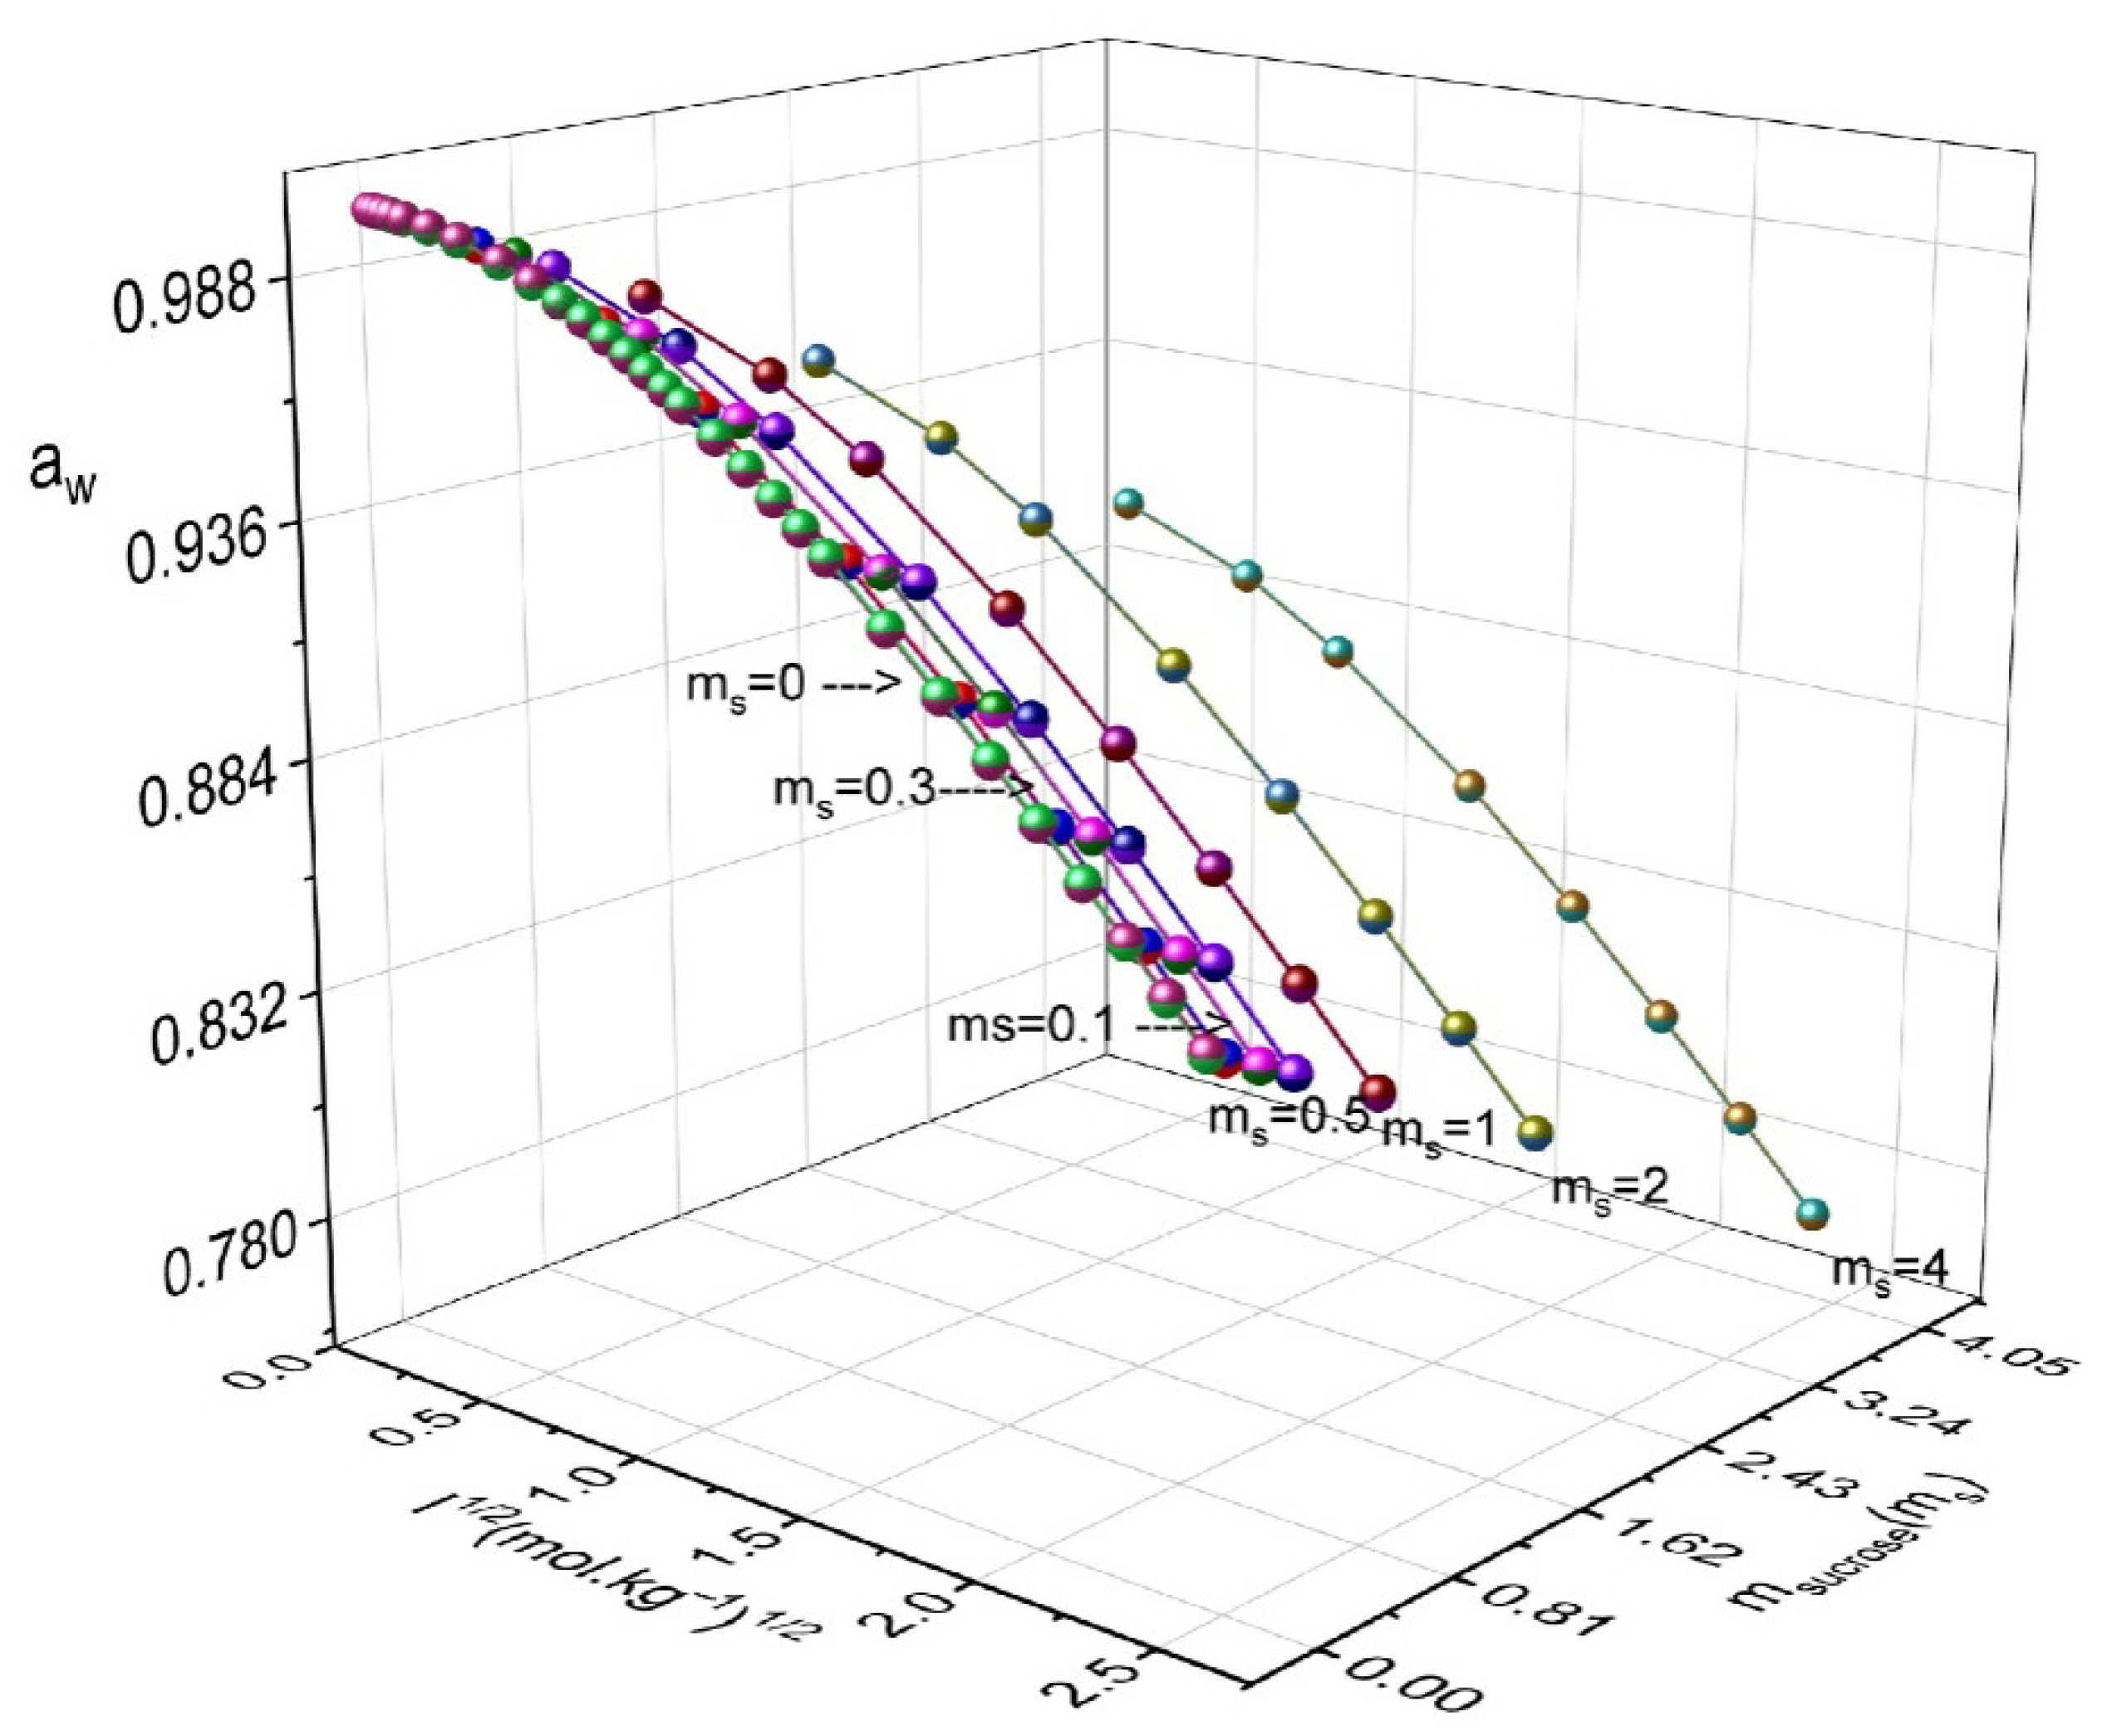
We reported in Table 2 the experimental data of ϕ and aw. Figure 2 illustrates the water activity versus the square root of ionic strength for the concentrations of D-sucrose. For all D-sucrose contents, water activity decreases with increasing molality. This behavior is commonly observed in aqueous solutions of non-volatile electrolytes. The addition of NH4NO3 to the D-sucrose–water system significantly influences its thermodynamic properties. These changes result from the specific interactions between water and D-sucrose, NH4NO3 and water, and NH4NO3 and D-sucrose, as well as from the ternary interactions among all three components. This implies that the presence of NH4NO3 substantially disrupts the hydration structure of the sugar solution. These interactions are governed by the hydration degree of each species, which directly affects the system’s activity.
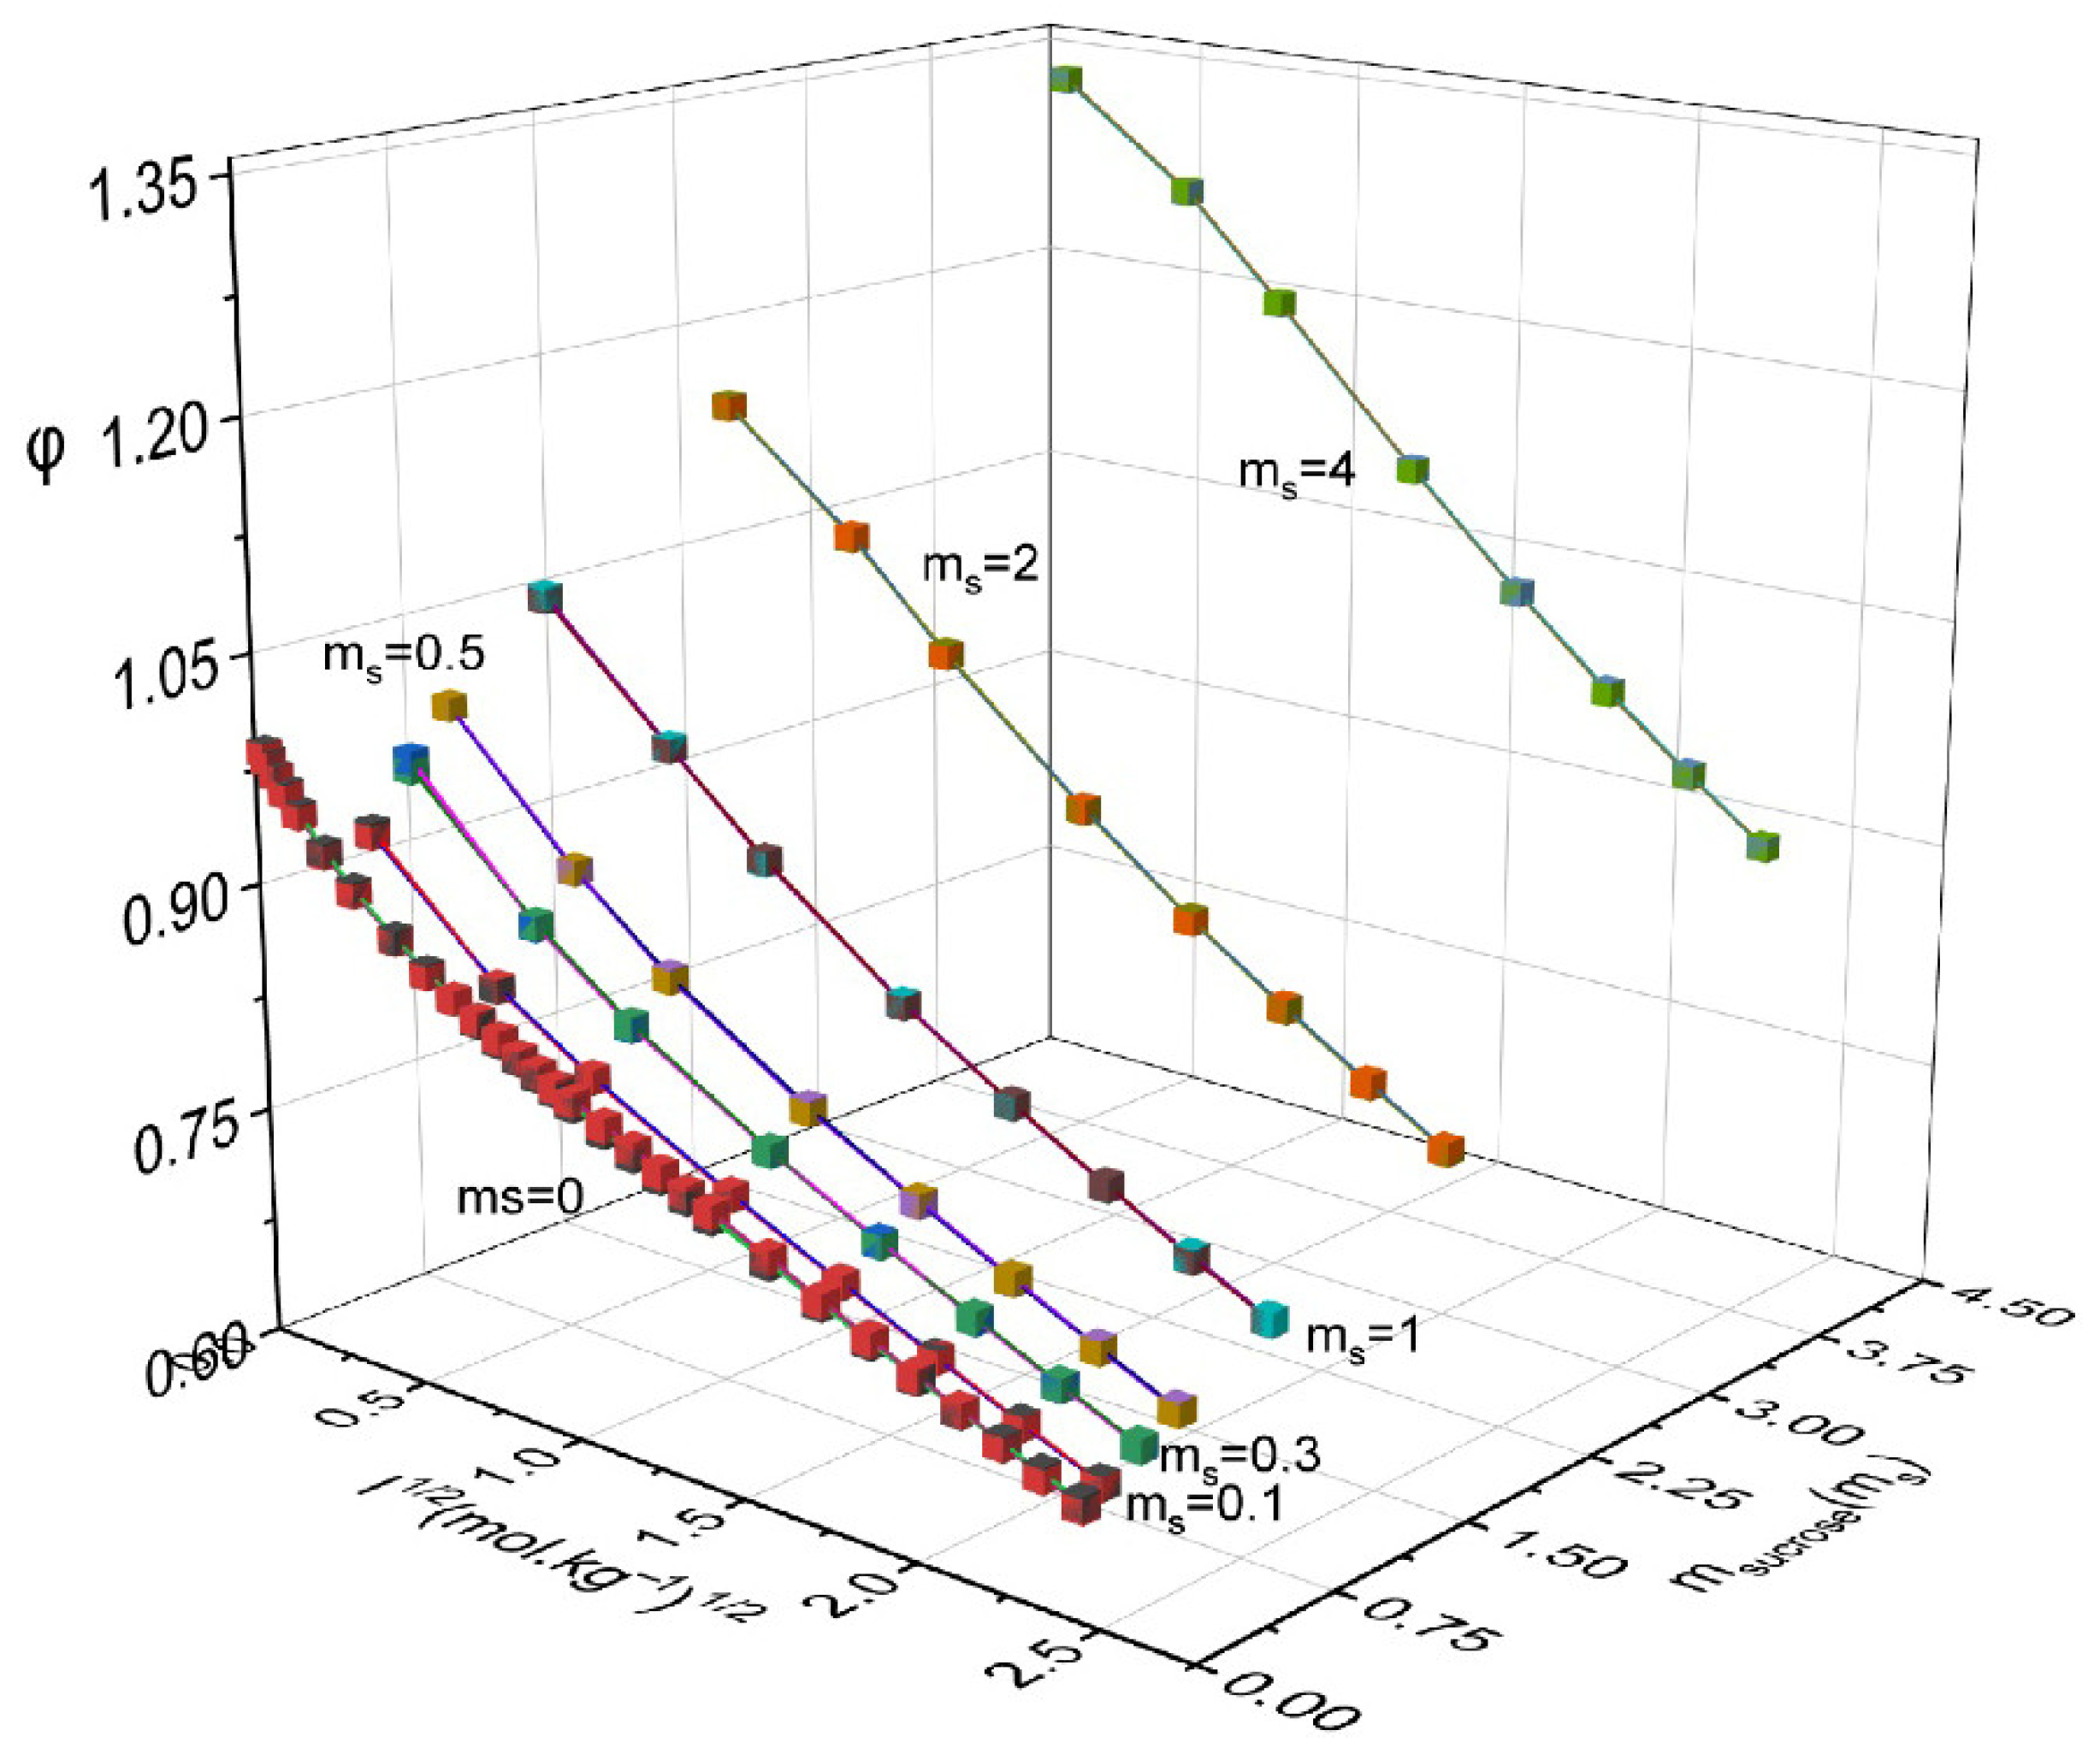
Figure 3 represents the osmotic coefficients derived from activities of water measurements for the studied Water–D-sucrose–ammonium nitrate (AN) system. The graph indicated that, at constant NH4NO3 concentration, this coefficient increased with rising D-sucrose content. However, the curves do not follow a uniform trend as a function of sucrose molality. Additionally, a slight decrease in the osmotic coefficient was observed with increasing NH4NO3 concentration.
The activities of water aw were correlated with the ECA equation (Appendix B) [25], the Lin et al. correlation (Appendix C) [26], and the Lietzke and Stoughton (LS II) equation (Appendix D) [27,28]. The thermodynamic data used to optimize the parameters of ECA and Lin et al. equations were taken from Robinson and Stokes [26] for the binary water–D-sucrose system and from this work and data reported in the literature [29,30] for the water–NH4NO3 system. Our experimental data for the ternary system were then employed to determine the mixing coefficients of the Lin et al. and ECA equations. For the ECA correlation, λ = 0.00438 (mol·kg−1)−2 and δ = 0.000758 (mol·kg−1)−3, while for the Lin et al. equation, C12 = 0.0000418. The calculated a w and ϕ using the ECA and Lin et al. equations show good agreement with the experimental data. In contrast, predictions obtained using the LS II exhibit significant deviations from the measured values. This discrepancy is attributed to the inherent limitation of the LS model, which treats the behavior of the mixture as a simple sum of the behavior of its individual components, thereby neglecting specific interactions present in the ternary system.
To calculate the parameters of the PSC model for the water–sucrose–NH4NO3 system, the sum of squared deviations between calculated and experimental osmotic coefficients was minimized. The ionic parameters BMX, W1,MX, U1,MX, and V1,MX were determined from experimental data on osmotic coefficients (ϕ) and mean ionic activity coefficients (γ ± AN) for the water–NH4NO3 system [15]. For the water–D-sucrose system, the Margules parameters w12 and u12 were taken from the data in Robinson et al. [21]. The W2,MX, U2,MX, V2,MX, Y (0)1,2,MX, and Y(1)1,2,MX were obtained from measured ϕ in this study. In Table 3, these parameters are given with their standard deviations.
The standard deviations show that aw and ϕ are more reliable for the sucrose–water and NH4NO3–water systems. Our goal is to determine the optimized parameters of the model for the studied system. The results revealed important details about the interactions between different substances of the solution.
The developed model was applied to determine activity coefficients of NH4NO3 and sucrose, as well as the excess Gibbs free energy, in the ternary H2O–sucrose–ammonium nitrate. The corresponding results are presented in Table 4, while the graphical representations are shown in Figure 4, Figure 5 and Figure 6.
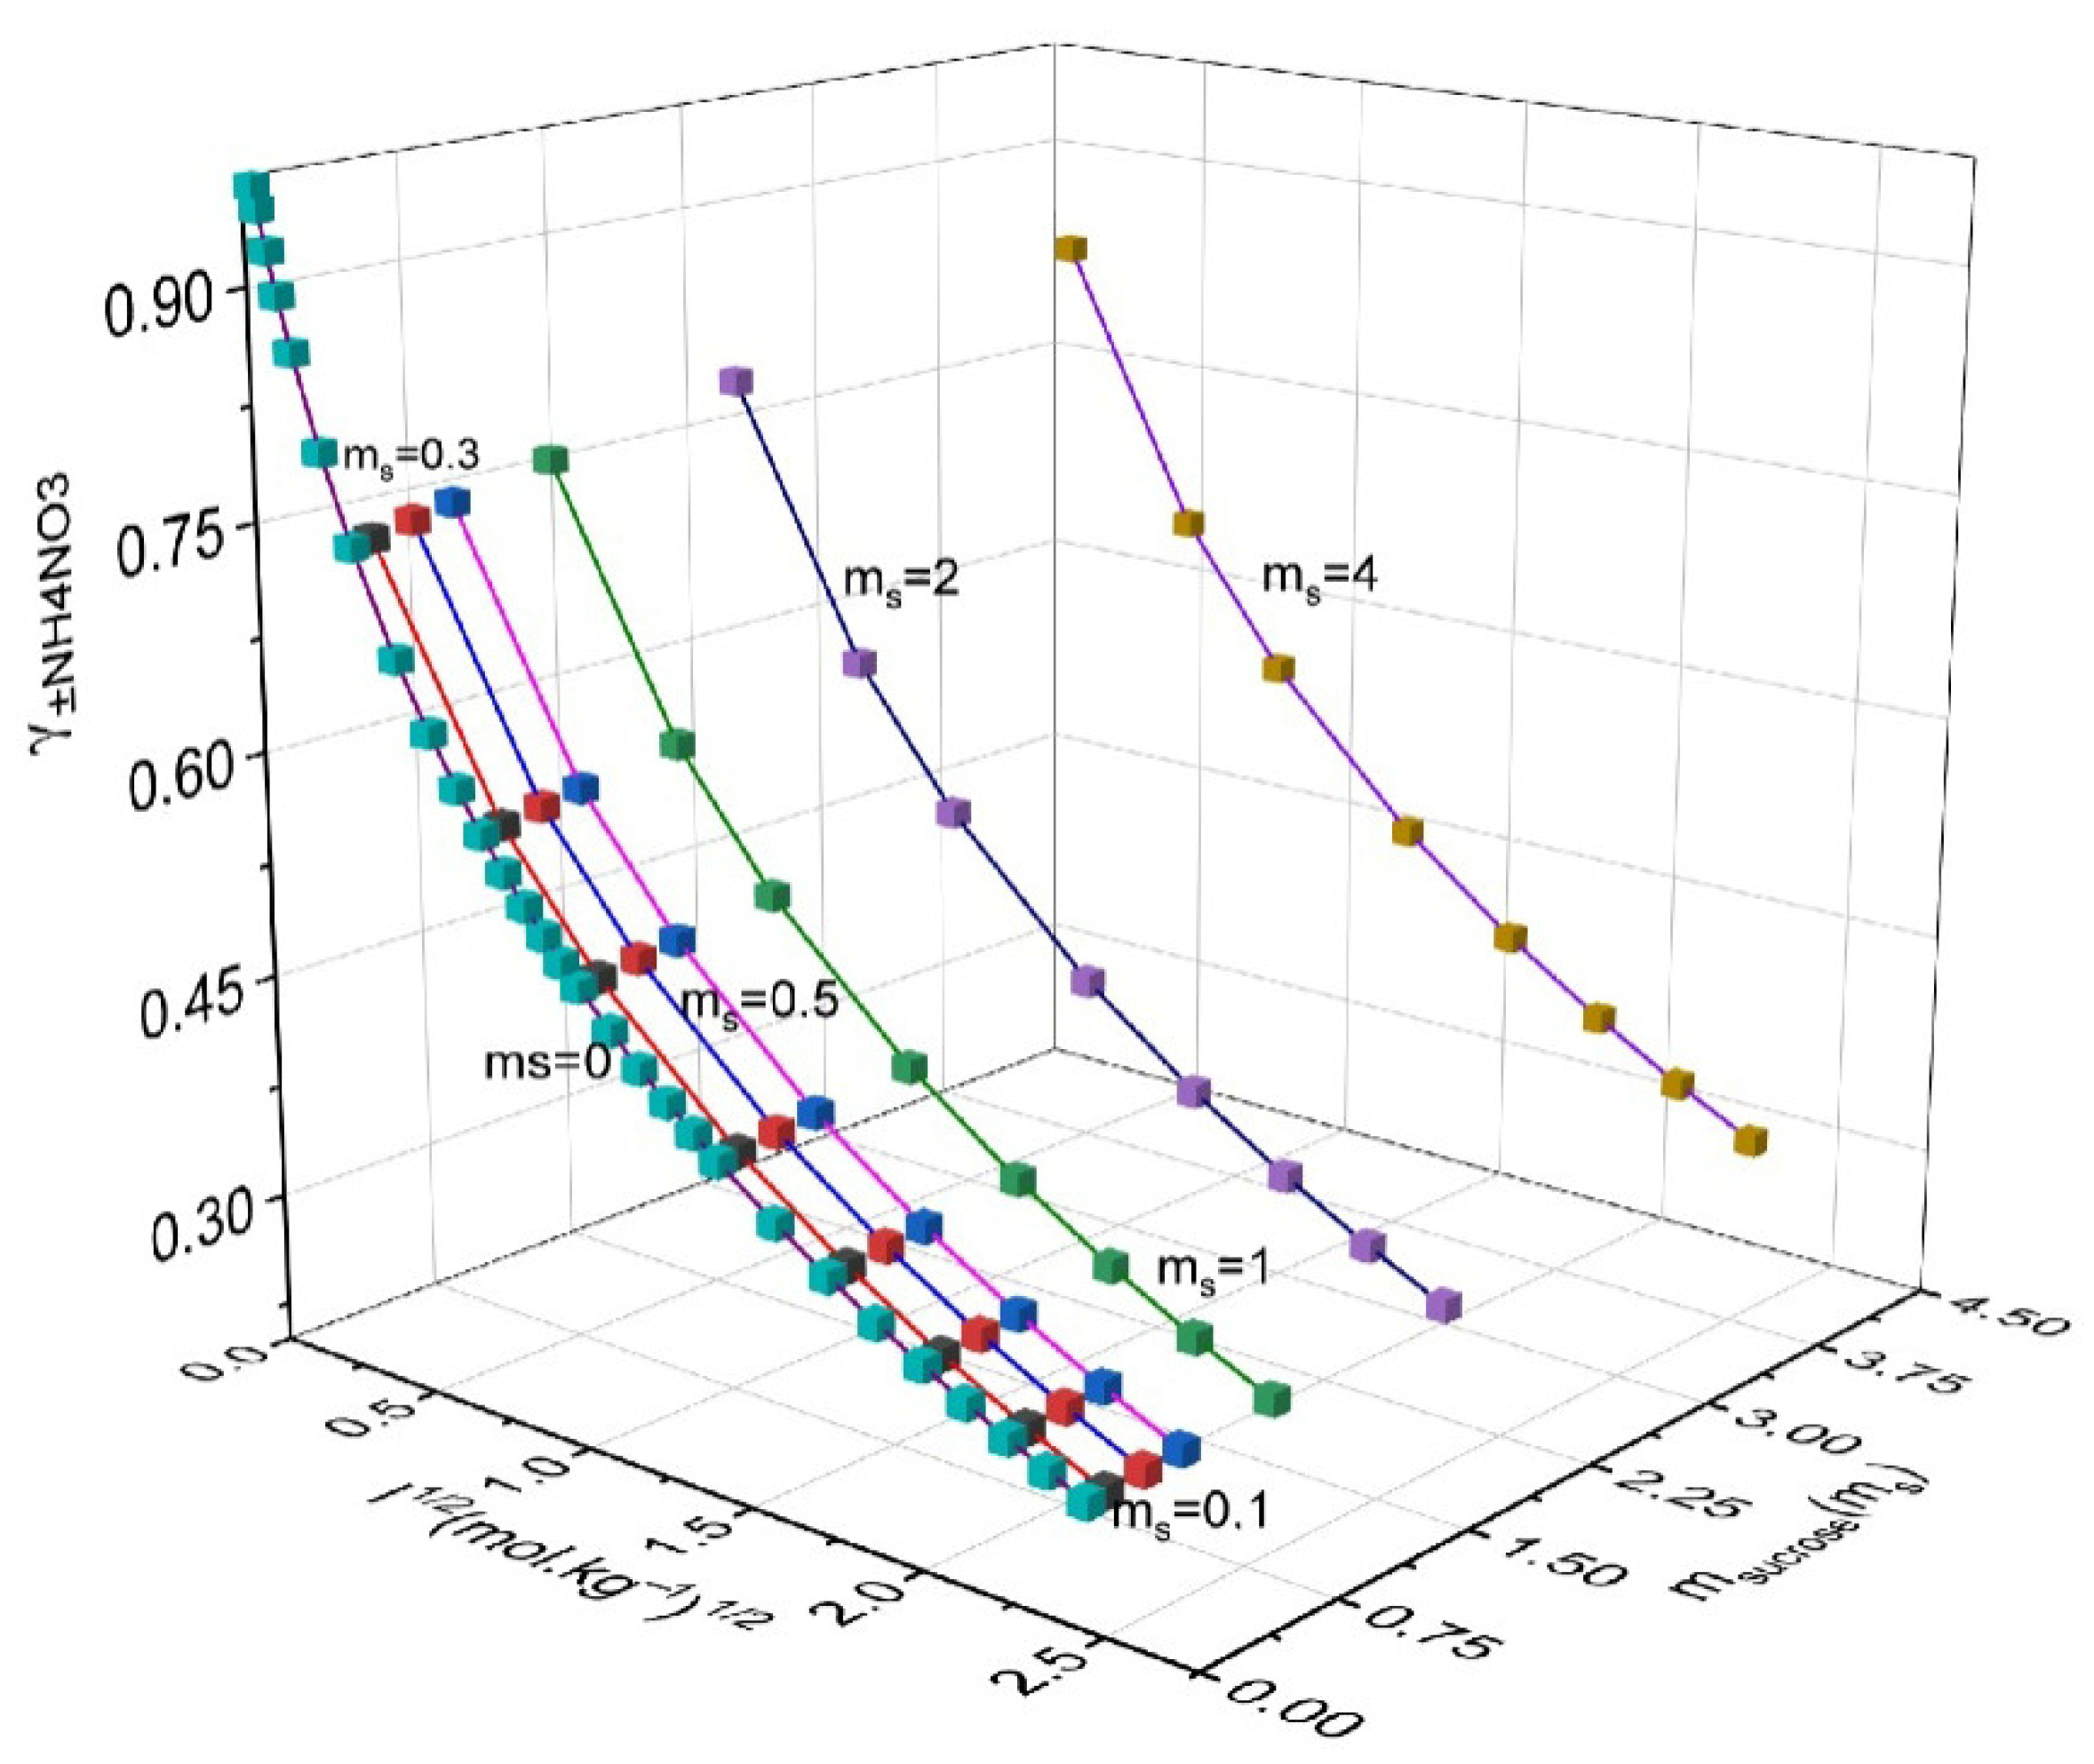
Figure 4 shows the variation in activity coefficient of ammonium nitrate (AN) in the ternary solution. The curves followed a clear pattern influenced by ion–ion interactions, ion–water molecules hydration, and water molecules–sucrose molecules interactions. In solutions with a high AN concentration and molality of sucrose inferior to 1 mol·kg−1, the ammonium nitrate activity coefficients are very close to that in pure aqueous NH4NO3. However, when the D-sucrose concentration exceeds 1 mol·kg−1, the activity coefficient γ(NH4NO3) decreases as ammonium nitrate concentration increases but shows a slight increase with higher D-sucrose levels. This behavior results from different interactions between ions and molecules of sucrose, and those between molecules of water and molecules of sucrose, which together affect the solution’s thermodynamics.
Figure 5 illustrates the variation in the activity coefficient of sucrose. All curves exhibit a similar trend, depending on the amounts of D-sucrose and ammonium nitrate. The data show that the activity coefficient of sucrose in the ternary solutions is higher than in pure aqueous sucrose solutions, indicating that NH4NO3 strongly affects the sucrose activity coefficient and induces a salting-out effect. Moreover, as ammonium nitrate concentration increases, both sucrose activity coefficient and the salting-out effect become more pronounced. The results obtained show that the thermodynamic properties of sucrose are affected by the addition of the salt NH4NO3. This is due to different types of interactions such as binary water–sucrose, electrolyte–water and electrolyte–sucrose interactions, as well as ternary interactions between NH4NO3 ions, sucrose molecules, and water molecules. Table 4 shows that the addition of NH4NO3 to sugar solutions disrupts the hydration structure of the solution with respect to sugar. These interactions are affected by the degree of hydration of each component and, consequently, by the activity coefficient. As the NH4NO3 concentration increases, the activity coefficient of sugar in mixed solution decreases, passes through a minimum at about 3 mol·kg−1 of NH4NO3, and then increases with the amount of NH4NO3 in aqueous solution, all of which were observed at different molalities of sucrose. This behavior of the activity coefficient in the mixture may be due to the ion–solvent and sugar–solvent interactions by hydration and the ion–sugar molecule interaction. Thus, the effect of short-range ion–solvent interactions is important in the low concentration region, and similarly for ion–sucrose in high concentrations. Indeed, the negative deviation from ideality was observed for the salt concentration inferior to 3 mol·kg−1; at this molality, the deviation is greater and the interaction is also greater between the species in solution by hydration. At a molality above 3 mol·kg−1, the activity coefficients of sucrose in the aqueous solution increase along with the increase in its molality and salt concentration, resulting in the phenomenon of salting-out and a decrease in its hydration. This illustrates the important influence of the electrolyte on sucrose.
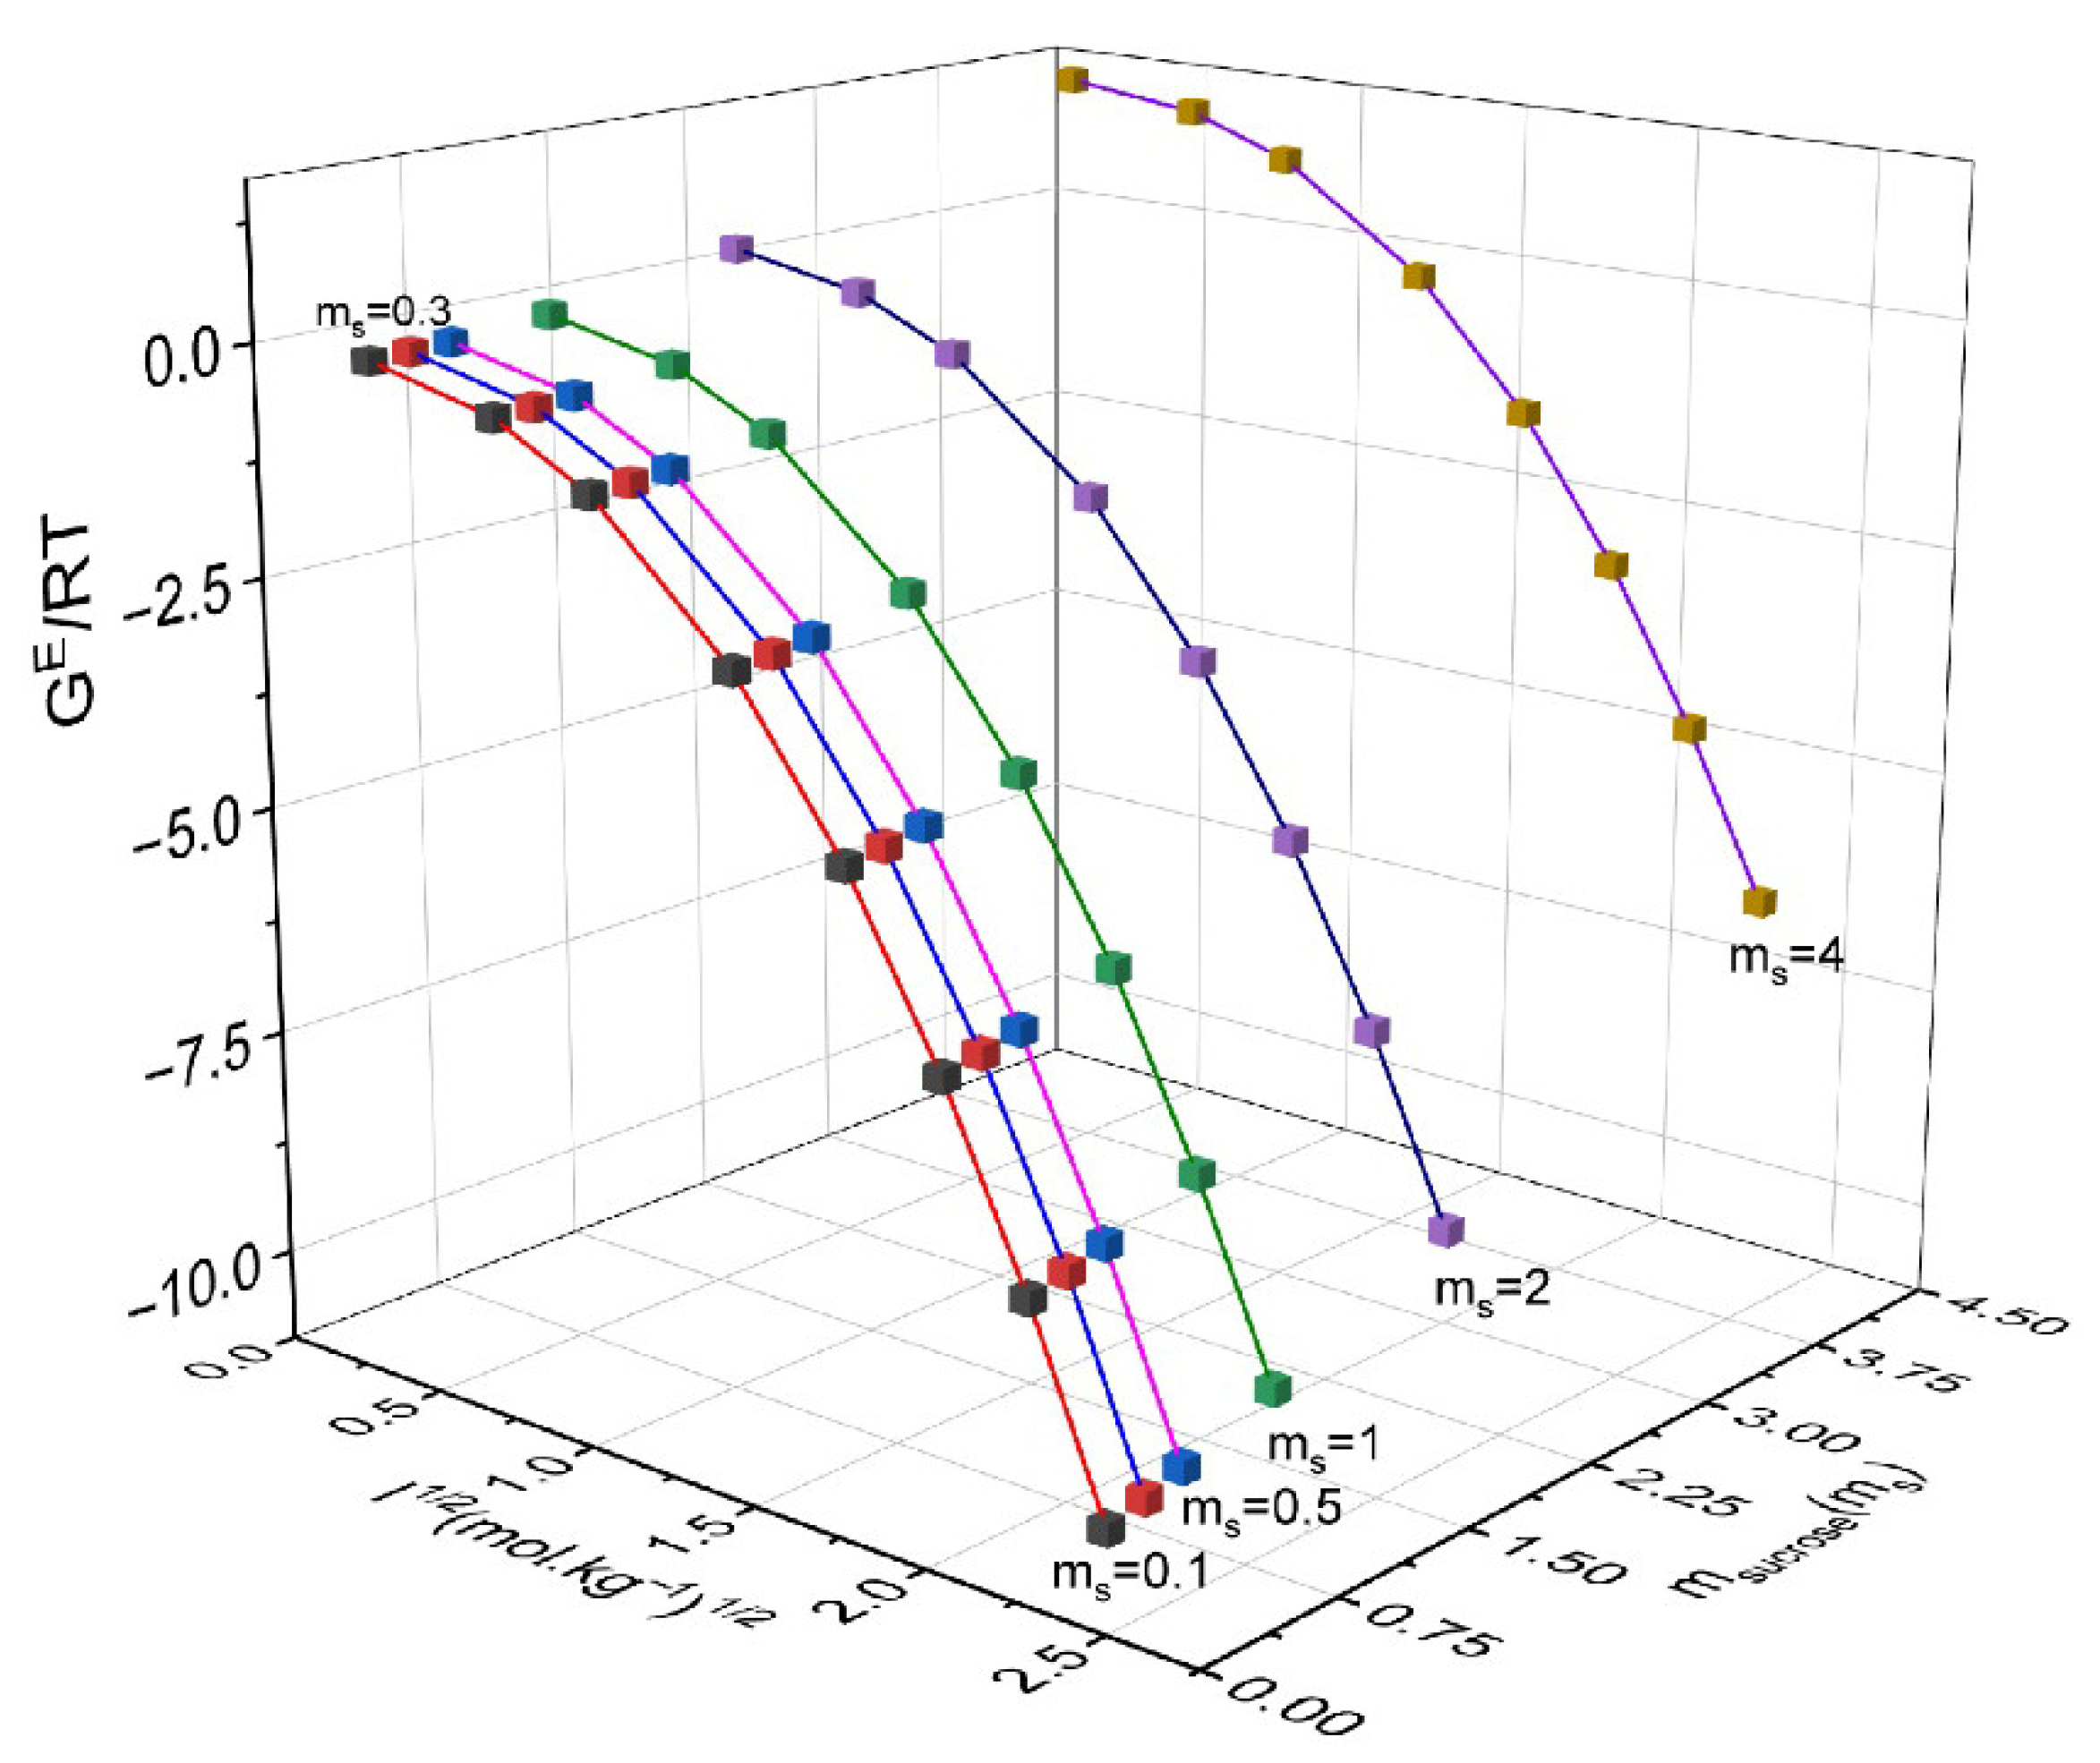
The values of GE/RT gE were determined across the entire range of molalities studied for NH4NO3 and sucrose using the parameters of Equations (14) to (18). Table 4 presents the calculated GE/RT gE for the water–sucrose–AN system at different sucrose concentrations. The results show similar overall trends: as the concentration of D-sucrose increases, the excess Gibbs free energy also increases, suggesting stronger interactions between sucrose molecules and the other system components. Conversely, as ionic strength increases, the excess Gibbs free energy decreases, indicating that ions weaken the interactions of sucrose with other species in the solution. These observations are consistent with the obtained data (Figure 6).
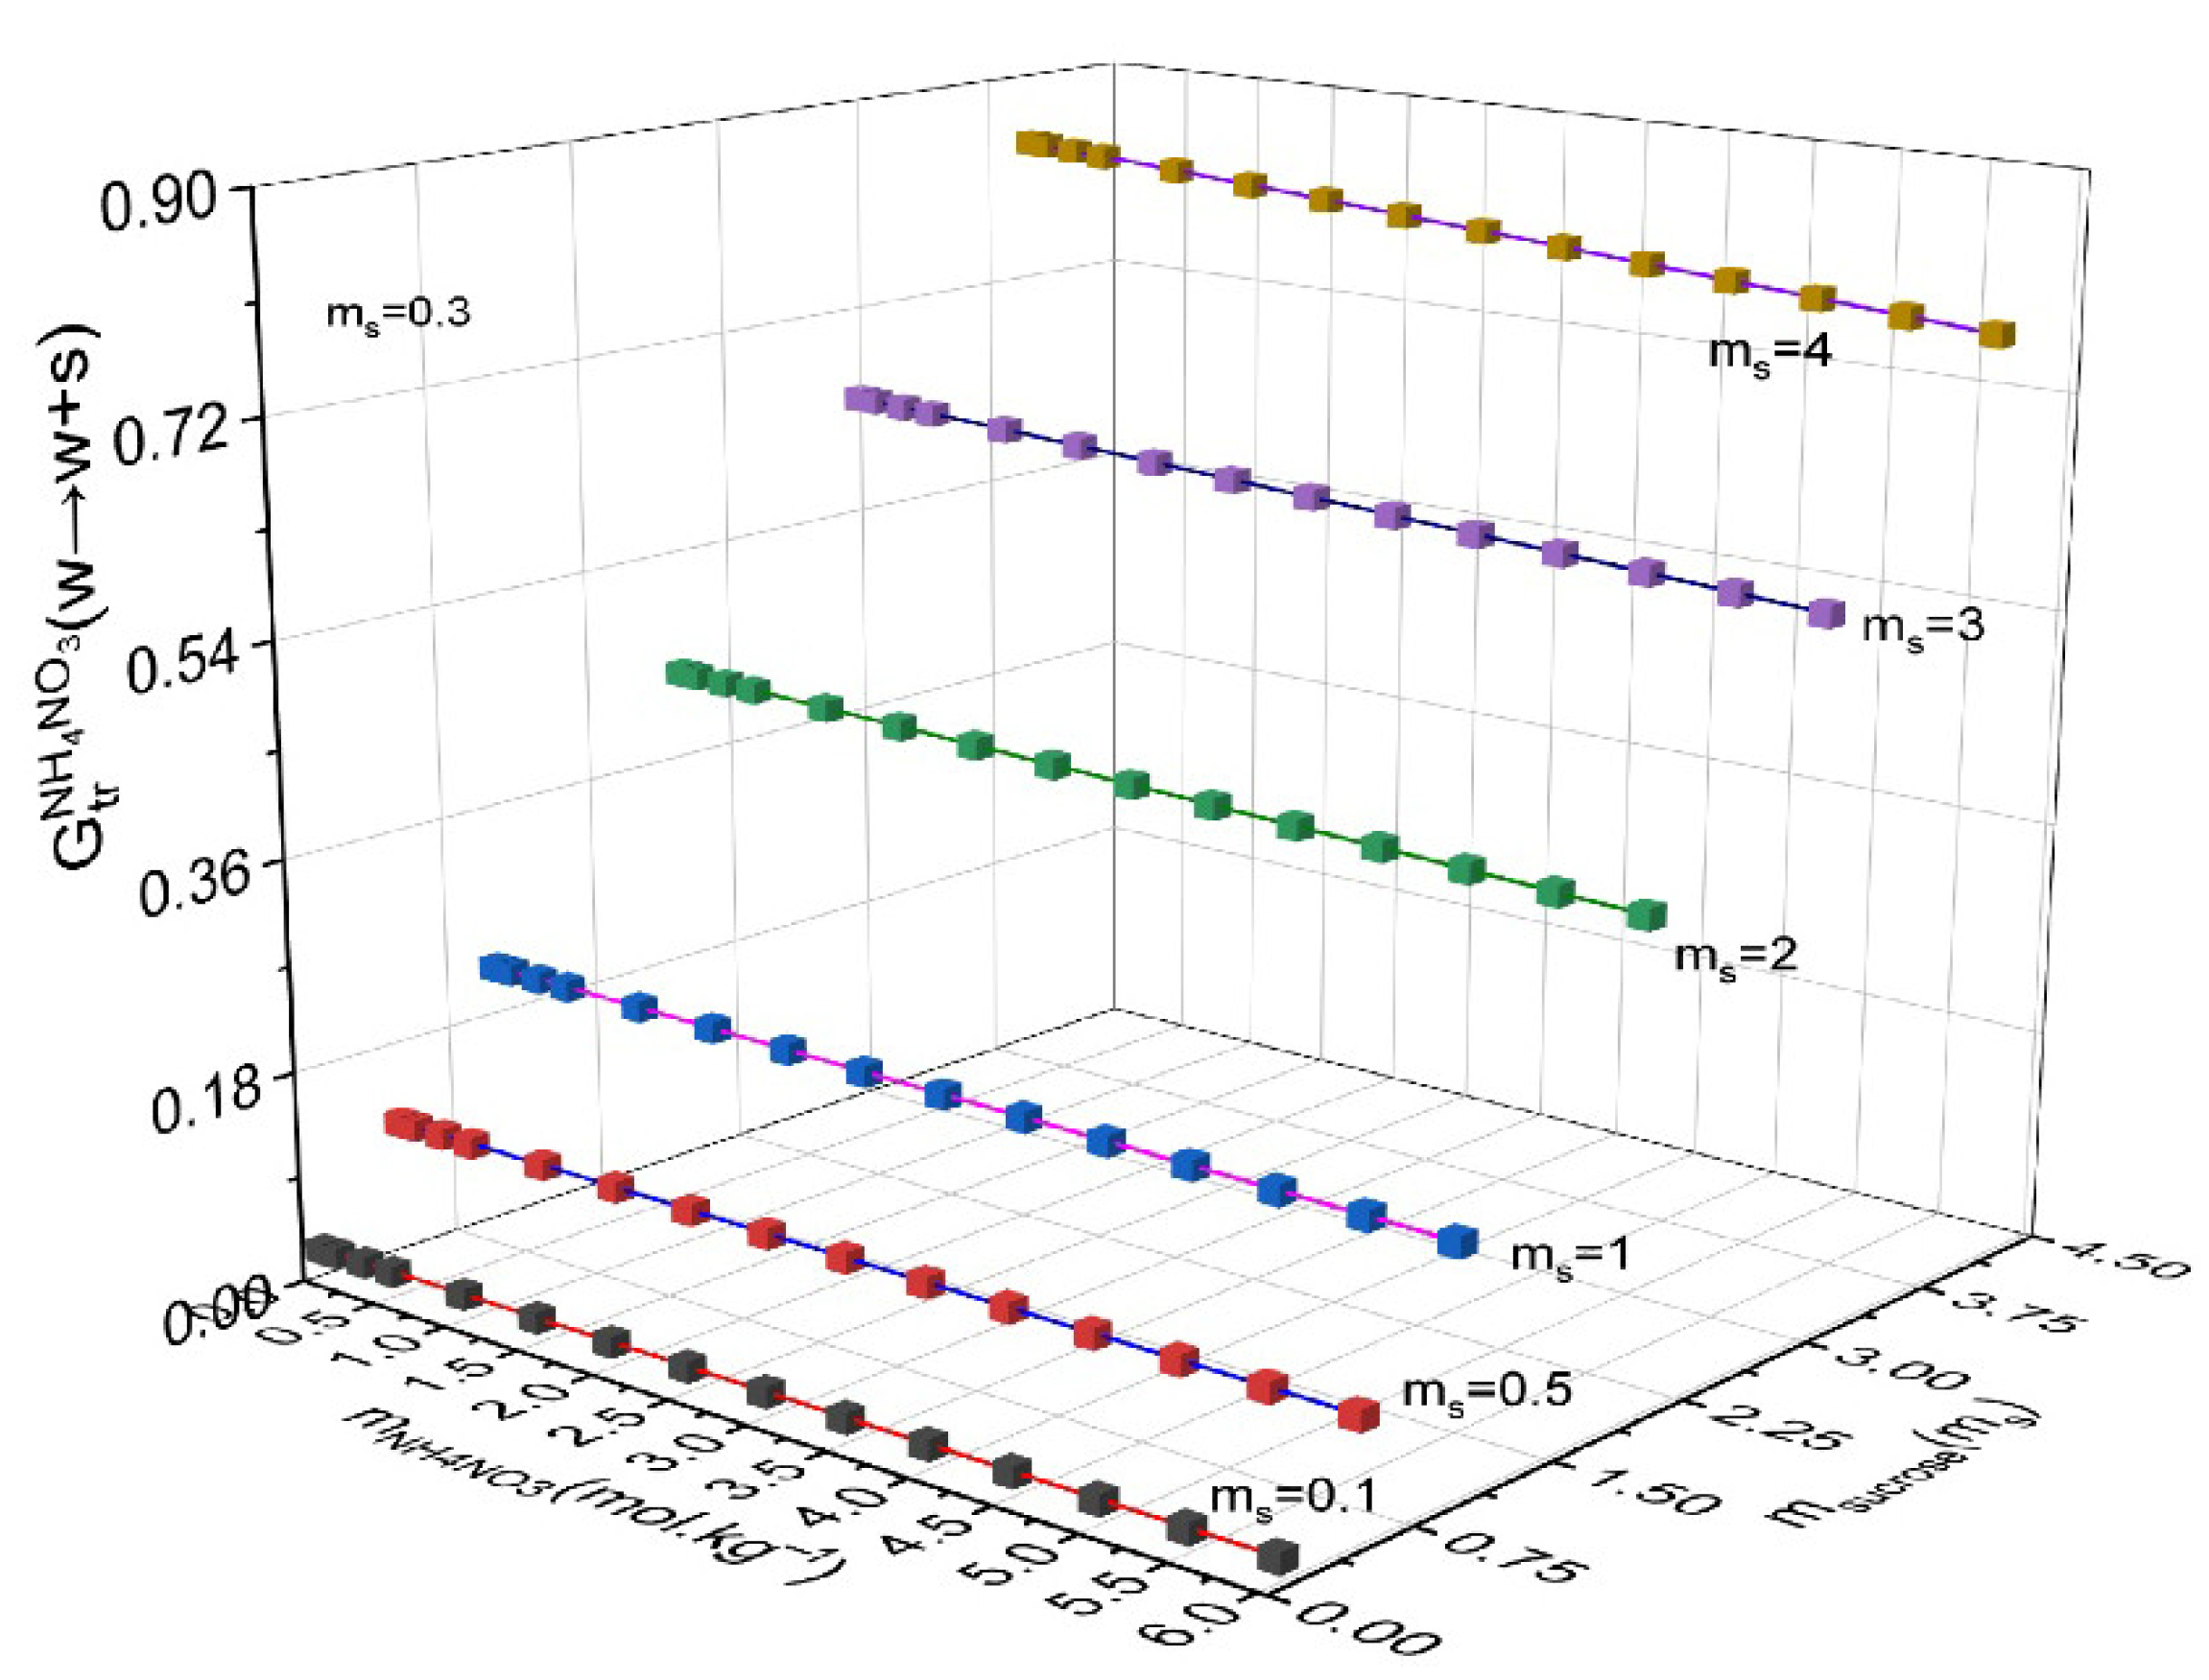
Figure 7 presents the calculated Transfer Gibbs Energies of NH4NO3 from water to mixed water–sucrose mixtures at various molalities of sucrose. The data show that this parameter increases with sucrose concentration, indicating that the presence of sucrose makes the transfer progressively less favorable and less spontaneous. For a given sucrose molality, ΔGtr remains constant across different NH4NO3 concentrations, reflecting that once equilibrium is established, the hydration environment of NH4+ and NO3 ions is not significantly altered by additional salt.
This behavior arises because ammonium and nitrate ions primarily hydrate through electrostatic interactions with water, while sucrose interacts via dipole–dipole interactions and hydrogen bonding. Although sucrose reduces the availability of bulk water, compensating solute–solvent interactions maintain a dynamic equilibrium. Overall, these results highlight that increasing sucrose content destabilizes ammonium nitrate dissolution by reducing its thermodynamic spontaneity.
Table 5 presents the pair and triplet interaction parameters, along with the salting constant. In this work, we assume that the gEEN and gENN terms are negligible at low solute molalities, and therefore, the salting coefficients are obtained from the pair interaction parameter, gEN. This approximation is supported by the small fitted values of triplet terms gENN (−5.94 J·kg2·mol−3) and gEEN (−7.73 J·kg2·mol−3)—compared to the significantly larger value of the pair interaction parameter gEN gEN (137.89 J·kg·mol−2). This clear disparity shows that the contribution of the triplet terms is negligible at low concentrations of sucrose and NH4NO3.
The positive sucrose–NH4NO3 interaction values indicate a repulsive effect, demonstrating that NH4NO3 induces salting-out of sucrose. Similar behavior has been reported in the literature for sucrose–NaCl [10,11], sucrose–MgCl2 [13], and sucrose–CaCl2 [13]. In contrast, KCl exhibits a weak attractive interaction with sucrose, resulting in less pronounced salting-out [14].
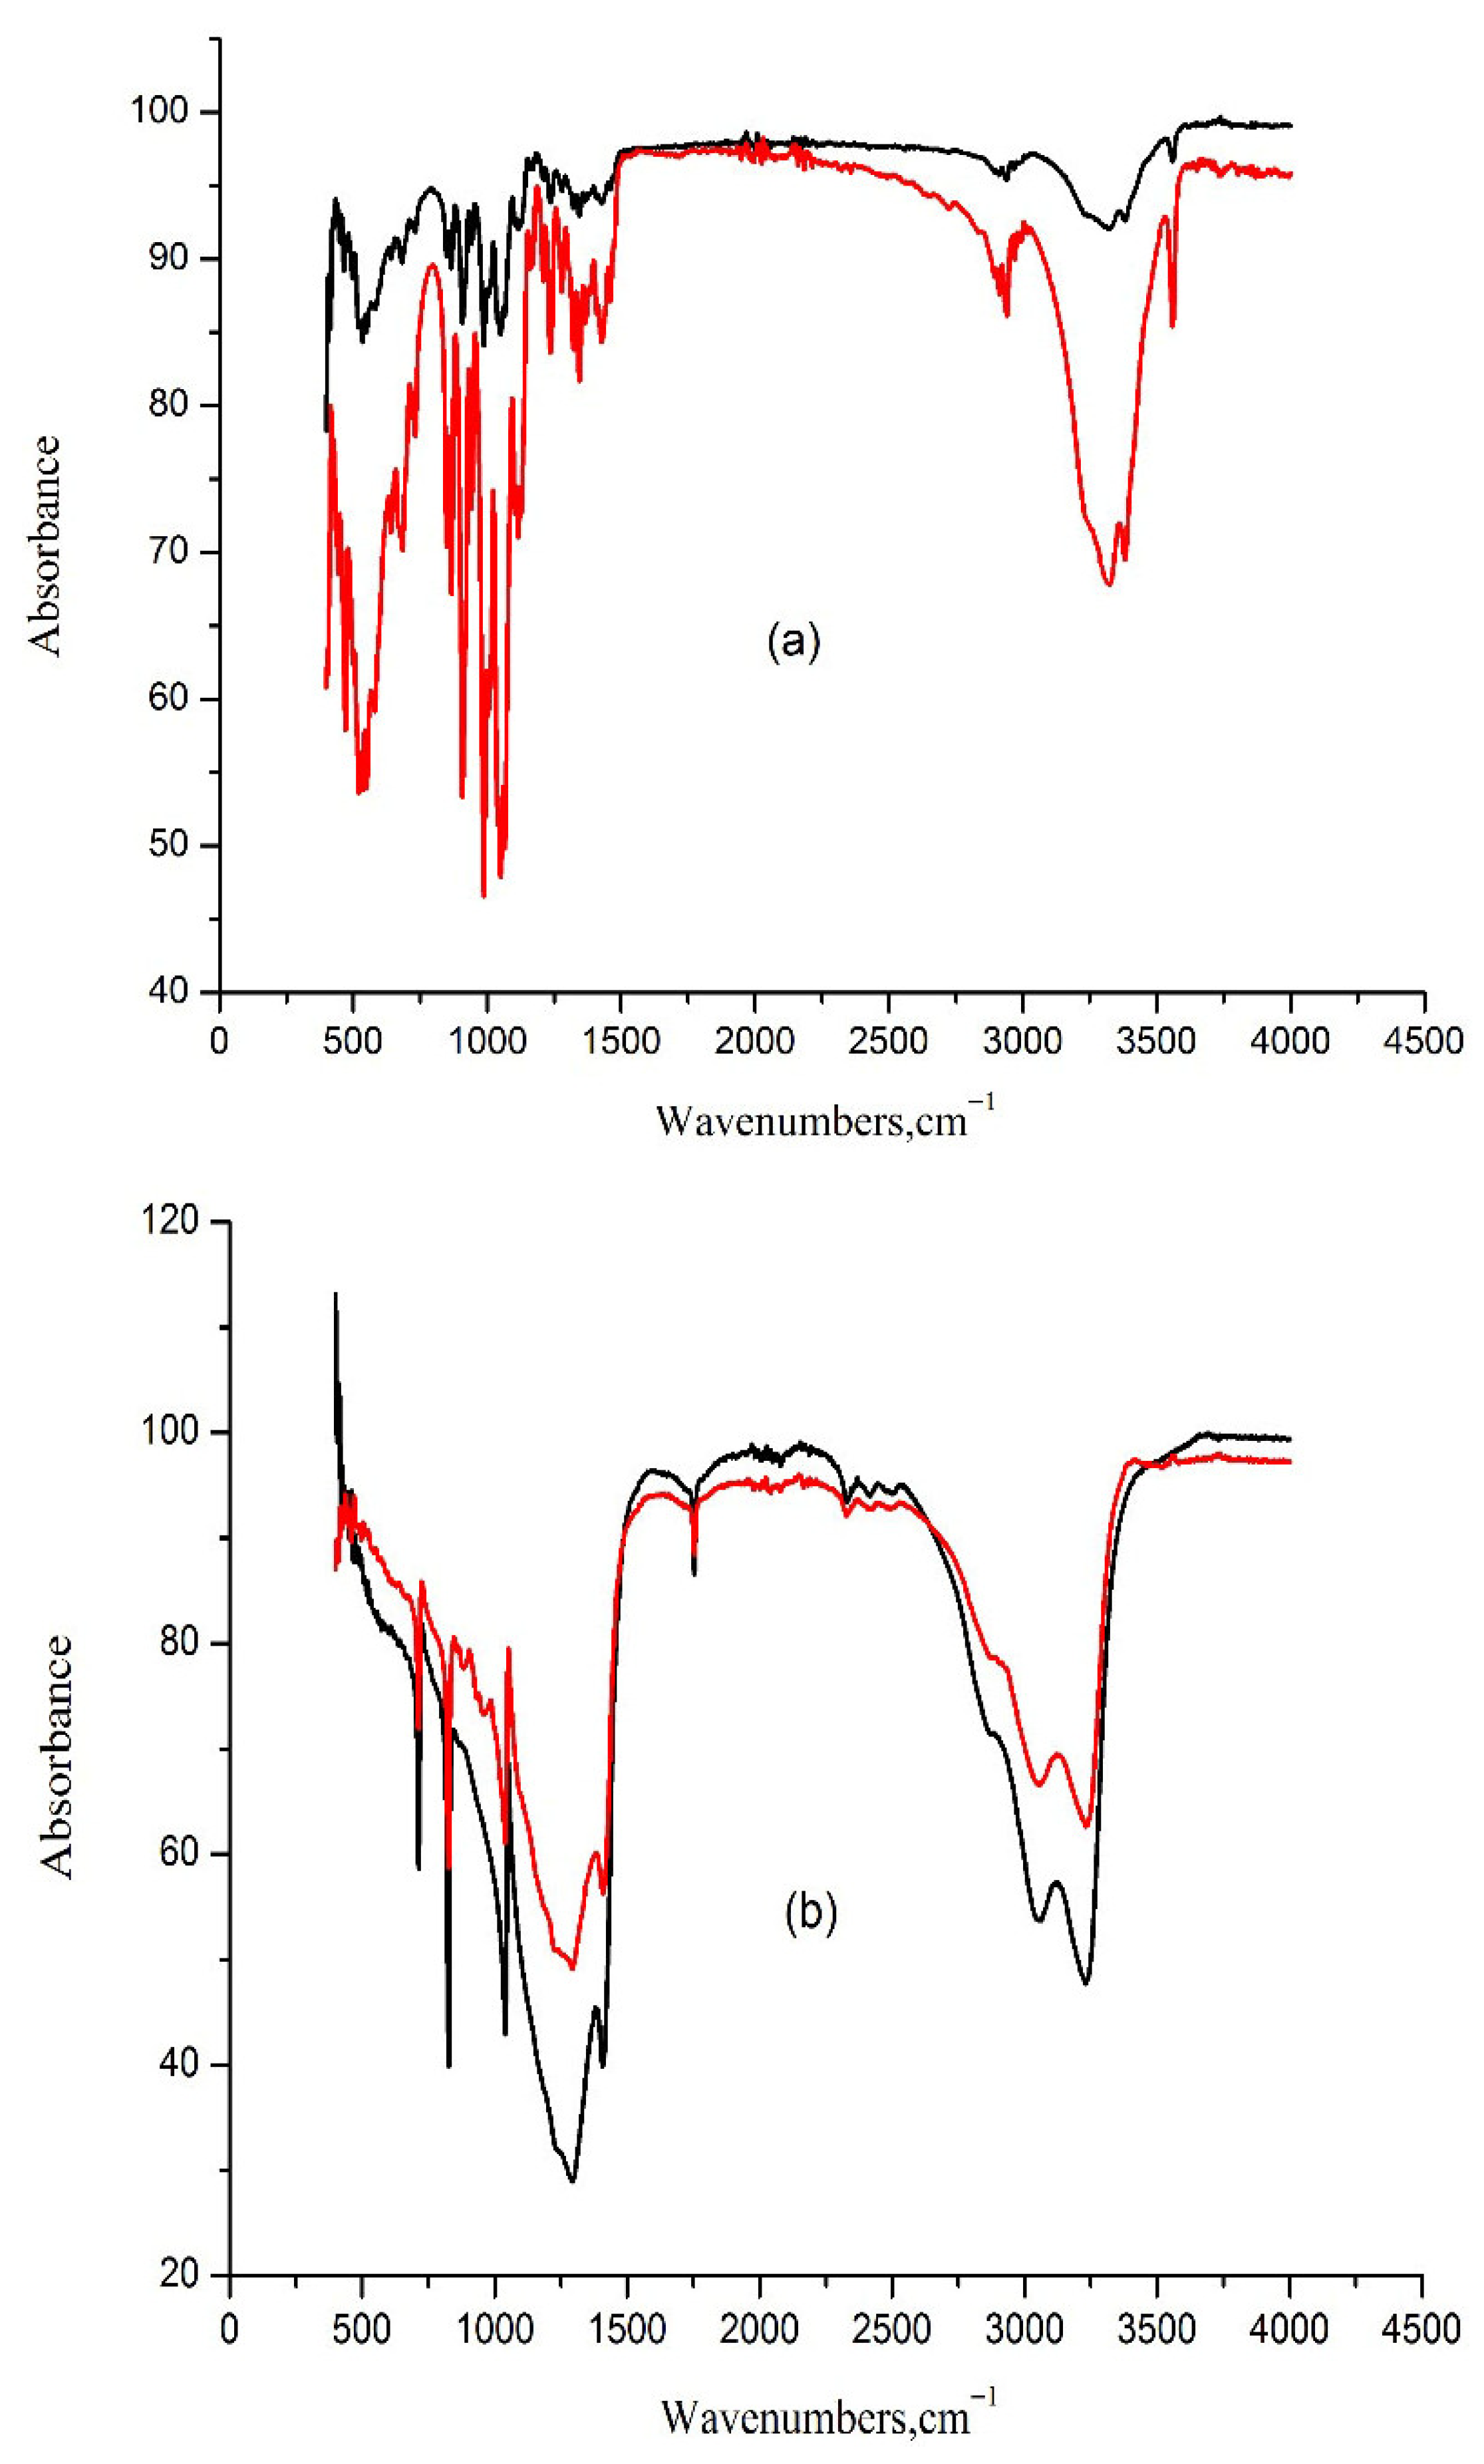
The saturation limit of the components in the studied solution is obtained using our hygrometric method described above. Once the solution reaches saturation, both the relative humidity and solute concentration in liquid phase remain constant [12,15]. To identify the solid phases formed, ATR-FTIR spectroscopy and powder X-Ray diffraction (PXRD) analyses were performed. The PXRD patterns of the crystals are shown in Figure 8, while the ATR-FTIR spectra are presented in Figure 9.
As shown in Figure 8a, PXRD analyses of solids crystallized from supersaturated sucrose–water and from water/D-sucrose/AN mixtures at high sucrose concentrations yielded identical diffraction patterns. The PXRD profile of crystalline sucrose (Figure 8a) is in excellent agreement with reference data reported in the literature. Figure 8b presents the PXRD patterns of crystals obtained from supersaturated water/D-sucrose/AN solutions with high ammonium nitrate content. These results confirm that a dry AN crystal is formed during the crystallization of ammonium nitrate, both from pure aqueous solutions and from supersaturated ammonium nitrate–sucrose–water systems at elevated AN concentration. Figure 9 shows the ATR-FTIR spectra of solids recovered from the super-saturated mixtures of ammonium nitrate, sucrose, and water, alongside the spectra of the pure sucrose and the pure ammonium nitrate crystallized from water for comparison.
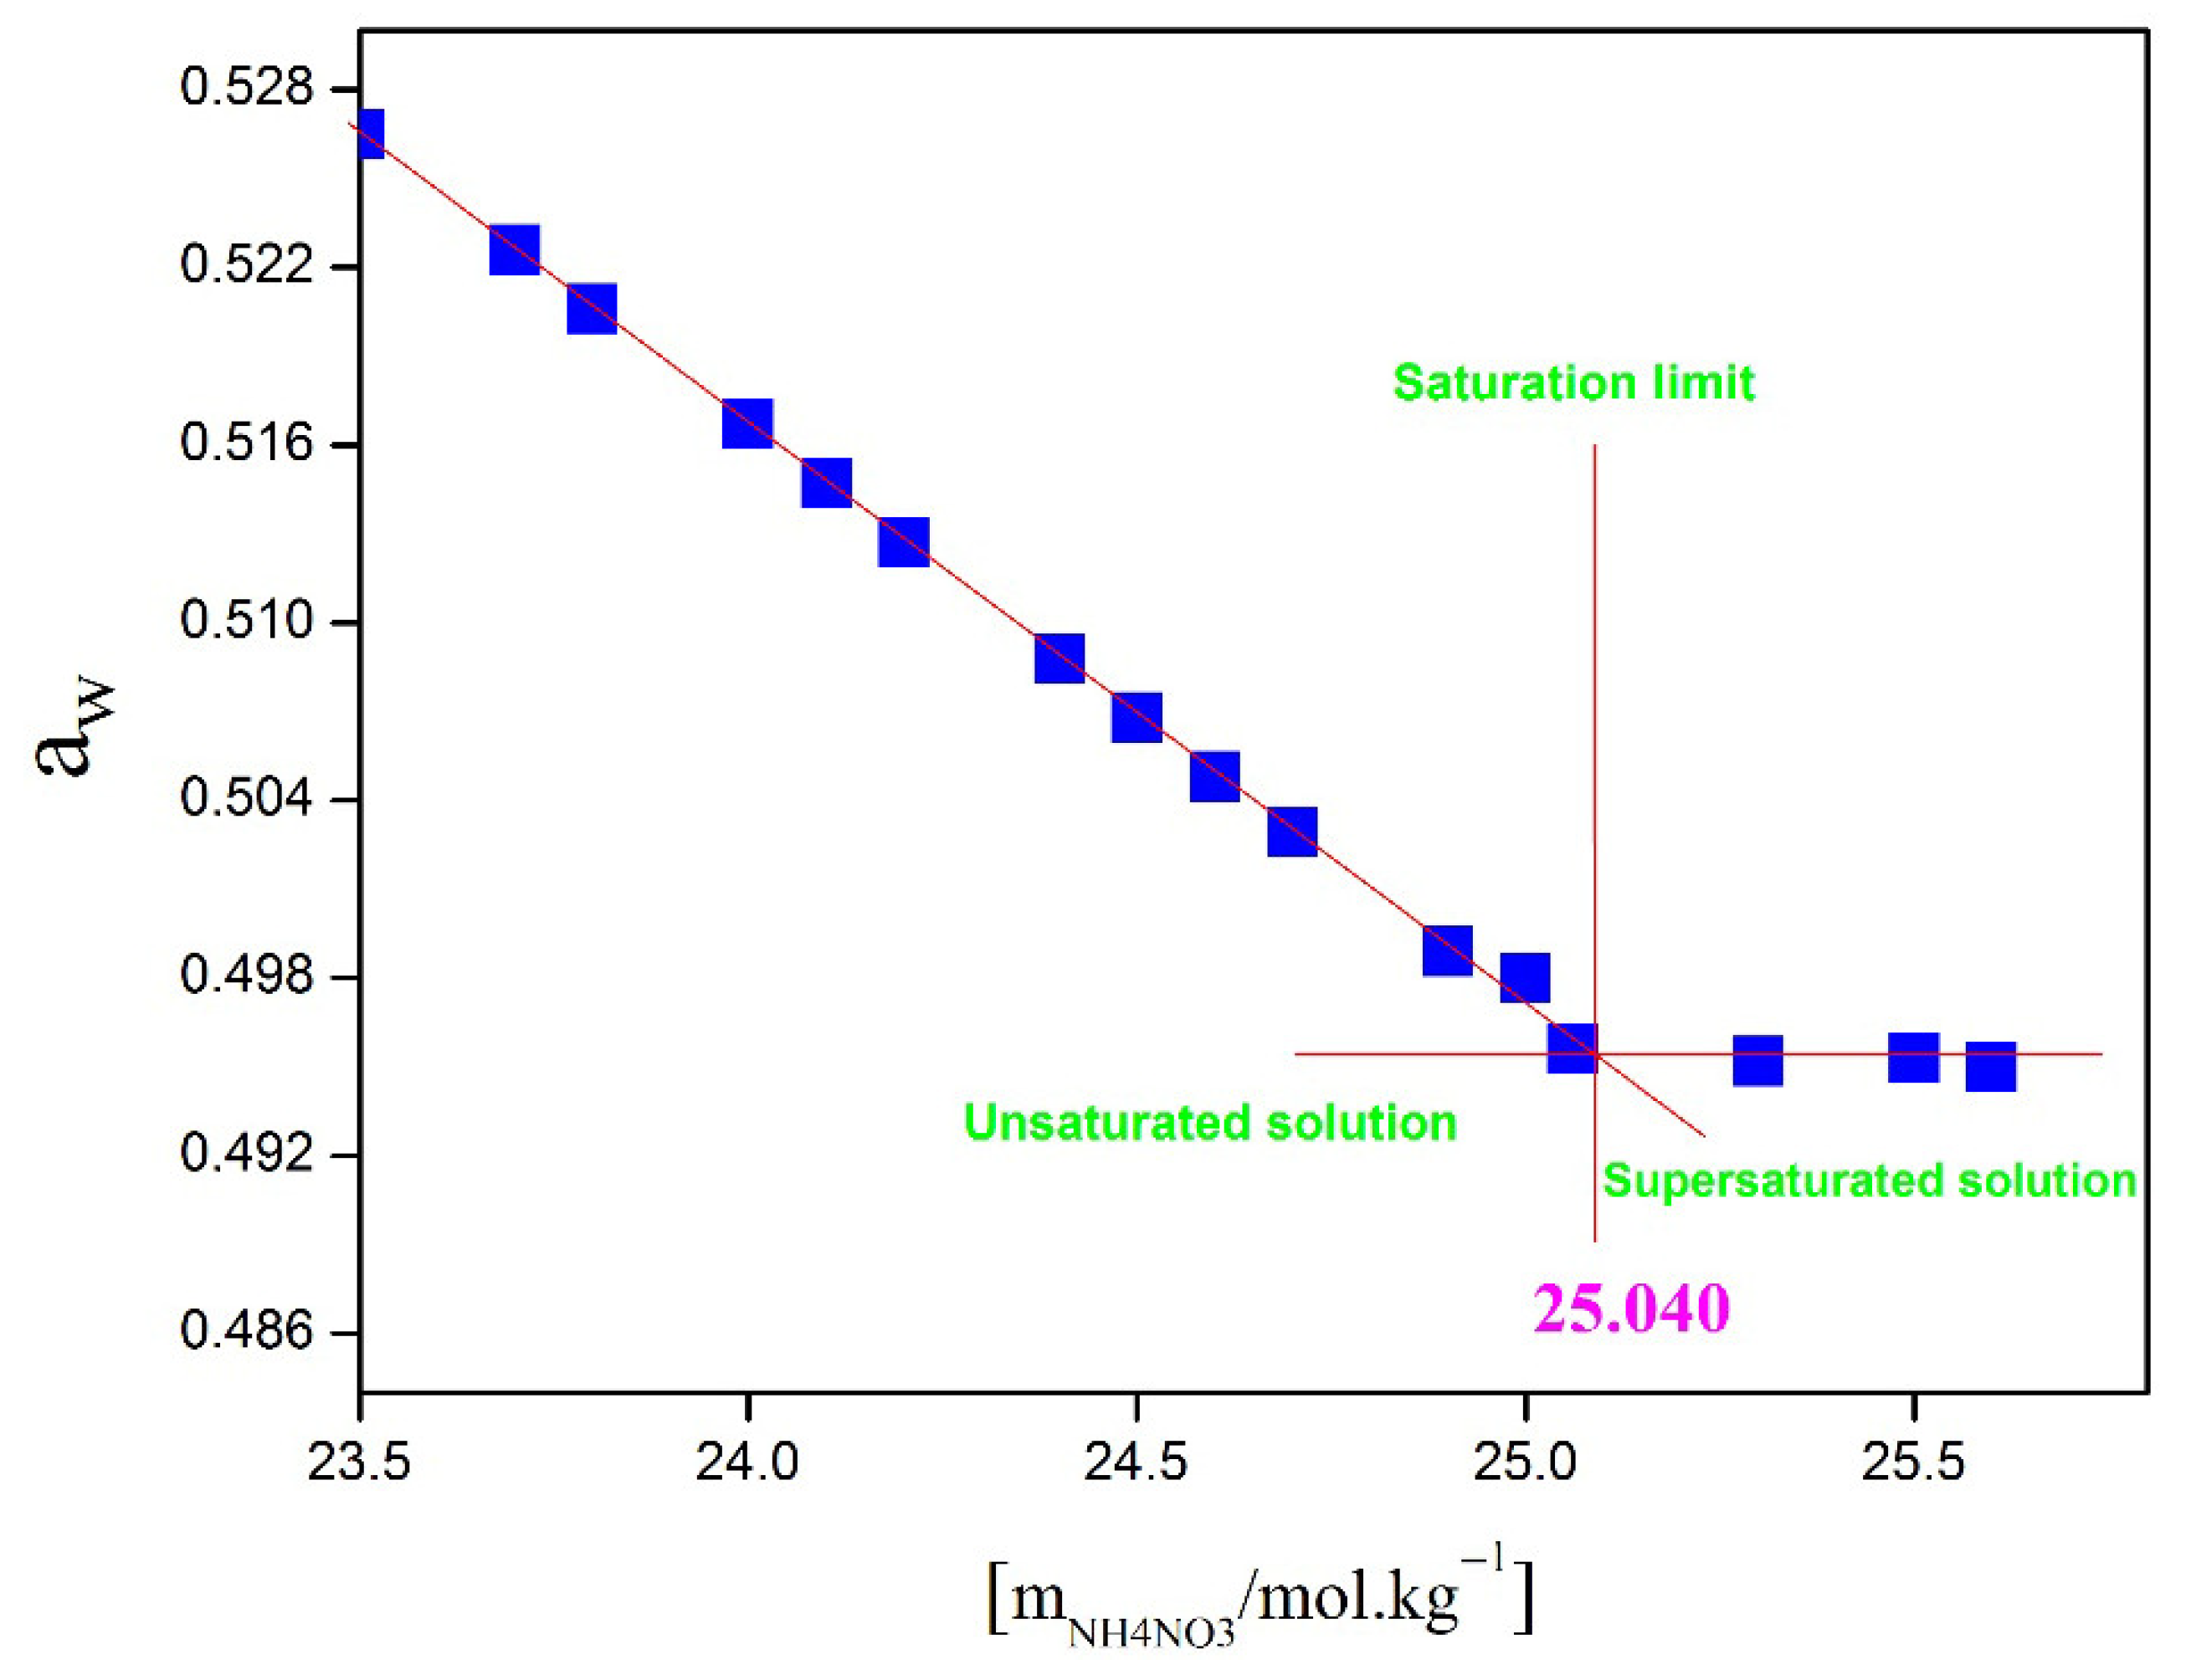
Figure 10 shows the variation in water activity in the NH4NO3–sucrose–H2O system versus sucrose molality, with a fixed NH4NO3 concentration set at 18.7 mol·kg−1. In this Figure, it is observed that water activity remains stable once the saturation limit is reached. The approximate value of this limit, extracted from Figure 10, is around 6.15 mol·kg−1, corresponding to the solubility of sucrose inthe NH4NO3–sucrose–H2O system containing 18.7 mol·kg−1 of NH4NO3. The same methodology was applied to determine the sucrose solubility at different NH4NO3 molalities and the solubility of NH4NO3 at different molalities of sucrose (see Figure 11).
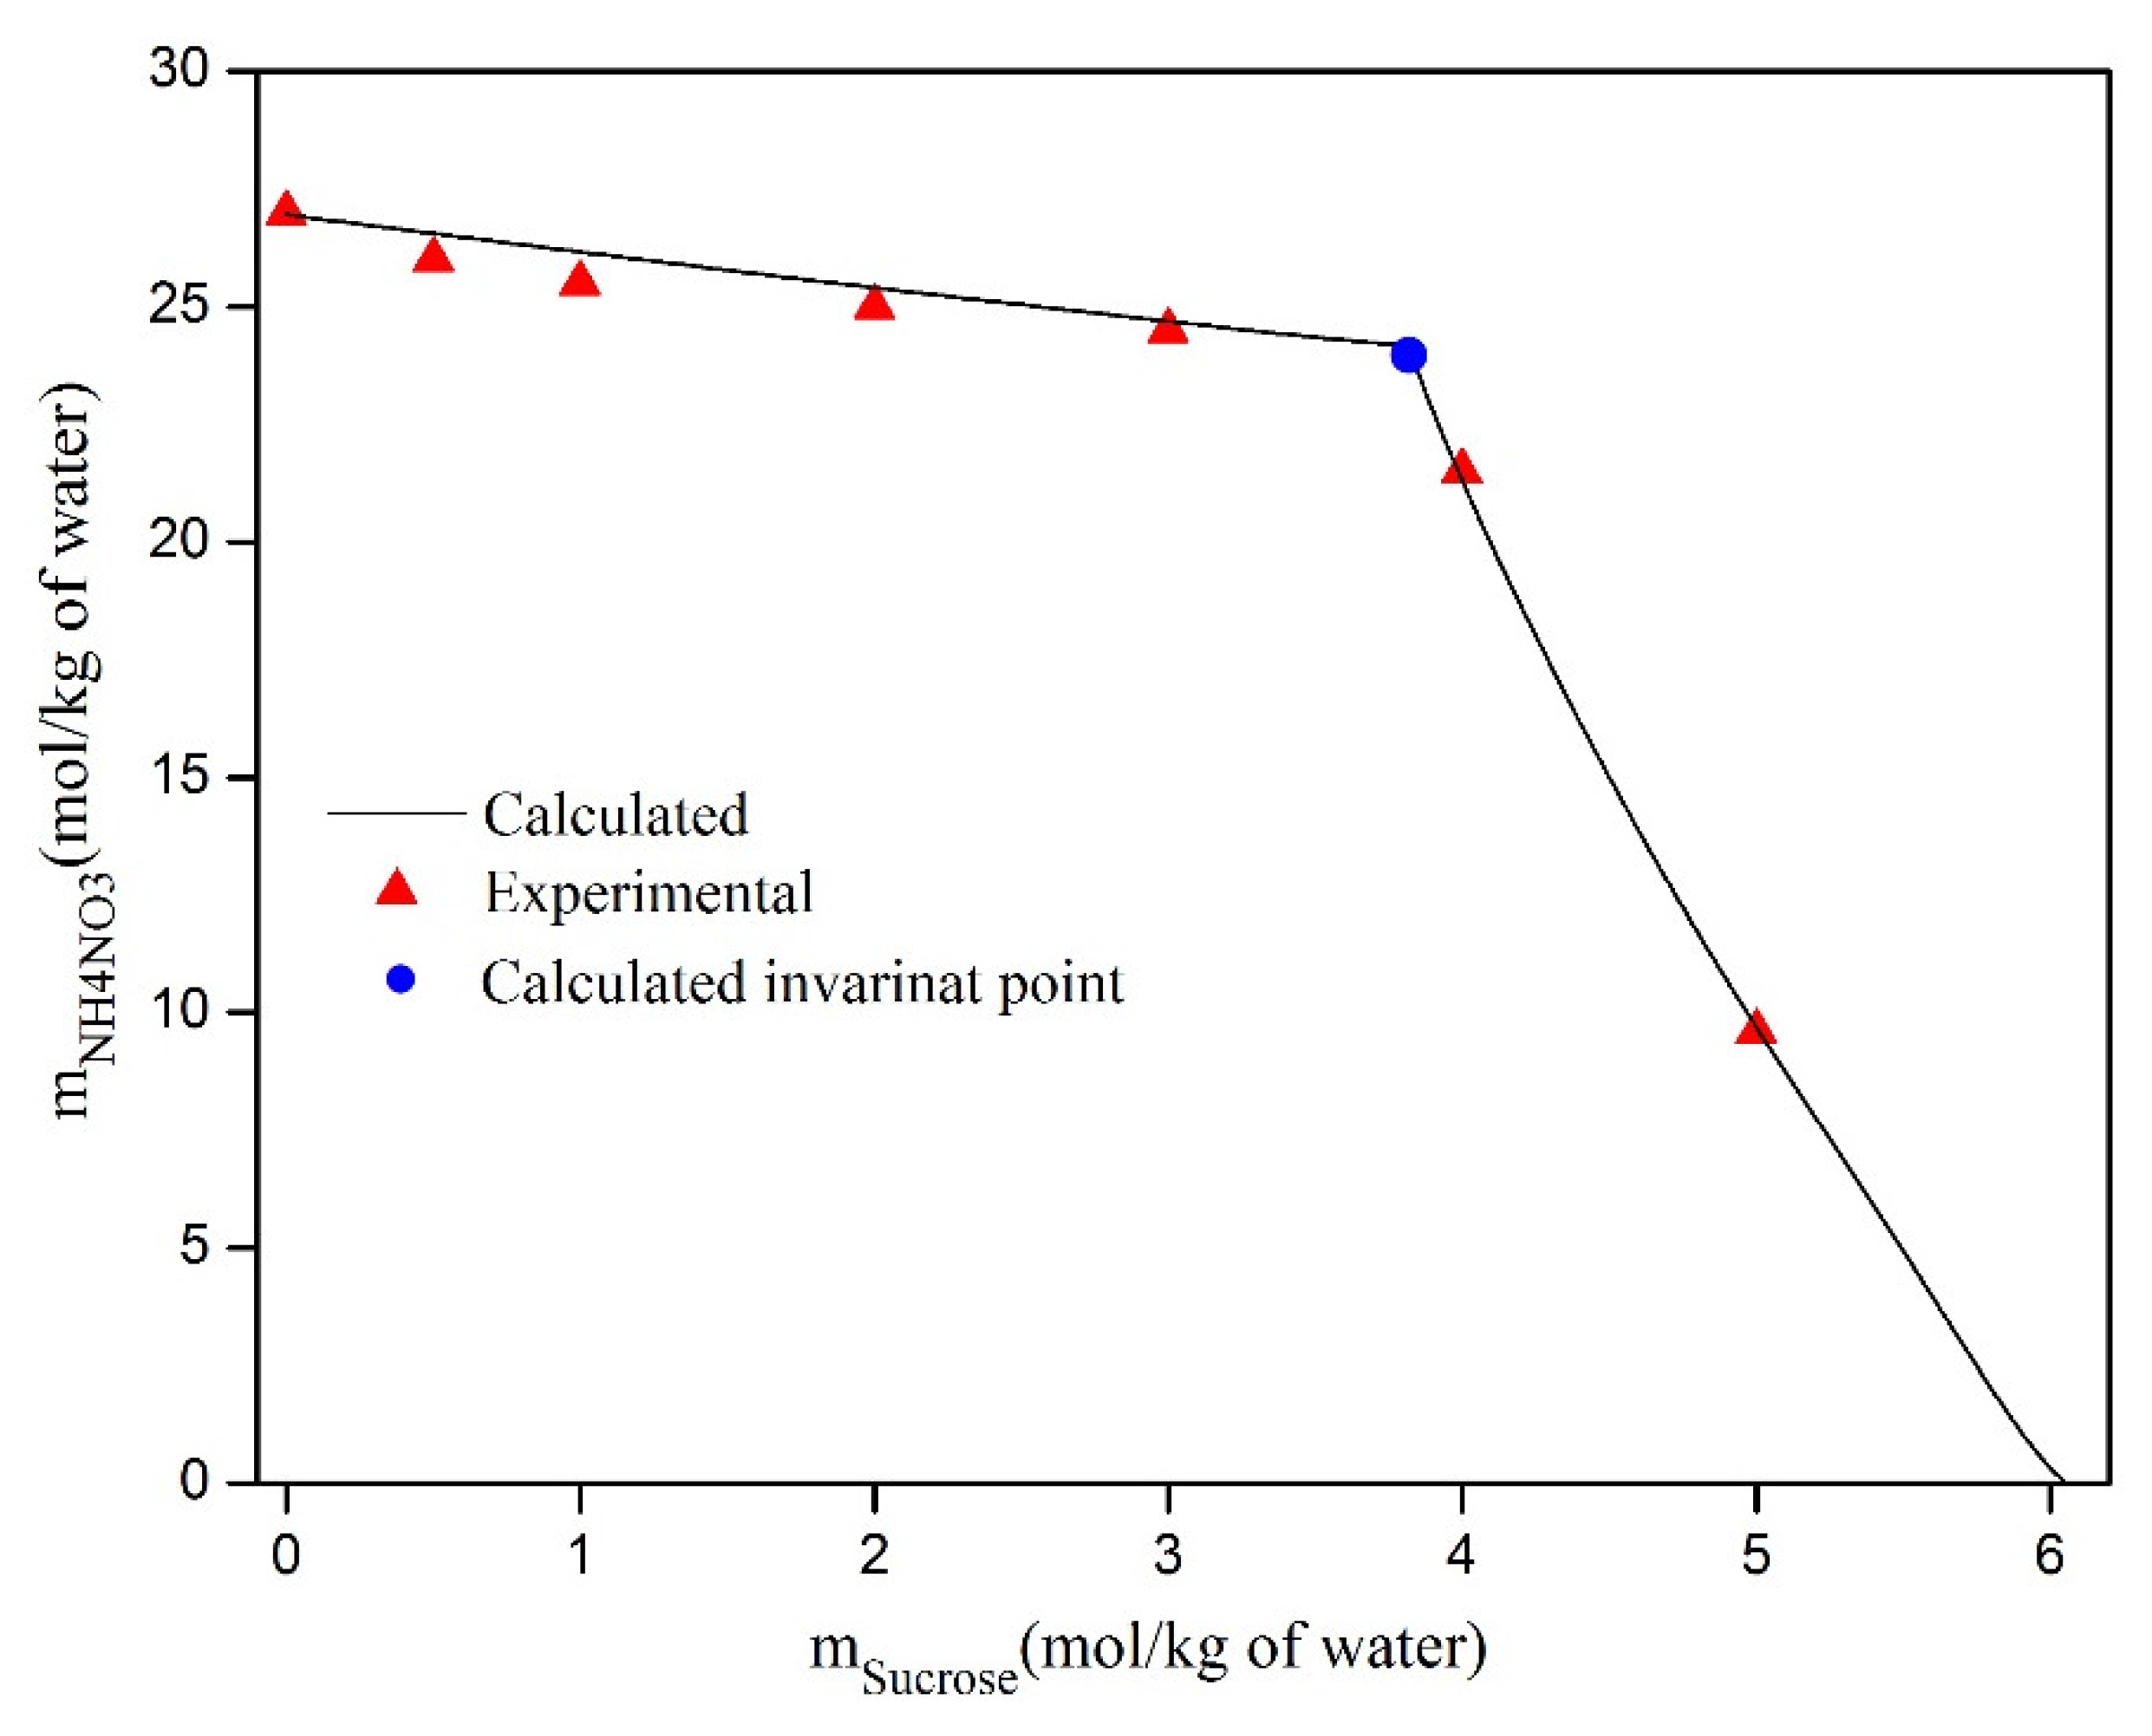
The experimental saturated aqueous solutions of mixed water, sucrose, and NH4NO3 are presented in Table 6 and also are shown in Figure 12. These results demonstrate good agreement between the measurement values and those calculated by Equations (19) and (20) and the PSC model with a standard deviation of σs = 0.02. The same Figure shows that the solubility of sucrose in the NH4NO3–sucrose–H2O decreases slightly as the salt content increases. Also, the solubility of NH4NO3 decreases as the concentration of sucrose increases. The literature gives the solubility value for only binary solutions of NH4NO3 + H2O as 25.3 mol·kg−1 and that of sugar + H2O as 6.2 mol·kg−1. Comparing our experimental results with those in the literature for binary solutions, we observed that RMSE = 1.65 for ammonium nitrate and RMSE = 0.22 for sugar. For the ternary solutions NH4NO3 + sucrose + H2O, there was no data in the literature on the solubility of this ternary and this present study is the first instance that the solubility curve of the mixture NH4NO3 + Sugar + H2O was obtained. The estimate of the experimental error of the solubility of the aqueous ternary mixture of sugar and ammonium nitrate is about 0.4 mol·kg−1 for NH4NO3 and 0.12 mol·kg−1 for sugar.

5. Conclusions

The hygrometric technique was employed to measure the thermodynamic properties and saturation points of the ternary NH4NO3/D-sucrose/water system at 298.15 K, over a wide range of ammonium nitrate and sucrose concentrations. The measured water activities allow for obtaining osmotic coefficient values ϕ. The solubilities of NH4NO3 and D-sucrose were determined over a wide range of NH4NO3 and sugar molalities. The solid characterization was carried out using X-ray powder diffraction and spectroscopic analyses.
The unknown parameters of the Pitzer–Simonson–Clegg (PSC) model for the single systems NH4NO3–water and sucrose–water were optimized using the osmotic and activity coefficient data reported in the literature, as well as those measured in the present study. The mixed model parameters were further optimized based on the ϕ-data obtained via experiments in the present study. The PSC thermodynamic model was then applied to calculate the activity coefficients and solubilities of sucrose and ammonium nitrate, the free energy of transfer of NH4NO3 from water to the water–sucrose mixture, and the excess Gibbs free energy of the D-sucrose-NH4NO3 mixture. The resulting data on the free energy of transfer were used to estimate the salting coefficient. The results indicate that the system exhibits increasingly negative deviations from ideality, and that NH4NO3 enhances the salting-out effect of sucrose.

Author Contributions

Conceptualization, W.E.F. and A.D.; Methodology, W.E.F., S.E.H., B.M. and A.M.; Software, W.E.F., Z.N., A.D. and B.M.; Validation, A.D., A.S. and A.A.; Formal analysis, W.E.F. and A.D.; Investigation, W.E.F., A.D. and A.A.; Resources, A.D. and A.S.; Data curation, Z.N. and A.D.; Writing—original draft, W.E.F., S.E.H. and A.D.; Writing—review and editing, A.D.; Supervision, A.D.; Project administration, A.D.; Funding acquisition, A.D. All authors have read and agreed to the published version of the manuscript.

Funding

This research received no external funding.

Data Availability Statement

The original contributions presented in this study are included in the article. Further inquiries can be directed to the corresponding author.

Conflicts of Interest

The authors declare no conflicts of interest.

List of Symbols

aActivity
AxDebye–Hückel parameter
B M X Parameter of single electrolyte
DDiameter of the drop
gexExcess Gibbs energy per mole of particles
GexExcess Gibbs energy
hrRelative humidity
KRatio of drops
KsSolubility product
MMolality
nMole number
nrIndex of refraction
RGas constant, J·mol−1·K−1
TAbsolute temperature
PPressure
xMole fraction
u(p)Standard uncertainty of parameter p
W12, U12Parameters of PSC model
W j , M X , U j , M X , V j , M X Short-range parameters between molecule j and salt MX
Y 1 , 2 , M X 0
Y 1 , 2 , M X 1
Short-range ternary parameters molecule-molecule-Salt MX
Greek letters
αConstant
ρClosest approach distance
ϕOsmotic coefficient
γActivity coefficient
σawUncertainty of measured water activity
σϕUncertainty of measured osmotic coefficient
Subscripts
CalcCalculated
ExpExperimental
refReference
i, 1,2Indicate component
PSCPitzer–Simonson–Clegg
PDHPitzer–Debye–Hückel
Superscripts
ExExcess

Appendix A. Calculation of Uncertainties

Uncertainty of molality:
The standard uncertainties were calculated using error propagation techniques and are due to the uncertainties of the different quantities related to the measured quantity. For molality, they are at most u(m) = 0.01 mol·kg−1 (with a confidence level of 0.68).
u ( m ) m = ( u ( w ) w ) 2 + ( u ( p ) p ) 2 + ( u ( V ) V ) 2 + ( u ( M ) M ) 2 + ( u ( ρ ) ρ ) 2 ,
m: the molality of the solution; w: mass of the component; V: volume of the solution; M molar mass of the component; p: purity of the component; ρ: specific volume of water. The symbol u indicates the standard uncertainty of the compound under consideration.
Uncertainty of water activity:
The relative uncertainty in the measured droplet diameter is approximately ur = 0.0025. Consequently, the relative uncertainty in the relative humidity or water activity aw measurements can be determined using error propagation methods as follows:
a w a w = ( D a w D a w ) 2 + ( D a r e f D a r e f ) 2 ,
where aw: water activity and a w its uncertainty; Daw and D a r e f : are droplet diameters at relative humidity above the studied solution and at reference solution, respectively; and D a w   a n d   D a r e f : are t h e i r   u n c e r t a i n t i e s .
Uncertainty of osmotic coefficient:
The standard uncertainty of osmotic coefficient u(ϕ) is determined by error propagation as:
u ϕ = 1000 M w i v i m i a w u ( a w ) 2 ,
where the estimated standard uncertainty of the osmotic coefficients, with a confidence level of 0.68, is at a maximum of u(ϕ) = 0.003.
Solubility Uncertainty
To determine the uncertainty of the measured saturation point, we can also use the law of error propagation, which is formulated as follows:
u s = i S v i 2 u v i 2 ,
where vi represents the measured variables and us represents the experimental uncertainty of molality and water activity. The relative standard uncertainty of water activity at saturation detection is u(aws) = 0.02 and the solubility is us = 0.066 mol·kg−1.

Appendix B. ECA Equation [25]

The “Extended Composed Additivity” (ECA) is given by:
a w = 1 + a w 1 + a w 2 m 1 m 2 λ m 1 m 2 m δ ,
where m1, m2 are the molalities of component 1 and 2. m is the total molality of the mixture. The terms aw1 and aw2 correspond to the water activities of components 1 and2 in their respective binary solutions. The parameters λ and δ characterize the deviation of the ternary mixture from ideality at higher concentrations. These parameters can be determined graphically as follows:
a w m 1 m 2 = λ m δ ,
The term Δaw corresponds to the discrepancy between the predicted and observed water activities. By plotting this difference against the total molality, the resulting best-fit line enables the extraction of the intercept λ and slope δ parameters.

Appendix C. The Lin et al. Equation [16]

The Lin et al. [25] empirical equation for aqueous ternary systems is:
a w 1 = a w 1 1 + a w 2 1 + C 12 m 1 m 2 ,
where, m i   denotes the molality of species i, and C 12 is an adjustable parameter. The terms a w 1 and a w 2 represent the water activities of the binariescontaining components 1 and 2, respectively.

Appendix D. The LS Model [27,28]

The LS II model (Lietzke–Stoughton) for the prediction of osmotic coefficients in mixtures containing two solutes is:
(ν1m1 + ν2m2)ϕ = ν1m1ϕ1 + ν2m2ϕ2,
where m1 and m2 are the molalities of components 1 and 2, respectively. The parameters ν1 and ν2 are the number of dissociated ions of each solute. ϕ1, ϕ2, and ϕ are the osmotic coefficients for the binary solutions at the total molality and the osmotic coefficient of the ternary mixture, respectively.

References

  1. Azov, V.A.; Egorova, K.S.; Seitkalieva, M.M.; Kashin, A.S.; Ananikov, V.P. “Solvent-in-salt” systems for design of new materials in chemistry, biology and energy research. Chem. Soc. Rev. 2018, 47, 1250–1284. [Google Scholar] [CrossRef]
  2. Yin, H.; Li, B.; Wang, X.; Xi, Z. Effect of ammonium and nitrate supplies on nitrogen and sucrose metabolism of cabernet sauvignon (Vitis vinifera cv.). J. Sci. Food Agric. 2020, 100, 5239–5250. [Google Scholar] [CrossRef]
  3. Liu, J.; Lyu, M.; Xu, X.; Liu, C.; Qin, H.; Tian, G.; Zhu, Z.; Ge, S.; Jiang, Y. Exogenous sucrose promotes the growth of apple rootstocks under high nitrate supply by modulating carbon and nitrogen metabolism. Plant Physiol. Biochem. 2022, 192, 196–206. [Google Scholar] [CrossRef]
  4. Sjolin, C. The influence of moisture on the structure and quality of ammonium nitrate prills. J. Agric. Food Chem. 1971, 19, 83–95. [Google Scholar] [CrossRef]
  5. Sihag, R.K.; Guha-Mukherjee, S.; Sopory, S.K. Effect of ammonium, sucrose and light on the regulation of nitrate reductase level in Pisum sativum. Physiol. Plant. 1979, 45, 281–287. [Google Scholar] [CrossRef]
  6. Zhang, Y.H.; Zhou, S.L.; Huang, Q.; Leng, G.H.; Xue, Q.W.; Stewart, B.A.; Wang, Z.M. Effects of sucrose and ammonium nitrate on phosphoenolpyruvate carboxylase and ribulose-1, 5-bisphosphate carboxylase activities in wheat ears. Aust. J. Crop Sci. 2012, 6, 822–827. [Google Scholar]
  7. Seuvre, A.M.; Mathlouthi, M. Solutions properties and solute–solvent interactions in ternary sugar–salt–water solutions. Food Chem. 2010, 122, 455–461. [Google Scholar] [CrossRef]
  8. Hernández-Luis, F.; Amado-González, E.; Esteso, M.A. Activity coefficients of NaCl in trehalose–water and maltose–water mixtures at 298.15 K. Carbohydr. Res. 2003, 338, 1415–1424. [Google Scholar] [CrossRef]
  9. Abderafi, S.; Bounahmidi, T. Measurement and modeling of atmospheric pressure vapor-liquid equilibrium data for binary, ternary and quaternary mixtures of sucrose, glucose, fructose and water components. Fluid Phase Equilibria 1994, 93, 337–351. [Google Scholar] [CrossRef]
  10. Messnaoui, B.; Mounir, A.; Dinane, A.; Samaouali, A.; Mounir, B. Determination of water activity, osmotic coefficients, activity coefficients, solubility and excess gibbs free energies of NaCl-sucrose-H2O mixture at 298.15 K. J. Mol. Liq. 2019, 284, 492–501. [Google Scholar] [CrossRef]
  11. Hu, Y.; Guo, T. Thermodynamics of electrolytes in aqueous systems containing both ionic and nonionic solutes, Application of the Pitzer–Simonson–Clegg equations to activity coefficients and solubilities of 1:1 electrolytes in four ternary systems at 298.15 K electrolyte–non-electrolyte–H2O. Phys. Chem. Chem. Phys. 1999, 1, 3303–3308. [Google Scholar] [CrossRef]
  12. Robinson, R.A.; Stokes, R.H.; Marsh, K.N. Activity coefficients in theternarysystem: Water + Sucrose + sodiumchloride. J. Chem. Thermodyn. 1985, 2, 745–750. [Google Scholar] [CrossRef]
  13. Wang, J.; Liu, W.; Bai, T.; Lu, J. Standard Gibbs Energies of Transfer ofsomeElectrolytesfromWatertoAqueousSucrose Solutions at 298.15 K. J. Chem. Soc. Faraday Trans. 1993, 89, 1741–1744. [Google Scholar] [CrossRef]
  14. Mounir, A.; Messnaoui, B.; Dinane, A.; Samaouali, A. Determination of water activity, osmotic coefficient, activity coefficient, solubility, excess Gibbs energy and transfer Gibbs energy of KCl-D−sucrose-water mixture at 298.15 K. J. Chem. Thermodyn. 2020, 142, 105962. [Google Scholar] [CrossRef]
  15. El Fadel, W.; El Hantati, S.; Nour, Z.; Dinane, A.; Samaouali, A.; Messnaoui, B. Experimental Determination of Osmotic Coefficient and Salt Solubility of System NH4NO3−NH4H2PO4−H2O and Their Correlation and Prediction with the Pitzer−Simonson−Clegg Model. J. Ind. Eng. Chem. Res. 2023, 62, 17986–17996. [Google Scholar] [CrossRef]
  16. Clegg, S.L.; Pitzer, K.S. Thermodynamics of Multicomponent, Miscible, Ionic Solutions: Generalized Equations for Symmetrical Electrolytes. J. Phys. Chem. 1992, 96, 3513–3520. [Google Scholar] [CrossRef]
  17. Clegg, S.L.; Pitzer, K.S.; Brimblecombe, P. Thermodynamics of Multicomponent, Miscible, Ionic solutions. 2. Mixtures Including Unsymmetrical Eelectrolytes. J. Phys. Chem. 1992, 96, 9470–9479. [Google Scholar] [CrossRef]
  18. Clegg, S.L.; Pitzer, K.S.; Brimblecombe, P. Thermodynamics of Multicomponent, Miscible, Ionic Solutions: Generalized Equations for Symmetrical Electrolytes. J. Phys. Chem. 1992, 96, 9472, Erratum in J. Phys. Chem. 1994, 98, 1368. [Google Scholar] [CrossRef]
  19. Perron, G.; Joly, D.; Desnoyers, J.E.; Avedikian, L.; Morel, J.P. Thermodynamics of the salting effect; free energies, enthalpies, entropies, heat capacities, and volumes of the ternary systems electrolyte–alcohol–water at 25 °C. Can. J. Chem. 1978, 56, 552–559. [Google Scholar] [CrossRef]
  20. Morel, J.P.; Lhermet, C.; Desrosiers, N.M. Interactions between cations and sugars. Part 4. Free energy of interaction of the calcium ion with some aldopentoses and aldohexoses in water at 298.15 K. J. Chem. Soc. Faraday Trans. 1988, 184, 567–2571. [Google Scholar] [CrossRef]
  21. Dagade, D.H.; Patil, K.J. Thermodynamic studies for aqueous solutions involving 18-crown-6 and alkali bromides at 298.15 K. Fluid Phase Equilibria 2005, 231, 44–52. [Google Scholar] [CrossRef]
  22. Robinson, R.A.; Stokes, R.H. Activity coefficients in aqueous solutions of D-Sucrose, mannitol and their mixtures at 25°. J. Phys. Chem. 1961, 65, 1954–1958. [Google Scholar] [CrossRef]
  23. Song, J.; Meng, Y.; Yuan, F.; Guo, Y.; Xie, Y.; Deng, T. Phase diagrams for the ternary system (NH4NO3 + CsNO3 + H2O) at 298.15 and 348.15 K and its application to cesium nitrate recovery from the eluent aqueous solution of ammonium nitrate. J. Mol. Liq. 2021, 338, 117079. [Google Scholar] [CrossRef]
  24. Marquardt, D.W. An algorithm for least squares estimation of nonlinear parameters. J. Soc. Ind. Appl. Math. 1963, 11, 431–441. [Google Scholar] [CrossRef]
  25. Dinane, A.; El Guendouzi, M.; Mounir, A. Hygrometric determination of water activities, osmotic and activity coefficients of (NaCl + KCl)(aq) at T = 298.15 K. J. Chem. Thermodyn. 2002, 34, 423–441. [Google Scholar] [CrossRef]
  26. Lin, D.Q.; Zhu, Z.Q.; Mei, L.H.; Yang, L.R. Isopiestic determination of the water activities of poly(ethyleneglycol) salt water systems at 25 °C. J. Chem. Eng. Data 1996, 41, 1040–1042. [Google Scholar] [CrossRef]
  27. Lietzke, M.H.; Stoughton, R.W. Simple empirical equation for the prediction of the activity coefficients value of each component in aqueous electrolyte mixtures containing a common ion. J. Solut. Chem. 1972, 1, 299–308. [Google Scholar] [CrossRef]
  28. Lietzke, M.H.; Stoughton, R.W. A simple method for predicting the osmoticcoefficient of aqueous solutions containing more than one electrolyte. J. Inorg. Nucl. Chem. 1974, 36, 1315–1317. [Google Scholar] [CrossRef]
  29. Hamer, W.J.; Wu, Y.-C. Osmotic Coefficients and Mean Activity Coefficients of Uniunivalent Electrolytes in Water at 25 °C. J. Phys. Chem. Ref. Data 1972, 11, 1047–1100. [Google Scholar] [CrossRef]
  30. Partanen Jaakko, I. Mean Activity Coefficients and Osmotic Coefficients in Aqueous Solutions of Salts of Ammonium Ions with Univalent Anions at 25 °C. J. Chem. Eng. Data 2012, 57, 2654–2666. [Google Scholar] [CrossRef]
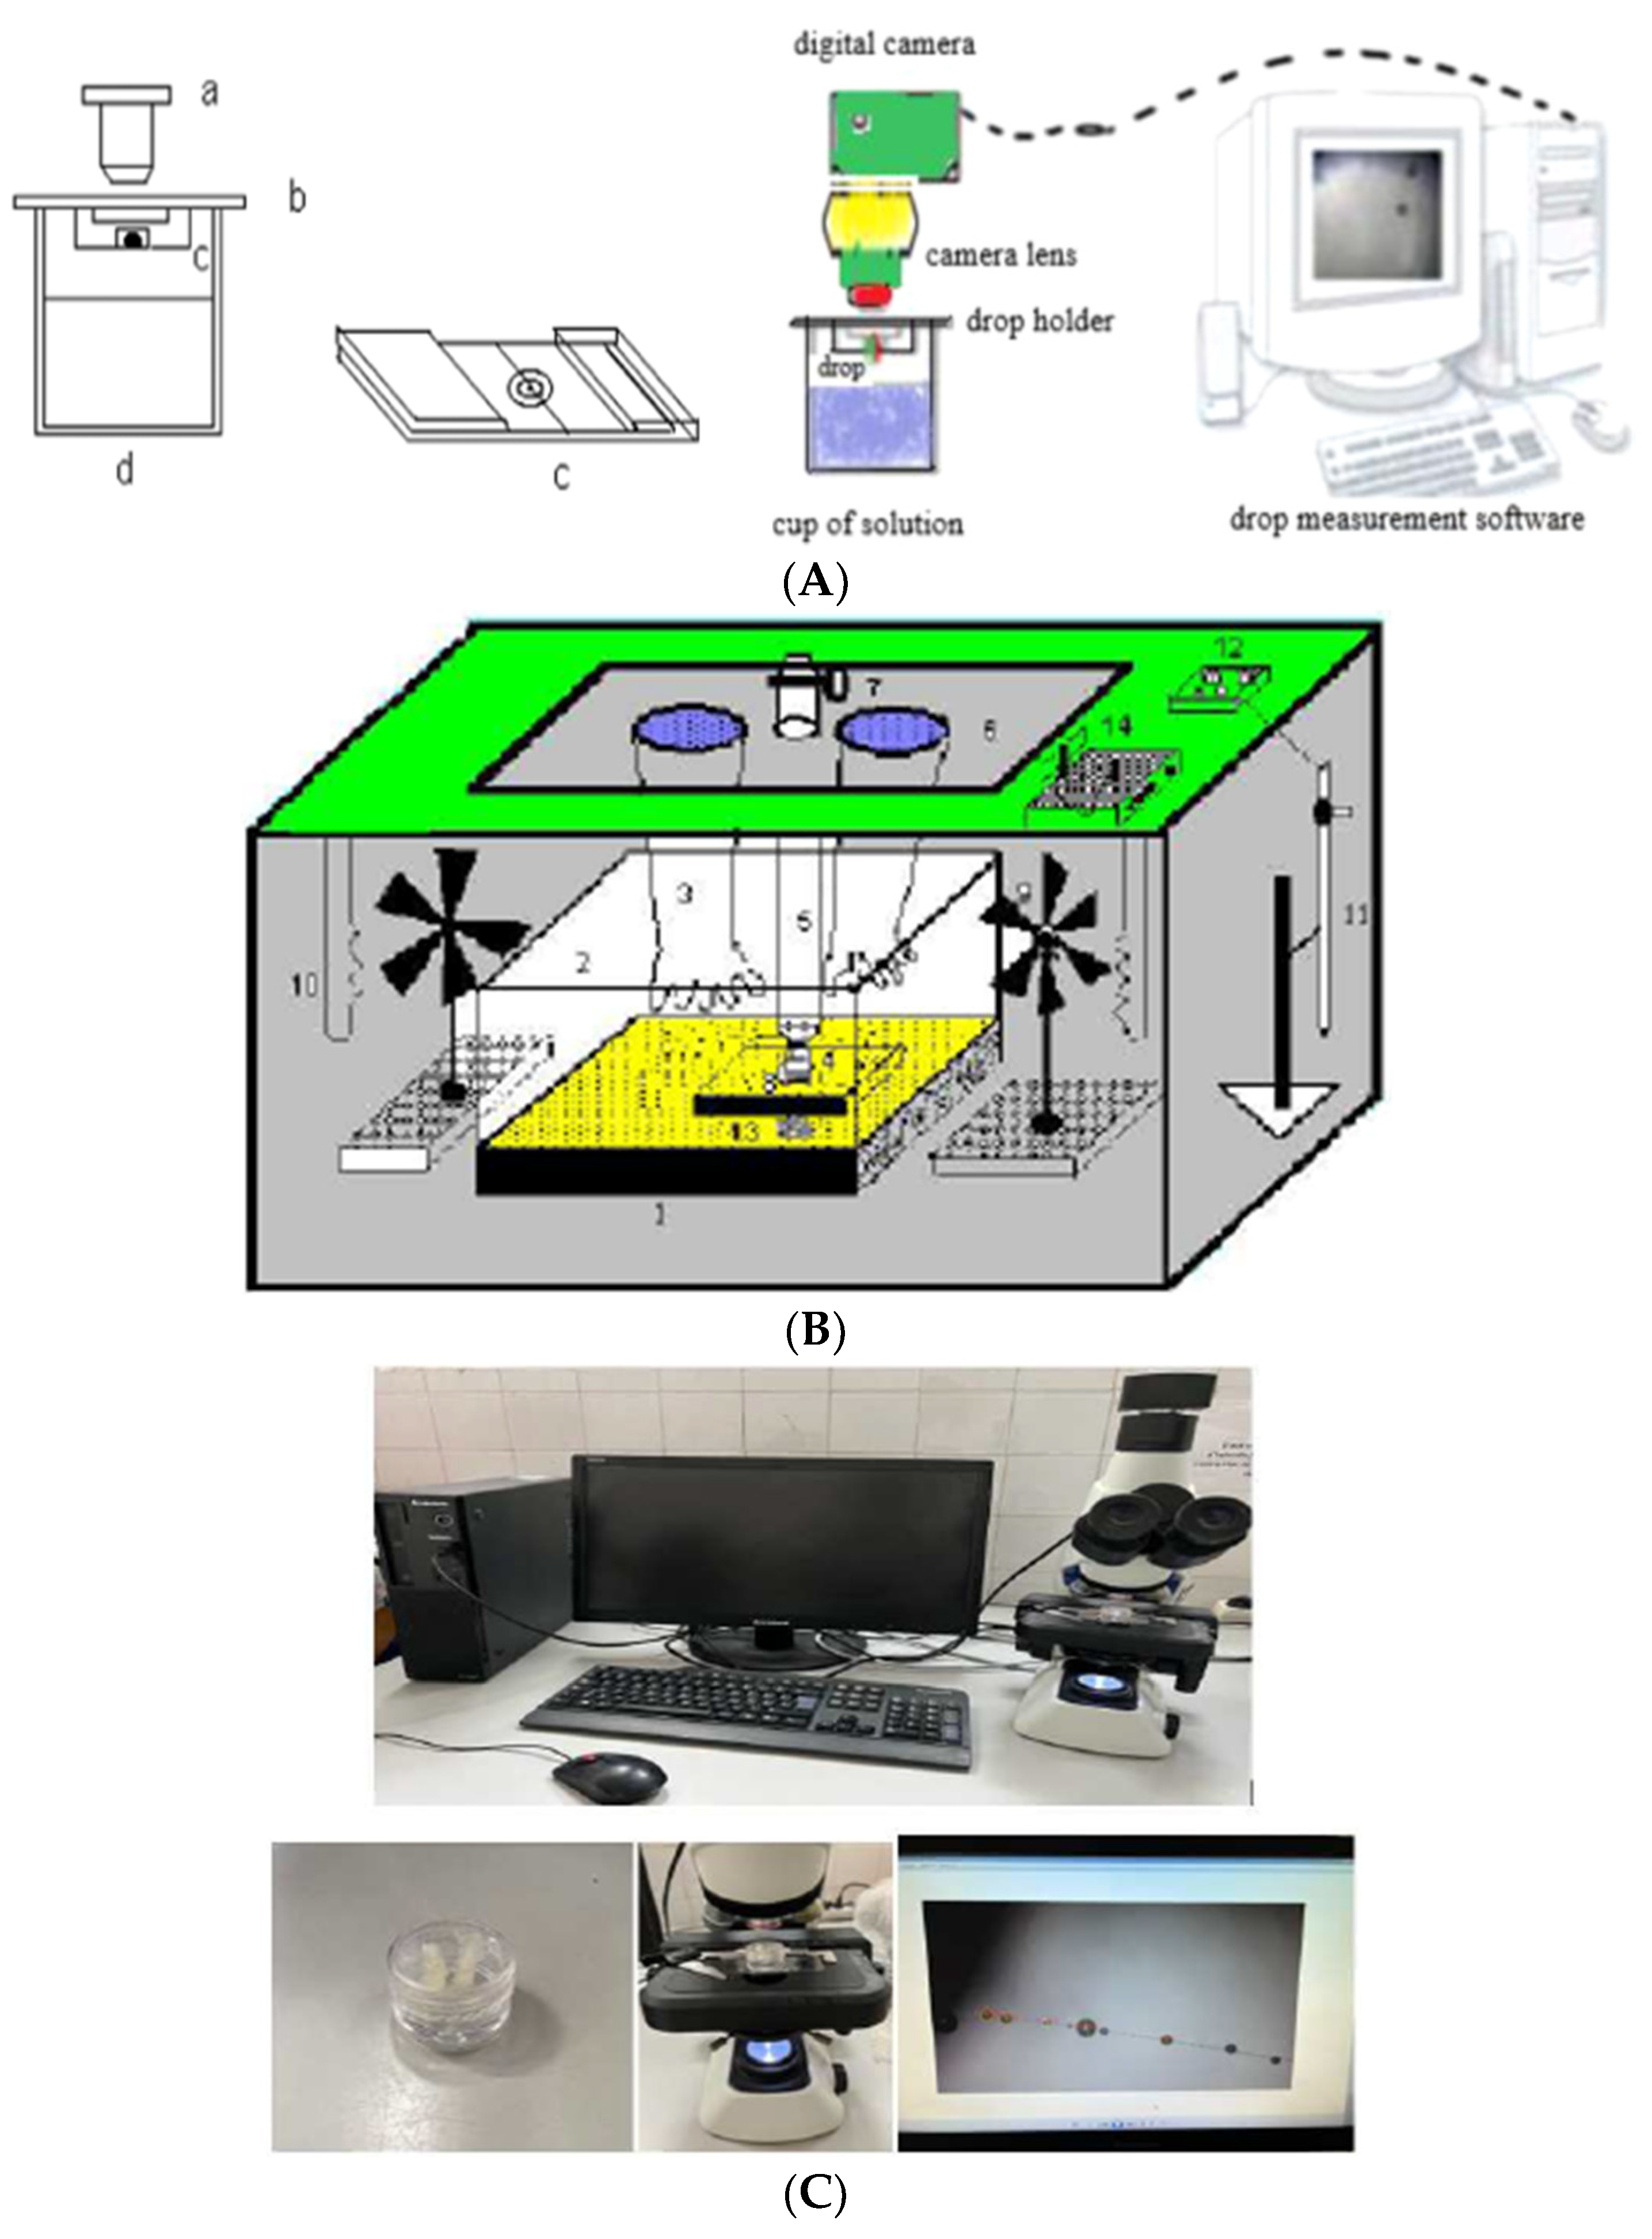
Figure 1. Description of materials used. (A): In hygrometric apparatus: (a) microscope, (b) lid, (c) support of the drops using thin thread on which droplet is pulverized, (d) cup. (B): Thermostatic chamber. 1: Wooden inner box; 2: Glass lid; 3: Gloves; 4: Microscope objective; 5: Extension tube; 6: Glass top cover; 7: Digital camera; 8: Measuring tank; 9: Fan; 10: Heating resistor; 11: Contact thermometer; 12: Heating regulator; 13: Lighting lamp; 14: Refrigeration unit regulator. (C): set of devices. Measurements of droplet diameters are carried out by software installed on computer.
Processes 13 03438 g001
Figure 2. Water activity of ternary solution NH4NO3-sucrose-H2O versus square root of total ionic strength and molality of sucrose at different molalities of D-sucrose increasing from molality ms = 0 mol·kg−1 (lower curve) to molality ms = 4 mol·kg−1 (top curve).
Processes 13 03438 g002
Figure 3. Osmotic coefficient versus square root of total ionic strength and molality of sucrose at molalities of D-sucrose ranging from molality ms = 0 mol·kg−1 (lower curve) to molality ms = 4 mol·kg−1 (top curve).
Processes 13 03438 g003
Figure 4. Mean ionic activity coefficient of NH4NO3versus square root of ionic strength and molality of D-sucrose for different constant molalities of D-sucrose increasing from molality ms = 0 mol·kg−1 (lower curve) to molality ms = 4 mol·kg−1 (top curve).
Processes 13 03438 g004
Figure 5. Activity coefficient of D-sucrose versus the square root of ionic strength and molality of sucrose at molalities of D-sucrose ranging from molality ms = 0 mol·kg−1 (lower curve)to molality ms = 4 mol·kg−1 (top curve).
Processes 13 03438 g005
Figure 6. The excess Gibbs free energies (GE/RT) versus square root of total ionic strength and molality of D-sucrose at different constant molalities of D-sucrose ranging from molality ms = 0 mol·kg−1 (lower curve) to molality ms = 4 mol·kg−1 (top curve).
Processes 13 03438 g006
Figure 7. The Gibbs energy of transfer of NH4NO3 from H2O to the mixed H2O + D-sucrose versus molalities of NH4NO3 at the different constant molalities of D-sucrose ranging from molality ms = 0 mol·kg−1 (lower curve) to molality ms = 4 mol·kg−1 (top curve).
Processes 13 03438 g007
Figure 8. XRD pattern. (a): —sucrose crystallization in water; —sucrose crystallization in NH4NO3-H2O; (b): —NH4NO3 crystallization in H2O; —NH4NO3 crystallization in sucrose + water.
Processes 13 03438 g008
Figure 9. The ATR-FTIR spectra. (a): —sucrose crystallization in water; —sucrose crystallization in NH4NO3 + H2O; (b): —NH4NO3 crystallization in H2O; —NH4NO3 crystallization sucrose + H2O.
Processes 13 03438 g009
Figure 10. The limit of saturation of H2O + sucrose at 298 K measured by hygrometric method and were determined by the constant water activity line of the sucrose solution.
Processes 13 03438 g010
Figure 11. The limit of saturation of H20 + NH4NO3 at 298 K determined by using constant water activity line of the solution of NH4NO3(aq).
Processes 13 03438 g011
Figure 12. The point of saturation (measured and calculated) of NH4NO3 + D-sucrose + H2O at 298.15 K.
Processes 13 03438 g012
Table 1. Descriptions of chemical materials used.
Compound FormSourceFraction Purity
NaClAnhydrousFluka≥0.995
SucroseAnhydrousPanreac≥0.990
NH4NO3AnhydrousMerck≥0.995
Table 2. The aw (water activity) and the ϕ (osmotic coefficient) of NH4NO3-sucrose-H2O from 0.2 to 4 mol·kg−1 of D-sucrose for molality mNH4NO3 of NH4NO3 ranging from 0.1 mol·kg−1 to 6.0 mol·kg−1 at 298.15 K and P = 0.1 MPa.
msucrosemNH4NO3awϕmsucrosemNH4NO3awϕ
0.10.10.99490.9461.03.00.90190.819
0.10.50.98290.8701.04.00.88050.785
0.11.00.96910.8301.05.00.86090.756
0.12.00.94380.7831.06.00.84250.732
0.13.00.92090.7502.00.10.95491.164
0.14.00.89990.7232.00.50.94261.094
0.15.00.88040.7002.01.00.92851.029
0.16.00.86220.6802.02.00.90250.949
0.30.10.99120.9812.03.00.87910.894
0.30.50.97910.9022.04.00.85760.853
0.31.00.96520.8552.05.00.83770.819
0.32.00.93980.8012.06.00.81930.790
0.33.00.91680.7653.00.10.92951.268
0.34.00.89570.7373.00.50.91761.193
0.35.00.87610.7133.01.00.90321.130
0.36.00.85780.6923.02.00.87761.035
0.50.10.98731.0143.03.00.85470.968
0.50.50.97520.9293.04.00.83630.902
0.51.00.96130.8763.05.00.81750.860
0.52.00.93580.8183.06.00.80030.824
0.53.00.91260.7814.00.10.90361.340
0.54.00.89140.7514.00.50.89161.274
0.55.00.87180.7254.01.00.87771.207
0.56.00.85360.7034.02.00.85231.109
1.00.10.97721.0674.03.00.82931.039
1.00.50.9650.9894.04.00.80840.984
1.01.00.95090.9324.05.00.78890.940
1.02.00.92520.8634.06.00.77080.903
The reference solution is sodium chloride. Standard uncertainty of molality is u(m) = 0.01 mol·kg−1 and temperature is u(T) = 0.02 K. The relative standard uncertainty of water activity is u(aw) = 0.0005 for aw > 0.95 and u(aw) = 0.002 for aw < 0.95, and for the osmotic coefficient ϕ is u(ϕ) = 0.0055.
Table 3. Binary parameters of the model for NH4NO3-H2O, D-sucrose–H2O and ternary parameters for H4NO3-D-sucrose–H2O at 298 K and P = 0.1 MPa.
NH4NO3-H2Ommax (mol·kg−1)BMXU1MXV1MXW1MXSDϕ × 03SDγ × 103
7.405−9.9030−0.73880.37790.25683.397 a1.65 a
Sucrose–H2Ommax (mol·kg−1)w12u12 SDφ × 102SDγ × 102
6.00−11.0131.753 1.21242.0183
NH4NO3–sucrose-H2ON aUNMXVNMXWNMXY0MNMXY1MNMXSD × 103
572.3060−7.3173.00601.003
a The number of data points. The SD values are standard deviation of the fit.
Table 4. Mean activity coefficients γ ± of NH4NO3 (aq). Activity coefficients of D-sucrose and excess Gibbs energy (J·mol−1) of NH4NO3-D-sucrose (aq) at the temperature 298.15 K and P = 0.1 MPa.
msucrose/mol·kg−1mNH4NO3/mol·kg−1γ ± NH4NO3γsucroseGE/RTmsucrose/mol·kg−1mNH4NO3/mol·kg−1γNH4NO3γsucroseGE/RT
0.100.100.7510.783−0.0381.000.100.7740.9270.073
0.100.500.5860.662−0.3731.000.500.6050.783−0.224
0.101.000.5040.620−0.9591.001.000.5200.731−0.763
0.102.000.4190.598−2.4161.002.000.4320.699−2.128
0.103.000.3680.601−4.1121.003.000.3790.699−3.734
0.104.000.3320.614−5.9741.004.000.3410.710−5.510
0.105.000.3040.633−7.9641.005.000.3120.728−7.416
0.106.000.2810.655−10.0581.006.000.2890.750−9.429
0.300.100.7560.813−0.0272.000.100.7991.1140.388
0.300.500.5900.687−0.3542.000.500.6240.9390.130
0.301.000.5080.643−0.9292.001.000.5370.873−0.360
0.302.000.4220.619−2.3662.002.000.4450.831−1.630
0.303.000.3710.621−4.0412.003.000.3900.825−3.143
0.304.000.3340.634−5.8832.004.000.3510.833−4.829
0.305.000.3060.653−7.8542.005.000.3210.848−6.648
0.306.000.2830.675−9.9292.006.000.2960.869−8.577
0.500.100.7610.844−0.0094.000.100.8411.5891.607
0.500.500.5940.713−0.3274.000.500.6581.3331.418
0.501.000.5120.667−0.8924.001.000.5661.2321.013
0.502.000.4250.641−2.3074.002.000.4691.157−0.087
0.503.000.3730.643−3.9634.003.000.4111.134−1.436
0.504.000.3360.655−5.7854.004.000.3691.132−2.962
0.505.000.3070.674−7.7374.005.000.3361.140−4.627
0.506.000.2850.696−9.7954.006.000.3101.156−6.405
Table 5. The parameters of interaction relating to the Gibbs energies of transfer of NH4NO3 from H2O to mixed H2O + D-sucrose and the salting constants ηs at the temperature 298.15 K.
gEN
J.kg.mol−2
gEEN
J.kg.mol−3
gENN
J.kg.mol−3
R2%ηs
137.89−7.73561−5.9384299.990.2225
Table 6. The measured solubility in the NH4NO3–sucrose–H2O system at 298.15 K and P = 0.1 MPa.
msucrose (mol·kg−1)Solubility of NH4NO3 (mol·kg−1)UncertaintyCrystalline Solid
0.0026.9550.527NH4NO3(S)
2.5025.0400.415NH4NO3(S)
2.8024.8280.634NH4NO3(S)
3.1024.6200.293NH4NO3(S)
3.4024.4160.591NH4NO3(S)
Solubility of sucrose (mol·kg−1)mNH4NO3 (mol·kg−1)UncertaintyCrystalline Solid
5.980.2000.120Sucrose(S)
4.1918.7000.108Sucrose(S)
6.000.0000.152Sucrose(S)
Disclaimer/Publisher’s Note: The statements, opinions and data contained in all publications are solely those of the individual author(s) and contributor(s) and not of MDPI and/or the editor(s). MDPI and/or the editor(s) disclaim responsibility for any injury to people or property resulting from any ideas, methods, instructions or products referred to in the content.