Abstract
The use of equipment is an important source of energy consumption and carbon emissions. The energy consumption and carbon emissions generated by different types and quantities of equipment processing the same product vary greatly. At present, most of the equipment selection is only a comparison of the best types, rarely considering the dynamic changes and effects of the production process elements, which makes it difficult to adapt to the needs of sustainable development. In order to solve this problem, we establish a production equipment selection model based on new quality productivity (NQP)-oriented, and establish a unified calculation method for different types of equipment to consider energy consumption and carbon emissions in the production process. The multi-objective egret swarm optimization algorithm (MESOA) is used to calculate the energy consumption and carbon emissions of different devices. A case was conducted, taking the shaft processing as an example. The results show that the optimal energy consumption and carbon emission of the same product produced by different equipment can be calculated under the orientation of new quality productivity. In the later stage of the algorithm, MESOA outperforms NSGA-2 by 5.3%. At last, this paper provides a positive result for equipment selection under the orientation of new quality production.
1. Introduction
As a pillar industry in China, the manufacturing industry has a wide range of categories, covering various fields such as power machinery, textile machinery, chemical machinery, and other industries. At the same time, it involves chemical, medical, logistics, and other industries. Its development level not only reflects the degree of national industrialization, but also is an important symbol to measure the competitiveness and sustainable development ability of the national economy [1]. According to the data of the statistical bulletin of the People’s Republic of China on national economic and social development in 2023, China’s total energy consumption reached 5.72 billion tons of standard coal, an increase of 5.7% over 2022 [2]. The International Energy Agency pointed out in the report of CO2 emissions that China’s greenhouse gas emissions in 2023 reached 12.6 billion tons of carbon dioxide equivalent, of which the direct and indirect emissions of greenhouse gases from industrial production accounted for about 68.8%. This series of data shows that while the economy is developing at a high speed, China’s manufacturing industry is facing severe challenges of energy consumption and environmental pollution. Promoting green and low-carbon transformation has become an inevitable choice to achieve high-quality development [3,4].
In the manufacturing process, as the core link of product production, processing equipment is also an important source of energy consumption and carbon emissions. Its operation state, processing efficiency, and process parameters directly affect the overall energy consumption level [5]. Traditional equipment selection methods focus on the economic benefits, production efficiency, and product quality of equipment, but often ignore the dynamic changes in energy consumption and carbon emissions in the actual operation of equipment [6]. With the popularity of the concept of low-carbon economy and the continuous promotion of the national energy conservation and emission reduction policy, how to scientifically evaluate and optimize the energy consumption and emissions in the operation of equipment on the basis of ensuring efficient production and high-quality products has become an urgent technical problem for manufacturing enterprises, and also an important breakthrough to achieve green manufacturing [7].
At present, the research on green manufacturing and equipment selection at home and abroad mainly focuses on energy-saving transformation, process optimization, carbon footprint evaluation, and other fields [8,9]. Although these studies provide useful exploration for the green transformation of the manufacturing industry, systematic research on the comprehensive consideration of energy consumption and carbon emissions in the process of equipment selection is still insufficient [10,11,12]. Most of the existing methods use single objective or simple multi-objective weighted processing, which is difficult to fully reflect the energy consumption changes and environmental effects of equipment in the whole life cycle; At the same time, although multi-objective optimization algorithms (such as genetic algorithm and particle swarm optimization algorithm) have achieved the balance of economic benefits and environmental benefits to a certain extent, their adaptability and calculation accuracy are still insufficient in the face of the real-time dynamics of equipment operation status and complex environmental variables, which is difficult to meet the strict requirements of green and low-carbon standards in the actual production process [13]. Based on the above research, Xiao et al. studied the selection model of energy-saving and high-efficient equipment and the selection model of low-carbon and high-efficient equipment under the guidance of commercial compass, filling the theoretical basis related to equipment selection in terms of commercial value. But based on new mass productivity-oriented energy conservation. The selection of low-carbon equipment has not been reported yet. How to combine the advanced thinking of new quality productivity to guide equipment selection and strengthen the relationship between theory and actual manufacturing industry has a good theoretical and practical significance for the selection of energy-saving and efficient production. Table 1 shows the research gap of related work.

Table 1.
The research gap in related work.
In view of the above problems, this paper proposes an energy-saving and low-emission equipment selection model based on the new quality production orientation, aiming to build a comprehensive evaluation system that takes into account production efficiency, product quality, and environmental benefits. The model quantifies the energy consumption and carbon emissions of different types of equipment in the process of processing the same product through a unified calculation method, and introduces the multi-objective egret swarm algorithm (MESOA) to optimize the alternative solutions, so as to realize the real-time balance control of energy consumption and emissions in the dynamic production process. Based on the reference in Table 1, the MESOA adopts the adaptive weight update mechanism based on “egret foraging” behavior, which can quickly diffuse in the early stage of the search and quickly converge in the late stage, significantly reducing the number of iterations. By directly embedding the energy consumption/carbon emission index in the fitness, the dynamic weight adjustment mechanism can minimize the energy consumption and avoid the additional energy consumption caused by manual parameter adjustment in the traditional multi-objective algorithm. In the multi-objective optimization of tool cutting parameters (processing quality, processing time, energy consumption, and carbon emission), diversity and convergence accuracy of the solution set can be maintained, which is superior to the congestion failure of NSGA-II and the reference vector dependence of MOEA/D.
Taking hole machining as an example, this paper verifies the feasibility and effectiveness of the model through experiments, and proves that under the guidance of new quality production, the differences in energy consumption and carbon emissions of different equipment in the same production task can be accurately calculated and scientifically compared, which provides practical decision support for manufacturing enterprises in equipment update, process improvement and life cycle management.
To sum up, while promoting the development of the national economy, the manufacturing industry is also facing increasingly severe problems of energy consumption and environmental pollution. As a key link in the production chain, the energy consumption and carbon emissions of processing equipment have an important impact on the overall green transformation of enterprises [16]. Based on the research results of green manufacturing at home and abroad, this paper puts forward the equipment selection framework under the guidance of new quality production (NQP).
Under the constraints of tool life, lathe technological capacity, and processing quality, with the energy consumption and carbon emissions in the processing process as the optimization objectives, a multi-objective optimization model for turning processing parameters was established. An improved multi-objective egret swarm optimization algorithm (MESOA) was proposed to solve this model and compared with the manual method to verify the effectiveness of this method. It provides a new theoretical basis and practical path for the realization of low-carbon, environmental protection, and efficient development of the manufacturing industry. With the continuous progress of technology and the in-depth promotion of the concept of green and low-carbon, this method is expected to be widely used in more manufacturing fields, providing solid support for the transformation and upgrading of China’s manufacturing industry.
2. Equipment Selection Based on NQP
In the context of NQP, equipment selection not only involves improving production efficiency, but also needs to consider multiple factors such as sustainable development. The NQP provides a comprehensive strategic framework through five core elements—technological innovation, market innovation, resource optimization, ecosystem collaboration, and organizational change-to help companies make rational equipment selection decisions in complex environments and enhance overall competitiveness [17,18,19].
2.1. Equipment Selection
Driven by informatization, digitization, and intelligence, new quality productivity not only focuses on improving production efficiency but also emphasizes resource conservation and environmental sustainability. Unlike traditional productivity models, new quality productivity emphasizes technological innovation and green low-carbon production, and requires equipment selection to meet multiple requirements such as energy conservation, emission reduction, intelligence, and full lifecycle cost [20]. The core of equipment selection is to ensure efficient resource utilization and reduced environmental burden while improving production efficiency. Therefore, enterprises should choose devices that have forward-looking technologies, support intelligent and green production, and are in line with future development trends.
New quality productivity not only emphasizes the improvement of production efficiency, but also pays more attention to environmental friendliness and sustainable use of resources. Equipment selection plays a crucial role in achieving energy-saving and low-emission goals. According to the Figure 1, equipment selection is a key point at the intersection of multiple aspects, covering energy-saving management, process optimization, waste management, and low-emission target requirements. By selecting appropriate equipment, enterprises can effectively improve resource utilization efficiency in the production process, while reducing energy waste and environmental pollution.
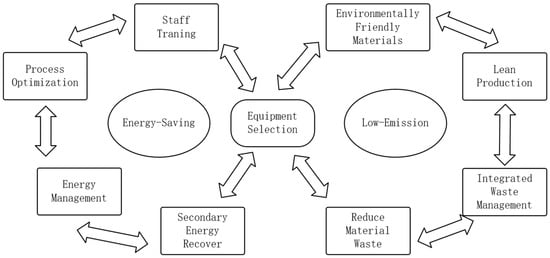
Figure 1.
Energy-saving and low-emission Equipment Selection.
Equipment selection plays a central role in achieving these goals. Firstly, the energy-saving characteristics of the equipment directly affect the management of energy consumption throughout the entire production process. Choosing high-efficiency energy-saving equipment can significantly reduce energy consumption, optimize energy use in the production process, and help enterprises achieve significant results in energy-saving management. At the same time, the low emission characteristics of the equipment help enterprises meet environmental protection standards, reduce harmful gas emissions, and achieve green development in the production process.
Under the framework of new quality productivity, equipment selection should not only focus on production efficiency, but also take into account environmental friendliness and intelligence. Intelligent devices can optimize production processes through data-driven optimization, adjust parameters in real-time to reduce energy consumption, and improve resource utilization efficiency. Therefore, equipment selection must take into account the entire lifecycle of the equipment, from procurement to maintenance, and then to disposal, to ensure the maximization of resource utilization and minimization of environmental impact in the production process.
In addition, equipment selection is closely related to other relevant factors such as lean production, waste management, and the use of environmentally friendly materials. Through device selection, enterprises can promote process optimization and waste reduction, thereby reducing resource waste and material consumption in the production process. Under the guidance of new quality productivity, equipment selection provides comprehensive optimization methods for enterprises, helping them achieve sustainable development in energy conservation, low emissions, and resource optimization.
2.2. The Framework of Equipment Selection Based on NQP
New quality productivity (NQP) represents an advanced form of productivity characterized by high technological content, operational efficiency, and product or process quality. The high-level conceptual framework of NQP [21,22] is illustrated in Figure 2. The core of NPQ is digital productivity, technological productivity, and green productivity, which can enable high-quality development of the economy and manufacturing industry (First circle). The high-quality development can be represented by innovative development, coordinated development, green development, open development, and shared development (Second circle). The NQP provides a multidimensional decision-making framework for device selection, as a mechanism to drive businesses to make rational choices in complex market and technological environments (Third circle). One is to drive enterprises to select more effective equipment in the manufacturing process to achieve high-quality development (Fourth circle). Under the guidance of new quality productivity, the key objective of equipment selection is to pursue more efficient, low-carbon, low-energy consumption, and other objectives in enterprise production activities (Fifth circle).
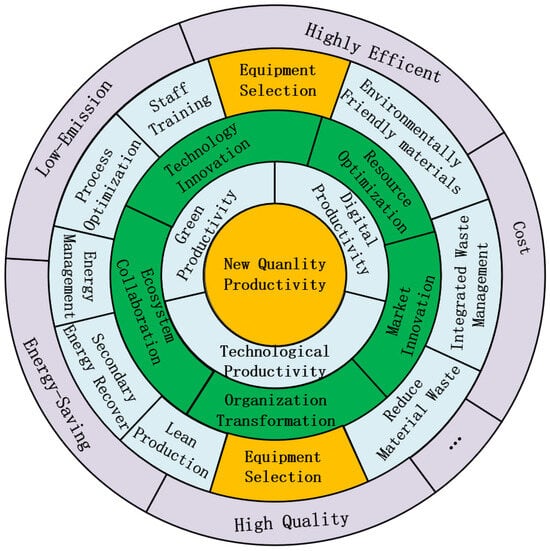
Figure 2.
Equipment Selection based on NQP Framework.
According to Figure 2, equipment selection involves the intersection of multiple key factors, including technological innovation, market demand, resource optimization, industry chain collaboration, and organizational change [23,24]. By using an NQP, companies can ensure that equipment selection meets the goals of energy conservation, low emissions, and intelligence while improving production efficiency.
Equipment selection needs to be closely integrated with technological innovation to ensure that the selected equipment can support the latest technological advances and improve production efficiency. Intelligent devices can adjust production parameters in real time, helping enterprises optimize production processes and reduce energy consumption [25]. The changes in market demand also need to be considered when selecting equipment, choosing equipment that can flexibly respond to market changes and support customized production.
Resource optimization is also an indispensable consideration in device selection. By choosing energy-saving and efficient equipment, enterprises can reduce resource consumption, improve production efficiency, and reduce the burden on the environment. The selection of equipment also needs to promote industry chain collaboration, ensure that the equipment can form a synergistic effect with the upstream and downstream of the supply chain, and improve overall production efficiency.
Organizational change represents the driving force of equipment selection on internal management and production processes within the enterprise. Smart devices can not only improve production efficiency but also enhance information flow and decision-making processes, thereby promoting organizational optimization and management level improvement of enterprises.
By integrating these factors, NQP helps enterprises make comprehensive decisions in the equipment selection process, promote continuous progress in technological innovation, market adaptation, resource utilization, and organizational management, enhance overall competitiveness, and promote green production and intelligent transformation [26].
3. Model Construction Based on Energy Consumption and Carbon Emissions
In the process of CNC milling, the two factors that have the greatest impact on the environment during the turning process are energy consumption and carbon emissions. The cutting speed, feed rate, and feed depth are the main controlling factors affecting energy consumption and carbon emissions. A reasonable combination of cutting parameters can achieve the coordination of various targets in the milling process, improving production efficiency while reducing production costs and environmental pollution. Therefore, the author will measure the cutting rate, feed rate, and cutting width a. These three parameters serve as the optimization variables for this study. Which can be expressed as Formula (1).
In the formula, n, f, and respectively represent the spindle speed (unit: r/min), feed rate (mm/min), and feed depth (unit: mm) of the machine tool. indicates energy consumption, indicates carbon emissions.
3.1. Machine Tool Processing Energy Consumption
Machine tool processing energy consumption refers to the energy consumption generated during the machine tool processing, including the energy consumption generated during the actual processing of the machine tool and the power consumption generated when the machine tool is unloaded. In addition, it also includes the power consumption generated by various auxiliary systems during the machine tool processing. The auxiliary power consumption of machine tools is mainly generated by coolant pumps, lighting, machine control equipment, and other devices. It can be expressed as Formula (2).
represents the no-load power, represents the cutting power, represents the cutting time, and represents the power consumption generated by other auxiliary equipment besides the main motor of the machine tool. We can express the no-load power of as shown in Formula (3).
The energy consumption of machine tools under no-load conditions mainly consists of three parts, namely the inherent energy consumption of the spindle motor under no-load conditions, the coefficient related to the spindle structure and machine performance, and the coefficient related to spindle friction. Among them, and are related to the current speed n of the spindle motor.
The power of the machine tool during operation mentioned in Formula (3) is related to the cutting force and cutting speed during the cutting process, and can be expressed as Formula (4), where D represents the diameter of the milling cutter used in the machining process (unit: mm). Formula (5) represents the relationship between cutting time, cutting path length L, spindle speed n, and feed rate f.
During the machining process, in addition to the power consumption generated by the main motor of the machine tool, it also includes the power consumption generated by various auxiliary systems. As shown in Formula (6), the power consumption generated by the auxiliary system is . The auxiliary system mainly consists of coolant pump power consumption, lighting power consumption, control system power consumption, and other equipment power consumption. The power consumption of the clamping operation during the machining process of the workpiece can be ignored.
3.2. Machine Tool Processing Emissions
The carbon emissions generated by machine tools during the machining process are composed of multiple parts, including the carbon emissions generated by the electricity used by the machine tools during the machining process, the carbon emissions cause by material consumption, the carbon emissions generated by the cutting materials scrap during the machining process, the carbon emissions generated by the use of coolant during the machining process, and the carbon emissions generated by the cutting tools during the machining process.
As shown in Formula (7), where represents the electric carbon emission factors, represents the material carbon emission factors, represents the cutting scrap carbon emission factors, represents the machine tool use carbon emission factors, represents the coolant use carbon emission factors. Then, represents the electrical energy consumption of mechanical processing equipment, represents the mass of cutting scrap, represents the cutting tool life, represents, and represents the amount of coolant used per unit time.
(1)
The carbon emission factor of electricity is closely related to the composition of the power grid, and different power grids have different carbon emission factors. Jeswiet and Kara proposed the concept of electric energy carbon emission factors and compared the carbon emission factors of two different power grids, indicating that there are significant differences in carbon emission factors between different power grids. The Climate Change Response Department of the National Development and Reform Commission of China releases data on the carbon emission factors of several major power grids in China every year. Table 2 shows the emission factors of several major power grids in China in 2009 [27]. This article uses the average of several major grid emission factors as the carbon emission factor for electrical energy when calculating the carbon emissions of mechanical processing systems.
Table 2.
The emission factors of several major power grids in China.
The energy consumption of the machining equipment of the machine tool is determined by Formula (2).
(2)
According to the IPCC carbon emission factor index, the material carbon emission factor is defined as the amount of carbon dioxide emissions caused by the output of a unit of material (selected as per kilogram in the text). The calculation formula for the material carbon emission factor is as follows.
represents material energy carrying capacity, the unit is MJ/kg; represents the carbon content of materials, the unit is kg/MJ. Many institutions and scholars at home and abroad have conducted extensive research on determining the energy-carrying capacity of materials, and the data is relatively complete. However, it is difficult to determine the carbon content of different materials. Therefore, by converting the energy-carrying capacity of materials into equivalent standard coal and combining it with the carbon emission factors of standard coal, the carbon emission factors of different materials can be calculated. Then Equation (8) is converted into Equation (9).
represents material energy carrying standard coal equivalent, the units is kg ce/kg; indicate the carbon emission factor of standard coal; the units are kg CO2/kg. The carbon emission factors of commonly used materials in mechanical processing can be calculated as shown in Table 3.
Table 3.
Common material carbon emission factors.
V represents cut-off material; it can be calculated based on the material removal rate. The material cutting rate can be determined by the cutting parameters on the process route sheet. The material removal rate (Q) is the volume of material removed per unit time.
Within the cutting time , the mass of material to be cut is
The calculation formula for cutting time is
represents material removal rate, unit is mm3/s; units is s; is material density, g/cm3; is feed depth, units are mm; is feed rate, units mm/min; n is spindle speed, r/min; is cutting speed, units are m/s; is workpiece processing length (mm); ∆ is Workpiece machining allowance (mm); is workpiece diameter (mm).
(3)
The cutting scrap generated by the machining system needs to be collected and compacted before being returned to the furnace (electric melting furnace) for treatment, which will result in carbon emissions. The cutting scrap mainly includes scrap iron, steel, and aluminum. Due to different requirements and standards for recycling, the processing technology for these cutting scraps also varies greatly. Therefore, the energy consumption and carbon emissions of processing different types of waste per unit mass are also different. The calculation formula for is as follows:
is the consumption of standard coal for processing unit mass cutting scrap. is carbon emission factor of standard coal.
The carbon emission factors for processing different types of cutting scrap are shown in Table 4.
Table 4.
Energy Consumption and Carbon Emission Factors for Cutting Scrap Disposal.
(4)
Generally speaking, in the process of mechanical processing, the direct environmental impact caused by cutting tools is relatively small, mainly indirect impact; that is, the environmental impact of the tool preparation process is shared in the use process. Therefore, for a certain machining process, the calculation method for tool carbon emissions is similar to that of cutting fluid, using a time-based allocation method. The specific calculation method is as follows:
To calculate the carbon emission factor of cutting tools, the first step is to know the energy consumption of tool preparation. is cutting time, is machine tool life, is carbon emission factor of cutting tools, is the weight of the cutting tool. The weight of the cutting tool can be measured.
The tool life refers to the cutting time of the tool from the beginning of cutting until its wear reaches the dullness standard. It refers to the net cutting time, excluding non-cutting time such as tool alignment, measurement, fast forward, and return. The tool life is closely related to the selection of machining parameters. The empirical formula relationship between tool life and machining parameters given in the machining process manual is as follows [30,31].
is a constant related to cutting conditions; j, k and l are related to indices related to tool materials and cutting materials. Due to the complexity of calculating tool life using empirical formulas, numerous experiments have shown that cutting speed has the greatest impact on tool life, followed by feed rate, and back cutting rate has the smallest impact. To simplify the calculation, only the influence of cutting speed on tool life is considered. According to Taylor’s formula, there is a relationship between cutting speed and tool life as follows:
j is the tool life index, which represents the degree of influence of cutting speed on tool life; A is a constant related to cutting conditions, and its value can be obtained by consulting literature [30]. However, due to the influence of many factors such as tool material, workpiece material, processing conditions (such as different process parameters), and processing environment (such as the presence or absence of cutting fluid), the calculated value of tool life often varies greatly. In the actual calculation process, the tool life can refer to the empirical value of actual factory processing.
(5)
There are two parts to consider for the carbon emission factor of cutting fluid: (1) preparing the carbon emission factor CEF from pure mineral oil required for configuring cutting fluid; (2) the Carbon emission factor of waste cutting fluid treatment.
Carbon emission factors for mineral oil preparation. The energy content of general oil substances ranges from 41,868 to 42,705 kJ/kg (with an average value of 42,287 kJ/kg taken for calculation), and the default carbon emission factor for oil substances is 20 kg C/GJ. The density of oil substances at room temperature and pressure is 0.86 to 0.98 g/cm3 (with an average value of 0 taken for calculation), 92 g/cm3. The carbon emission factor of mineral oil is calculated to be 2.85 kgCO2/L. This value is used for calculation in this article.
There are often phenomena such as evaporation, leakage, and chip adsorption during the service life of cutting fluid. The replacement cycle of cutting fluid is generally between one to three months [32]. In this article, the average value of 2 months is taken as the replacement cycle of the cutting fluid .
4. Verification of Multi-Objective Parameter Optimization Examples in Turning Processing
The egret swarm optimization algorithm originated from the observation of two kinds of egret predation strategies in nature. Snow egrets often wait quietly for their prey, while the Great Egret shows an active predatory behavior. Inspired by these two different strategies, the algorithm combines “sit-and-wait strategy, aggressive strategy”, which not only keeps attention on the global optimal solution, but also can quickly find the local optimal solution. Because of this, ESOA does not need to rely on a large number of parameter adjustments and can flexibly adapt to the needs of solving different problems, effectively avoid falling into local optimization, and ensure high global search efficiency and convergence speed [33]. The above characteristics of the Egret Swarm Algorithm enable it to balance multiple conflicting objectives and output a set of Pareto optimal solutions, making it more suitable for multi-objective scenarios such as complex engineering optimization and parameter tuning. During the process of optimizing the control of pressure, flow rate, and temperature in gas turbine cooling systems using the MESOA, Li used the Frierdman test to verify the stability and statistical effectiveness of MESOA [34]. Therefore, this paper does not verify the stability and statistical effectiveness of MESOA. In recent years, egret swarm optimization algorithms have been widely used in many fields, especially in combinatorial optimization, multi-objective scheduling, network resource allocation, and other complex problems [35,36]. Previous studies have shown that ESOA can show strong robustness and search ability in high-dimensional, nonlinear, and dynamic environments. Its simple and efficient structure makes the algorithm have low implementation difficulty and stable performance in practical engineering applications, which provides a new idea for solving the problems involving multiple conflicting objectives in actual production. Because of this feature, ESOA has gradually attracted the attention of academia and industry and has achieved good results in multi-objective optimization problems.
Aiming at the multi-objective optimization problem of CNC machine tool equipment selection, this paper improves the traditional egret group optimization algorithm and puts forward the multi-objective egret swarm optimization algorithm (MESOA). In the process of equipment selection, enterprises should not only comprehensively consider the economic cost, production efficiency, and product quality, but also consider the environmental indicators, such as energy consumption and carbon emissions, in the process of equipment operation. This problem is essentially multi-objective, nonlinear, and dynamic, and MESOA is an optimization tool tailored to solve such problems. By constructing a unified evaluation model, the improved algorithm achieves the coordination of the conflict relationship between the objectives and further improves the precision and convergence speed of local search while ensuring the global search ability. Therefore, this paper uses the improved multi-objective algorithm based on ESOA. The specific flow of the algorithm is shown in Figure 3.
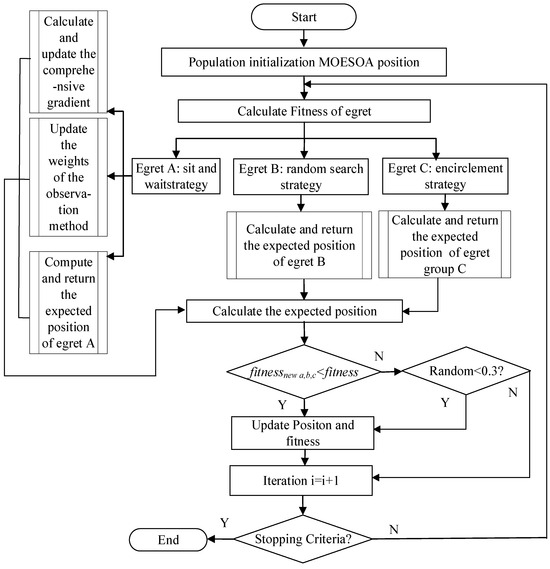
Figure 3.
Flow chart of multi-objective egret swarm optimization algorithm.
As shown in Figure 3, this study uses MESOA to obtain the Pareto optimal solution for the processing parameter optimization problem.
Step1: Set the population size N and the maximum number of iterations maxGen, where N = 20–200 and the maximum number of iterations maxGen = 100–5000. The optimization objective is set to minimize energy consumption and carbon emissions, and the objective function is expressed as shown in Equation (1).
Step2: Set the composition of the group’s individual structure. To reduce encoding errors, real number encoding is adopted and represented by structures. The constituent elements of the individual structure include three variables: cutting depth, feed rate, and cutting speed. Energy consumption and carbon emissions are taken as the optimization goals, and the values of the constraint conditions are determined.
Step3: Initialize the population size containing N individuals, randomly assign variable values within the variable range, then calculate the values of the objective function and the constraint conditions, respectively. Finally, perform non-dominated sorting on the N individuals to obtain the initial egret population, where the position of each egret represents a candidate solution in space.
Step4: Use the wait-and-sit strategy to calculate and update the comprehensive gradient. The observation equation of the i-th Egret A can be described as , function E represents the evaluation method of Egret A for possible targets at the current location. is the position of group i. Calculate the current estimated value of prey by iteration, parameterize the evaluation method, and calculate the error .
where the is the weight of the estimate method. The error could be described as below.
means the practical gradient of , it can be obtained by calculating the partial derivative of , and its direction is .
Calculate and update the comprehensive gradient .
In the formula, () represents random numbers between (0,0.5), which are used to balance the weights corrected in different directions in the comprehensive gradient. represents the direction correction for the best position of the i-th egret squad. represents the direction correction of the best positions of all teams in the i-th egret team.
Update the weight of the observation
In the formula: represents the exponential moving mean of the gradient, and represents the exponential moving mean of the square of the gradient.
Obtain and return the expected position of Egret A.
represents the current position of Egret A, represents the upper and lower bound intervals of the solution space, represents the current number of iterations, and represents the maximum number of iterations.
Step5: Aggressive Strategy. Egret B tends to randomly search for prey and its behavior could be depicted as below.
In the formula: represents the random number used to synthesize the expected position of egret B, and is the random number between (−π/2,π/2).
Step6: Obtain and return the expected position of Egret group c through the encirclement strategy.
In the formula: represents the gap matrix between the current position and the best position in this egret team, and represents the gap matrix between the current position and the best positions in all egret teams. and are random numbers in (0,0.5).
Step7: Discrimination conditions. After each member of the Egret group has decided on their own plan, the group will select the best option and take action together. is the solution matrix of the i-th Egret class:
If the minimal value of is better than the current fitness , the Egret squad would accept the choice. Or if the random number is less than 0.3, which means there is a 30% possibility to accept a worse plan.
Step 8: Compare the global optimal solution and the historical optimal solution of the individuals in the population and determine whether to set t = t + 1 until the optimal solution is finally obtained or the termination condition is met.
In this paper, different types of CNC machine tools and their corresponding processing parameters are taken as optimization variables, processing costs and carbon emissions are taken as optimization objectives, and the multi-objective egret swarm optimization algorithm is used for multi-objective optimization. The detailed optimization steps are shown below.
Example Verification
In order to verify the effectiveness of the equipment selection model, an RFCX26 horizontal CNC machine tool M1 was selected for the experiment, with a spindle power of 15 kW and a maximum speed of 4500 r/min. The detailed parameters are shown in Table 5; And XHK716 vertical machining machine M2, with a spindle power of 15 kW and a maximum speed of 8000 r/min. Please refer to Table 6 for detailed parameters. Jointly process the same shaft type parts (part specifications are shown in Figure 4). Analyze the device selection model. The surface roughness requirement for machining is Ra < 6.4. µ m, and the power coefficient of the machine tool is 0.8.
Table 5.
Basic parameters of CNC lathe M1.
Table 6.
Basic parameters of CNC milling machine M2.
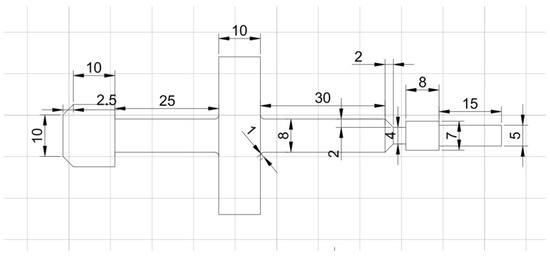
Figure 4.
Component Structure Diagram.
By inputting relevant data, a model that comprehensively considers energy consumption and carbon emissions is constructed as shown in Formulas (8) and (9). When the spindle speed of the M1 machine tool is between 500 and 2000 r/min, the speed correlation coefficients K1 and K2 are 0.4759 and −1.399 ∗ 10−6, respectively. The real-time power of device M1 is collected using the WB6830 sensor, and then the data is transmitted to the PC for storage through the Modbus protocol. The minimum no-load power coefficient of the machine tool is 1.1 kw/h. The power efficiency factor of machine M1 is 0.8. In the carbon efficiency calculation formula, the material carbon emission factor is set to 2.69, and the waste disposal carbon emission factor is set to 0.361. The carbon emission factors of cutting fluid oil is 2.85 (shown at Section 3.1 (5). By querying the emission factors of China’s regional power grid baseline, it was found that the carbon emission factor of the test site in East China, where this article was conducted, was about 0.8. Rajemi et al. [37] found that the average mass of a single blade was 9.5 g. When only considering the energy consumption during the tool preparation process, the total energy consumption of the tool was 1.5 MJ. Combined with the electricity carbon emission factor , the carbon emission factor of the tool was calculated to be 34.7 kg CO2/kg.
In equation
In order to determine the optimal combination of process parameters for the machine tool, a 5-level 3-factor table for the CNC lathe (as shown in Table 7) and a 3-level 3-factor table for the CNC milling machine (as shown in Table 8) were collected based on the actual performance of the machine tool.
Table 7.
Numerical Control Lathe Factor Level Table.
Table 8.
Numerical Control Milling Machine Factor Level Table.
Taking the turning process of a certain shaft type part shown in Figure 4 by the two machine tools mentioned above as an example (the part material is 45 steel, and the selected processing length is 105.5 mm), analyze the method and application of the model in this paper.
5. Results
Based on the device selection model constructed above, write relevant programs in Matlab 2022b (Natick, MA, USA). The experimental platform is Intel Core i7-14650HX (2.20 GHz), with 16 GB DDR4 RAM, running a Windows 10 64-bit system. This algorithm is implemented based on MATLAB R2022b and does not use GPU acceleration. The algorithm can complete calculations on a regular workstation. For industrial-scale equipment libraries (thousands of types), algorithms can be deployed on server clusters or cloud platforms, utilizing multi-core parallelism or GPU acceleration to further improve solving efficiency. Due to the fact that the time complexity of the algorithm is mainly determined by the population size and iteration times, users can flexibly adjust it according to their actual needs to achieve a balance between computational resources and solution accuracy.
According to the assembly constraints and classification scheme selection, the white egret swarm optimization algorithm proposed in this study was used to optimize the model with 500 iterations. Matlab was used for optimization simulation, and the calculation results are shown in Figure 5. The optimization results of relevant parameters are shown in Table 9.
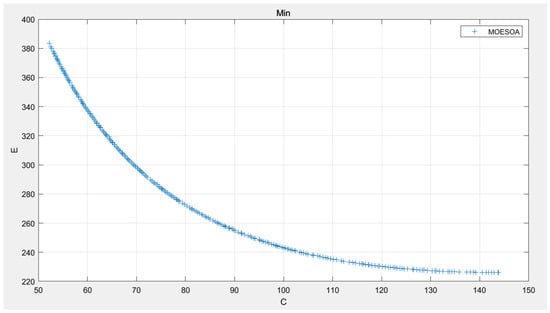
Figure 5.
Optimization Results of the MESOA.
Table 9.
The optimization result of MESOA for M1 and M2.
Figure 5 is optimization result of the MESOA, where E represents energy consumption and C represents carbon emissions. Under the optimization of the MESOA, the optimization model with two objectives performs well in terms of convergence. At the same time, we will both equipment parameters optimization results were compared, the optimization results of M1 matrix (397.9, 0.038, 0.039, 107.7, 233.57), and the optimizing results M2 matrix (2,790,270.6, 2.9, 118.1, 228.68). Obviously, after being optimized by MESOA, the processing parameters of both have been reasonably optimized, and both carbon emissions and energy consumption have achieved better results, verifying the superiority of MESOA. However, the relevant conclusions can still be further analyzed through Figure 5. As can be seen from Figure 5, across the entire Pareto frontier, as carbon emissions increase, the energy consumption of the equipment decreases. Therefore, based on this, in the face of different carbon emission and energy consumption selection strategies, the final result can be further optimized by changing the weights of carbon emissions or energy consumption to support a better equipment selection result.
To further demonstrate the effectiveness of MESOA, we used the same experimental environment (Matalb2022b, Intel Core i7-14650HX…) to compare and validate NSGA-2 with MESOA. The validation results are shown in Figure 6, and the relevant Pareto optimal points are shown in Table 10. From Figure 6, it can be seen that the results obtained by NSGA-2 and MESOA are similar, that is, as carbon emissions increase, energy consumption will decrease. However, from the Pareto results, NSGA-2 performs well in the initial global optimization, which is related to its great advantages in theoretical maturity and implementation convenience for multi-objective optimization. But as the number of iterations increases, its convergence speed is not as fast as the multi-objective white egret swarm algorithm. With convenient parameter simplification, the white egret swarm algorithm can quickly find feasible solutions in noisy or uncertain environments.
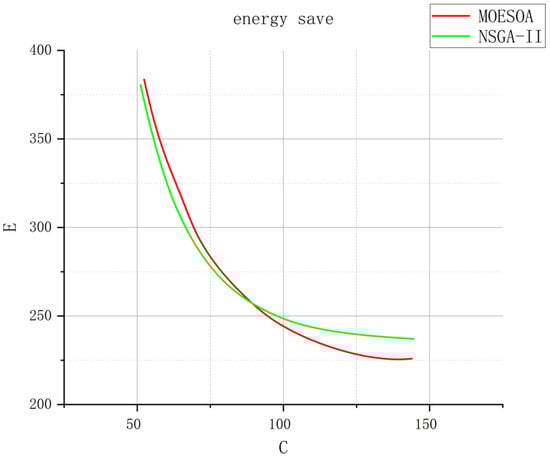
Figure 6.
Pareto optimization results of the MESOA and NSGA-2.
Table 10.
The comparison between NSGA-2 and MESOA of Pareto for M1.
From Figure 6, it can be seen that the Pareto of the two intersect. The detailed Pareto solution sets of the two algorithms are shown in Figure 6. In the first half of the Pareto solution set, the NSGA-2 algorithm outperforms MESOA. In the later stage of the algorithm, MESOA outperforms NSGA-2 by 5.3%. Overall, the superiority and effectiveness of the MESOA have been verified.
6. Conclusions
In this paper, a new energy-saving and low-emission equipment selection model based on new quality productivity orientation is proposed to address the dynamic balance between energy consumption and carbon emissions in the process of manufacturing equipment selection. Realized scientific decision-making for equipment selection. The main conclusions are as follows:
(1) Dynamic optimization model for equipment selection based on NQP was established. Based on NQP-oriented, energy consumption and carbon emission indicators were established, combined with an improved multi-objective egret swarm optimization algorithm (MESOA), the limitation of traditional methods, which ignore dynamic changes in processing parameters, has been solved. Taking CNC machine tool axes machining as an example, this model can dynamically match equipment types and process parameters, select machine tool equipment according to different needs, and provide theoretical tools for green manufacturing.
(2) Practical application verification and benefit improvement. Through comparative experiments between CNC lathes and milling machines, it has been verified that the model can improve equipment utilization and reduce resource waste while ensuring machining accuracy. Meanwhile, users can assign different weights to energy consumption and carbon emissions based on the processing conditions of the equipment, further optimize the final optimization result, and obtain a more optimized plan that better suits their own production situation. The application of a hierarchical optimization strategy provides a feasible path for enterprises to reduce environmental protection costs and achieve low-carbon production, and may be promoted to complex manufacturing scenarios.
(3) Although the model and algorithm have achieved good results, due to differences in actual operating conditions of different regions, processes, and equipment, the carbon emission factor coefficient may deviate from the actual emissions to a certain extent, resulting in existing models and algorithms being more dependent on carbon emission factors. The future work plan is to calibrate carbon emission factors through measurement data and introduce uncertainty analysis to improve the robustness of the model. The search performance of the Multi-Objective Egret Swarm Optimization Algorithm (MESOA) is greatly affected by parameters such as population size, iteration times, and learning factors. The current work determines parameter settings through empirical experiments but lacks systematic parameter sensitivity analysis. The follow-up plan is to adopt parameter adaptive mechanisms or meta learning methods to reduce reliance on manual parameter adjustments and evaluate the robustness of the algorithm through comparative experiments.
(4) This article has been validated through a case study of shaft machining, and in this case, the model parameters have been carefully optimized, which may have strong adaptability to process characteristics, leading to potential overfitting in the study of specific cases. In the future, it will be expanded to various processing technologies (such as milling, grinding, etc.) and different product categories, and cross-case universality verification will be conducted to prevent overfitting.
(5) Subsequent research will expand to explore multi-objective optimization models and promote their application in industry. For example, the coupling relationship between different targets, such as surface quality, processing cost, energy consumption, and carbon emissions, as well as the adaptability and scalability of models and algorithms on relevant industrial platforms (MES, ERP, digital twin platforms). Further improve its microservices, encapsulation, and other methods, and plan to validate its response latency and stability in industrial pilot projects.
Author Contributions
Conceptualization, Q.X. and W.D.; methodology, Q.X.; software, W.D.; validation, S.X.; formal analysis, Q.X.; investigation, W.D.; data curation, W.D.; writing—original draft preparation, Q.X.; writing—review and editing, Q.X. All authors have read and agreed to the published version of the manuscript.
Funding
The authors are grateful for the Doctoral Entrance Examination Initiation Fund from the Xinjiang Institute of Engineering (No. 2025XGYBQJ24), the Hubei Provincial Science and Technology Project under the Open Competition Mechanism (No. 2024BEB021), Huanggang City 2025 Key Technology Research and Development Project (Category I): R&D and Industrialization of Key Technologies for Highly Flexible and Anti-Interference Robotic Cables.
Data Availability Statement
The original contributions presented in this study are included in the article. Further inquiries can be directed to the corresponding author.
Conflicts of Interest
The authors declare no conflict of interest.
Abbreviations
| NQP | New quality productivity | cutting path length (mm) | |
| DE | Differential evolution | coolant pump power consumption | |
| GW | Gray wolf | lighting power consumption | |
| GA | Genetic algorithm | control system power consumption | |
| PSO | Particle swarm optimization | equipment power consumption | |
| GSA | Gravitational search algorithm | electricity carbon emission factor | |
| AAA | Advantage actorcritic algorithm | material carbon emission factor | |
| BAS | Beetle antennae search | the cutting scrap carbon emission factor | |
| ESOA | Egret swarm algorithm | the machine tool use carbon emission factor | |
| MESOA | multi-objective egret swarm algorithm | the coolant use carbon emission | |
| spindle speed (r/min) | Electrical energy consumption of mechanical processing equipment | ||
| feed rate (mm/min) | the amount of coolant used per unit time | ||
| feed depth (mm) | Machine tool life | ||
| energy consumption (kW) | Cut off material | ||
| carbon emissions (gCO2) | Material energy carrying capacity (internal energy, MJ/kg) | ||
| no-load power (kW) | Carbon content of materials (kg/MJ) | ||
| no-load running time (s) | material energy carrying standard coal equivalent (kg ce/kg) | ||
| cutting power | carbon emission factor of standard coal (kg CO2/kg) | ||
| cutting time | material removal rate (mm3/s) | ||
| power consumption generated by other auxiliary equipment | Workpiece processing length (mm) | ||
| minimum no-load power of the machine tool | Workpiece machining allowance (mm) | ||
| spindle speed coefficients | Workpiece diameter (mm) | ||
| spindle speed coefficients | feed depth (mm) | ||
| cutting force (N) | consumption of standard coal for processing unit mass cutting scrap | ||
| cutting speed (m/s) | carbon emission factor of cutting tools | ||
| diameter of the milling cutter (mm) | the weight of cutting tool |
References
- Zhou, L.; He, P.; Wang, S.; Ma, C.; Zhou, Y.; Cai, C.; Zou, H. Economic Dispatch Strategy for Power Grids Considering Waste Heat Utilization in High-Energy-Consuming Enterprises. Processes 2025, 13, 2450. [Google Scholar] [CrossRef]
- Statistical Bulletin on the National Economic and Social Development of the People’s Republic of China in 2024. National Bureau of Statistics of the People’s Republic of China, 2025. Available online: https://www.stats.gov.cn/sj/zxfb/202502/t20250228_1958817.html (accessed on 10 August 2025).
- Fang, J.; Wei, H.F.; Shi, J.J.; Junjie, S.; Jing, C.; Shoubiao, L. Research on the development of new quality productive forces of green low-carbon coal mining. China Min. Mag. 2025, 34, 296. [Google Scholar] [CrossRef]
- Kim, Y.J.; Cho, S.H.; Sharma, B.P. Constructing efficient portfolios of low-carbon technologies. Renew. Sustain. Energy Rev. 2021, 150, 111515. [Google Scholar] [CrossRef]
- Zhang, Z.L.; Li, H.F.; Wang, L. Selection method of remanufacturing process scheme considering low carbon. Comput. Integr. Manuf. Syst. 2025, 31, 1314–1325. [Google Scholar] [CrossRef]
- Deng, Z.; Lv, L.; Huang, W.; Shi, Y. A High Efficiency and Low Carbon Oriented Machining Process Route Optimization Model and Its Application. Int. J. Precis. Eng. Manuf. Green Tech. 2019, 6, 23–41. [Google Scholar] [CrossRef]
- Deng, Z.; Lv, L.; Li, S.; Wan, L.; Liu, W.; Yan, C.; Zhang, H. Study on the model of high efficiency and low carbon for grinding parameters optimization and its application. J. Clean. Prod. 2016, 137, 1672–1681. [Google Scholar] [CrossRef]
- Wu, B.H.; Zhang, Y.; Zheng, Z.Y.; Zhang, S. Review and prospects of feedrate optimization in CNC machining. Acta Aeronaut. Et Astronaut. Sin. 2022, 43, 525467. [Google Scholar]
- Yin, R.; Ke, J. Optimization of Milling Cutting Parameters under Carbon Efficiency Target. Mach. Manuf. 2022, 1, 136–144. [Google Scholar] [CrossRef]
- Yingqiang, S.; Qingdong, Y.; Bo, X.; Rane, W. Study on the multi-objective optimization method for efficientand high-quality milling parameters. Manuf. Technol. Mach. Tool 2022, 2, 116–120. [Google Scholar] [CrossRef]
- Zhengtao, H.; Jie, Y.; Chaoyong, Z.; Zhiheng, Z.; Yang, X.; Wenwen, L. Energy oriented CNC Milling Process Modelling and Parameter Optimization. Chin. J. Mech. Eng. 2016, 27, 2524–2531. [Google Scholar]
- Xing, S.; Chen, G.; Yu, G.; Chen, X.; Sun, C. Optimization of milling parameters considering high efficiency and low carbon based on gravity search algorithm. J. Intell. Fuzzy Syst. 2021, 41, 6303–6321. [Google Scholar] [CrossRef]
- Xikun, Z.; Congbo, L.; Yong, Y.A.G.; Yan, L.; Shuyan, J. A Data and Model Hybrid Driven Cutting Parameter Energy-efficiency Optimization Method for Flexible Machining Process Considering Cutting Tool Flexibility. J. Mech. Eng. 2024, 60, 236–248. [Google Scholar]
- Xiao, Y.M.; Zhou, J.C.; Wang, R.P.; Zhu, X.Y.; Zhang, H. Energy-Saving and Efficient Equipment Selection for Machining Process Based on Business Compass Model. Processes 2022, 10, 1846. [Google Scholar] [CrossRef]
- Xiao, Y.M.; Chen, G.H.; Zhang, H.; Zhu, X.Y. Optimization of Low-Carbon and Highly Efficient Turning Production Equipment Selection Based on Beetle Antennae Search Algorithm (BAS). Processes 2023, 11, 911. [Google Scholar] [CrossRef]
- Zhang, H.; Deng, Z.; Fu, Y.; Lv, L.; Yan, C. A process parameters optimization method of multi-pass dry milling for high efficiency, low energy and low carbon emissions. J. Clean. Prod. 2017, 148, 174–184. [Google Scholar] [CrossRef]
- Yao, L.; Li, A.; Yan, E. Research on digital infrastructure construction empowering new quality productivity. Sci. Rep. 2025, 15, 6645. [Google Scholar] [CrossRef] [PubMed]
- Chen, X.; Di, Q.; Wang, Z. Mechanism and realization path of new quality productivity enabling modern marine industrial system. Front. Mar. Sci. 2025, 12, 1597785. [Google Scholar] [CrossRef]
- Liu, H.; Li, X. How digital technology can improve new quality productive forces?—Perspective of total factor agricultural carbon productivity. J. Asian Econ. 2025, 98, 101921. [Google Scholar] [CrossRef]
- Du, C.; Shu, S.; Li, Z. Mechanism analysis and realization path of new quality productivity promoting high-quality economic development. Econ. Rev. 2023, 12, 20–28. [Google Scholar]
- Liu, Z.Q.; Zhang, H.; Guo, C.Y.; Yang, Y.C. New Quality Productive Forces Enabling High-Quality Development: Mechanism, Measurement, and Empirical Analysis. Sustainability 2025, 17, 8146. [Google Scholar] [CrossRef]
- Lin, L.; Gu, T.; Shi, Y. The influence of new quality productive forces on high-quality agricultural development in China: Mechanisms and empirical testing. Agriculture 2024, 14, 1022. [Google Scholar] [CrossRef]
- Chen, J.; Zhang, K.R.; Yang, S.; Han, X. Exploration of Future Technology Forecasting Models Oriented towards New Quality Productivity. J. Quantitative Technol. Econ. 2025, 24, 787. [Google Scholar] [CrossRef]
- Wang, Q.W.; Du, Q.; Li, Z.R.; Xu, W. The Dual Control Effect of Carbon Emissions from Digitalization and Green Transformation: Mechanism Analysis Based on New Quality Productivity in Manufacturing Industry. Chin. J. Manag. Sci. 2025, 102, 104149. [Google Scholar] [CrossRef]
- Cheng, L.; Pan, Y.N. The Logical Dimensions of Artificial Intelligence in Shaping New Quality Productive Forces. J. Northeast. Univ. 2025, 27, 128–135. [Google Scholar] [CrossRef]
- Zhou, E.Y.; Zhao, L.; Xie, M. The carbon reduction effect of new quality productivity: Technological Empowerment and structural optimization. J. Northwest Minzu Univ. 2025, 17, 567. [Google Scholar] [CrossRef]
- Climate Change Department of National Development and Reform Commission. Reports on Emission Factors of China’s Regional Power Network 2009. Available online: https://www.mee.gov.cn/ywgz/ydqhbh/wsqtkz/201812/W020181220585204772575.pdf (accessed on 2 August 2025).
- Gutowski, T.G. Gutowski the carbon and energy intensity of manufacturing. In Proceedings of the 40th CIRP International Manufacturing Systems Seminar, Liverpool, UK, 30 May–1 June 2007; Liverpool University: Liverpool, UK, 2007; pp. 1–6. [Google Scholar]
- China National Institute of Standardization. Corporation Green Gasmeasuring and Reporting; Zhijian Publishing House: Beijing, China, 2011. (In Chinese) [Google Scholar]
- Jiqian, Y.U.N.; Wengui, L.I. Fundamentals of Machine Manufacturing Technology; Machine Press: Beijing, China, 2001. (In Chinese) [Google Scholar]
- Xing, A.; Shigang, X. A Concise Manual of Machining Parameters, 3rd ed.; Machine Press: Beijing, China, 1994. (In Chinese) [Google Scholar]
- Zhenchang, L.I. The Selection, Concoction and Use of Metalmachining Liquid; Chemical Industry Press: Beijing, China, 2007. (In Chinese) [Google Scholar]
- Chen, Z.; Francis, A.; Li, S.; Liao, B.; Xiao, D.; Ha, T.T.; Cao, X. Egret swarm optimization algorithm: An evolutionary computation approach for model free optimization. Biomimetics 2022, 7, 144. [Google Scholar] [CrossRef]
- Li, T.Y.; Liu, Y.M.; Chen, Z. Application of Sine Cosine Egret Swarm Optimization Algorithm in Gas Turbine Cooling System. System 2022, 10, 201. [Google Scholar] [CrossRef]
- Spea, S.R. Social network search algorithm for combined heat and power economic dispatch. Electr. Power Syst. Res. 2023, 221, 109400. [Google Scholar] [CrossRef]
- Huang, Z.; Zhang, Z.; Hua, C.; Li, S. Leveraging enhanced egret swarm optimization algorithm and artificial intelligence-driven prompt strategies for portfolio selection. Sci. Rep. 2024, 14, 26681. [Google Scholar] [CrossRef] [PubMed]
- Rajemi, M.F.; Mativenga, P.T.; Aramcharoen, A. Sustainable Machining: Selection of Optimum Turning Conditions Based on Minimum Energy Considerations. J. Clean. Prod. 2010, 18, 1059–1065. [Google Scholar] [CrossRef]


Disclaimer/Publisher’s Note: The statements, opinions and data contained in all publications are solely those of the individual author(s) and contributor(s) and not of MDPI and/or the editor(s). MDPI and/or the editor(s) disclaim responsibility for any injury to people or property resulting from any ideas, methods, instructions or products referred to in the content. |
© 2025 by the authors. Licensee MDPI, Basel, Switzerland. This article is an open access article distributed under the terms and conditions of the Creative Commons Attribution (CC BY) license (https://creativecommons.org/licenses/by/4.0/).