1. Introduction
In the last few decades, stand-alone Forward Osmosis (FO) and FO combined with other technologies have been the research focus for many different applications [
1]. Applications related to separation processes like biomass recuperation [
2,
3,
4], the concentration of a permeate in the food processing industry [
5,
6,
7], agricultural applications [
8,
9,
10], wastewater treatment, and desalination [
11,
12,
13], among others, and applications related to energy generation like Pressure-Retarded Osmosis (PRO), Forward Osmosis–Electrokinetic (FO-EK) and Diffusion–Osmosis (DO) are the most frequently researched [
14]. In the energy generation field, PRO has been the most studied FO-based technology. Moreover, in 2009, a company named Statkraft in Norway implemented the first fully functioning, PRO, osmotic power plant with approximately
of membrane and a capacity of
[
15]. Even though this power plant was decommissioned almost 3 years later due to high operational costs, that experience gave the academic community more arguments to identify some crucial aspects that could help make this technology more economically competitive, like developing fabrication technologies that deliver membranes with better parameters at lower costs and implementing technologies and devices that enhance the ratio between the consumed energy and the produced energy, among others [
16]. While Pressure-Retarded Osmosis (PRO) has been widely investigated as a membrane-based process for indirect energy generation, other configurations of Forward Osmosis (FO) remain largely unexplored in this context. PRO requires the use of high-pressure pumps, which results in a significant portion of the generated energy being consumed by the process itself, reducing the net energy output. In contrast, conventional FO operates without external energy input, and even its pressurized variant, Pressure-Assisted Forward Osmosis (PAFO), demands considerably less energy than PRO. This inherent advantage suggests that FO-based osmotic systems could provide a more energy-efficient pathway for osmotic power generation. Therefore, exploring FO as an alternative to PRO may address one of the key limitations of current membrane-based energy generation technologies, potentially enabling more economically competitive osmotic power processes.
In this paper, we present a batch process for generating energy that comprises an FO charging stage that increases the potential energy of a water column, coupled with a discharging stage where the electrical energy is obtained in a low-head, hydropower generation plant. To do this,
Section 2 presents a general outline of how the osmotic power plant works; then,
Section 3 explains the basic assumptions made to develop the mathematical model of the system.
Section 3.1 deals with the details of the charging stage, while
Section 3.2 explains the discharging stage, where the equations for calculating the generated power with the input that comes from the first stage are presented. Later, in
Section 4, the two stages are simulated, and a series of theoretical experiments are executed. Finally, in
Section 5, the results are analyzed, and the conclusions from this work are presented.
2. Osmotic Power Plant
When a freshwater source, such as a river, converges with the sea, characterized by a salt concentration of approximately 35 g/L, a notable chemical potential emerges from the contrast in their concentrations. This chemical potential equates to an effective hydraulic head of roughly 270 m. Consequently, certain scholars have aptly coined the term “silent waterfall” to depict these natural sites where such mixing takes place, signifying the latent energy inherent in osmotic differentials [
17].
The concept of an osmotic power plant is not new. As early as 1974, the researcher Richard Norman proposed an osmotic salination converter where the salinity gradient potential was converted into a pressure head by the interaction of freshwater and sea saltwater through a membrane. The pressure head was later discharged towards a waterwheel that powered a pump to replenish the saltwater in the pressure chamber and a generator to obtain the electrical energy [
18].
Another pioneering concept was the PRO proposed by Sidney Loeb in 1976. In this process, a pressurized high-concentration solution meets with a low-concentration solution through a membrane; thereby, part of the volume of the low-concentration solution will flow to the high-concentration solution. The high-concentration solution will keep its initial pressure, but its volume will be increased. After this, the high-concentration solution is depressurized by a hydro turbine coupled to a generator to extract the salinity gradient energy as electricity [
19,
20].
More recently, Li [
21] proposed a Batch Pressure-Retarded Osmosis (BPRO) system that includes a pressurized variable-volume tank in the draw solution side to reduce the osmotic pressure loss due to the simultaneous dilution of the draw solution and concentration of the feed solution. This configuration, under the same conditions, allowed the system to maintain a higher osmotic pressure than the typical pressure-retarded osmosis configuration but requires a pressurized tank that does not allow an easy escalation of the process. As another possibility for the BPRO system, Li et al. [
22] proposes an Atmospheric Batch Pressure-Retarded Osmosis (AB-PRO) system in which the pressurized variable-volume tank is replaced by two atmospheric tanks and a pressure-exchanger to obtain similar results to the BPRO system while facilitating the escalation of the system.
These osmotic power plants share problems related to membrane processes like reverse solute flux through the membrane that decreases the effective osmotic power, membrane fouling, and polarization concentration. All of these systems require the use of pumps to generate a pressure that will work against the osmotic flow; also, the effects of time on the working parameters were not thoroughly considered.
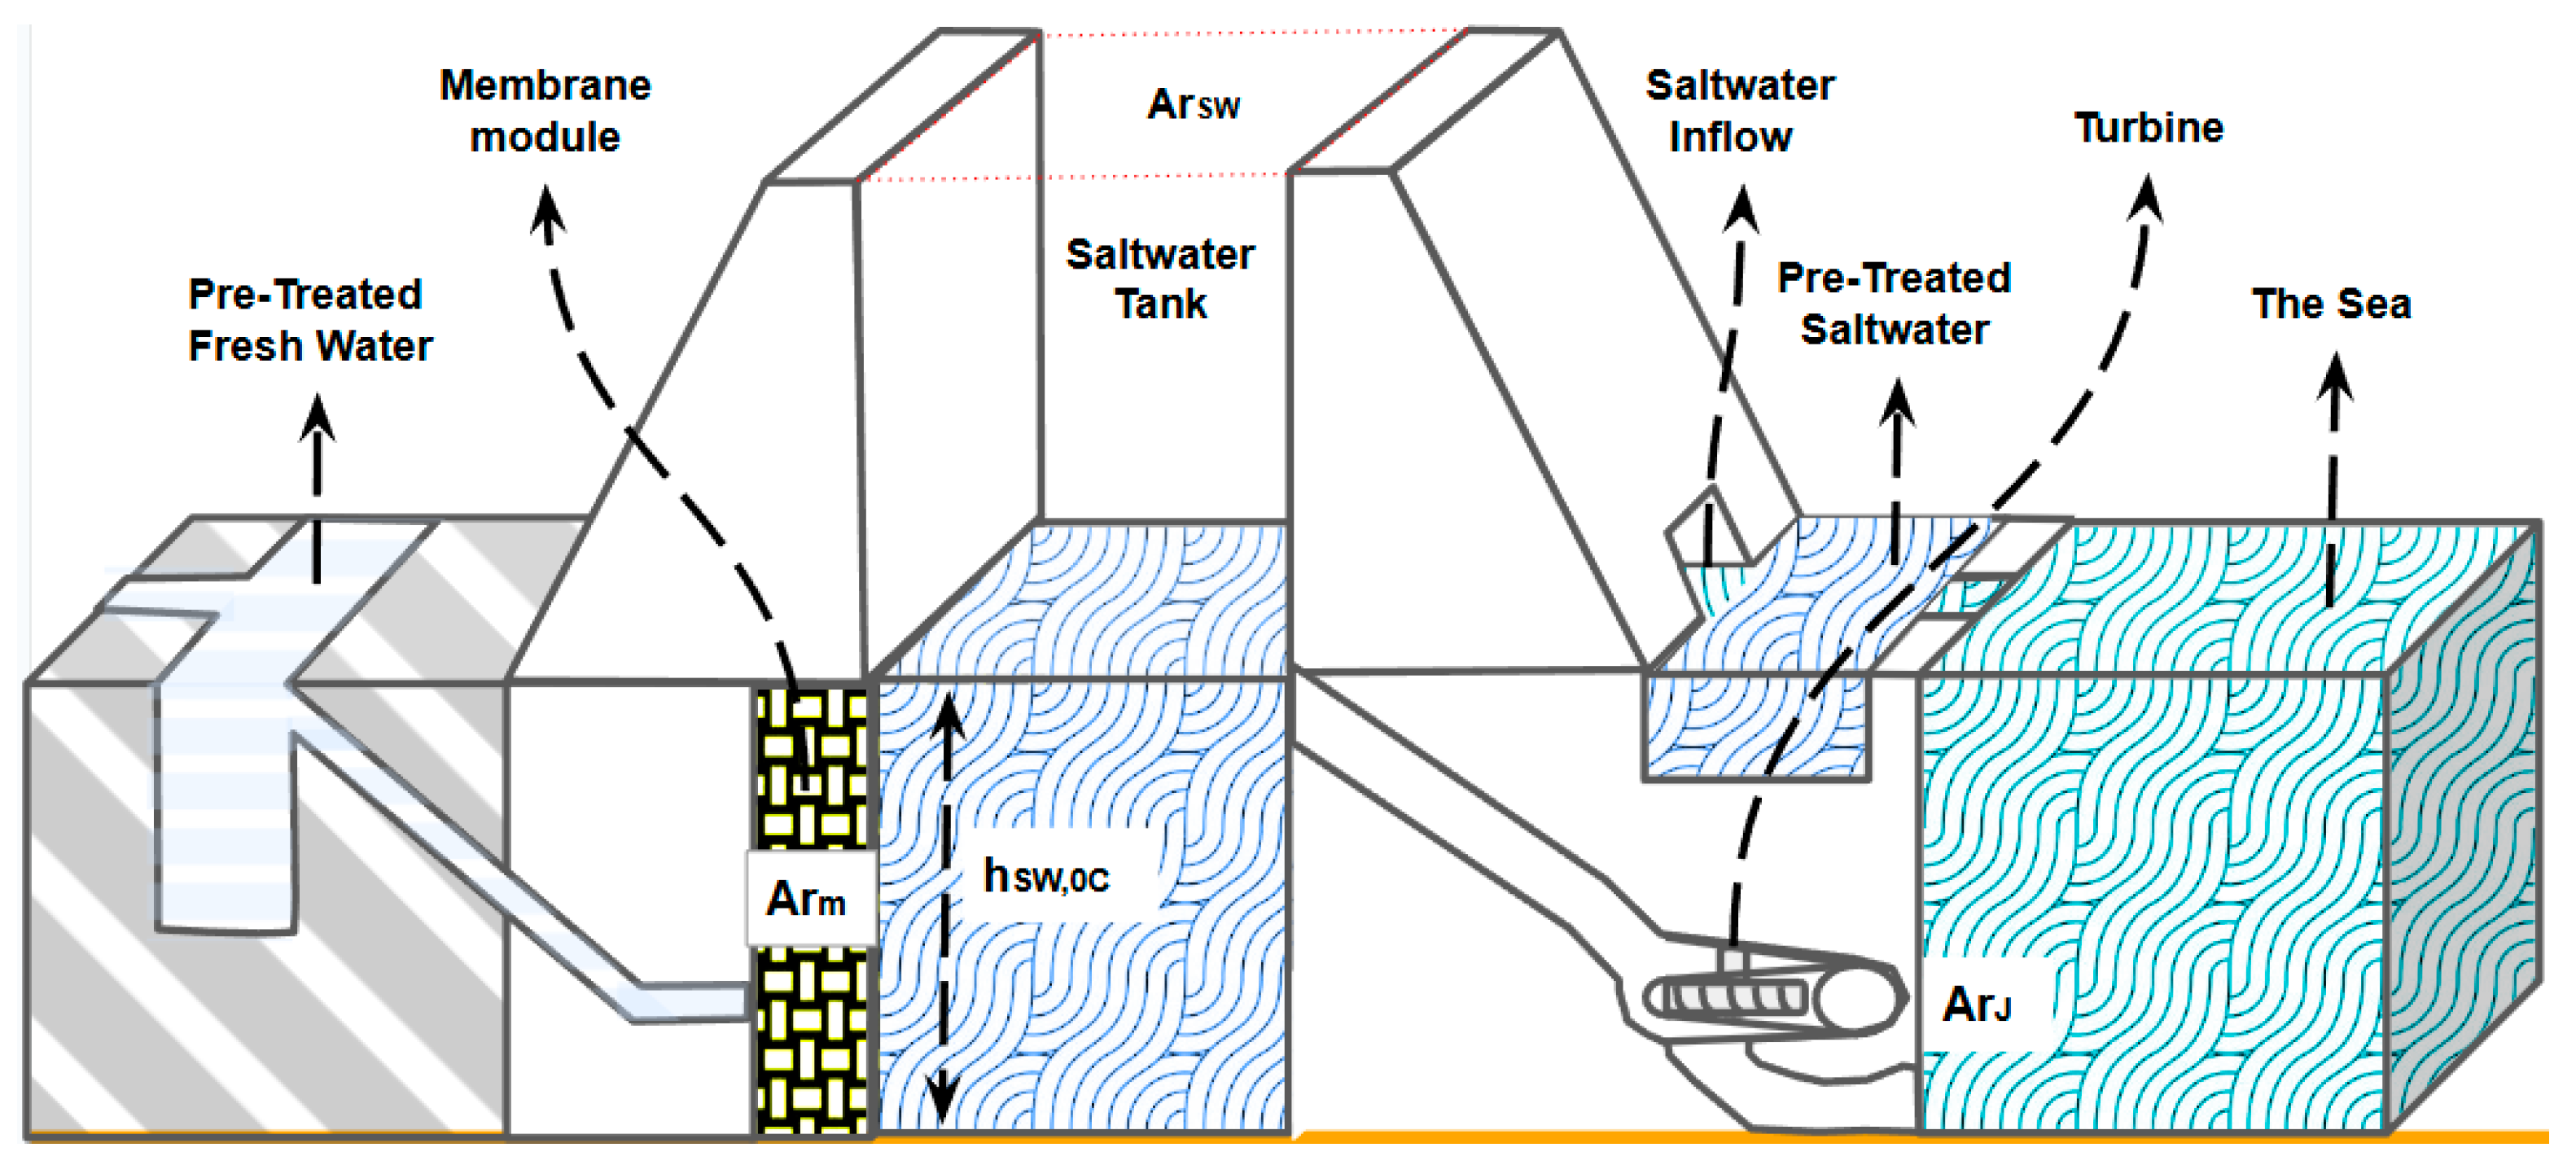
Similar to the previously mentioned concepts, the proposed osmotic power plant is tailored for deployment in places where natural freshwater–saltwater mixing occurs. The main components of the proposed osmotic power plant are presented in
Figure 1.
Even if FO is less prone to membrane fouling than PRO, the better the quality of the feed and draw solution, the less fouling the membrane will present. Because of this, the proposed system includes a pretreatment reservoir for the freshwater and another for saltwater to filter and reduce the quantity of organic, inorganic, biological, and colloidal contaminants in the water. Due to the time required for the diffusion through the membrane to occur, there will be a need for large quantities of membrane area, so a suitable membrane module that houses and protects the membrane area will be needed. The freshwater volume that flows through the membrane will mix with the saltwater in a volume defined by a height and a cross-sectional area ; this volume will be called the saltwater tank. After the charging stage ends, the salinity of the water inside the saltwater tank will be lower than the seawater salinity, and thus, a means to regenerate the saltwater salinity is needed; this will be achieved by a saltwater inflow that will allow the passing of pretreated saltwater into the saltwater tank until the seawater salinity is achieved. Finally, a low-head turbine will be used to generate electricity.
The operational sequence commences with the extraction of freshwater from a river, which undergoes filtration and pretreatment stages before being channeled into a reservoir. Subsequently, the treated freshwater is directed toward the membrane module, constituting the feed solution side of the plant. It is considered that on the feed solution side, there will always be enough freshwater available to permeate through the membrane module. The other side will be called the draw solution side. On this side, we will have a filtering and pretreatment stage for the saltwater. Then the saltwater will be directed to a saltwater tank until the tank reaches the desired initial height and salinity
and
, respectively. This situation will be called the initial stage of the process (See
Figure 1).
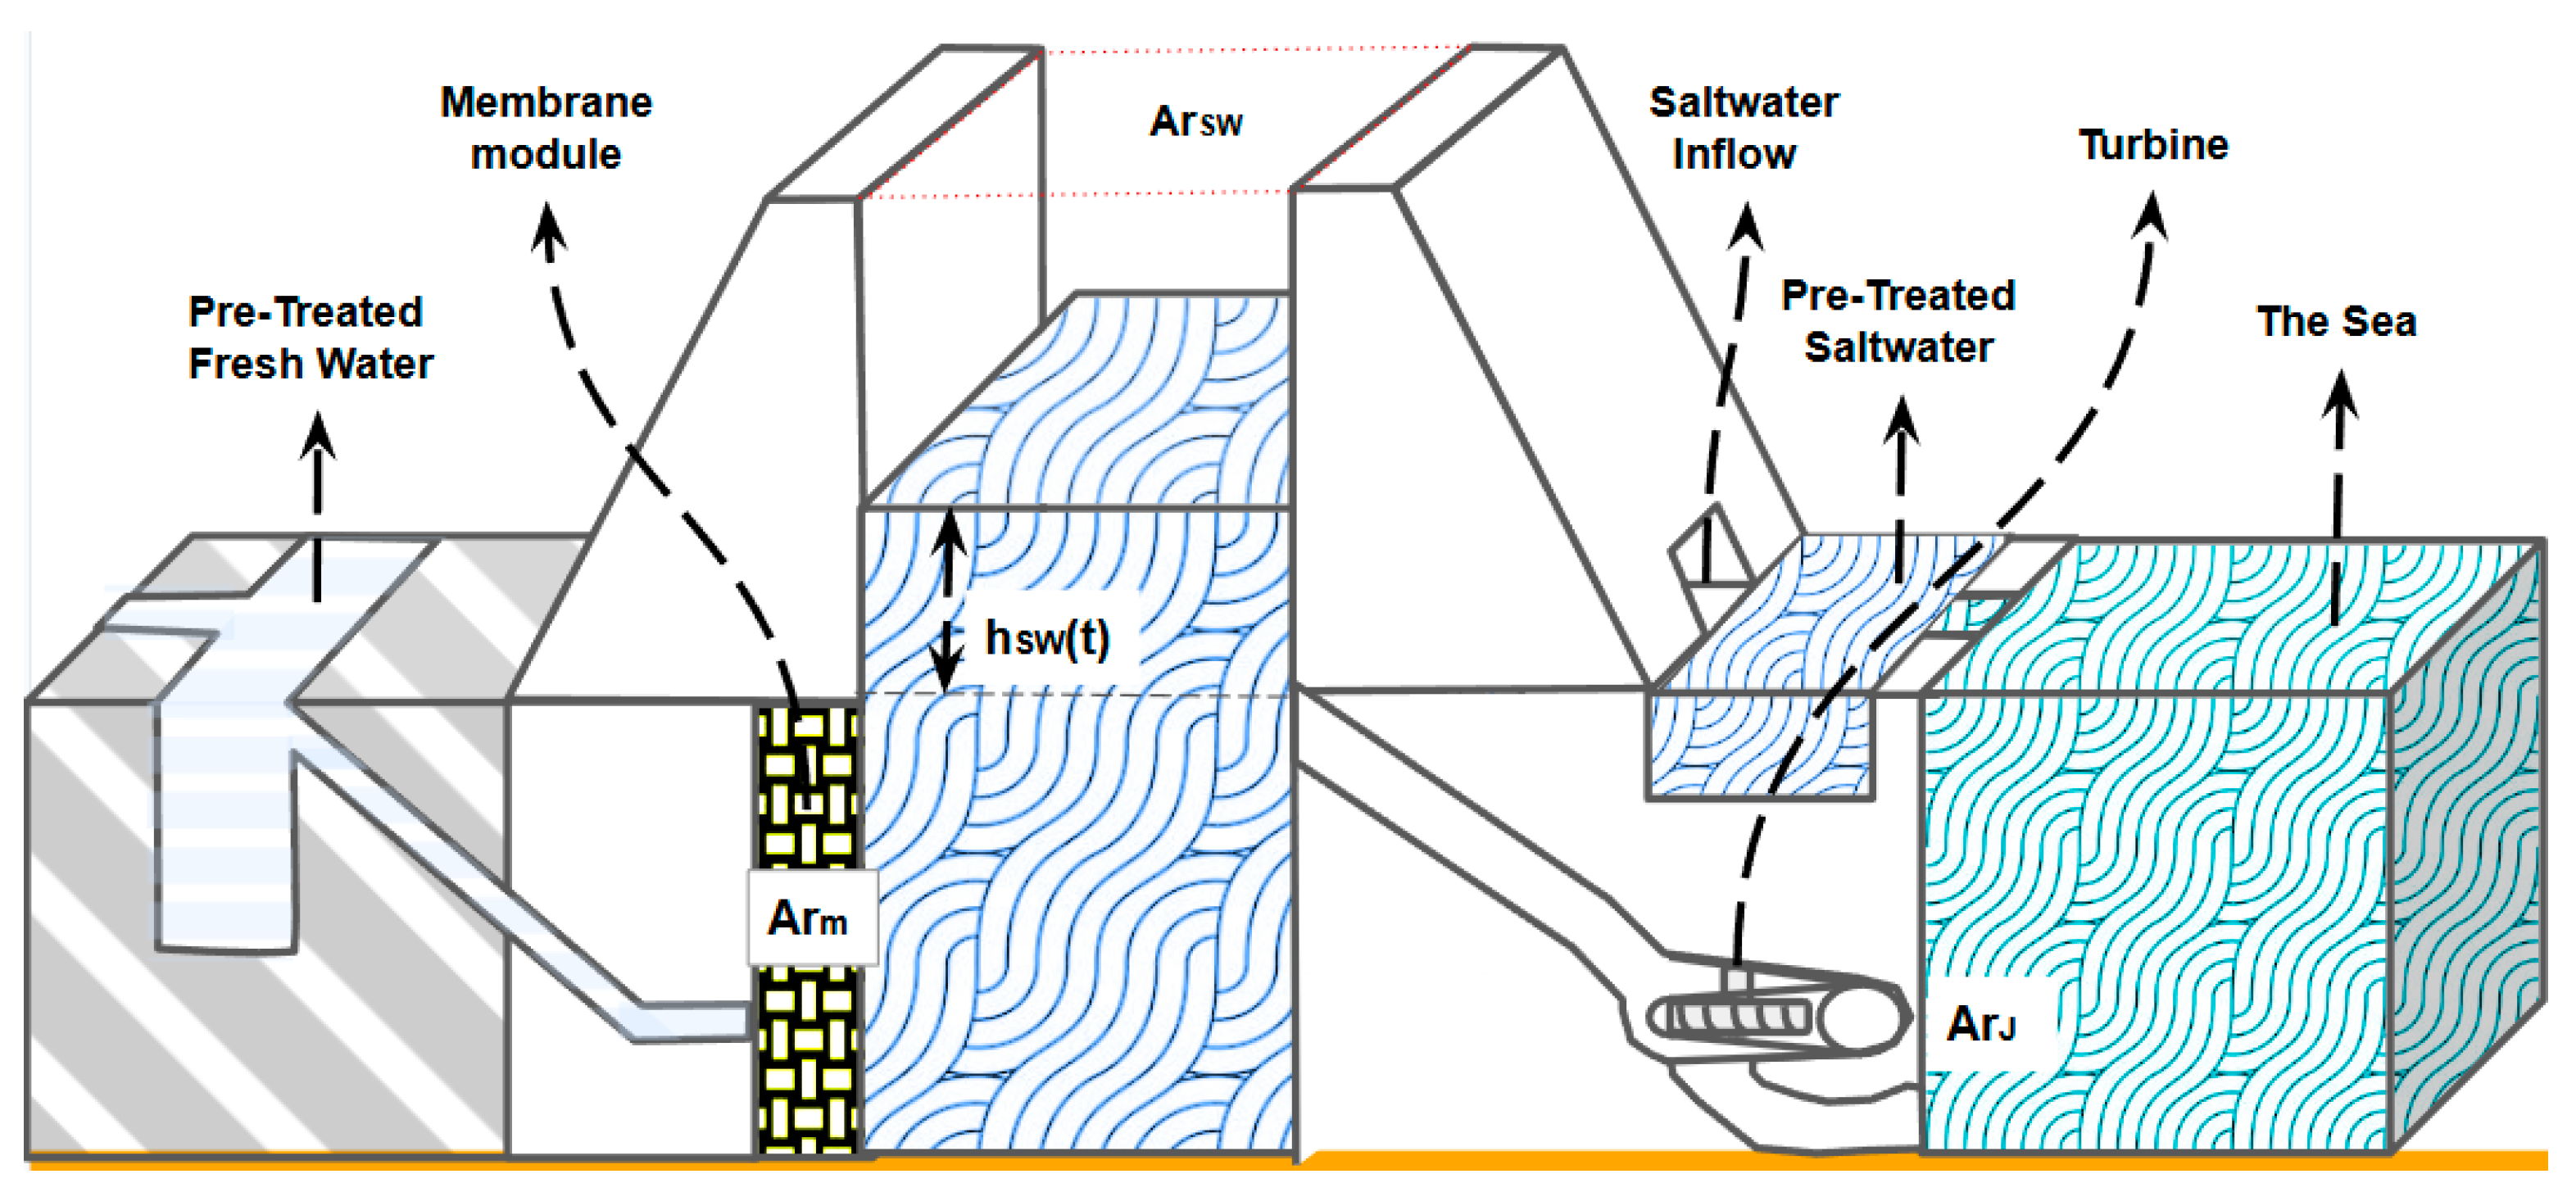
Once the system has reached the initial stage’s desired values, the saltwater inflow to the tank will be closed, and the permeation through the membrane will be enabled. Due to the concentration gradient, the freshwater will flow through the membrane to the draw side, and the height of the saltwater tank
will increase. At the same time, the salinity of the saltwater tank will start to decrease (See
Figure 2).
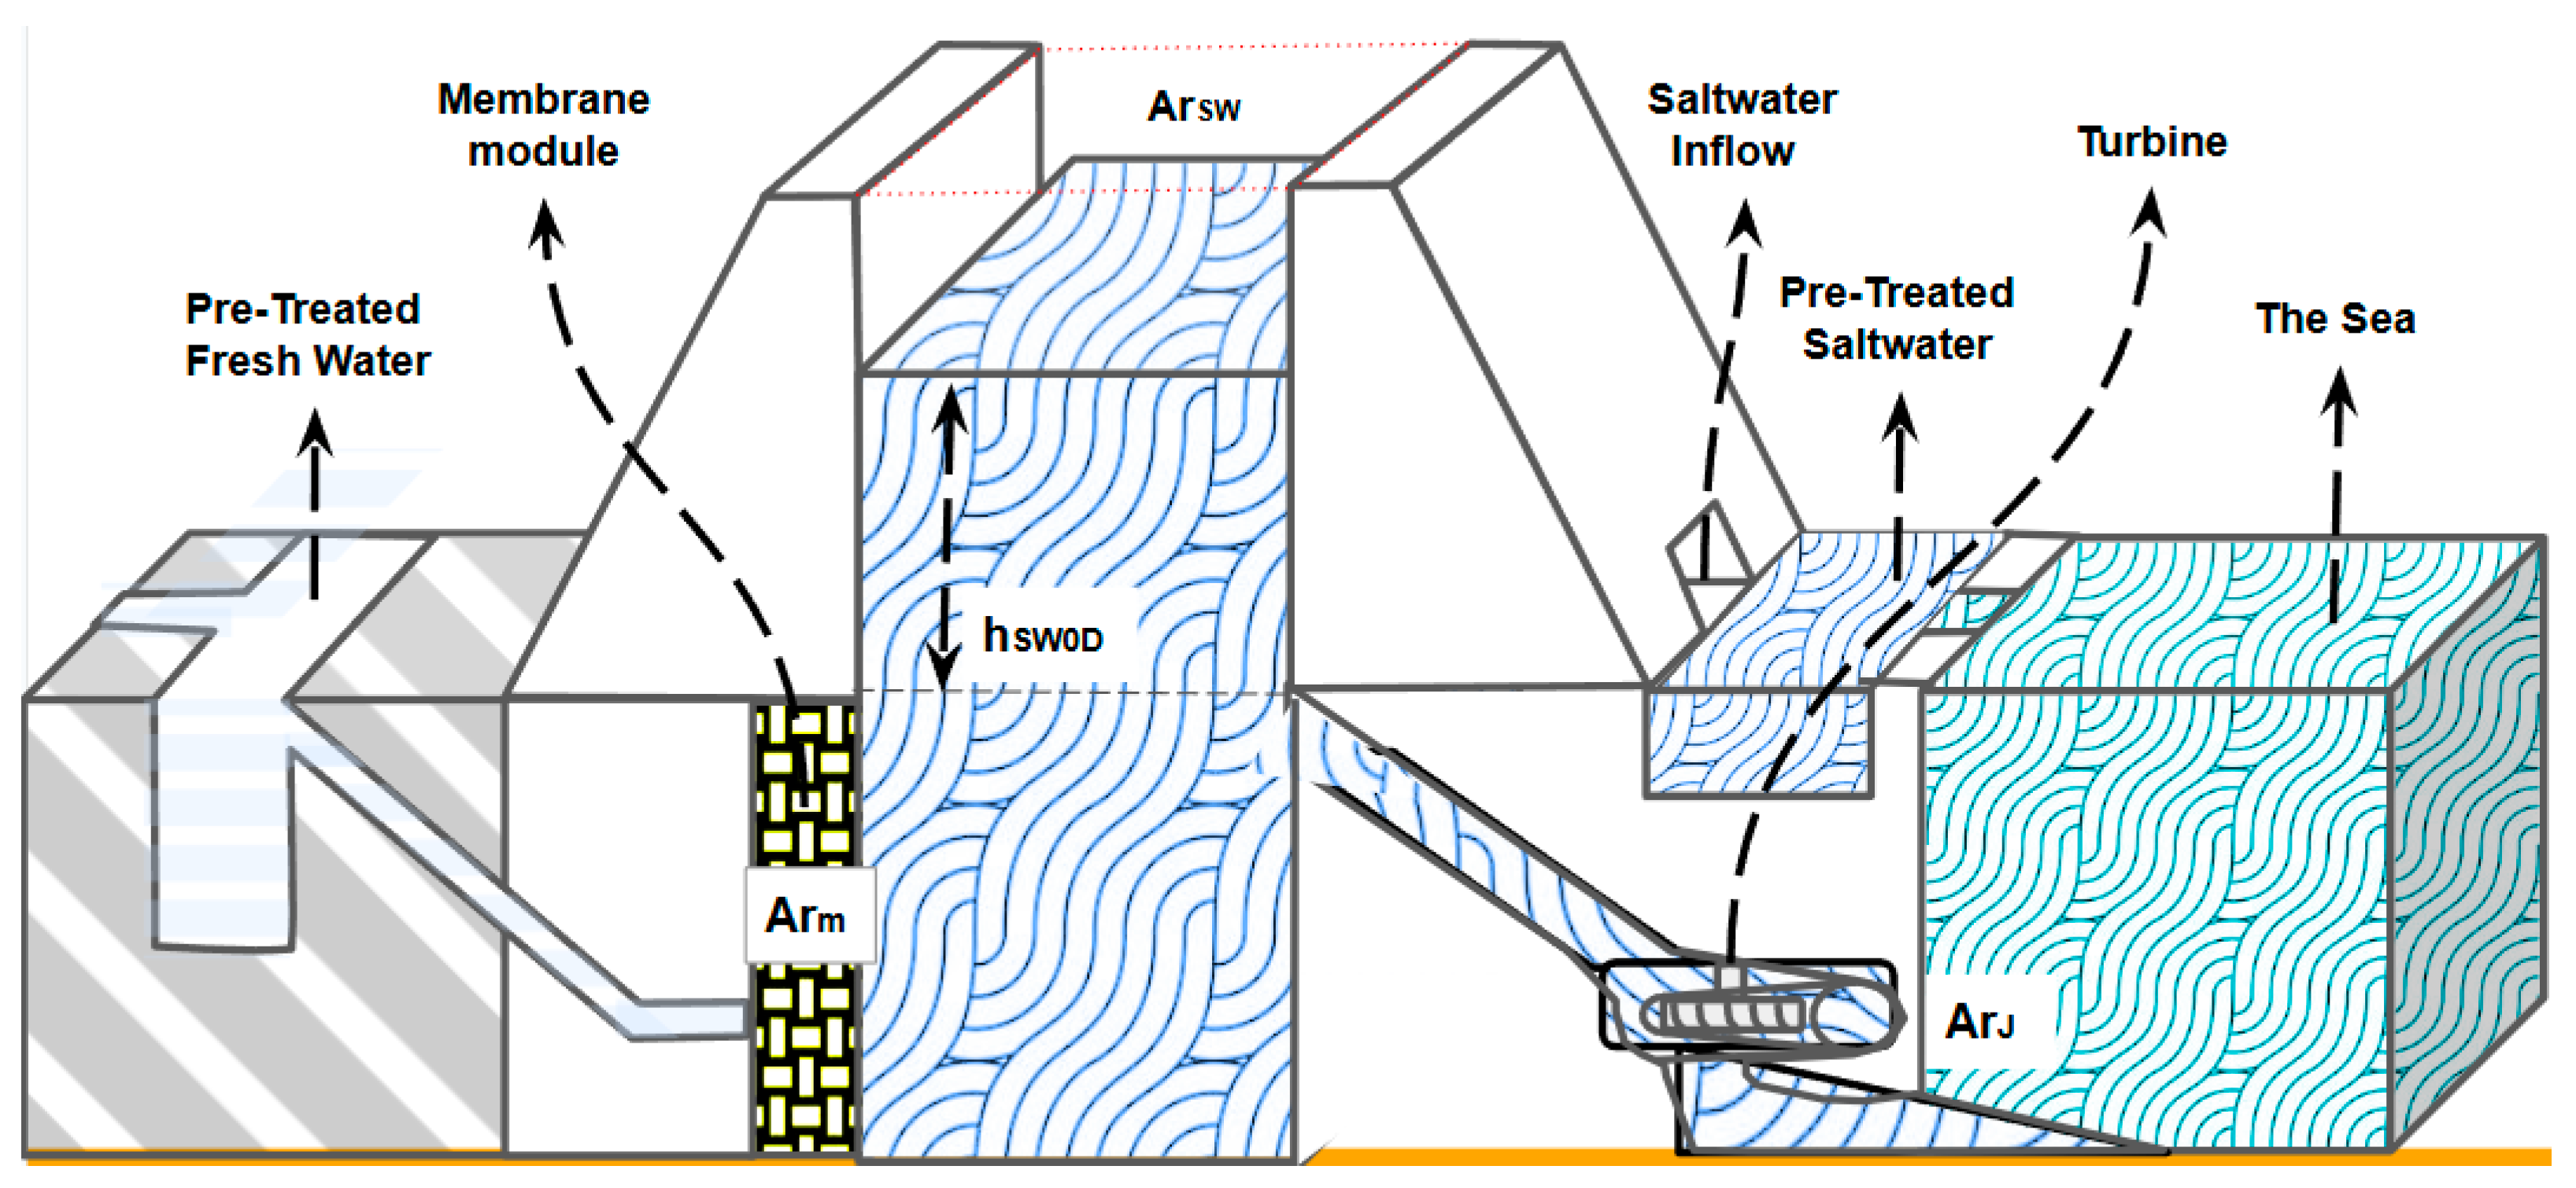
After the desired salinity and height of the saltwater tank are reached, the gates of the saltwater tank are opened, and thereby, the difference in height between the sea level and the
will move the saltwater to the sea, energizing a turbine and producing electricity until the height of the saltwater tank reaches the sea level (See
Figure 3).
The presented system is a batch process, so to give the system the capacity to operate continuously, the system can include many saltwater tanks (See
Figure 4).
During the discharging stage, the first tank releases its diluted saltwater through a turbine, generating electricity as it flows. Simultaneously, a second tank, poised as a reserve, begins its discharge process once the first tank is depleted, ensuring a seamless transition of power generation. Meanwhile, the depleted first tank undergoes a regeneration process, replenishing its salinity through the intake of saltwater, and when the first tank reaches sea level height, the system will enable the freshwater flux to reach the desired height of saltwater and be ready for the next discharging cycle.
3. Mathematical Model
As with most membrane energy generation processes, the proposed system will work in two stages. The first stage corresponds to an FO process where the saltwater tank will transform the chemical potential of the salinity gradient into the potential energy of a water column. This stage will be called the charging stage. The second stage is a small-head hydroelectric generation process that will be called the discharging stage. In this first approach, we will not consider the Concentration Polarization (CP) or the effects of membrane orientation in the membrane; even though these effects can have a great impact on the performance of the system, they will be out of the scope of this research. As we consider that the feed and draw solutions are pretreated, and that FO is less prone to fouling than other membrane processes that use high pressures, we will not consider the fouling of the membrane. We will consider a spiral-wound module capable of packing large membrane areas in a small volume that behaves like an extended spiral, that is, as a flat sheet membrane with a rectangular cross-sectional area, with no dead zones and with no pressure losses over its length. With all these considerations, we use the ideal solution–diffusion model for an osmotic process.
3.1. Charging Stage
Due to the difference in concentration between the saltwater solution and the freshwater solution, there will be an osmotic pressure ∆Π that will generate a freshwater flow to the saltwater tank. We consider an ideal membrane operation with no CP and no fouling. Equation (1), according to the solution–diffusion model, represents the change in freshwater volume over time
where
is the superficial area of the semi-permeable membrane,
is the diffusivity constant of the membrane, and Δ
P is the difference between the hydraulic pressure applied to the two sides of the membrane. We consider a system in which the feed side is such that its water column will not exert pressure over the membrane and the draw side will be an open tank system where the hydrostatic pressure exerted by the water column over the membrane will oppose the permeate flow. With the previous consideration, Equation (2) represents the external pressure over the membrane as
where
is the saltwater density,
is the gravitational acceleration, and
(
t) is the height of the saltwater tank at a given instant of time.
We consider an input of pure freshwater for the feed solution; with this, the osmotic pressure will depend only on the salinity of the draw solution. Equation (3) represents the value of the osmotic pressure as a function of the temperature (
) and the salinity (
). For this, we use the Engineering Equation Solver (EES) software V10.834-3D (27 May 2020), by f-Chart company Madison, WI 53744, U.S., specifically, a library developed in [
23].
Equation (4) expresses the relationship between the change in volume (
) and the variation in the heights in the tank, through a mass balance. For the seawater tank, we have
Equation (5) is obtained by integration of Equation (4):
Equation (6) defines the variation in salinity over time as a ratio between the mass of salt and the mass of seawater.
where
is the mass of salt in the saltwater tank and
is the mass of the seawater in the saltwater tank. Equation (7) defines the initial salinity
as
Here,
corresponds to the mass of the saltwater at
. Equation (8) represents this magnitude as the product of the saltwater density
,
, and the height of the water column in the saltwater tank at
Equation (9) is obtained by modifying Equation (6), considering that the mass of saltwater changes over time due to the freshwater flow rate
To simplify the equations and improve readability, the following auxiliary parameters are defined:
When the saltwater tank reaches the desired height
, we define the ending of the charging stage. In this instant, due to the influx of freshwater into the saltwater tank, the salinity will drop to a factor
of the initial salinity
. The instant in time when this happens will be called
. Equation (10) is by definition the salinity at
:
Equation (11) is obtained by rewriting Equation (9) in terms of the change in salinity over time.
If we substitute Equation (10) into Equation (11) and reorganize, we arrive at Equation (12) for
, which is defined by membrane parameters (
), the geometry of the saltwater tank (
), the initial height of the saltwater tank
, the initial salinity
, and the desired salinity factor
:
3.2. Discharging Stage
The end of the first stage, defined by the salinity factor
, marks the start of the second stage. For example, the selection of the factor
at 50% will define
. Values of
> 50% will make the charging stage faster, but the average output power will be lower. Values of
< 50% will increase the average output power, but the charging stage will take more time, and this could make the process impractical. The start of the discharging stage is represented in
Figure 3.
In this stage, the main objective is electrical energy generation, and this is achieved by releasing water from the saltwater tank through an outflow jet that will propel a turbine. The main driving force in this process is the hydraulic head represented by the difference between the starting height of the discharging stage and the sea level .
Equation (13) is obtained from the definition of power for a hydraulic system.
This is the change in permeate volume over time, , times the product of the density , the gravitational acceleration , and the height of the water column . In this system, these are , , and , respectively.
Now, we can write the water flow rate
as the product of the outflow jet area
times the velocity of the water at the outflow
. Equation (14) represents the output velocity for the water flow and is derived from the Bernoulli equation.
Equation (15) represents the instantaneous power as a function that depends only on the change in the height over time.
Equation (16) represents the volume balance in the saltwater tank.
Equation (17) is the differential equation for the change in height in the saltwater tank over time. It is obtained after substituting (14) into (16).
Equation (18) is the result of integrating Equation (17) between the maximum height
and an unknown value
.
Equation (19) corresponds to the generated power as a function of the initial system parameters and the variable t. It is obtained by substituting Equation (18) into Equation (15).
Equation (20) presents the time at which the system will stop generating energy
.
Now, for the operation of the osmotic power plant, it will be desirable to have an equal duration for the charging and discharging stages (). We have that is controlled by the parameters , , , and , while is controlled by the parameters , , and . We can modify to match by modifying only the parameters and . Equation (21) represents the desired membrane area that allows compliance with the condition .
For ease in reading the equations, we will define the following parameters:
4. Results and Discussion
The proposed osmotic power plant was simulated by using membrane parameters reported in the literature and running the proposed mathematical model in the software EES V10.834-3D. The membrane and system parameters are presented in
Table 1.
In the next sections, the simulations of the charging and discharging stages will be analyzed, and the explored optimization experiments will be presented.
4.1. Charging and Discharging Stage
As per the description of the process presented in
Section 3.1,
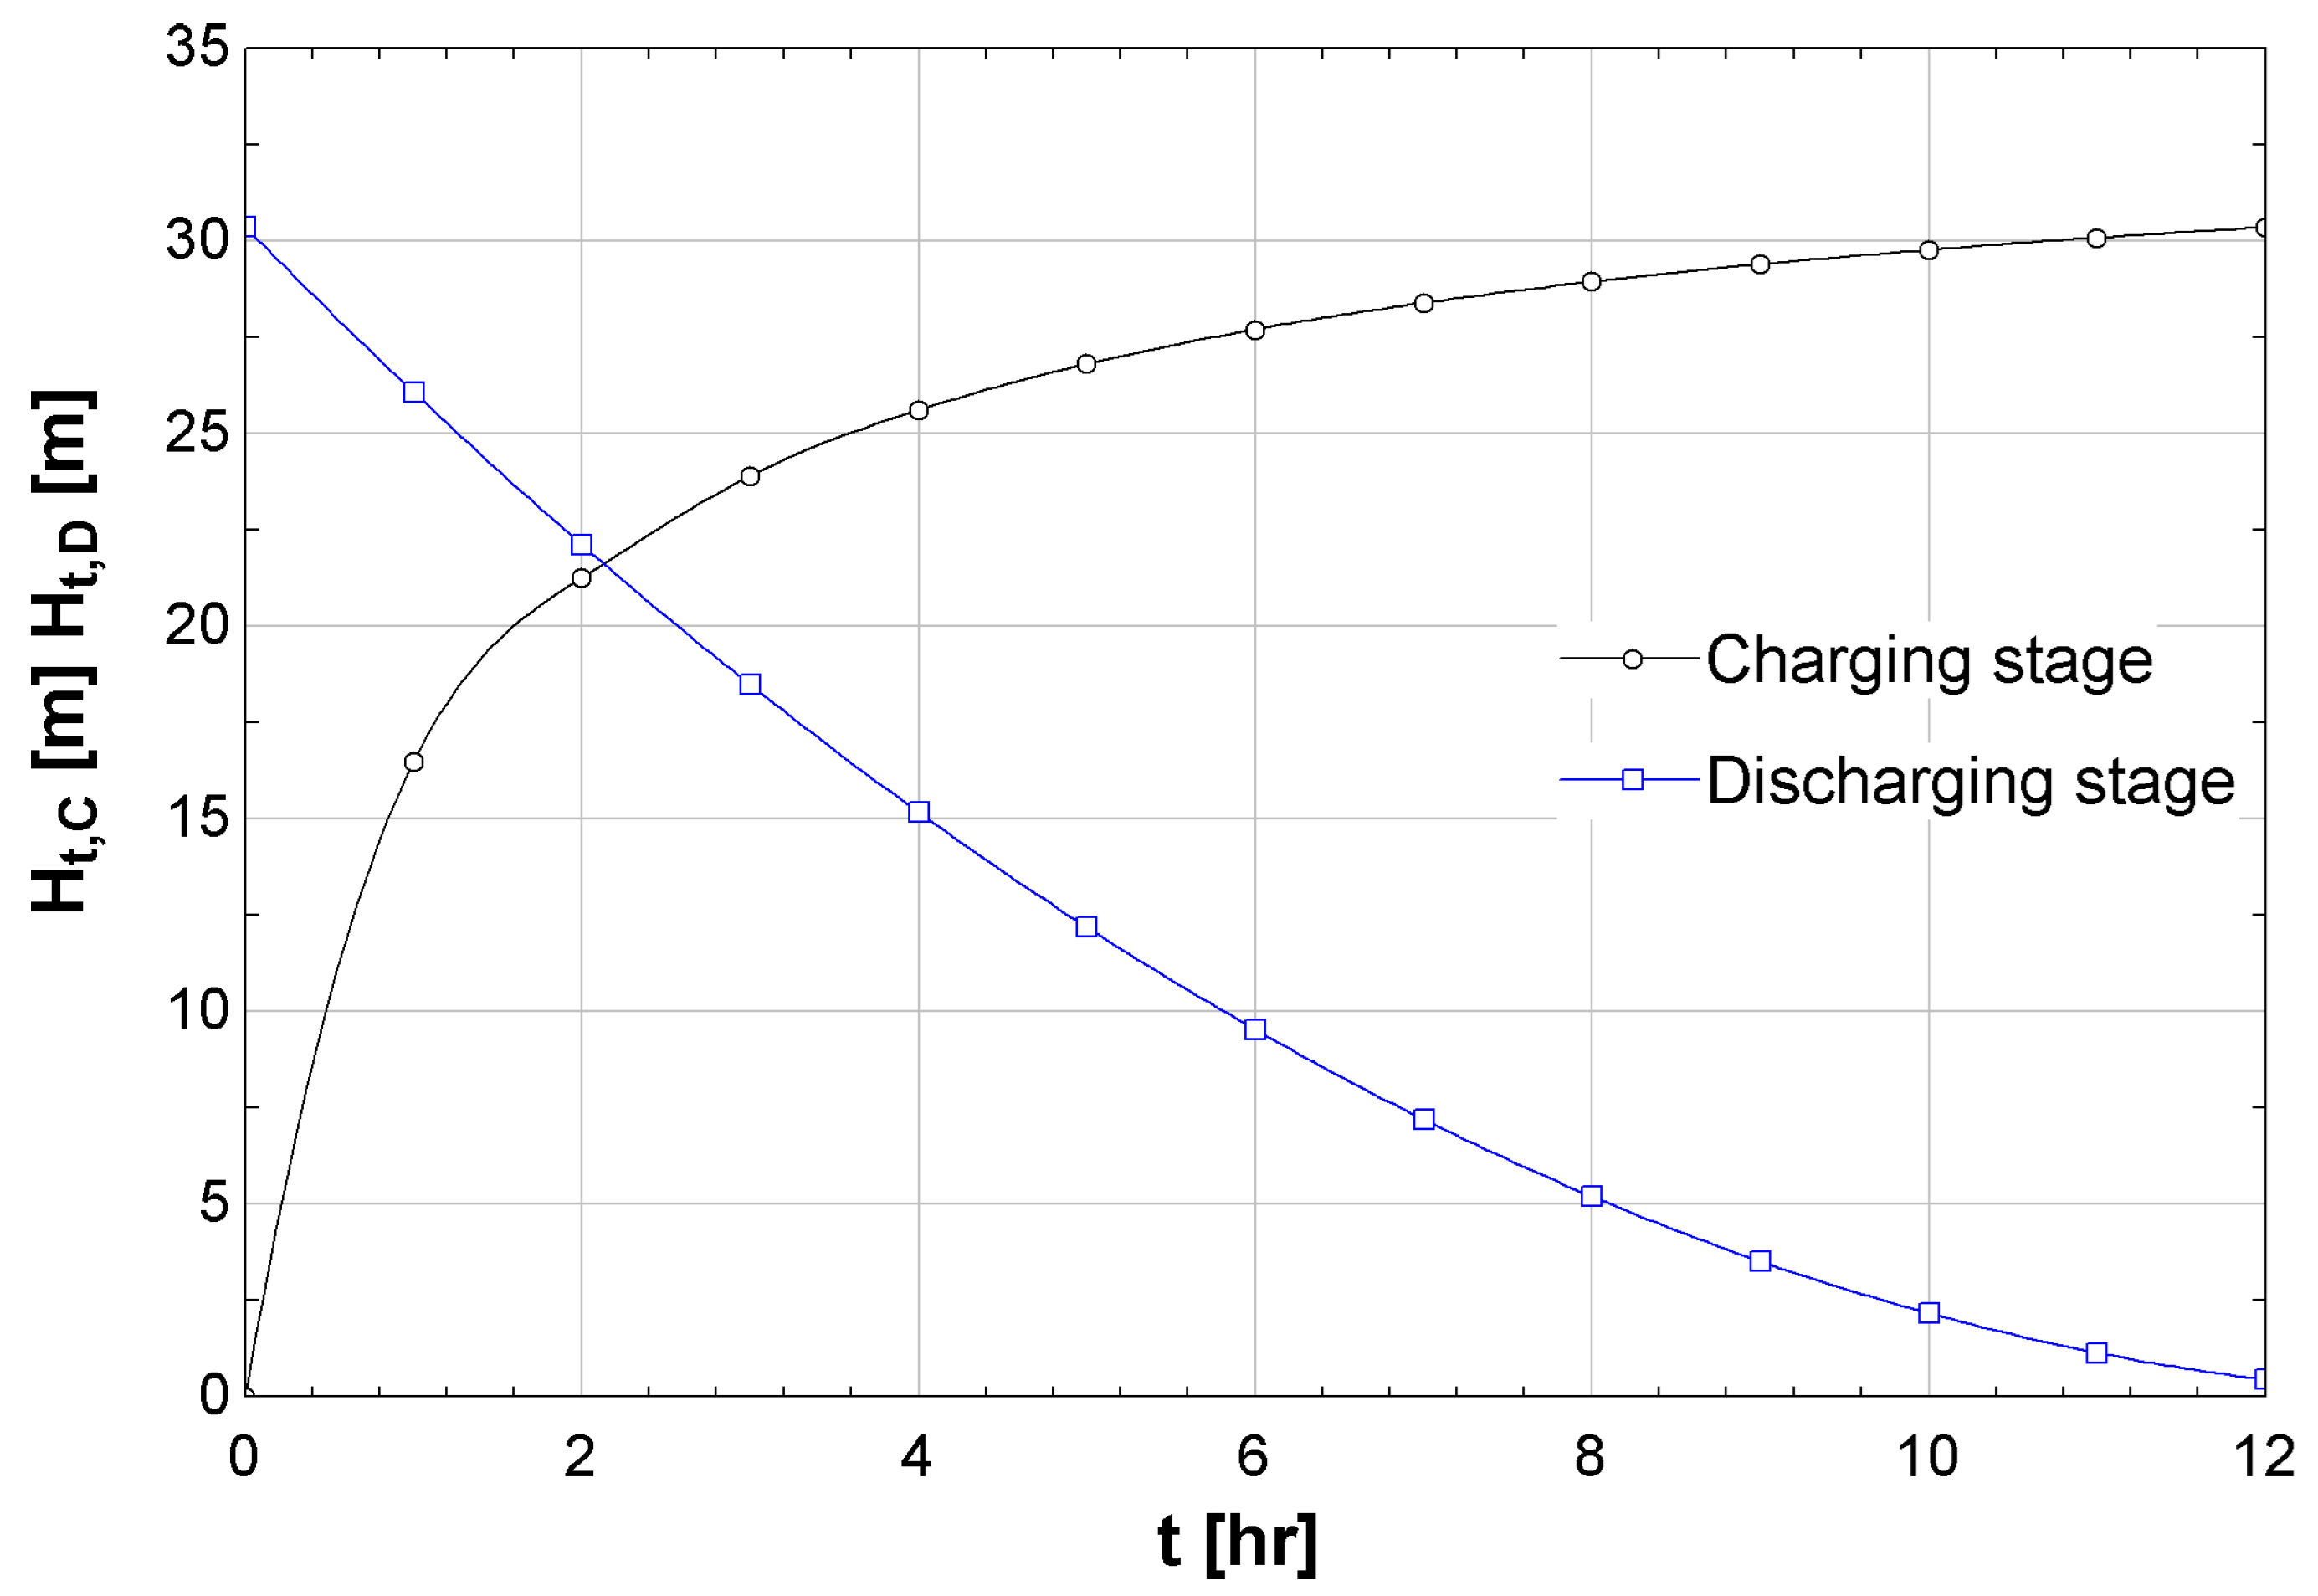
Figure 5 shows the charging over time of the saltwater tank, and simultaneously, it shows the change in salinity over time. As the salinity decreases, it takes more time for the freshwater to flow into the saltwater tank, and thus the change in the tank height is slower. The first two hours of the charging stage result in a height increase of approximately 83%, and the last 17% height increase takes approximately ten hours.
Figure 6 presents the curves for the charging and discharging stages. As the charging stage depends on a solution–diffusion process, it has a steep start that slows down as time passes and the salinity of the draw solution decreases. The change in height for the discharging stage is mainly a gravity-driven process. It depends on the initial height of the saltwater tank
and on the diameter of the outflow pipe that defines the area of the water jet
that will impel the turbine.
Similarly,
Figure 7 presents the change in the instantaneous power over time. As the generated power mathematically depends on a power of
of the height, the outflow pressure decreases exponentially as the saltwater tank height decreases. Although the simulation results indicate that the discharging stage of the proposed forward osmosis power plant yields the majority of its energy output within the first two hours, setting equal durations for the charging and discharging stages, such as 12 h each, remains a strategically advantageous design choice. This symmetrical cycle facilitates the implementation of multiple modular systems operating in tandem, where one unit charges while another discharges. In doing so, it becomes possible to maintain continuous energy generation at the plant level, even if individual modules exhibit non-uniform output over time.
Moreover, maintaining fixed-duration stages simplifies the synchronization and control of the system, especially in remote or off-grid scenarios where operational reliability is paramount. A predictable operating cycle enables easier automation, scheduling, and integration with external components such as energy storage or renewable sources. While longer discharging periods may result in a reduction in local energy conversion efficiency, this trade-off is justified by the system-level benefits gained in stability, modularity, and ease of scalability.
Additionally, standardized cycle lengths reduce the complexity of the mechanical and control systems, allowing for more consistent component sizing, maintenance routines, and overall infrastructure design. In this way, the adoption of symmetrical operational stages supports not only the technical feasibility of the plant but also its practical implementation, cost-efficiency, and long-term sustainability.
4.2. Plant Parameter Optimization
With the aim of finding the best combination for the plant parameters that could result in a good relationship between produced energy and process duration, a series of experiments were carried out, defining two main relationships: the membrane-area-to-saltwater-tank-area ratio , which directly affects the behavior of the charging stage, and the water-jet-area-to-saltwater-tank-area ratio , that defines the performance for the discharging stage. In all the experiments, the duration for the charging and discharging stage was set to 12 h.
To find the optimum value for the
, the value for the saltwater tank area
was fixed. The
was explored for three values of salinity
and four values of the initial saltwater tank height under the sea level
as presented in
Figure 8. For a given
, increasing the initial height under the sea level
or the salinity
will result in greater values for the initial height of the saltwater tank in the discharging stage
.
It is noted that higher values of will result in higher values for that represent higher potential energy; moreover, the effect of increasing will have a synergistic effect for higher salinity values as having an initial higher water volume with higher salinity will represent a greater chemical potential that will pump more freshwater from the feed side to the draw side in a given unit of time. Values greater than for the resulted in less of an increase for . This means that for a large-scale system, investing resources to increase this parameter beyond this point will be less cost-effective and should be avoided.
The influence of the outflow-jet-to-tank-area ratio
on the system’s performance was analyzed in terms of both instantaneous power and total energy generation for different initial saltwater tank heights under the sea level
(
= 1, 3, 5, and 10 m) and for fixed values for the saltwater tank area
and the salinity
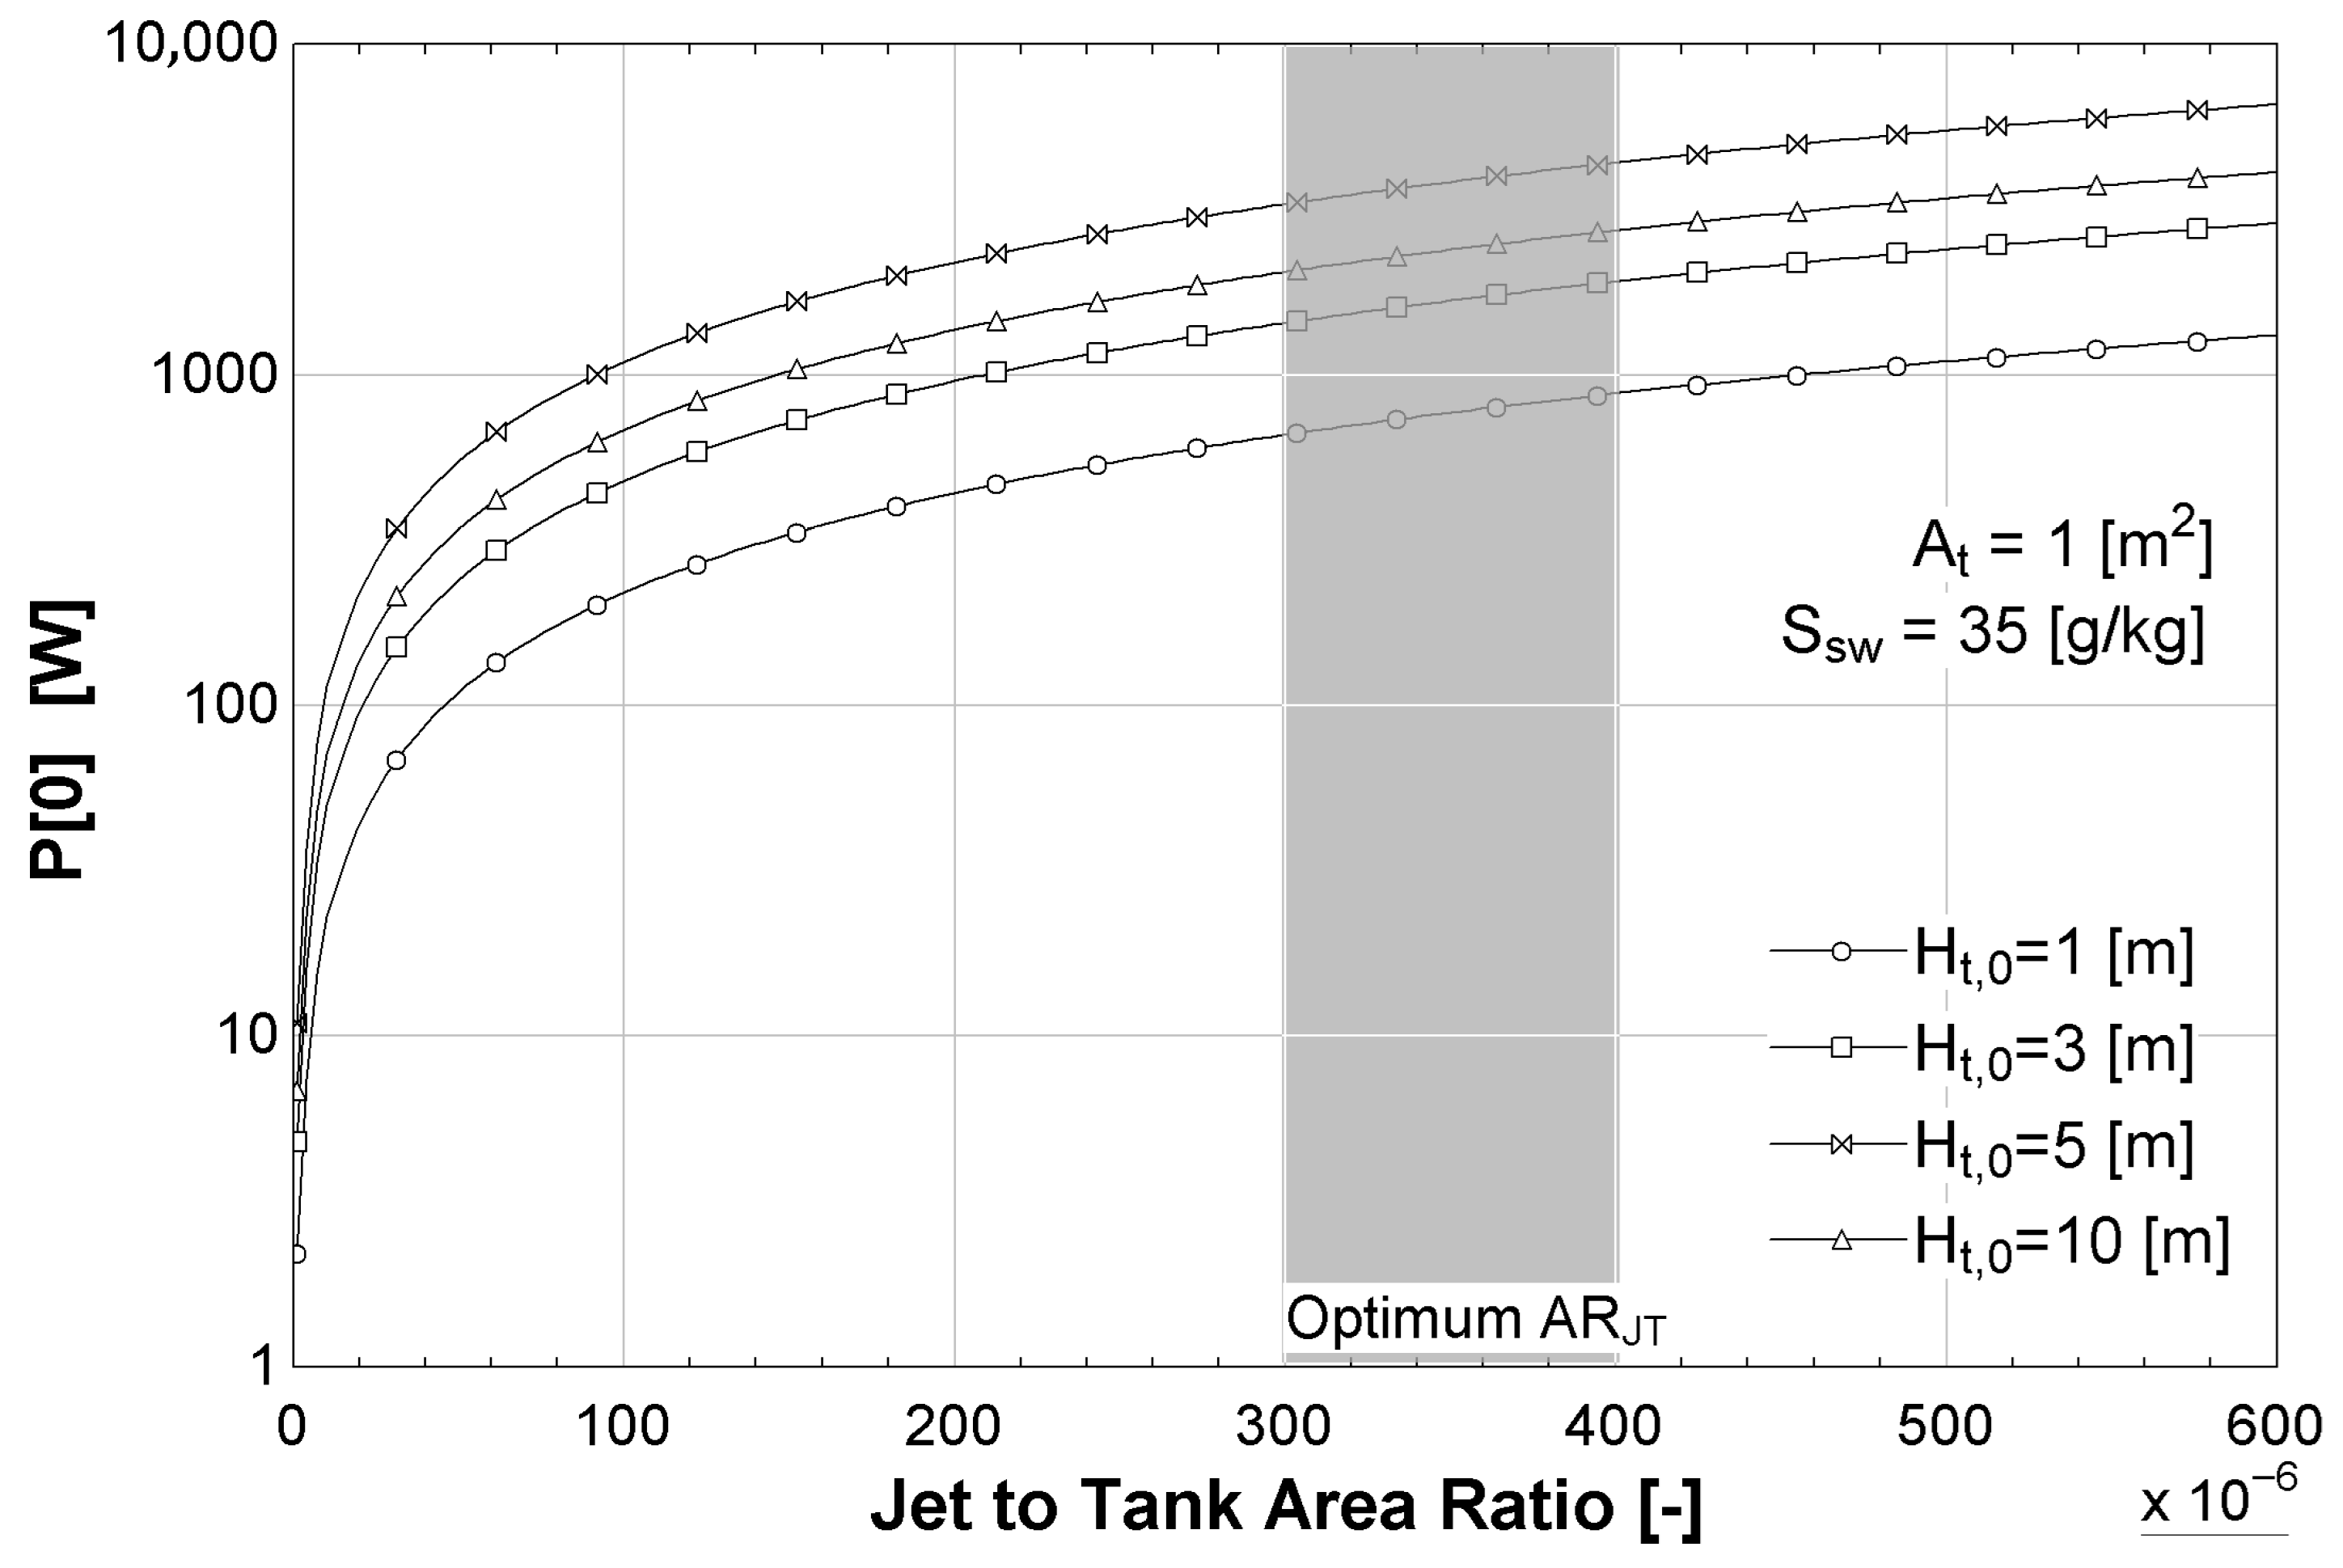
. As shown in
Figure 9, increasing
results in a rapid rise in instantaneous power output, especially for lower values of
. However, beyond approximately
, the growth in power begins to saturate, indicating diminishing returns. For all tested values of
, an optimal range of
(shaded area) was identified where the instantaneous power exceeds 1 kW, which is considered the minimum threshold for turbine operation. There exists an optimal operating range of
, where instantaneous power generation is maximized while ensuring that the water jet has sufficient mechanical energy to drive a turbine effectively. Values below
were discarded from the optimization, as they correspond to impractically narrow jets.
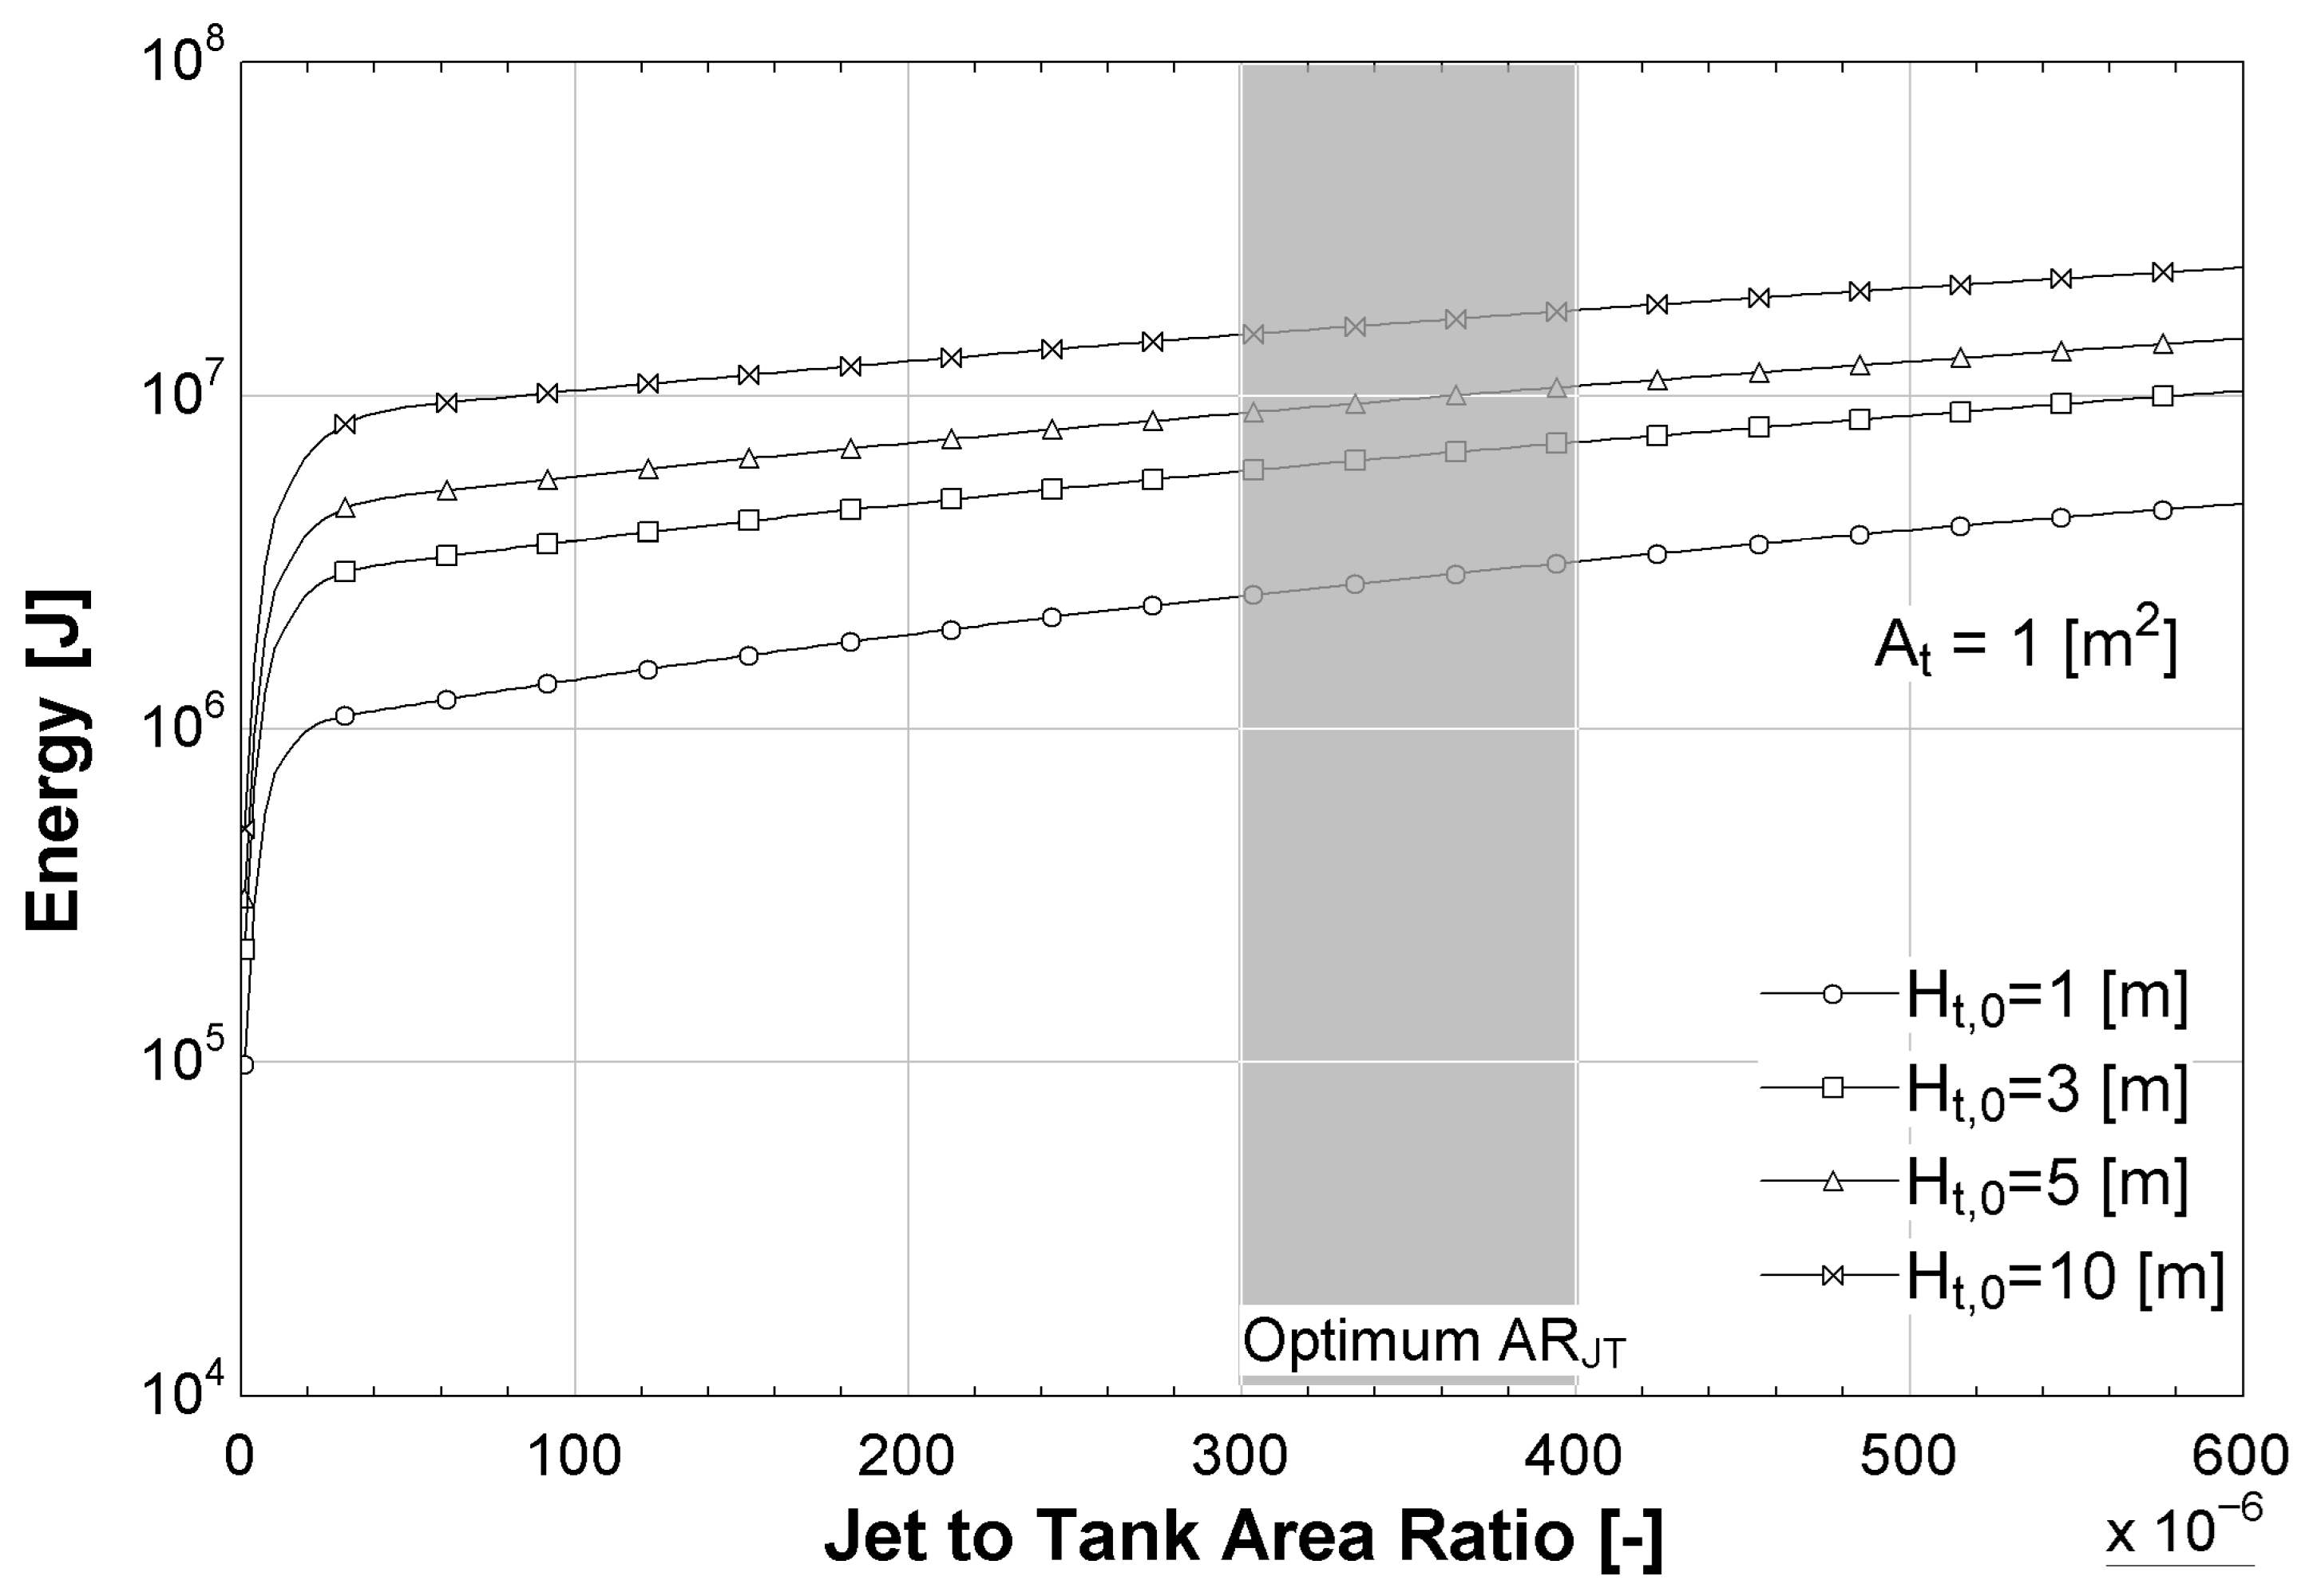
In
Figure 10, a similar trend is observed for total generated energy. The energy output increases with
, showing a near-linear behavior beyond the initial steep slope. Although the rate of increase is less sharp than in the power case, the gain in energy output is sustained over a broader range of
, especially for larger tank heights. While power output saturates at high
values, total energy generation continues to benefit from increased
. However, this must be balanced against practical design constraints and construction feasibility. The optimal range for
balances energy efficiency with jet size appropriate for turbine operation.
As shown in
Figure 9 and
Figure 10, values of less than
for
produce quick changes in the output parameter, but these values are not considered in the optimization as they represent a very small water jet that could be inadequate to move a turbine.
4.3. Possible Impacts
The results obtained from the simulation and optimization provide relevant insights for the practical design and deployment of FO-based osmotic power systems. By identifying an optimal range for key parameters, such as the membrane-area-to-tank-area ratio and the jet-area-to-tank-area ratio, the study establishes clear operational guidelines that can improve both the technical performance and economic feasibility of the system. The finding that increasing the membrane area beyond a certain threshold leads to diminishing returns allows for more cost-efficient system sizing, avoiding unnecessary investment without compromising energy output. Likewise, defining a jet-area range capable of sustaining turbine operation ensures stable and predictable power generation.
Recent experimental advances in osmotic energy conversion further support and inform these modeling results. Refs. [
25,
26] demonstrated that novel MXene- and MOF-based membranes can substantially enhance ion transport and power density, confirming that membrane material and morphology are decisive for osmotic system efficiency. These findings suggest that incorporating such high-performance membranes into the proposed batch-operated osmotic power plant could significantly shorten the charging time and increase net energy yield. Similarly, Ko et al. [
27] reported enhanced ion transport and power generation in graphene oxide nanofluidic membranes, highlighting opportunities for nanostructured materials to reduce internal concentration polarization—an effect that could further improve the efficiency of the charging stage in the present design.
Beyond materials development, recent studies have emphasized the importance of sustainability and operational robustness in forward osmosis systems. Zhao et al. [
28] investigated green and sustainable FO processes, addressing key challenges such as fouling control, energy consumption, and the use of renewable pretreatment sources. Integrating these considerations into future implementations of the proposed plant—such as coupling with renewable-powered ultrafiltration or degassing units—could enhance overall sustainability and autonomy. In parallel, Rahbari-Sisakht and Ismail [
29] reviewed recent progress in osmotic processes, underscoring persistent issues such as reverse solute flux, fouling, and pressure-loss limitations. The batch-operated configuration proposed here inherently mitigates some of these drawbacks by eliminating the need for continuous high-pressure operation, potentially offering a simpler and more energy-efficient alternative.
Furthermore, the implementation of fixed-duration charging and discharging cycles enables the modular operation of multiple units, which can guarantee continuous energy generation and simplify control and automation. This operational flexibility is particularly relevant for off-grid or remote applications, where reliability and low maintenance requirements are essential. Overall, these results, together with recent experimental progress, demonstrate that FO-based osmotic power plants can achieve meaningful energy recovery with lower intrinsic energy losses than conventional PRO systems, supporting their potential as a competitive and sustainable renewable energy technology.
5. Conclusions
This study proposed a novel batch-operated osmotic power plant and developed a mathematical model to describe its operation. The system was simulated using parameters representative of currently available technology. Simulation results demonstrate the technical feasibility of this concept and highlight its potential as a viable renewable energy solution.
The analysis shows that the charging stage is strongly influenced by membrane properties and membrane area, whereas the discharging stage is mainly determined by the initial water column height and the jet area driving the turbine. Maintaining an appropriate ratio between membrane area and tank volume was found to be crucial for stable and continuous power generation. The results further suggest that the batch-operated system could achieve higher energy efficiency than conventional PRO systems due to its operating principle.
These findings underscore the scalability and practical potential of the proposed design for large-scale osmotic energy generation. Future work will focus on experimental validation of the theoretical model, including pilot-scale testing, and on integrating advanced optimization strategies and renewable-powered pretreatment stages to enhance system performance and sustainability.
