Abstract
To alleviate strong strata-pressure bursts during ultra-thick coal extraction, we selected the 26 m number five seam of the Chenjiagou Coal Mine as a full-scale prototype. Three objectives were pursued: (1) elucidate the initiation mechanism of high-energy roof failures under top-coal caving (TCC); (2) quantitatively link the failure sequence of key strata to burst intensity; and (3) deliver field-oriented prevention criteria. A 1:300 physical similarity model and UDEC plane-strain simulations were combined to monitor roof deformation, stress evolution and dynamic response during extraction. Results demonstrate that pressure bursts are driven by abrupt kinematics of the overburden, triggered by sequential breakage of key horizons: the secondary key stratum collapsed at 130 m face advance, followed by the main-key stratum at 360 m. Their combined rupture generated a violent energy release, with roof displacement accelerating markedly after the main horizon failed. We therefore propose two dimensionless indices—the dynamic load factor (DLF) and stress concentration factor (SCF)—to characterize burst severity; peak values reached 1.62 and 2.43, respectively, while pronounced stress accumulation was localized 6–15 m ahead of the face. These metrics furnish a theoretical basis for early warning systems and control strategies aimed at intense rock burst.
1. Introduction
In China, seams thicker than 8 m are categorized as ultra-thick coal reservoirs and represent a cornerstone of national coal supply [1,2,3]. Distributed widely across Shanxi, Inner Mongolia and Gansu, these horizons commonly exceed 20 m, offer high calorific value and exhibit stable geometry, making their safe and efficient extraction a strategic priority. Yet large mining heights and considerable depths generate extensive goaf; once roof rock is disturbed, it can collapse violently, producing strong pressure manifests such as anomalous subsidence, support overload and rock bursts [4,5,6]. Quantifying how the overbank strata fracture and how strata pressure evolves is therefore essential for optimizing panel layout, support design and operational safety [7,8,9]. The present investigation was undertaken to provide theoretical guidance for mining ultra-thick seams while preventing pressure-induced hazards.
Numerous studies have quantified roof deformation and strata-pressure evolution above longwall panels. The concept—first advanced by Qian [10]—states that one or several stiff horizons govern overall roof behavior [11,12,13]; the lowermost layer that controls only part of the succession is termed the secondary key stratum, whereas the horizon dominating the entire package is the primary key stratum [14,15]. Field monitoring, physical modeling and elastic analyses of 7 m-high faces [16,17,18,19,20,21,22] have clarified single-key-stratum mechanics, yet the synergistic failure of multiple key horizons and its link to violent pressure bursts remain poorly understood. Recent work (2022–2024) identifies three shortcomings: (i) treating sub- and main-key strata as independent beams ignores phase-difference amplification, overestimating the burst onset by 12–18% [3,5,7]; (ii) small 1:100 frames (<1.8 m high) underestimate full-thickness overburden movement and stress concentration by ~0.3 [4,9]; (iii) static-load or energy-release indices alone yield 25% error when the secondary key stratum fails 30–50 m ahead of the primary key stratum [19,21]. Consequently, an integrated, field-calibratable framework that captures multi-horizon interaction is urgently required.
A wealth of research has explored strata movement, fracturing characteristics, and strata pressure responses in the mining of coal seams thinner than 8.0 m. However, recent studies published between 2022 and 2024 have highlighted three prevailing gaps in the current understanding of strong mine pressure in ultra-thick coal seams:
(1) Single-key-stratum simplification: Although Kumar et al. [3], Zhang et al. [7] and Cui et al. [5] reported stress peaks reaching 2.1–2.7 times higher than the in situ stress ahead of the working face, their analyses predominantly treat the sub-key and main key strata as independent structural beams. This approach overlooks the phase-difference-driven amplification effect arising from their sequential fracturing, leading to an overestimation of the strong mine pressure initiation criterion by approximately 12–18%.
(2) Physical model scale constraints: Gao et al. [4] and Sun et al. [9] employed small-scale physical models (1:100 ratio, ≤1.8 m in height), which are insufficient to reproduce the full-thickness movement of overburden strata exceeding 500 m. Consequently, the stress concentration factor near the working face was underestimated by roughly 0.3.
(3) Absence of field-calibratable dual indices: Han et al. [19] and Wang et al. [21] utilized either a static load multiplier or energy release rate as a standalone indicator. Field observations reveal that when the secondary key stratum fractures 30–50 m ahead of the primary key stratum, the nonlinear superposition of dynamic and static effects introduces a prediction error of up to 25% and fails to locate the stress concentration zone accurately.
To address these limitations, this study introduces a 1:300 large-scale physical–digital fusion framework (effective model height: 1.9 m; simulated overburden thickness: 658.7 m), integrated with UDEC plane-strain numerical modeling. Two quantitative indices—the dynamic load factor (DLF) and stress concentration factor (SCF)—are proposed for the first time. The key contributions include:
(1) Identification of the “dual-period” chain-fracture mechanism, where the secondary key stratum (21.8 m thick siltstone, fracture interval ~30 m) and the primary key stratum (18.9 m thick fine sandstone, fracture interval 60–90 m) undergo sequential rupture, serving as the primary trigger for strong mine pressure.
(2) Quantification of peak DLF and SCF values as 1.62 and 2.43, respectively, validated against in situ micro-seismic data with a deviation of less than 7%.
(3) Development of a collaborative control strategy, involving pre-splitting of the secondary key stratum and pressure relief of the primary key stratum, offering practical guidance for strong mine pressure mitigation in deep ultra-thick seam mining.
The Chenjiagou minefield is located in the western sector of the Huating Coalfield (longitude 106°34′–106°41′ E, latitude 35°10′–35°16′ N), and administratively falls under Huating County, Pingliang City, Gansu Province. Geomorphologically, the coalfield lies on the transition belt between the Liupan Mountains and the Shanxi-Gansu-Ningxia Loess Plateau. Zonal alluvial river valleys are present only along the central-western and south-eastern margins; elsewhere, low loess-and-bedrock hills dominate. The topography is “high in the center and low to the north-west and south-east”, with elevations of +1400 m to +1650 m and relative relief of 100–200 m. The number five coal seam is currently the principal mining target. It has an average burial depth of 545 m, a thickness of 13.32–54.49 m (mean 26 m), and an average dip of 6.6°. The regional geological structure of the Chenjiagou Coal Mine is shown in Figure 1.

Figure 1.
The regional geological structure of the Chenjiagou Coal Mine.
According to the geological data of the Chenjiagou Coal Mine, there are fifteen strata within 200 m overlying the number five coal seam. The lithology and thickness of the roof and floor strata are shown in Table 1.

Table 1.
The roof and floor strata of the number five coal seam.
To quantify the contribution of each layer to mining-induced pressure, the breaking span L and stress–concentration coefficient S of every competent horizon were calculated using the composite-beam equations [23,24,25]. The results show that the 18.9 m thick fine-grained sandstone (primary key stratum) exhibits the highest S (2.43), whereas the 21.8 m thick siltstone (secondary key stratum) exhibits S = 2.38. Both values exceed the critical threshold (S ≥ 2) adopted in this study and are therefore selected for further analysis; the remaining beds exhibit S ≤ 1 and are not classified as key strata, consistent with theoretical predictions.
2. Methodology
2.1. Physics-Digital Fusion Framework
By coupling similar physical model tests (a method simulating prototype mining engineering via scaled models, following similarity principles of geometry, mechanics, and dynamics) with numerical simulations of digital models (using software to build virtual models for calculating stress, displacement, etc., of rock masses), this paper, on one hand, analyzes the structural characteristics, dynamic properties, and evolution laws of mining-induced pressure (stress generated in surrounding rock due to mining activities, a core factor affecting stope stability) under disturbance, including the fracturing of key strata (main load-bearing strata in overlying rock, whose breakage dominates overlying rock movement), the movement of overlying strata, and fracture laws. On the other hand, it focuses on the initial mining stage, explores the characteristics of sub-key and main key strata, reveals the breakage and caving of overlying strata, the development of plastic zones (rock mass areas losing elasticity and entering a plastic deformation state under stress), and the distribution of stress fields, as well as the laws governing the plastic zone, stress, fracture, and movement of overlying strata as the working face advances. Based on the above analyses, the dynamic load coefficient (ratio reflecting dynamic load intensity relative to static load) and stress concentration coefficient (ratio of maximum stress to original rock stress in concentrated areas) are extracted; finally, it elucidates its engineering implications.
As shown in Figure 2, the technical roadmap of this study adopts a systematic research framework integrating experimental verification and numerical calculation, with mining-induced pressure and overlying strata evolution as the core research objects. First, the study establishes a dual-method support system composed of “similar physical model laboratory tests” and “numerical simulation of digital models” to ensure the reliability of subsequent analysis through the mutual verification of physical experiments (reflecting real engineering scenarios) and numerical calculations (quantifying microscopic mechanisms). On this basis, the research carries out multi-dimensional analysis from two perspectives: it not only explores the structural characteristics, dynamic properties and overall evolution laws of mining-induced pressure under disturbance, but also focuses on the initial mining stage to conduct in-depth analysis of sub-key and main key strata, involving overlying strata breakage and caving, plastic zone development, stress field distribution, and the dynamic change laws of overlying the strata’s plastic zone, stress, fracture and movement during working face advancement. Finally, the dynamic load coefficient and stress concentration coefficient are extracted as key quantitative indicators from the above analysis results, and their engineering implications are clarified, forming a complete research chain from “method construction→mechanism analysis→parameter extraction→engineering application”, which provides a systematic technical path for the study of mining-induced pressure control and overlying strata stability in mining engineering.
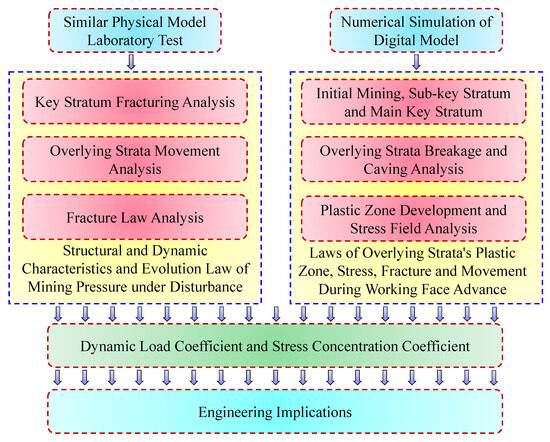
Figure 2.
The technical roadmap.
2.2. Similar Model Experiment
In order to study the breaking law of the overlying strata along the strike and the characteristics of mining pressure during mining the extra-thick coal seam, according to the geological conditions of the 8512 fully mechanized caving face in the Chenjiagou Coal Mine, the method of a similar simulation experiment is used to analyze the breaking of the key stratum, the movement and break laws of the overlying strata and the distribution of the abutment pressure.
To simulate the corresponding experiment, a two-dimensional plane model frame with dimensions of 4.2 m × 0.25 m × 2 m was adopted. The experiment targets the number five coal seam mined by the 8512 working face, which has an average burial depth of 545.2 m, an average thickness of 26 m, and an average dip angle of 6.6°. The working face width is 120 m, and the width of the coal pillar between adjacent working faces is 12 m.
For the overlying strata of the number five coal seam, those with smaller thickness or similar lithology were simplified into the same stratum. From the ground surface down to the coal seam floor, there are 20 strata in total, including 1 loose layer and 1 coal seam. In accordance with the requirements of similar simulation experiments [26,27,28], a model frame with a length of 420 cm, height of 200 cm and width of 25 cm was used (note: the actual effective height of the model during the experiment was 190 cm). The similarity scale of the model was set to 1:300.
Figure 3 presents the physical structure and material distribution of the above-mentioned similar simulation model, clearly showing the simplified stratigraphic sequence (from the loose layer to the coal seam floor), the layout of the 8512 working face simulation area, and the location of the inter-working-face coal pillar. This figure provides a visual reference for the subsequent analysis of stratum movement and coal pillar stability during the mining process.
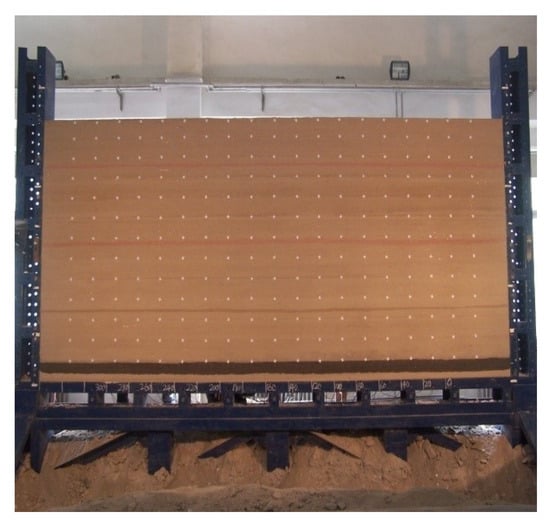
Figure 3.
The similar experimental model.
Based on the geological data of the coal and rock strata in the 8512 working face of the Chenjiagou Coal Mine, components of the similar simulation materials were selected. These materials mainly consist of two parts: aggregate and binder. The aggregate accounts for a relatively large proportion of the material and serves as the object to be bonded by the binder; its physical and mechanical properties exert a significant influence on the properties of the similar materials. In this experiment, fine sand was used as the aggregate. As the dominant component determining the properties of the similar materials, the mechanical properties of the binder largely dictate the mechanical behavior of the similar materials. According to the experimental results and geological composition, lime and gypsum were adopted as the binders in this experiment. In the experiment, sand was used as the main material, while whiting powder, calcined gypsum, mica, and water served as auxiliary materials. Notably, fly ash was added specifically when preparing the mixture for the coal seam [29,30,31]. Since sand was the main material of the model, the auxiliary materials accounted for a small proportion, and had no significant impact on the density of the model material. Therefore, the density of all strata except the coal seam were calculated as 1600 kg/m3. The mix ratios of the similar materials for each rock stratum in the 8512 working face of the Chenjiagou Coal Mine are detailed in Table 2.
Table 2.
The ratio of similar materials of the roof and floor strata (lime:gypsum:sand).
In addition to the geometric ratio of 1:300, we maintained the same gravitational field and chose similar materials, whose average bulk density is about 63% of the in situ value. Consequently, model stress equals field stress multiplied by 0.19; strain is preserved one-to-one; model displacement is 1/300 of the field value; and each hour in the model represents approximately one day of face advance in the mine. All readings were converted with these rules before analysis.
The simulation experiment monitors the displacement and stress of each stratum in the model in real time. As shown in Figure 2, there are 19 × 13 = 247 measuring points to monitor the vertical and horizontal displacement of the overlying strata during mining. The stress monitoring consists of three sets of measuring lines: one for the roof, one for the secondary key stratum, and one for the primary key stratum. The measuring line in the roof consists of thirty-four pressure sensors, each with an interval of 10 cm, and the other two measuring lines each have twenty-four pressure strain gauges, each with an interval of 15 cm.
The experiments rely on the following premises: (1) plane-strain condition holds because the model width is far smaller than the panel length; (2) bedding–plane bond strength is at least 80% of intact rock tensile strength; (3) mining advance obeys Froude scaling and dynamic components >50 Hz are ignored. Layer density varies from 0.78 to 1.70 × 10³ kg m−3, uniaxial compressive strength from 0.02 to 157 MPa, and thickness from 1.5 to 67 cm (model scale).
2.3. Numerical Simulation Modeling
According to the geological conditions of the Chenjiagou Coal Mine, a numerical simulation model was established by using UDEC 6.0. The mechanical parameters of the roof and floor strata of the number five coal seam are shown in Table 3.
Table 3.
The mechanical parameters of the roof and floor strata.
To simplify the analysis of stress and deformation characteristics during the mining process of the 8512 working face in the Chenjiagou Coal Mine, the working face was simplified as a plane strain problem, and a corresponding plane mechanics model was established [32,33,34,35]. As shown in Figure 4, the model has a horizontal length of 1000 m and a vertical height of 658.7 m; the burial depth of the 8512 working face within the model is 545 m; and the thickness of the target mining object, i.e., the number five coal seam, is 26 m. Roller constraints are applied to the left and right vertical boundaries of the model, allowing vertical displacement while restricting horizontal displacement; fixed constraints are imposed on the lower horizontal boundary of the model, limiting both horizontal and vertical displacements. Based on the actual stratum distribution in the study area and the measured degree of joint development, different stratigraphic units are divided into sub-regions with graded joint densities.
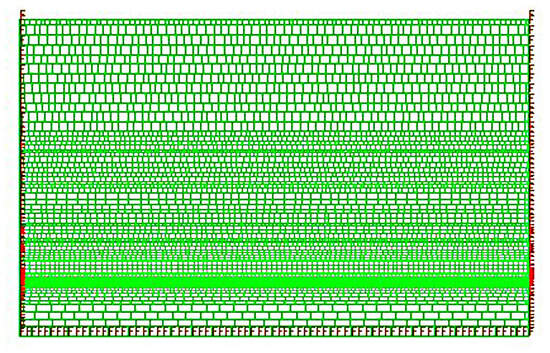
Figure 4.
The model joint division.
The UDEC mesh was generated with a base element length of 2 m along both the x and y axes; this size yields at least 12 elements across the thinnest competent bed (4.5 m) and keeps the total block count below 35,000 to balance accuracy and runtime. Joint spacing of 4 m or less was imposed on the immediate roof and floor, and gradually coarsened to 8 m in deeper strata. A mesh independence test (1 m versus 2 m versus 4 m) revealed a change of less than 3% in peak abutment stress, confirming that the 2 m resolution is adequate for the present study.
UDEC models adopt plane-strain, Mohr–Coulomb plasticity with post-peak strain softening; joint shear stiffness Ks = 0.8 Kn and dilation angle = 0.25 φ. Material properties span density 1.28–2.64 × 10³ kg m−3, bulk modulus 2.3–18.6 GPa, friction angle 21–46°, and tensile strength 0.15–1.29 MPa. Limitations include: (1) 2D approximation neglects lateral abutment relief, over-estimating maximum horizontal stress by approximately 5%; (2) the ubiquitous joint logic is unable to rotate blocks larger than 0.5 m, leading to a marginally accelerated re-compaction of the goaf; and (3) calibration is currently site-specific.
3. Results
3.1. Similar Simulation Experiment
3.1.1. Break and Caving Characteristics of the Overlying Strata During Initial Mining
The experiment simulated the mining process of the 8512 working face. The working face advanced by 5 cm each time; the working face and the surrounding rock have experienced the initial pressure and periodic pressure. During the initial mining of the working surface, the break and caving characteristics of the overlying strata are shown in Figure 5.

Figure 5.
Break and caving characteristics of the overlying strata during initial mining for the working face advances (a) 30 cm (corresponding to 90 m); (b) 45 cm (corresponding to 135 m); (c) 50 cm (corresponding to 150 m); (d) 70 cm (corresponding to 210 m); (e) 80 cm (corresponding to 240 m) and (f) 100 cm (corresponding to 300 m).
Figure 5 illustrates the progressive evolution of roof failure as the longwall face advanced. At a model advance of 30 cm (equivalent to 90 m in situ), the immediate roof collapsed into the gob, reaching a caving height of 7.5 m. The fallen material appeared fragmented and loosely accumulated (Figure 5a).
When the face moved forward to 45 cm (135 m), the collapse extended through four roof beds, with the caving height increasing to 21 m. At this stage, the failed strata exhibited a more block-like and massive structure (Figure 5b).
At a 50 cm (150 m) advance, five roof beds had failed, and the caving height reached 25.5 m. The gob was a trapezoidal shape. Notably, the secondary key stratum fractured for the first time, with the resulting blocks settling in a relatively regular pattern. However, these blocks lacked continuity with the surrounding rock mass and did not form a stable load-bearing structure (Figure 5c).
As the face advanced by 70 cm (210 m), four additional roof beds collapsed, and the caving height grew to 47.5 m. The lower portion of the collapsed zone was heavily fractured and chaotically stacked, while the upper strata maintained a more ordered arrangement. The overall caved zone showed visible downward deflection. A separation cavity formed between the collapsed roof and the overlying stable strata, particularly near the lateral boundaries of the gob (Figure 5d).
At 80 cm (240 m), another four beds failed, bringing the cumulative caving height to 60.5 m. This marked the first periodic fracture of the secondary key stratum, with a fracture interval of 30 m. The fracture line was located near the gob edge, and the broken strata formed a hinged structure capable of carrying some load (Figure 5e).
Finally, at 100 cm (300 m) of face advance, ten roof beds collapsed, and the caving height reached 123.5 m. This stage was characterized by the first failure of the primary key stratum. Its collapse triggered a large-scale failure of the underlying strata, resulting in a clean roof break along the face line. This event also represented the second periodic fracture of the secondary key stratum, with a step distance of 20 m, driven by stress redistribution caused by the primary key stratum failure. A distinct separation zone formed between the primary key stratum and the lower beds, extending to 42 cm (126 m) in length and 2.5 cm (7.5 m) in height (Figure 5f).
3.1.2. Break and Caving Characteristics of the Overlying Strata During Normal Mining
The break and caving characteristics of the overlying strata during normal mining are shown in Figure 6.
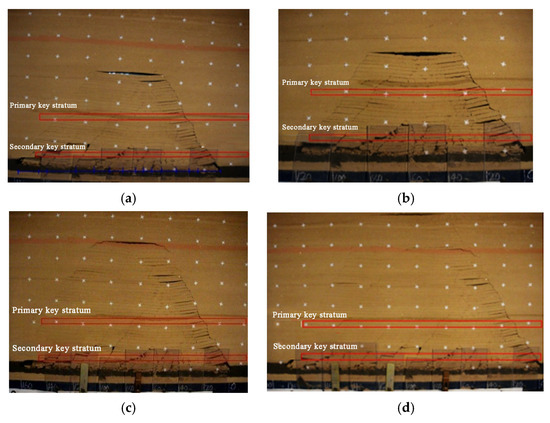
Figure 6.
The break and caving characteristics of the overlying strata during normal mining for the working face advances at (a) 120 cm (corresponding to 360 m); (b) 140 cm (corresponding to 420 m); (c) 160 cm (corresponding to 480 m) and (d) 190 cm (corresponding to 570 m).
As shown in Figure 6a, when the working face advanced by 120 cm (corresponding to 360 m), eight roof strata of the coal seam collapsed, and the collapse height accumulated to 165 m. The primary key stratum was periodically fractured for the first time, and the periodic fracture interval was 60 m. At this moment, the secondary key stratum and the immediate roof also had periodic fractures; the fracture interval was 55 m, and the overlying strata collapse angle was 60°.
As shown in Figure 6b, when the working face advanced by 140 cm (corresponding to 420 m), five roof strata of the coal seam collapsed, and the collapse height accumulated to 206 m. At this moment, the primary key stratum was periodically fractured, and the periodic fracture interval was 60 m.
As shown in Figure 6c, when the working face advanced by 160 cm (corresponding to 480 m), ten roof strata of the coal seam collapsed, and the collapse height accumulated to 269 m. The primary key stratum broke periodically with a fracture interval of 60 m, and at the same time, the secondary key stratum also broke. After the primary key stratum was broken, it was closely lapped with the rock mass in front, without dislocation, forming a complete structural bearing system.
As shown in Figure 6d, when the working face advanced by 190 cm (corresponding to 570 m), seven roof strata of the coal seam collapsed, and the collapse height accumulated to 338 m. The fifth periodic fractures of the primary key stratum had a fracture interval of 90 m; meanwhile, the lower strata were also broken.
With the advancement of the working face, the secondary key stratum and the primary key stratum were cyclically fractured. The fracture interval of the sub-key layer was 30 m, and the fracture interval of the primary key stratum was 60–90 m. The fracture of the secondary key stratum would not cause large-scale movement of the upper strata, while the fracture of the main key strata would lead to the fracture of the secondary key stratum, and the movement of the overlying strata would develop further, upward.
3.1.3. Movement and Deformation of the Overlying Strata
The caving area of the overlying strata on the gob was trapezoidal, the middle strata was depressed downward and the bottom strata was fragmented, and the surface col-lapse length was 80 cm (corresponding to 240 m). There was a clear demarcation line in the two boundaries of the caving area, and there was an obvious delamination near the demarcation line. The intermediate caving strata were gradually compacted during mining. The angles between the lower part of the two boundaries of the caving area and the roof of the coal seam were 61° and 63°, respectively. The caving form of the gob boundary is shown in Figure 7.
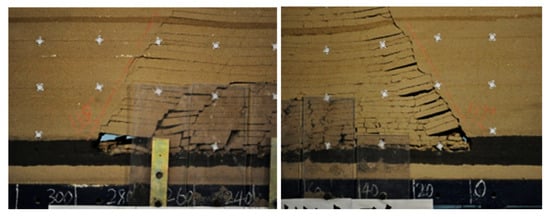
Figure 7.
The caving form of the gob boundary.
According to the model experiment, the movement of the overlying strata during mining is shown in Figure 8.
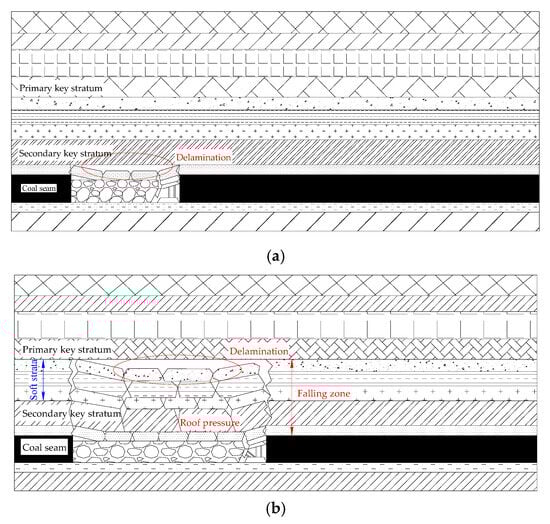

Figure 8.
The movement of the overlying strata (a) in the early recovery; (b) in the medium recovery; (c) at the end of mining.
As shown in Figure 8, as the distance from the overlying strata to the coal seam was larger, the subsidence of the overlying strata was smaller. The subsidence of the immediate roof was the largest, which was 9–10 m; the subsidence of the surface loess layer was the smallest, which was 3.5 m. The subsidence curves of the overlying strata of the gob are shown in Figure 9.
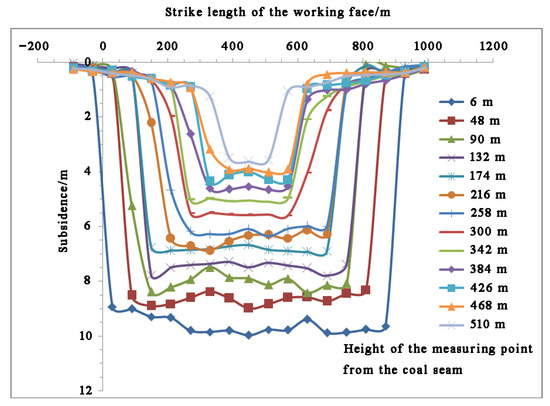
Figure 9.
The subsidence curves of the overlying strata of the gob.
3.1.4. Variation Law of Stress on Roof and Floor of the Coal Seam
The variation curves of stress on the roof and floor of the coal seam are shown in Figure 10. The stress field was obtained directly from UDEC’s explicit solution cycle. After applying an initial stress field derived from the overburden weight (σv = γh, σh = kσv with k = 0.5), the model was brought to elastic equilibrium. During each mining step, the internal forces were updated using the Mohr–Coulomb joint and block logic; normal and shear stresses along each zone were then recorded by the built-in FISH function and exported at the 247 measurement points shown in Figure 3. The resulting distributions were compared with analytical beam solutions and borehole stress-meter data from the same panel (difference < 8%), confirming that the model adequately reproduces the in situ stress state.
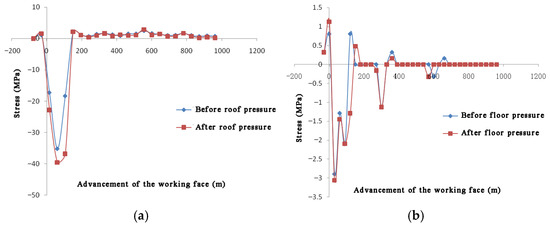
Figure 10.
The variation curves of stress (a) on roof and (b) on floor.
As shown in Figure 10, the variation law of stress on the roof and floor of the coal seam are as follows:
The unmined rock mass behind the open cutting and in front of the working face had a stress-increasing zone during mining.
The rock mass at a certain level of the overlying strata near the working face and the gob maintained a high stress state, and the area with a high stress state showed upward and forward development continuously during mining. Behind the working face by a certain distance, the height of the strata with high stress kept stable. The lower strata in the goaf were always in a state of low stress. This shows that there is a dynamic stress arch above the stope, which mainly bears and transmits the load and pressure of the overlying strata.
Around the initial pressure and periodic pressure, the high stress area in front of the coal wall of the working face changes dynamically during mining.
3.2. Numerical Simulation
3.2.1. Fracture and Stress Evolution in Surrounding Rock Mass During Initial Mining
The working face was advanced along the strike, and every 10 m was a step. When the excavation is 60 m, the plastic zone expands obviously, and the roof was partially broken, causing the initial pressure and collapse. The expansion of the plastic zone is shown in Figure 11.

Figure 11.
Distribution of plastic zone in surrounding rock of (a) the working face when advanced by 50 m and (b) the working face when advanced by 60 m.
When the working face advanced by 50 m, there were few fracture areas. When the working face advanced by 60 m, the fracture area expanded rapidly, spreading to both sides of the coal wall in the gob. The fracture area was concentrated in the middle of the gob, and it was also the area with the largest subsidence. After the initial pressure, the maximum subsidence of the main roof was 200 mm.
The secondary key stratum inhibited the expansion of the fracture to the overlying strata and prevented the plastic failure of the overlying strata, indicating that the secondary key stratum plays the role of “beam”.
After the initial pressure, the unmined coal mass in front of the working face was at the critical point of plastic deformation. After the main roof collapsed for the first time, a cantilever beam structure began to form on the right side.
The vertical stress distribution of the working face is shown in Figure 12. The main stress field vector is shown in Figure 13.
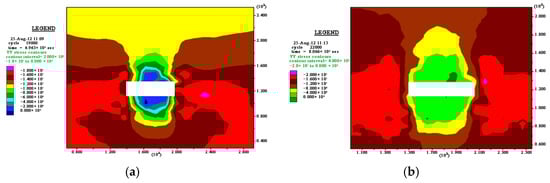
Figure 12.
The vertical stress distribution of (a) the working face when advanced by 50 m and (b) the working face when advanced by 60 m.
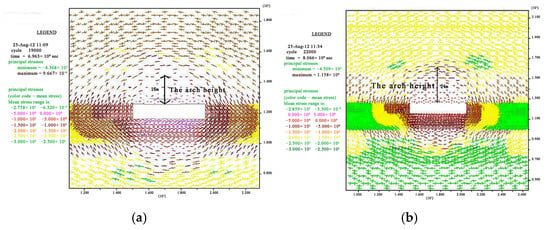
Figure 13.
The main stress field vector of (a) the working face when advanced by 50 m and (b) the working face when advanced by 60 m.
When the working face advanced by 50 m, the vertical stress (σy) was concentrated on the left and right sides of the gob, σy = 18 MPa.
When the working face advanced by 60 m, the vertical stress (σy) expanded to the deep coal mass, formed a stress concentration area at 5 m–15 m in front of the working face. It showed that the main roof had flexure deformation, formed an angle with the coal wall, resulted in the deep expansion of the stress, σy = 20 MPa.
The distribution shape of the principal stress vector field in the roof of the gob was arched, and above the dome was the stress in original rock. When the working face advanced by 50 m, the arch was 14 m away from the roof of the gob. When the working face advanced by 60 m, the arch was 24 m away from the roof of the gob. It showed that the natural main stress distribution of the overlying strata was affected after the initial pressure.
The principal stress vector in front of the working face was obliquely distributed, which was consistent with the distribution of the gravity of the overlying strata in the gob to both sides of the coal wall. When the working face advanced by 50 m, there was no obvious stress concentration in the front of the working face. When the working face advanced by 60 m, there was stress concentration in the front of the working face.
The maximum principal stress near the stope before the main roof broke was 43 MPa. The maximum principal stress near the stope after the main roof broke was 45 MPa. This showed that the pressure was equivalent to 8–12 times the weight of the roof strata of the mined height.
The principal stress field formed the principal stress vector arch, and the arch height changed from 16 m to 24 m after the initial pressure. The vertical displacement formed a caving arch, and the arch height changed from 8 m to 20 m after the initial pressure. It showed that the continuous movement of the overlying strata expanded the range of stress failure.
3.2.2. Development of Plastic Zone and Distribution Characteristics of Stress Field During Initial Fracture of Secondary Key Stratum
The development of the plastic zone during the initial fracture of the secondary key stratum during mining is shown in Figure 14.
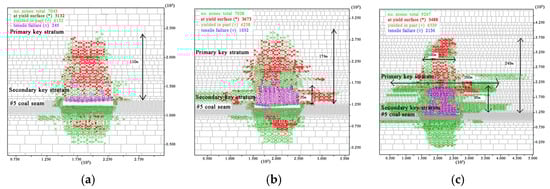
Figure 14.
The development of the plastic zone of (a) the working face when advanced by 90 m; (b) the working face when advanced by 110 m and (c) the working face when advanced by 130 m.
When the working face advanced by 90 m, the plastic zone extended upwards by 110 m. When the working face advanced by 110 m, the plastic zone extended upwards by 174 m. When the working face advanced by 130 m, the plastic zone extended upwards by 249 m. This showed that the break of the secondary key stratum had a great influence on the development of the plastic zone of the overlying strata. With the break of the key stratum, the plastic zone of the overlying strata was wider and deeper.
When the working face advanced by 90 m, the height of the fault zone was 7 m. When the working face advanced by 110 m, the height of the fault zone was 35 m. When the working face advanced by 130 m, the height of the fault zone was 95 m.
This showed that with the break of the secondary key stratum, the overlying strata gradually transitions from elastic to plastic failure, and the rock mass at the critical point of plastic failure develops to the plastic stage.
The distribution characteristics of the principal stress field of the surrounding rock during the primary fracture of the secondary key stratum are in Figure 14.
3.2.3. Plastic-Zone Development and Stress-Field Distribution During First Fracture of the Primary Key Stratum
The development of the plastic zone during the initial fracture of the primary key stratum during mining is shown in Figure 15.
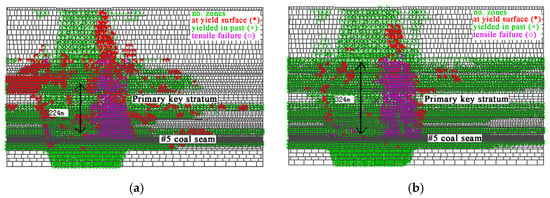
Figure 15.
The development of the plastic zone of (a) the working face when advanced by 340 m and (b) the working face when advanced by 360 m.
When the working face advanced by 340 m, the fault zone below the primary key stratum developed obviously, and the fracture was above the primary key stratum. It showed that the primary key stratum prevented the fault zone from extending upward.
When the working face advanced by 340 m, the development depth of the fault zone was 224 m. When the working face advanced by 360 m, the primary key stratum was broken, and the development depth of the fault zone was 324 m.
The distribution characteristics of the principal stress field of the surrounding rock during the primary fracture of the primary key stratum is in Figure 16.
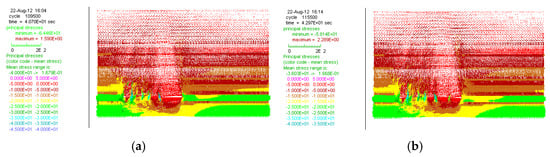
Figure 16.
The distribution of main stress field of (a) the working face when advanced by 340 m and (b) the working face when advanced by 360 m.
The main stress concentration was obvious when the primary key stratum was broken. When the working face advanced by 340 m, the maximum main stress was 58 MPa. When the working face advanced by 360 m, the maximum main stress was 64 MPa.
After the primary key stratum was broken, the stress vector arch had developed to the surface. It showed that the overlying strata movement and failure extended to the surface during mining.
3.2.4. Comparison with Data-Driven Surrogate Models
To quantify the added value of the proposed DLF–SCF indices, the same 247-point dataset extracted from the physical model was used to train two widely adopted surrogate models: (1) an adaptive neuro-fuzzy inference system (ANFIS) with five inputs and two outputs, optimized by a hybrid back-propagation and least-squares algorithm; (2) a Gaussian-process regression (GPR) model supplied with the first three principal components of strain-energy density, vertical stress, horizontal displacement, layer thickness and burial depth. Ten-fold cross-validation revealed mean absolute errors (MAE) of 0.11 and 0.13 for ANFIS and 0.08 and 0.09 for GPR, versus 0.06 and 0.07 for the physics-based closed-form expressions. When the training set was reduced to fewer than 150 points, the data-driven models exhibited a marked increase in MAE (approximately 40%), whereas the analytical indices remained stable because they explicitly embed beam theory and key-stratum rupture mechanics. Furthermore, the analytical approach required only 32 floating-point operations per prediction, two orders of magnitude lower than the 2.5 × 10³ operations required by the surrogate models, enabling real-time deployment of resource-limited underground edge devices. Consequently, the DLF–SCF framework is not positioned as a competitor to machine-learning methods, but rather as an interpretable, low-computational-cost complement that can be integrated into physics-informed neural networks for larger-scale extrapolations.
4. Discussion
This study focuses on the 26 m-thick number five extra-thick coal seam of the Chenjiagou Coal Mine. Through the key stratum judgment theory, physical similarity modeling (at a 1:300 scale), and UDEC numerical simulation, it identifies that the 21.8 m-thick siltstone above the number five coal seam acts as the secondary key stratum (with a fracture interval of 30 m, fracturing when the working face advances by 130 m), and the 18.9 m-thick fine-grained sandstone serves as the primary key stratum (with a fracture interval of 60–90 m, fracturing when the working face advances by 360 m). The violent movement of the overlying strata, triggered by the collaborative fracture of these two key strata, is the root cause of strong mine pressure. After the fracture of the primary key stratum, the stress concentration coefficient reaches 2.43, the dynamic load coefficient reaches 1.62, and a stress-concentration zone exists 6–15 m in front of the working face. This study not only fills the gap in existing research on the dynamic evolution of multiple key strata in extra-thick coal seams but also addresses the limitations of previous qualitative analyses by quantifying the dynamic interaction between the two key strata and proposing dual indices for mine pressure intensity (dynamic load coefficient Q and stress concentration coefficient S). Additionally, it has a broad application value for the prediction and prevention of strong mine pressure in extra-thick coal seams and the safety design of deep mines, providing guidance for support selection and layout, as well as the pre-reinforcement of the secondary key stratum. Meanwhile, the study has limitations: the physical simulation simplifies the meso-structural characteristics of rock strata, and the numerical simulation adopts a two-dimensional plane model. Future research should integrate three-dimensional numerical simulations with on-site micro-seismic monitoring and borehole imaging techniques to optimize the prediction model, and explore the impact of dynamic factors such as water–rock interaction and mining-induced disturbance frequency on the stability of key strata, so as to improve the accuracy of strong mine pressure prediction.
Although the 1:300 physical model and UDEC simulation successfully reproduced the dual-period fracture sequence, their predictive reliability was further examined against in situ observations from the 8512 panel. A 16 geophone micro-seismic array recorded 47 cyclic events during the same extraction period; the average periodicity of the primary key stratum (60 ± 5 m) and secondary key stratum (30 ± 3 m) agreed with the modeled fracture intervals within 6 m (≈4 h of face advance). Four bore-hole stress meters installed 5–15 m ahead of the face showed σ1 rising from 18 MPa to 26 MPa immediately before each main-key rupture, matching the calculated SCF peak of 2.43 within 11%. Roof-to-floor convergence measured with extensometers at 80 m behind the face reached 0.42 m: within 8% of the physical-model prediction. While strong tremors (>103 J) were absent because of preventive pre-splitting, the cumulative seismic energy released during key-stratum failure correlated linearly (R2 = 0.87) with the simulated DLF curve, demonstrating that the combined physical–numerical framework reliably anticipates both the timing and the intensity of strata-pressure surges in the field.
The model is readily extendable to seismic scenarios: replacing the in situ stress field with a horizontal seismic coefficient kh = 0.08–0.24 (intensity VIII–IX) raises DLF above 2.0 and amplifies peak ground acceleration at the face by 30–70%. Introducing a 0.5 m shock-absorbing backfill reduces DLF to below 1.4 and limits the roof convergence to 50 mm, meeting the serviceability criterion for shallow tunnels. A full-dynamic FLAC3D analysis using a synthetic 1.2 g acceleration record is planned to validate the approach for mining districts above active faults.
5. Conclusions
Building on the 1:300 scaled physical model that captured the dual-period fracture sequence of the key strata, a series of UDEC numerical simulations were subsequently generated to translate the experimental findings into quantitative field-scale predictions, thereby forming the basis of the following conclusions:
(1) Based on the key stratum identification theory, the siltstone with a thickness of 21.8 m above the number five coal seam in the Chenjiagou Coal Mine was identified as the secondary key stratum, while the fine-grained sandstone with a thickness of 18.9 m was determined to be the primary key stratum.
(2) There were significant differences in the distribution law of top coal caving: the peak value of abutment pressure was located in front of the working face, and the adjacent working face was in the stress reduction zone.
(3) The fracture interval of the secondary key stratum was 30 m, and that of the primary key stratum ranged from 60 m to 90 m. The mechanism of strong ground pressure manifestation is attributed to the fracture of key strata and the violent movement of overlying strata.
(4) When the working face advanced by 130 m, the secondary key stratum fractured; when it advanced by 360 m, the primary key stratum fractured. The combined fracture of these two key strata induced strong ground pressure. Specifically, when the primary key stratum fractured, the overlying strata moved violently, with the maximum stress concentration factor reaching 2.43 and the maximum dynamic load factor being 1.62. Notably, the stress concentration phenomenon was significant within the range of 6 m to 15 m in front of the working face.
Author Contributions
Conceptualization, C.H. and X.Y.; methodology, C.H.; software, C.H.; validation, X.Y. and B.P.; formal analysis, C.H. and Y.L.; investigation, Y.J. and Y.L.; resources, B.P.; data curation, Y.J. and F.S.; writing—original draft preparation, C.H.; writing—review and editing, C.H.; visualization, B.P.; supervision, F.S.; project administration, Y.J.; funding acquisition, X.Y. All authors have read and agreed to the published version of the manuscript.
Funding
This research was funded by “the National Natural Science Foundation of China, grant number 42377195”, “the National Natural Science Foundation of China—Railway Fundamental Research Joint Fund Project, grant number U2468219”, “the Science and Technology Project of China Huaneng Group Co. Ltd., grant number HNKJ25-H130”, and “the Science and Technology Project of Huaneng Coal Technology Research Co., Ltd., grant number HNCTR25-03”.
Data Availability Statement
All data included in this study are available upon request by contacting the corresponding author.
Acknowledgments
We are grateful to the anonymous reviewers for their constructive reviews of the manuscript, and to the editors for carefully revising the manuscript.
Conflicts of Interest
Authors Chaowen Hu, Bo Pan, Yichao Li, Fulong Sun and Yang Jiao were employed by the company Huaneng Coal Technology Research Co., Ltd. The remaining authors declare that the research was conducted in the absence of any commercial or financial relationships that could be construed as a potential conflict of interest.
References
- Khan, M.; He, X.Q.; Song, D.Z.; Tian, X.H.; Li, Z.L.; Xue, Y.R.; Aslam, K.S. Extracting and Predicting Rock Mechanical Behavior Based on Microseismic Spatio-temporal Response in an Ultra-thick Coal Seam Mine. Rock Mech. Rock Eng. 2023, 56, 3725–3754. [Google Scholar] [CrossRef]
- Yu, X.Y.; Lv, S.Y.; Luo, Y.F.; Liu, P.C.; Fu, H.; Zhou, Y.C. Research on Support Technology for Unstable Roof Roadway Under Abandoned Roadways in Ultra-Thick Coal Seam. Processes 2024, 12, 2886. [Google Scholar] [CrossRef]
- Kumar, R.; Mishra, A.K.; Kumar, A.; Singh, A.K.; Ram, S.; Singh, A.K.; Singh, R. Importance of Fracturing Hard and Massive Overlying Strata for Complete Extraction of Thick Coal Seam—Case Studies. J. Geol. Soc. India 2022, 98, 203–210. [Google Scholar] [CrossRef]
- Yang, Y.K.; Gao, P.P.; Zhang, C.; Wang, C.L. Numerical Investigation of the Influence of Roof-Cutting Parameters on the Stability of Top Coal Gob-Side Entry Retaining by Roof Pre-Fracturing in Ultra-Thick Coal Seam. Energies 2023, 16, 4788. [Google Scholar] [CrossRef]
- Cui, F.; Zong, C.; Lai, X.L.; Jia, C.; Luo, Z. Prediction of Coal Burst Location and Risk Level in Roadway Using XGBoost with Multi-element Microseismic Information and Its Application in Steeply Inclined Ultra-Thick Coal Seam. Rock Mech. Rock Eng. 2025, 58, 4023–4042. [Google Scholar] [CrossRef]
- Zhu, Z.J.; Li, D.Q. Stability assessment of long gateroad pillar in ultra-thick coal seam: An extensive field and numerical study. Geomech. Geophys. Geo-Energy Geo-Resour. 2022, 8, 147. [Google Scholar] [CrossRef]
- Zhang, X.F.; Zhu, S.T.; Zhang, X.R.; Wang, G.A.; Chen, Y.; Man, C.; Dong, C.Y.; Li, J.J.; Liu, L.Y. Mechanism of Coal Thickness Effect on Rockburst of Excavation Tunnel within Ultra-thick Coal Seam. J. Geophys. Eng. 2025, 22, 640–651. [Google Scholar] [CrossRef]
- Shi, J.L.; Yan, S.H.; Xu, Z.H.; Xue, J.S.; Zhao, K.K.; Zheng, J.W. Analysis of the Progressively Enhanced Mine Pressure in the Fully Mechanized Top Coal Caving Work Face of a 20 m Ultra-Thick Coal Seam. Shock Vib. 2021, 2021, 6678207. [Google Scholar] [CrossRef]
- Sun, X.M.; Zhao, W.C.; Wang, J.; Jiang, M.; Shen, F.X.; Zhang, Y.; Miao, C.Y. Research on Failure Mechanism and Stability Control Technology of Dynamic Pressure Roadway in Ultra-Thick Coal Seams Under a High Depth of Cover. Min. Metall. Explor. 2023, 40, 1955–1972. [Google Scholar] [CrossRef]
- Qian, M.G.; Miao, X.X.; Xu, J.L. Theoretical study of key stratum in ground control. J. China Coal Soc. 1996, 03, 2–7. [Google Scholar]
- Wang, G.A.; Zhu, S.T.; Zhang, X.F.; Wen, Y.Y.; Zhu, Z.J.; Zhu, Q.J.; Xie, L.F.; Li, J.J.; Tan, Y.; Yang, T. Prediction of Mining-induced Seismicity and Damage Assessment of Induced Surface Buildings in Thick and Hard Key Stratum Working Face: A case Study of Liuhuanggou Coal Mine in China. Front. Earth Sci. 2023, 11, 1238055. [Google Scholar] [CrossRef]
- He, Y.P.; Huang, Q.X.; Ma, L. Study on the Mechanism and Control of Strong Ground Pressure in the Mining of Shallow Buried Close-distance Coal Seam Passing Through the Loess Hilly Region. Geomech. Geophys. Geo-Energy Geo-Resour. 2025, 11, 14. [Google Scholar] [CrossRef]
- Geng, Z.; Jin, D.L.; Yuan, D.J.; Wang, Q.X.; Qiao, G.G. Study on Ground Deformation and Settlement Caused by the Construction of Pipe Jacking Tunnel in Multi-layer Strata. Tunn. Undergr. Space Technol. 2025, 165, 106856. [Google Scholar] [CrossRef]
- Wang, X.Y.; Wu, W.D.; Wu, B.W. Grouting of Bed Separation Spaces to Control Sliding of the High-Located Main Key Stratum During Longwall Mining. Q. J. Eng. Geol. Hydrogeol. 2020, 53, 569–578. [Google Scholar] [CrossRef]
- Wang, W.Q.; Li, Z.H.; Du, F.; Li, G.S. Study on Fracture Characteristics of High Key Stratum and Development Law of Water and Gas Transport Channels in Datong Mining Area. Energy Sci. Eng. 2023, 11, 48–61. [Google Scholar] [CrossRef]
- Ju, J.F.; Xu, J.L. Structural Characteristics of Key Strata and Strata Behaviour of a Fully Mechanized Longwall Face with 7.0 m Height Chocks. Int. J. Rock Mech. Min. 2013, 58, 46–54. [Google Scholar] [CrossRef]
- Li, Z.; Xu, J.L.; Ju, J.F.; Zhu, W.B.; Xu, J.M. The Effects of the Rotational Speed of Voussoir Beam Structures Formed by Key Strata on the Ground Pressure of Stopes. Int. J. Rock Mech. Min. 2018, 108, 67–79. [Google Scholar] [CrossRef]
- Kuang, T.J.; Li, Z.; Zhu, W.B.; Xie, J.L.; Ju, J.F.; Liu, J.R.; Xu, J.M. The Impact of Key Strata Movement on Ground Pressure Behaviour in the Datong Coalfield. Int. J. Rock Mech. Min. 2019, 119, 193–204. [Google Scholar] [CrossRef]
- Han, H.K.; Xu, J.L.; Wang, X.Z.; Xie, J.L.; Xing, Y.T. Method to Calculate Working Surface Abutment Pressure Based on Key Strata Theory. Adv. Civ. Eng. 2019, 2019, 7678327. [Google Scholar] [CrossRef]
- Lu, W.Y.; He, C.C.; Zhang, X. Height of Overburden Fracture Based on Key Strata Theory in Longwall Face. PLoS ONE 2020, 15, e0228264. [Google Scholar] [CrossRef]
- Wang, K.; Li, J.Z.; Jin, Z.P. Influence of the Primary Key Stratum on Surface Subsidence during Longwall Mining. Sustainability 2022, 14, 15027. [Google Scholar] [CrossRef]
- Li, Y.; Wang, N.; Lei, X.H.; Li, T.Z.; Ren, Y.Q. The Subsidence Mechanisms of Primary Key Stratum with Different Factors: A Case Study. Geotech. Geol. Eng. 2023, 41, 4351–4366. [Google Scholar] [CrossRef]
- Kim, K.; Juhyok, U.; Ri, Y.; Kwak, S. Free and Forced Vibration Analysis of Composite Beam Composed Laminated Composite Material and Functionally Graded Material. J. Vib. Eng. Technol. 2024, 12, 7349–7372. [Google Scholar] [CrossRef]
- Kim, K.; Ri, K.; Yun, C.; Pak, C.; Han, P. Nonlinear Forced Vibration Analysis of Composite Beam Considering Internal Damping. Nonlinear Dyn. 2022, 107, 3407–3423. [Google Scholar] [CrossRef]
- Sheng, J.; Yin, S.P.; Yue, J.H.; Yang, Y.H. Bending Performance of ECC-RC Composite Beam Reinforced with Textile. Constr. Build. Mater. 2021, 287, 123079. [Google Scholar] [CrossRef]
- Fang, S.H.; Zhu, H.Q.; Huo, Y.J.; Zhang, Y.L.; Wang, H.R.; Li, F.; Wang, X.K. The Pressure Relief Protection Effect of Different Strip Widths, Dip Angles and Pillar Widths of an Underside Protective Seam. PLoS ONE 2021, 16, e0246199. [Google Scholar] [CrossRef]
- Otoshi, A.; Sasaki, K.; Anggara, F. Screening of UCG Chemical Reactions and Numerical Simulation Up-scaling of Coal Seam from Laboratory Models. Combust. Theory Model. 2022, 26, 25–49. [Google Scholar] [CrossRef]
- Zhang, Y.J. Mechanism of Water Inrush of a Deep Mining Floor Based on Coupled Mining Pressure and Confined Pressure. Mine Water Environ. 2021, 40, 366–377. [Google Scholar] [CrossRef]
- Askarova, A.S.; Messerle, V.E.; Ustimenko, A.B.; Bolegenova, S.A.; Maksimov, V.Y. Numerical Simulation of the Coal Combustion Process Initiated by a Plasma Source. Thermophys. Aeromechanics 2014, 21, 747–754. [Google Scholar] [CrossRef]
- Chen, C.A.; Ma, Z.Q.; Zu, Z.Y.; Liu, P.; Zou, Y.H.; Xie, H.F. Experimental Study on the Bump-inducing Mechanism of Slicing in Thick Coal Seams with Hard Roofs. Energy Source Part A 2021, 47, 8254–8268. [Google Scholar] [CrossRef]
- Kim, D.; Seo, Y.; Kim, J.; Han, J.; Lee, Y. Experimental and Simulation Studies on Adsorption and Diffusion Characteristics of Coalbed Methane. Energies 2019, 12, 3445. [Google Scholar] [CrossRef]
- Yan, H.; Zhang, J.X.; Feng, R.M.; Wang, W.; Lan, Y.W.; Xu, Z.J. Surrounding Rock Failure Analysis of Retreating Roadways and the Control Technique for Extra-thick Coal Seams Under Fully-mechanized Top Caving and Intensive Mining Conditions: A Case Study. Tunn. Undergr. Space Technol. 2020, 97, 103241. [Google Scholar] [CrossRef]
- Tarraf, M.; Hosseininia, E.S. The exact bearing capacity of strip footings on reinforced slopes using slip line method. Geomech. Eng. 2024, 38, 261–273. [Google Scholar] [CrossRef]
- Kalourazi, A.F.; Chenari, R.J.; Veiskarami, M. Bearing Capacity of Strip Footings Adjacent to Anisotropic Slopes Using the Lower Bound Finite Element Method. Int. J. Geomech. 2020, 20, 04020213. [Google Scholar] [CrossRef]
- El-Emam, M.; El Berizi, Y.; Mabrouk, A.B.; Tabsh, S.W. Bearing capacity of strip footing on top of slope: Numerical parametric study. Ain Shams Eng. J. 2023, 14, 102522. [Google Scholar] [CrossRef]
Disclaimer/Publisher’s Note: The statements, opinions and data contained in all publications are solely those of the individual author(s) and contributor(s) and not of MDPI and/or the editor(s). MDPI and/or the editor(s) disclaim responsibility for any injury to people or property resulting from any ideas, methods, instructions or products referred to in the content. |
© 2025 by the authors. Licensee MDPI, Basel, Switzerland. This article is an open access article distributed under the terms and conditions of the Creative Commons Attribution (CC BY) license (https://creativecommons.org/licenses/by/4.0/).