Article

Electro-Oxidation of Biofloc Aquaculture Effluent Through a DoE-Driven Optimization in a Batch Reactor

by
Ever Peralta-Reyes
1,
Gina Gómez-Gómez
1,
Alfredo Gallardo-Collí
1,
Juan F. Meraz
1,
Carlos Iván Pérez-Rostro
2,
Patricio J. Espinoza-Montero
3,* and
Alejandro Regalado-Méndez
1,*
1
Universidad del Mar, Campus Puerto Ángel, San Pedro Pochutla 70902, Oaxaca, Mexico
2
Tecnológico Nacional de México, Instituto Tecnológico de Boca del Rio, Boca del Río 94290, Veracruz, Mexico
3
Escuela de Ciencias Químicas, Pontificia Universidad Católica del Ecuador, Quito 170525, Ecuador
*
Authors to whom correspondence should be addressed.
Processes 2025, 13(11), 3377; https://doi.org/10.3390/pr13113377
Submission received: 23 September 2025 / Revised: 16 October 2025 / Accepted: 20 October 2025 / Published: 22 October 2025

Abstract

In this study, wastewater generated from tilapia biofloc aquaculture was treated using the electro-oxidation (EO) process in a batch reactor. Optimal reaction conditions were determined through a robust screening design based on a Taguchi L9 (34) orthogonal array. The evaluated parameters included three anode–cathode configurations—boron-doped diamond with titanium (BDD–Ti), BDD with copper (BDD–Cu), and BDD with BDD—as well as current intensity (1–2 A), initial pH (5.5–11.5), and treatment time (2.5–3.5 h). The EO process exhibited high removal efficiencies for key water quality indicators. Under optimal conditions (BDD–Ti, i = 2 A, t = 3.5 h, pH0 = 11.5), removal efficiencies of 96.57% for chemical oxygen demand (COD), 99.06% for total ammoniacal nitrogen (TAN), 67.68% for turbidity, and 81.09% for total organic carbon (TOC) were obtained. Phytotoxicity and bioassay tests further confirmed the detoxification potential of the treated effluent. Overall, the proposed green treatment approach demonstrates that EO is a viable and sustainable strategy for improving effluent quality and advancing water management in intensive aquaculture systems.

Graphical Abstract

1. Introduction

Food scarcity has become a global challenge, worsened by the reduction in arable land and limited water resources. In this context, aquaculture and hydroponic systems have established themselves as alternatives to help ensure food security. It is estimated that by 2030, around 60% of the fish consumed worldwide will be produced through aquaculture [1].
The rapid expansion of aquaculture has markedly increased the generation of effluents enriched with nutrients and organic matter, primarily derived from uneaten fish feed. When discharged without treatment, these effluents can trigger eutrophication and foster the proliferation of harmful organisms, such as toxic algal blooms [2].
The waste stream, characterized by its high protein content, contains phosphorus and nitrogen in various forms (ammonium, nitrite, and nitrate), together with suspended solids, chemical oxygen demand (COD), total organic carbon (TOC), and biochemical oxygen demand (BOD) [3,4,5]. The accumulation of these compounds not only deteriorates water quality within culture systems but also undermines the sustainability and circularity of aquaculture practices [2].
Historically, wastewater from aquaculture has been treated through biological, physical, and chemical approaches, often applied in combination. Biological methods rely on microorganisms to metabolize nutrients, whereas physical processes remove contaminants via filtration or sedimentation. Chemical treatments, in turn, transform pollutants into less harmful by-products. Among these, advanced oxidation processes (AOPs) are notable for their ability to mineralize recalcitrant pollutants into carbon dioxide, water, and inorganic acids [6], or alternatively, generate value-added products.
Within this framework, advanced oxidation electrochemical processes (AOEPs) have attracted increasing attention owing to their high efficiency, relatively low operating costs, and minimal need for chemical reagents—attributes that align well with the principles of green chemistry [7].
Among AOEPs, electrochemical oxidation (EO), also referred to as “electrochemical combustion,” has emerged as particularly effective because it enables the mineralization of organic compounds into CO2, water, and inorganic salts. This process is driven by the generation of physisorbed hydroxyl radicals (OH) at the anode surface.
M + H 2 O M O H + H + + e
The strong oxidizing power of OH (E0 = 2.80 V vs. SHE) and its high reactivity enable rapid attack on a wide spectrum of organic compounds, including recalcitrant and emerging pollutants. These reactions proceed through successive dehydrogenation or hydroxylation steps, ultimately leading to complete mineralization into CO2 and, concomitantly, to the disinfection of pathogenic microorganisms [8]. BDD anodes are regarded as the most efficient electrodes for EO, owing to their exceptional ability to generate large quantities of OH, which act as powerful, non-selective oxidants [9]. Consequently, electrochemical processes—particularly EO—are considered promising technologies for the treatment of aquaculture effluents, offering high efficiency, low operating costs, and short treatment times [1].
In this context, several studies have investigated the application of electrochemical processes for aquaculture wastewater treatment, employing both batch and flow reactors. Notably, two studies have reported the use of EO in batch reactor configurations. In the first, synthetic and real aquaculture wastewaters were treated using an anode composed of atomically dispersed iron sites on nitrogen-doped carbon (Fe-SAs/N-C) coupled with a graphite cathode. This system achieved ammoniacal nitrogen removal efficiencies of 99.3% for synthetic wastewater and 96.7% for real aquaculture wastewater [10]. The second study focuses on the removal of ammonia from aquaculture and synthetic wastewater using a PtRu/graphite anode and a graphite cathode. The results indicate that the ammonia removal rates for both real and synthetic wastewater are quite comparable, achieving complete removal within 30 min [11].
In addition, three studies have examined the application of EO to synthetic aquaculture seawater, seawater, and real aquaculture wastewater collected from a semi-commercial tilapia recirculating aquaculture system (RAS) using flow reactor configurations. In the first study, ammonia and COD were targeted using two BDD electrodes, achieving removal efficiencies of 99% for ammonia and 90% for COD [3]. The second study investigated the removal of TAN from synthetic seawater using a Ti/RuO2 anode coupled with a Ti cathode, resulting in complete TAN removal within 40 min [12]. The third study evaluated the EO of aquaculture wastewater from a tilapia RAS, employing a Ti/RuO2–IrO2 anode and a graphite cathode, and achieved 78% TAN removal together with 95% nitrite removal [13].
Collectively, these studies demonstrate the high effectiveness of EO for the removal of TAN, COD, ammonia, and nitrite. However, the majority of investigations have relied on synthetic aquaculture wastewater, which does not fully reflect the complexity of real effluents. Moreover, no optimization studies have yet been reported for the EO treatment of aquaculture wastewater, despite their importance for accurately estimating energy consumption (EC) and operating costs at industrial scale.
Response surface methodology (RSM) is a widely applied statistical approach for process optimization, relying on structured experimental design. Its effectiveness depends strongly on the choice of design framework—such as Central Composite, Box–Behnken, or Plackett–Burman—that provides the experimental basis for predictive model development and efficient optimization. In parallel, the Taguchi design represents a robust parameter optimization strategy. Its key advantage lies in minimizing the influence of uncontrollable factors (noise), thereby reducing variability in system responses [14].
In this study, the Taguchi design considering all factors as categorical was applied to optimize the electro-oxidation of wastewater from an intensive tilapia biofloc system using a batch reactor. The effects of initial pH, applied current intensity, reaction time, and cathode material were investigated using an L9 orthogonal array (34). The Taguchi experimental design was employed to identify the optimal operating conditions for maximizing the removal efficiency of COD, turbidity, TAN, and TOC. In addition, operating costs were evaluated, and the toxicity of the treated effluent was assessed to ensure both environmental and economic feasibility.

2. Materials and Methods

2.1. Reagents and Equipment

Wastewater samples were obtained from a biofloc tilapia farming system located at the Aquaculture Laboratory of Universidad del Mar, Campus Puerto Ángel, Oaxaca, Mexico. Prior to discharge into the environment, the wastewater was collected and pre-filtered using a 40 μm sieve. For TOC analysis, an additional filtration step was performed with a 0.45 μm Acrodisc filter to ensure sample preparation.
Sodium sulfate (Na2SO4, 0.1 M, 99% purity; Karal, Mexico) was employed as the supporting electrolyte. The pH was adjusted using sodium hydroxide (NaOH, 0.1 M, 97% purity) and sulfuric acid (H2SO4, 0.1 M, 95% purity), both obtained from Sigma-Aldrich. pH measurements were performed with a Hanna HI2210 potentiometer(Hanna Instruments Inc. Woonsocket, RI, USA). The electrodes were powered using a GW Instek GPR-3510HD power supply (Test Equipment Depot, Melrose, MA, USA). The initial physicochemical properties of the biofloc tilapia wastewater used in this study are summarized in Table 1.

2.2. Experimental Set-Up

EO experiments were carried out in a batch reactor with a total working volume of 500 mL (Figure 1). A BDD electrode was used as the anode, while the cathode material varied depending on the experimental run and consisted of BDD, Cu, or Ti. The electrodes were positioned 1 cm apart, each with a geometric surface area of 16 cm2. Uniform mixing was maintained with a magnetic stirrer operating at 400 rpm.
Samples were collected at the beginning and end of each run according to the Taguchi design to determine the optimal operating conditions. The influence of process variables on these conditions was further assessed using the method of steepest ascent implemented in Design-Expert v10 software. Validation was performed by conducting an additional experiment under the identified optimal conditions, during which samples were withdrawn at regular intervals to determine the reaction order. All experiments were conducted at ambient temperature (25 ± 1.0 °C).

2.3. Analytical Methods

The concentration of TAN was determined spectrophotometrically using a Multiparameter Photometer for Water and Wastewater HI83300 (Hanna Instruments Inc. Woonsocket, RI, USA), following the adapted Nessler method as described in the ASTM Manual of Water and Environmental Technology (D1426). Chemical oxygen demand (COD) was measured according to the procedure reported in reference [15]. Once the optimal operating conditions were established, TOC was quantified before and after EO treatment using a Shimadzu TOC-L CPH analyzer to evaluate the degree of mineralization. The removal efficiencies of COD, TAN, and turbidity were calculated using Equation (2) [16].
R ( % ) = Z i n Z f i n Z i n × 100
where Zin and Zfin are the initial and final values for COD, TAN, and turbidity.

2.4. Taguchi Experimental Design

To investigate the influence of key operating factors, an experimental design based on a Taguchi L9 (34) orthogonal array considering all factors as categorical was employed. This design comprised nine experimental runs and allowed the evaluation of four factors, each at three levels: initial pH (5.5–11.5), applied current intensity (1–2 A), reaction time (2.5–3.5 h), and cathode material (BDD, Ti, Cu). For the analysis, all factors were treated as categorical variables. The performance of each run was evaluated in terms of the percentage removal of COD, TAN, and turbidity [17,18]. The factors and their corresponding levels are summarized in Table 2.

2.5. Operating Cost

The operating cost (OC) was calculated using Equation (6), which considers the prices of both energy and electrolyte. The energy cost reflects the consumption by the electrodes and stirring. Energy consumption is determined using Equations (3)–(5).
E electrode = U × i × t
E stirring = P n × t
E C = E electrode + E s t i r r i n g
O C = λ E C + ϕ m e l e c t r o l y t e
where EC is the total energy consumption in kWh, U is the electrical potential (Volts (V)), i is the applied current intensity (A), t is the electrolysis time (h), Eelectrode is the electrical energy consumed by the electrodes, Estirring is the electrical energy consumed by the agitation grid, Pn is the power of the agitation grid, obtained from the supplier’s catalog (1.2 kW), the Operating Cost is the total operating cost, λ is the price of electricity (0.052 USD/kWh) according to the Federal Electricity Commission (CFE) for the 1B tariff in Mexico, ϕ is the price of the electrolyte (38.79 USD/kg), and melectrolyte is the mass of electrolyte used (0.0071 kg).
S E C kWh / m 3 = E e l e c t r o d e 1000 × V s
Energy consumption per volume of treated solution (Vs (m3)) was determined using Equation (7) [8].

2.6. Phytotoxicity and Bioassays Test

2.6.1. Phytotoxicity

The phytotoxicity of tilapia farming wastewater was studied before and after electrochemical treatment under optimal conditions, using mung beans (Vigna radiata) in accordance with the technique described in [19].
In an experiment conducted over ten days, mung bean seeds were sown in containers at a density of thirty seeds per container. Each container was irrigated daily with 10 mL of water type. The water treatments included tap water, distilled water, untreated wastewater, wastewater containing sodium sulfate, and treated wastewater. Afterward, the length of the stems and roots was measured. Also, the germination percentage of the bean seeds was determined using Equation (8).
G P % = N S G N S S × 100
where GP is the germination percentage, NSG is the number of germinated seed beans, and NSS is the total number of seed beans sown.

2.6.2. Bioassays with Artemia Salina

The acute toxicity test was performed using Artemia salina, following the methodology outlined in [20], under optimal conditions for the EO process. For the hatching of the cysts, an aquarium was prepared with approximately 500 mL of seawater and around 10 mg of Artemia cysts, maintaining constant oxygenation with a mineral bubble diffuser connected to a two-outlet air pump. The incubation conditions were maintained at a temperature of 25–30 °C for 48 h, achieving a hatching rate of 90%.
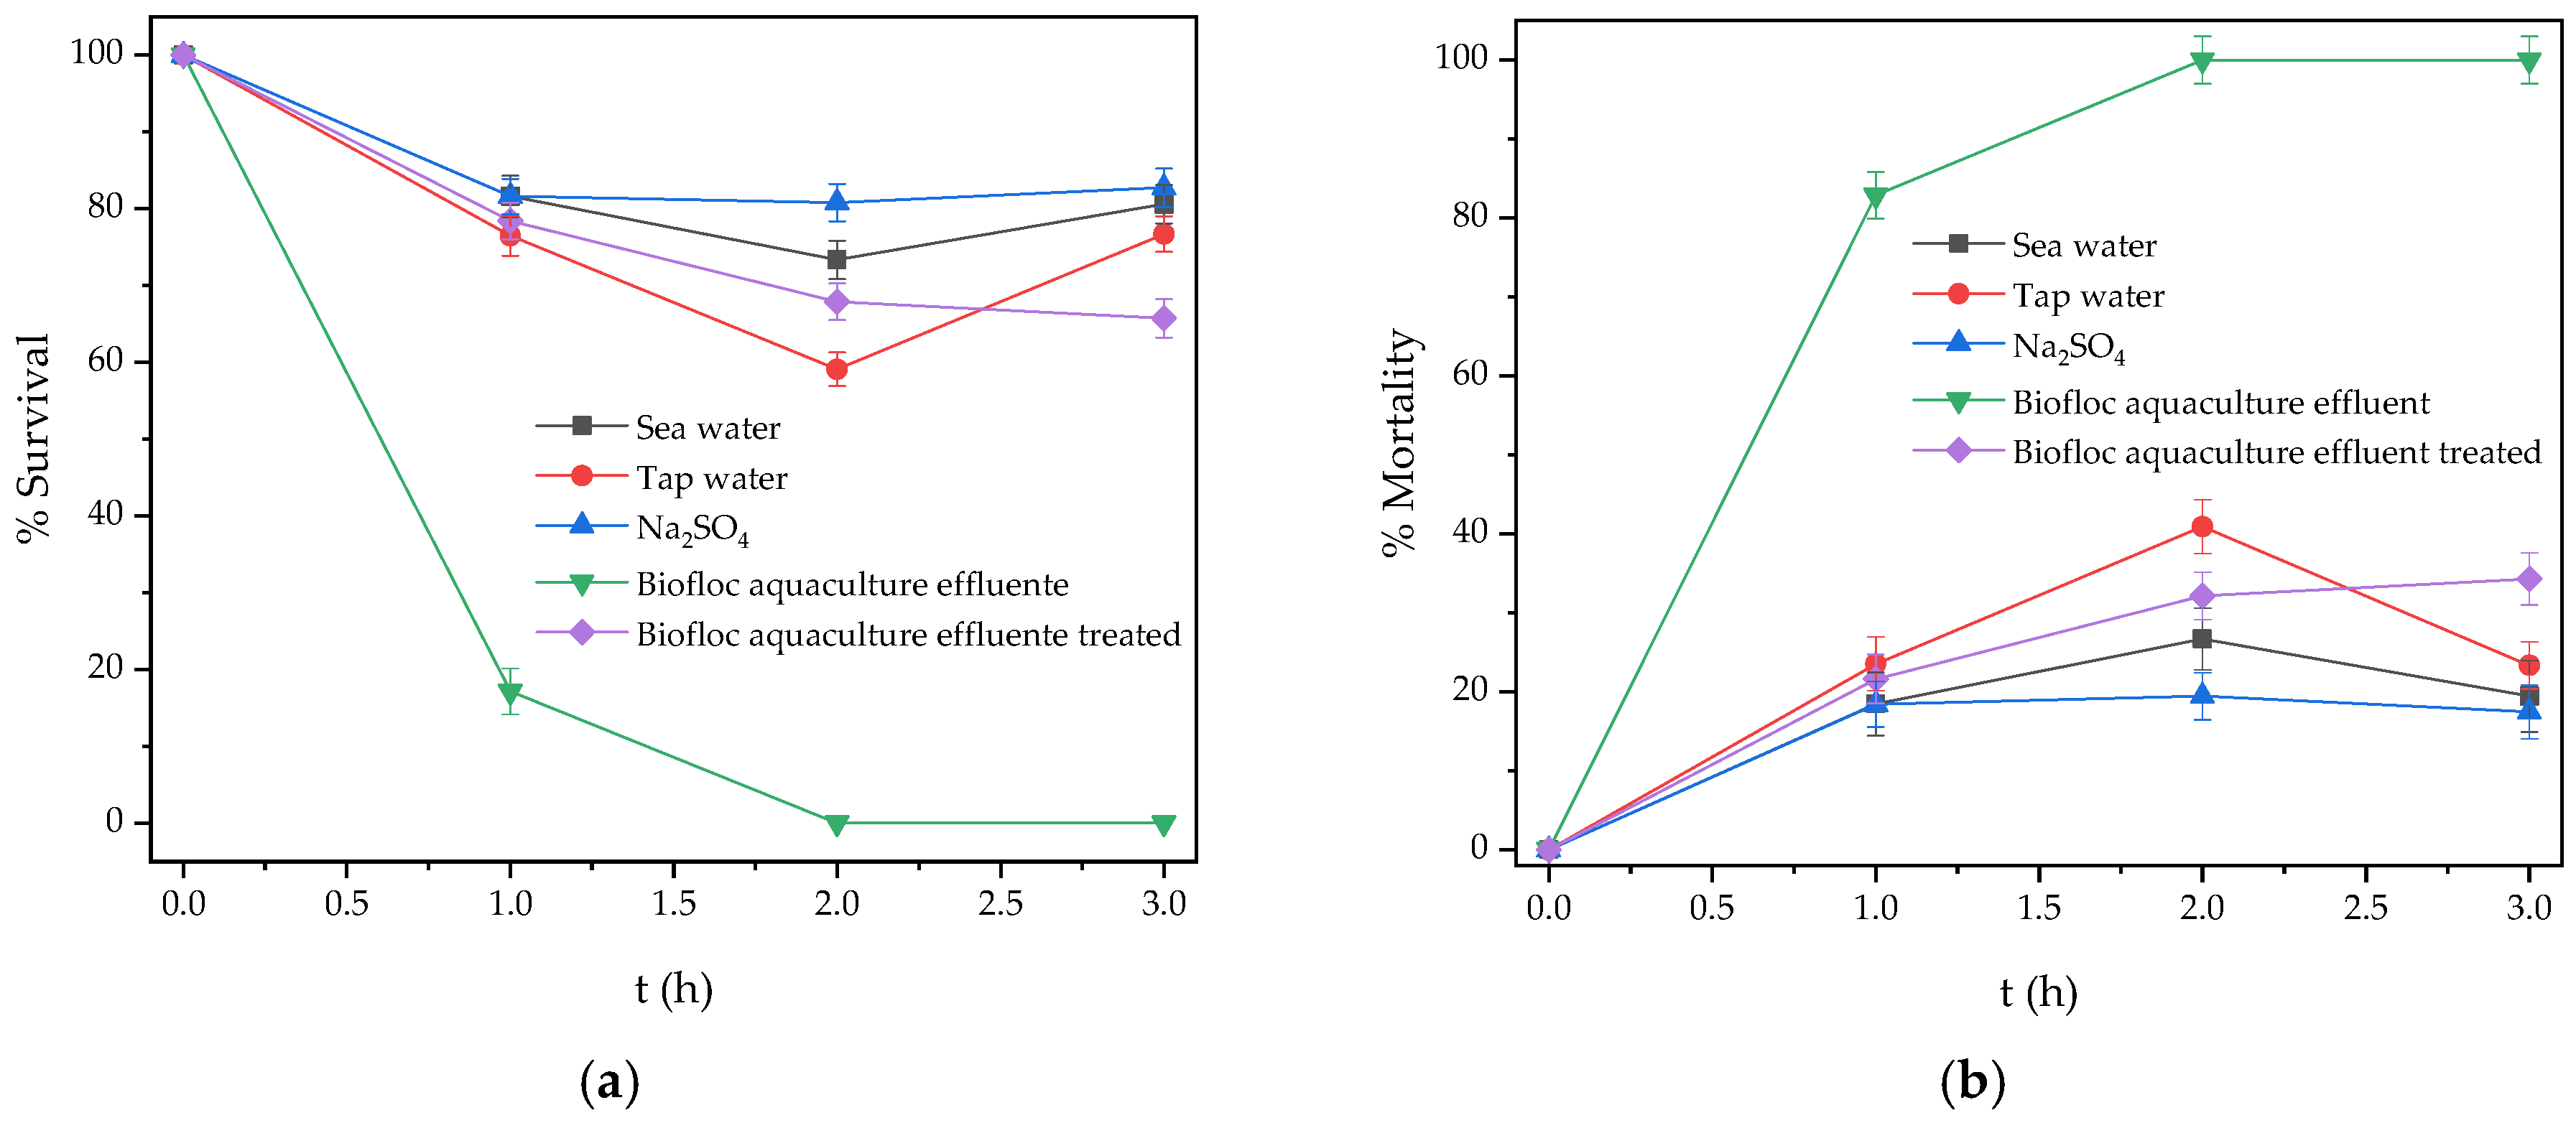
Artemia salina larvae (2.5 mL) were exposed to five test solutions: seawater (control), tap water, a 0.1 M Na2SO4 solution, untreated wastewater, and a treated wastewater sample. For each solution, the exposure lasted for 1, 2, and 3 h. Following each exposure period, live and dead larvae were counted under a stereomicroscope to determine mortality and survival rates. The entire bioassay was performed in triplicate to ensure statistical reliability.
The corresponding percentages for survival and mortality were calculated using Equations (9) and (10), respectively.
Mortality ( % ) = Dead   Larvae Total   Used   Larvae × 100
Survival ( % ) = 100 Mortality

3. Results and Discussion

3.1. Removal of COD, TAN, and Turbidity

The effects of initial pH, applied current, reaction time, and cathode material on the removal of COD, TAN, and turbidity were evaluated using the Taguchi experimental design (Table 3). The results showed that the highest removal efficiencies for COD and TAN were obtained in run 5, with values of 90.68% and 99.01%, respectively. The greatest reduction in turbidity was observed in run 8, achieving a removal efficiency of 75.39%.

3.2. ANOVA Analysis

Table 4 displays the results of the ANOVA test for the experimental data fitted to a linear regression model for COD, TAN, and Turbidity removal. Additionally, the contribution factor test was conducted according to Equation (11) [18].
C o n t r i b u t i o n % = S S A S S T × 100
where SSA is the sum of squares of one variable and SST is the total sum of squares.
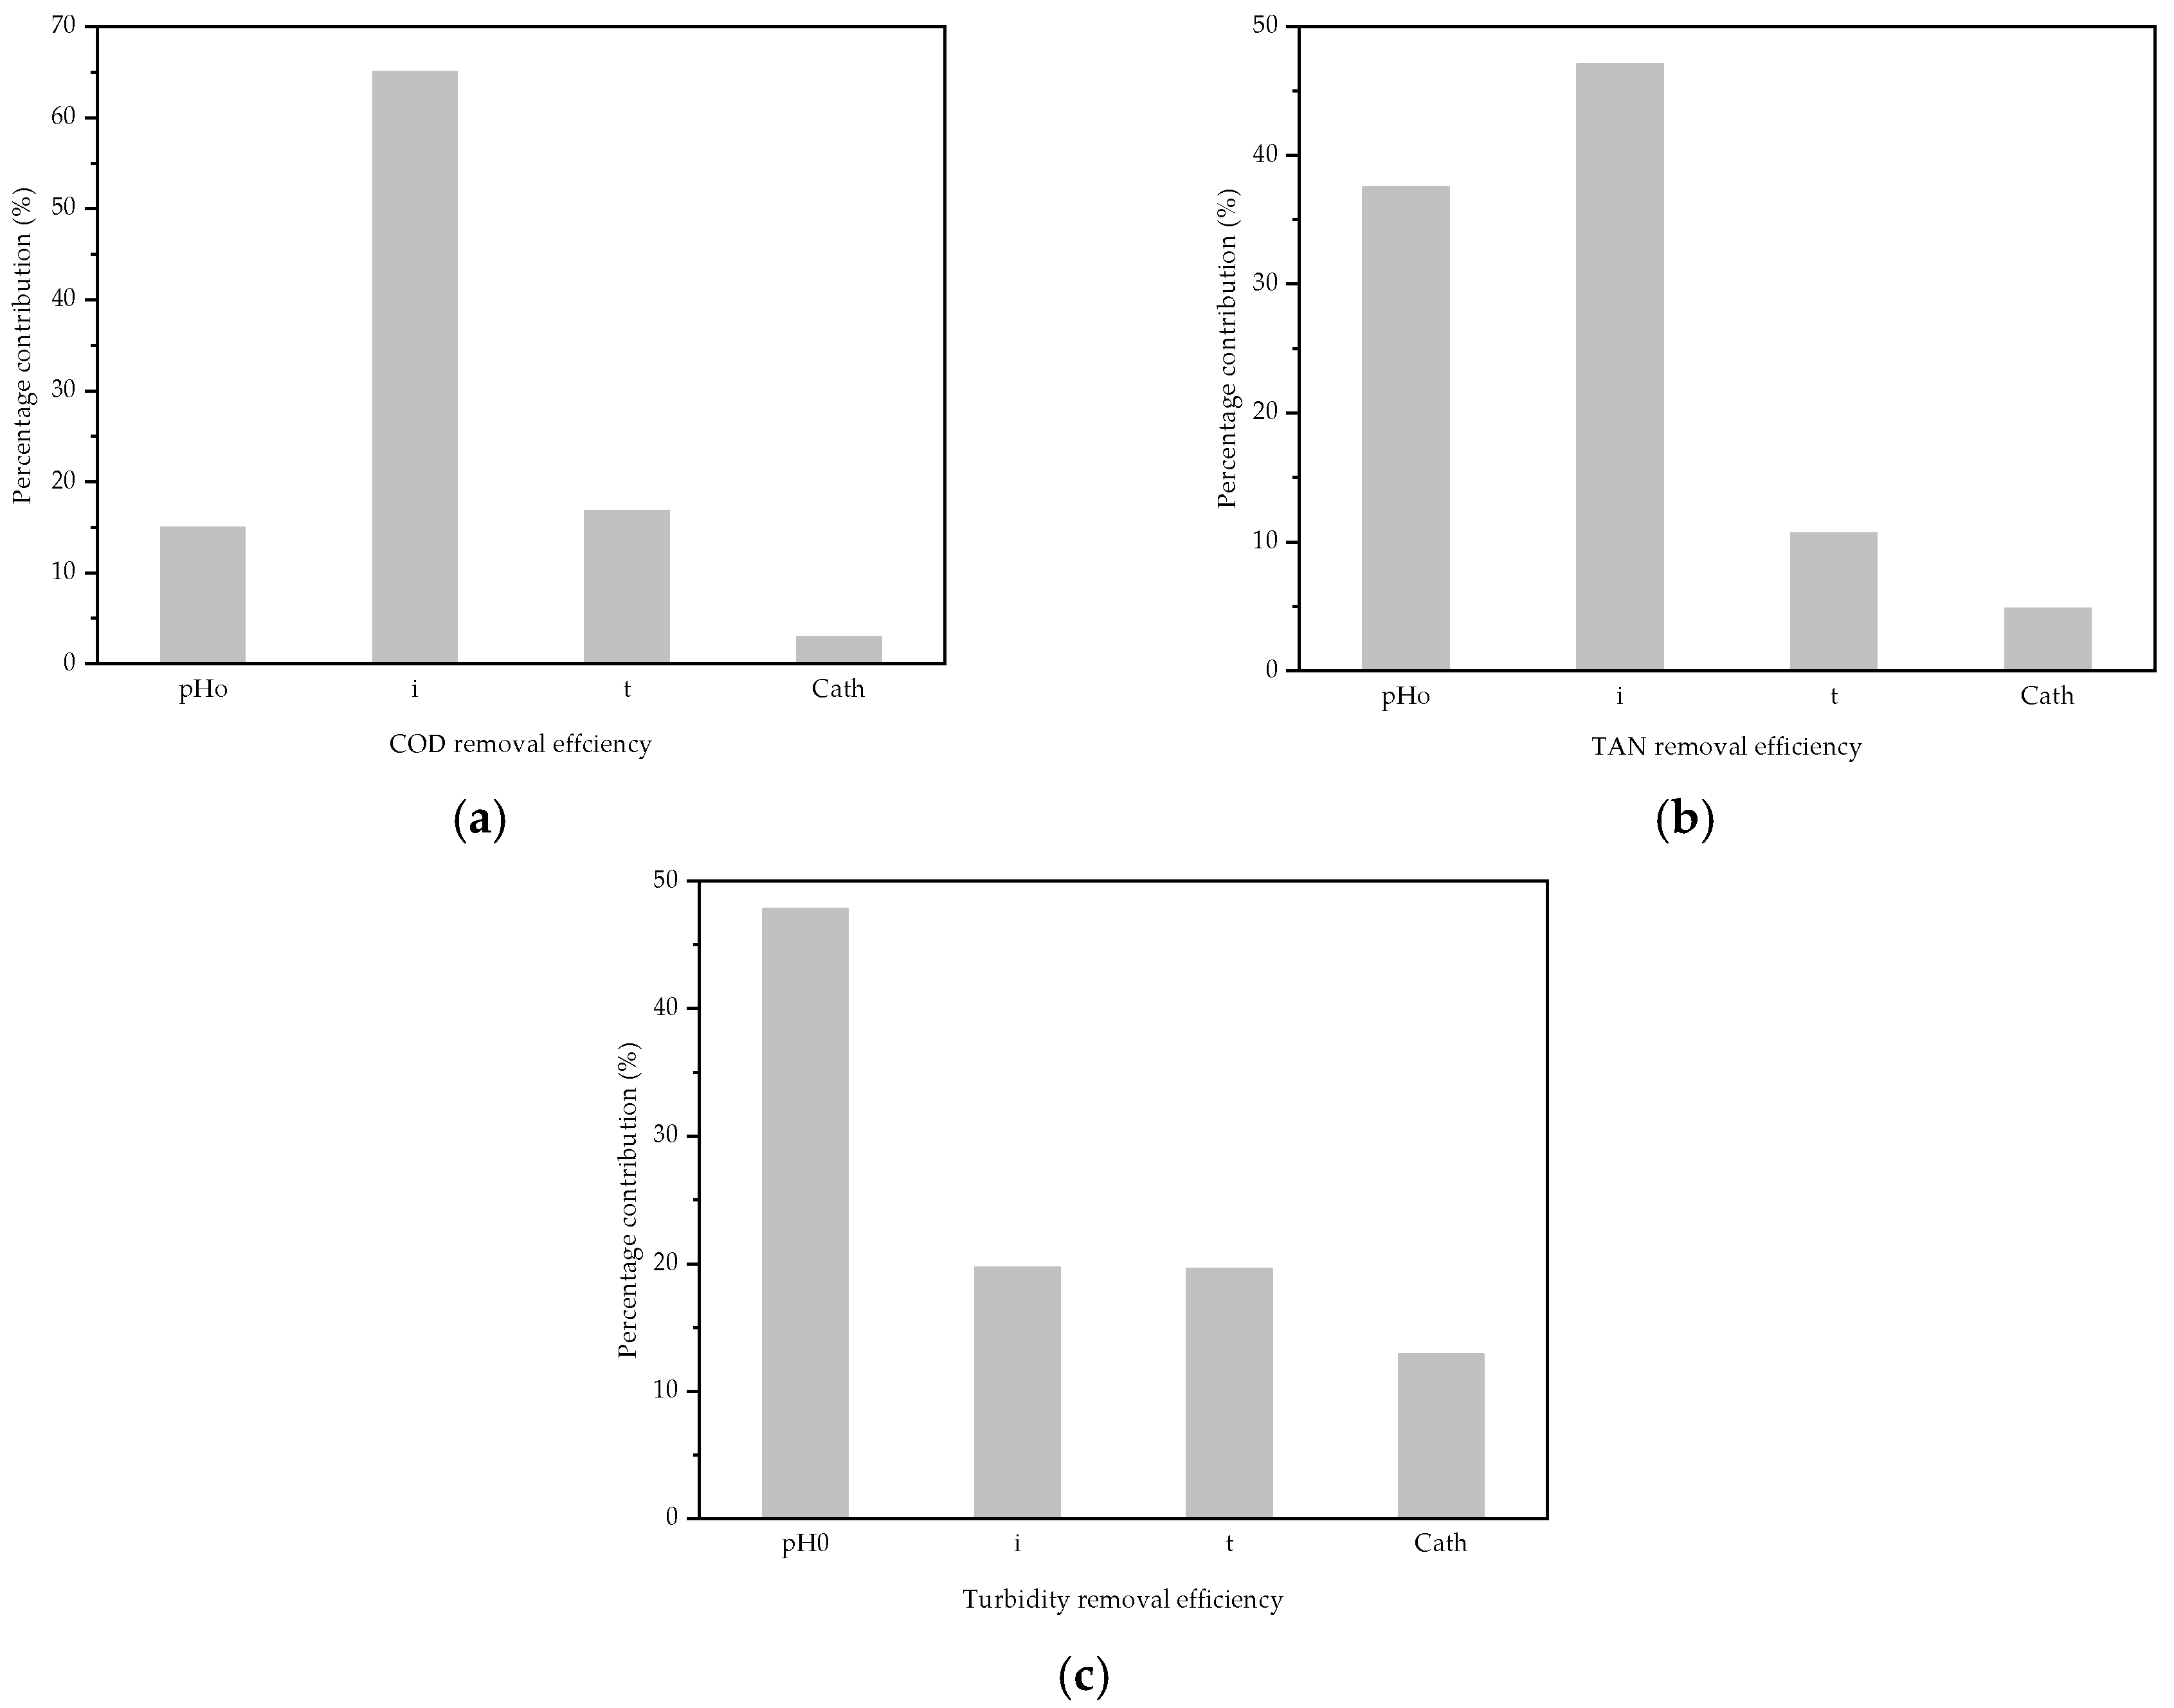
Based on the results presented in Figure 2a, the most significant factor in COD removal is the current (i), which contributes 65.09%, followed by time (t) at 16.83%, initial pH (pH0) at 15.07%, and the cathode, which has the least contribution at 3.0%. For turbidity, Figure 2b illustrates that the primary factor is pH0, contributing 47.79%, followed by the i at 19.70%, t at 19.61%, and the cathode at 12.88%, making it the least important factor. Finally, in terms of TAN removal, as shown in Figure 2c, the most crucial factor is again the i, with a contribution of 47.05%, followed by pH0 at 37.50%, t at 10.63%, and the cathode, which contributes 4.80%.

3.3. Optimization Process

To enhance the efficiency of COD, TAN, and turbidity removal, numerical optimization was conducted using Design Expert V10 software. It was established that all factors and responses were equally important (+++). Table 5 presents the criteria and constraints used in the optimization process. The steepest ascent method was applied to fine-tune the process variables.
The numerical optimization results are shown in Figure 3. It shows that the maximum efficiencies for removing COD, TAN, and Turbidity are 96.57%, 99.06%, and 67.68%, respectively, achieving a desirability score of 0.867. The optimal conditions for this process are a pH0 of 11.5, an applied current of 2 A, a treatment time of 3.5 h, and the use of a titanium cathode.

3.4. Experimental Validation of Optimal Operating Conditions

To verify the reproducibility of the optimal operating conditions, three additional experiments were performed. The average removal efficiencies obtained were 90% for COD, 96.88% for TAN, and 66.35% for Turbidity. The percentage errors for COD (6.98%), TAN (2.20%), and Turbidity (1.95%) were within acceptable limits, confirming good agreement between the predicted and experimental results. This consistency underscores the reliability of the Taguchi design for optimizing complex electrochemical processes.
While a previous study reported complete ammonia removal within 30 min using a PtRu/graphite anode in batch reactors with synthetic water [11], the present work demonstrates the successful application of electro-oxidation to real biofloc wastewater—a more challenging and environmentally relevant matrix for intensive aquaculture. The decay profiles of COD, TAN, and TOC removal efficiencies are illustrated in Figure 4.
The behavior observed in Figure 4 can be attributed to the high availability of OH at elevated current densities, which enhances the oxidation of recalcitrant compounds. In addition, the presence of oxidizing species such as S O 4 and S 2 O 8 2 further promotes the degradation process [21]. With respect to pH, previous studies have shown that under alkaline conditions, larger amounts of OH are generated at the surface of the BDD anode, making pH the second most influential factor in the electro-oxidation process [22].

3.5. Total Operating Cost

The total operating cost was estimated at USD 1.0014 per liter (equivalent to 20.62 MXN at the current exchange rate). This cost accounts for both electricity consumption and electrolyte usage. For industrial-scale applications, energy demand is a critical factor in determining the feasibility of process scale-up.
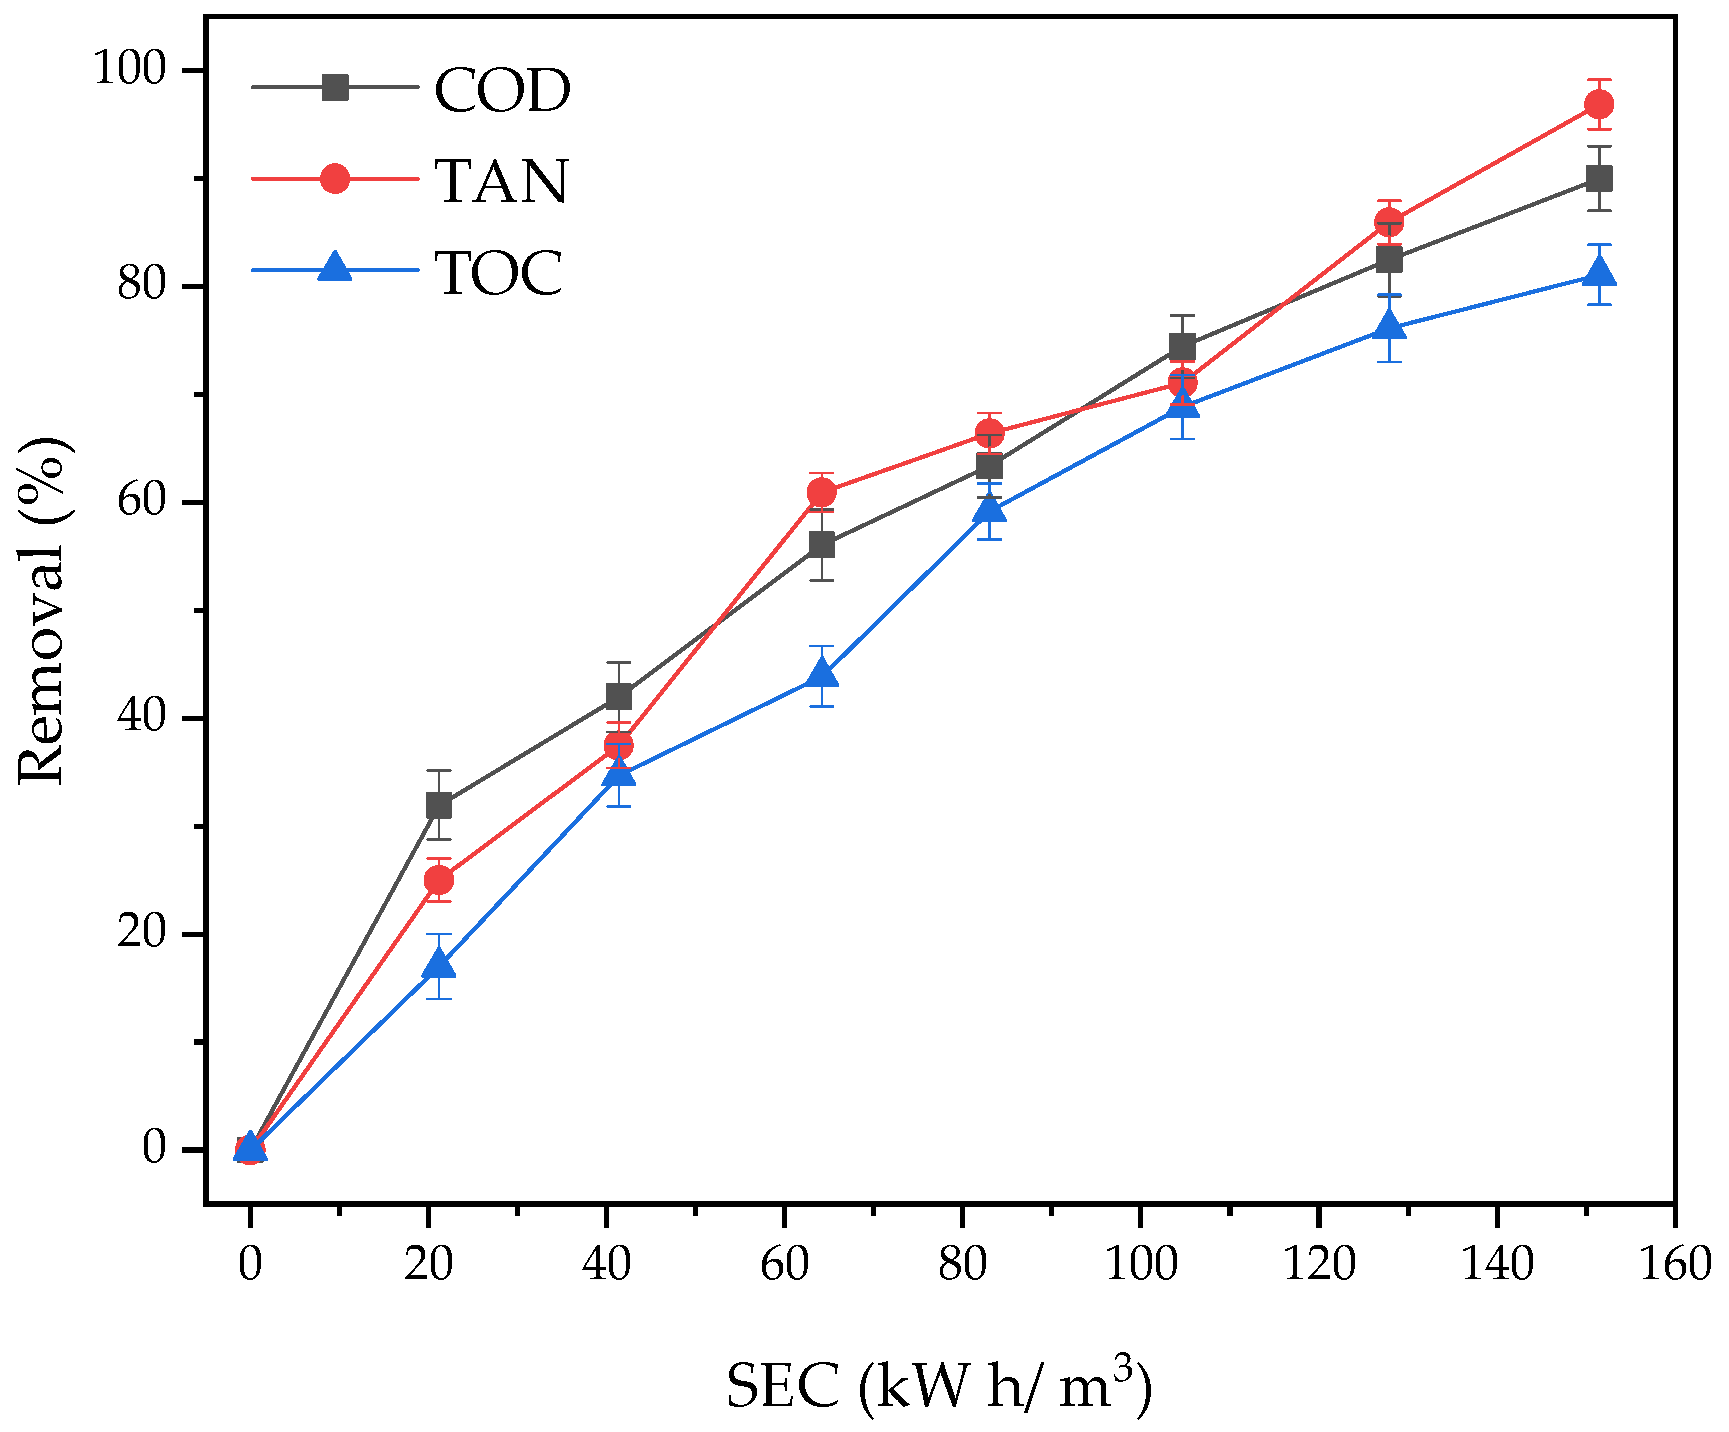
As shown in Figure 5, approximately 150 kWh/m3 were required to achieve removal efficiencies of 90% for COD, 97% for TAN, and 80% for TOC. On this basis, the specific energy consumption (SEC) can be considered acceptable, as it ensures substantial reductions in COD, TAN, and TOC, thereby supporting the scalability of the process. Nevertheless, owing to the high organic matter content characteristic of this wastewater, longer treatment times are necessary to achieve optimal results [23].

3.6. Removal Profiles

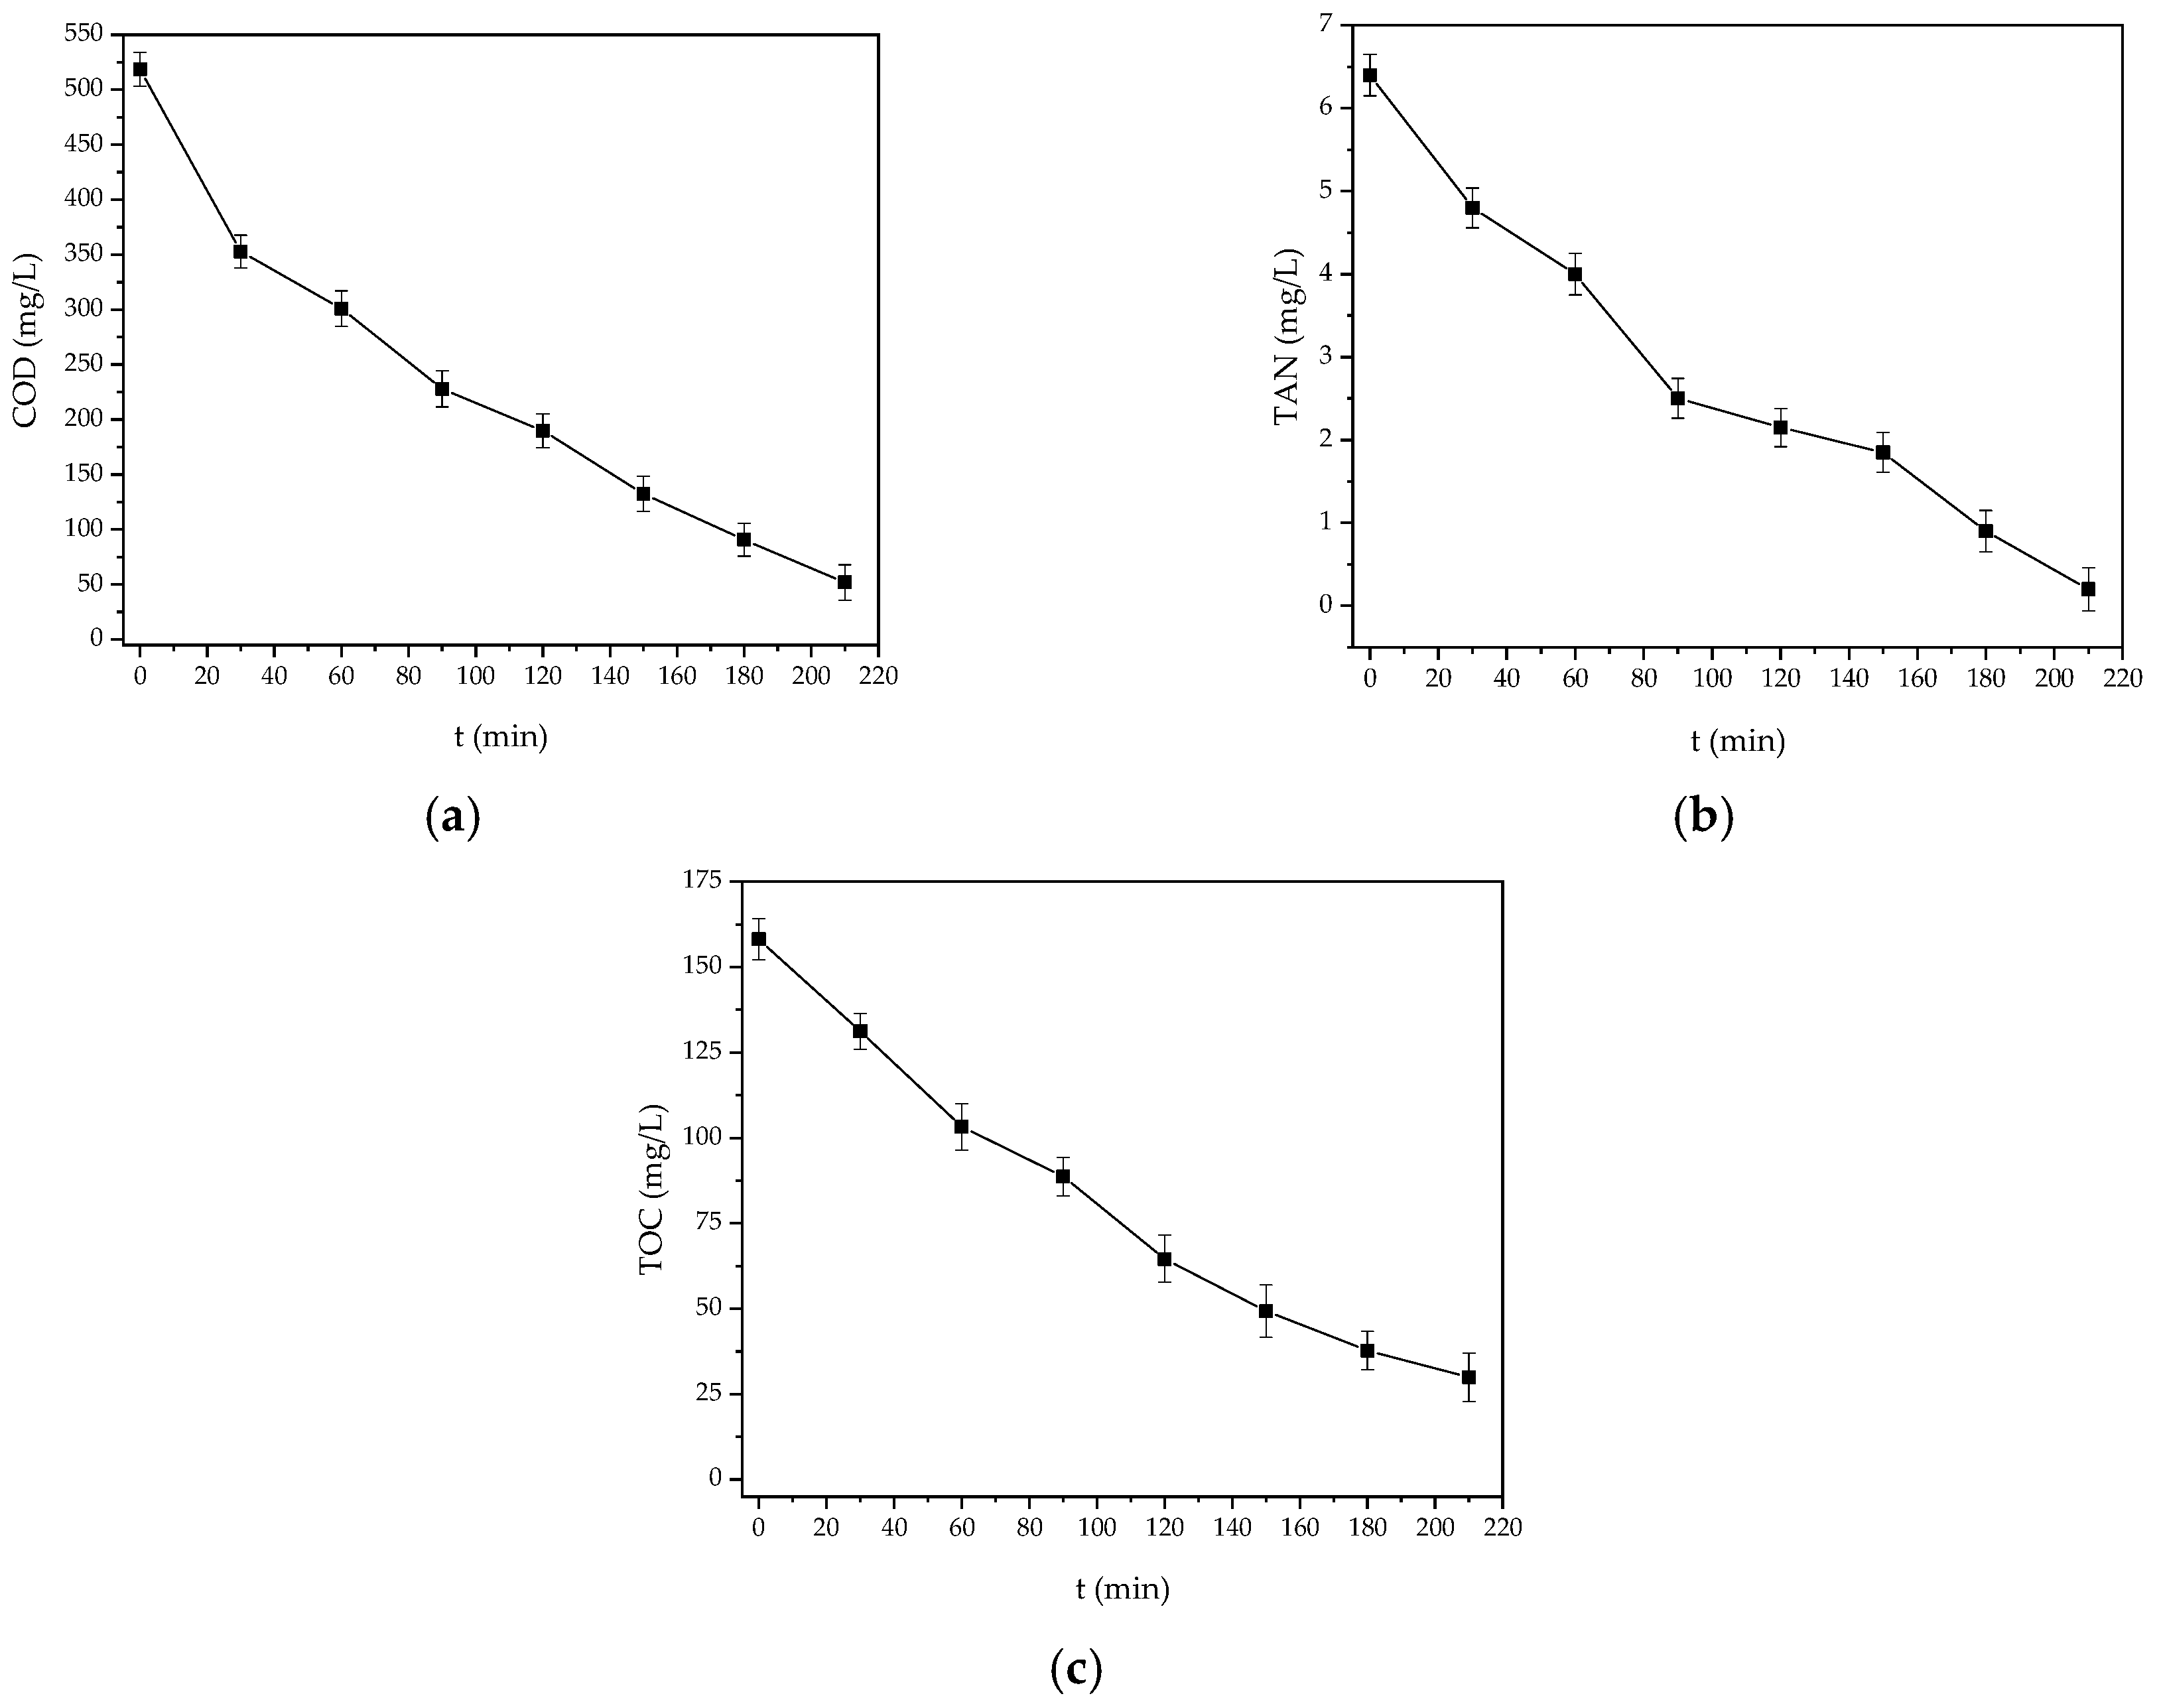
Figure 6 depicts the removal profiles of COD, TAN, and TOC under the optimal operating conditions (pH 11.5, applied current of 2 A, treatment time of 3.5 h, and Ti cathode). As shown in Figure 6a–c, substantial reductions were achieved, with mineralization rates of 90% for COD and 81% for TOC, alongside a 96.88% removal of TAN. The use of a DDB electrode as a non-active anode is particularly advantageous, as its weak interaction with hydroxyl radicals (OH) and high oxygen evolution overpotential favor the direct oxidation of organic compounds by OH radicals [7]. These results provide strong evidence for the effectiveness of this technology in treating real wastewater [21], such as tilapia biofloc aquaculture effluent.
Based on the trends in Figure 6 and Figure S1, the removals of COD and TOC were found to follow pseudo-first-order kinetics, while TAN removal followed pseudo-zero-order kinetics. The corresponding rate constants are summarized in Table 6. These observed reaction orders—pseudo-zero for TAN and pseudo-first for COD—contrast with the second-order and zero-order kinetics reported in prior studies [3]. This discrepancy underscores that these are apparent kinetic orders, heavily dependent on the specific experimental conditions rather than the intrinsic properties of the contaminants. Although TAN removal is often described by second-order kinetics in the literature, our findings confirm that this behavior is not universal. Instead, the apparent reaction order is influenced by multiple factors, including the water matrix composition (e.g., biofloc versus marine systems), electrode material, and reactor design [12]. The goodness-of-fit for the kinetic models of COD, TAN, and TOC (Equations (12)–(14)) was evaluated using the coefficient of determination (R2), with values provided in Table 6. Graphical validations of the model fits are presented in Figure S1.
As shown in Figure 6a,c, the removal of organic matter, indicated by the COD and TOC, exhibits exponential behavior. This kinetic profile is a key indicator that the process is governed by mass transfer rather than reaction kinetics under the established optimal conditions [24,25].
d C O D d t = k C O H k a p p , C O D C O D = k a p p , C O D C O D
d T A N d t = k C O H k a p p , T A N = k a p p , T A N
d T O C d t = k C O H k a p p , T O C T O C = k a p p , T O C T O C

3.7. Mean Oxidation Number of Carbon (MOC)

As illustrated in Figure 4, the treatment process achieved a high degree of mineralization, as evidenced by the substantial reduction in organic load. COD removal reached 90%, exceeding the 81.09% removal observed for TOC. This corresponds to a decrease in COD from 518.52 mg/L to 51.85 mg/L and in TOC from 159.10 mg/L to 30.08 mg/L. The difference in removal efficiencies indicates that a considerable fraction of the organic pollutants present in the biofloc aquaculture effluent was not merely degraded but effectively mineralized. In other words, these compounds were converted into inorganic end products, primarily carbon dioxide (CO2) and water.
To demonstrate the extent of mineralization over time, researchers use the MOC, as outlined in Equation (15) [23].
M O C = 4 1.5 C O D T O C
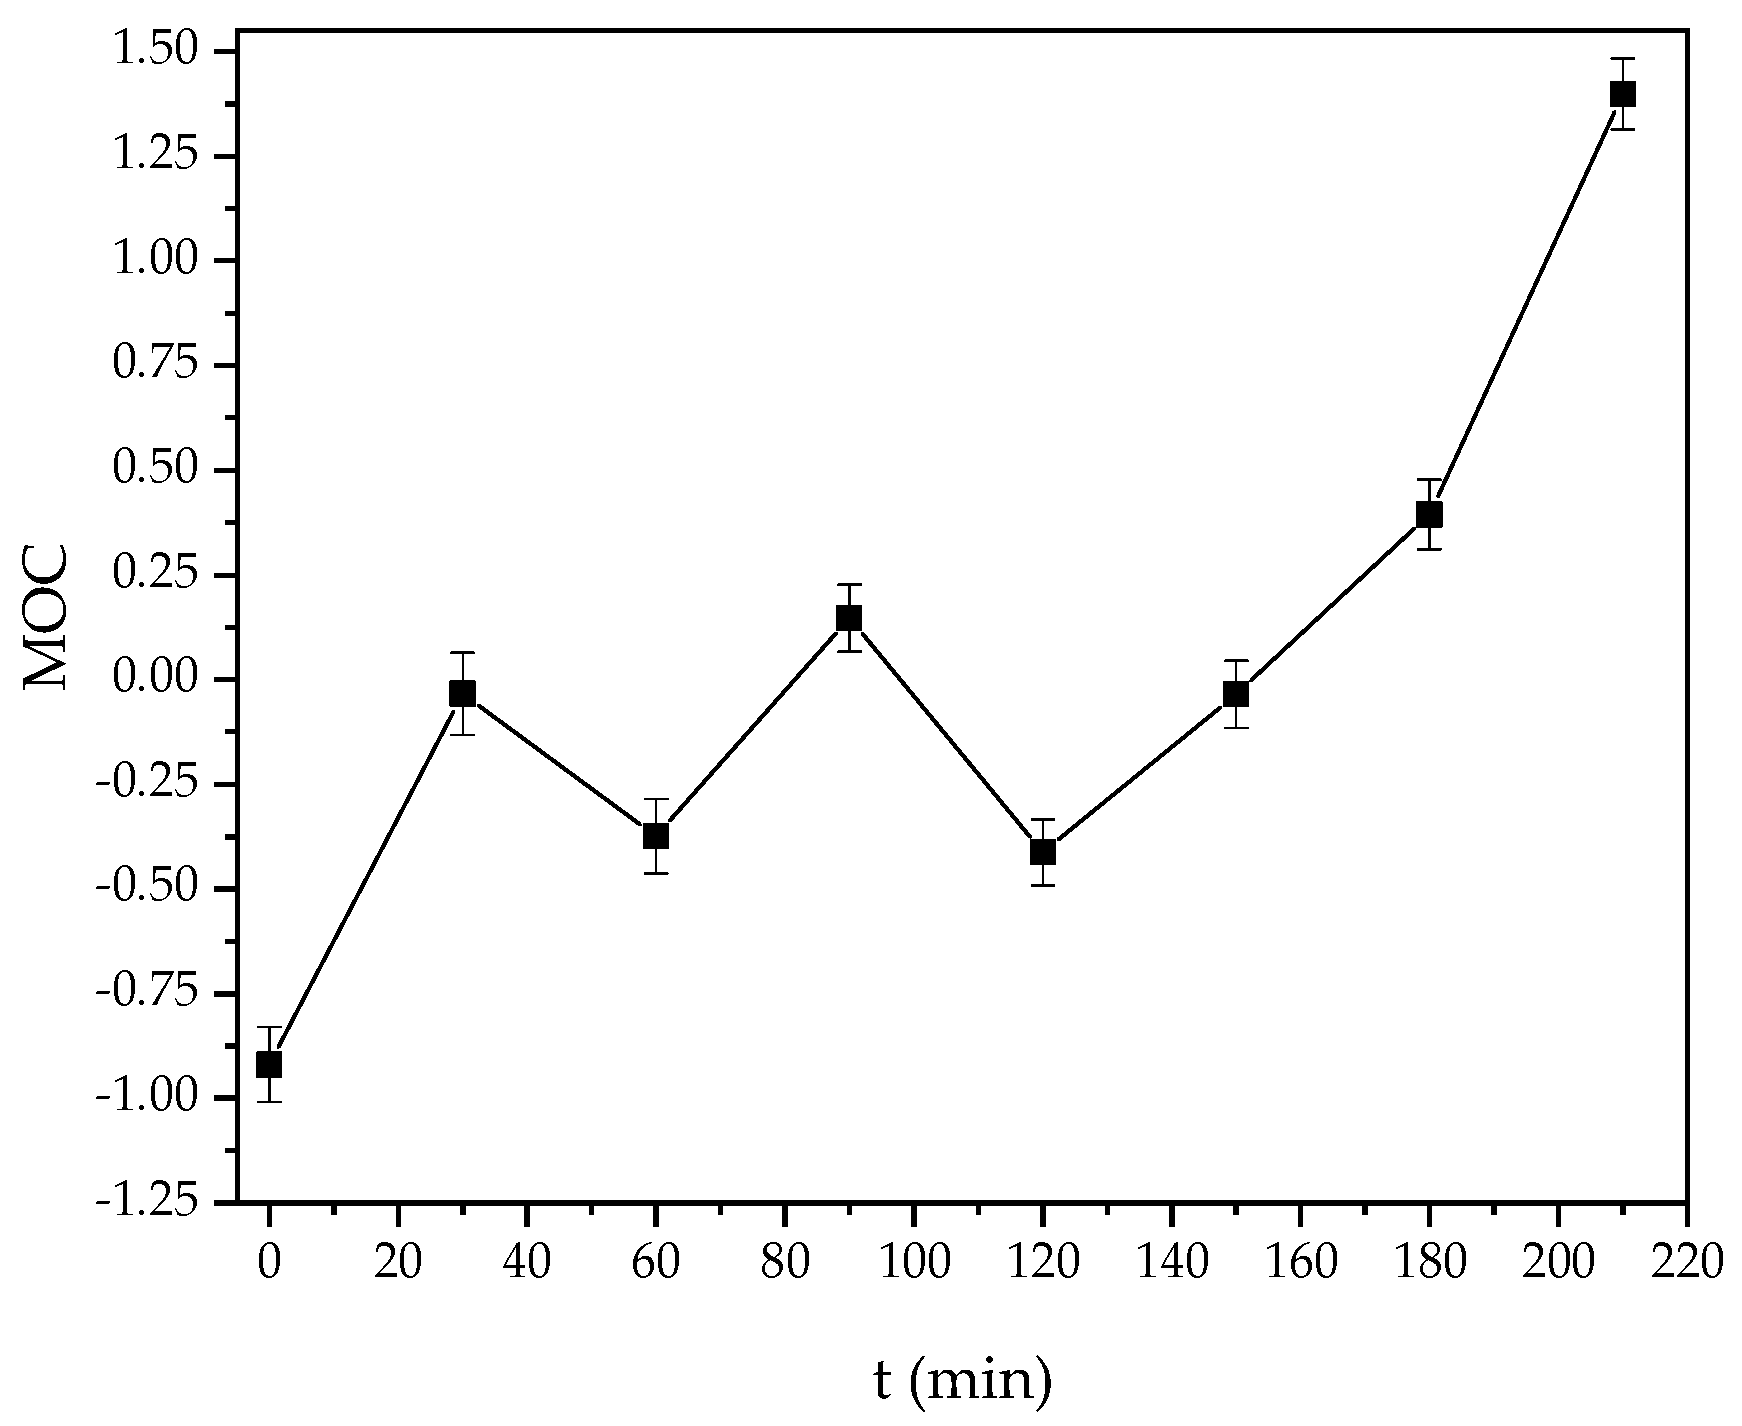
Figure 7 shows that the MOC value increased from −0.91 to approximately +1.4 during treatment. This increase is associated with the formation of intermediate compounds, such as malonic acid [26], which arise as by-products of oxidizing the organic matter present in biofloc aquaculture effluent. Although the proposed EO process effectively reduced COD and TOC concentrations below the discharge limits established by Mexican regulations (NOM-001-SEMARNAT-2021; COD ≤ 150 mg/L, TOC ≤ 38 mg/L), complete mineralization was not achieved. Total mineralization would require an MOC value greater than +3 [23]. For this reason, complementary toxicity studies are currently underway.

3.8. Phytotoxicity Assays Test

Table 7 summarizes the germination and growth performance of Vigna radiata under different irrigation conditions. In effluent treated with 0.1 M Na2SO4, germination reached 86.67%, which was higher than that observed in effluent treated without sulfate (76.76%), but lower than the germination rate of untreated biofloc aquaculture effluent (90%). In comparison, the control treatments with tap water and distilled water exhibited the highest germination rates (93.33%).
With respect to seedling growth, plants irrigated with effluent treated in the presence of sulfate exhibited reduced development, with an average stem length of 1.1 cm and root length of 4.38 cm after 10 days. These values were smaller than those obtained under the control conditions, suggesting that although treatment improved germination relative to sulfate-free effluent, growth remained negatively affected.
According to the results, germination percentage increased by 11.53% when effluent was treated compared to untreated effluent, whereas root length and stem length decreased by 16.10% and 26.67%, respectively. Although the treated effluent complied with the Mexican discharge standard (NOM-001-SEMARNAT-2021; COD ≤ 150 mg/L and TOC ≤ 38 mg/L), achieving COD and TOC values of 51.85 mg/L and 29.9 mg/L, respectively, its residual toxicity was evident in the reduced root and stem growth. These findings are consistent with previous reports [8], which attribute such effects to the persistence of oxidized by-products that maintain residual toxicity even after significant organic matter removal.

3.9. Bioassay Test

A series of five complementary experiments, each performed in triplicate, evaluated the toxicity of Artemia salina under different water sources and exposure times, with the averaged results presented in Figure 8. The findings reveal a pronounced difference between untreated and treated aquaculture effluent. The untreated effluent was completely lethal, with 0% survival and 100% mortality. In contrast, treatment markedly reduced toxicity, achieving a survival rate of 65.7% and a corresponding mortality rate of 34.3%.
For comparison, control water sources—including seawater (80.06% survival, 19.94% mortality), tap water (76.70% survival, 23.30% mortality), and 0.1 M Na2SO4 solution (82.80% survival, 17.20% mortality)—all exhibited significantly higher survival rates than the treated effluent. These results confirm the persistence of residual toxicity, likely attributable to partially oxidized compounds. This interpretation is consistent with earlier findings [20], where wastewater containing Rhodamine B retained toxicity following treatment with photocatalytic nanocomposites.

3.10. Results Comparison with the Literature

Table 8 summarizes selected studies on electrochemical treatments of aquaculture wastewater, including both real and synthetic effluents. In general, previous reports demonstrate high efficiencies in the removal of nitrogen compounds and organic matter; however, none have simultaneously evaluated energy consumption (EC) and operating cost (OC) [10,11], which distinguishes the present work.
Under optimal conditions, the proposed electro-oxidation (EO) process achieved removal efficiencies of 96.57% for COD, 99.06% for TAN, 67.68% for Turbidity, and 81.09% for TOC. These results were obtained with an energy consumption of 150 kWh/m3 and a total operating cost of USD 1.0014/L. The inclusion of EC and OC metrics provides critical insight into the environmental and economic feasibility of the process, particularly for industrial-scale applications.
A comparison with the literature (summarized in Table 8) reveals two key distinctions in the present work: First, the applied current density (0.125 A/cm2) exceeds the previously reported values of 7.5 × 10⁻⁴ A/cm2 and 0.025 A/cm2 [10,11]. Second, the volume of aquaculture effluent treated here (500 mL) is greater than the volumes of 30 mL and 400 mL used in prior studies. It is important to note that the literature primarily targeted nitrogen removal, which may account for the use of milder conditions. The more intensive parameters used here are justified by the broader treatment scope of this work.
This study achieved a cell voltage of 10.74 V, which is significantly higher than the 1.89 V reported in the referenced work [10]. The corresponding voltage profile under optimal operating conditions, presented in Figure S1, confirms this performance. The data are provided to facilitate reproducibility and future scaling efforts by the broader community.
The high operating cell voltage, approximately 10.74 V at 2 A, is primarily attributed to a substantial ohmic drop (I × R). This drop arises from the high ionic resistance associated with the low-conductivity electrolyte, specifically 0.1 M sodium sulfate (Na2SO4), and the 1 cm electrode separation, both selected for this proof-of-concept investigation. A first-order calculation of total cell resistance using Ohm’s Law (R = V/I) yields an estimated value of 5.37 Ω. Consequently, most of the applied voltage compensates for ohmic losses, while the remaining 1–2 V is sufficient to drive the faradaic reactions, such as oxygen evolution and pollutant oxidation, consistent with previously reported values for similar processes [10]. These findings indicate that future efforts to optimize energy efficiency should prioritize reducing ionic resistance.
Compared to prior studies, which have largely focused on removal efficiency under laboratory conditions, this work adds value by addressing both treatment performance and scalability considerations. The findings underscore the suitability of EO for treating complex wastewater matrices, such as biofloc aquaculture effluents, and highlight its potential as a sustainable technology for aquaculture wastewater management.

4. Conclusions

Based on the findings of this study, the following conclusions can be drawn:
  • Electrochemical oxidation proved to be an efficient and effective alternative for the treatment of tilapia biofloc effluent in a batch reactor.
  • The optimal operating conditions were identified as an initial pH of 11.5, a current intensity of 2 A, and a treatment time of 3.5 h using a titanium cathode. Under these parameters, removal efficiencies reached 96.57% for chemical oxygen demand (COD), 67.68% for turbidity, and 99.06% for total ammonia nitrogen (TAN), in compliance with Mexican discharge regulations (NOM-001-SEMARNAT-2021).
  • Phytotoxicity assays using Vigna radiata and bioassays with Artemia salina confirmed significant detoxification of the treated effluent.
  • The process demonstrated an energy consumption of 150 kWh/m3 and an estimated operating cost of USD 1 per liter, suggesting strong potential for scale-up due to expected cost reductions at the industrial level.
  • Overall, the results confirm that electrochemical oxidation is a viable technology for improving aquaculture effluent quality and advancing sustainable water management in intensive farming systems.

Supplementary Materials

The following supporting information can be downloaded at: https://www.mdpi.com/article/10.3390/pr13113377/s1, Figure S1: (a) Kinetic analysis for the pseudo first-order model for COD decay; (b) Kinetic analysis for the pseudo zero-order model for TAN decay; (c) kinetic analysis for the pseudo first-order for the pseudo second-order model for TOC decay. Performed under the optimal operating conditions: pH0 = 11.5, i = 2 A, t = 3.5 h, and Ti cathode; Figure S2: Cell voltage profile under optimal operating conditions. pH0 = 11.5, i = 2 A, t = 3.5 h, and Ti cathode.

Author Contributions

Conceptualization, C.I.P.-R., A.G.-C., E.P.-R., J.F.M., P.J.E.-M. and A.R.-M.; methodology, G.G.-G., J.F.M., E.P.-R. and A.R.-M.; software, A.R.-M.; validation, G.G.-G., E.P.-R. and A.R.-M.; formal analysis, E.P.-R., G.G.-G., P.J.E.-M. and A.R.-M.; investigation, G.G.-G., E.P.-R. and A.R.-M.; resources, E.P.-R., A.G.-C., P.J.E.-M. and A.R.-M.; data curation, J.F.M., A.G.-C., C.I.P.-R. and A.R.-M.; writing—original draft preparation, E.P.-R., G.G.-G. and A.R.-M.; writing—review and editing, E.P.-R., G.G.-G., J.F.M., A.G.-C., C.I.P.-R., P.J.E.-M. and A.R.-M.; visualization, J.F.M., E.P.-R., P.J.E.-M. and A.R.-M.; supervision, E.P.-R. and A.R.-M.; project administration, E.P.-R. All authors have read and agreed to the published version of the manuscript.

Funding

This research received no external funding.

Data Availability Statement

The original contributions presented in this study are included in the article and Supplementary Materials. Further inquiries can be directed to the corresponding authors.

Acknowledgments

Authors Ever Peralta-Reyes, Alferdo Gallardo-Collí, Carlos Iván Pérez-Rostro, and Alejandro Regalado-Mendez would like to express their gratitude to the Secretariat of Science, Humanities, Technology, and Innovation (SECIHTI) for the financial stimulus provided through the National Investigators System (SNII) program. The authors also appreciate the staff of the research, aquaculture, and environmental laboratories for their dedication and efforts in facilitating the materials necessary for this research. Finally, we are grateful to Derek Joe for his thorough proofreading of the text.

Conflicts of Interest

The authors declare no conflicts of interest.

Abbreviations

AnAnode
BDDBoron doped diamond
CatCathode
CEEnergy consumption, kWh
OCOperating cost, USD/L
CODChemical Oxygen Demand, mg/L
CuCopper
EOElectrooxidation
iCurrent intensity, A
pHPotential of hydrogen
SECSpecific energy consumption kWh/g COD
tTime, h
TANTotal Ammoniacal Nitrogen, mg/L
TiTitanium
TOCTotal Organic Carbon, mg/L

References

  1. Bhatt, P.; Huang, J.-Y.; Brown, P.; Shivaram, K.B.; Yakamercan, E.; Simsek, H. Electrochemical Treatment of Aquaculture Wastewater Effluent and Optimization of the Parameters Using Response Surface Methodology. Environ. Pollut. 2023, 331, 121864. [Google Scholar] [CrossRef]
  2. Kashem, A.H.M.; Das, P.; Hawari, A.H.; Mehariya, S.; Thaher, M.I.; Khan, S.; Abduquadir, M.; Al-Jabri, H. Aquaculture from Inland Fish Cultivation to Wastewater Treatment: A Review. Rev. Environ. Sci. Biotechnol. 2023, 22, 969–1008. [Google Scholar] [CrossRef]
  3. Díaz, V.; Ibáñez, R.; Gómez, P.; Urtiaga, A.M.; Ortiz, I. Kinetics of Electro-Oxidation of Ammonia-N, Nitrites and COD from a Recirculating Aquaculture Saline Water System Using BDD Anodes. Water Res. 2011, 45, 125–134. [Google Scholar] [CrossRef] [PubMed]
  4. Wijesekara, R.G.S.; Nomura, N.; Matsumura, M. Electrochemical Removal of Ammonia, Chemical Oxygen Demand and Energy Consumption from Aquaculture Waters Containing Different Marine Algal Species. J. Chem. Technol. Biotechnol. 2005, 80, 1408–1415. [Google Scholar] [CrossRef]
  5. Mook, W.T.; Chakrabarti, M.H.; Aroua, M.K.; Khan, G.M.A.; Ali, B.S.; Islam, M.S.; Abu Hassan, M.A. Removal of Total Ammonia Nitrogen (TAN), Nitrate and Total Organic Carbon (TOC) from Aquaculture Wastewater Using Electrochemical Technology: A Review. Desalination 2012, 285, 1–13. [Google Scholar] [CrossRef]
  6. Kanakaraju, D.; Glass, B.D.; Oelgemöller, M. Advanced Oxidation Process-Mediated Removal of Pharmaceuticals from Water: A Review. J. Environ. Manag. 2018, 219, 189–207. [Google Scholar] [CrossRef]
  7. Moreira, F.C.; Boaventura, R.A.R.; Brillas, E.; Vilar, V.J.P. Electrochemical Advanced Oxidation Processes: A Review on Their Application to Synthetic and Real Wastewaters. Appl. Catal. B 2017, 202, 217–261. [Google Scholar] [CrossRef]
  8. Candia-Onfray, C.; Espinoza, N.; Sabino da Silva, E.B.; Toledo-Neira, C.; Espinoza, L.C.; Santander, R.; García, V.; Salazar, R. Treatment of Winery Wastewater by Anodic Oxidation Using BDD Electrode. Chemosphere 2018, 206, 709–717. [Google Scholar] [CrossRef]
  9. Souli, I.; Fernandes, A.; Lopes, A.; Gomes, I.; Afonso, A.; Labiadh, L.; Ammar, S. Treatment of Cheese Whey Wastewater by Electrochemical Oxidation Using BDD, Ti/RuO2-TiO2, and Ti/RuO2-IrO2-Pt Anodes: Ecotoxicological and Energetic Evaluation. Environ. Sci. Pollut. Res. 2025, 32, 7058–7069. [Google Scholar] [CrossRef]
  10. Quan, F.; Zhan, G.; Zhou, B.; Ling, C.; Wang, X.; Shen, W.; Li, J.; Jia, F.; Zhang, L. Electrochemical Removal of Ammonium Nitrogen in High Efficiency and N2 Selectivity Using Non-Noble Single-Atomic Iron Catalyst. J. Environ. Sci. 2023, 125, 544–552. [Google Scholar] [CrossRef]
  11. Qing, G.; Anari, Z.; Abolhassani, M.; Foster, S.L.; Matlock, M.; Thoma, G.; Greenlee, L.F. Electrochemical Ammonia Removal and Disinfection of Aquaculture Wastewater Using Batch and Flow Reactors Incorporating PtRu/Graphite Anode and Graphite Cathode. Aquac. Eng. 2021, 93, 102155. [Google Scholar] [CrossRef]
  12. Romano, A.; Ortiz, I.; Urtiaga, A.M. Comprehensive Kinetics of Electrochemically Assisted Ammonia Removal in Marine Aquaculture Recirculating Systems. J. Electroanal. Chem. 2021, 897, 115619. [Google Scholar] [CrossRef]
  13. Ruan, Y.; Lu, C.; Guo, X.; Deng, Y.; Zhu, S. Electrochemical Treatment of Recirculating Aquaculture Wastewater Using a Ti/RuO2-IrO2 Anode for Synergetic Total Ammonia Nitrogen and Nitrite Removal and Disinfection. Trans. ASABE 2016, 59, 1831–1840. [Google Scholar] [CrossRef]
  14. Roy, R.K. A Primer on the Taguchi Method, 2nd ed.; Society of Manufacturing Engineers: Southfield, MI, USA, 2010; ISBN 9780872638648. [Google Scholar]
  15. NORMA Oficial Mexicana NOM-001-SEMARNAT-2021, Que Establece Los Límites Permisibles de Contaminantes En Las Descargas de Aguas Residuales En Cuerpos Receptores Propiedad de La Nación. 2021. Available online: http://legismex.mty.itesm.mx/normas/ecol/semarnat001-2022_03.pdf (accessed on 13 May 2015).
  16. Sharma, S.; Simsek, H. Treatment of Canola-Oil Refinery Effluent Using Electrochemical Methods: A Comparison between Combined Electrocoagulation + Electrooxidation and Electrochemical Peroxidation Methods. Chemosphere 2019, 221, 630–639. [Google Scholar] [CrossRef]
  17. Abbas, R.N.; Abbas, A.S. The Taguchi Approach in Studying and Optimizing the Electro-Fenton Oxidation to Reduce Organic Contaminants in Refinery Wastewater Using Novel Electrodes. Eng. Technol. Appl. Sci. Res. 2022, 12, 8928–8935. [Google Scholar] [CrossRef]
  18. Luong, X.T.H.; Liang, C. Evaluation of Atrazine Degradation by Iron Persulfate Activation Process in Aqueous Phase Using Taguchi Approach. Environ. Eng. Res. 2023, 29, 230137. [Google Scholar] [CrossRef]
  19. Asath Murphy, M.S.; Jane, D.J.; Leenus, S.S.; Riju, S.R.; Jegathambal, P.; Kalivel, P. Electrochemical Treatment of Textile Wastewater Using Copper Electrodes. J. Environ. Sci. Health Part A 2023, 58, 971–980. [Google Scholar] [CrossRef]
  20. Selvinsimpson, S.; Eva Gnana Dhana Rani, S.; Ganesh Kumar, A.; Rajaram, R.; Sharmila Lydia, I.; Chen, Y. Photocatalytic Activity of SnO2/Fe3O4 Nanocomposites and the Toxicity Assessment of Vigna Radiata, Artemia Salina and Danio Rerio in the Photodegraded Solution. Environ. Res. 2021, 195, 110787. [Google Scholar] [CrossRef] [PubMed]
  21. Baía, A.; Lopes, A.; Nunes, M.J.; Ciríaco, L.; Pacheco, M.J.; Fernandes, A. Removal of Recalcitrant Compounds from Winery Wastewater by Electrochemical Oxidation. Water 2022, 14, 750. [Google Scholar] [CrossRef]
  22. Flox, C.; Cabot, P.-L.; Centellas, F.; Garrido, J.A.; Rodríguez, R.M.; Arias, C.; Brillas, E. Solar Photoelectro-Fenton Degradation of Cresols Using a Flow Reactor with a Boron-Doped Diamond Anode. Appl. Catal. B 2007, 75, 17–28. [Google Scholar] [CrossRef]
  23. Donoso, G.; Dominguez, J.R.; González, T.; Correia, S.; Cuerda-Correa, E.M. Electrochemical and Sonochemical Advanced Oxidation Processes Applied to Tartrazine Removal. Influence of Operational Conditions and Aqueous Matrix. Environ. Res. 2021, 202, 111517. [Google Scholar] [CrossRef]
  24. Panizza, M.; Michaud, P.A.; Cerisola, G.; Comninellis, C. Anodic Oxidation of 2-Naphthol at Boron-Doped Diamond Electrodes. J. Electroanal. Chem. 2001, 507, 206–214. [Google Scholar] [CrossRef]
  25. Cabeza, A.; Urtiaga, A.M.; Ortiz, I. Electrochemical Treatment of Landfill Leachates Using a Boron-Doped Diamond Anode. Ind. Eng. Chem. Res. 2007, 46, 1439–1446. [Google Scholar] [CrossRef]
  26. Vogel, F.; Harf, J.; Hug, A.; von Rohr, P.R. The Mean Oxidation Number of Carbon (MOC)—A Useful Concept for Describing Oxidation Processes. Water Res. 2000, 34, 2689–2702. [Google Scholar] [CrossRef]
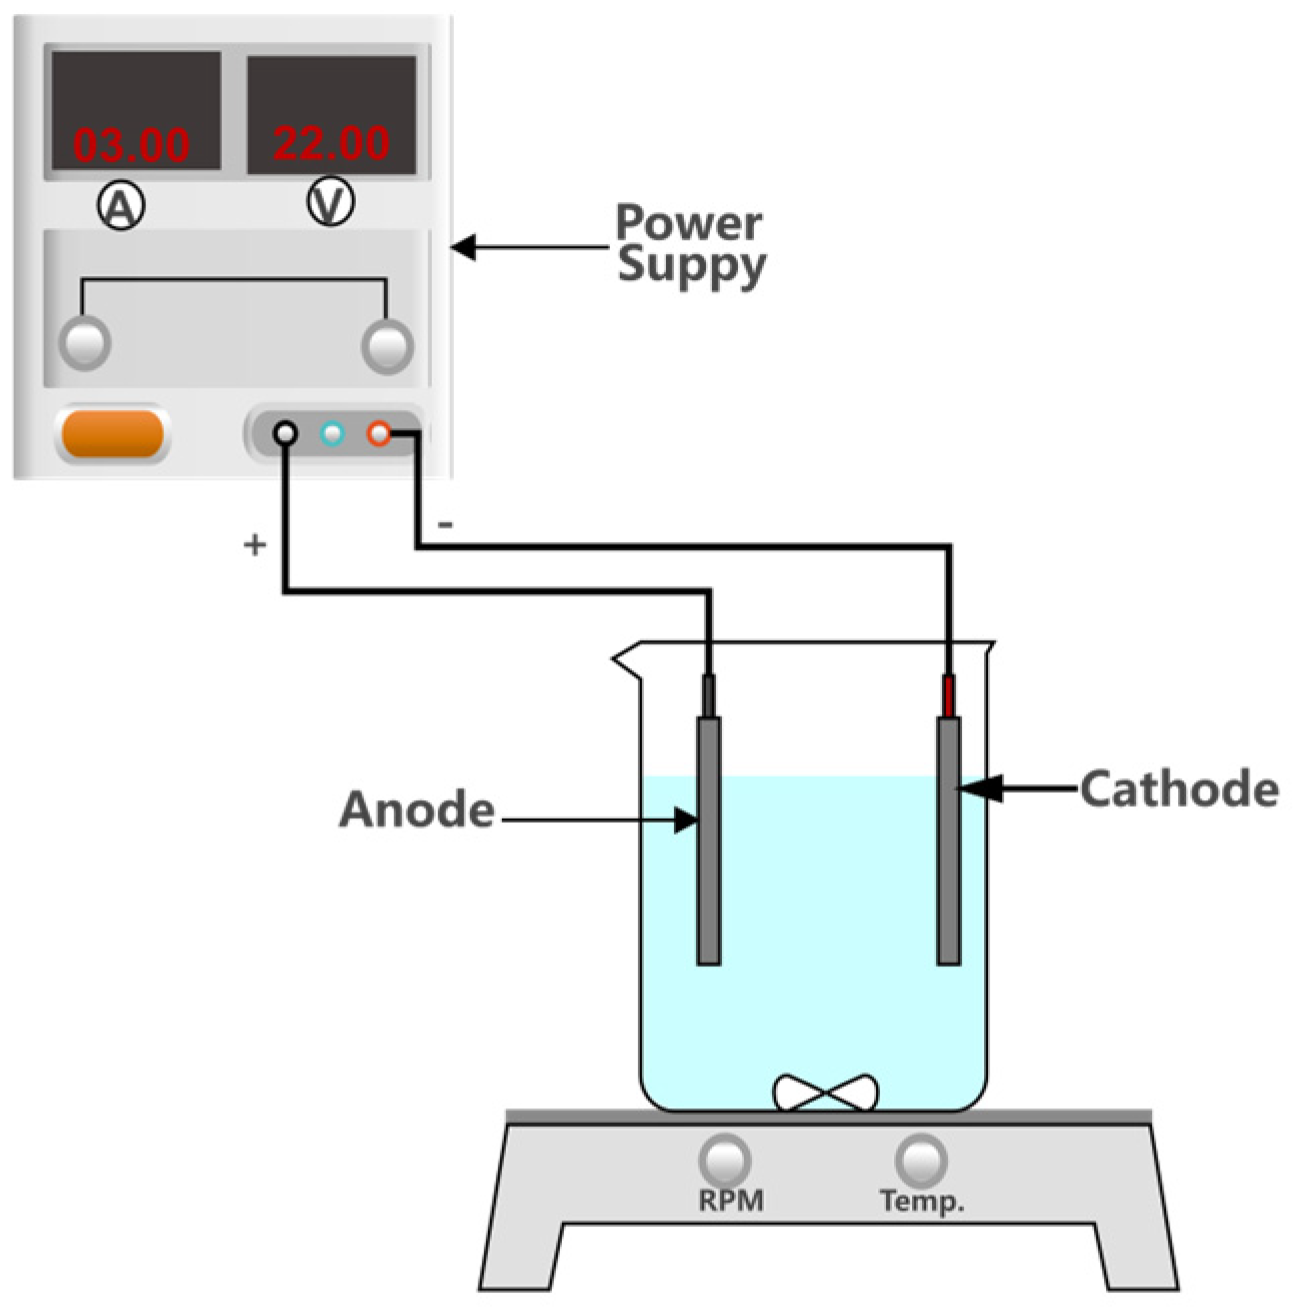
Figure 1. Experimental set-up used for the electro-oxidation of biofloc tilapia wastewater in a batch reactor, consisting of a BDD anode and different cathode materials (BDD, Cu, or Ti).
Processes 13 03377 g001
Figure 2. Percentage contribution of each factor in the removal of (a) COD, (b) TAN, and (c) Turbidity.
Processes 13 03377 g002
Figure 3. Numerical optimization ramps.
Processes 13 03377 g003
Figure 4. Removal efficiency decay for COD, TAN, and TOC under optimal operating reaction conditions. pH0 = 11.5, i = 2 A, t = 3.5 h, and Ti cathode.
Processes 13 03377 g004
Figure 5. Specific energy consumption vs. COD, TAN, and TOC removal under optimal operating reaction conditions. pH0 = 11.5, i = 2 A, t = 3.5 h, and Ti cathode.
Processes 13 03377 g005
Figure 6. Removal profiles under optimal operating reaction conditions (a) COD, (b) TAN, and (c) TOC. pH0 = 11.5, i = 2 A, t = 3.5 h, and Ti cathode.
Processes 13 03377 g006
Figure 7. Evolution of the MOC during the EO treatment.
Processes 13 03377 g007
Figure 8. (a) Survival percentage and (b) mortality percentage under optimal operating reaction conditions.
Processes 13 03377 g008
Table 1. Physicochemical properties of the biofloc tilapia wastewater.
ParametersMean Values
Conductivity (mS/cm)4.93
TDS (mg/L)2416
Turbidity (NTU)7.29
COD (mg/L)518.52
TAN (mg/L)6.4
TOC (mg/L)158.10
Table 2. Factors and levels considered for the Taguchi experimental design.
FactorLevels (−1, 0, +1)
A: pH05.5, 8.5, 11.5
B: i (A)1.0, 1.5, 2
C: t (h)2.5, 3.0, 3.5
D: CathodeBDD, Cu, Ti
Table 3. Experimental design matrix and the experimental result values for the removal of COD, turbidity, and TAN.
FactorsResponses
RunABCDRemoval (%)
CODTurbidityTAN
18.51.53.5BDD82.0960.7898.17
25.52.03.5Cu82.8453.2695.83
38.52.02.5Ti79.7467.1298.04
411.51.03.5Ti77.0473.2894.149
511.52.03.0BDD90.6867.6199.01
65.51.53.0Ti78.3661.8991.08
711.51.52.5Cu76.8460.1592.88
88.51.03.0Cu62.4375.3994.00
95.51.02.5BDD54.9156.1190.01
Table 4. ANOVA analysis for COD, TAN and Turbidity Removal.
SourceSum of SquaresDegree of FreedomMean Square
COD Removal
A-pH0143.10271.55
B-i618.132309.06
C-t159.83279.92
D-Cath28.50214.25
Core total949.568
TAN Removal
A-pH030.85215.42
B-i38.71219.36
C-t8.7524.38
D-Cath3.9521.98
Core total82.278
Turbidity Removal
A-pH0213.092106.55
B-i87.87243.94
C-t87.43243.72
D-Cath57.44228.72
Core total445.848
Table 5. Optimization criteria and constraints.
ResponseObjectiveLimitsImportance
LowHigh
pH0In range5.5011.5+++
iIn range1.002.00+++
tIn range2.503.50+++
CathIn rangeBDDCu+++
CODMaximizer54.9190.68+++
TANMaximizer90.0099.01+++
TurbidityMaximizer53.2675.39+++
Table 6. Apparent kinetic constant values for COD, TAN, and TOC removal.
Removal KineticOrdenKappR2
CODPseudo-first0.0101 L/min0.9726
TANPseudo-zero0.0276 mg/L min0.9586
TOCPseudo-first0.0081 L/min0.9944
Table 7. Phytotoxicity assay results.
VariableControlBiofloc Aquaculture Wastewater
Tap
Water
Distilled
Water
Untreated
Effluent Without Na2SO4
Untreated
Effluent with Na2SO4
Treated
Effluent with Na2SO4
Germination (%)93.3393.3390.0076.6786.67
Root size (cm)7.938.517.885.224.38
Stem size (cm)23.4623.9120.611.481.10
Table 8. Comparison of results for wastewater treated using electrochemical processes in batch reactors.
Wastewater SourceOperating Reaction
Conditions
Removal
Efficiency (%)
SEC
(kw h /m3)
OC (USD/L)Ref.
Tilapia biofloc aquaculture effluentOptimized
[COD]0 = 518 mg/L
[TAN]0 = 6.4 mg/L
[TOC]0 = 158.10 mg/L
An: 1-Cath: 2
j = 0.125 A/cm2
A = 16 cm2
Average U = 10.74 V
t = 3.5 h
Vs = 500 mL
COD: 96.57
TAN: 99.06
Turbidity: 67.68
TOC: 81.09
1501.0This work
Synthetic aquaculture wastewater Non optimized
NH 4 + N 0 = 20 mg/L
An: 3-Cath: 4
j = 7.5 × 10⁻⁴ A/cm2
A = 4 cm2
U = 1.89 V
t = 2 h
Vs = 30 mL
NH 4 + N : 99.3------[10]
Aquaculture wastewaterNon optimized
NH 4 + N 0 = 15 mg/L
An: 3-Cath: 4
j = 7.5 × 10⁻⁴ A/cm2
A = 4 cm2
U = 1.89 V
t = 2 h
Vs = 30 mL
NH 4 + N : 96.7
Synthetic aquaculture wastewaterNon optimized
[NH3-N]0 = 50 mg/L
An: 5-Cath: 4
j = 0.025 A/cm2
A = 8.06 cm2
U = n.a.
t = 2 h
Vs = 400 mL
NH3-N: 100.0------[11]
Aquaculture wastewaterNon optimized
[NH3-N]0 = 7 mg/L
An: 5-Cath: 4
j = 0.025 A/cm2
A = 8.06 cm2
U = n.a.
t = 2 h
Vs = 400 mL
NH3-N: 100.0
An: Anode; Cath: Cathode; 1: BDD; 2: Ti; 3: Fe-SAs/N-C; 4: Graffito; 5: PtRu/graffito; n.a.: not available.
Disclaimer/Publisher’s Note: The statements, opinions and data contained in all publications are solely those of the individual author(s) and contributor(s) and not of MDPI and/or the editor(s). MDPI and/or the editor(s) disclaim responsibility for any injury to people or property resulting from any ideas, methods, instructions or products referred to in the content.