Article

Service Restoration Strategy for Distribution Networks Considering Multi-Source Collaboration and Incomplete Fault Information

1
Electric Power Research Institute, State Grid Anhui Electric Power Co., Ltd., Hefei 230601, China
2
State Grid Anhui Electric Power Co., Ltd., Hefei 230041, China
3
School of Electrical Engineering and Automation, Hefei University of Technology, Hefei 230009, China
*
Author to whom correspondence should be addressed.
Processes 2025, 13(10), 3075; https://doi.org/10.3390/pr13103075
Submission received: 26 August 2025 / Revised: 22 September 2025 / Accepted: 22 September 2025 / Published: 25 September 2025
(This article belongs to the Special Issue Modeling, Optimization, and Control of Distributed Energy Systems)

Abstract

To address the severe damage and outage risks to distribution networks caused by extreme weather, this paper proposes a coordinated optimization strategy for distribution network repair sequencing and rapid restoration, which considers multi-source collaboration and incomplete fault information. In response to the challenge of incomplete fault information after a disaster, a two-layer robust optimization model is constructed. The upper-layer model aims to minimize the completion time of repairs for all faults under the most unfavorable fault scenario to obtain a robust repair time for potential faulty lines, providing a reliable basis for the restoration decisions of the lower-layer model. The lower-layer model’s objective is to maximize the weighted restored load quantity by comprehensively coordinating mobile diesel generators (MDGs), distributed generators (DGs), photovoltaics (PVs), wind turbines (WTs), and energy storage systems (ESSs) to achieve the optimal restoration strategy. The proposed service restoration strategy is validated through simulation on a modified IEEE 33-bus power system, and the results demonstrate that the strategy can efficiently and comprehensively utilize multi-source collaborative resources and improve the resilience of the distribution network.

1. Introduction

With the increasing severity of global climate change, extreme weather events, e.g., typhoons and floods, are occurring more frequently, posing a serious threat to the safe and stable operation of power systems [1,2,3]. As the final link connecting power users to the main grid, distribution networks are highly vulnerable to natural disasters due to their complex structure and wide geographic distribution, which often leads to large-scale power outages [4,5,6,7]. The rapid development of various energy resources, such as distributed generators (DGs) like wind turbines (WTs) and photovoltaics (PVs), as well as energy storage systems (ESSs) and mobile diesel generators (MDGs), has provided new technical means and strategies for post-disaster distribution network restoration [8,9,10,11]. The efficient and rapid restoration of power supply to distribution networks and the enhancement of system resilience using these resources have become a hot topic and a major challenge in current power system research [12,13,14].
Distribution network load restoration is one of the core issues in post-disaster emergency management, aiming to restore as much de-energized load as possible with limited repair resources and time [15]. Traditional load restoration research has mainly focused on the scheduling of single types of resources, considering only power supply from the main grid or the integration of fixed DGs [16,17]. However, with the development of new energy technologies, distribution network restoration strategies need to more comprehensively consider the collaborative utilization of multiple resources. Reference [18] proposed a microgrid-based service restoration method that restores critical loads in a wind-penetrated system by scheduling power sources. Reference [19] presented a robust load restoration method that coordinates network reconfiguration, MDGs, and repair crews (RCs) to achieve rapid load restoration. Reference [20] proposed a mixed-integer linear programming model that co-optimizes RCs, resources, and grid operations while integrating different types of photovoltaic systems in the restoration process, with simulation results showing that multi-resource collaboration accelerates the load restoration speed. Therefore, in-depth research and optimization of multi-source coordinated scheduling to maximize the restored load quantity is of great significance for improving the efficiency of post-disaster restoration of distribution networks.
In actual post-disaster repair processes, fault information is often incomplete or uncertain due to damaged communication and failed monitoring equipment. Most existing studies assume that fault information is fully known, which is an overly idealistic assumption [21]. Incomplete fault information significantly increases the difficulty and uncertainty of repair work, leading to suboptimal or even incorrect repair decisions. Therefore, it is of great importance to study distribution network restoration strategies under incomplete fault information. Currently, some studies have begun to address this issue. Reference [22] proposed a two-stage stochastic mixed-integer linear programming model to co-optimize distribution network operation and repair crew paths, using a log-normal distribution to model the uncertainty of repair times. Reference [23] proposed a dynamic restoration strategy that uses model predictive control to handle random repair times and coordinate repair crew scheduling. Reference [24] used a stochastic programming method to handle the uncertainty of line faults and traffic congestion and proposed an integrated sequential service restoration model. However, these studies mainly focus on handling the uncertainty of fault parameters, with less attention paid to situations where fault location information is completely missing. This problem of missing information has a more fundamental and challenging impact on repair decisions. Therefore, there is an urgent need for a comprehensive restoration strategy that can handle both uncertainty and missing information simultaneously. The statistical comparisons among the proposed model and existing works are shown in Table 1 to illustrate the gap of the proposed model and existing works.
To solve the above problems, this paper proposes a coordinated optimization strategy for distribution network repair sequencing and rapid restoration, considering multi-source collaboration and incomplete fault information. The main innovations of this paper are as follows:
(1) In the presence of incomplete fault information, a robust optimization method is used within a two-layer model framework to determine the robust repair time for potential faulty lines, providing reliable repair guidance for the lower-layer load restoration.
(2) A multi-source collaborative distribution network restoration model is proposed, which comprehensively considers the path scheduling of MDGs and the energy constraints and time-varying load characteristics of DGs, PVs, WTs, and ESSs. The objective is to maximize the weighted restored load quantity, thereby achieving coordinated optimization of the distribution network repair sequence and load restoration.

2. Mathematic Formulation of the Proposed Strategy

2.1. Framework of the Proposed Strategy

The proposed two-layer model framework is designed to solve the problem of determining fault repair times, distribution network repair sequencing, and load restoration plans under incomplete fault information. First, post-disaster data is input. Next, the upper-layer model calculates the minimum repair completion time for all faults under the most unfavorable fault scenario to obtain a robust repair time for potential faulty lines. Finally, based on the robust fault repair time calculated by the upper-layer model, the lower-layer model considers multiple resources such as MDGs, PVs, WTs, ESSs, and DGs to maximize the weighted restored load quantity, thereby obtaining and outputting the optimal restoration strategy.
The framework diagram of the proposed restoration strategy is shown in Figure 1 with the detailed input data and restoration solution to make the service restoration solutions clearer. As shown in the upper-layer model in Figure 1, this model aims to minimize the repair completion time of all faults under the most unfavorable fault scenario. Its constraints include RC scheduling and dual constraints for fault scenario probabilities. The output of the upper-layer model is the repair completion time of all faults under the most unfavorable fault scenario, which is then passed as input to the lower-layer model to guide changes in the lower-layer’s network topology. In the lower-layer model, a comprehensive fault restoration model is proposed, which aims to coordinate various available resources to enhance the resilience and restoration capabilities of the distribution network. As shown in the lower-layer model in Figure 1, the scheduling of MDGs is constrained to their spatial movement between charging station nodes. At the same time, the model fully considers the characteristics of DGs, PVs, WTs, and ESSs to optimize resource utilization and demonstrates the power output capabilities of both static and mobile resources. Additionally, constraints are placed on the power flow and node voltages of the distribution network, while ensuring the radiality and connectivity of the network. Dynamic adjustment of the distribution network’s topological structure is achieved through remotely controlled switch operations, further enhancing the flexibility and effectiveness of the distribution network’s resilience. The detailed upper-layer model and lower-layer model are presented in the following subsections, and a nomenclature table is presented in the Nomenclature.

2.2. Upper-Layer Model

The objective function of the upper-layer model is to minimize the repair completion time of all faults under the most unfavorable fault scenario to obtain a robust repair time for potential faulty lines, as shown in Equation (1).
T main = min u Ω U max a Ω A s Ω S p s τ s
where T main is the robust fault repair time of the upper-layer model; u is the decision variable of the master problem; Ω U is the feasible domain of the master problem, including Equations (2)–(10); a is the decision variable of the subproblem; Ω A is the feasible domain of the subproblem, including Equation (11); Ω S is the set of fault scenarios; p s is the probability of scenario s; τ s is the repair completion time of all faults under scenario s.

2.2.1. Master Problem of the Upper-Layer Model

The master problem of the upper-layer model is the routing and scheduling of RCs, as shown in Equations (2)–(10). Compared to common RC routing and scheduling models, the RC routing and scheduling model proposed in this paper can achieve the repair time for each potential fault location in different fault scenarios within the same repair path.
k Ω K f d , k C a p d RC , d Ω D
k Ω K f k , d C a p d RC , d Ω D
k Ω K Ω D / { k } f k , k = 1 , k Ω K
k Ω K Ω D / { k } f k , k = k Ω K Ω D / { k } f k , k , k Ω K
where Ω K is the set of potential fault locations; Ω D is the set of depots; f k , k is a binary variable, where 1 indicates that a repair crew travels from a potential fault location k′ to k, and 0 otherwise; C a p d RC is the number of repair crews in depot d. Equations (2) and (3) indicate that all repair crews depart from and return to the depot, and the number of dispatched repair crews cannot exceed the maximum number of repair crews available in the depot. Equation (4) indicates that each potential fault location is visited exactly once by one repair crew. Equation (5) enforces the flow conservation and ensures the continuous movement of repair crews.
t k , s RC , AR t k , s RC , AR + t k RC , CH + A k , s t k RC , DE + t k , k RC , TR + ( 1 f k , k ) M , k Ω K Ω D , k Ω K / { k } , s Ω S
t k , s RC , AR t k , s RC , AR + t k RC , CH + A k , s t k RC , DE + t k , k RC , TR ( 1 f k , k ) M , k Ω K Ω D , k Ω K / { k } , s Ω S
T k , s R t k , s RC , AR + ( t k RC , CH + A k , s t k RC , DE ) k Ω K Ω D / k f k , k , k Ω K , s Ω S
T k , s R t k , s RC , AR + ( t k RC , CH + A k , s t k RC , DE ) k Ω K Ω D / k f k , k + 1 ε , k Ω K , s Ω S
τ s A k , s T k , s R , k Ω K , s Ω S
where t k , s RC , AR is the time for a repair crew to arrive at potential fault location k in scenario s; t k RC , DE is the time required for repair crew to repair potential fault location k; t k , k RC , TR is the travel time of repair crew between potential fault locations k′ and k; t k RC , CH is the time for repair crew to inspect potential fault location k to check for a fault; A k , s is a binary variable parameter indicating whether potential fault location k belongs to scenario s, where 1 means it belongs to scenario s and 0 otherwise; T k , s R is the repair completion time for potential fault location k in scenario s, which is an integer variable; M is a large parameter; ε is a positive number approaching zero. Equations (6) and (7) calculate the arrival time of the repair crew at each potential fault location in each scenario. Equations (8) and (9) calculate the repair completion time for each potential fault location in each scenario. Equation (10) calculates the total fault repair time for all faults in each scenario.

2.2.2. Subproblem of the Upper-Layer Model

The feasible domain of the subproblem is shown in Equation (11).
ψ = { p s } R + S s Ω S | p s p s ini | θ 1 max s Ω S | p s p s ini | θ s Ω S p s = 1
where R + S is the set of positive real numbers for the scenario probability distribution; p s ini is the initial probability of scenario s; θ 1 and θ are the maximum values of the first-order norm and infinite norm of the scenario probability deviation, respectively. Equation (11) contains a nonlinear absolute value term, which is linearized to obtain Equations (12)–(18).
s Ω S κ s θ 1 ,   λ 1
p s p s ini κ s , s Ω S   λ s 2
p s p s ini κ s , s Ω S   λ s 3
κ s θ , s Ω S   λ s 4
κ s 0 , s Ω S   λ s 5
p s 0 , s Ω S   λ s 6
s Ω S p s = 1 ,   λ 7
where κ s is an auxiliary variable introduced for the linearized absolute value calculation; λ 1 , λ s 2 , λ s 3 , λ s 4 , λ s 5 , λ s 6 and λ 7 are dual variables.

2.2.3. Dual Model of the Upper-Layer Model

The subproblem is transformed into its equivalent dual problem using the duality theory. Since the subproblem becomes a convex problem after fixing the master problem’s decision variable u, it can be replaced by its corresponding dual problem. This transforms the min-max problem into a min-min problem, which is a single-layer mixed-integer programming problem. Therefore, the resulting single-layer problem is shown in Equations (19)–(23).
T main = min f k , k , t k , s RC , AR , T k , s R , τ s , λ 1 , λ s 2 , λ s 3 , λ s 4 , λ s 5 , λ s 6 , λ 7 λ 1 θ 1 + s Ω S λ s 2 p s ini s Ω S λ s 3 p s ini + s Ω S λ s 4 θ + λ 7
Equations   ( 2 ) ( 10 )
τ s λ s 2 + λ s 3 λ 7 0 , s Ω S
λ 1 + λ s 2 + λ s 3 λ s 4 0 , s Ω S
λ 1 , λ s 2 , λ s 3 , λ s 4 0 , s Ω S  
The objective function of the dual problem is shown in Equation (19), and the constraints are shown in Equations (20)–(23). Among these, Equations (21)–(23) are the dual constraints of the subproblem, which are related to the original variables p s and κ s . Note that part of the formulation method for the dual model of the upper-layer model presented in this subsection can be found in [29,30].

2.3. Lower-Layer Model

The objective function of the lower-layer model is to maximize the restored load quantity, considering the importance of the nodes, and to minimize line losses. These two objectives can be weighted and expressed as shown in Equation (24).
max t Ω T i Ω B w i v i , t p i , t L t Ω T i j Ω L I i j , t r i j
where Ω L is the set of distribution network lines; Ω T is the set of time steps; Ω B is the set of distribution network buses; w i is the weight of buses; v i , t is a binary variable for the energized status of bus i at time step t, where 1 indicates the bus is energized and 0 otherwise; p i , t L is the active power demand of a bus; I i j , t is the square of the current transmitted by a line; r i j is the line resistance. Equation (24) sets maximizing the weighted restored load quantity and minimizing network losses as the objective functions for the lower-layer model.

2.3.1. Scheduling Model of MDGs

i Ω C γ m , i , t 1 , m Ω MDG , t Ω T
m Ω MDG γ m , i , t C i M , i Ω C , t Ω T
γ m , j , t + k + γ m , i , t 1 , m Ω MDG , k T i , j tra , t T k , i Ω C Ω D , j Ω C Ω D / { i }
0 p m , i , t MDG γ m , i , t p ¯ m M , m Ω MDG , i Ω C , t Ω T
0 q m , i , t MDG γ m , i , t q ¯ m M , m Ω MDG , i Ω C , t Ω T
where Ω MDG is the set of MDGs; Ω C is the set of charging station buses; Ω D is the set of depots; γ m , i , t indicates whether MDG m is connected to charging station bus i at time t; C i M is the maximum number of connections for charging station bus i; T i , j tra is the travel time of an MDG between charging station buses i and j; p m , i , t MDG is the active power output of MDG m at charging station bus i at time t; p ¯ m M is the upper limit of the active power output of MDG m; q m , i , t MDG is the reactive power output of MDG m at charging station bus i at time t; q ¯ m M is the upper limit of the reactive power output of MDG m. Equation (25) indicates that each MDG can be connected to at most one charging station bus in each time step. Equation (26) limits the number of MDGs that can be connected to each charging station bus in each time step. Equation (27) ensures that an MDG cannot be connected to the distribution network while moving from charging station bus i to j, thus guaranteeing that the movement between different buses satisfies the required transfer time. Equations (28) and (29) are the active and reactive power constraints for the MDG [8].

2.3.2. Scheduling Model of WTs and PVs

0 p i , t WT p ¯ i , t R , i Ω WT , t Ω T
0 p i , t PV p ¯ i , t R , i Ω PV , t Ω T
p ¯ i , t R p ¯ i , t A + κ μ p ¯ i , t A , i Ω WT Ω PV , t Ω T
p ¯ i , t R p ¯ i , t A κ μ p ¯ i , t A , i Ω WT Ω PV , t Ω T
where p i , t WT is the active power of the WT at bus i at time t; p i , t PV is the active power of the PV at bus i at time t; p ¯ i , t R is the actual power of the new energy source at bus i; p ¯ i , t A is the predicted power of the new energy source at bus i at time t; κ is the robustness parameter; μ is the maximum prediction error of the new energy output. Equations (30) and (31) represent the wind curtailment and light curtailment constraints for WTs and PVs, respectively; Equations (32) and (33) are the new energy output limits considering the robust risk.

2.3.3. Scheduling Model of ESSs

p i C , min x i , t C p i , t C x i , t C p i C , max , i Ω ESS , t Ω T
p i D , min x i , t D p i , t D x i , t D p i D , max , i Ω ESS , t Ω T
q i C , min x i , t C q i , t C x i , t C q i C , max , i Ω ESS , t Ω T
q i D , min x i , t D q i , t D x i , t D q i D , max , i Ω ESS , t Ω T
x i , t C + x i , t D v i , t , i Ω ESS , t Ω T
H i min E i M E i , t H i max E i M , i Ω ESS , t Ω T
E i , 0 = H i ini E i M , i Ω ESS
E i , t + 1 = E i , t + η i C p i , t C Δ T ( p i , t D / η i D ) Δ T , i Ω ESS , t Ω T / { 1 }
where Ω ESS is the set of buses where energy storage is located; p i , t C and p i , t D are the charging and discharging power of ESS i, respectively; x i , t C and x i , t D are the charging and discharging status of ESS i, respectively, where 1 indicates that ESS i is in a charging or discharging state; p i D , min and p i D , max are the minimum and maximum active discharging power of ESS i, respectively; p i , t C , min and p i , t C , max are the minimum and maximum active charging power of ESS i, respectively; q i , t D , min and q i , t D , max are the minimum and maximum reactive discharging power of ESS i, respectively; q i , t C , min and q i , t C , max are the minimum and maximum reactive charging power of ESS i, respectively; H i min , H i max , and H i ini are the minimum, maximum, and initial state-of-charge levels of ESS i, respectively; E i , t is the remaining energy of ESS i at time t; E i M is the capacity of ESS i; η i C and η i D are the charging and discharging loss coefficients of ESS i, respectively; Δ T is the time duration of one step. Equations (34) and (35) constrain the upper and lower limits of the active charging and discharging power of the ESS [19]; Equations (36) and (37) constrain the upper and lower limits of the reactive charging and discharging power of the ESS; Equation (38) indicates that the ESS can only be in one state, either charging or discharging; Equation (39) limits the energy of the ESS; Equations (40) and (41) are the formulas for calculating the energy of the ESS.

2.3.4. Radiality Constraints [19]

α i j , t + α j i , t = y i j , t , i j Ω L , t Ω T
j i Ω L α j i , t = v i , t , i Ω B / Ω sub , t Ω T
j i Ω L α j i , t = 0 , i Ω sub , t Ω T
y i j , t v i , t , i j Ω L , t Ω T
y i j , t v j , t , i j Ω L , t Ω T
where Ω sub is the set of substation buses; y i j , t is a binary variable for the energized status of line ij at time t, where 1 means it is energized and 0 otherwise; α i j , t indicates whether bus i is the parent bus of bus j at time t, where 1 means bus i is the parent bus of bus j, and 0 otherwise. Equations (42)–(44) are the radiality constraints, which convert the network into a directed graph by assigning binary variables α i j , t and α j i , t to each line. Equation (42) indicates that line ij is energized ( y i j , t = 1) only when bus j is the parent bus of bus i ( α j i , t = 1) or bus i is the parent bus of bus j ( α i j , t = 1). Equation (43) indicates that each energized bus has only one parent bus, except for the substation bus. Equation (44) indicates that the bus where the substation is located has no parent bus. Equations (45) and (46) indicate that once a line is restored, the buses at its two ends should be restored.

2.3.5. Operation Constraints of the Distribution Networks

v i , t p i G , min p i , t G v i , t p i G , max , i Ω G Ω sub , t Ω T
v i , t q i G , min q i , t G v i , t q i G , max , i Ω G Ω sub , t Ω T
p _ i RP p i , t G p i , t 1 G p ¯ i RP , i Ω G Ω sub , t Ω T
where Ω G is the set of generators; p i , t G and q i , t G are the active and reactive power of the generator at bus i at time t, respectively; p i G , min and p i G , max are the minimum and maximum active power of the generator at bus i, respectively; q i G , min and q i G , max are the minimum and maximum reactive power of the generator at bus i, respectively; p _ i RP and p ¯ i RP are the ramp rate upper and lower limits of the generator at bus i, respectively. Equations (47) and (48) are the active and reactive power output limits for the generator. Equation (49) is the ramp rate limit for the generator.
p i , t G + p i , t WT + p i , t PV + m Ω MDG p m , i , t MDG + p i , t D p i , t C + j i Ω L P j i , t r j i I j i , t = v i , t p i , t L + i j Ω L P i j , t , i Ω B , t Ω T
q i , t G + m Ω MDG q m , i , t MDG + q i , t D q i , t C + j i Ω L Q j i , t x j i I j i , t = v i , t q i , t L + i j Ω L Q i j , t , i Ω B , t Ω T
V j , t V i , t 2 r i j P i j , t + x i j Q i j , t + I i j , t r i j 2 + x i j 2 + 1 y i j , t M , i j Ω L , t Ω T
V j , t V i , t 2 r i j P i j , t + x i j Q i j , t + I i j , t r i j 2 + x i j 2 1 y i j , t M , i j Ω L , t Ω T
2 P i j , t 2 Q i j , t I i j , t V i , t 2 I i j , t + V i , t , i j Ω L , t Ω T
v i , t V _ V i , t v i , t V ¯ , i Ω B , t Ω T
P ¯ i j y i j , t P i j , t P ¯ i j y i j , t , i j Ω L , t Ω T
Q ¯ i j y i j , t Q i j , t Q ¯ i j y i j , t , i j Ω L , t Ω T
0 I i j , t I ¯ i j y i j , t , i j Ω L , t Ω T
y i j , t ( t T main + Ω T ) / Ω T , i j Ω FZ , t Ω T
where Ω FZ is the set of fault areas; P i j , t and Q i j , t are the active and reactive power transmitted by the line, respectively; V i , t is the square of the bus voltage; x i j is the line reactance; q i , t L is the reactive power demand of a bus; V ¯ and V _ are the squares of the lower and upper limits of the bus voltage, respectively; P ¯ i j and Q ¯ i j are the rated active and reactive power transmitted by the line, respectively; I ¯ i j is the square of the rated current of the line. Equations (50) and (51) are the power balance equations [19]. Equations (52) and (53) describe the voltage drop across the buses at both ends of a line. Equation (54) is the power flow based on SOCP. Equations (55)–(57) are the safety limits for bus voltage, active power, and reactive power transmitted by the line, respectively. Equation (58) limits the line transmission current. Equation (59) indicates that lines in the fault area can only be re-energized after the fault has been fully repaired.

3. Results and Discussion

3.1. Simulation Parameters

The proposed strategy is validated on a modified IEEE 33-bus power system. This paper assumes that the power system experiences a complete outage at the initial time step due to an extreme typhoon event. The program is implemented on the AMPL platform, and GUROBI 12.0.1 is used to solve the constructed model. The computer used has a 2.10 GHz quad-core i7-12700 processor and 16 GB of RAM, with a set gap of 0.01%.
In the IEEE 33-bus power system, the total power demand is 3.715 MW + 2.3 MVar. It is assumed that every line in the distribution network is a switchable line, and the parameters of load and line are detailed in reference [31]. The time step is set to 15 min. The topology of the IEEE 33-bus power system is shown in Figure 2. It is assumed that the fault occurs at 16:00, with five potential faulty lines: l7–8, l8–9, l9–10, l27–28, and l28–29. The fault probability of each line is generated randomly, with the sum of probabilities being 1.
The IEEE 33-bus power system is configured with 1 substation, 2 DGs, 1 RC, 2 MDGs, 2 WTs, 1 PV, and 2 ESSs. The parameters for the substation, DGs, and MDGs are detailed in Table 2, and the parameters for the ESSs are detailed in Table 3. Two WTs with rated power of 200 kW and 300 kW are added at buses 13 and 21, respectively, and a PV with a rated power of 500 kW is added at bus 25. The output curves for WTs and PVs refer to reference [32]. Considering the uncertainty of new energy output, the robustness parameter κ is set to 1, and the maximum prediction error for new energy output μ is set to 0.1 [33]. In this case study, one depot is established, where both the RC and the MDG are initially located. The travel times for the RC and MDG, as well as the repair and inspection times for the RC, are randomly generated within 30 min. Load priority is categorized into three classes, with the priority of each bus specified in Table 4. The time varying load demand curve is detailed in reference [34]. V min and V max are set to 0.96 p.u. and 1.04 p.u., respectively, with θ 1 = 0.5 and θ = 0.4.

3.2. Result Analysis

There are 4309 variables and 9152 constraints in the proposed model for the modified IEEE 33-bus power system. The computation time of solving the proposed two-layer robust optimization model is 1.83 s. Solving the proposed two-layer model yields the optimal repair sequencing and restoration strategy for the distribution network, with the results presented in the following sections. Figure 3 illustrates the travel paths of the RCs. As shown in Figure 3, the RC departs from the depot and sequentially visits the potential faulty lines l9–10, l28–29, l27–28, l7–8, and l8–9 before returning to the depot. If a line is not faulted in a given scenario, the RC will only perform an inspection of that line. The robust fault repair completion time calculated by the upper-layer model is time step 8, which means all potential faulty lines are repaired by the time step 8, and the potential faulty lines are restored to an available state.
Figure 4 shows the travel paths of the MDGs. As shown in Figure 4, MDG1 departs from the depot, and after one time step, it moves to bus 7 at time step 1. MDG1 continues to supply power at bus 7 for three time steps and then moves towards bus 10 at time step 4. After two time steps, MDG1 arrives at bus 10 at time step 6 and continues to supply power there until time step 12. MDG2 departs from the depot and, after two time steps, moves to bus 26 at time step 2. MDG2 supplies power at bus 26 for two time steps and then moves toward bus 30 at time step 4. After two time steps, it arrives at bus 30 at time step 6 and continues to supply power there until time step 12.
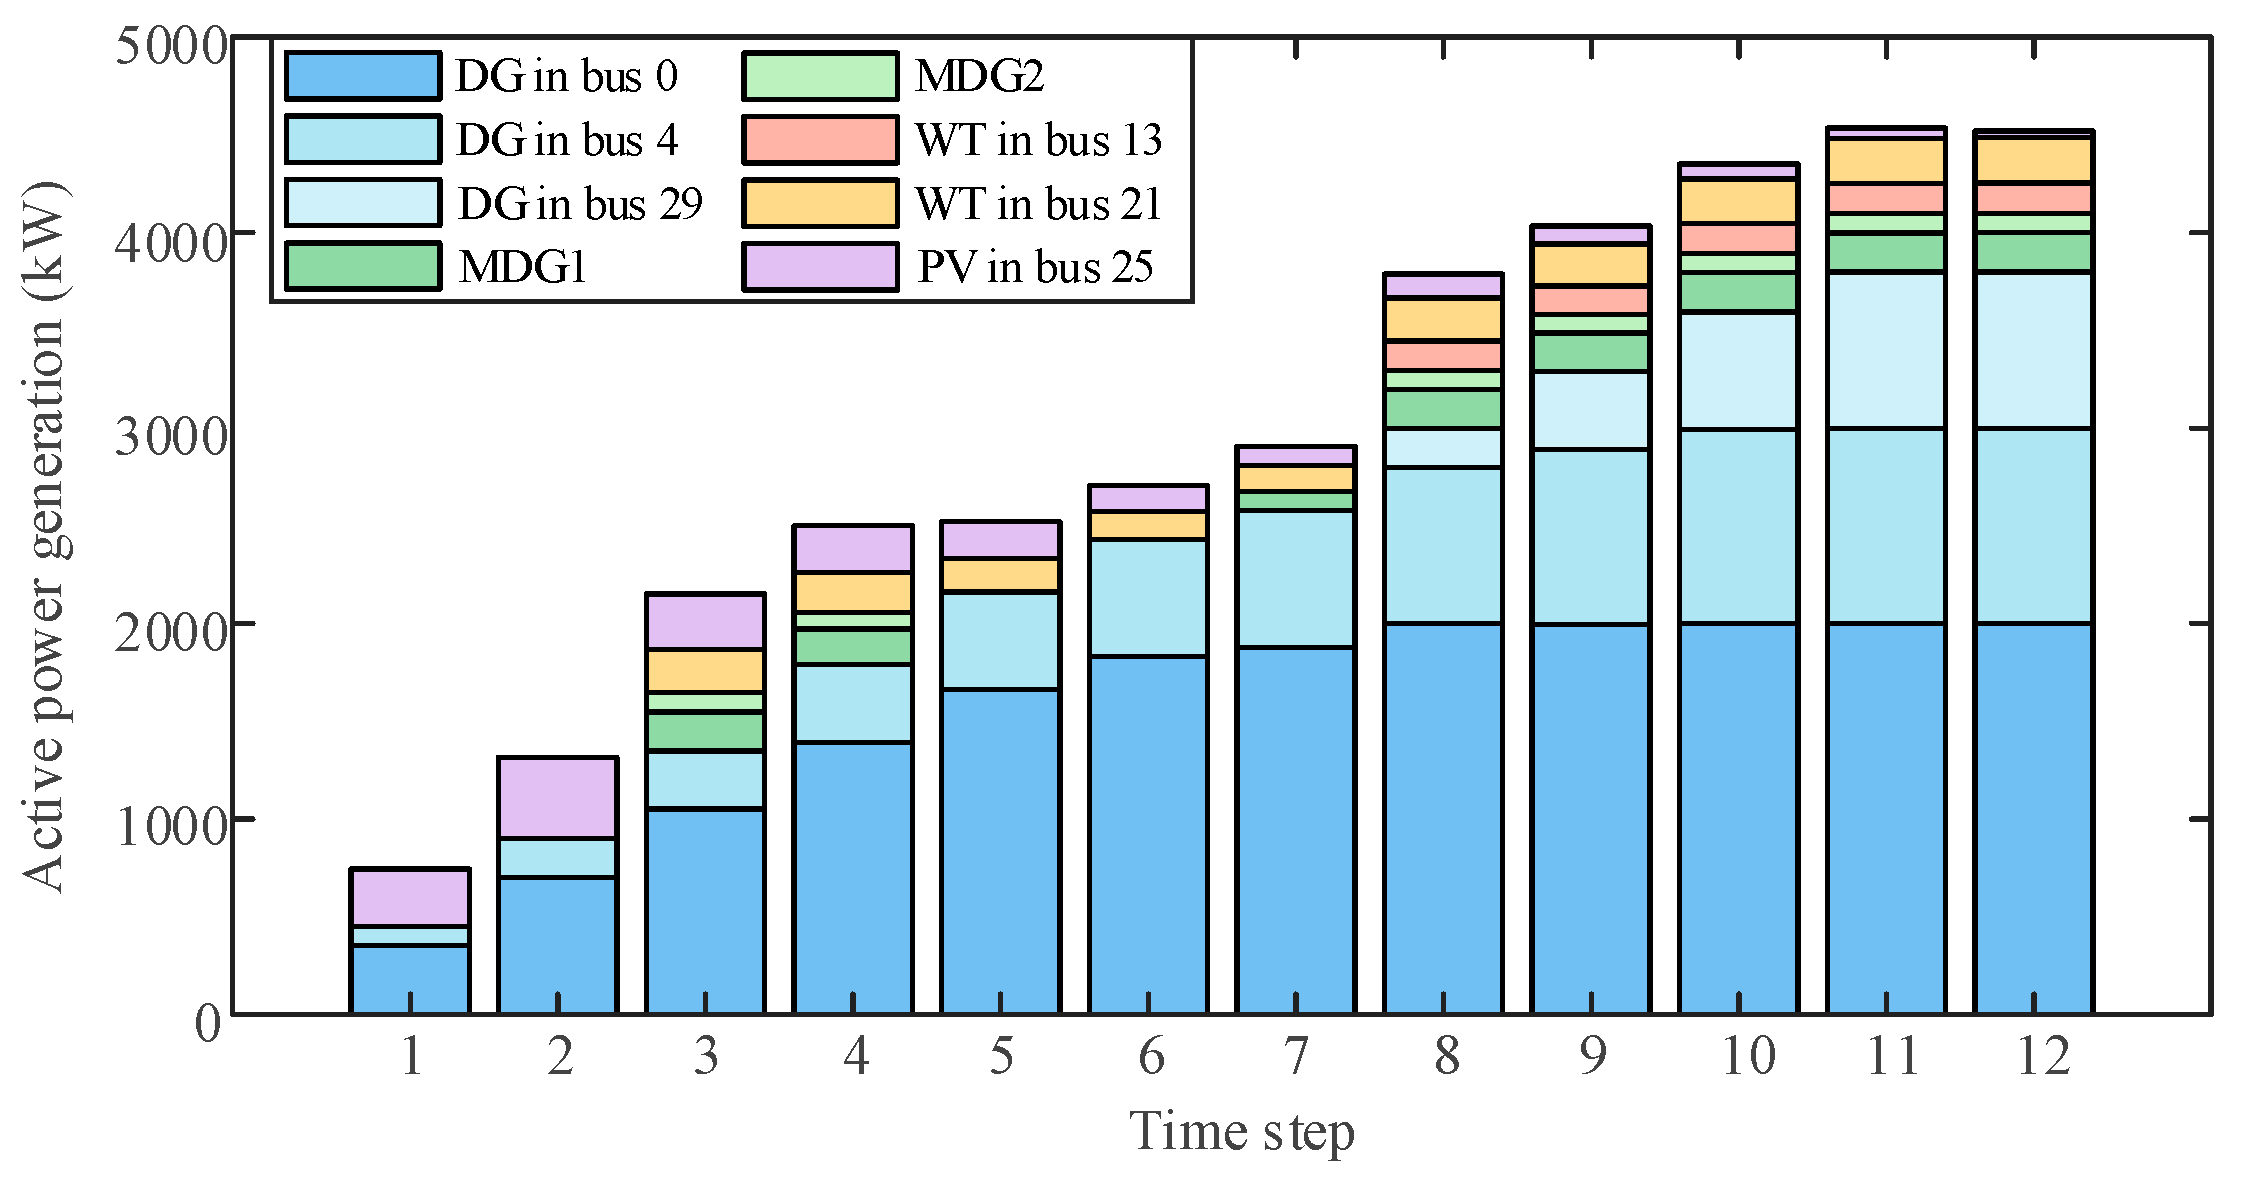
Figure 5 shows the active power generation of DGs, MDGs, WTs, and PVs. As can be seen from Figure 5, at time step 1, the substation at bus 0 provides power support to the distribution network. As the output of the substation at bus 0 increases, the buses where DGs, WTs, and PVs are located are gradually restored and begin to provide power support to the distribution network. During the fault recovery process, the total output of the generating resources at each time step gradually increases, reaching a peak at time steps 11–12.
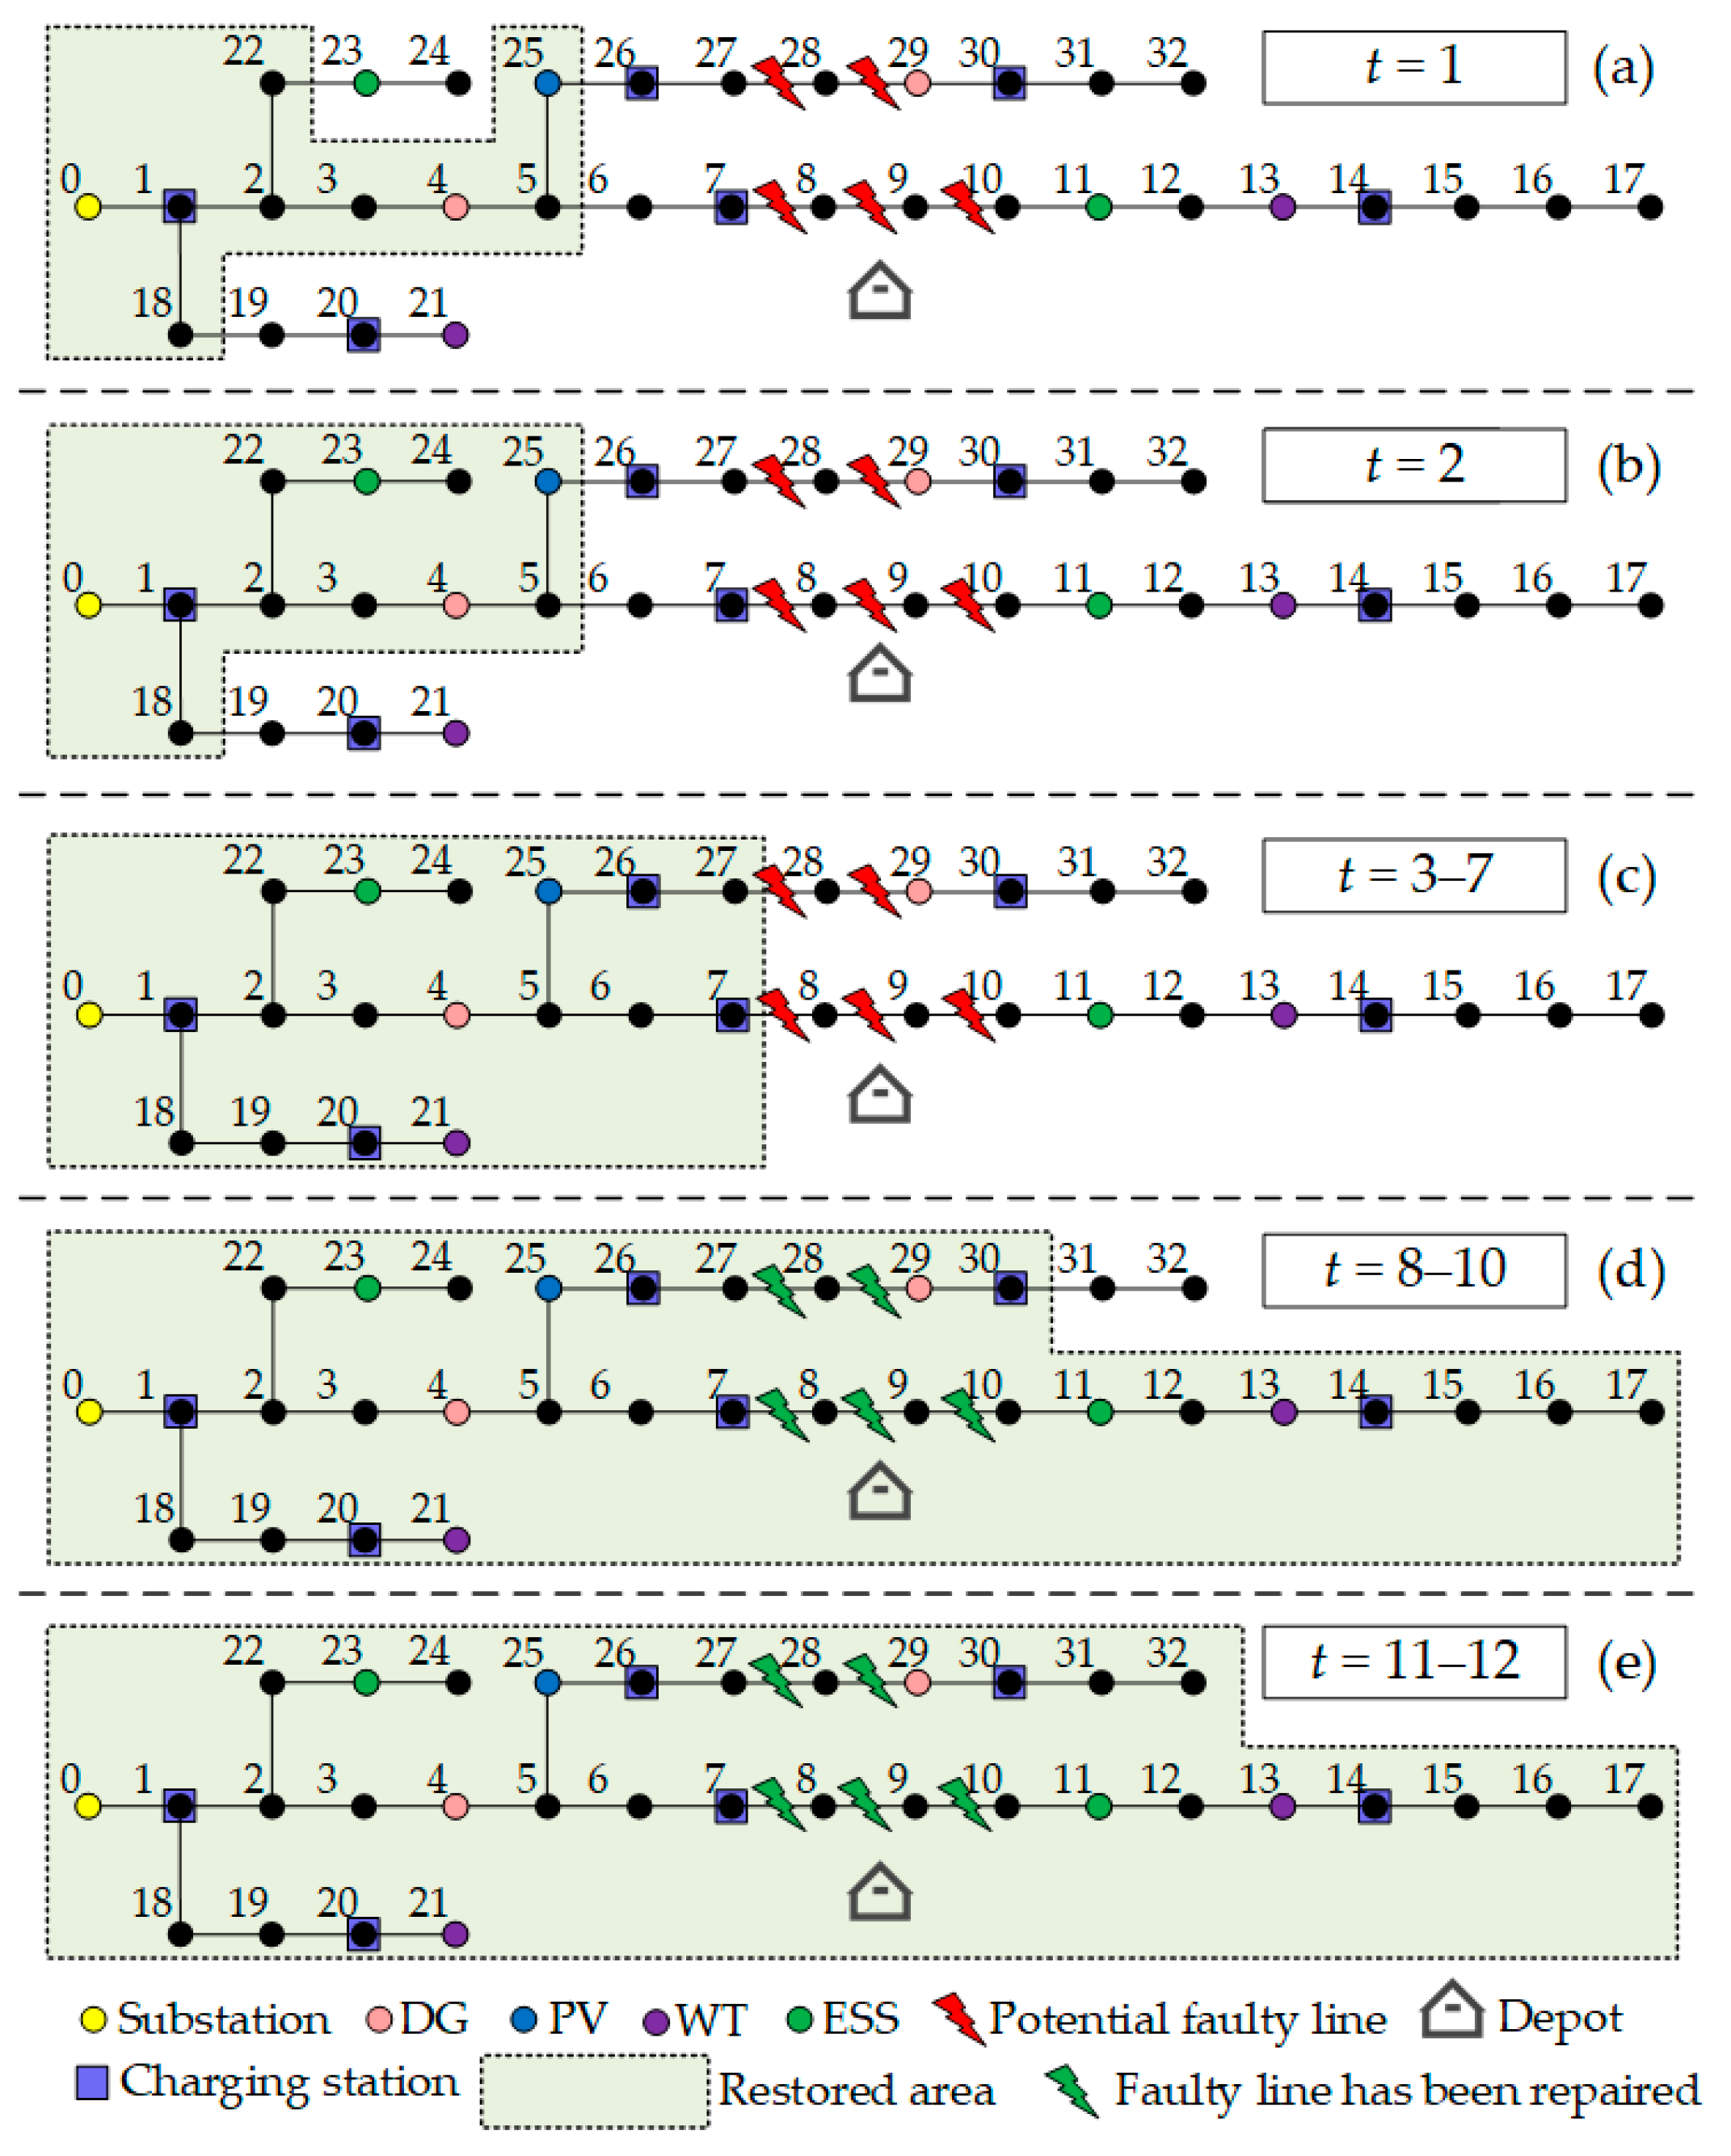
Figure 6 presents the situation of recovery status of each bus at each time step obtained by solving the proposed strategy. The restoration results at time step 1 are shown in Figure 6a. As can be seen from Figure 6a, in the initial stage of restoration, the substation at bus 0 first restores the nearby distributed generation buses, namely the PV at bus 25 and the DG at bus 4, to quickly acquire initial power support. Building on this, buses 1–5, 18, 22, and 25 are restored, forming a basic power supply recovery area. The restoration results at time step 2 are shown in Figure 6b. As can be seen from Figure 6b, with the increase in output from the substation and the restored DGs, the restoration area further expands, and buses 23 and 24 are restored. The restoration results at time steps 3–7 are shown in Figure 6c. As can be seen from Figure 6c in conjunction with the content of Figure 4 and Figure 5, the restoration scope significantly expands during this stage due to the increasing output of various distributed power sources such as the substation, DGs, MDGs, PVs, and WTs. Buses 6, 7, 19–21, 26, and 27 are restored, indicating that the system can utilize more distributed resources to accelerate the restoration process. The restoration results at time steps 8–10 are shown in Figure 6d. As can be seen from Figure 6d, the potential faulty lines have been identified and repaired. As these lines return to normal, and in conjunction with Figure 4 and Figure 5, two MDGs are connected to nodes 10 and 30, providing power support for load restoration. The distribution network further expands, and buses 8–17 and 28–30 are restored. The restoration results at time steps 11–12 are shown in Figure 6e. From Figure 6e, it can be seen that the remaining buses 31 and 32 are successfully restored, and all buses have now had their power supply restored. This demonstrates that the strategy proposed in this paper can efficiently and comprehensively achieve rapid restoration of the distribution network by considering multi-source coordination.
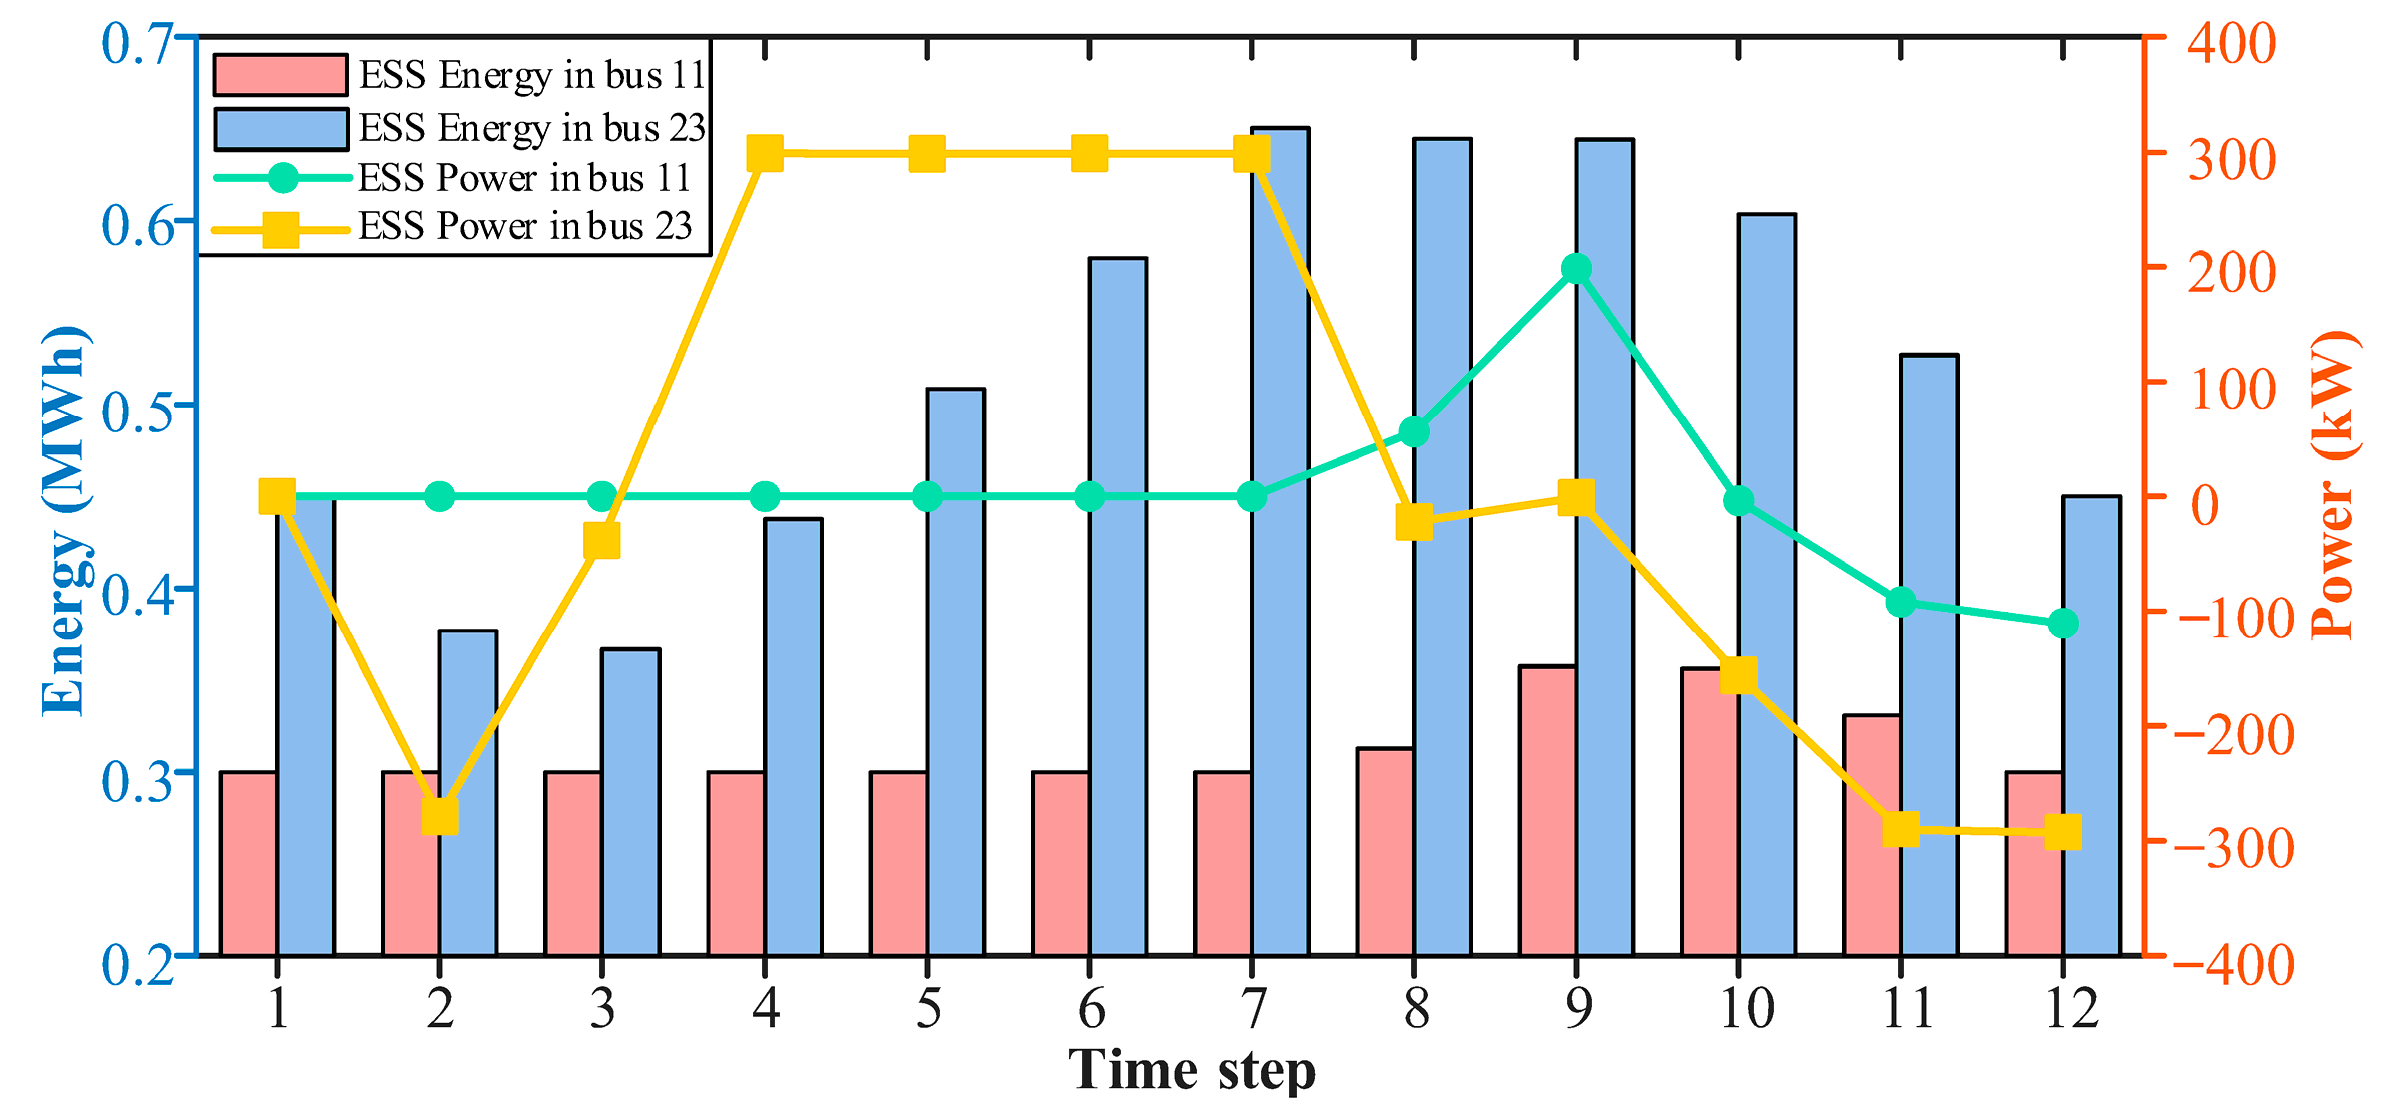
Figure 7 illustrates the power and energy of the ESSs at different buses. In Figure 7, the left vertical axis represents the ESS energy level, and the right vertical axis represents the ESS charging and discharging power. Power greater than 0 indicates charging, while power less than 0 indicates discharging. It can be seen from Figure 5 that the ESS at bus 23 discharges during time steps 2–3 to provide power support for the distribution network’s restoration, and charges during time steps 4–7 to store energy. At time step 8, since the potential faulty lines have been eliminated and repaired, the outage area can be restored after time step 8. Therefore, the ESS at bus 23 discharges during time steps 8–12 to provide power support for restoration. The ESS at bus 11 does not perform charging or discharging operations during time steps 1–7 because, during this period, bus 11 is in a fault area and has not been restored. After the potential faulty lines are eliminated and repaired at time step 8, bus 11 is restored. The ESS at bus 11 then charges during time steps 8–9 and discharges during time steps 10–12 to provide power support to the distribution network. This demonstrates that ESSs can achieve a dynamic balance of power in the distribution network over time. They not only provide rapid power support to maintain the stability of the distribution network during a fault but also flexibly regulate energy storage and dispatch through charging and discharging operations during the restoration period, thereby improving the efficiency of power utilization in the distribution network.
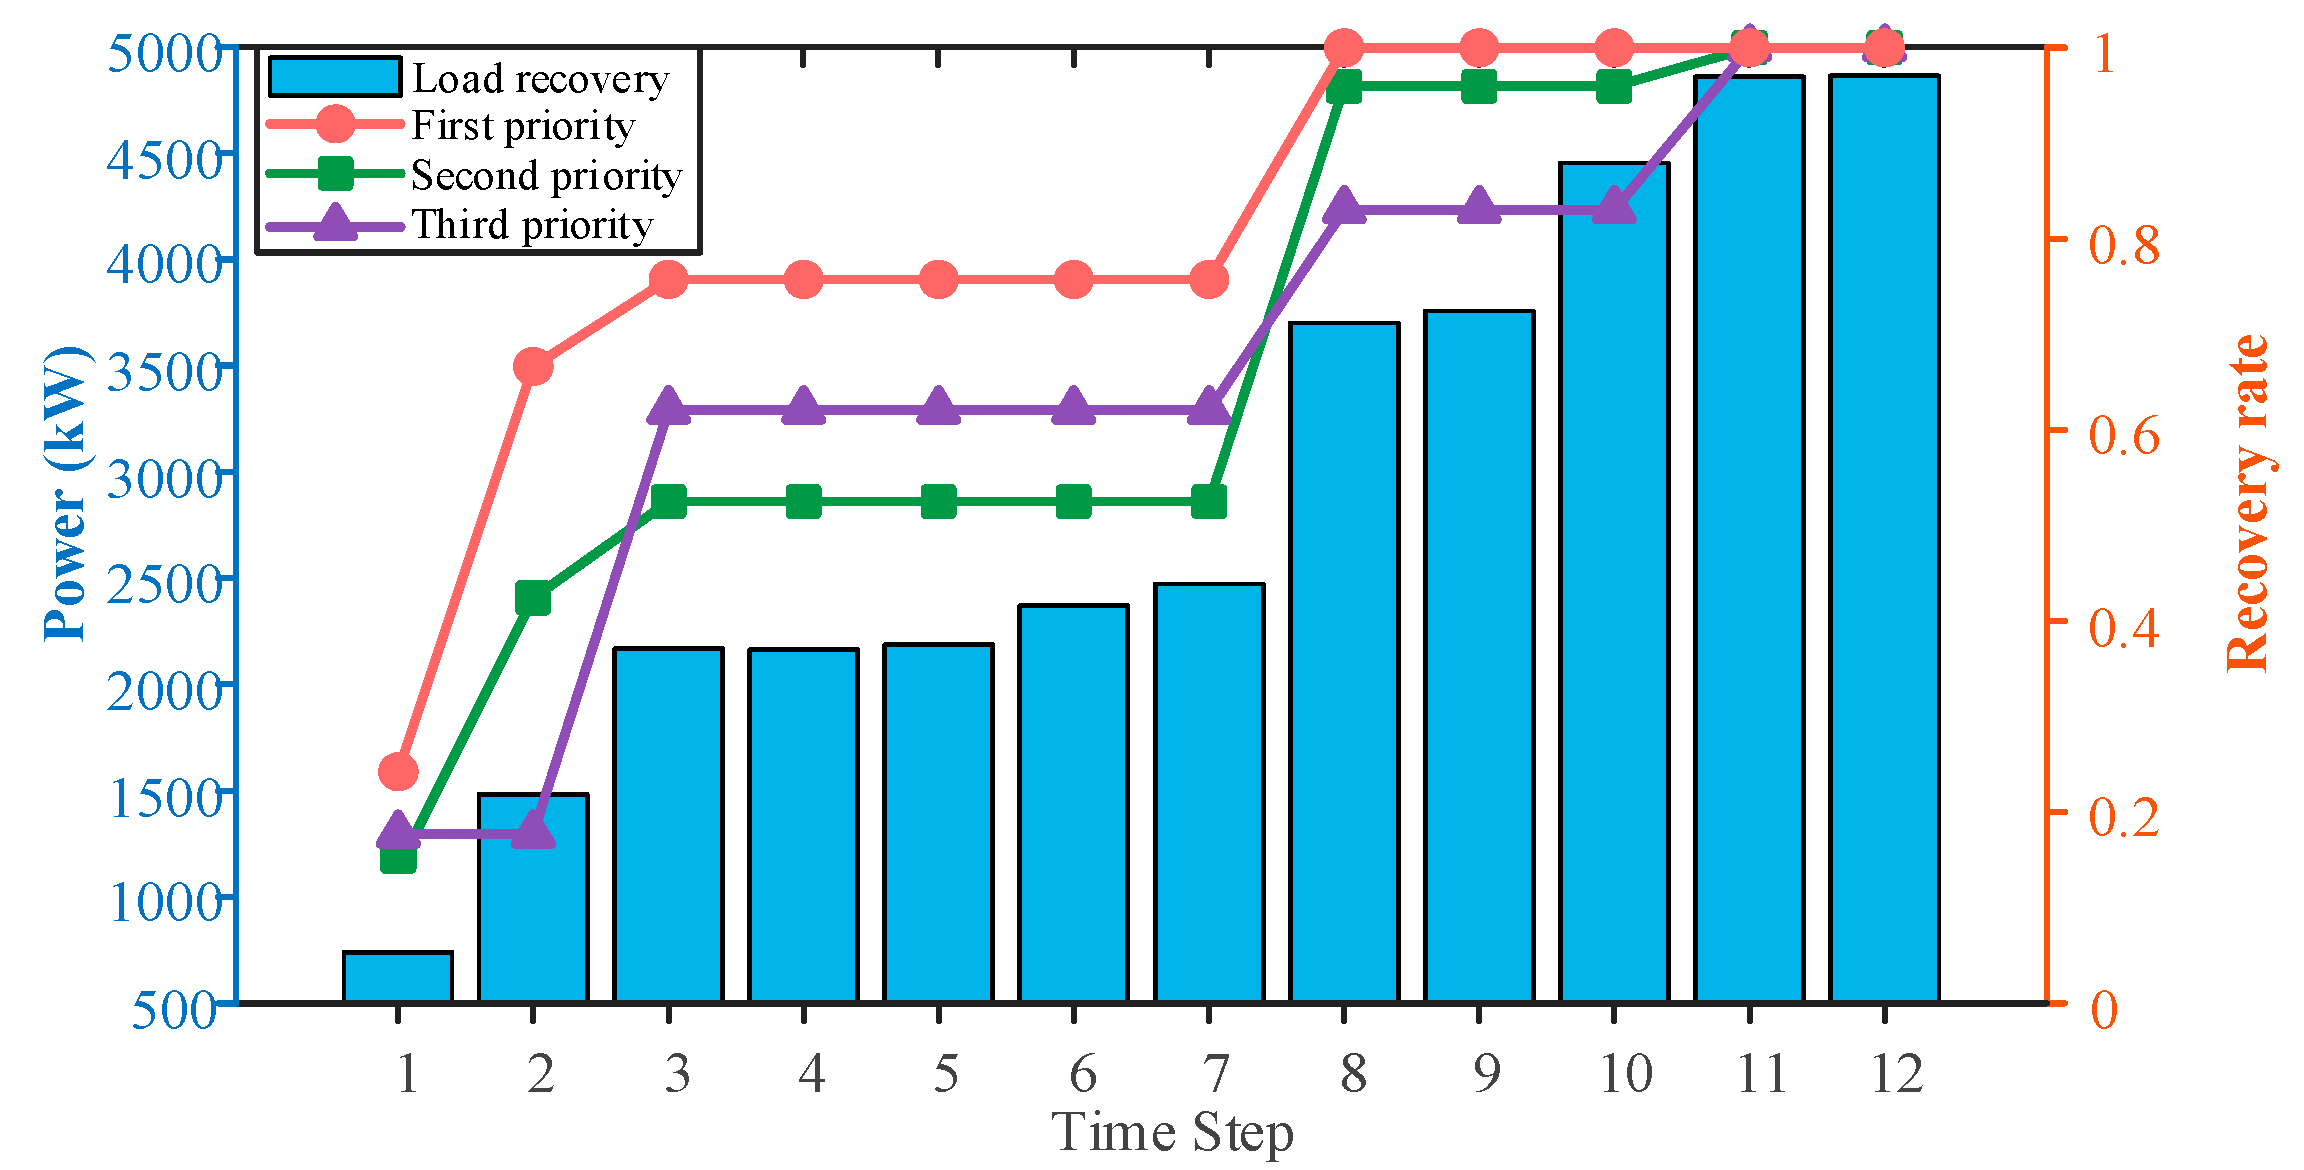
Figure 8 presents the total restored load quantity and restoration rate of loads with different priority levels. In Figure 8, the left vertical axis represents the total restored load quantity, while the right vertical axis shows the restoration rate for each load priority level. As seen in Figure 8, the restoration rate for priority 1 loads is the highest at every time step. The restoration rate for priority 2 loads is lower than that of priority 3 loads during time steps 3–7. This is because at time steps 3–7, the potential faulty lines have not been eliminated and repaired. In the current state of available lines, all restorable buses have been recovered, and the proportion of priority 3 loads among all currently restorable buses is relatively large, leading to a higher restoration rate for them compared to priority 2 loads. At time step 8, the potential fault locations are eliminated and repaired. From time steps 8–10, the restoration rate of priority 2 loads is greater than that of priority 3 loads. All priority 1 loads are restored at time step 8, and all priority 2 and priority 3 loads are restored at time step 11. Therefore, the restoration strategy proposed in this paper can achieve the prioritized restoration of priority 1 loads.
Restored energy with different values of parameters μ and κ is shown in Table 5. It is seen from Table 5 that restored energy increases with the increasing value of parameters μ and κ. This is because large values of these two parameters result in the larger radius bound of the difference between the actual power of the new energy generator and its predicted one.

4. Conclusions

This paper addresses the challenges faced by distribution networks under extreme weather conditions, specifically the issue of incomplete fault information, by proposing a repair sequencing and load restoration strategy based on a two-layer robust optimization approach. The upper-layer model employs distributionally robust theory to determine the robust repair time for potential faults under the most unfavorable fault scenario, effectively addressing the uncertainty of fault information. The lower-layer model coordinates the scheduling of multiple resources, including MDGs, DGs, PVs, WTs, and ESSs, to maximize the weighted restored load. Simulation results on an IEEE 33-bus power system demonstrate that the proposed strategy not only efficiently utilizes multi-source collaborative resources but also ensures the reliability and effectiveness of repair and restoration decisions in an uncertain fault environment. Additionally, it achieves the prioritized restoration of high-priority loads.

Author Contributions

Conceptualization, H.W. and C.X.; methodology, X.W.; software, H.W.; validation, J.L. and L.X.; formal analysis, X.W.; investigation, C.X.; resources, L.X.; data curation, L.S.; writing—original draft preparation, X.W.; writing—review and editing, X.W.; visualization, X.W.; supervision, C.X.; project administration, L.X.; funding acquisition, J.L. All authors have read and agreed to the published version of the manuscript.

Funding

This work was supported by the Science and Technology Project of State Grid Anhui Electric Power Co., Ltd., grant number B3120524001N.

Data Availability Statement

The original contributions presented in this study are included in the article. Further inquiries can be directed to the corresponding author.

Conflicts of Interest

Authors Cheng Xie and Jianlin Li were employed by the State Grid Anhui Electric Power Co., Ltd. Authors Xunting Wang and Lingzhi Xia were employed by Electric Power Research Institute, State Grid Anhui Electric Power Co., Ltd. The remaining authors declare that the research was conducted in the absence of any commercial or financial relationships that could be construed as a potential conflict of interest. The company had no role in the design of the study; in the collection, analyses, or interpretation of data; in the writing of the manuscript; or in the decision to publish the results.

Nomenclature

Sets and Indexes
R + S Set of positive real numbers for the scenario probability distribution.
Ω A Feasible domain of subproblem of the upper-layer model, including Equation (11).
Ω B Set of distribution network buses.
Ω C Set of charging station buses.
Ω D Set of depots.
Ω ESS Set of ESSs.
Ω FZ Set of fault areas.
Ω G Set of generators.
Ω K Set of potential fault locations.
Ω L Set of distribution network lines.
Ω MDG Set of MDGs.
Ω PV Set of PVs.
Ω S Set of fault scenarios.
Ω sub Set of substation buses.
Ω T Set of time steps.
Ω U Feasible domain of master problem of the upper-layer model, including Equations (2)–(10).
Ω WT Set of WTs.
Parameters
C i M Maximum number of connections for charging station bus i.
C a p d RC Number of RCs in depot d.
E i M Capacity of ESS i.
H i ini Initial state-of-charge level of ESS i.
H i min , H i max Minimum and maximum state-of-charge levels of ESS i, respectively.
I ¯ i j Square of the rated current of the line.
M A large parameter.
p i , t C , min , p i , t C , max Minimum and maximum active charging power of ESS i, respectively.
p i D , min , p i D , max Minimum and maximum active discharging power of ESS i, respectively.
p i G , min , p i G , max Minimum and maximum active power of the generator at bus i, respectively.
p ¯ i , t A Predicted power of the new energy source at bus i at time t.
p ¯ m M Upper limit of the active power output of MDG m.
p _ i RP , p ¯ i RP Ramp rate upper and lower limits of the generator at bus i, respectively.
p ¯ i , t R Actual power of the new energy source at bus i.
P ¯ i j , Q ¯ i j Rated active and reactive power transmitted by the line, respectively.
q i , t C , min , q i , t C , max Minimum and maximum reactive charging power of ESS i, respectively.
q i , t D , min , q i , t D , max Minimum and maximum reactive discharging power of ESS i, respectively.
q i G , min , q i G , max Minimum and maximum reactive power of the generator at bus i, respectively.
q i , t L Reactive power demand of bus i at time t.
q ¯ m M Upper limit of the reactive power output of MDG m.
r i j Resistance line ij.
t k RC , CH Time for RC to inspect potential fault location k to check for a fault.
t k RC , DE Time required for RC to repair potential fault location k.
t k , k RC , TR Travel time of RC between potential fault locations k′ and k.
T i , j tra Travel time of an MDG between charging station buses i and j.
V ¯ , V _ Square of the lower and upper limits of the bus voltage, respectively.
w i Weight of buses.
x i j Reactance of line ij.
ε A positive number approaching zero.
θ 1 , θ Maximum values of the first-order norm and infinite norm of the scenario probability deviation, respectively.
κ Robustness parameter of new energy source.
μ Maximum prediction error of the new energy output.
η i C , η i D Charging and discharging loss coefficients of ESS i, respectively.
Δ T Time duration of one step.
Variables
A k , s Binary variable indicating whether potential fault location k belongs to scenario s, where 1 means it belongs to scenario s and 0 otherwise.
E i , t Remaining energy of ESS i at time t.
f k , k Binary variable, where 1 indicates that a RC travels from a potential fault location k′ to k, and 0 otherwise.
I i j , t Square of the current transmitted by line ij at time t.
p s Probability of scenario s.
p i , t C , p i , t D Charging and discharging power of ESS i, respectively.
p i , t G , q i , t G Active and reactive power of the generator at bus i at time t, respectively.
p i , t L Active power demand of bus i at time t.
p m , i , t MDG Active power output of MDG m at charging station bus i at time t.
p i , t PV Active power of the PVs at bus i at time t.
p i , t WT Active power of the WTs at bus i at time t
P i j , t , Q i j , t Active and reactive power transmitted by the line, respectively.
q i , t C , q i , t D Charging and discharging reactive power of ESS i, respectively.
q m , i , t MDG Reactive power output of MDG m at charging station bus i at time t.
t k , s RC , AR Time for an RC to arrive at potential fault location k in scenario s.
T main Robust fault repair time of the upper-layer model.
T k , s R Repair completion time for potential fault location k in scenario s, which is an integer variable.
v i , t Binary variable for the energized status of bus i at time step t, where 1 indicates the bus is energized and 0 otherwise.
V i , t Square of the bus voltage.
x i , t C , x i , t D Binary variable indicating charging and discharging status of ESS i, respectively, where 1 indicates that ESS i is in a charging or discharging state.
y i j , t Binary variable for the energized status of line ij at time t, where 1 means it is energized and 0 otherwise.
α i j , t Binary variable indicating whether bus i is the parent bus of bus j at time t, where 1 means bus i is the parent bus of bus j, and 0 otherwise.
γ m , i , t Binary variable indicating whether MDG m is connected to charging station bus i at time t.
τ s Repair completion time of all faults under scenario s.
κ s Auxiliary variable introduced for the linearized absolute value calculation.
λ 1 , λ s 2 , λ s 3 , λ s 4 , λ s 5 , λ s 6 , λ 7 Dual variables.

References

  1. Yang, X.; Xu, C.; Wen, J.; Zhang, Y.; Wu, Q.; Zuo, W. Cooperative repair scheduling and service restoration for distribution systems with soft open points. IEEE Trans. Smart Grid 2023, 14, 1827–1842. [Google Scholar] [CrossRef]
  2. Hou, H.; Wang, Y.; Bai, X.; Lv, J.; Cui, R.; Zhang, L.; Li, S.; Li, Z. Modelling icing growth on overhead transmission lines: Current advances and future directions. Energy Convers. Econ. 2024, 6, 343–357. [Google Scholar] [CrossRef]
  3. Li, H.; Zhang, Y.; Ju, Y.; Li, K.; Zhang, B.; Vazquez, S. A multi-timescale stability analysis framework for isolated DC microgrids. Chin. J. Elect. Eng. 2025; early access. [Google Scholar] [CrossRef]
  4. Sun, L.; Wang, H.; Huang, Z.; Wen, F.; Ding, M. Coordinated islanding partition and scheduling strategy for service restoration of active distribution networks considering minimum sustainable duration. IEEE Trans. Smart Grid 2024, 15, 5539–5554. [Google Scholar] [CrossRef]
  5. Lan, L.; Liu, G.; Zhu, S.; Hou, M.; Liu, X. Fault recovery strategy for urban distribution networks using soft open points. Energy Convers. Econ. 2024, 5, 42–53. [Google Scholar] [CrossRef]
  6. Lu, M.; Liu, Y.; Yan, Y.; Bian, R.; Du, Y.; Jiang, X. Distribution network repair scheduling with multiple types of cooperation using dynamic programming after disasters. IEEE Trans. Power Del. 2023, 38, 631–641. [Google Scholar] [CrossRef]
  7. Peng, Y.; Yang, Y.; Chen, M.; Wang, X.; Xiong, Y.; Wang, M. Value evaluation method for pumped storage in the new power system. Chin. J. Elect. Eng. 2023, 9, 26–38. [Google Scholar] [CrossRef]
  8. Taheri, B.; Safdarian, A.; Moeini-Aghtaie, M.; Lehtonen, M. Distribution system resilience enhancement via mobile emergency generators. IEEE Trans. Power Del. 2021, 36, 2308–2319. [Google Scholar] [CrossRef]
  9. Liu, F.; Chen, C.; Lin, C.; Li, G.; Xie, H.; Bie, Z. Utilizing aggregated distributed renewable energy sources with control coordination for resilient distribution system restoration. IEEE Trans. Sustain. Energy 2023, 14, 1043–1056. [Google Scholar] [CrossRef]
  10. Maji, A.; Croella, A.L.; Dose, V.; D’ Agostino, G.; Palagi, L.; Tofani, A. OPT-RecSIM: An optimization-simulation integrated system for the repair sequence optimization problem. Electr. Power Syst. Res. 2025, 249, 111995. [Google Scholar] [CrossRef]
  11. Lei, S.; Wang, J.; Chen, C.; Hou, Y. Mobile emergency generator pre-positioning and real-time allocation for resilient response to natural disasters. IEEE Trans. Smart Grid 2018, 9, 2030–2041. [Google Scholar] [CrossRef]
  12. Wu, Y.; Wang, J.; Song, Y.; Xie, Y. Resilience-oriented valuation for energy storage amidst extreme events. Chin. J. Elect. Eng. 2023, 9, 15–25. [Google Scholar] [CrossRef]
  13. Shen, F.; Wu, Q.; Huang, S.; López, J.C.; Li, C.; Zhou, B. Review of Service Restoration Methods in Distribution Networks. In Proceedings of the 2018 IEEE PES Innovative Smart Grid Technologies Conference Europe (ISGT-Europe), Sarajevo, Bosnia and Herzegovina, 21–25 October 2018; pp. 1–6. [Google Scholar] [CrossRef]
  14. Zhao, Y.; Lin, J.; Song, Y.; Xu, Y. A robust microgrid formation strategy for resilience enhancement of hydrogen penetrated active distribution networks. IEEE Trans. Power Syst. 2024, 39, 2735–2748. [Google Scholar] [CrossRef]
  15. Liu, J.; Qin, C.; Yu, Y. Enhancing distribution system resilience with proactive islanding and RCS-based fast fault isolation and service restoration. IEEE Trans. Smart Grid 2020, 11, 2381–2395. [Google Scholar] [CrossRef]
  16. Cai, S.; Xie, Y.; Wu, Q.; Zhang, M.; Jin, X.; Xiang, Z. Distributionally robust microgrid formation approach for service restoration under random contingency. IEEE Trans. Smart Grid 2021, 12, 4926–4937. [Google Scholar] [CrossRef]
  17. Sedzro, K.S.A.; Shi, X.; Lamadrid, A.J.; Zuluaga, L.F. A heuristic approach to the post-disturbance and stochastic pre-disturbance microgrid formation problem. IEEE Trans. Smart Grid 2019, 10, 5574–5586. [Google Scholar] [CrossRef]
  18. Cai, S.; Zhang, M.; Xie, Y.; Wu, Q.; Jin, X.; Xiang, Z. Hybrid stochastic-robust service restoration for wind power penetrated distribution systems considering subsequent random contingencies. IEEE Trans. Smart Grid 2022, 13, 2859–2872. [Google Scholar] [CrossRef]
  19. Xu, R.; Zhang, C.; Zhang, D.; Dong, Z.; Yip, C. Adaptive robust load restoration via coordinating distribution network reconfiguration and mobile energy storage. IEEE Trans. Smart Grid 2024, 15, 5485–5499. [Google Scholar] [CrossRef]
  20. Arif, A.; Wang, Z.; Chen, C.; Wang, J. Repair and resource scheduling in unbalanced distribution systems using neighborhood search. IEEE Trans. Smart Grid 2020, 11, 673–685. [Google Scholar] [CrossRef]
  21. Pang, K.; Wang, C.; Hatziargyriou, N.D.; Wen, F. Microgrid formation and real-time scheduling of active distribution networks considering source-load stochasticity. IEEE Trans. Power Syst. 2024, 39, 2801–2813. [Google Scholar] [CrossRef]
  22. Arif, A.; Ma, S.; Wang, Z.; Wang, J.; Ryan, S.M.; Chen, C. Optimizing service restoration in distribution systems with uncertain repair time and demand. IEEE Trans. Power Syst. 2018, 33, 6828–6838. [Google Scholar] [CrossRef]
  23. Pang, K.; Wang, C.; Hatziargyriou, N.D.; Wen, F. Dynamic restoration of active distribution networks by coordinated repair crew dispatch and cold load pickup. IEEE Trans. Power Syst. 2024, 39, 4699–4713. [Google Scholar] [CrossRef]
  24. Zhang, M.; Cai, S.; Xie, Y.; Zhou, B.; Zheng, W.; Wu, Q. Supply resilience constrained scheduling of megs for distribution system restoration: A stochastic model and FW-PH algorithm. IEEE Trans. Smart Grid 2025, 16, 194–208. [Google Scholar] [CrossRef]
  25. Zhu, X.; Si, Y. Multi-period dynamic power supply recovery strategy for distribution networks considering cyber-physical-traffic network coupling. IEEE Trans. Power Del. 2023, 38, 4454–4464. [Google Scholar] [CrossRef]
  26. Chen, B.; Chen, C.; Wang, J.; Butler-Purry, K.L. Multi-time step service restoration for advanced distribution systems and microgrids. IEEE Trans. Smart Grid 2018, 9, 6793–6805. [Google Scholar] [CrossRef]
  27. Zheng, X.; Khodayar, M.E.; Wang, J.; Yue, M.; Zhou, A. Distributionally robust multistage dispatch with discrete recourse of energy storage systems. IEEE Trans. Power Syst. 2024, 39, 6960–6973. [Google Scholar] [CrossRef]
  28. Yin, C.; Wu, X.; Wang, X. Two-stage resilient recovery of unbalanced distribution system considering intelligent zoning and merging of microgrids. IEEE Trans. Smart Grid 2024, 15, 5555–5567. [Google Scholar] [CrossRef]
  29. Boyd, S.; Vandenberghe, L. Convex Optimization; Cambridge Univ. Press: New York, NY, USA, 2004. [Google Scholar]
  30. Sun, L.; Wei, Y.; Lin, Z.; Yang, X.; Li, M.; Wen, F.; Ding, M. Determining optimal generator start-up sequence in bulk power system restoration considering uncertainties: A confidence gap decision theory based robust optimization approach. Int. J. Elect. Power Energy Syst. 2023, 153, 109365. [Google Scholar] [CrossRef]
  31. Kumar, V.; Kumar, H.C.R.; Gupta, I.; Gupta, H.O. DG integrated approach for service restoration under cold load pickup. IEEE Trans. Power Deliv. 2010, 25, 398–406. [Google Scholar] [CrossRef]
  32. Huang, Y.; Lin, Z.; Liu, X.; Yang, L.; Dan, Y.; Zhu, Y.; Ding, Y.; Wang, Q. Bi-level coordinated planning of active distribution network considering demand response resources and severely restricted scenarios. J. Mod. Power Syst. Clean Energy 2021, 9, 1088–1100. [Google Scholar] [CrossRef]
  33. Wang, T.; Wu, C.; Sui, Q.; Chen, C.; Ma, Y.; Lin, X.; Li, Z.; Wei, F. Integrated dispatching strategy for post-disaster distribution networks with fault repair and network reconfiguration. Proc. CSEE 2024, 44, 1764–1776. [Google Scholar]
  34. Ghasemkhani, A.; Yang, L.; Zhang, J. Learning-based demand response for privacy-preserving users. IEEE Trans. Ind. Inform. 2019, 15, 4988–4998. [Google Scholar] [CrossRef]
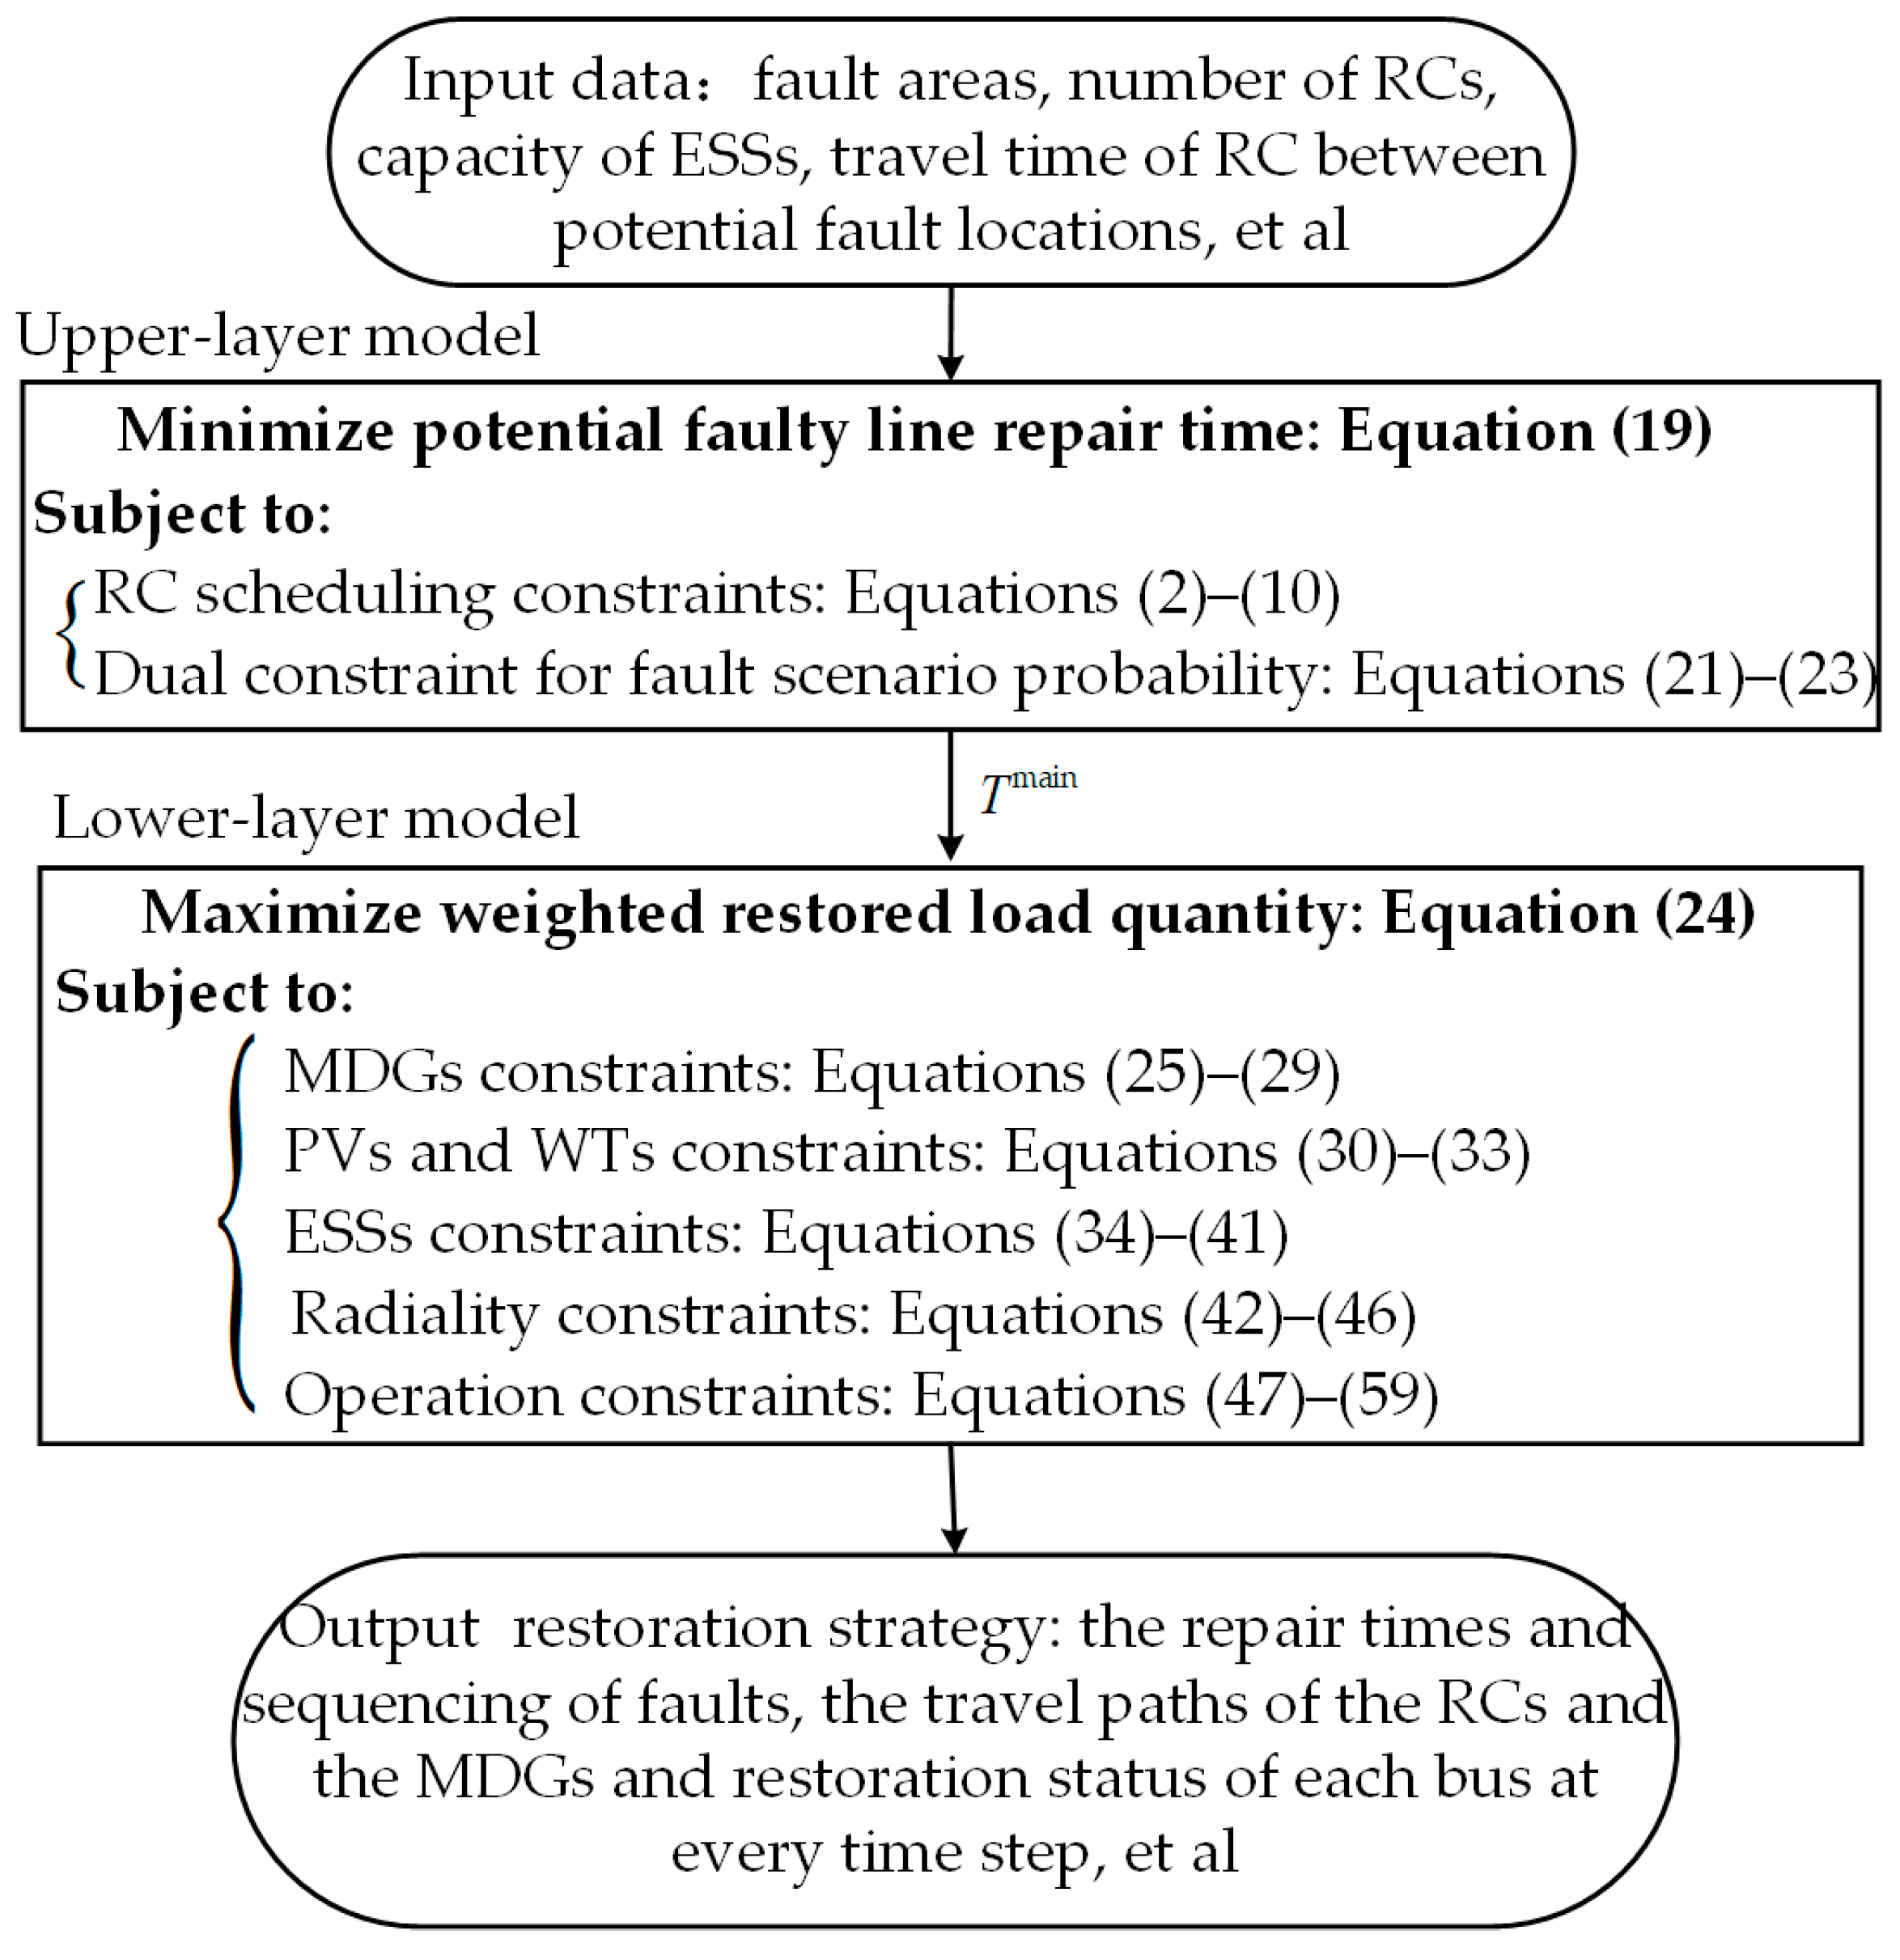
Figure 1. The framework diagram of the proposed restoration strategy.
Processes 13 03075 g001
Figure 2. The modified IEEE 33-bus power system.
Processes 13 03075 g002
Figure 3. Travel paths of the RCs.
Processes 13 03075 g003
Figure 4. Travel paths of the MDGs.
Processes 13 03075 g004
Figure 5. Active power generation of DGs, MDGs, WTs and PVs.
Processes 13 03075 g005
Figure 6. The situation of the recovery status of each bus at each time step obtained by solving the proposed strategy. (a) The recovery status of each bus at time step 1; (b) The recovery status of each bus at time step 2; (c) The recovery status of each bus at time steps 3–7; (d) The recovery status of each bus at time steps 8–10; (e) The recovery status of each bus at time steps 11–12.
Processes 13 03075 g006
Figure 7. The power and energy of ESSs at different buses.
Processes 13 03075 g007
Figure 8. Total restored load quantity and restoration rate of loads with different priority levels.
Processes 13 03075 g008
Table 1. Statistical comparisons among the proposed model and existing works.
[8][10][19][23][25][26][27][28]This Work
RC×××
ESS××
MDG××××××
Incomplete Fault Information××××××××
Uncertainty of fault scenario××××××
Robust optimization××××××
Table 2. Parameters of DGs and MDGs.
TypeBus No.Maximum and Minimum
Power Outputs
Other Parameters
Substation and DG0/4/29 p i G , max = 2000/1000/800 kW
p i G , min = 0/0/0 kW
q i G , max = 1500/600/600 kVar
q i G , min = −(1500/600/600) kVar
p ¯ i RP = 350/100/100) kW/15 min
p _ i RP = −(350/100/100) kW/15 min
MDG/ p ¯ m M = 200/100 kW
q ¯ m M = 150/100 kVar
/
Table 3. Parameters of ESSs.
Bus No.Parameters
11/23 p i D , max = 200/300 kW
p i C , max = 200/300 kW
q i D , max = 100/200 kVar
q i C , max = 100/200 kVar
E i M = 600/900 kWh
H i min = 0.1/0.1
H i max = 0.9/0.9
H i ini = 0.5/0.5
η i C = 0.9/0.95
η i D = 0.9/0.95
Table 4. Parameters of load priority.
PriorityBus No.Weight
Priority 12, 4, 12, 16, 20, 22, 24, 28100
Priority 20, 3, 8–10, 13–15, 17, 18, 21, 23, 26, 30, 3210
Priority 31, 5–7, 11, 19, 25, 27, 29, 311
Table 5. Restored energy with different values of parameters μ and κ.
κ = 0.2 κ = 0.4 κ = 0.6 κ = 0.8 κ = 1
μ = 0.18.7188.7188.7598.7928.806
μ = 0.28.7188.7598.8038.9478.997
μ = 0.48.7598.9479.0139.0879.196
μ = 0.68.8039.0139.1509.2319.342
μ = 0.88.9479.0879.2319.3429.359
μ = 18.9979.1969.3429.3599.457
Disclaimer/Publisher’s Note: The statements, opinions and data contained in all publications are solely those of the individual author(s) and contributor(s) and not of MDPI and/or the editor(s). MDPI and/or the editor(s) disclaim responsibility for any injury to people or property resulting from any ideas, methods, instructions or products referred to in the content.