Abstract
Fused Filament Fabrication (FFF) is the most used additive manufacturing (AM) technique. Understanding the behavior of the in situ temperature profile during the cooling stage is crucial to enhancing the mechanical properties of the parts manufactured by FFF since adhesion between printed layers is strongly related to the polymer cooling rate. However, only some studies analyze each layer in detail. For such analysis, infrared thermographic cameras can be used as a tool for non-contact temperature measurement. Numerous variables in constructing the part offer potential for such investigation. This study may lead to the enhancement of the part manufactured and improvements in the 3D printer itself. In addition, the polymer matrix and the manufacturing software can also be optimized. This work aims to systematically evaluate the temperature profile along the deposited layers during the fabrication of three-dimensional parts using poly(lactic acid) (PLA) filament. An infrared camera was used for real-time temperature measurements, and the data were processed with MATLAB® as a function of time and part length. A difference of up to 30 °C was observed between the edges, and non-uniform temperature profiles were also observed at the beginning, middle, and end of the part manufacturing. The highest temperatures were observed at the side where the print nozzle positions itself for the base to descend to the next layer. Several strategies are proposed to enhance the temperature distribution during the cooling process.
1. Introduction
The additive manufacturing (AM) technique is based on the successive addition of layers of material, allowing the production of complex geometries. Among different possible AM techniques, material extrusion-based additive manufacturing is one of the most used due to the low cost of the equipment and the raw materials and the ease of handling the equipment [1,2,3,4,5,6,7,8]. After more than a decade of intense studies, after the patent’s expiration [9], the analysis of temperature behavior is still challenging.
Heat losses during the cooling stage highly affect parts produced with polymeric materials through conventional processes [10], particularly regarding mechanical properties. The layer-by-layer cooling process leads to varying microstructures, crystallization rates, and thermal stresses, all contributing to the mechanical anisotropy observed in printed parts. The cooling rate and thermal history within the part play a critical role in determining the material’s strength, stiffness, and overall durability, with the weakest mechanical properties typically observed in the z-direction (perpendicular to the build layers). These effects highlight the importance of process control, such as cooling rate optimization and material choice, to reduce anisotropy and improve the mechanical performance of 3D-printed parts.
Nevertheless, the thermal control of 3D printing processes is a challenging task. This is due to a random geometry’s inherent complex and multimode heat transfer processes. Costa et al. (2015) studied heat transfer by conduction to the platform and adjacent filament and convection and radiation with the surrounding environment and within the voids between filaments during the cooling process of a 3D-printed part. According to the authors, convection losses to the surrounding environment and conduction losses to the base and adjacent filament are significant events in printing compared to other thermal events, such as heat exchange by convection with the surroundings and conduction between adjacent filaments [11]. All three heat transfer modes are present during the cooling of the part, namely conduction, convection, and thermal radiation, for high-temperature increase and/or emissivity [12,13,14,15,16]. Therefore, the heat transfer analysis must involve the three coupled modes [17].
Non-intrusive temperature measurements using an infrared thermography camera can detect when the top deposited layer reaches the glass transition temperature (Tg). This threshold temperature is essential for determining warping and cracks [18]. Thermal mapping can help calculate deformation [17] and choose the weld quality between the filaments [19]. Thermographic studies indicate that the position of the part on the building platform is a factor that influences the heat received by the part [17,20,21]. In certain conditions studied, better results were obtained when the nozzle fan was off [22], promoting energy savings. Failures in 3D printing can also be identified using infrared thermography [23]. Tang et al. (2023) observed a good relationship between the measurements of the nozzle temperature of different extruders performed by thermocouples and thermographic cameras [24]. Vanaei et al. (2021) have indicated that thermography presents an advantage over thermocouple measurements in capturing data from complex components, enabling the acquisition of the global temperature profile [25]. Bauriedel et al. (2024) investigated the influence of changing the material of the print nozzle [26]. The brass nozzle exhibited higher temperatures than steel, even under lower printing temperature conditions.
Understanding the macromolecule’s behavior while manufacturing printed parts is crucial for optimizing the equipment and the polymeric matrices [27,28,29,30,31,32,33,34,35]. According to the literature review conducted by Oleff et al. (2021) [36], few studies have been reported on temperature monitoring during printing, totaling fewer than 20 publications. Among these, less than half specifically focused on the layer, possibly due to the need for high-resolution cameras to capture information at a micrometric scale. This situation highlights the importance of the topic addressed in the present paper and the relevance of the work.
Practical challenges in capturing and processing data from thermographic images must be overcome. Seppala and Migler (2017) changed the g-code to keep the nozzle at a fixed position in front of the camera, which allowed the obtaining of thermographic data for the in situ analysis of the cooling profile [37]. Zhou et al. (2017) used an infrared sensor coupled to the printing head to record a continuous increase in the temperature of the printing box environment during part manufacturing [38]. In the study by Hartmann et al. (2022), thermography was used for temperature measurements, and a mathematical model was used to describe the temperature evolution on a curved surface [39].
The effect of indirect nozzle heating has been reported in the literature [40]. Such an effect is more significant as the printing head speed decreases [37,38]. Seppala and Migler observed that the heat transfer by radiation from the nozzle in their experiments can be neglected [41]. Additionally, Hossain et al. (2021) stated that the more significant heating of the lower layer occurs by conduction from the newly deposited layer [41]. A deeper analysis to correlate the location where the printing nozzle pauses for layer change and the extent to which the heat diffuses into the part is essential, directly affecting the interlayer bonding behavior for that region’s location. Wolszczak et al. (2018) qualitatively indicated a more intense heating of the workpiece on one of its sides [40], but heat losses were not quantitated.
In the present work, ME analyzes the experimental temperature data during the cooling profile for different stages of polymer processing. Another challenge this work explores is the temperature measurement of the thin deposited layer with sufficient resolution. Thus, the objective of the present study is to conduct a detailed investigation of the temperature profile along the deposited layer from the beginning to the end of the manufacturing process. Finally, the influence of heat emitted by the nozzle on the workpiece, which remains in the same position during layer transition, was examined.
2. Materials and Methods
PLA in pellets (Ingeo Biopolymer 2003D, Natureworks, USA) was extruded in a 1.75 mm diameter filament on the AX 16:26 single screw extruder (AX Plásticos, São Paulo, Brazil) with monofilament die and coupled winder. The temperatures in the three heating zones were 160, 175, and 170 °C. The screw and winder rotations were 33 rpm and 20 rpm, respectively. The filament was used as raw material for the 3D printing samples manufactured in the Cloner Brasil 3D printer model ST. The g-code was generated by the program Slic3r Prusa Edition 1.36.2-prusa 3d-win64 within the program Repetier-Host V2.0.5. Some printing parameters are described next: the deposition angle was 0°, the speed of the head was set to 20 mm/s, the printing temperature was 200 °C, and there was no heating at the printing base and no top/bottom layer. The platform was not heated to avoid interferences in the thermographic measurements.
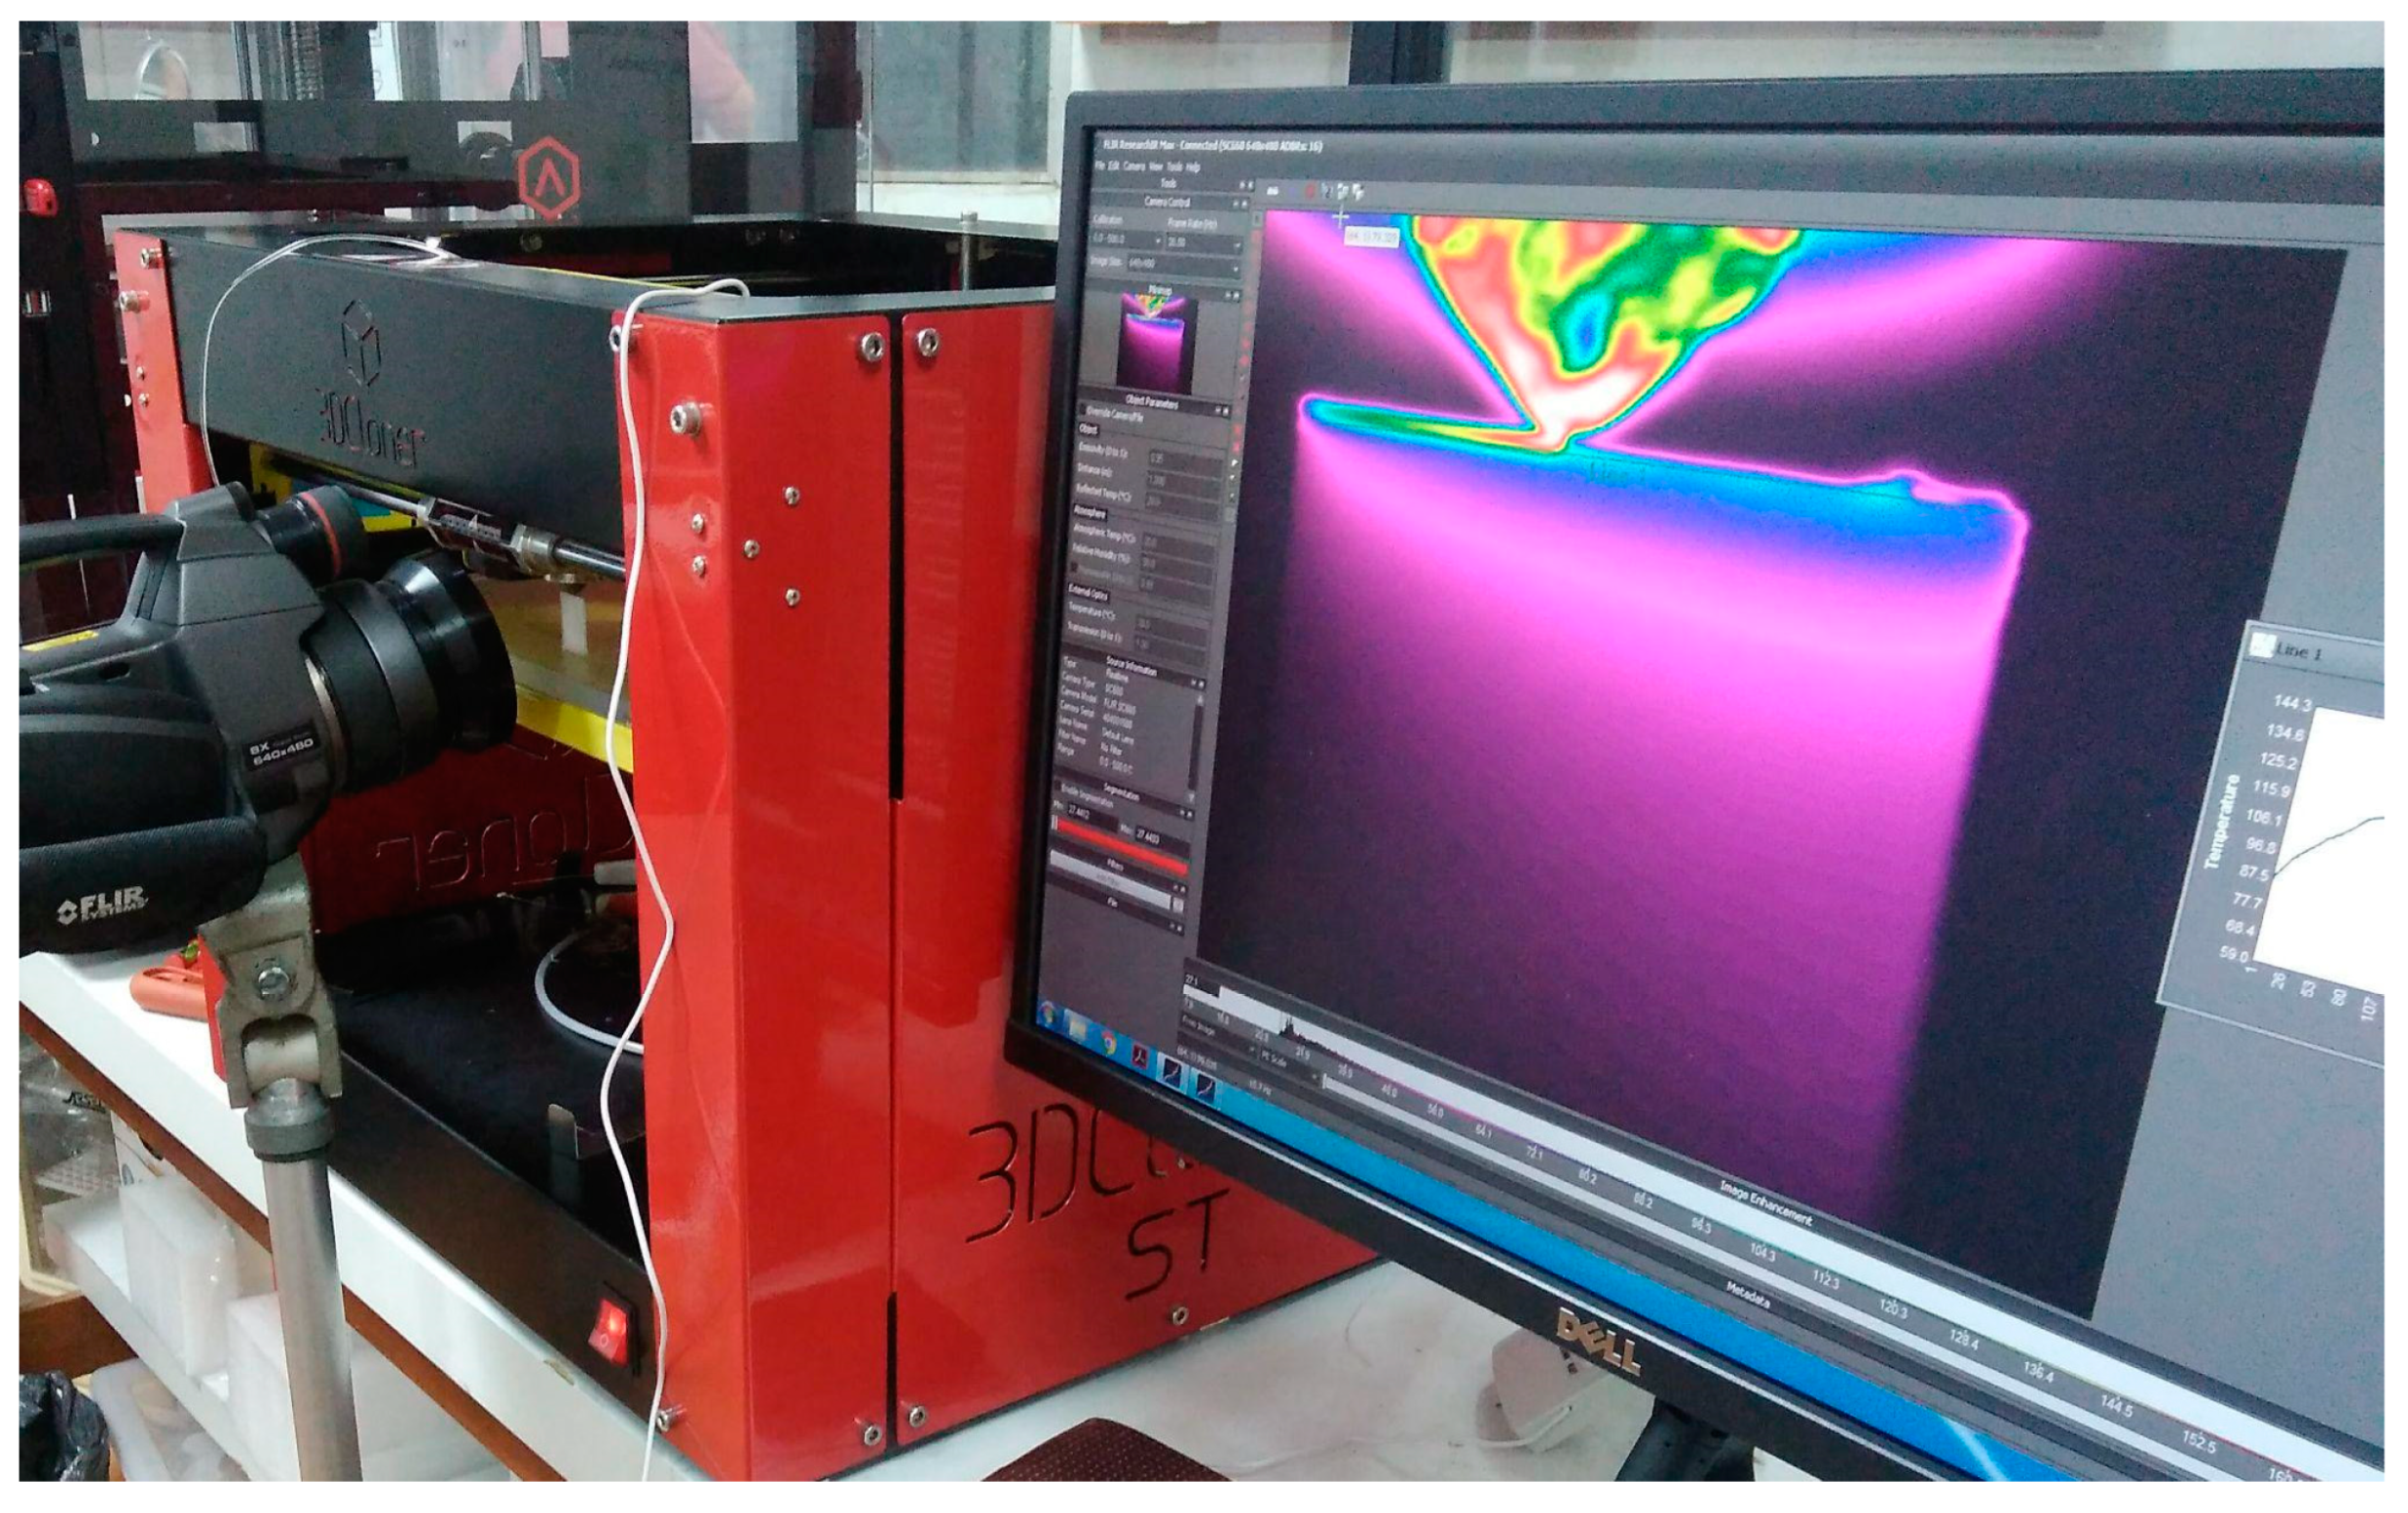
The room temperature was constant during all the experiments. Non-intrusive temperature measurements were performed during manufacturing using a FLIR Systems ThermoVision® SC660 thermographic camera. Thermographic images are generated by converting radiation in the infrared spectrum into an electrical signal by uncooled Focal Plane Array microbolometer detectors. The camera has a minimum focal length of 30 mm, a 25 × 19° field of view, and a 640-by-480-pixel resolution. The emissivity chosen was 1 for the part manufactured with PLA, i.e., it is assumed as a blackbody [42,43]. Tests were performed with lower emissivity values, resulting in temperature variations lower than 0.1419 °C, the standard deviation of the error of the measurements. Therefore, the value of 1 was selected for all experiments. The distance from the camera to the part was approximately 10 cm. To facilitate data capture by the thermographic camera, the specimens in the program were positioned in the frontmost part of the platform (near its bottom), as indicated in Figure 1.
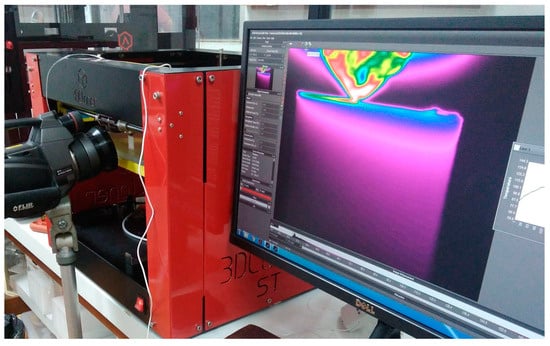
Figure 1.
In situ thermographic analysis of the printed parts showing the specimens of the part on the construction platform.
The parts were manufactured with cylinders with 0.4 mm diameter and 2 cm length, one on top of the other, forming a wall. This strategy forces the printing nozzle to remain horizontal by varying the X positions and with a constant Y position.
Static and Dynamic Thermographic Analysis
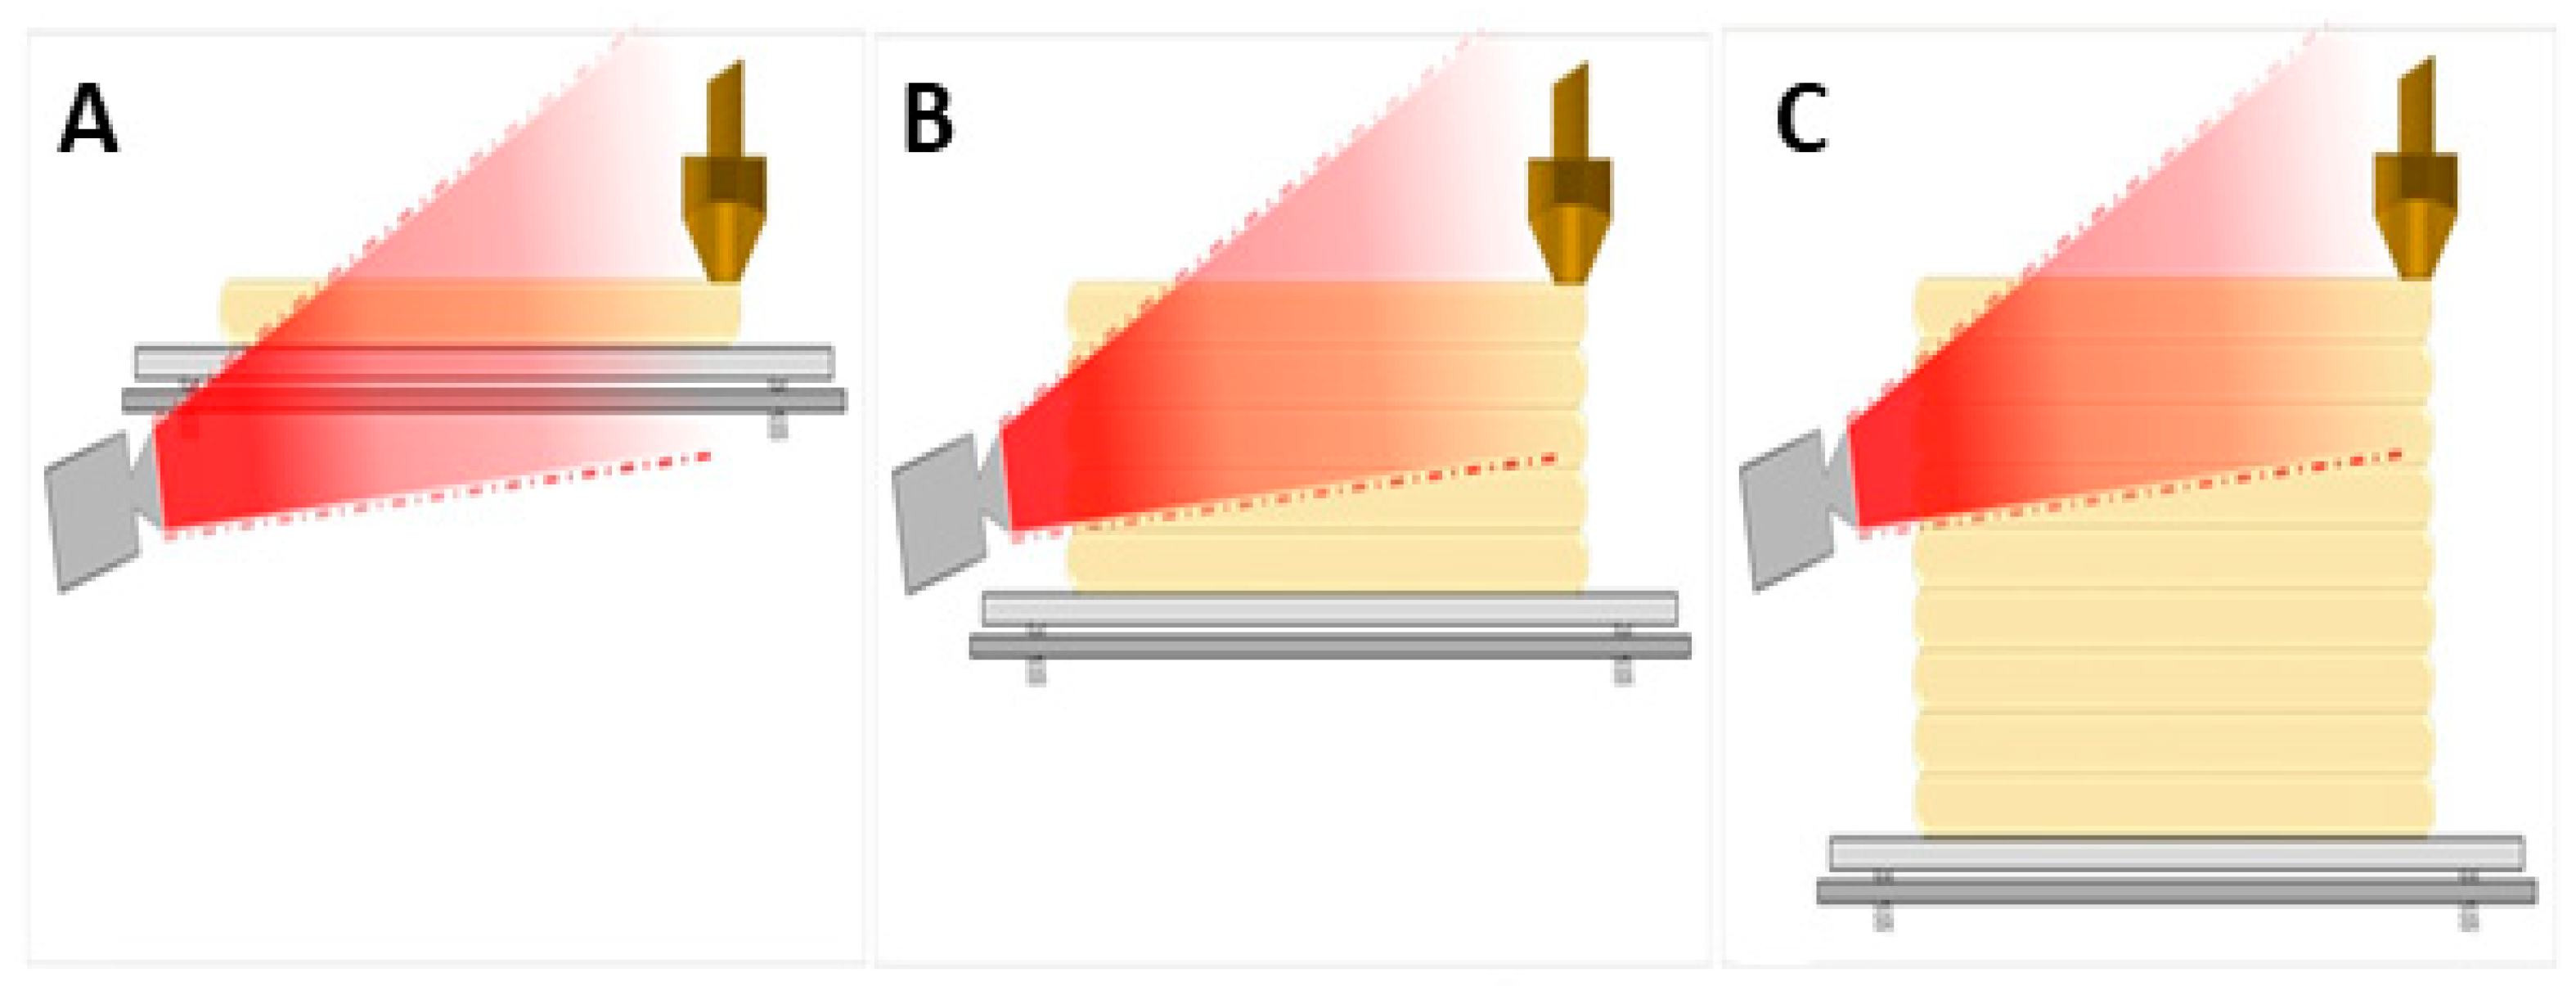
Preliminary tests indicated variations in the cooling rate during part fabrication that were greater when observed at the beginning and end of fabrication. Considering that the filming acquisition time was approximately 45 s, three manufacturing moments were registered, indicated as the beginning, middle, and end of manufacturing, referencing the results from previous tests. Three distinct behaviors in the cooling speed profile were observed. The beginning of the deposition corresponds to the deposition of the second layer, the middle of the piece corresponds to layers 6 to 8, and the thermal equilibrium of the system was considered the end (12th layer onwards). Figure 2A–C shows a strategy scheme representing the acquisition of the films referencing the beginning, middle, and end of the part fabrication, respectively. Figure 3 also shows that the camera has been maintained at a fixed position, and as the part is being built, the platform moves down as the next layer is deposited.
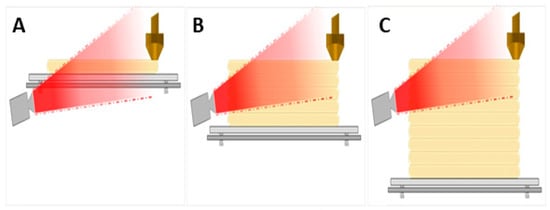
Figure 2.
Representative drawing of data acquisition at the beginning, middle, and end of the part manufacturing in the images of (A–C), respectively (Source: Author’s elaboration).
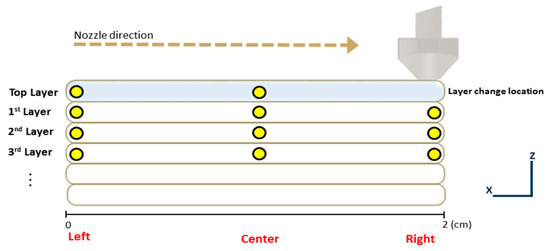
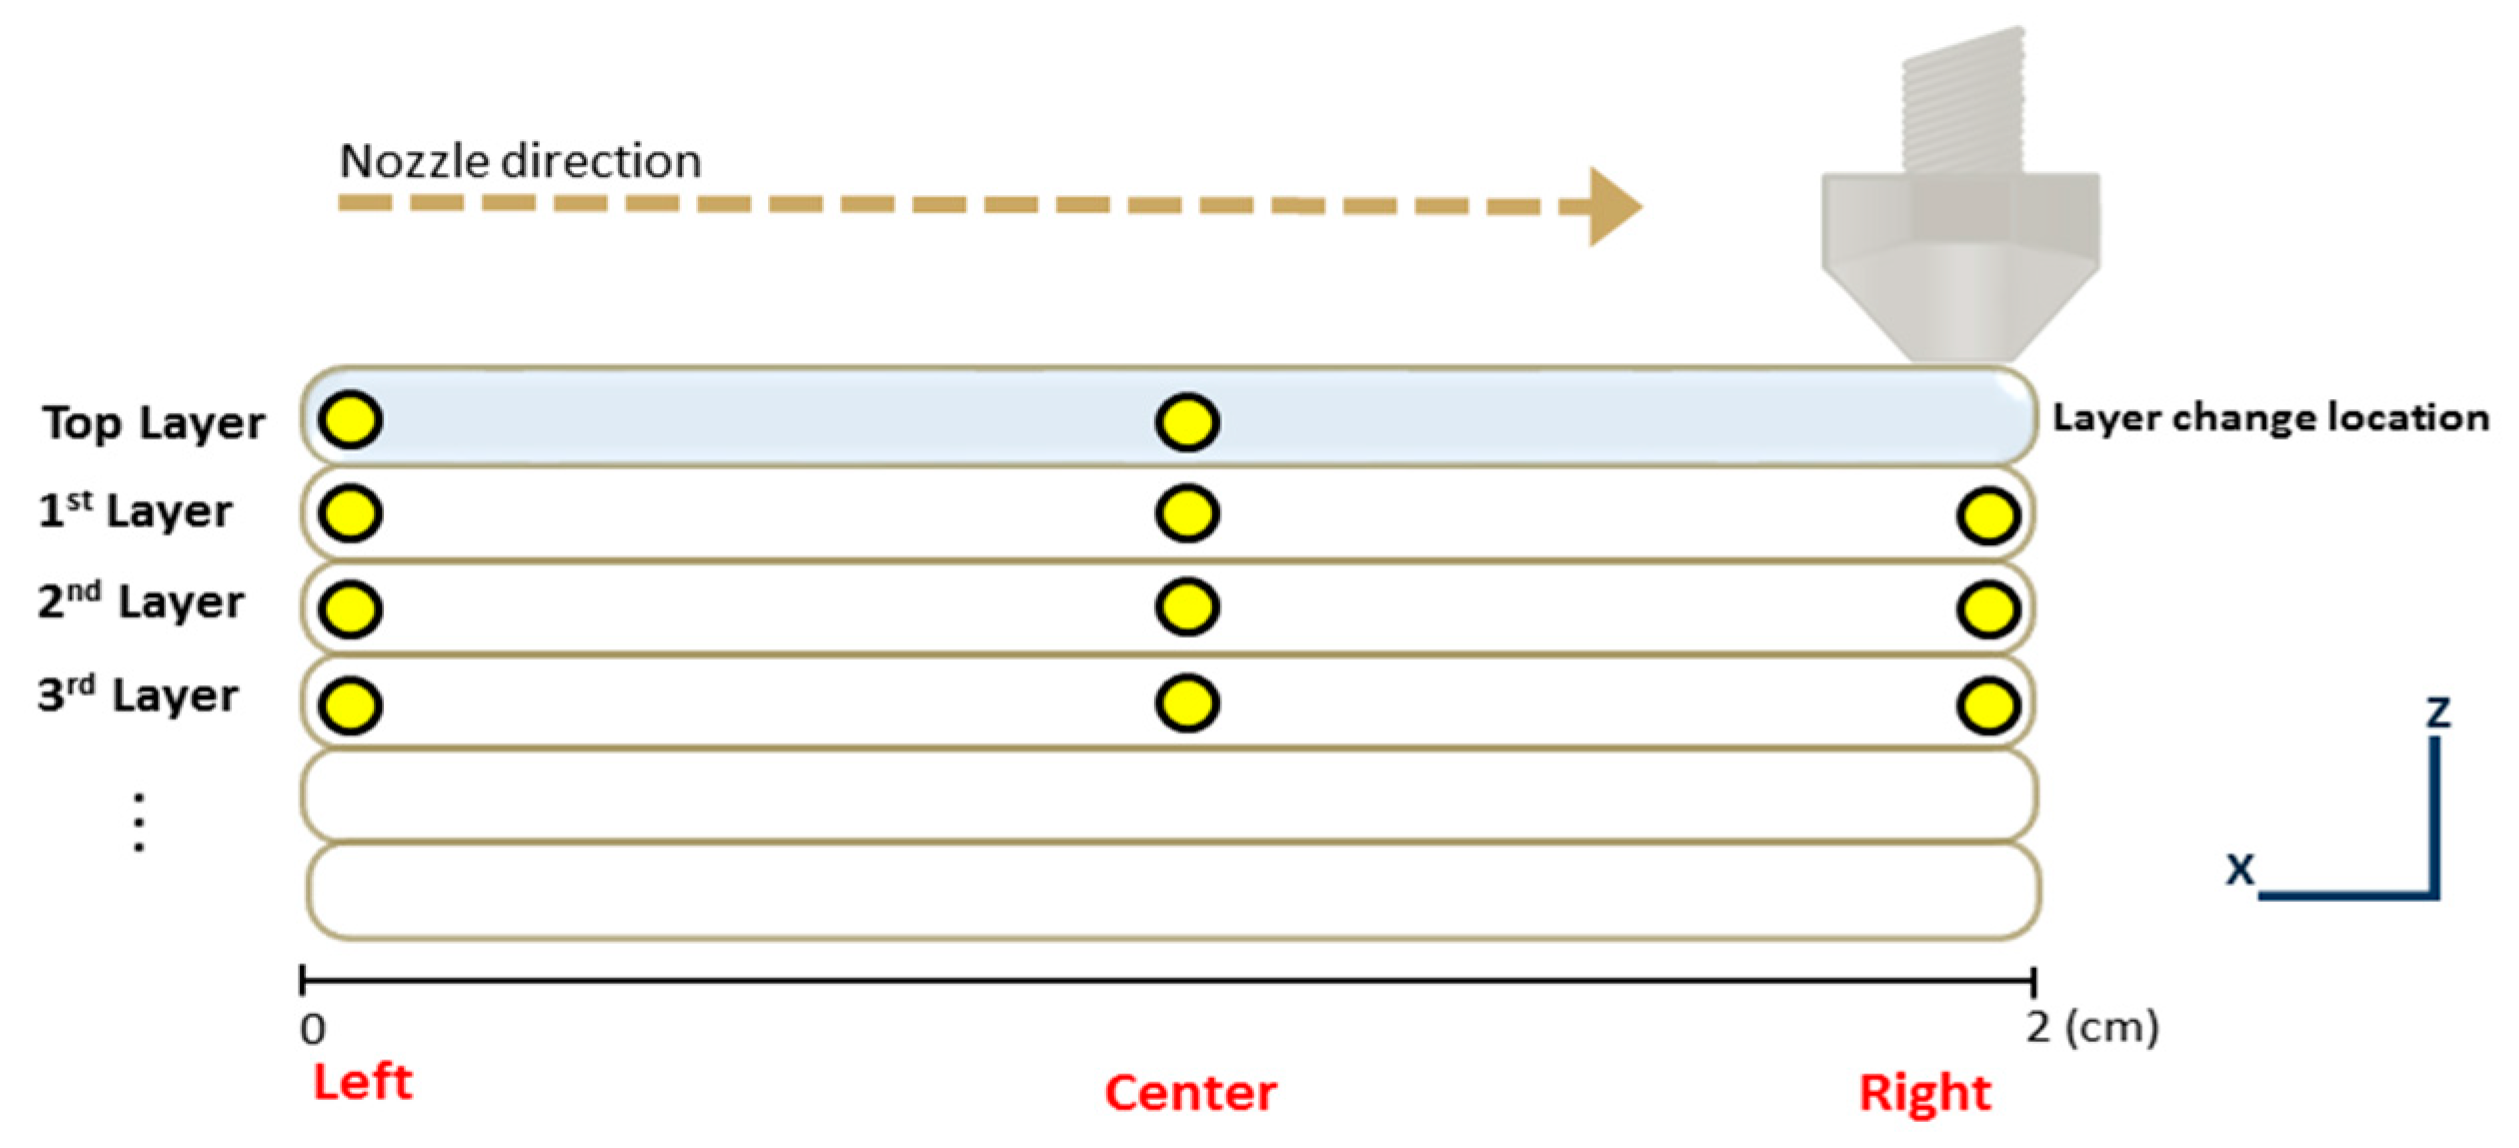
Figure 3.
Diagram showing the data logging point selection on the left edge and in the center of part (XZ view).
Infrared thermographic measurements were obtained during the printing of the parts. The camera-generated files were imported in MATLAB, where each image was transformed into a temperature matrix of XY coordinates, where XY is the camera’s resolution, 640 × 480. It can be seen from Figure 3 that the gray printer nozzle is in the center of the part being built, whereas the red printer nozzles represent the edge of that layer. The camera is placed in front of the part to record the temperature profile of the layers. The upmost layer at a particular time is named the Top Layer (TL).
The yellow circles in each layer, shown in Figure 3, are the points where the temperature measurements were plotted. At the Top Layer, only two points are captured because, in the sequence, there is a change of layer. It should be noted from Figure 3 that the time range for the temperature profile plot for these points is the time it takes for the nozzle to print each layer since the table moves down at the end of each layer. Thus, the time range for a point selected at the left edge of a layer is more extensive than that for a point in the middle of that layer. Studies on the evolution of temperature indicate a strong influence of the path carried out by the nozzle on the final properties of the part [40,44,45,46] since the shape or path in which the filaments are deposited reflects the heat loss profile.
3. Results
3.1. Qualitative Thermographic Analysis
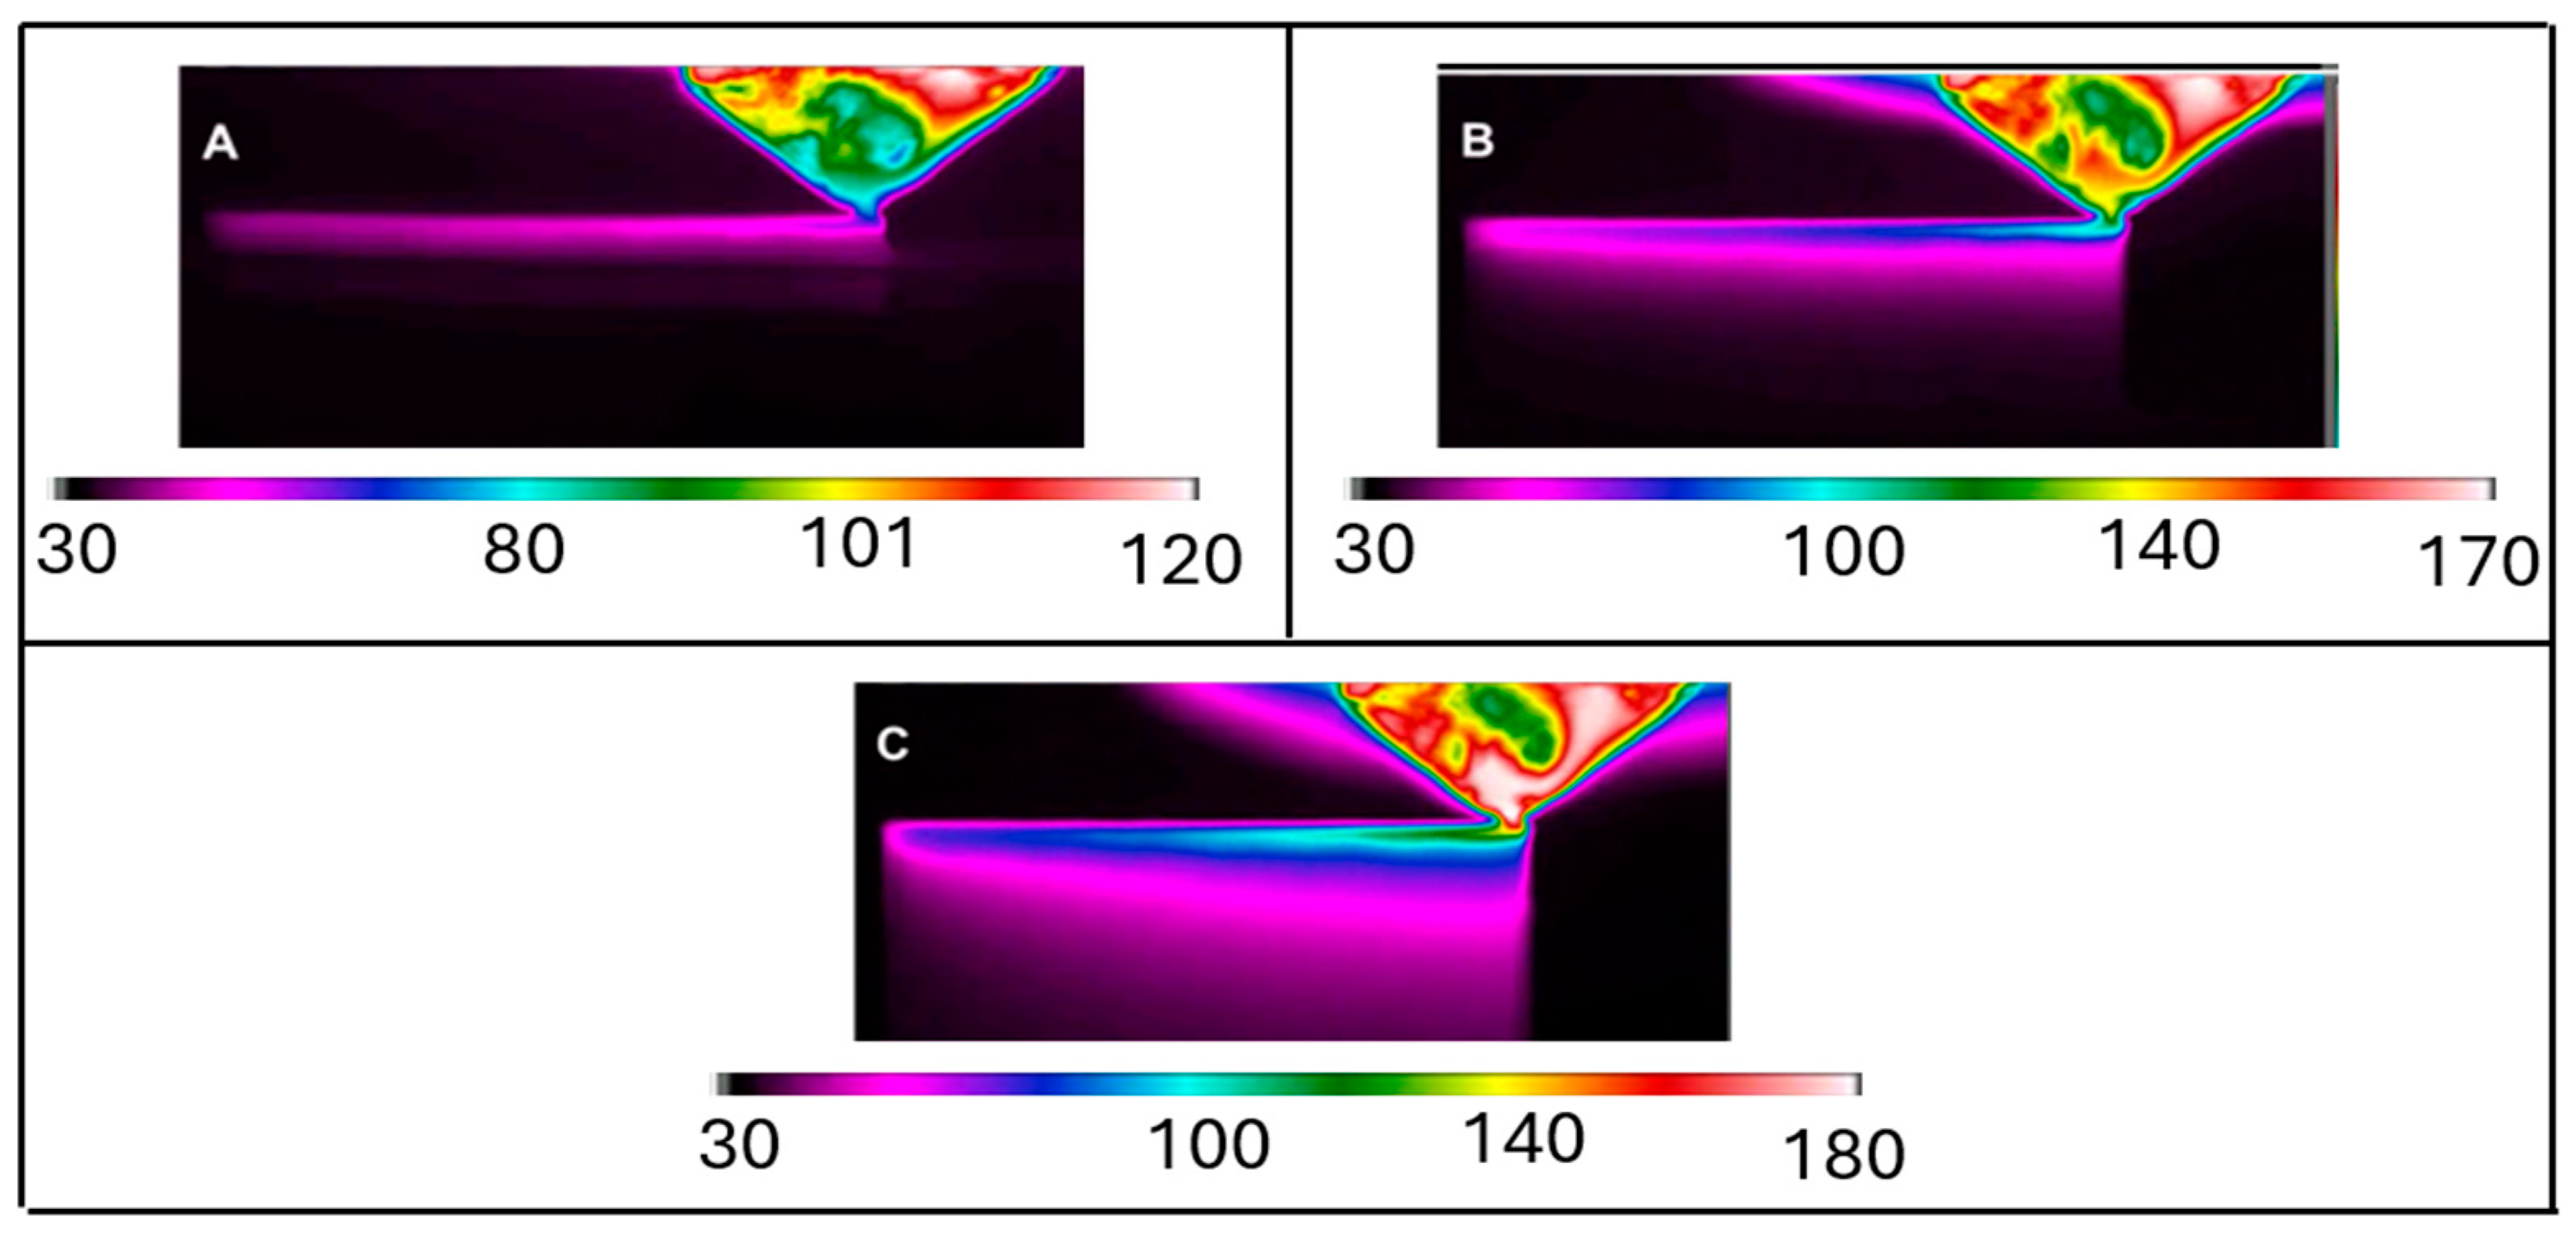
Qualitative images from the thermographic filming of the PLA samples at the beginning, middle, and end of the printing process are shown in Figure 4A–C, respectively.
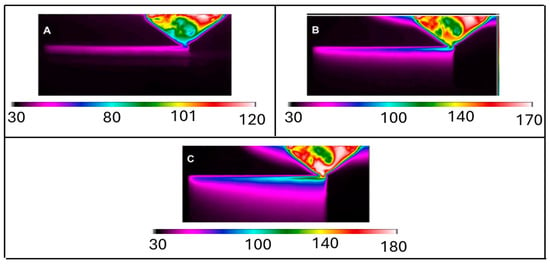
Figure 4.
Thermographic image of the part at the beginning, middle, and end of the printing process (A–C), respectively.
The filaments deposited at the beginning of the manufacturing process have temperatures of 60 °C, as shown in Figure 4A. The following layers are deposited on the top of the hot layer. Therefore, although the printing parameters remain the same, the part experiences different temperature gradients throughout the fabrication. Since the mechanical resistance of the printed parts is sensitive to temperature gradients, the measurement and control of the cooling process are crucial during fabrication.
An increase in the printing head temperature can have a beneficial effect, as described by Yang et al. (2017). The nozzle’s heating can be considered an external heat source and helps increase the polymeric matrix’s crystallinity [47] due to thermal radiation [42]. This effect is apparent in Figure 4C. Zhou and Hsieh (2017) recorded a continuous increase in the temperature of the part, attributed to the rise in the temperature of the environment of the printing box, which stabilizes after a while [38]. The authors did not evaluate nor report the effect of indirect heating of the nozzle on the part. Still, Seppala and Migler (2016) reported that this effect is more significant as the printing speed decreases [41].
After a qualitative analysis, a quantitative study on the lengthwise and timewise evolution temperature is presented in Section 3.2 and Section 3.3, respectively.
3.2. Static Thermographic Analysis
Static thermographic analysis refers to two different lengthwise analyses: (i) the temperature profile along some layers of the sample being printed (see Figure 3), and (ii) the temperature profile from top to bottom of the sample, that is, following the temperature evolution the column of yellow spots, as presented in Figure 3. Thus, some of the plots presented in this section will have the width of the sample in the abscissa range; other plots will have the range of the number of layers.
The deposit of each layer requires that the printing head passes in front of the infrared camera four times. These temperature measurements were used to compute the confidence interval (CI). The confidence interval was calculated as 2.576 σ, where σ is the standard deviation of each set of four measurements, as will be detailed in the next section.
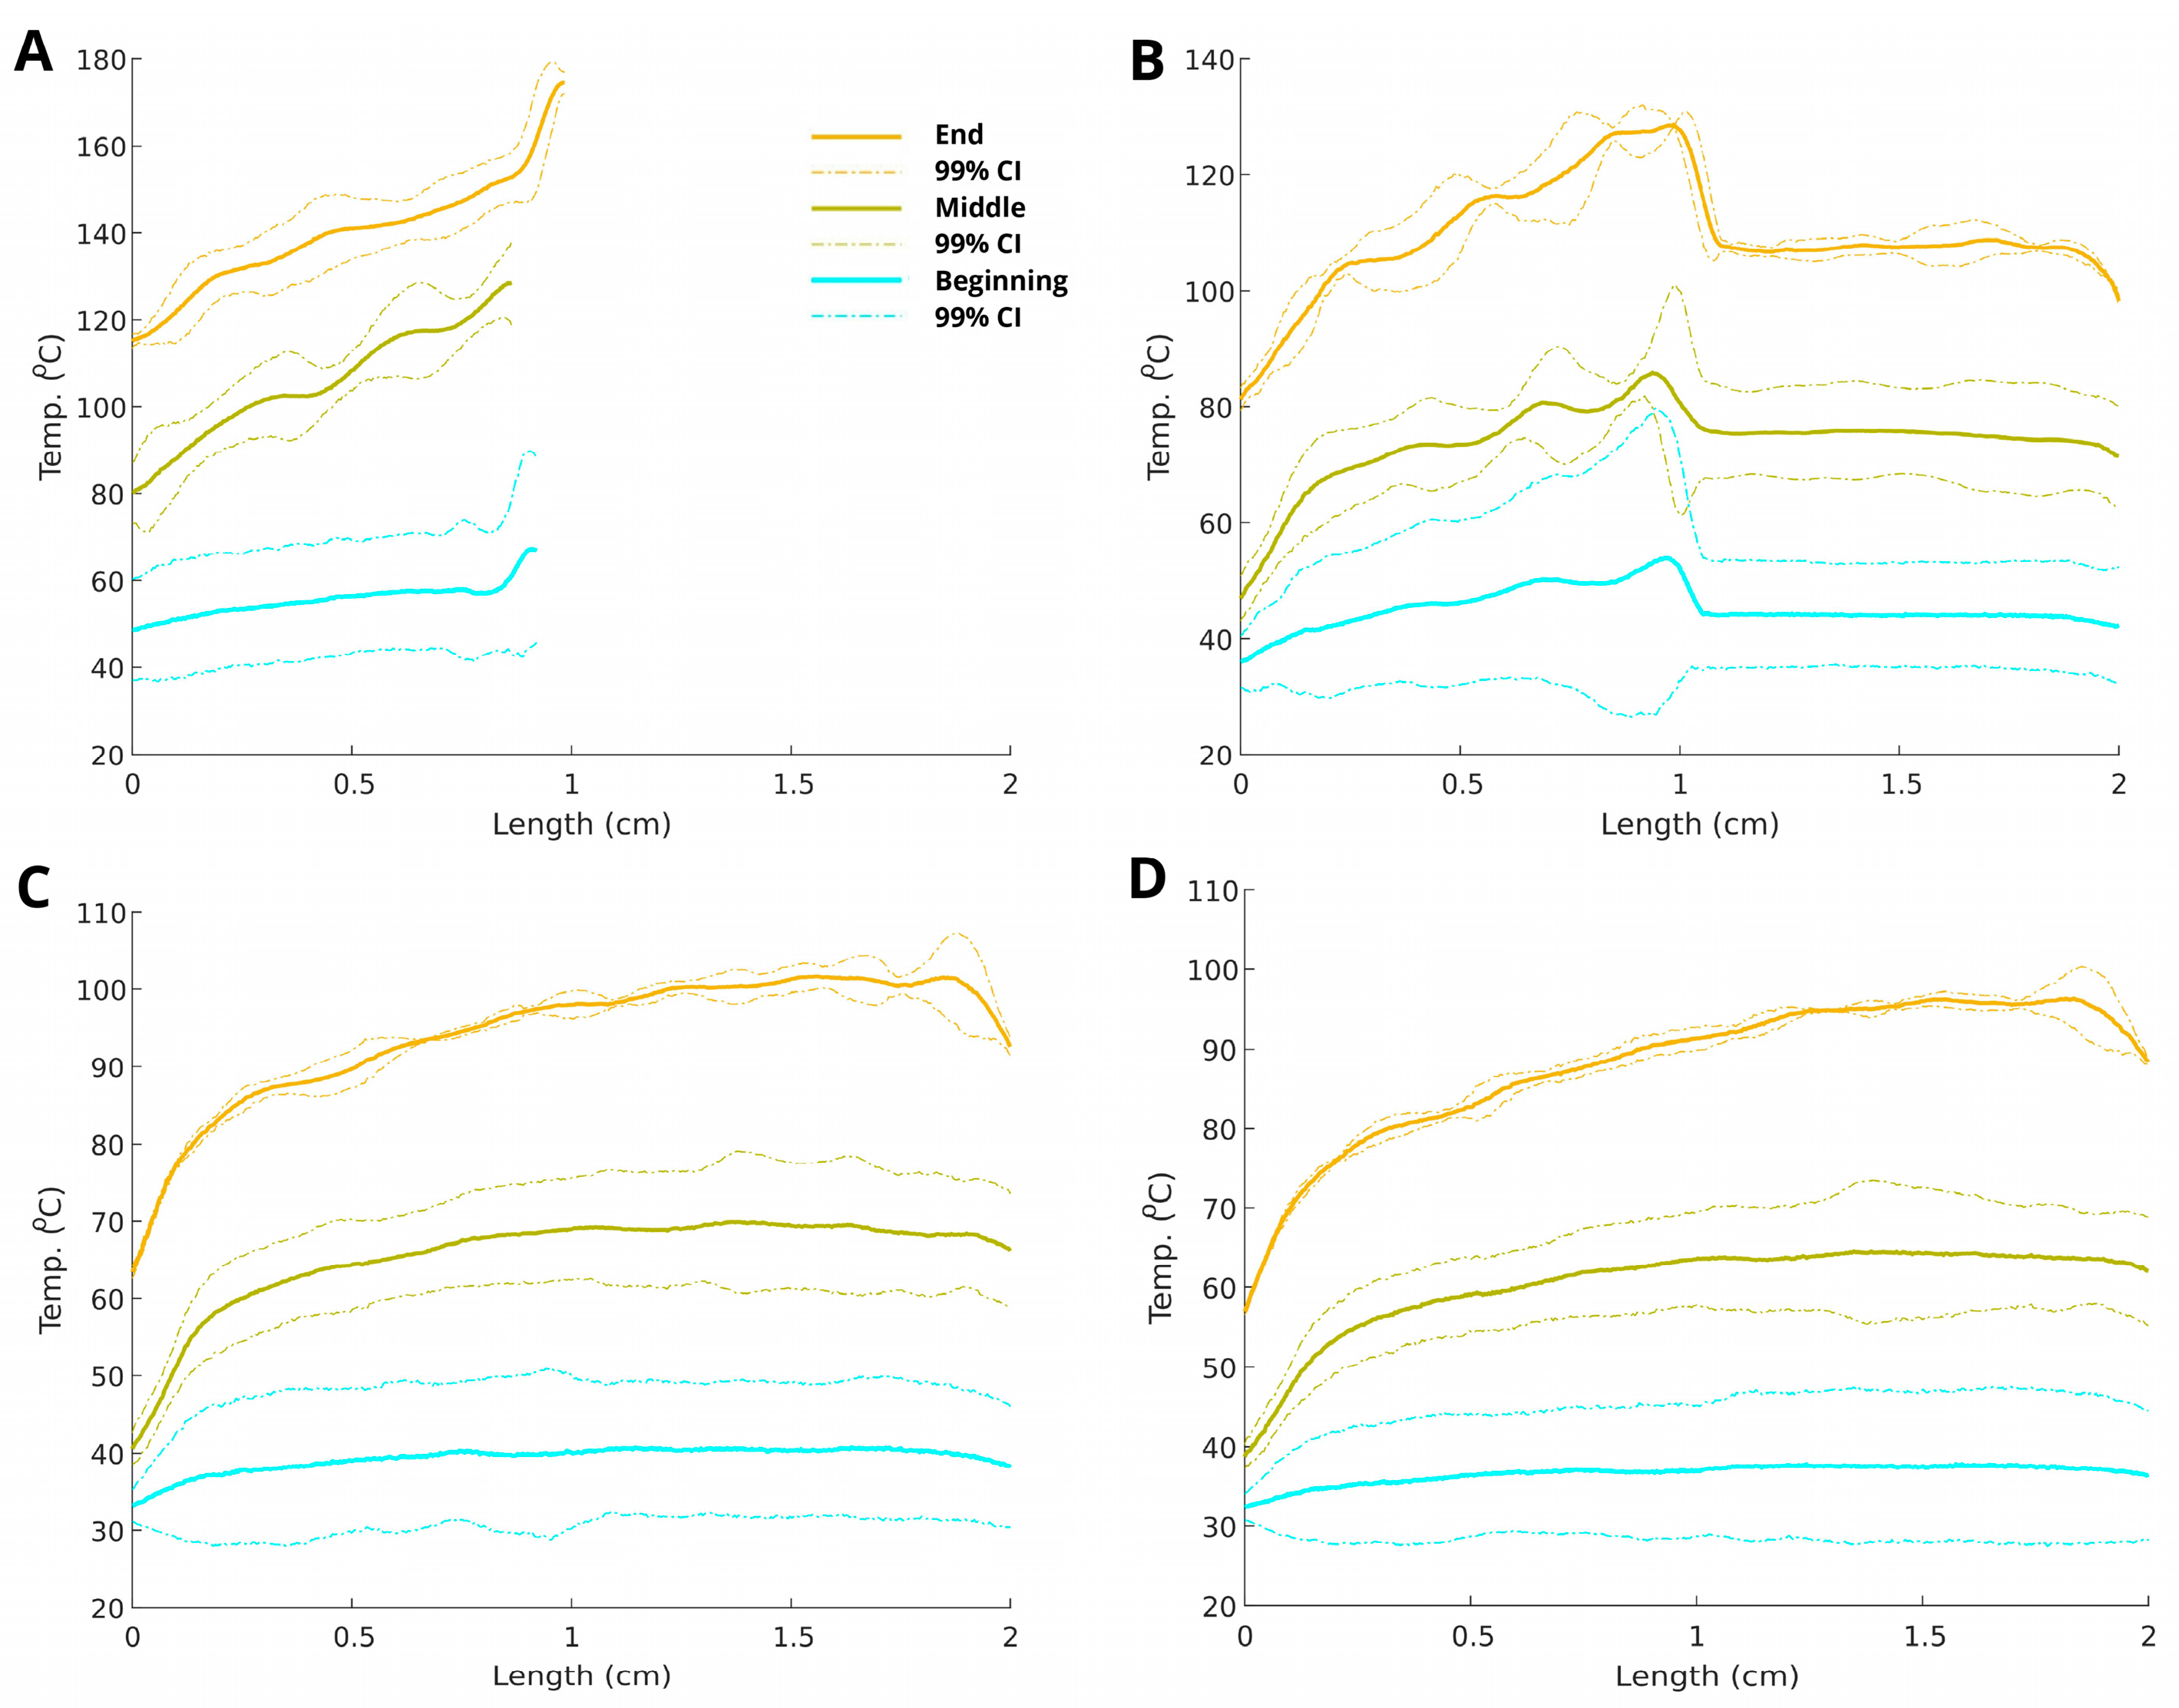
The lengthwise variation in the temperature profile will now be discussed. As can be seen from Figure 5A–D, at the print’s beginning, the temperature measurements’ uncertainty was higher when compared to the middle and end for all layers. This phenomenon may indicate a more significant variation in the temperature profiles at the beginning of the process due to the non-uniformity of the temperature of the table and the temperature increase inside the chamber due to the printing nozzle. The increase in the temperature of the printing head leads to heat transfer by convection and radiation from the head to the printed part. In addition, heat transfer induced by radiation and convection leads to increased heat transfer by conduction within the printed part. As the manufacturing process develops, these temperatures and heat transfer modes tend to stabilize, resulting in average temperature profile values with less variation, as can be seen for the beginning, middle, and end instants for all the layers.
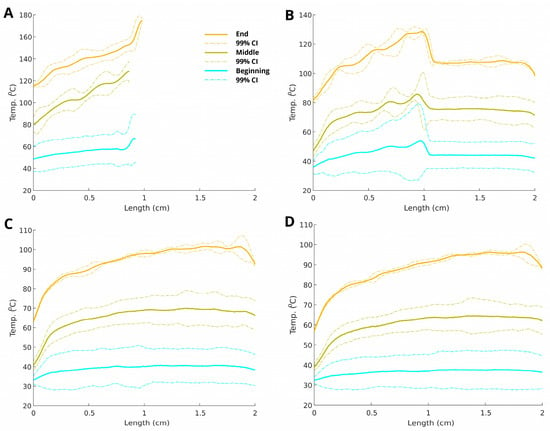
Figure 5.
Mean and confidence interval (CI) of the cooling profile as a function of the part length of the top, first, second, and third layer, (A–D), respectively, at the beginning, middle, and end of the part build.
For Figure 5A, the average temperature profiles in the top layer (TL) (beginning, middle, and end of the process) have a similar trend as observed in [48]. The maximum temperatures reached were 180, 120, and 60 °C at the process’s end, middle, and beginning, respectively. The pattern of continuous increase in the maximum temperature throughout the fabrication, associated with the rise in ambient temperature during fabrication by the nozzle heating, was also reported by [38,49,50,51].
Figure 5B shows the average temperature profile at the first layer, that is, the average temperature profile of the layer just below the top layer (TL). This figure shows a sharp step where the nozzle is positioned at the top layer. The 0–1 cm part profile indicates where the filament was deposited at the top layer. In the 1 to 2 cm section, the temperature measurement is related to the process before the nozzle reaches that region. According to this profile, it is possible to observe the effect of reheating that layer. Such reheating reached a maximum variation of around 20 °C at the end of the manufacturing. On the other hand, the amount of heat transferred is affected by the contact area between the filaments [11]. Srinivas et al. (2018) indicated that this effect is essential for the stress relaxation of macromolecules [52].
Figure 5C,D shows that the effect of reheating was not observed after the deposit of the second layer. This behavior can be attributed to the thermal energy balance, where the heat is mainly dissipated by convection instead of being transferred by conduction. On the other hand, the temperature profile shows the pattern according to the strategy that the piece was built (see Figure 4). On the edges, near the ends, at positions 0 and 2 cm, the curves show a steeper downward slope, indicating that the part was colder in these regions compared to its center. This behavior is observed for all layers. These regions have more significant heat loss by convection through the lateral surfaces due to the larger surface area in contact with the air [11]. The temperature difference experienced at different fabrication times (beginning, middle, and end) indicates anisotropy in the fabrication process. The region that usually presents the most significant defects while fabricating is the part’s base, which has high heat loss by conduction to the fabrication table [11]. This phenomenon justifies problems in fabrication, such as the detachment of the part from the construction platform due to the lack of adhesion [53]. Hence, residual stress occurs because of the heat transfer characteristic [54].
Figure 5 shows the temperature imbalance between the left and the right corner. Varying the starting point of each layer would tend to equalize the temperature distribution during cooling.
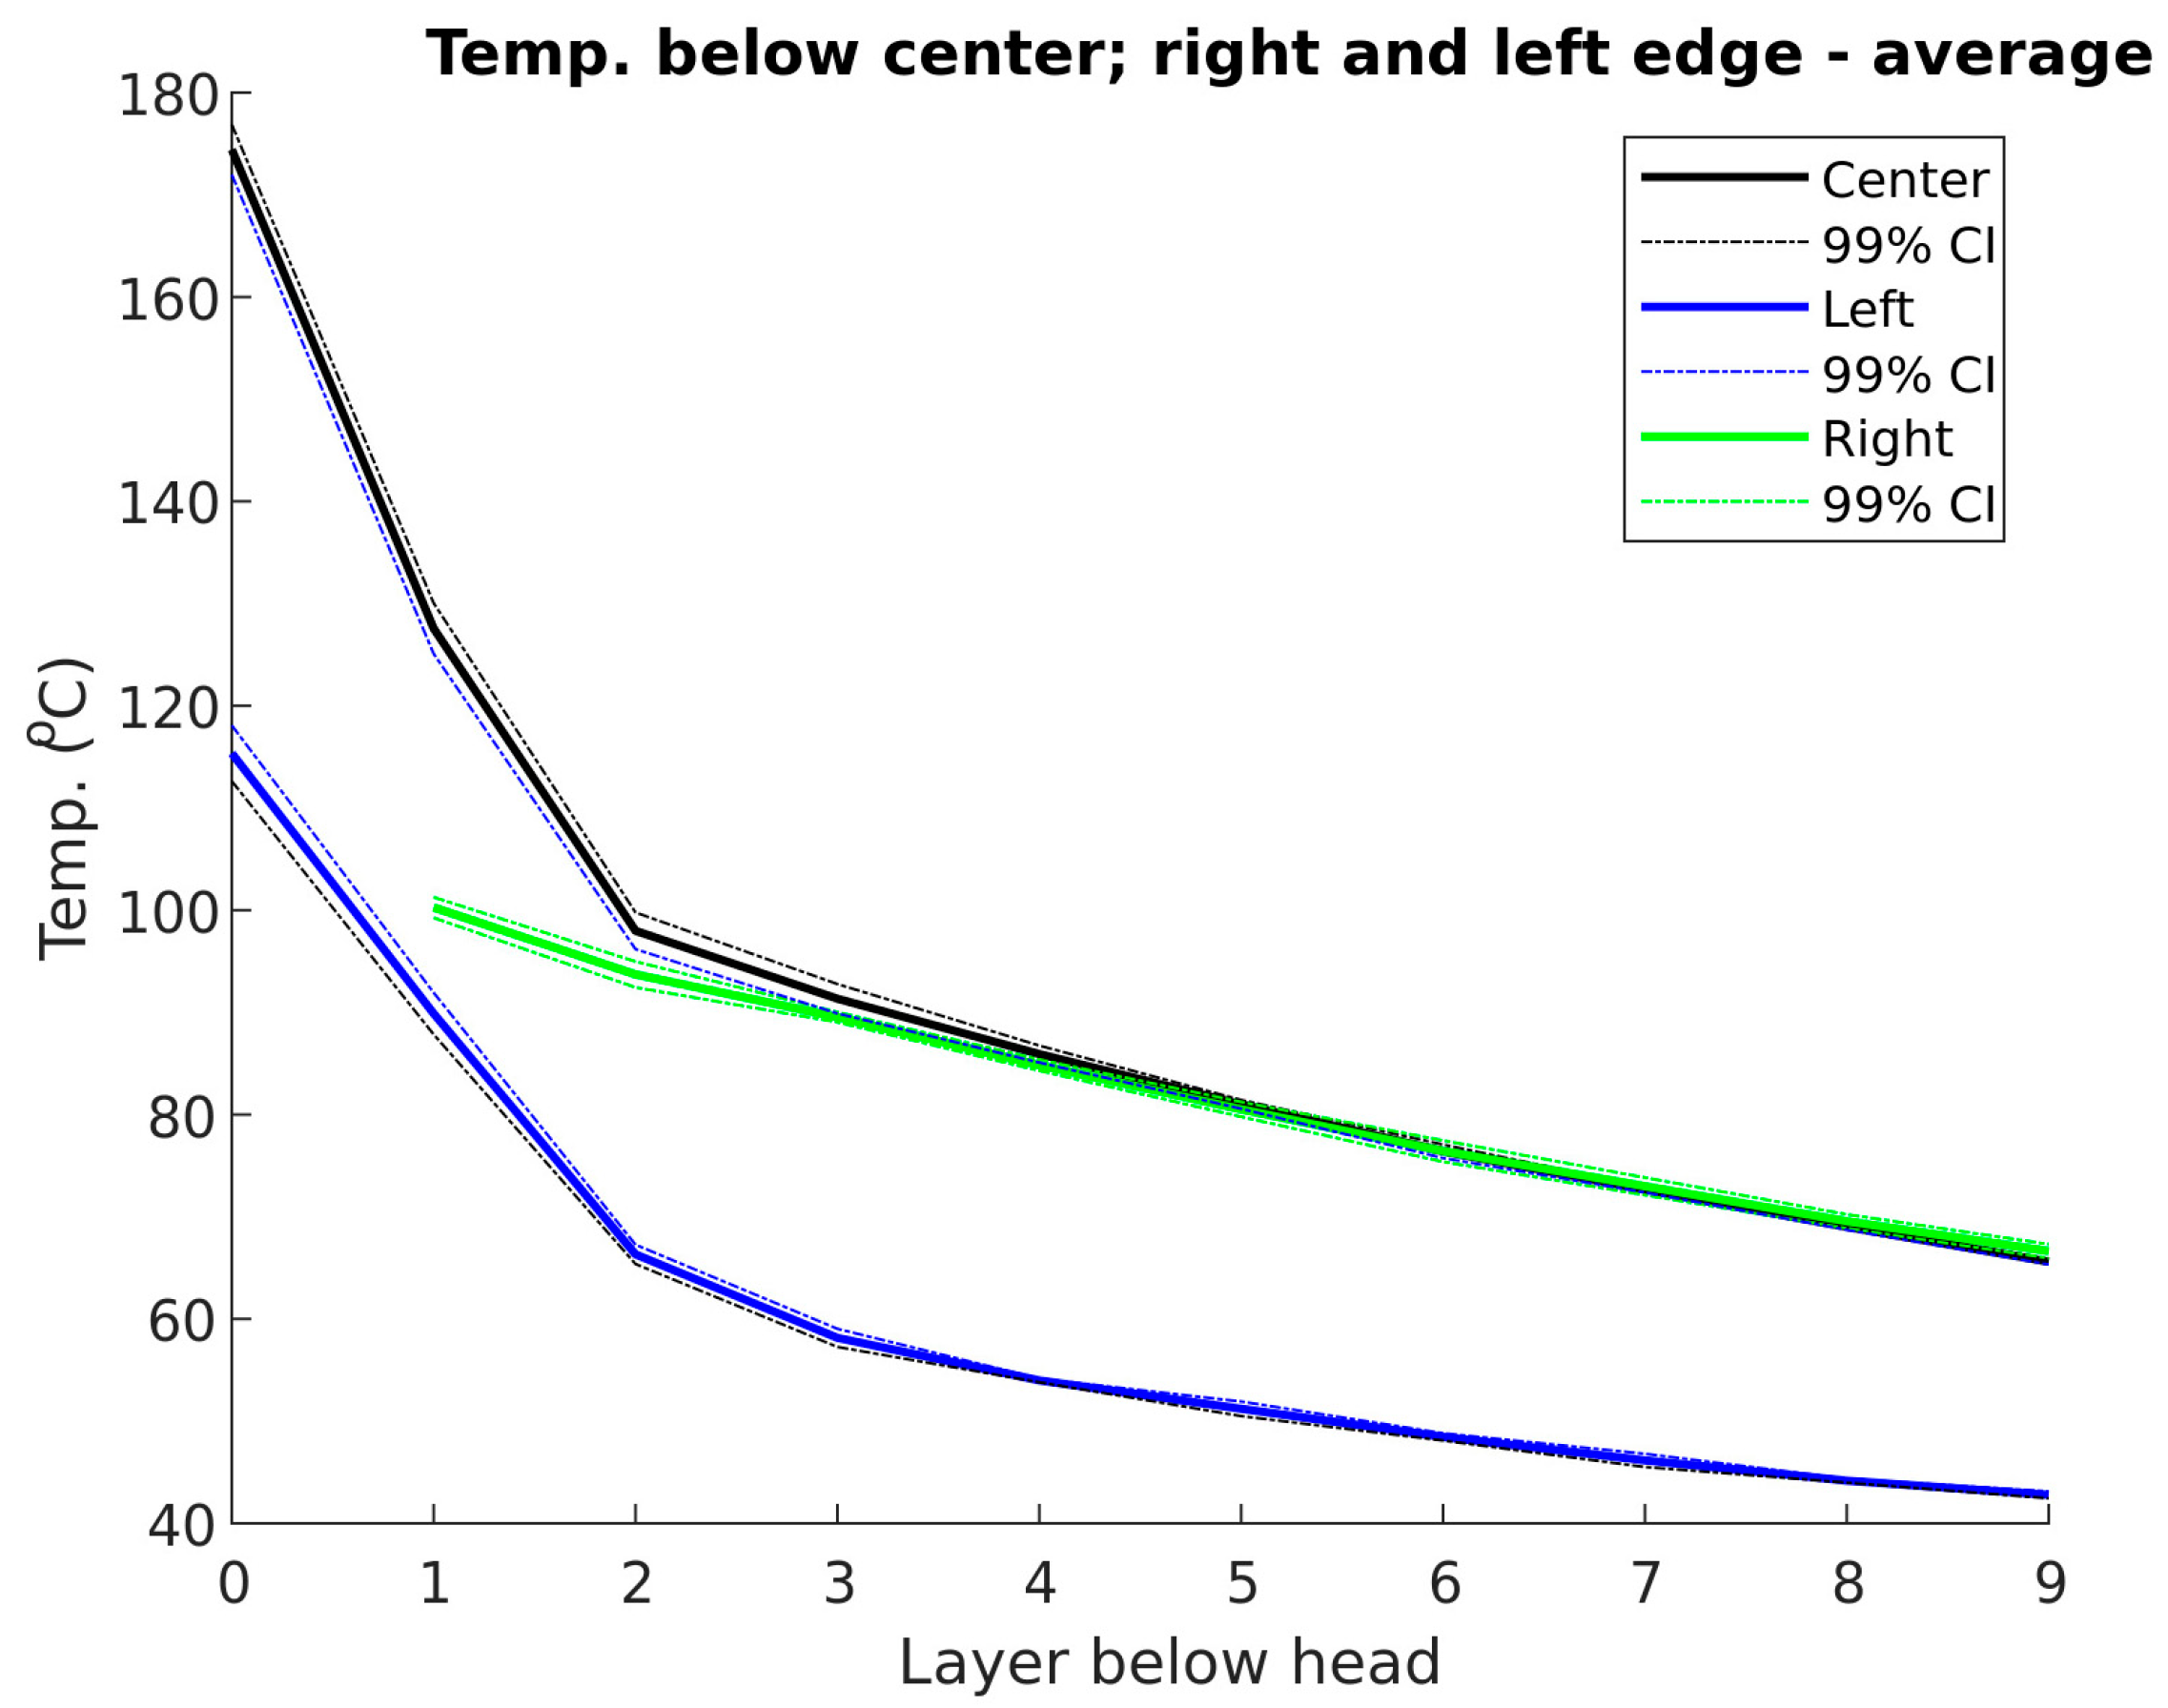
The temperature variation along several layers below the top will now be discussed. Figure 6 presents the temperature evolution for the left corner, center, and right corner of the part, presents the temperature evolution below the printing head. The temperature profile observed in Figure 6 agrees with previous studies [42,55], especially in the region of higher residual stress [56]. The left, center, and right edges refer to the temperature values at the part’s 0, 1, and 2 cm positions, respectively; for the top layer (TL), only the left edge and the center were printed. In the first layer, it is observed that the center of the part was at a temperature higher than the edges because of the reheating, that is, the passage of the nozzle to the deposition of the upper layer. For the following layers, there is no effect of reheating; the center and right edge temperatures were similar. Also, it can be observed that the center and the right edge presented temperatures of 30 °C above the left edge. Such behavior can be explained by the fact that the right edge is the filaments’ beginning and end for the deposition of each layer. Also, this spot is where the nozzle pauses for the downward movement of the platform [17]. Such behavior agrees with Hu et al. (2019) [57], where a heat collector device was attached to the nozzle to increase the polymeric solder.
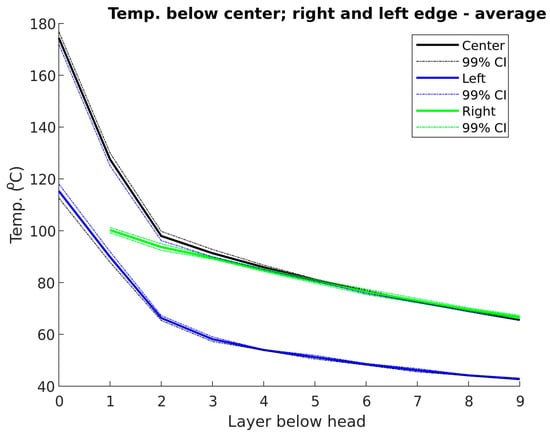
Figure 6.
Temperature profile at the part’s left, center, and right edges as a function of the number of layers.
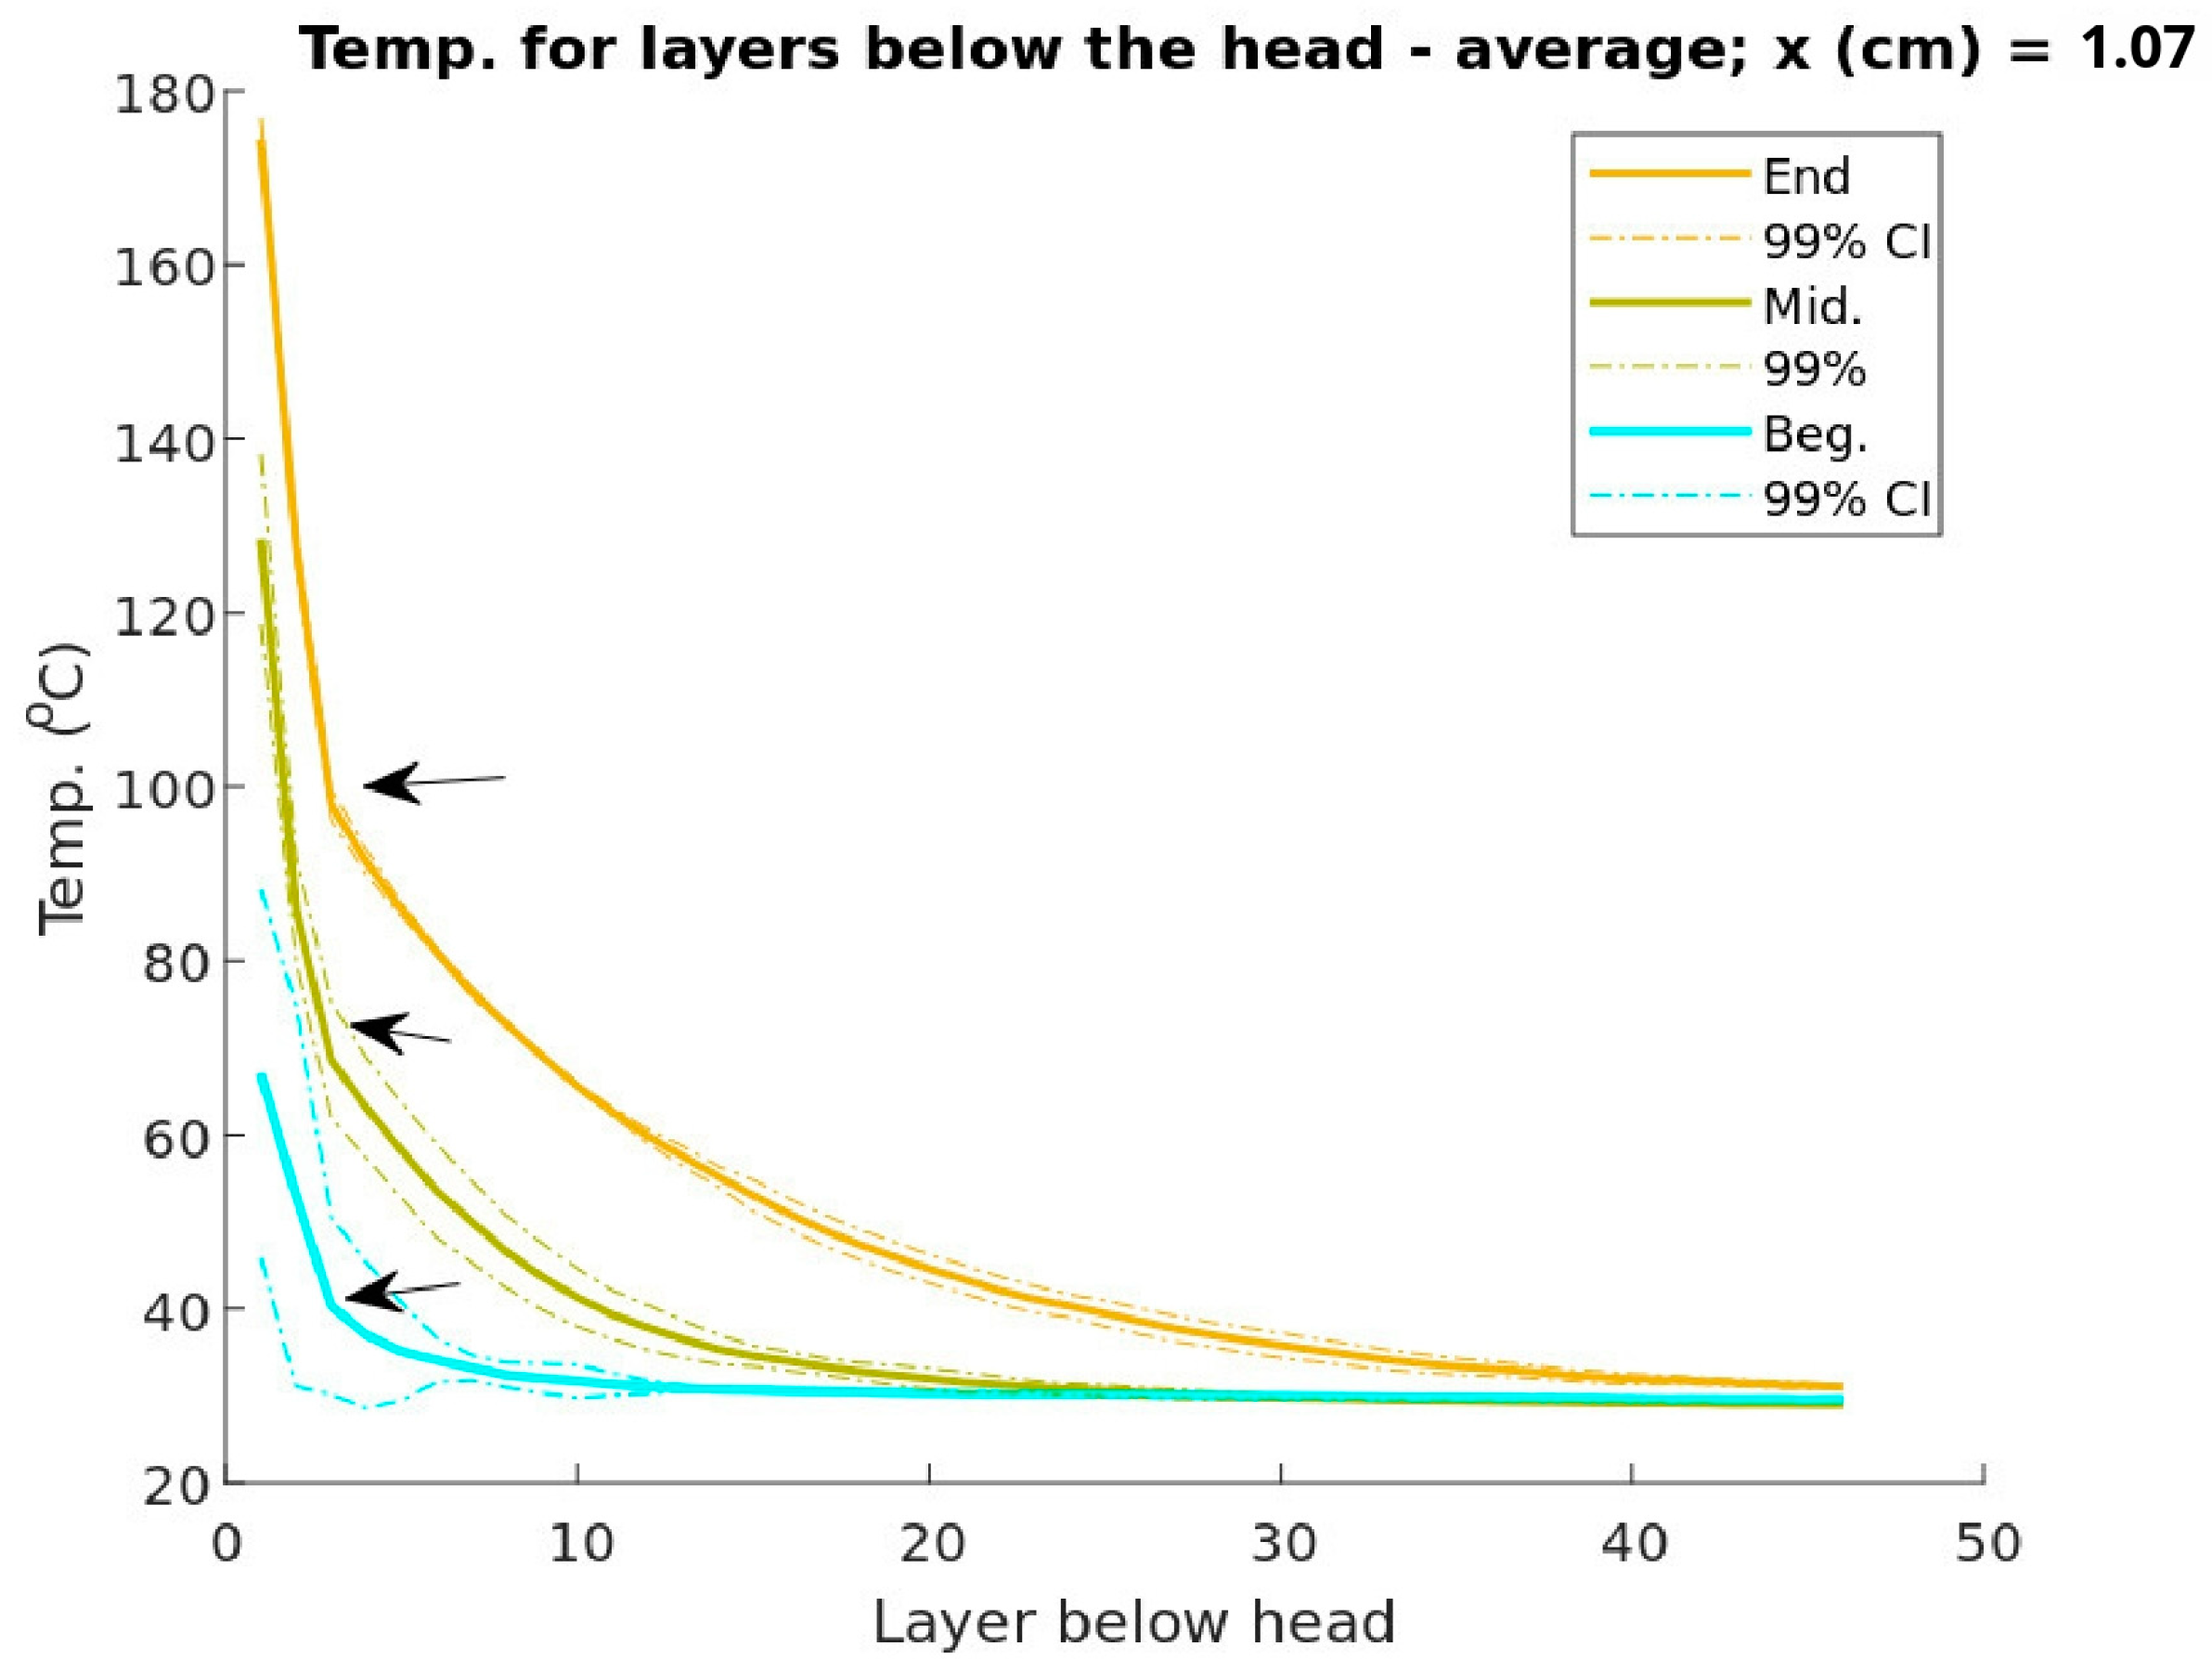
The temperature profile below the printing nozzle can be observed in Figure 7 at the beginning, middle, and end of the layer deposition. The curves have different ranges. In the beginning, few layers are printed, and as the printing process evolves, more layers are deposited. Initially, all three curves showed the same trend. Before the fifth layer, a steep slope in the temperature profile was observed, as indicated by the curve arrows. This can be followed by the curves that equilibrium reached around the 20th and 30th layers below the nozzle for the middle and end curves, respectively. For the polymer, the temperature that influences this system is the glass transition temperature (Tg), which for the PLA used here is 60 °C. Below Tg, macromolecules present no significant mobility. Thus, it is observed that at the beginning of the deposition, which is the critical stage, the molecules do not have enough energy for stress relief. Taking the Tg as a reference, the temperature of the molten polymer affects up to the 5th layer below the nozzle, at the middle of the printing, and up to the 10th at the end of printing. The following layers are below Tg.
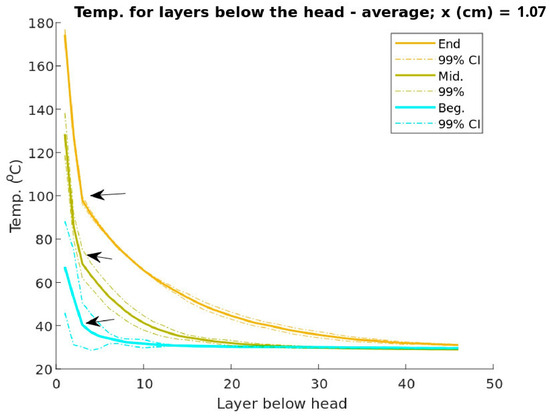
Figure 7.
Temperature profile as a function of the number of layers below the print nozzle at the beginning, middle, and end of manufacture.
3.3. Dynamic Thermographic Analysis
After a detailed analysis of the spatial variation in temperature, a timewise analysis will be presented. For that, the same three points will be analyzed, namely the left edge (start of deposition) and the middle and end of the part deposition (or right edge) (see Figure 4). Figure 8A–C shows the plot of temperature evolution for a frozen pixel at the left edge for the deposition’s beginning, middle, and end, respectively. In Figure 9A, the first peak was at 6.689 s, and the temperature was 55.47 °C. The temperature then decreased exponentially to 34.42 °C at 10.41 s.

Figure 8.
Observation of the overall temperature profile on the left edge of the part at the beginning, middle, and end of the part deposition, (A–C), respectively.

Figure 9.
Cooling profile of the left edge of the part for the deposition of the four layers and its average of (A–C) for the beginning, middle, and end of the deposition, respectively.
The general profile of the graph, with several peaks and valleys, is due to the printing head movement in front of the camera and the movement to print the back walls behind the focal point. It is also possible to see from Figure 9A that at the beginning of the deposition, the peaks presented a variation with a gradual increase, ranging from 55.47 °C to 72.82 °C, a 17.35 °C increase. In Figure 9B, this variation occurred in a less accentuated way, ranging from 122.7 °C to 135.6 °C, a 12.9 °C increase. Finally, at the end of the deposition, Figure 8C, the maximum temperatures were around 172 °C, with a slight variation due to measurement noise, indicating stability. Such behavior suggests that after a specific time, the temperature experienced by the part reached a quasi-equilibrium state. Since the printing temperature is stable during the entire printing process, such behavior is associated with the temperature of the printing environment [49] and/or nozzle heating [41,42]. The points indicated with the black square are used as the basis for Figure 9.
Figure 9A–C presents the temperature average of the four peaks and valleys indicated with the black squares in Figure 8A–C for the beginning, middle, and end of the deposition process, respectively, of a pixel at the left edge. At the start of the part fabrication, Figure 9A, there is more variation in the temperature profile. As the process developed, the measurements presented less dispersion, indicating that the temperature was in equilibrium, as shown in Figure 9C. The maximum value reached during deposition was about 180 °C, although the printing temperature was 200 °C. Such an effect has been reported in the literature both in works where the thermocouple was included in the sample [54] or in the deposition platform [52] and by thermographic measurements [38,40,41,53,58] at different extrusion temperatures [37], or even by simulation [13]. The maximum values at the beginning and middle of the fabrication were even lower, 75 and 120 °C, respectively (Figure 9B,C). Such an effect was observed in the literature on small [38,49,50] and large [59] printers. The center of the part was analyzed, and the same pattern of behavior was found, as indicated in Figure 10 and Figure 11.

Figure 10.
Observation of the overall temperature profile on the center of the part at the beginning, middle, and end of the part deposition, (A–C), respectively.

Figure 11.
Cooling profile of the center of the part for the deposition of the four layers and its average of (A–C) for the deposition’s beginning, middle, and end, respectively.
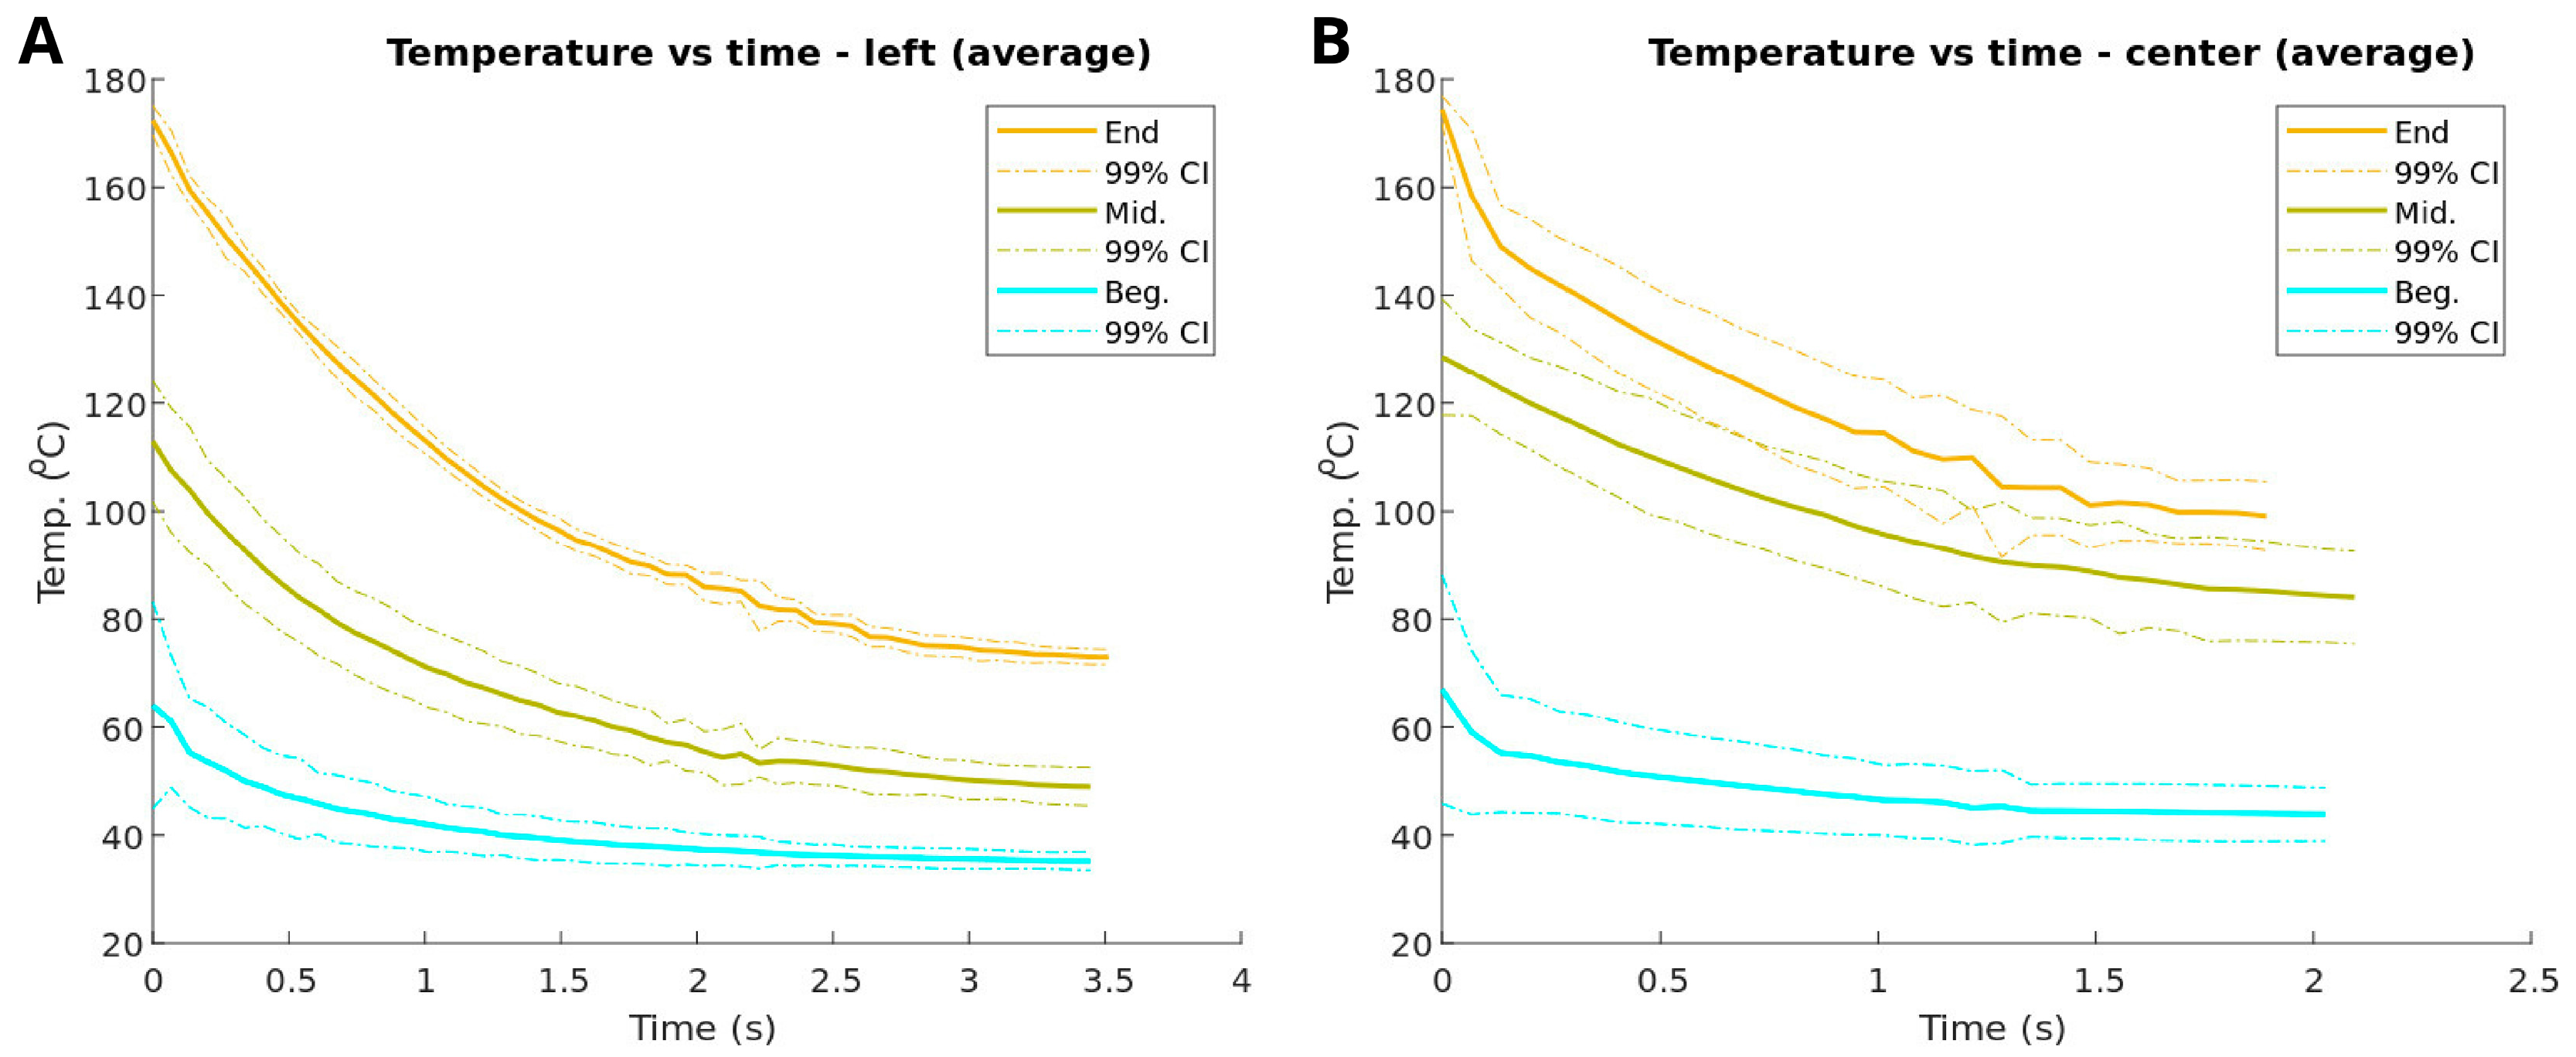
Figure 12A,B shows the curves of the average cooling profile at the left edge and center of the part, respectively. They were plotted in a single graph to observe the cooling behavior of the part along the deposition length. The time range in Figure 12A is higher than in Figure 12B. This is because the center is closer to the right edge, where the platform moves downward. The first layer at the center is evaluated until 1 s because of experimental issues during data acquisition.
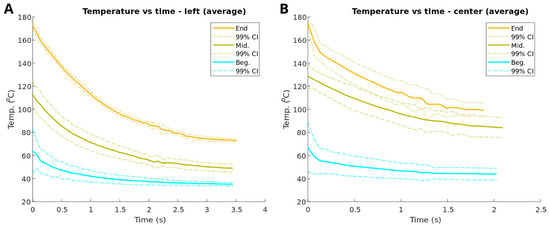
Figure 12.
Profile of the temperature evolution at the left edge (A) and at the center (B) of the part for different stages of fabrication.
The cooling profiles indicate anisotropy [17,60,61]; different layers present different lengthwise and timewise temperature variations, as discussed next. The first printed layers have lower temperatures due to the higher heat transfer by conduction from the part to the print bed, plus convection heat loss from the part to the environment. In addition, the nozzle has a relatively low temperature at the beginning. Zhou and Hsieh (2017) found the same trend when studying the deposition temperature of the PLA part. The middle layer has a higher temperature than the first layer, and the highest temperatures are reached at the end of the printing process. Figure 10 shows the subsequent heating as the printing process evolves. In addition, the temperature increases because the printing nozzle becomes hotter as the printing process evolves until it reaches a steady state temperature [38,49,50,51].
Also noteworthy when comparing Figure 12A,B is the behavior of the cooling profile. Since the left edge is exposed to the environment, the increased heat loss leads to a faster temperature drop than the center.
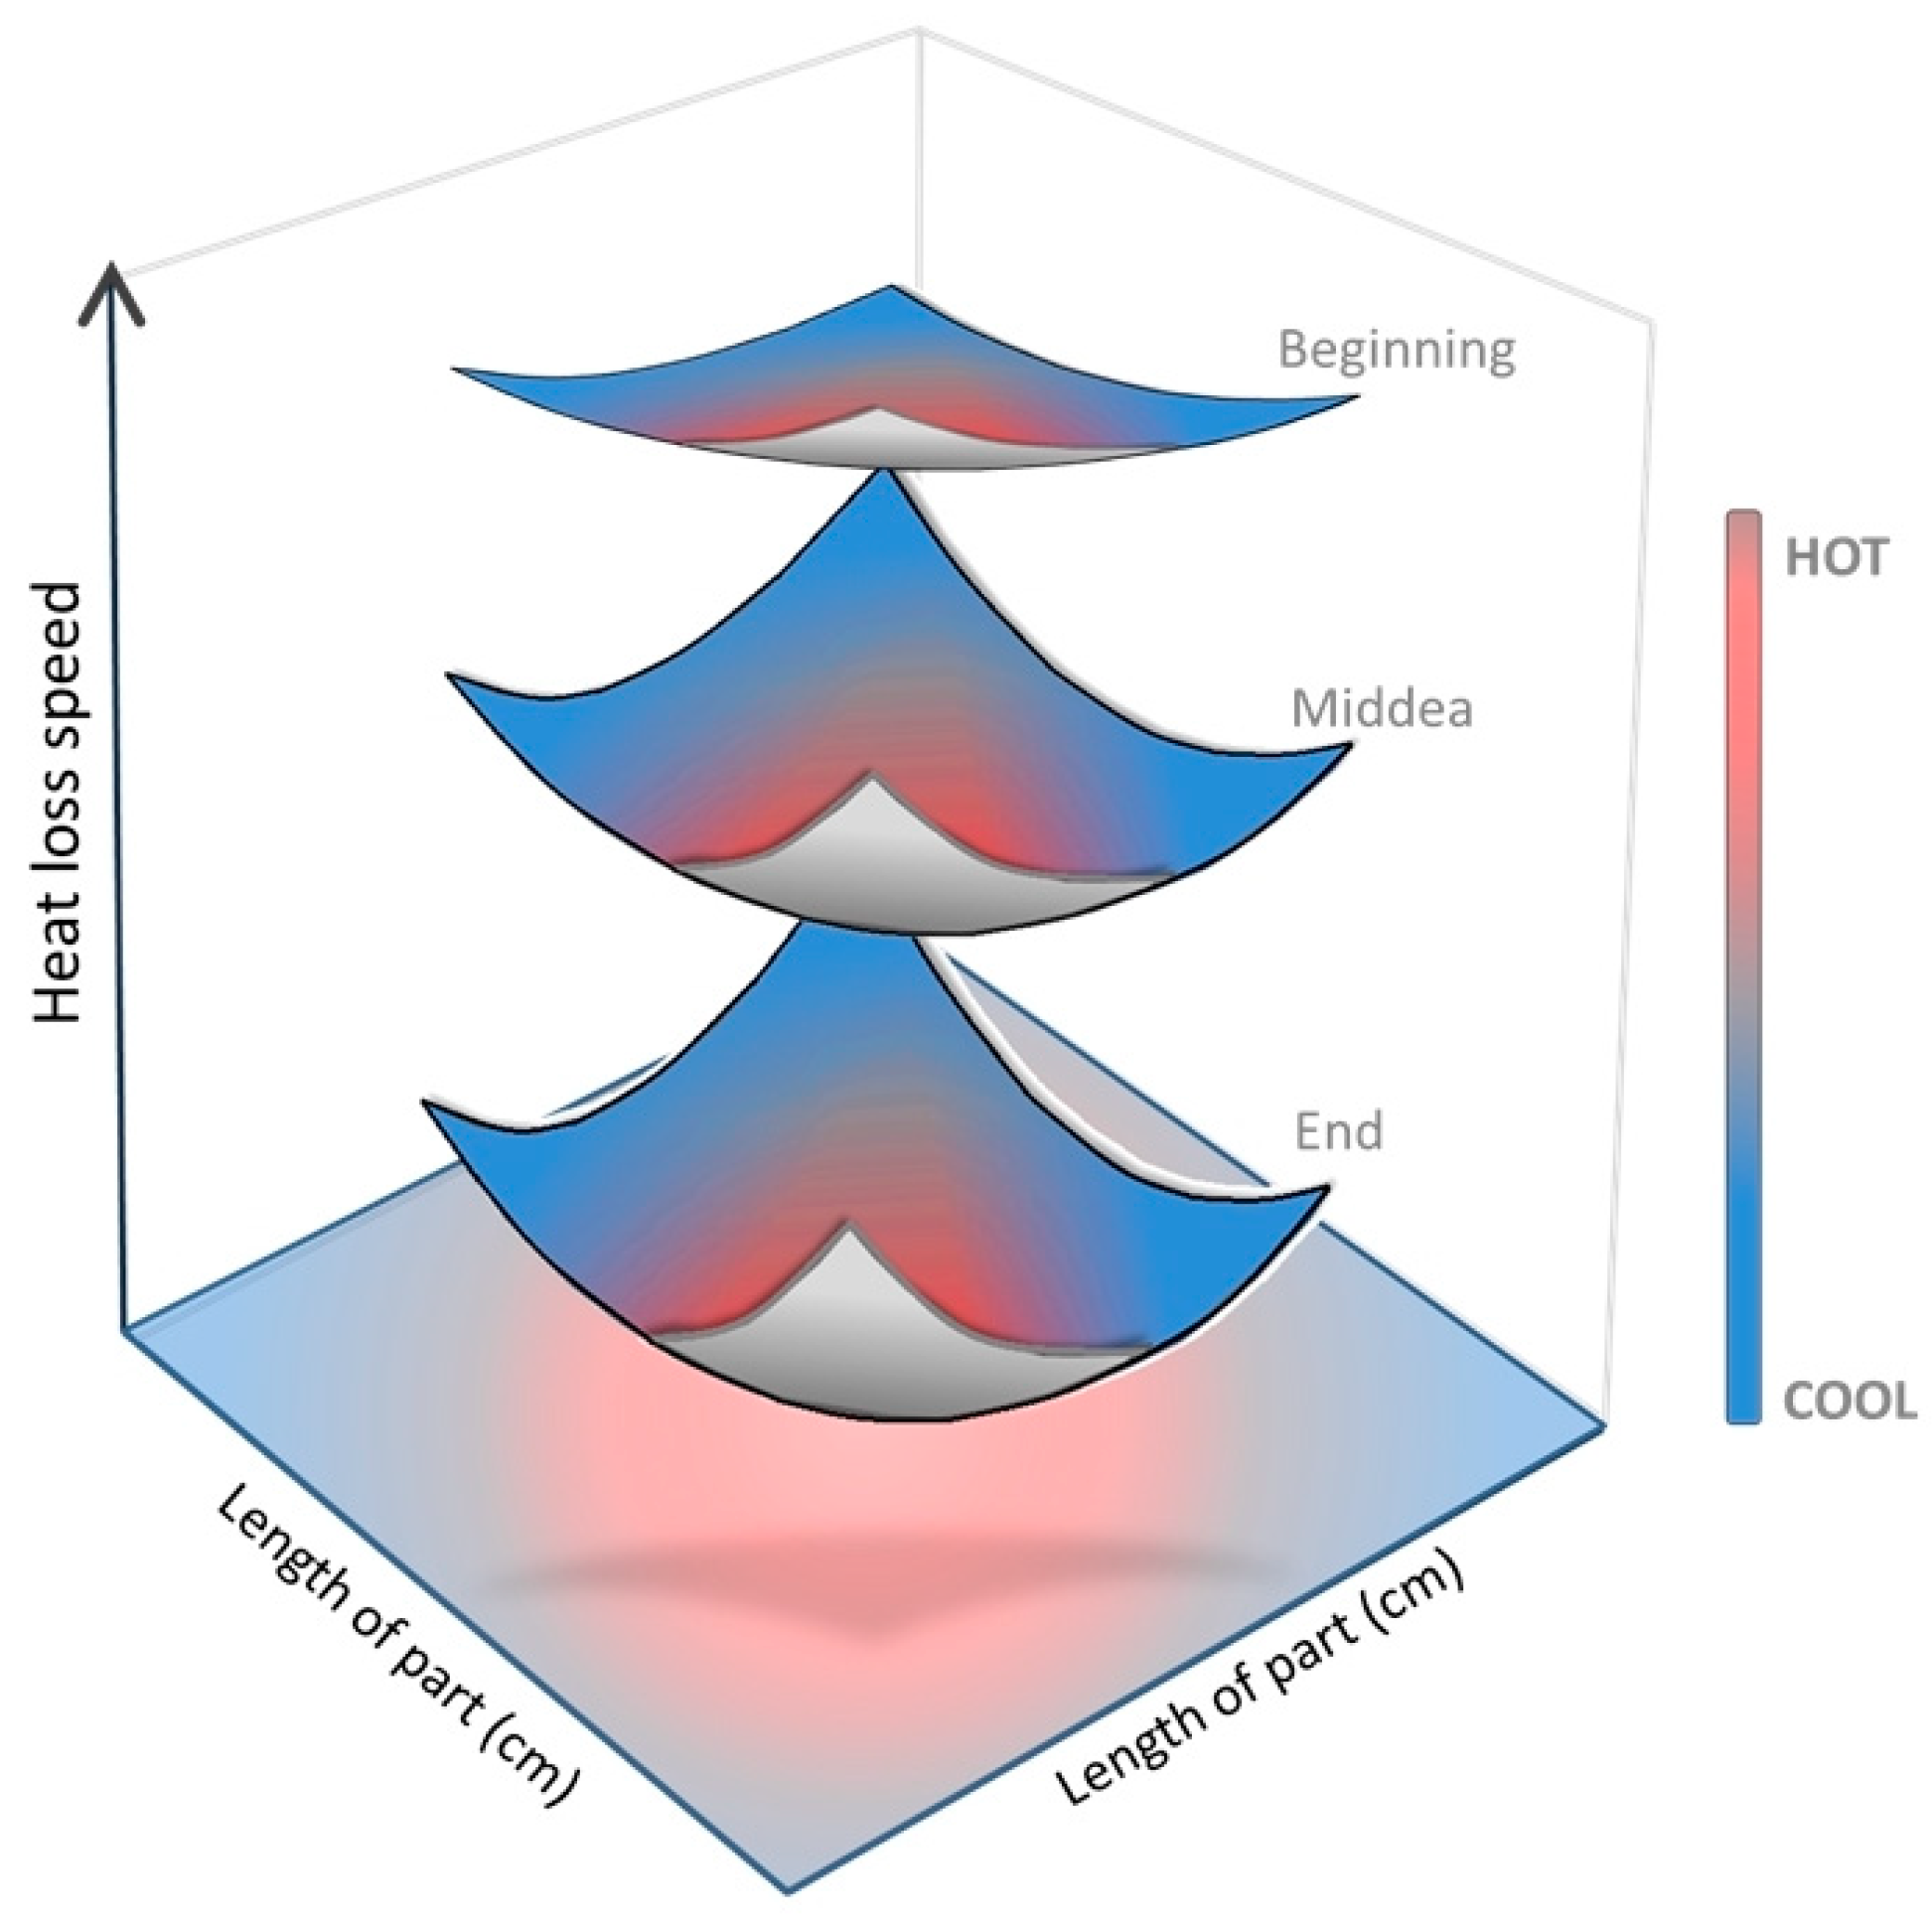
Finally, an outline indicating the variation in the heat loss profile at the beginning, middle, and end of the part deposition, in addition to the edge and center of the part, is presented in Figure 13. The rate of heat loss is greater at the beginning because of the heat transfer by conduction to the platform. At this stage, the heat transfer by conduction from the part to the print bed is overcome by the heat transfer by convection from the part to the environment. Hence, the temperature difference between the edge and the center at the beginning is relatively flat (see Figure 5). For the end of the deposition, the edge-to-center temperature has a parabolic shape, which is the typical behavior of a heat transfer by conduction within the medium, combined with the heat transfer by convection and radiation to the environment. The outline shows the anisotropy for the cooling conditions experienced by the 3D-printed part throughout manufacturing. Such behavior may contribute to anisotropy in the mechanical properties of printed parts, such as the polymeric weld or crystallinity of the polymeric matrix. This kind of correlation is not well explored in the literature.
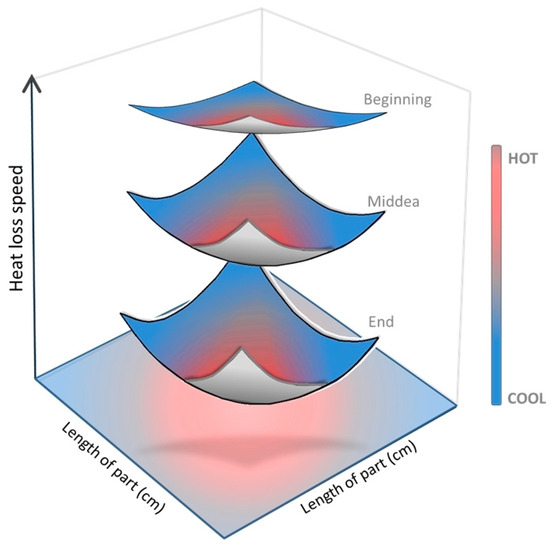
Figure 13.
Illustration of the difference in cooling speed along the Z-axis at the beginning, middle, and end of the part build.
4. Conclusions
A systematic evaluation of the cooling profile was conducted, analyzing both the edges and the center of the specimen at different stages of construction. This approach contributes to the existing knowledge in the literature, as thermography in micrometric regions, such as the deposited layer, remains very scarce.
A quantitative analysis of the cooling stage can aid in equipment modifications and suggestions, such as devices that emit heat in specific areas to improve the temperature distribution. The results presented herein indicate that at the location where the nozzle shift layer is located, the temperatures are around 30 °C higher than on the opposite side of the part. Thus, the nozzle’s position for the layer change must constantly change. In other words, a g-code must be generated to avoid heat concentration by the nozzle, which has not been previously discussed in the literature. Furthermore, we studied the difference in cooling speed between the edge and center of the part for the same layer, contributing to the literature by revealing significant differences in the cooling profile along the same layer. The g-code should program the filament deposition path over the residual heating of the adjacent filament, thus increasing the welding power between the filaments. During different stages of deposition, the part exhibits a difference in the cooling profile, especially when comparing the beginning and end of the deposition process, which highlights the non-uniformity in the manufacturing process—understanding the cooling profile of the printed parts aids in comprehending the anisotropy of the properties of the parts, which is associated with anisotropy in cooling that, in turn, affects the intermolecular diffusion and welding between the deposited filaments. It is important to stress that the results and findings presented in this work are valid for configurations like the ones used herein. The nozzle size impacts the observed heat loss profile. If the nozzle were bigger, its higher surface area would increase the heat transfer by radiation and convection from the nozzle to the printed part. This would lead to higher temperatures in regions close to the nozzle, leading to different temperature behavior. Temperature gradients within the part would increase, as well as the heat loss to the environment. Finally, heat transfer (and its resulting temperature distribution) is strongly influenced by the thermophysical properties of materials, namely the thermal conductivity, thermal diffusivity, and heat capacity. In addition, the emissivity of the material strongly influences heat loss by radiation to the environment, which in turn influences heat loss through convection.
Author Contributions
Conceptualization, R.M.S.M.T. and M.d.N.d.C.; methodology, M.d.N.d.C. and H.M.d.F.; software, H.M.d.F.; validation, M.d.N.d.C. and H.M.d.F.; investigation, M.d.N.d.C. and H.M.d.F.; resources, R.M.S.M.T. and H.M.d.F.; data curation, H.M.d.F. and M.d.N.d.C.; writing—original draft preparation, M.d.N.d.C.; writing—review and editing, R.M.S.M.T. and H.M.d.F.; visualization, M.d.N.d.C. and H.M.d.F.; supervision, R.M.S.M.T.; project administration, R.M.S.M.T. All authors have read and agreed to the published version of the manuscript.
Funding
Conselho Nacional de Desenvolvimento Científico e Tecnológico (CNPq), Grant no. 316270/2023-7.
Data Availability Statement
The data presented in this study are available on request from the corresponding author.
Acknowledgments
The author would like to thank the Laboratório de Transmissão e Tecnologia do Calor (LTTC), especially Helcio Rangel Barreto Orlande from the Department of Mechanical Engineering at the Universidade Federal do Rio de Janeiro—Brazil.
Conflicts of Interest
The authors declare no conflicts of interest.
References
- Balderrama-Armendariz, C.O.; MacDonald, E.; Espalin, D.; Cortes-Saenz, D.; Wicker, R.; Maldonado-Macias, A. Torsion analysis of the anisotropic behavior of FDM technology. Int. J. Adv. Manuf. Technol. 2018, 96, 307–317. [Google Scholar] [CrossRef]
- Montalvo Navarrete, J.I.; Hidalgo-Salazar, M.A.; Nunez, E.E.; Arciniegas, A.J.R. Thermal and mechanical behavior of biocomposites using additive manufacturing. Int. J. Interact. Des. Manuf. (IJIDeM) 2018, 12, 449–458. [Google Scholar] [CrossRef]
- Kollamaram, G.; Croker, D.M.; Walker, G.M.; Goyanes, A.; Basit, A.W.; Gaisford, S. Low temperature fused deposition modeling (FDM) 3D printing of thermolabile drugs. Int. J. Pharm. 2018, 545, 144–152. [Google Scholar] [CrossRef] [PubMed]
- Tan, D.K.; Maniruzzaman, M.; Nokhodchi, A. Advanced Pharmaceutical Applications of Hot-Melt Extrusion Coupled with Fused Deposition Modelling (FDM) 3D Printing for Personalised Drug Delivery. Pharmaceutics 2018, 10, 203. [Google Scholar] [CrossRef] [PubMed]
- Bandinelli, F.; Peroni, L.; Morena, A. Elasto-Plastic Mechanical Modeling of Fused Deposition 3D Printing Materials. Polymers 2023, 15, 234. [Google Scholar] [CrossRef] [PubMed]
- Parker, M.; Inthavong, A.; Law, E.; Waddell, S.; Ezeokeke, N.; Matsuzaki, R.; Arola, D. 3D printing of continuous carbon fiber reinforced polyphenylene sulfide: Exploring printability and importance of fiber volume fraction. Addit. Manuf. 2022, 54, 102763. [Google Scholar] [CrossRef]
- Storck, J.L.; Ehrmann, G.; Güth, U.; Uthoff, J.; Homburg, S.V.; Blachowicz, T.; Ehrmann, A. Investigation of Low-Cost FDM-Printed Polymers for Elevated-Temperature Applications. Polymers 2022, 14, 2826. [Google Scholar] [CrossRef] [PubMed]
- Mogan, J.; Harun, W.S.W.; Kadirgama, K.; Ramasamy, D.; Foudzi, F.M.; Sulong, A.B.; Tarlochan, F.; Ahmad, F. Fused Deposition Modelling of Polymer Composite: A Progress. Polymers 2023, 15, 28. [Google Scholar] [CrossRef]
- Crump, S. Apparatus and Method for Creating Three-Dimensional Objects. U.S. Patent No. 5,121,329, 9 June 1992. [Google Scholar] [CrossRef]
- Menczel, J.D.; Prime, R.B. Thermal Analysis of Polymers: Fundamentals and Applications; Wiley: Hoboken, NJ, USA, 2008. [Google Scholar] [CrossRef]
- Costa, S.F.; Duarte, F.M.; Covas, J.A. Thermal conditions affecting heat transfer in FDM/FFE: A contribution towards the numerical modelling of the process. Virtual Phys. Prototyp. 2015, 10, 35–46. [Google Scholar] [CrossRef]
- Zhang, J.; Vasiliauskaite, E.; De Kuyper, A.; De Schryver, C.; Vogeler, F.; Desplentere, F.; Ferraris, E. Temperature Analyses in Fused Filament Fabrication: From Filament Entering the Hot-End to the Printed Parts. 3D Print. Addit. Manuf. 2022, 9, 132–142. [Google Scholar] [CrossRef] [PubMed]
- Coogan, T.J.; Kazmer, D.O. Healing simulation for bond strength prediction of FDM. Rapid Prototyp. J. 2017, 23, 551–561. [Google Scholar] [CrossRef]
- Zhou, Y.; Nyberg, T.; Xiong, G.; Liu, D. Temperature Analysis in the Fused Deposition Modeling Process. In Proceedings of the 2016 3rd International Conference on Information Science and Control Engineering, ICISCE 2016, Beijing, China, 8–10 July 2016; pp. 678–682. [Google Scholar] [CrossRef]
- D’Elia, C.R.; Hill, M.R.; Stender, M.E.; San Marchi, C.W. Residual Stresses at Critical Locations in Additively-Manufactured Components. In Residual Stress, Thermomechanics & Infrared Imaging and Inverse Problems; Conference Proceedings of the Society for Experimental Mechanics Series; Springer: Cham, Switzerland, 2020; Volume 6, pp. 49–57. [Google Scholar] [CrossRef]
- Liu, T.; Zhang, M.; Kang, Y.; Tian, X.; Ding, J.; Li, D. Material extrusion 3D printing of polyether ether ketone in vacuum environment: Heat dissipation mechanism and performance. Addit. Manuf. 2023, 62, 103390. [Google Scholar] [CrossRef]
- Kousiatza, C.; Chatzidai, N.; Karalekas, D. Temperature Mapping of 3D Printed Polymer Plates: Experimental and Numerical Study. Sensors 2017, 17, 456. [Google Scholar] [CrossRef]
- Compton, B.G.; Post, B.K.; Duty, C.E.; Love, L.; Kunc, V. Thermal analysis of additive manufacturing of large-scale thermoplastic polymer composites. Addit. Manuf. 2017, 17, 77–86. [Google Scholar] [CrossRef]
- Yardimci, M.A.; Guceri, S.I.; Agarwala, M.; Danforth, S.C. Part Quality Prediction Tools For Fused Deposition Processing. In Proceedings of the Solid Freeform Fabrication Proceedings, Austin, TX, USA, 12–14 August 1996; pp. 539–548. [Google Scholar]
- Sun, Q.; Rizvi, G.M.; Bellehumeur, C.T.; Gu, P. Effect of processing conditions on the bonding quality of FDM polymer filaments. Rapid Prototyp. J. 2008, 14, 72–80. [Google Scholar] [CrossRef]
- Dinwiddie, R.B.; Love, L.J.; Rowe, J.C. Real-Time Process Monitoring and Temperature Mapping of a 3D Polymer Printing Process. In Proceedings of the Thermosense: Thermal Infrared Applications XXXV, Baltimore, MD, USA, 29 April–3 May 2013; SPIE Digital Library: Bellingham, WA, USA, 2013; Volume 8705. [Google Scholar] [CrossRef]
- Kuznetsov, V.E.; Solonin, A.N.; Tavitov, A.; Urzhumtsev, O.; Vakulik, A. Increasing strength of FFF three-dimensional printed parts by influencing on temperature-related parameters of the process. Rapid Prototyp. J. 2020, 26, 107–121. [Google Scholar] [CrossRef]
- Hossain, R.E.N.; Lewis, J.; Moore, A.L. In situ infrared temperature sensing for real-time defect detection in additive manufacturing. Addit. Manuf. 2021, 47, 102328. [Google Scholar] [CrossRef]
- Tang, C.-L.; Seeger, S.; Röllig, M. Improving the comparability of FFF-3D printing emission data by adjustment of the set extruder temperature. Atmos. Environ. X 2023, 18, 100217. [Google Scholar] [CrossRef]
- Vanaei, H.R.; Deligant, M.; Shirinbayan, M.; Raissi, K.; Fitoussi, J.; Khelladi, S.; Tcharkhtchi, A. A comparative in-process monitoring of temperature profile in fused filament fabrication. Polym. Eng. Sci. 2021, 61, 68–76. [Google Scholar] [CrossRef]
- Bauriedel, N.; Albuquerque, R.Q.; Utz, J.; Geis, N.; Ruckdäschel, H. Monitoring of fused filament fabrication (FFF): An infrared imaging and machine learning approach. J. Polym. Sci. 2024, 62, 5633–5641. [Google Scholar] [CrossRef]
- Malekipour, E.; Attoye, S.; El-Mounayri, H. Investigation of Layer Based Thermal Behavior in Fused Deposition Modeling Process by Infrared Thermography. Procedia Manuf. 2018, 26, 1014–1022. [Google Scholar] [CrossRef]
- D’andrea, D.; Risitano, G.; Raffaele, M.; Cucinotta, F.; Santonocito, D. Damage assessment of different FDM-processed materials adopting Infrared Thermography. Frat. Integrita Strutt. 2022, 16, 75–90. [Google Scholar] [CrossRef]
- Buj-Corral, I.; Zayas-Figueras, E.E. Comparative study about dimensional accuracy and form errors of FFF printed spur gears using PLA and Nylon. Polym. Test. 2023, 117, 107862. [Google Scholar] [CrossRef]
- Slejko, E.A.; Sesto Gorella, N.; Makaya, A.; Gallina, P.; Scuor, N.; Seriani, S. Vacuum 3D printing of highly filled polymeric matrix composites. Acta Astronaut. 2023, 204, 25–33. [Google Scholar] [CrossRef]
- Nycz, A.; Kishore, V.; Lindahl, J.; Duty, C.; Carnal, C.; Kunc, V. Controlling substrate temperature with infrared heating to improve mechanical properties of large-scale printed parts. Addit. Manuf. 2020, 33, 101068. [Google Scholar] [CrossRef]
- Kishore, V.; Ajinjeru, C.; Nycz, A.; Post, B.; Lindahl, J.; Kunc, V.; Duty, C. Infrared preheating to improve interlayer strength of big area additive manufacturing (BAAM) components. Addit. Manuf. 2017, 14, 7–12. [Google Scholar] [CrossRef]
- Ravi, A.K.; Deshpande, A.; Hsu, K.H. An in-process laser localized pre-deposition heating approach to inter-layer bond strengthening in extrusion based polymer additive manufacturing. J. Manuf. Process. 2016, 24, 179–185. [Google Scholar] [CrossRef]
- Luo, M.; Tian, X.; Zhu, W.; Li, D. Controllable interlayer shear strength and crystallinity of PEEK components by laser-assisted material extrusion. J. Mater. Res. 2018, 33, 1632–1641. [Google Scholar] [CrossRef]
- Ravoori, D.; Salvi, S.; Prajapati, H.; Qasaimeh, M.; Adnan, A.; Jain, A. Void reduction in fused filament fabrication (FFF) through in situ nozzle-integrated compression rolling of deposited filaments. Virtual Phys. Prototyp. 2021, 16, 146–159. [Google Scholar] [CrossRef]
- Oleff, A.; Küster, B.; Stonis, M.; Overmeyer, L. Process monitoring for material extrusion additive manufacturing: A state-of-the-art review. Prog. Addit. Manuf. 2021, 6, 705–730. [Google Scholar] [CrossRef]
- Seppala, J.E.; Hoon Han, S.; Hillgartner, K.E.; Davis, C.S.; Migler, K.B. Weld formation during material extrusion additive manufacturing. Soft Matter 2017, 13, 6761–6769. [Google Scholar] [CrossRef] [PubMed]
- Zhou, X.; Hsieh, S.-J. Thermal Analysis Of Fused Deposition Modeling Process Using Infrared Thermography Imaging And Finite Element Modeling. In Proceedings of the Thermosense: Thermal Infrared Applications XXXIX, Anaheim, CA, USA, 10–13 April 2017; Volume 10214, p. 1021409. [Google Scholar] [CrossRef]
- Hartmann, S.; Müller-Lohse, L.; Tröger, J.-A. Temperature Gradient Determination with Thermography and Image Correlation in Curved Surfaces with Application to Additively Manufactured Components. Exp. Mech. 2023, 63, 43–61. [Google Scholar] [CrossRef]
- Wolszczak, P.; Lygas, K.; Paszko, M.; Wach, R.A. Heat distribution in material during fused deposition modelling. Rapid Prototyp. J. 2018, 24, 615–622. [Google Scholar] [CrossRef]
- Seppala, J.E.; Migler, K.D. Infrared thermography of welding zones produced by polymer extrusion additive manufacturing. Addit. Manuf. 2016, 12, 71–76. [Google Scholar] [CrossRef]
- Traxler, G.; Köpplmayr, T. Process Monitoring By Thermography During Fused Deposition Modeling. In Proceedings of the 32nd International Conference of the Polymer Processing Society, Lyon, France, 25–29 July 2016. [Google Scholar]
- Micalizzi, S.; Lantada, A.D. Shape-memory actuators manufactured by dual extrusion multimaterial 3d printing of conductive and non-conductive fi laments. Smart Mater. Struct. 2019, 28, 105025. [Google Scholar] [CrossRef]
- Yardimci, M.A.; Güçeri, S. Conceptual framework for the thermal process modelling of fused deposition. Rapid Prototyp. J. 1996, 2, 26–31. [Google Scholar] [CrossRef]
- Thomas, J.; Rodriguez, J. Modeling The Fracture Strength Between Fused-Deposition Extruded Roads. In Proceedings of the Solid Freeform and Additive Fabrication, San Francisco, CA, USA, 24–26 April 2000; pp. 16–23. [Google Scholar] [CrossRef]
- Bellini, A.; Güçeri, S. Mechanical characterization of parts fabricated using fused deposition modeling. Rapid Prototyp. J. 2003, 9, 252–264. [Google Scholar] [CrossRef]
- Yang, C.; Tian, X.; Li, D.; Cao, Y.; Zhao, F.; Shi, C. Influence of thermal processing conditions in 3D printing on the crystallinity and mechanical properties of PEEK material. J. Mech. Work. Technol. 2017, 248, 1–7. [Google Scholar] [CrossRef]
- Cox, J.R.; Kipling, I.; Gibbons, G.J. Ensuring supply chain integrity for material extrusion 3D printed polymer parts. Addit. Manuf. 2023, 62, 103403. [Google Scholar] [CrossRef]
- Zhou, X.; Hsieh, S.-J.; Sun, Y. Experimental and numerical investigation of the thermal behaviour of polylactic acid during the fused deposition process. Virtual Phys. Prototyp. 2017, 12, 221–233. [Google Scholar] [CrossRef]
- Pooladvand, K.; Salerni, A.D.; Furlong, C. In-Situ Thermal Monitoring of Printed Components During Rapid Prototyping by Fused Deposition Modeling. In Residual Stress, Thermomechanics & Infrared Imaging and Inverse Problems, Volume 6; Conference Proceedings of the Society for Experimental Mechanics Series; Springer: Cham, Switzerland, 2020; Volume 6, pp. 131–140. [Google Scholar] [CrossRef]
- Vaes, D.; Coppens, M.; Goderis, B.; Zoetelief, W.; Van Puyvelde, P. Assessment of Crystallinity Development during Fused Filament Fabrication through Fast Scanning Chip Calorimetry. Appl. Sci. 2019, 9, 2676. [Google Scholar] [CrossRef]
- Srinivas, V.; van Hooy-Corstjens, C.S.; Harings, J.A. Correlating molecular and crystallization dynamics to macroscopic fusion and thermodynamic stability in fused deposition modeling; a model study on polylactides. Polymer 2018, 142, 348–355. [Google Scholar] [CrossRef]
- Costa, S.F.; Duarte, F.M.; Covas, J.A. Estimation of filament temperature and adhesion development in fused deposition techniques. J. Mech. Work. Technol. 2017, 245, 167–179. [Google Scholar] [CrossRef]
- Kousiatza, C.; Karalekas, D. In-situ monitoring of strain and temperature distributions during fused deposition modeling process. Mater. Des. 2016, 97, 400–406. [Google Scholar] [CrossRef]
- Guessasma, S.; Belhabib, S.; Nouri, H. Printability and Tensile Performance of 3D Printed Polyethylene Terephthalate Glycol Using Fused Deposition Modelling. Polymers 2019, 11, 1220. [Google Scholar] [CrossRef] [PubMed]
- Gudadhe, A.; Bachhar, N.; Kumar, A.; Andrade, P.; Kumaraswamy, G. Three-Dimensional Printing with Waste High-Density Polyethylene. ACS Appl. Polym. Mater. 2019, 1, 3157–3164. [Google Scholar] [CrossRef]
- Hu, B.; Duan, X.; Xing, Z.; Xu, Z.; Du, C.; Zhou, H.; Chen, R.; Shan, B. Improved design of fused deposition modeling equipment for 3D printing of high-performance PEEK parts. Mech. Mater. 2019, 137, 103139. [Google Scholar] [CrossRef]
- Dinwiddie, R.B.; Kunc, V.; Lindal, J.M.; Post, B.; Smith, R.J.; Love, L.; Duty, C.E. Infrared Imaging of the Polymer 3D-Printing Process. In Proceedings of the Thermosense: Thermal Infrared Applications XXXVI, Baltimore, MD, USA, 5–9 May 2014. [Google Scholar] [CrossRef]
- Eyercioğlu, Ö.; Aladağ, M.; Sever, S. Temperature Evaluation and Bonding Quality of Large Scale Additive Manufacturing Thin Wall Parts. Sigma J. Eng. Nat. Sci. 2018, 36, 645–654. [Google Scholar]
- Rodríguez, J.F.; Thomas, J.P.; Renaud, J.E. Mechanical behavior of acrylonitrile butadiene styrene fused deposition materials modeling. Rapid Prototyp. J. 2003, 9, 219–230. [Google Scholar] [CrossRef]
- Rodriguez, J.F.; Thomas, J.P.; Renaud, J.E. Characterization of the mesostructure of fused-deposition acrylonitrile-butadiene-styrene materials. Rapid Prototyp. J. 2000, 6, 175–186. [Google Scholar] [CrossRef]
Disclaimer/Publisher’s Note: The statements, opinions and data contained in all publications are solely those of the individual author(s) and contributor(s) and not of MDPI and/or the editor(s). MDPI and/or the editor(s) disclaim responsibility for any injury to people or property resulting from any ideas, methods, instructions or products referred to in the content. |
© 2024 by the authors. Licensee MDPI, Basel, Switzerland. This article is an open access article distributed under the terms and conditions of the Creative Commons Attribution (CC BY) license (https://creativecommons.org/licenses/by/4.0/).

