Article

A Study on the Residual Oil Distribution in Tight Reservoirs Based on a 3D Pore Structure Model

1
PetroChina Tarim Oilfield Company, Korla 841000, China
2
R&D Center for Ultra-Deep Complex Reservoir Exploration and Development, China National Petroleum Corporation, Korla 841000, China
3
State Key Laboratory of Deep Oil and Gas, China University of Petroleum (East China), Qingdao 266580, China
*
Authors to whom correspondence should be addressed.
Processes 2025, 13(1), 203; https://doi.org/10.3390/pr13010203
Submission received: 9 December 2024 / Revised: 20 December 2024 / Accepted: 27 December 2024 / Published: 13 January 2025
(This article belongs to the Topic Exploitation and Underground Storage of Oil and Gas)

Abstract

:
A tight reservoir is characterized by low porosity and permeability as well as a complex pore structure, resulting in low oil recovery efficiency. Understanding the micro-scale distribution of residual oil is of great significance for improving oil production and water flooding recovery rates. In this study, a 3D pore structure model of tight sandstone was established using CT scanning to characterize the residual oil distribution after water flooding. The effects of displacement methods and wettability on residual oil distribution at the micro-scale were then studied and discussed. Moreover, increasing the displacement rate has little effect on the distribution area and dominant seepage channels. Microscopic residual oil is classified into five discontinuous phases according to the oil–water–pore–throat contact relationship. The microscopic residual oil exhibits characteristics of being dispersed overall but locally concentrated. Under water-wet conditions, the injected water tends to strip the oil phase along the pore walls. Under oil-wet conditions, the pore walls have an improved adsorption capacity for the oil phase, resulting in a large amount of porous and membranous residual oil retained in the pores, which leads to a decrease in the overall recovery rate.

1. Introduction

Tight reservoirs are present hotspots for oil and gas exploration and development. However, their characteristics—low porosity, low permeability, and complex pore structure—lead to difficulties in water injection and development, resulting in a low crude oil recovery rate [1,2,3,4,5,6,7]. Long-term exploration and development have shown that fluid seepage patterns and the distribution of residual oil in water injection development are closely related to the microscopic pore structure [8,9]. Moreover, the variability in the distribution of residual oil within the microscopic pore structure determines the reservoir’s production capacity and the development effect at the macroscopic level [10,11].
The relationship between reservoir depth and rock pore structure is a key topic in petroleum geology, directly influencing the occurrence, migration, and development of oil and gas. As reservoir depth increases, factors such as formation pressure, temperature, and long-term diagenesis significantly alter the rock’s pore structure and related parameters, including porosity, permeability, pore size distribution, and connectivity [12]. A deeper understanding of the coupling relationship between depth and pore structure parameters is essential for accurately predicting the physical property evolution and oil and gas distribution in deep and ultra-deep reservoirs. For instance, in the Lower Ordovician deep carbonate rocks of the Tarim Basins Tazhong area, Wang et al. [13] observed that porosity decreases with increasing burial depth, with deep reservoirs generally exhibiting low porosity. Zhou and Wu [14] found that the fractal characteristics of pore structure and the distribution of pore throats vary with depth, and these microstructural changes significantly influence fluid permeability. Wang et al. [15] discovered that dissolution and fracture development under high temperature and pressure conditions in deep reservoirs may create secondary porosity in localized areas, improving reservoir storage properties and causing non-linear changes in pore parameters. Analyzing the porosity, permeability, and pore structure distribution at different depths provides scientific insights for the exploration and development of deep and ultra-deep oil and gas reservoirs.
A lot of studies have been conducted on the distribution of residual oil in pores at the micro-scale. Teng et al. [16] conducted tests on gravity drainage characteristics to visualize biphasic gravity drainage in porous media using magnetic resonance imaging. The results revealed that small to medium internal orifices were almost unaffected by the injected water, while impulse flow formed in large pores. After water flooding, residual oil was predominantly distributed in the small to medium pores. Jungreuthmayer et al. [17] constructed high-resolution three-dimensional images of the pore structure within the core using CT scanning and digital image processing techniques. It was found that the smaller pores with poor connectivity tend to retain more residual oil in the form of isolated oil droplets. Larger, well-connected pores are conducive to the formation of oil gangs and sheens, which are more susceptible to water flooding. Jia et al. [18] used COMSOL to design three models illustrating actual rock pores and throat structures. The study revealed that in the initial phases of water flooding in the pure matrix model, clustered residual oil emerged as the predominant type. With the advancement of water flooding, the continuous clustered residual oil transitioned to predominantly discontinuous porous and columnar residual oil. Xia et al. [19] investigated the oil–water distribution characteristics of cores and the factors of residual oil micro-formation by using laser confocal and core fluorescence analysis techniques in combination with core water injection tests. It was found that the residual oil was mainly in free state and bound state under the condition of water drive, and the effect of producing cluster residual oil, inter-particle adsorption state residual oil, pore surface oil film, and corner residual oil under the condition of polymer drive was obvious. However, ordinary fluorescence microscopy and magnetic resonance imaging are mainly for two-dimensional image analysis, thus are unable to analyze and detect oil and water rocks in three dimensions. Furthermore, numerical simulation studies often use simple geometric approximations, which pose challenges in accurately characterizing the migration process and distribution patterns of residual oil within three-dimensional pore structures.
In addition, the wettability of the rock also affects the distribution of the remaining oil. Guo et al. [20] observed significant differences in the residual oil distribution within porous media under various wetting conditions. The study found that in medium-wet and water-wet porous media, it was difficult to observe the presence of residual oil and oil film in the pore throats, and the amount of residual oil in dead ends and clusters of residual oil was greatly reduced. Iglauer et al. [21] conducted displacement experiments using CT scanning to study the influence of pore throat wall wettability on the mechanisms and distribution of micro residual oil displacement. The study revealed that in oil-wet rock, the clusters of residual oil had obvious flaky flat geometry, while in the water-wet sample, the clusters of residual oil were more spherical. Ekechukwu et al. [22] conducted water-driven experiments on core samples using a high-precision micro-core driver integrated with a micro-CT scanner and a high-pressure, high-temperature macro-core driver. The results showed that the medium wettability samples had the highest oil recovery rates at both low and high flow rates. The studies on the relationship between wettability and microscopic residual oil distribution mainly focus on the wettability of porous media but ignore the effect of the wetting angle on residual oil distribution.
Aiming at the above problems regarding the spatial distribution of microscopic residual oil, this study uses CT scanning and digital image processing techniques to construct the actual three-dimensional pore structure within the core. It further analyzes the spatial distribution of residual oil under different water-driving velocities, directions, and wetting angles, in both oil-wet and water-wet conditions. This method accurately characterizes the distribution type of residual oil post-waterflooding and reveals the spatial distribution pattern of residual oil at the microporous scale, providing critical guidance for enhancing oil recovery.

2. Modeling of 3D Pore Structure in Tight Reservoirs

Computed Tomography (CT) scanning is a non-destructive imaging technique to acquire three-dimensional images of a rock sample’s internal structure. The sandstone sample undergoes scanning by a radiation source, followed by processing and reconstruction of the 2D image obtained from the scan using Avizo 2023.2 software to generate a final 3D structural image of the sandstone sample.

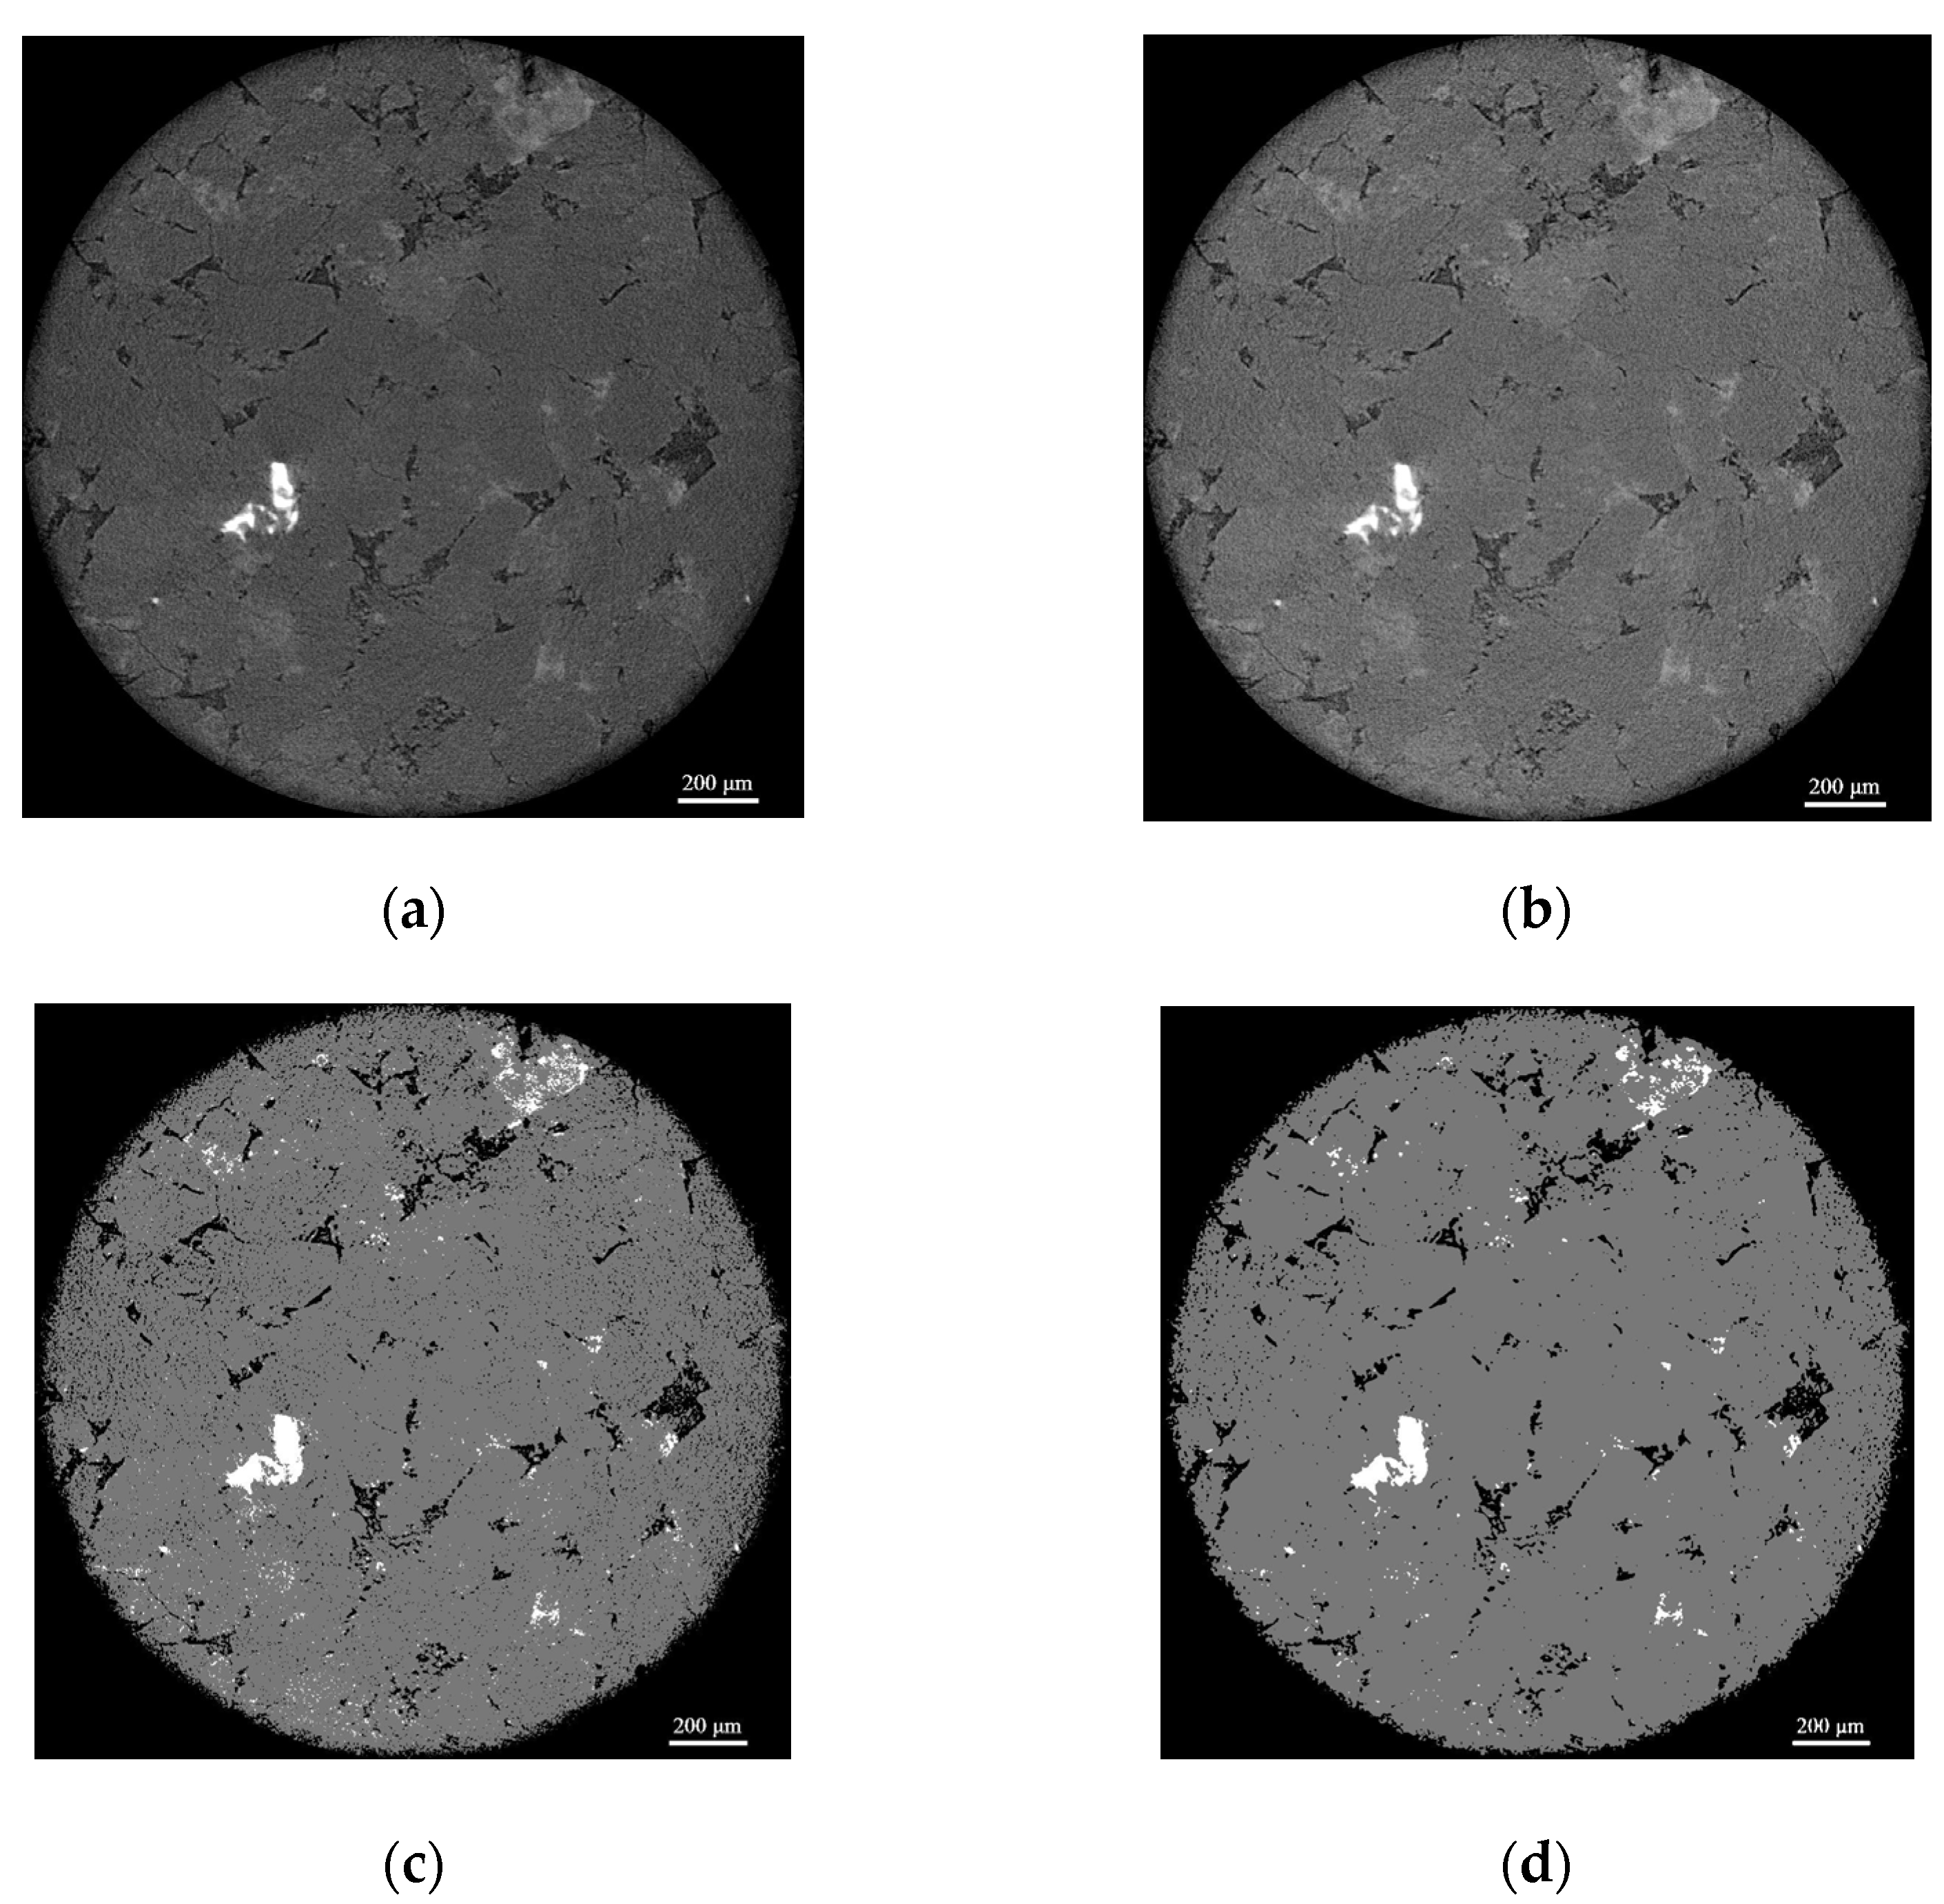
2.1. Micro-CT Scanning Test

Yongjin area is in the central part of the Junggar Basin, which is affected by multi-phase tectonic movement and has a complex geological structure. There are several fracture zones and folded zones inside the basin with frequent geotectonic activities. The reservoir lithology is mainly feldspathic clastic sandstone (58.14%) and clastic sandstone (41.86%). The core samples were obtained from a 5014 depth well in an oil field of western China. A small cylinder with a diameter of approximately 2.5 mm was precisely drilled from the core using linear cutting. The two ends were trimmed and flattened to prepare for the micro-CT scanning experiments. The experiments were carried out using a MicroXCT-200 (Nikon Metrology, Leuven, Belgium) with a resolution of 2.0 μm and a viewing angle range of 2.5 mm × 2.5 mm.

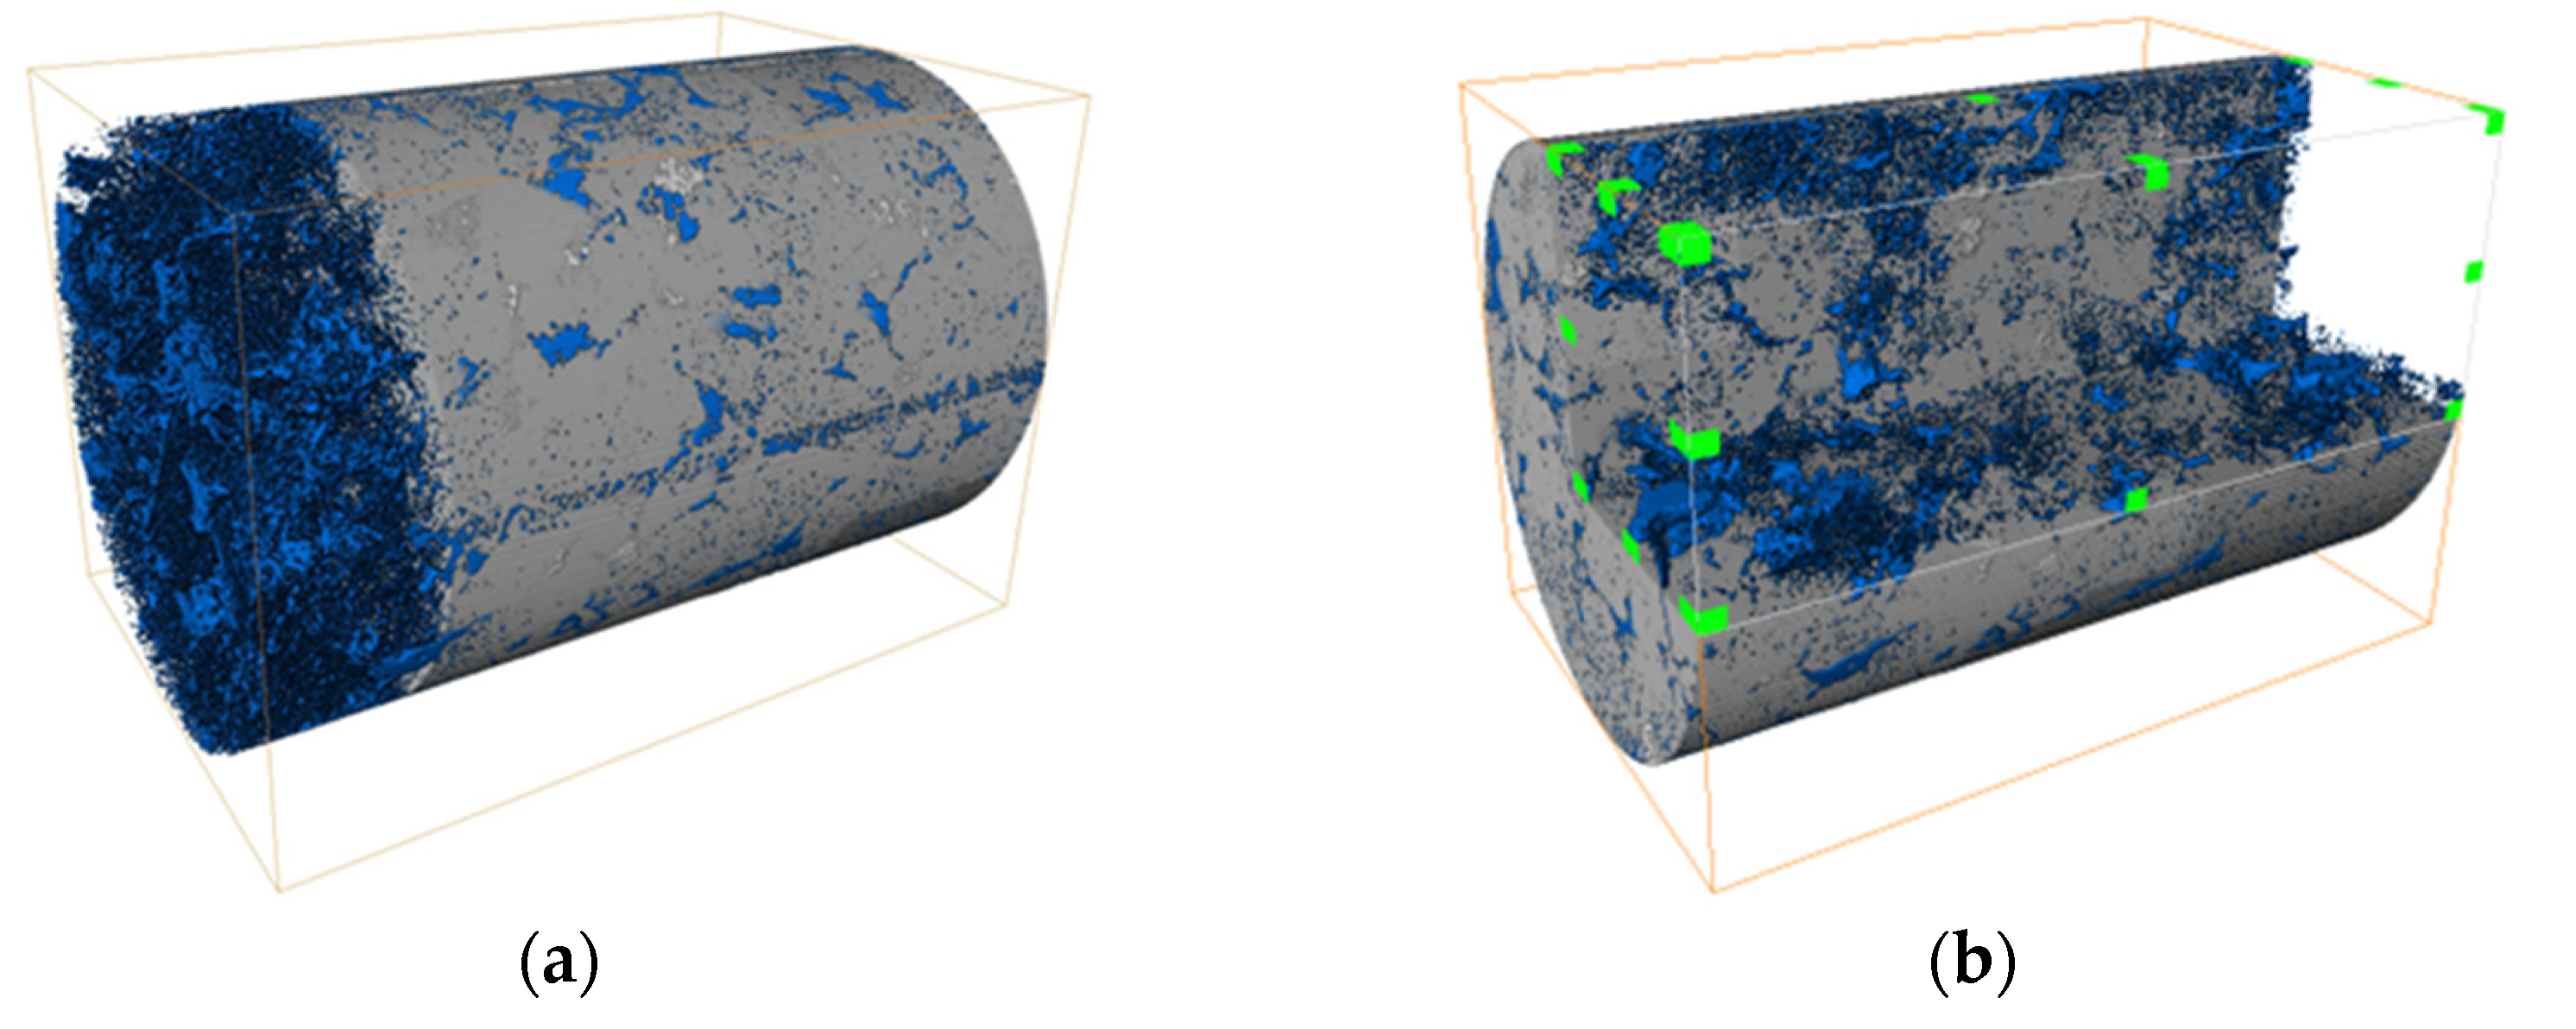
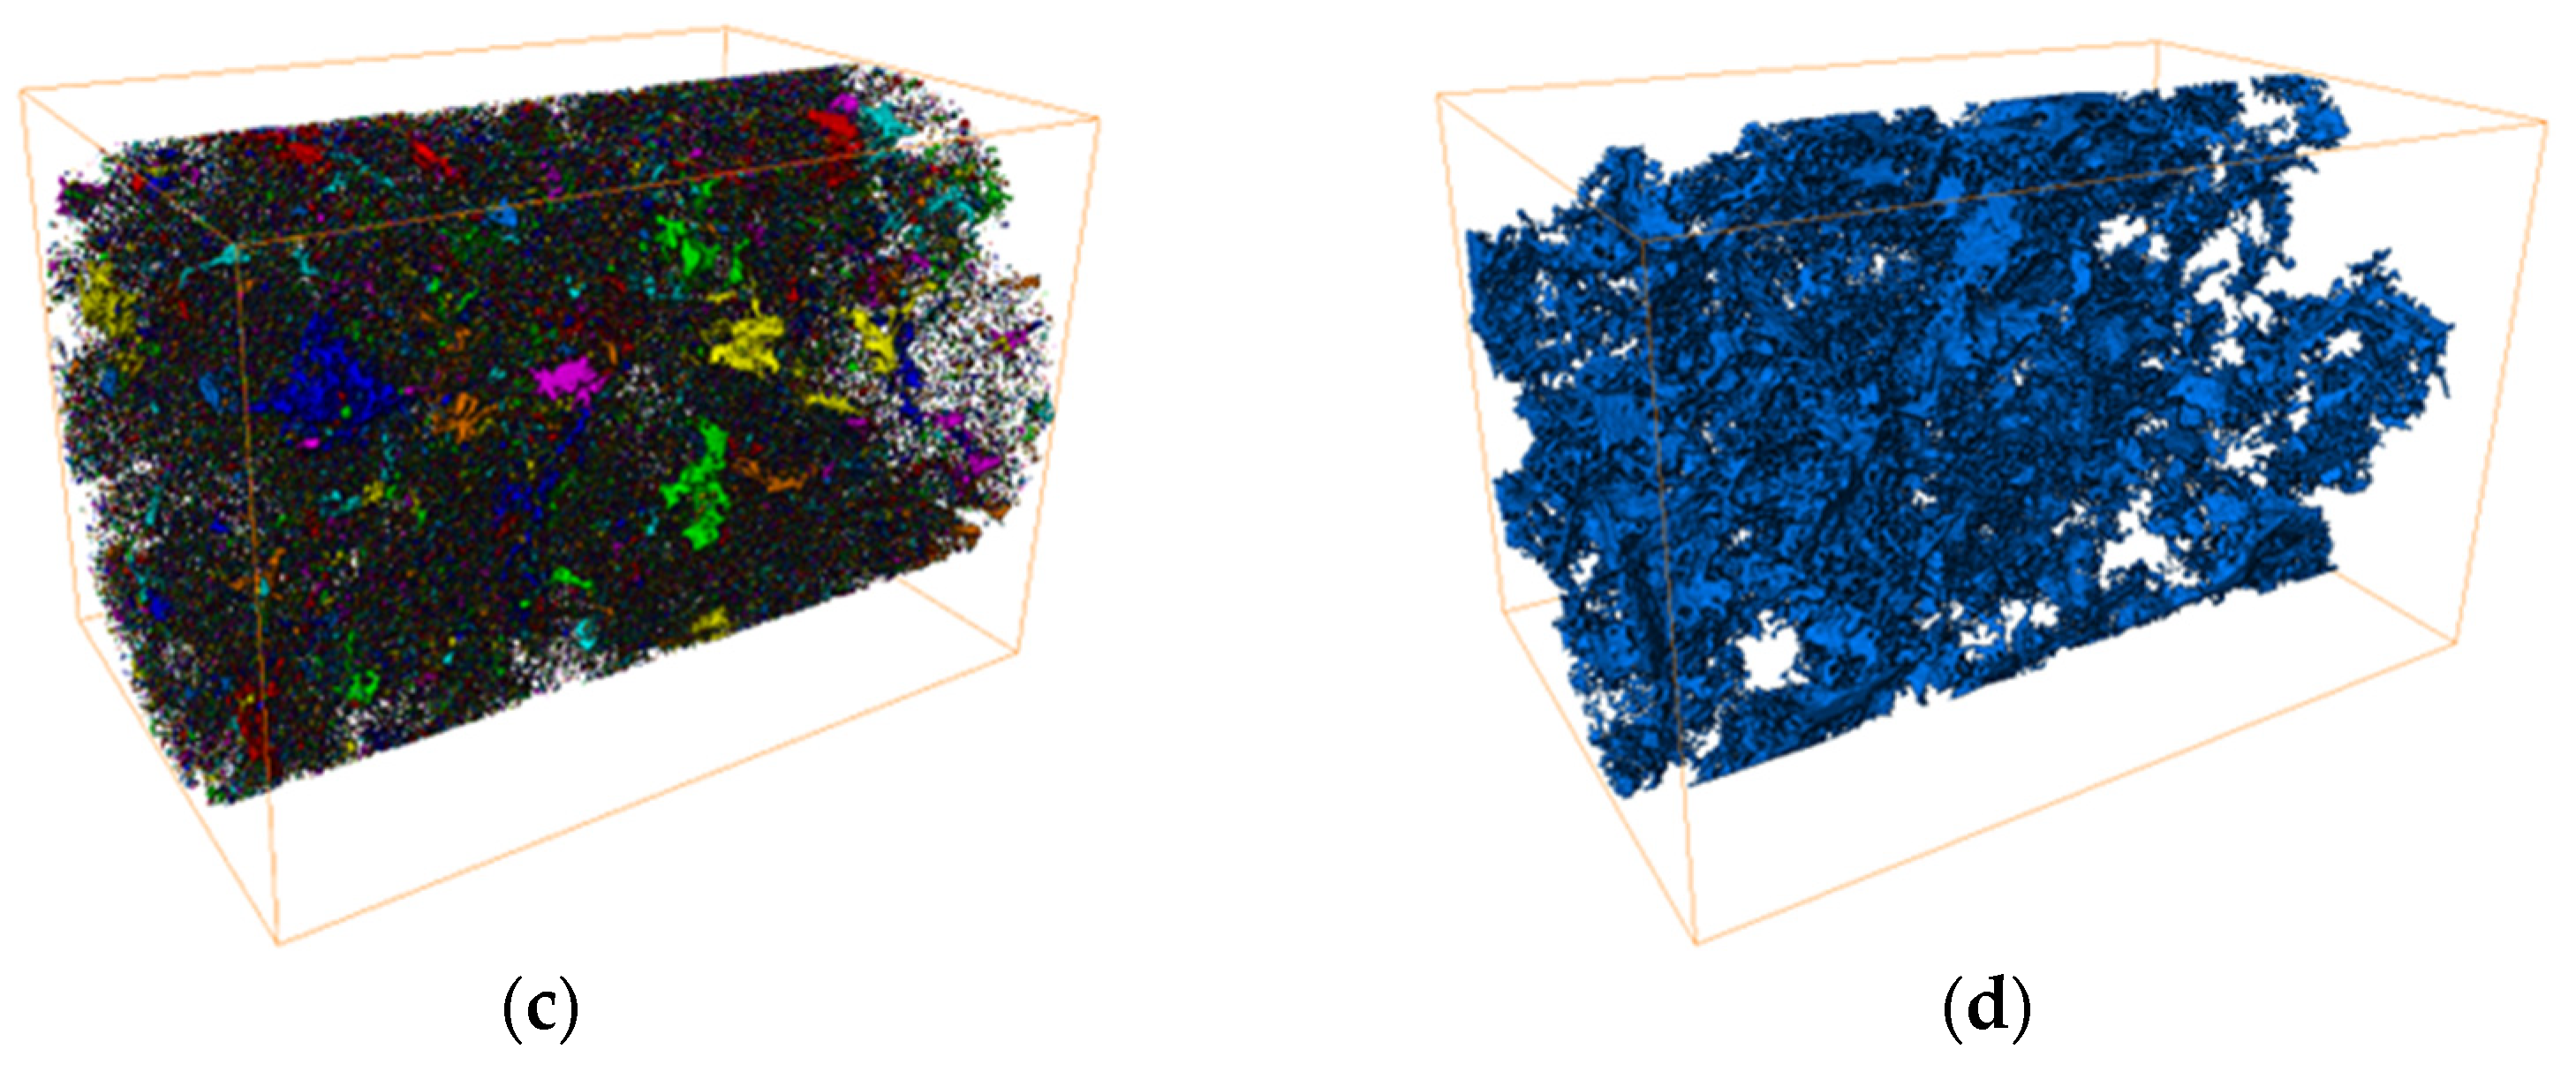
2.2. Three-Dimensional Pore Structure Reconstruction

The 3D model is constructed through a continuous, multi-stage process. This process involves three main stages: (1) image acquisition using Micro-CT scanning, (2) digital image processing (including threshold segmentation, median filtering, and noise removal), and (3) stacking the processed 2D slices to reconstruct the complete 3D pore structure model.
Multiple 1024 px × 1024 px two-dimensional grayscale images of rock samples were acquired by CT scanning. However, the original grayscale images had low contrast, various noise, and high-density minerals in the rocks, which tended to cause halos during scanning. These halos resulted in low image clarity and resolution, making it difficult to effectively distinguish the boundaries between pores and the matrix. Therefore, for the direct reconstruction of the pore space structure, digital image processing was performed on the original grayscale images. This process involved threshold segmentation, median filtering, and overlaying of screenshots of the 3D images [23]. The detailed process is illustrated in Figure 1a–d.
The batch-processed CT images were sequentially overlaid to build a 3D digital rock core, as shown in Figure 2a,b. Blue, gray, and white represent the pores, the matrix, and the minerals of the rock, respectively. An object separation algorithm was used to detect all the pores in the model, extracting the isolated and disconnected pores and cracks in the rock, and then grouped according to grain size, with different colors each representing pores and cracks of different grain sizes, as shown in Figure 2c. The image shows that isolated pores and cracks were abundant in the rock and varied in size and geometric shape. By removing isolated pores and cracks from the pore space, the connected pore structure inside the rock was obtained, as shown in Figure 2d.

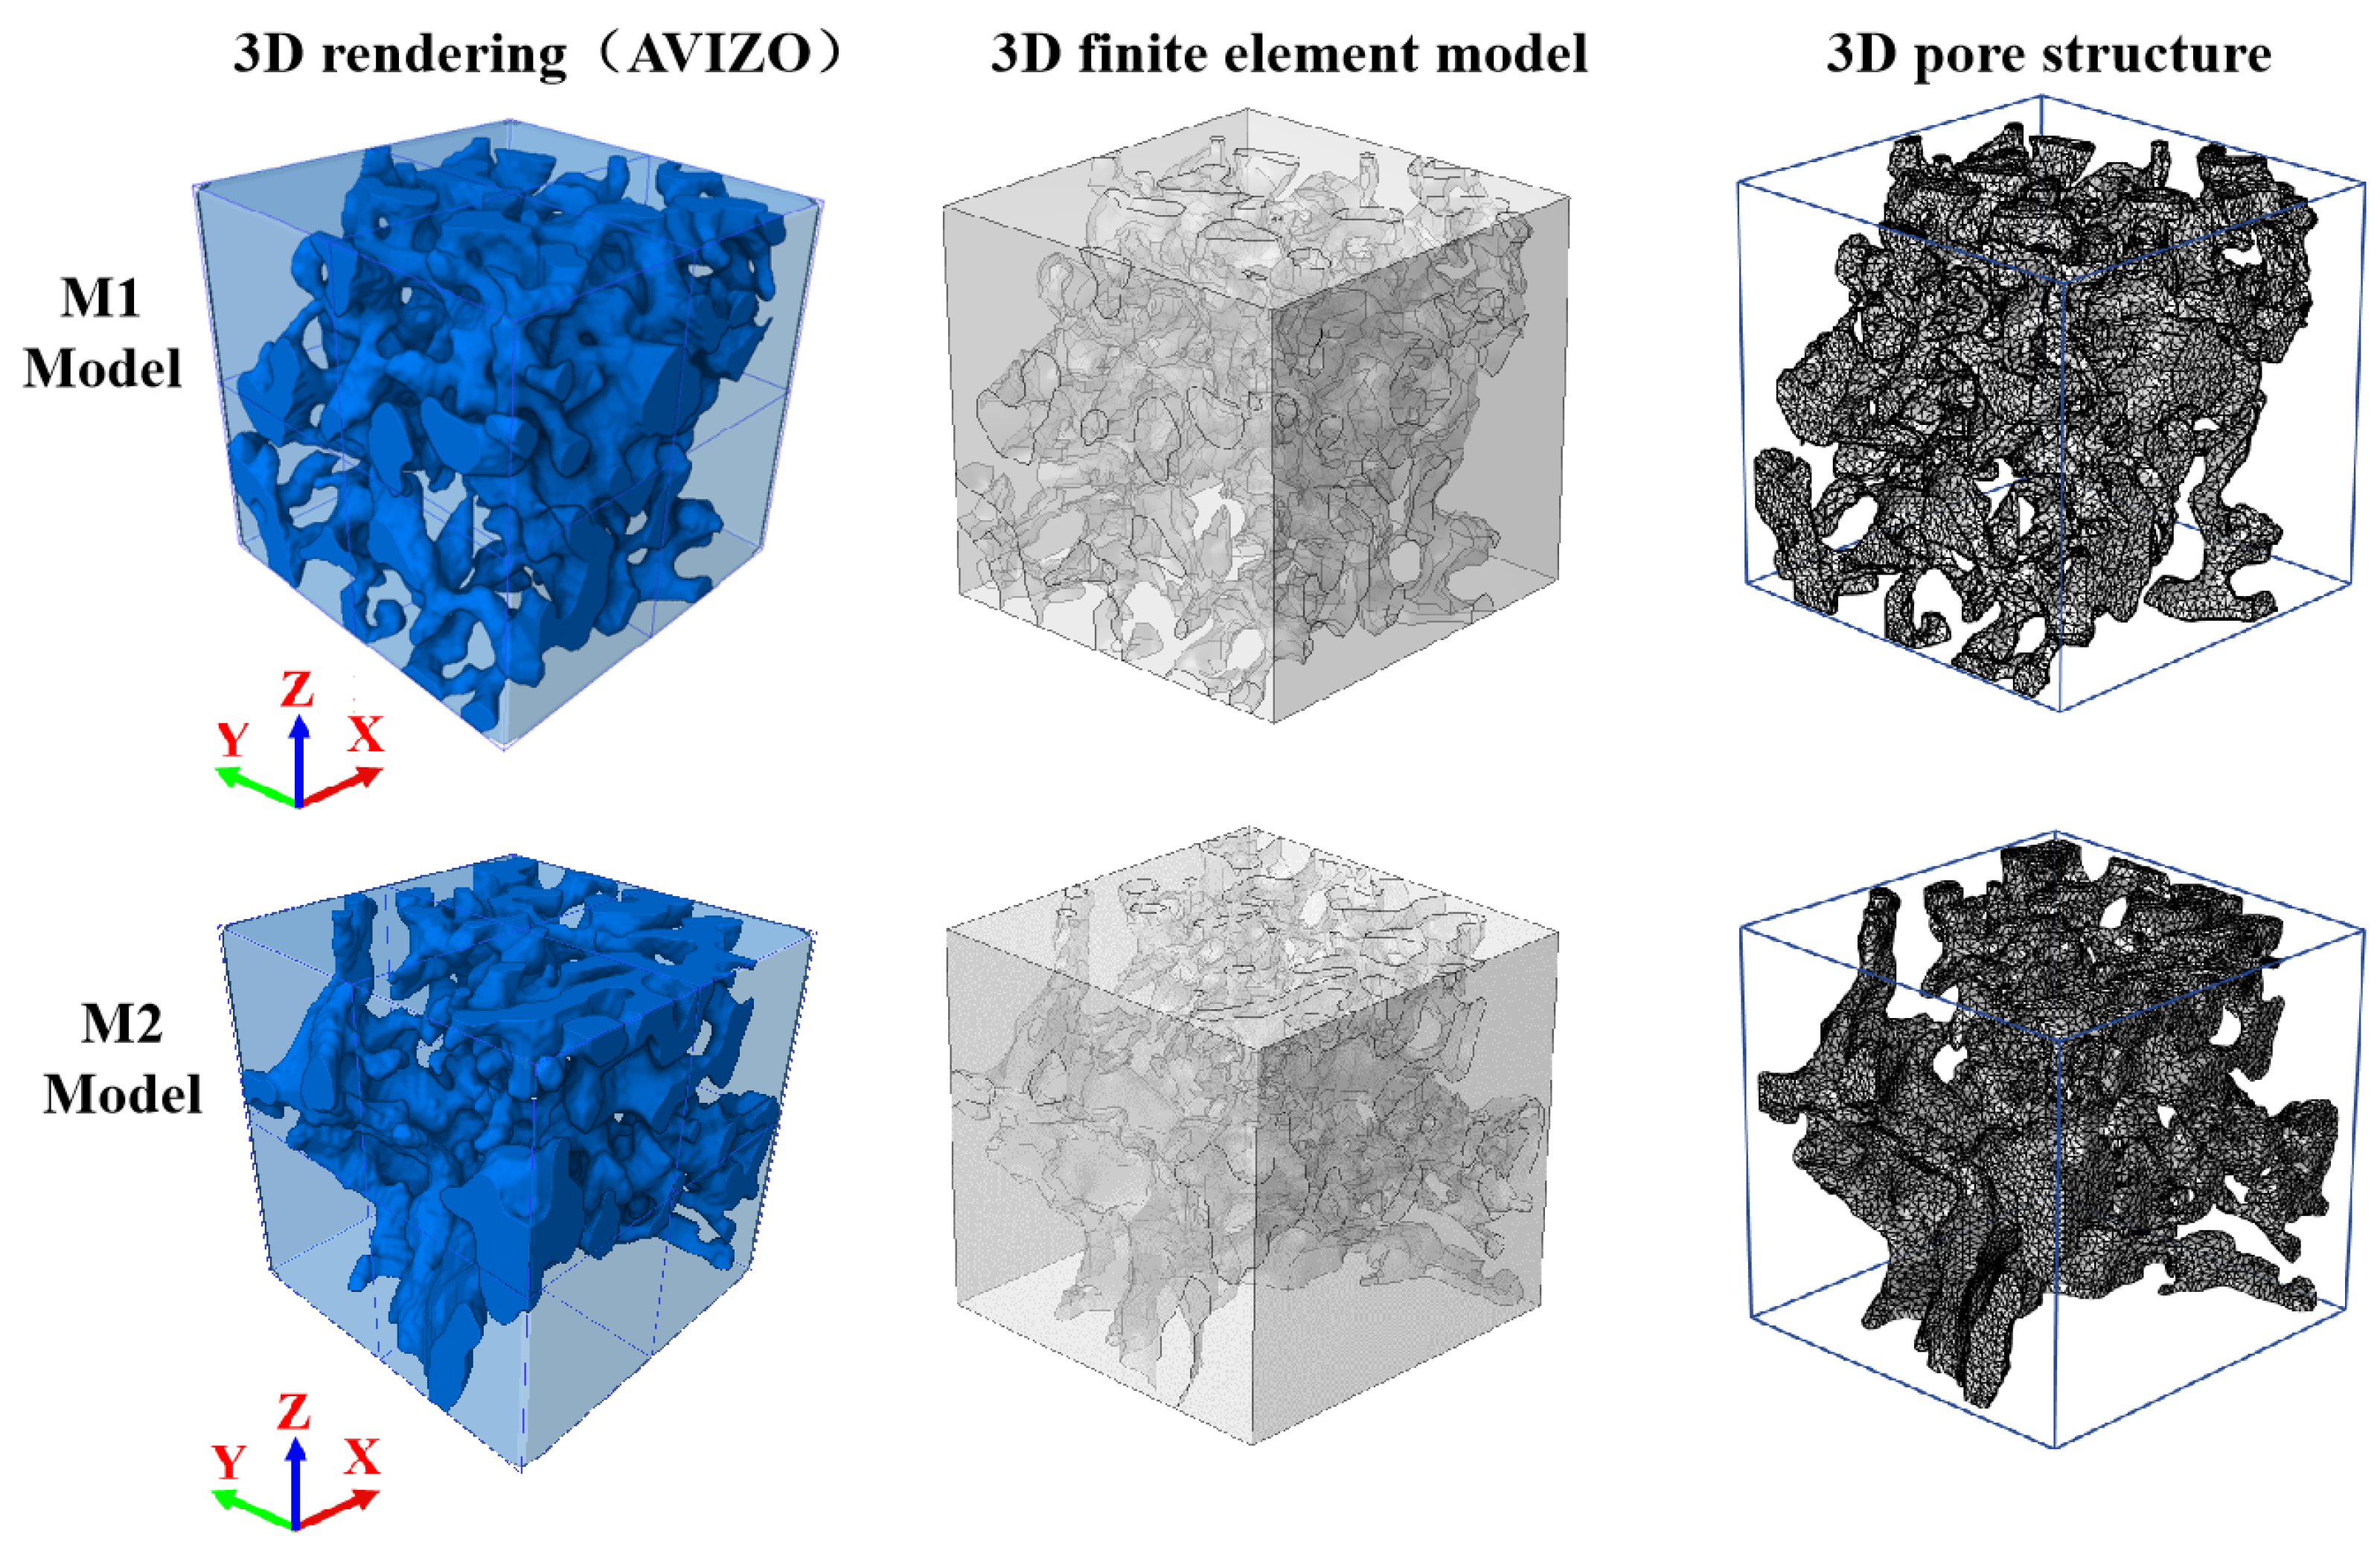
2.3. Three-Dimensional Pore Structure Finite Element Modeling

To accurately depict the distribution of residual oil, areas with concentrated pore development were selected, and isolated micropores were classified as part of the rock matrix. Two pore structure models with different porosity and spatial morphology were established to simulate the distribution of residual oil. The model dimensions were 90 × 90 × 90 voxels, corresponding to a three-dimensional pore structure model of 180 × 180 × 180 μm. Finite element mesh models were built using COMSOL. Figure 3 shows two typical pore structure models (i.e., M1 and M2). The M1 model mainly consists of complex connected pores (pore type) to analyze the impact of different displacement directions on residual oil distribution at the microscale. Meanwhile, the M2 model consists of pores in the upper part and intersecting cracks in the lower part (pore-crack type) to describe the presence and distribution of residual oil [24].
The boundary conditions for the M1 model are illustrated in Figure 4. Assuming the initial state within the rock pore domain is saturated with the oil phase, the fluid boundary conditions consist of inflow, outflow, and pore wall boundaries. The pore wall surface is designed as a wetting wall in this study. The upper and lower surfaces in the Z-axis direction serve as the inlet and outlet for fluid flow, respectively. The inlet phase consists of the water phase and represents the two-phase interface in the initial state. Gravitational acceleration acts in the downward direction (i.e., the negative Z-axis direction). The blue area in the diagram indicates the pore inlet and outlet. The legend for all three figures is the saturation of the oil phase, both the volume fraction of oil to total seepage, dimensionless. So, there is no indication of the unit.

3. Phase Field Method Control Equations

The phase field method couples the Cahn–Hilliard equation and the Navier–Stokes equation through the interfacial tension term, introducing key phase field variables to enable real-time tracking of dynamic fluid phase interface migration in pores [25,26]. In complex porous media with fractal characteristics, the flow and phase field evolution of two-phase fluids can be accurately characterized under mass conservation [27].
The Cahn–Hilliard equation is primarily used to depict phenomena such as phase separation, phase interface motion, and interface diffusion in two-phase and multiphase fluids [28]. The equation is as follows:
ϕ t + u · ϕ = · γ λ ε 2 ψ ψ = · ε 2 ϕ + ϕ 2 1 ϕ
where ϕ is the dimensionless phase field variable, which takes values between −1 and 1 in the phase field method. ϕ = + 1 represents fluid 1, ϕ = 1 represents fluid 2, and 1 < ϕ < 1 represents the transitional region of the interface between the two phases. λ is the mixed energy density, measured in N. ε is the phase interface thickness parameter, measured in m. u is the fluid velocity vector, measured in m·s−1. γ is the fluid migration rate, measured in m3·s·kg−1. ψ is the auxiliary variable for the phase field.
Inside the rock, fluids flow exclusively through the pores and fractures, bypassing the rock matrix [29,30].
In the viscous fluid, the stress tensor is expressed as follows [31]:
τ = μ u + u T 2 3 μ ( · u ) I
Simultaneously, there is a transfer of fluid mass and momentum in two-phase flow. Assuming there has incompressible two-phase flow within the pores, the flow dynamics of the two-phase fluid can be elucidated by incorporating interfacial tension as a body force into the Navier–Stokes equation. The expression is detailed below:
ρ u t + ρ u · u = · p I + τ + ρ g + F st ρ · u = 0
where ρ represents fluid density in kg·m−3. p represents fluid pressure in Pa. I represents a unit vector. τ represents the viscous stress tensor. represents the gradient operator. g represents the acceleration due to gravity in m·s−2. F s t represents the interface tension term in N·m−1.
The phase field method control equations are as follows:
F s t = λ ε 2 ψ = λ 2 ϕ + ϕ ϕ 2 1 ε 2
Surface tension can be calculated as a distributed force on the interface by using phase field variables ϕ and phase field auxiliary variables ψ . This method avoids the complex process of calculating interfacial tension using surface normal and surface curvatures. The modified Navier–Stokes equation and Cahn–Hilliard equation mentioned above together form the governing equations for the flow of two-phase fluids at the pore scale [32].
Fluid saturation is primarily determined by the distribution of the oil and water phases, as well as the physical conditions and boundary factors during the flow process, such as fluid permeability and pressure gradient. Fluid physical parameters such as density, viscosity, and fluid saturation during two-phase flow can be defined as functions associated with the phase field variables:
ρ = 1 + ϕ ρ 1 2 + 1 ϕ ρ 2 2 μ = 1 + ϕ μ 1 2 + 1 ϕ μ 2 2
where and ρ 2 represent the densities of the two fluids, in kg·m−3. μ 1 and μ 2 represent the dynamic viscosities of the two fluids, in Pa·s.
V f , 1 = 1 ϕ / 2 V f , 2 = 1 + ϕ / 2 V f , 1 + V f , 2 = 1
The pore walls are assigned a wetting condition characterized by the wetting angle, which typically falls within the range of 0° to 180°. In practical engineering applications, the magnitude of the wetting angle influences wetting performance, subsequently impacting the distribution of residual oil within the medium. A wetting angle ranging from 0° to 90° indicates hydrophilic properties of the rock surface (assuming the fluid is water). Conversely, a wetting angle between 90° and 180° signifies hydrophobic properties, indicating an affinity for oil. The wetting condition of the rock pore walls can be described by the phase field variable [33]:
n · γ λ ε 2 ψ = 0 n · ε 2 ϕ = ε 2 cos θ ϕ
where n is the unit vector normal to the boundary, θ is the wetting angle of the aqueous phase.
In fluid mechanics, the capillary number (usually denoted Ca) is a dimensionless physical quantity used to describe the relative importance of surface tension effects versus viscous force effects in fluid flow. The capillary number is defined as follows:
C a = μ v / σ
where μ is the dynamic viscosity of the fluid, v is the characteristic velocity (e.g., the average or relative flow rate of the fluid), and σ is the surface tension between the fluids.

4. Research on the Distribution of Micro Residual Oil

4.1. Distribution of Residual Oil Under Different Pore Structure

The spatial distribution of pores significantly influences the distribution of residual oil. Identifying the shape and location of residual oil in pore throats is essential to understand the distribution pattern. After water flooding (outlet water > 98%), a large amount of residual oil remains in areas untouched by the injected water and exhibits differential distribution. This study categorizes five types of discontinuous phase microscopic residual oil (porous, membranous, corner, droplet, and columnar) based on the oil–water–pore–throat contact relationship. The distribution of these residual oil types in 3D pores is illustrated in Figure 5.
The red squares in Figure 5 represent five typical residual oil distribution patterns. Different colors indicate varying oil volume fractions at each location, with red to blue showing a decreasing trend. The yellow arrows represent the direction of water flow. Porous residual oil often distributes between the complex and small non-mainstream lines of the displacement process, with an irregular morphology. Porous residual oil has low connectivity and recovery efficiency, with the oil phase being dispersed and unable to form coherent flow pathways, as shown in Figure 5a. Droplet residual oil is often present as dispersed oil drops within necking throats or pore throat mutations. Droplet residual has poor connectivity and is relatively difficult to mobilize. The recovery efficiency is moderate, as some of the droplets may be partially mobilized with increasing displacement pressure, but residual oil still remains, as shown in Figure 5b. Membranous residual oil adheres to the pore throat walls and appears as a thin film, as shown in Figure 5c. Membranous residual oil exhibits poor fluid connectivity and can only be partially mobilized through capillary pressure or changes in wettability. Its recovery efficiency is low due to strong adhesion to pore walls, often requiring specific wettability alteration or chemical flooding techniques for extraction. Corner residual oil mainly resides in the corner regions of pore throats, with one side being a blind end of the pore and the other side being open space in the free state, as shown in Figure 5d. Corner residual oil has limited connectivity but may be locally connected to the main flow channels. Its recovery efficiency is relatively high, as this type of residual oil can be mobilized by capillary pressure or effectively displaced by water flooding during the displacement process. Columnar residual oil is mainly isolated within the pore throats, surrounded by water at both ends, and exhibits a long cylindrical shape, as shown in Figure 5e. The connectivity of columnar residual oil depends on whether the columnar oil can be fragmented to form flow pathways. Its recovery efficiency ranges from moderate to high under suitable displacement conditions, such as increased pressure gradients or enhanced capillary forces.
Figure 6 shows the spatial distribution of residual oil in various pore structures under displacement stabilization. The red lines represent dominant channels, denoting the primary water–flood channels. The green areas signify the distribution of residual oil. Overall, the continuous distribution of residual oil is fragmented by the water phase. Both models demonstrate the coexistence of different types of residual oil, such as porous, corner, membranous, and droplet residual oil. The models show that microscopic residual oil is widely dispersed but exhibits relatively localized distribution characteristics. The residual oil distribution and dominant channel flow paths reveal that porous and corner residual oil predominantly occupy regions with local pore structures unaffected by water flooding. Conversely, membranous, droplet, and columnar residual oil are primarily distributed within areas impacted by water flooding. Hence, the non-dominant flow areas are the primary targets for residual oil recovery.

4.2. Influence of Rock Wettability on Residual Oil Distribution

Wettability refers to the ability of a fluid to spread over or adhere to the surface of a rock in the presence of two immiscible fluids. Typically, the wettability of a rock is stable, but specific extraction methods (e.g., the introduction of wetting agents) and ongoing oil and gas extraction activities can alter rock wettability, consequently impacting the eventual recovery rate [34,35]. To investigate the effect of rock wettability transition, the residual oil distribution under different wettability conditions is studied by altering the wetting angle of the model. Previous studies show that the wetting angles of rocks range from 0° to 180° [36,37,38]. Furthermore, accurate measurement of the wetting angle in real production is challenging due to its complexity and variability throughout the production process. To simulate the distribution of residual oil in actual engineering scenarios, the residual oil distribution under varying wettability conditions is examined by establishing six specific groups of wetting angles.
Water-wet conditions signify that the rock surface exhibits a greater inclination towards water over oil, while oil-wet conditions indicate a higher preference of the rock surface for oil. Figure 7 illustrates the spatial distribution of oil–water phase wetting angles of 45°, 60°, and 75°, with a constant displacement velocity of 25 μm·s−1. Figure 7 clearly shows that as the wetting angle decreases, the mobility of various types of residual oil increases, and the water flooding range expands. The green squares in Figure 7 represent the distribution of residual oil at various wetting angles. At a wetting angle of 45°, residual oil primarily distributes in deep pore throats and blind ends of pores. Most of the oil phase within micropores is displaced by water, leading to a significant reduction in overall residual oil distribution. This phenomenon is attributed to water adsorption on the hydrophilic rock surface in the direction of displacement, eliminating capillary forces as a barrier for water phase penetration into pores and throats. Consequently, the water phase can more easily access previously unaffected areas to displace the residual oil and enhance displacement efficiency. The green areas in the figure indicate that greater hydrophilicity under similar conditions is more likely to generate new flow channels. Therefore, decreasing the wetting angle of the water phase is an effective approach to enhance the recovery rate of residual oil.
According to the Young–Dupre Equation (8), with the wetting angle smaller between the water phase and the pore wall, the smaller the corresponding adhesive work, and the weaker the adsorption capacity of the pore wall to the water phase under water-wet conditions. This results in the smaller resistance to water phase flow and an increasing capillary force as the flooding force for oil displacement. The injected water (in film form) displaces the oil along the pore wall, resulting in improved recovery rate [39].
W m = σ O W 1 cos θ
where W m is the work of adhesion, N·m−1. σ O W is the interfacial tension, N·m−1. θ is the wetting angle of the aqueous phase.
Figure 8 illustrates the spatial distribution of the oil–water phase under a constant displacement velocity (25 μm·s−1) for wetting angles of 105°, 120°, and 135°. The Figure 8 shows that transitioning the pore wall from hydrophilic to lipophilic enhances the wall’s affinity for the oil phase. In regions with larger pore areas, the water phase can only access a small portion of the oil phase, leaving substantial blocks of residual oil in less affected areas (green squares). As the wetting angle increases, the water displacement range diminishes, leading to reduced displacement efficiency. A comparison between wetting angles of 105° and 135° in the M1 model reveals the challenge of establishing new seepage channels at 135°. In contrast, at a wetting angle of 105°, the water displacement forms a broader mainstream channel in the large pore throats and fractures in the M2 model. However, when the wetting angle increases, the water injection channel narrows, and the oil film thickness on the pore wall gradually increases. Eventually, the water phase traverses through the membranous residual oil, causing oil stagnation in the channel.
The phenomena depicted in Figure 8 can be explained by Equation (8), indicating that with a larger wetting angle between the water phase and the pore wall, the adhesion work also increases, thereby enhancing the oil phase’s adsorption capacity on the pore wall. When the external displacement force is weak, the shear force produced by water flooding is insufficient to overcome the adhesion force between the oil phase and the pore wall. Consequently, the water phase is unable to displace the oil film from the pore, leading to a higher probability of the membranous residual oil adhering to the wall.

4.3. Distribution of Residual Oil Under Different Displacement Methods

4.3.1. Distribution Pattern of Residual Oil at Different Displacement Rates

Three displacement velocities (V1 = 25 μm·s−1, V2 = 30 μm·s−1, and V3 = 35 μm·s−1) were employed to study the spatial distribution of oil and water phases at steady state (outlet water > 98%) under different displacement velocities, as shown in Figure 9. After water flooding, a significant amount of residual oil persists in the pore space, not displaced by the water injection (green squares). The residual oil predominantly exists in porous and corner forms, with membranous residual oil adhering to the walls of larger pore throats (M2 model).
In the M1 model, as the displacement velocity increases, a small portion of the porous residual oil in the middle region is displaced by water flooding. In the M2 model, at a velocity of V1, oil flow is blocked and residual oil forms at the neck of the middle pore throats. This is due to the sudden change in pore throat size, causing additional resistance (Jamin effect). When the displacement velocity increases to V2, the residual oil in smaller throats is extracted, forming new flow channels. The increased injection velocity enhances the displacement force of water flooding, further displacing the residual oil in the smaller radius areas of the pore throats.
Overall, increasing the displacement velocity does not significantly change the main distribution areas of residual oil and dominant flow channels. However, it expands the range of water flooding and improves the mobility of residual oil near the flow channels.
Figure 10 shows that the residual oil recovery rate increases with the injection velocity in the three porous structure models. The higher the velocity, the faster the oil–water two-phase system reaches phase equilibrium. The entire displacement process can be divided into three phases as follows: in the first phase is the water-free oil recovery period (within 3 s). Before the breakthrough of the water phase, pure oil mainly flows out from the outlet, and the oil recovery rate increases rapidly in a short period. In the second phase is the middle-low water content period. After the breakthrough of the water phase, the produced fluid contains both oil and water. The separation and carrying effect of the water phase becomes the main oil displacement mechanism. More dispersed residual oil with smaller volume is extracted, and although the recovery rate of the residual oil improves, the rate of increase slows down. In the third phase is the stable displacement stage. In this phase, the water phase usually floods along the established dominant channels and has difficulty entering the high-permeability pore throats. The residual oil is difficult to displace, and the system reaches dynamic equilibrium. However, based on the resolution limit of the Micro-CT scanner (2.0 μm) and the accuracy of image segmentation, the estimated allowable error for residual oil extraction is approximately 3–5%. This error range reflects the potential uncertainty in distinguishing between the residual oil phase and pore boundaries.
The final recovery rates corresponding to displacement velocities of V2 and V3 are 72.15% and 73.56%, respectively, which are increases of 6.15% and 8.22% compared to V1. The displacement phenomena in Figure 6 and Figure 7 can be explained from the perspective of the capillary number (i.e., the ratio of viscous force to capillary force). Specifically, high displacement velocity leads to a larger capillary number, resulting in a smaller residual oil distribution and an improved ultimate recovery rate.

4.3.2. Distribution Pattern of Residual Oil at Different Displacement Directions

Based on the simulation analysis in Section 4.3.1, enhancing the utilization of various residual oil types and improving recovery rates are limited by simply increasing the displacement rate. In the actual development process of an oilfield, hydrodynamic control measures such as well pattern exchange and diversion lines between strata are often carried out after the reservoir enters the ultra-high-water stage. To verify the effectiveness of these measures at the micro scale, the M1 pore model serves as an example. By altering the displacement direction to 90°, 180°, and 270° subsequent to the onset of exceedingly high water content (outlet water > 95%), the impact of different displacement orientations on residual oil distribution and recovery rates is examined.
Figure 11 illustrates the distribution of residual oil following a change in displacement direction during the extra-high-water phase. Blue represents the water phase, red represents the oil phase, and other colors indicate the interface between the oil and water phases. Figure 11c shows that reversing the displacement direction to 180° in the ultra-high-water phase causes the lower portion of the model to undergo residual oil displacement, leading to the dispersion of the residual oil. However, in comparison to Figure 11a, there is no significant alteration in the localized accumulation of residual oil. Conversely, employing 90° and 270° lateral displacement alters the primary channel, displacing a portion of the continuous residual oil within the new flow channel. This results in an overall trend of dispersion and reduction in residual oil distribution. This observation indicates that transitioning to lateral displacement during the extra-high-water phase extends its influence, effectively modifying the location and composition of residual oil distribution in previously unaffected areas and enhancing mobilization effects.
Figure 12 shows the fluid flow diagrams within the pore space of the M1 model under different displacement directions. It can be seen from Figure 11a that when the displacement direction changes to 180°, there is no fundamental change in the distribution of fluid velocity and dominant flow channels. Injected water flows out along the original dominant flow channels with lower resistance, causing ineffective water circulation. However, Figure 11b,c demonstrate that when the displacement direction changes to 90° and 270°, the original dynamic equilibrium of the flow field is disrupted. The direction and quantity of fluid velocity and dominant flow channels change, effectively displacing the residual oil located in the new flow channels.
Figure 13 shows the curve illustrating the change in the recovery rate of residual oil under different displacement directions. The initial 6 s represent the vertical displacement before altering the direction. At the 6 s mark, the displacement direction shifts during the ultra-high-water stage. Figure 13 indicates that after the direction change, the distribution of residual oil decreases to varying extents. The recovery rate curve for lateral displacement shows an incremental increase. This phenomenon occurs due to the disruption of the original residual oil distribution, enhancing the effective contact areas between oil and water. The residual oil, previously separated by the water phase, undergoes gradual displacement in a discontinuous phase.
A variance analysis and significance test were performed on the final recovery rates for different displacement directions (90°, 180°, and 270°) compared to the vertical displacement recovery rate. The results show that, compared to vertical displacement, the recovery rate increase in the 90° and 270° waterflood directions is statistically significant (p < 0.05), while the improvement in the 180° direction, although noticeable, is not significant (p > 0.05). The primary reason for these differences is the redistribution and disturbance of fluid flow paths, which disrupt the dominant flow channels formed by the waterflood, thereby effectively increasing the oil–water contact area in low-permeability regions and “dead zones”. The effect is most pronounced in the 90° and 270° directions, while the 180° direction, being closer to the original flow path, results in limited improvement.
The final recovery rates corresponding to displacement directions of 90°, 180°, and 270° are 82.79%, 70.55%, and 77.43%, respectively. These values surpass the final recovery rate of vertical displacement by 22.12%, 4.07%, and 14.22%, respectively. Therefore, making reasonable adjustments to the displacement direction after entering the ultra-high-water stage of a porous medium can effectively improve the recovery rate of residual oil.

5. Discussion

This study built a three-dimensional pore structure model to analyze in detail the micro distribution of residual oil and recovery comparison in tight reservoirs under different displacement conditions. Notably, our results emphasize the subtle effects of displacement methods and wettability on residual oil distribution. The final recovery rates observed in the simulations were 67.97%, 72.15%, and 73.56% at displacement rates of 25 μm·s−1, 30 μm·s−1, and 35 μm·s−1, respectively. The impunity indicated that the residual oil recovery rate showed some degree of increase with the increase in the rate of displacement. The specific reason is that by increasing the replacement rate, the main distribution area of the remaining oil and the dominant seepage channel do not change significantly, but the water drive coverage is enlarged, and the mobility of the remaining oil near the seepage channel is improved. At a displacement angle less than 90°, the mobility of all types of residual oil increases as the wetting angle decreases, and the scope of water drive becomes wider. The smaller the wetting angle between the water phase and the pore wall, the smaller the corresponding adhesion work, the weaker the adsorption capacity of the water phase on the pore wall, the smaller the resistance of the water phase flow, the capillary force as the driving force of the oil drive becomes increasingly larger, and the injected water flows along the pore wall to form a water film and strips off oil to form an oil droplet, and the extent of the recovery is increased. When the driving angle is more than 90°, with the increase in wetting angle, the water-driven channel of the remaining oil becomes narrower and narrower, and the thickness of the oil film adhering to the pore wall increases gradually, and eventually the water phase passes through the middle of the film remaining oil, and a large amount of film remaining oil will be retained in the channel.
Guo et al. [20] conducted pore-scale experiments to investigate the morphology and distribution of residual oil under different wettability conditions. Iglauer et al. [21] compared the size and shape of residual oil clusters in water-wet and oil-wet sandstone, demonstrating a significant impact on recovery efficiency. Jiang et al. [10] employed advanced visualization techniques to examine the micro-scale behavior of residual oil in fractured, low-permeability reservoirs. In comparison with these studies, the present research incorporates the coupling of free flow and seepage conditions, providing a more detailed distribution of residual oil and recovery rates that are better aligned with practical.
Although the simulations are highly controllable, they cannot fully replicate the field conditions of a tight reservoir. The models are still simplifications of the actual geological complexity. In addition, our study focuses primarily on two types of pore structures (M1 and M2), which may limit the generalization of our results to other types of tight reservoirs. There are several other factors outside the scope of this study that may affect the distribution of residual oil. For example, the changes in temperature and pressure can significantly affect the viscosity and density of both oil and injected fluids. Higher temperatures generally reduce oil viscosity, facilitating its movement through the reservoir. Conversely, pressure fluctuations can alter the phase behavior of hydrocarbons, impacting their flow characteristics.
Looking forward, future studies of residual oil distribution should integrate multi-field simulations to account for geomechanical, thermodynamic, and chemical interactions within the reservoir. More field studies are needed to validate and refine models developed in the laboratory. Advancing imaging techniques to capture the three-dimensional distribution of residual oil in actual reservoirs is another critical step forward. In addition, exploring novel oil recovery techniques (e.g., using nanoparticles or injecting carbon dioxide) could provide new avenues to enhance oil recovery in tight reservoirs.

6. Conclusions

(1)
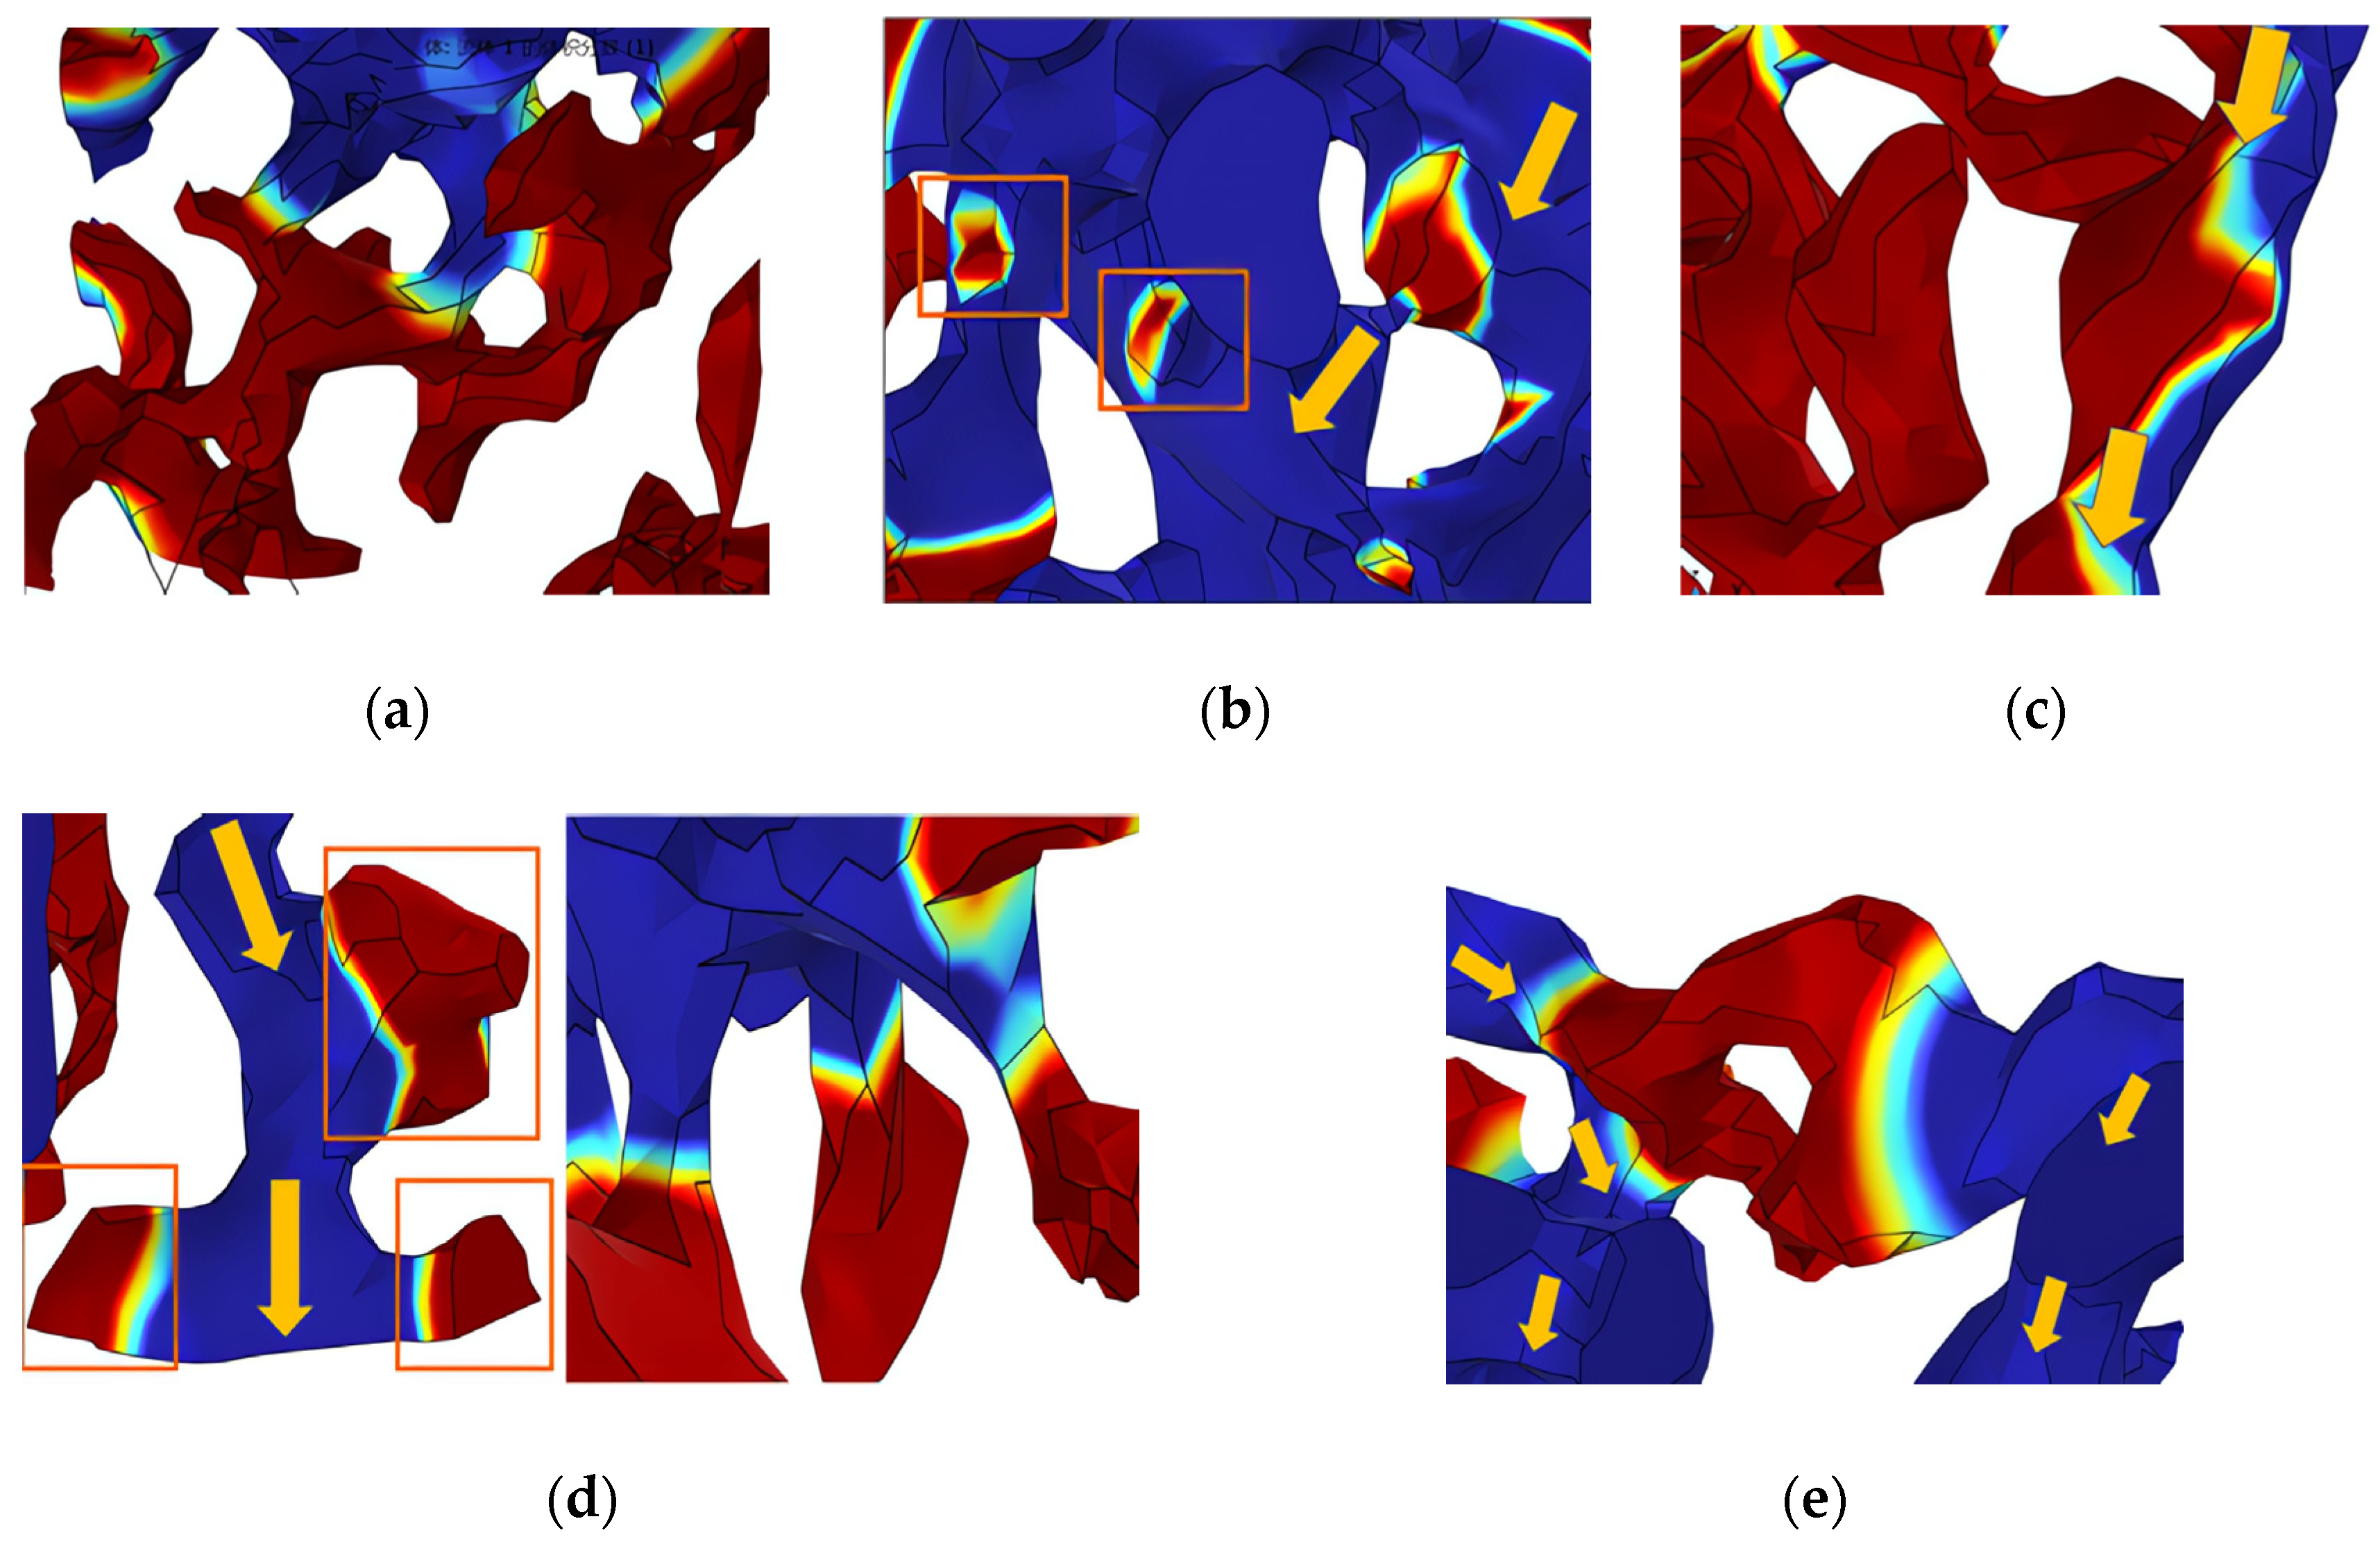
The micro residual oil after water flooding was divided into five discontinuous phases: porous (sheet-like), membranous, corner, droplet, and columnar phases. The content was mainly composed of porous and membranous micro residual oil. The residual oil exhibited characteristics of overall high dispersion but local relative distribution.
(2)
Under water-wet conditions, water can easily strip the oil phase along the pore wall, resulting in a significant reduction in the distribution of residual oil. Under oil-wet conditions, the adsorption capacity of the pore wall for the oil phase was enhanced. There was a large amount of porous and membranous residual oil within the pore, resulting in a decreased recovery rate.
(3)
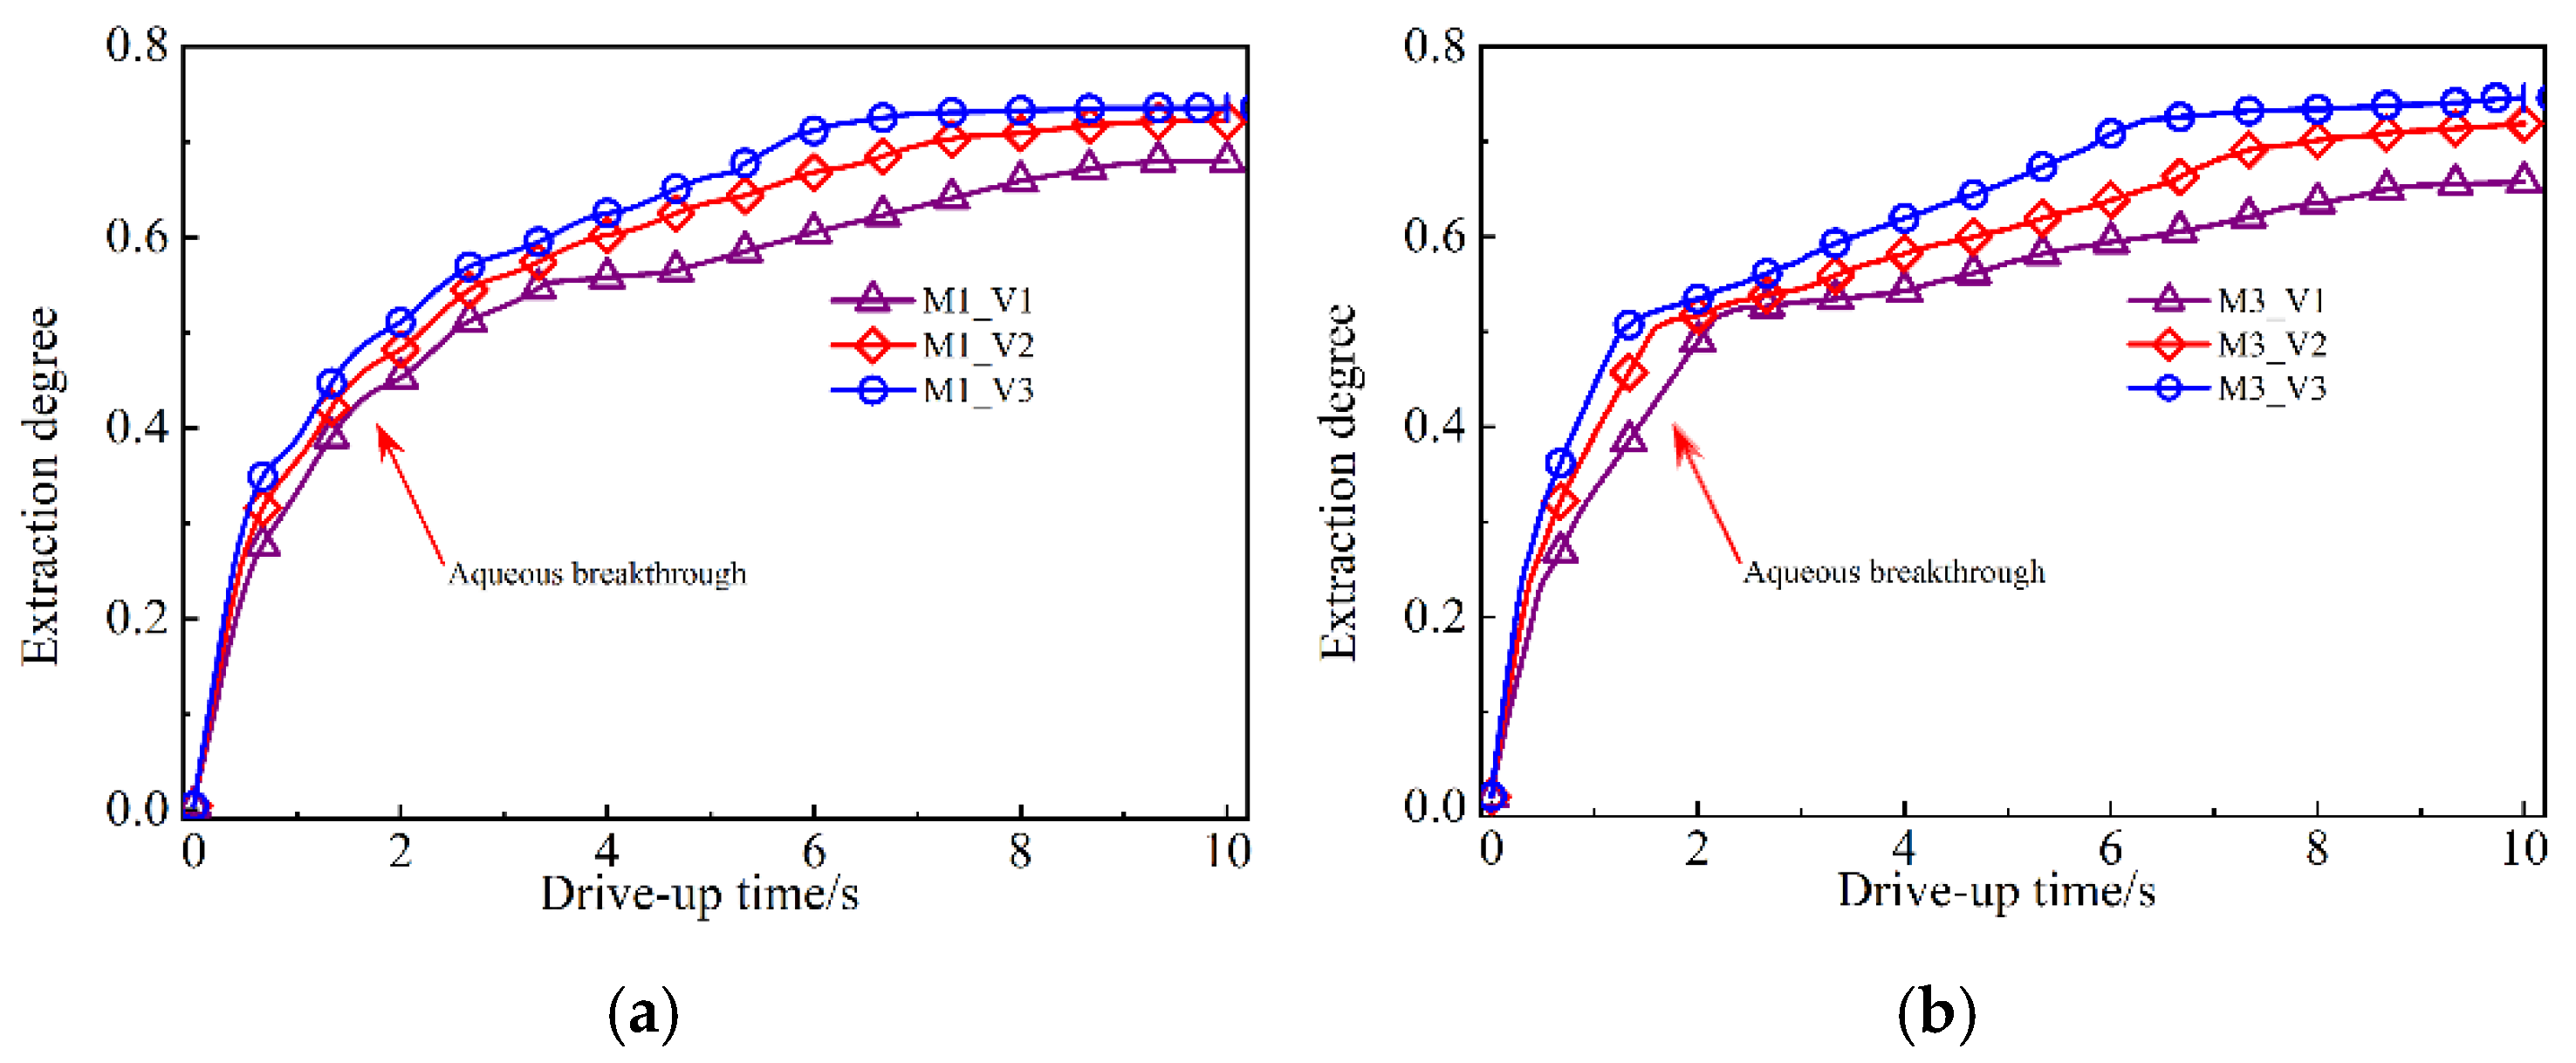
Increasing the displacement speed expands the range of water flooding and improves the mobility of residual oil near the dominant flow channels. However, there is no significant change in the main distribution area of residual oil or the dominant flow channels. The final recovery rates are 67.97%, 72.15%, and 73.56% at the displacement velocities of V1, V2, and V3, respectively. Furthermore, there is a limited improvement in the recovery rate by increasing the displacement velocity.
(4)
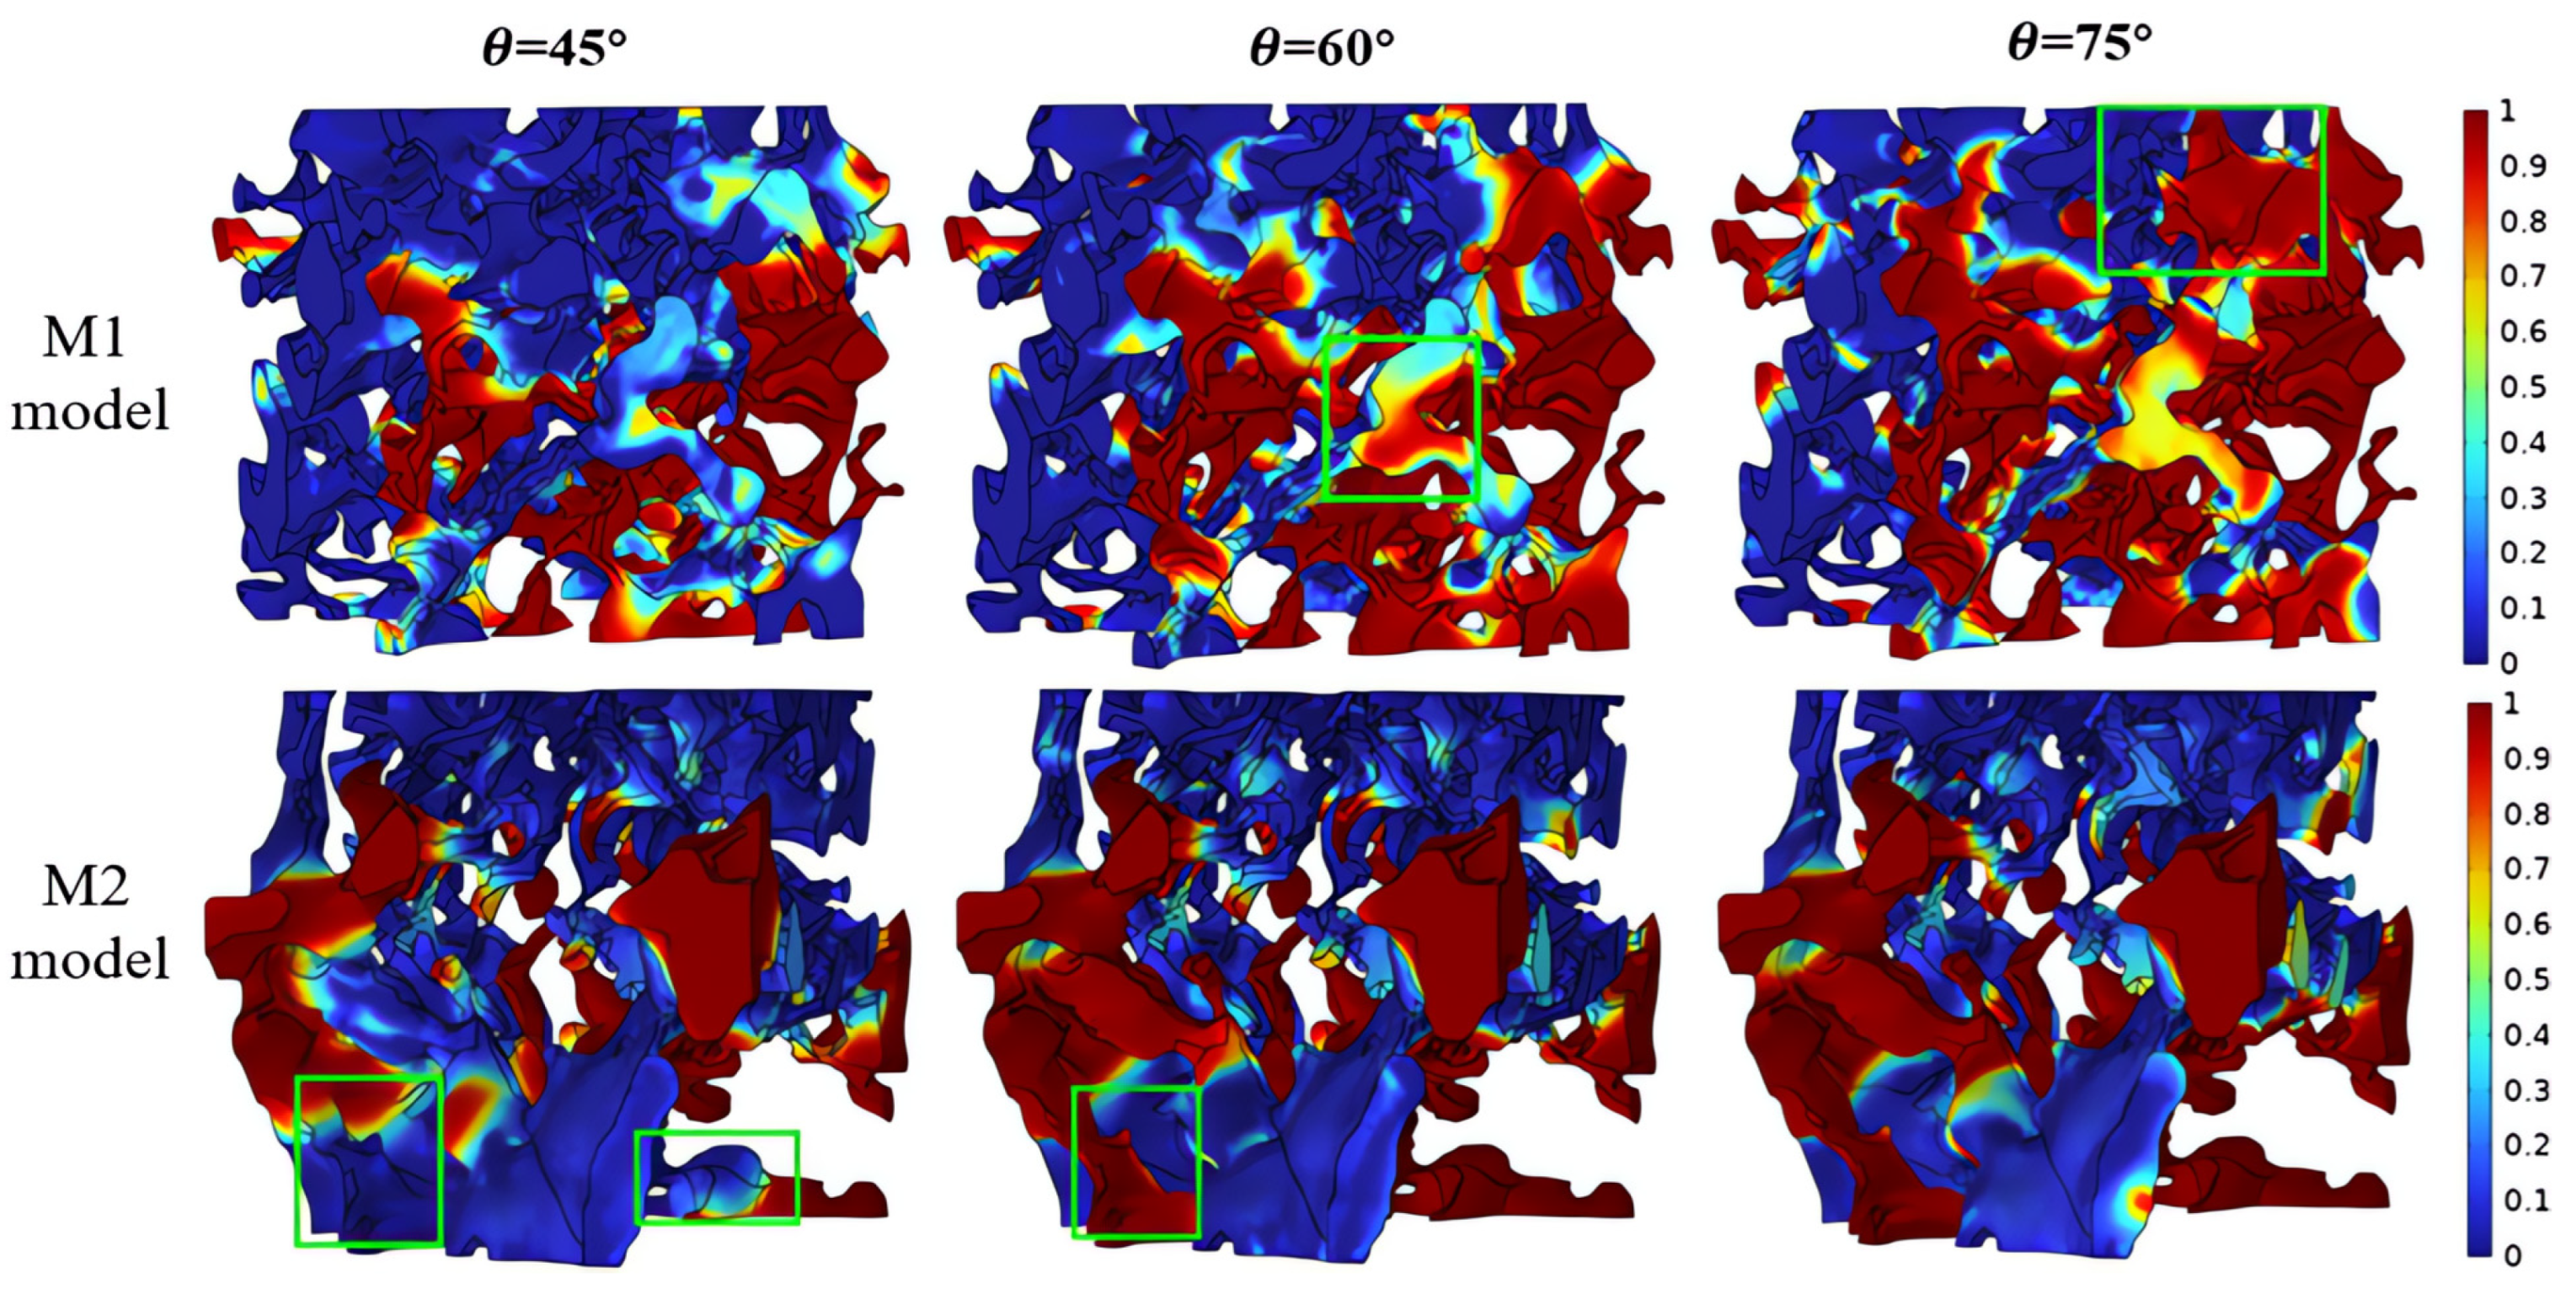
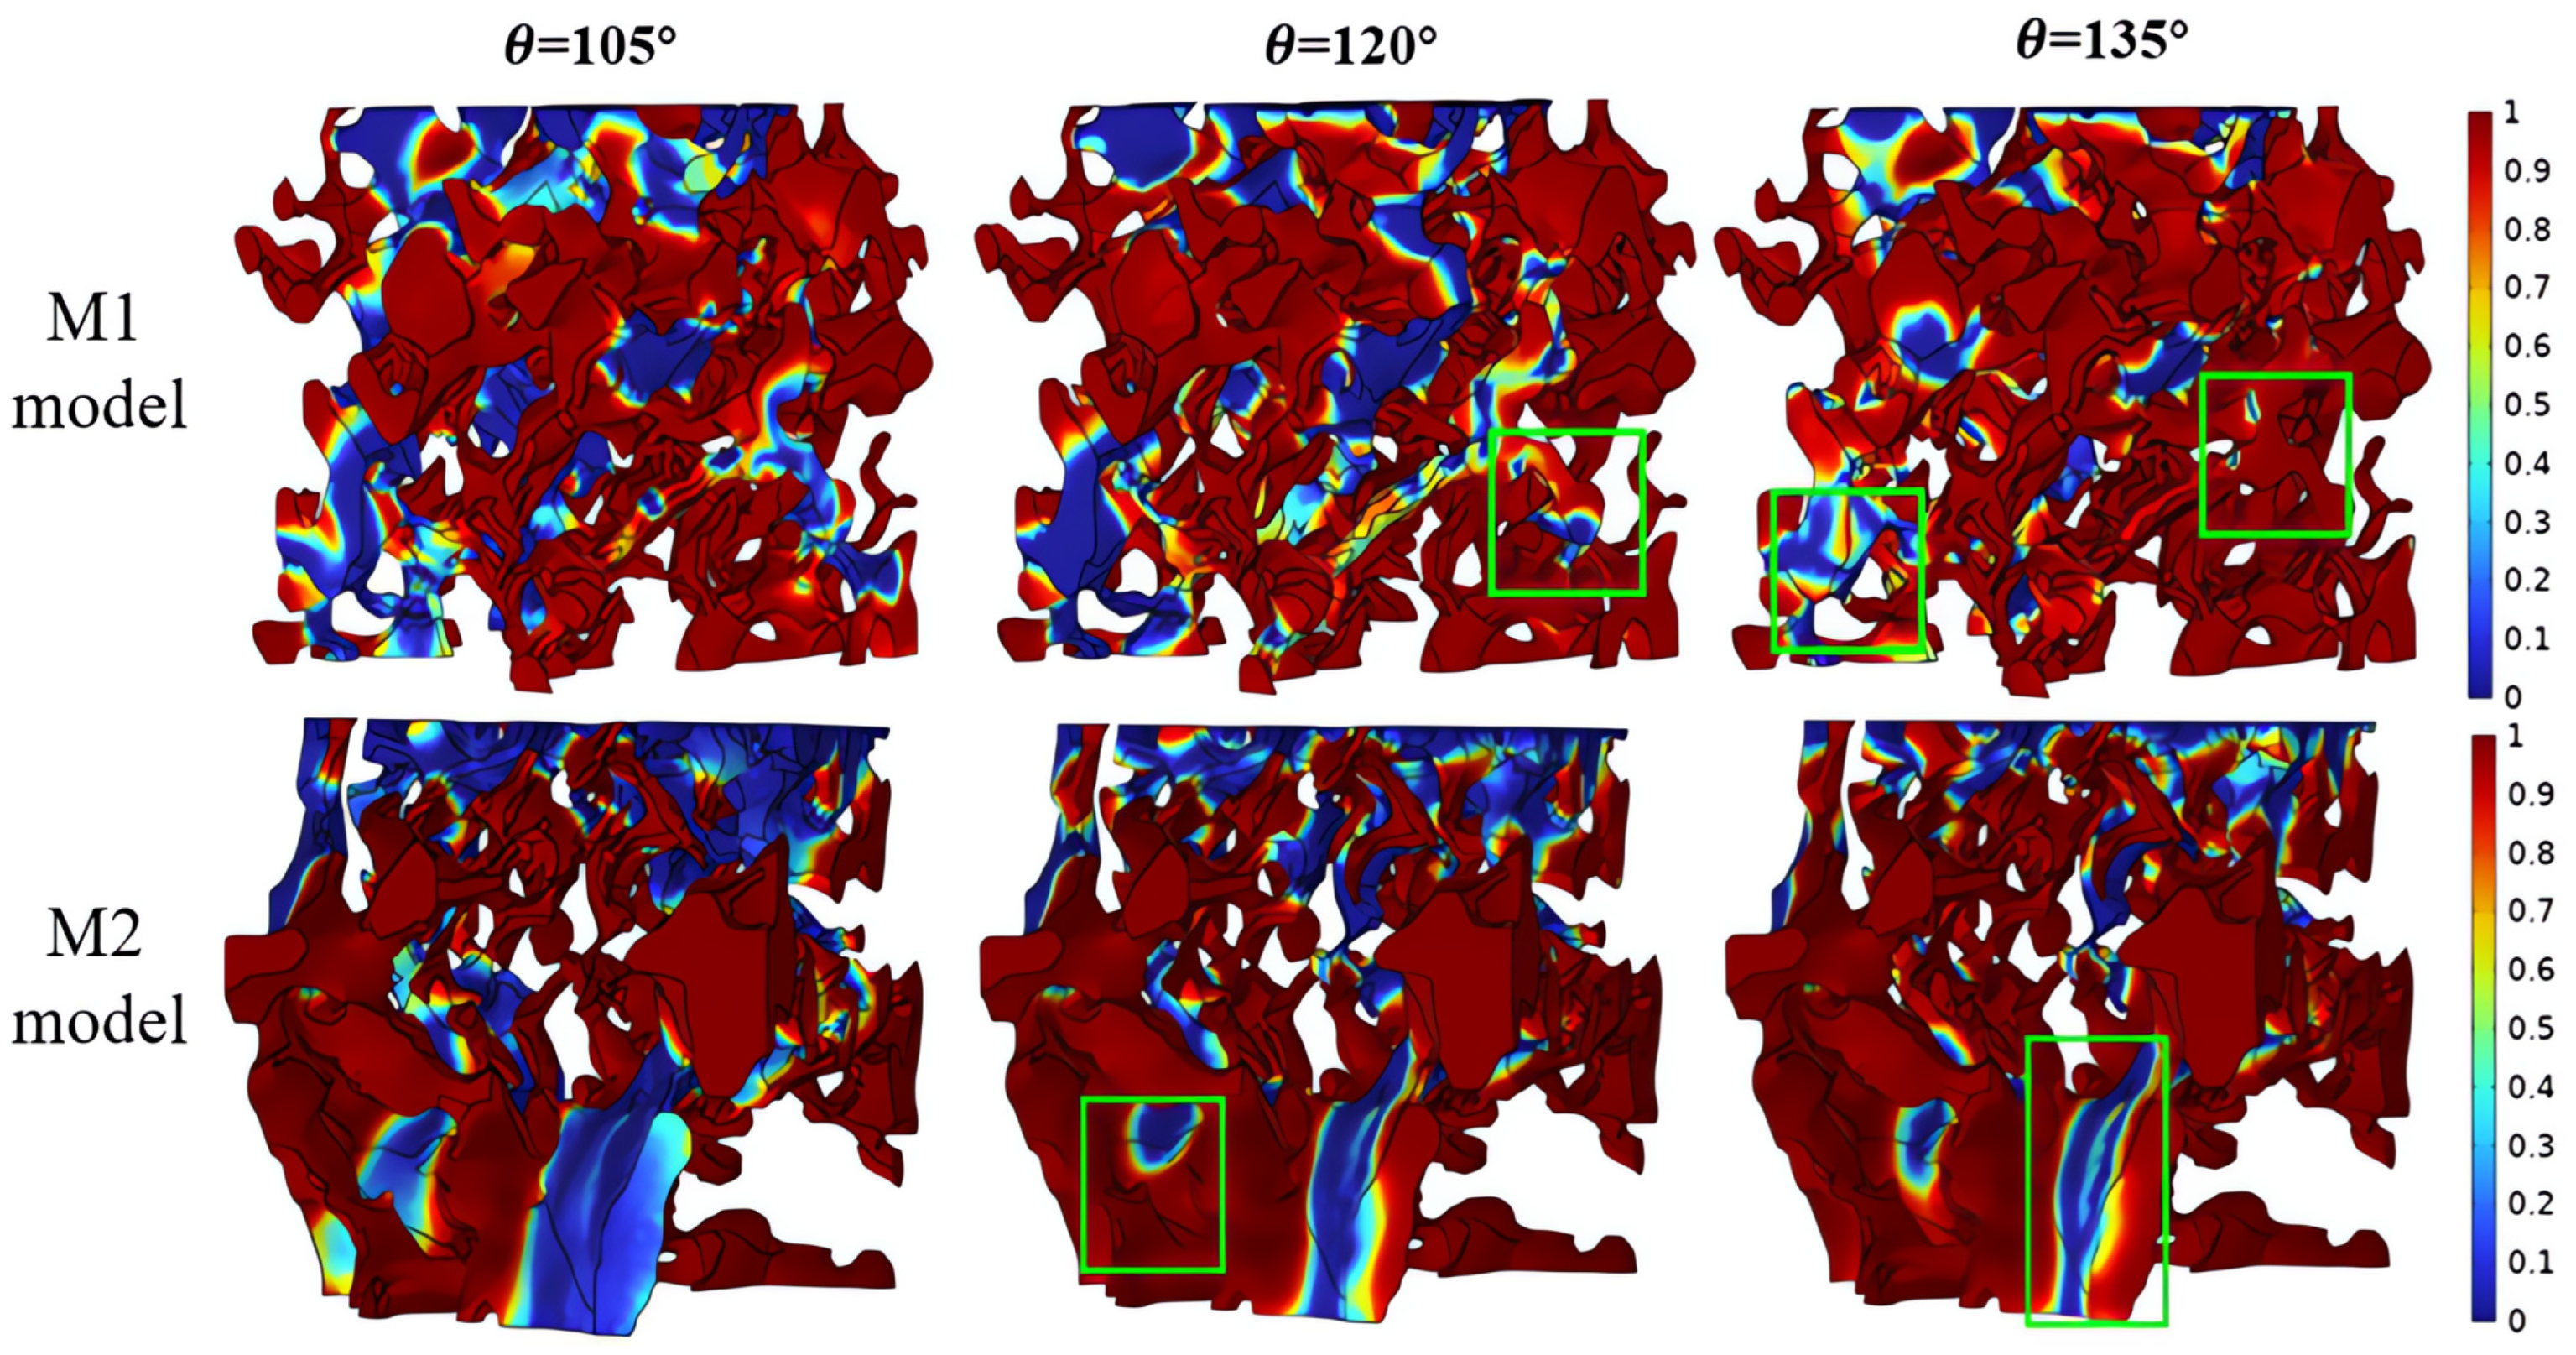
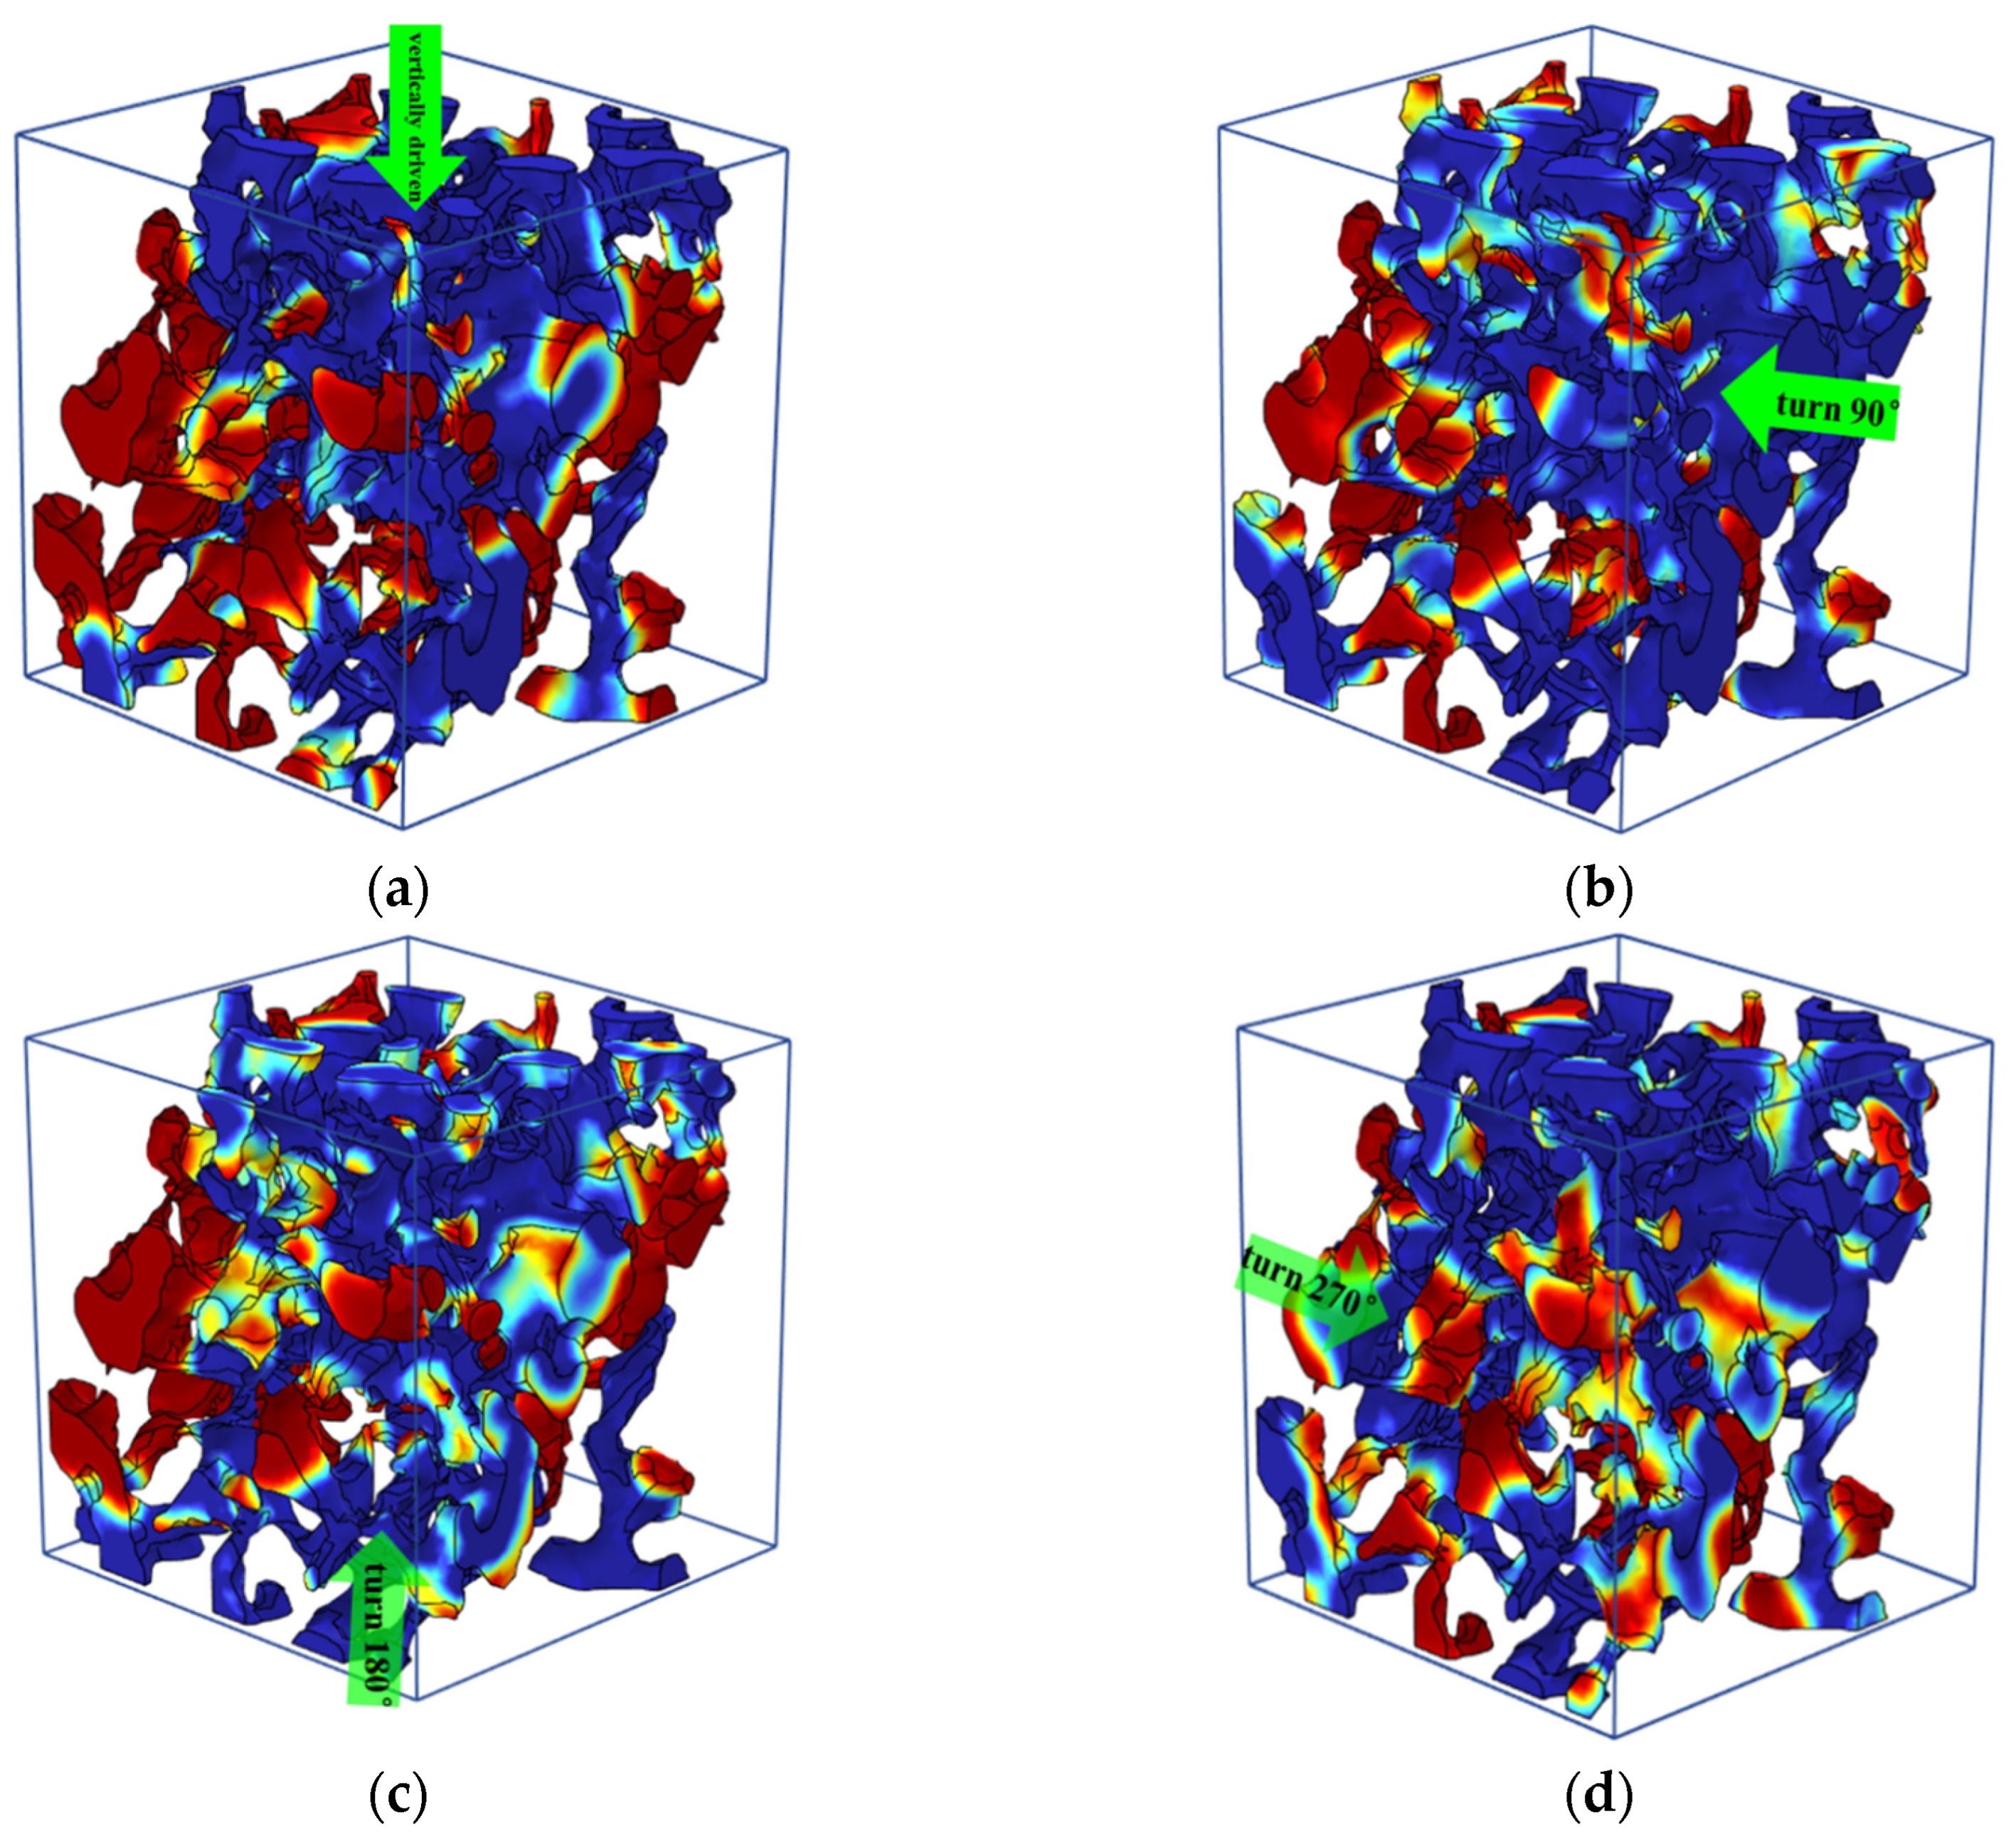
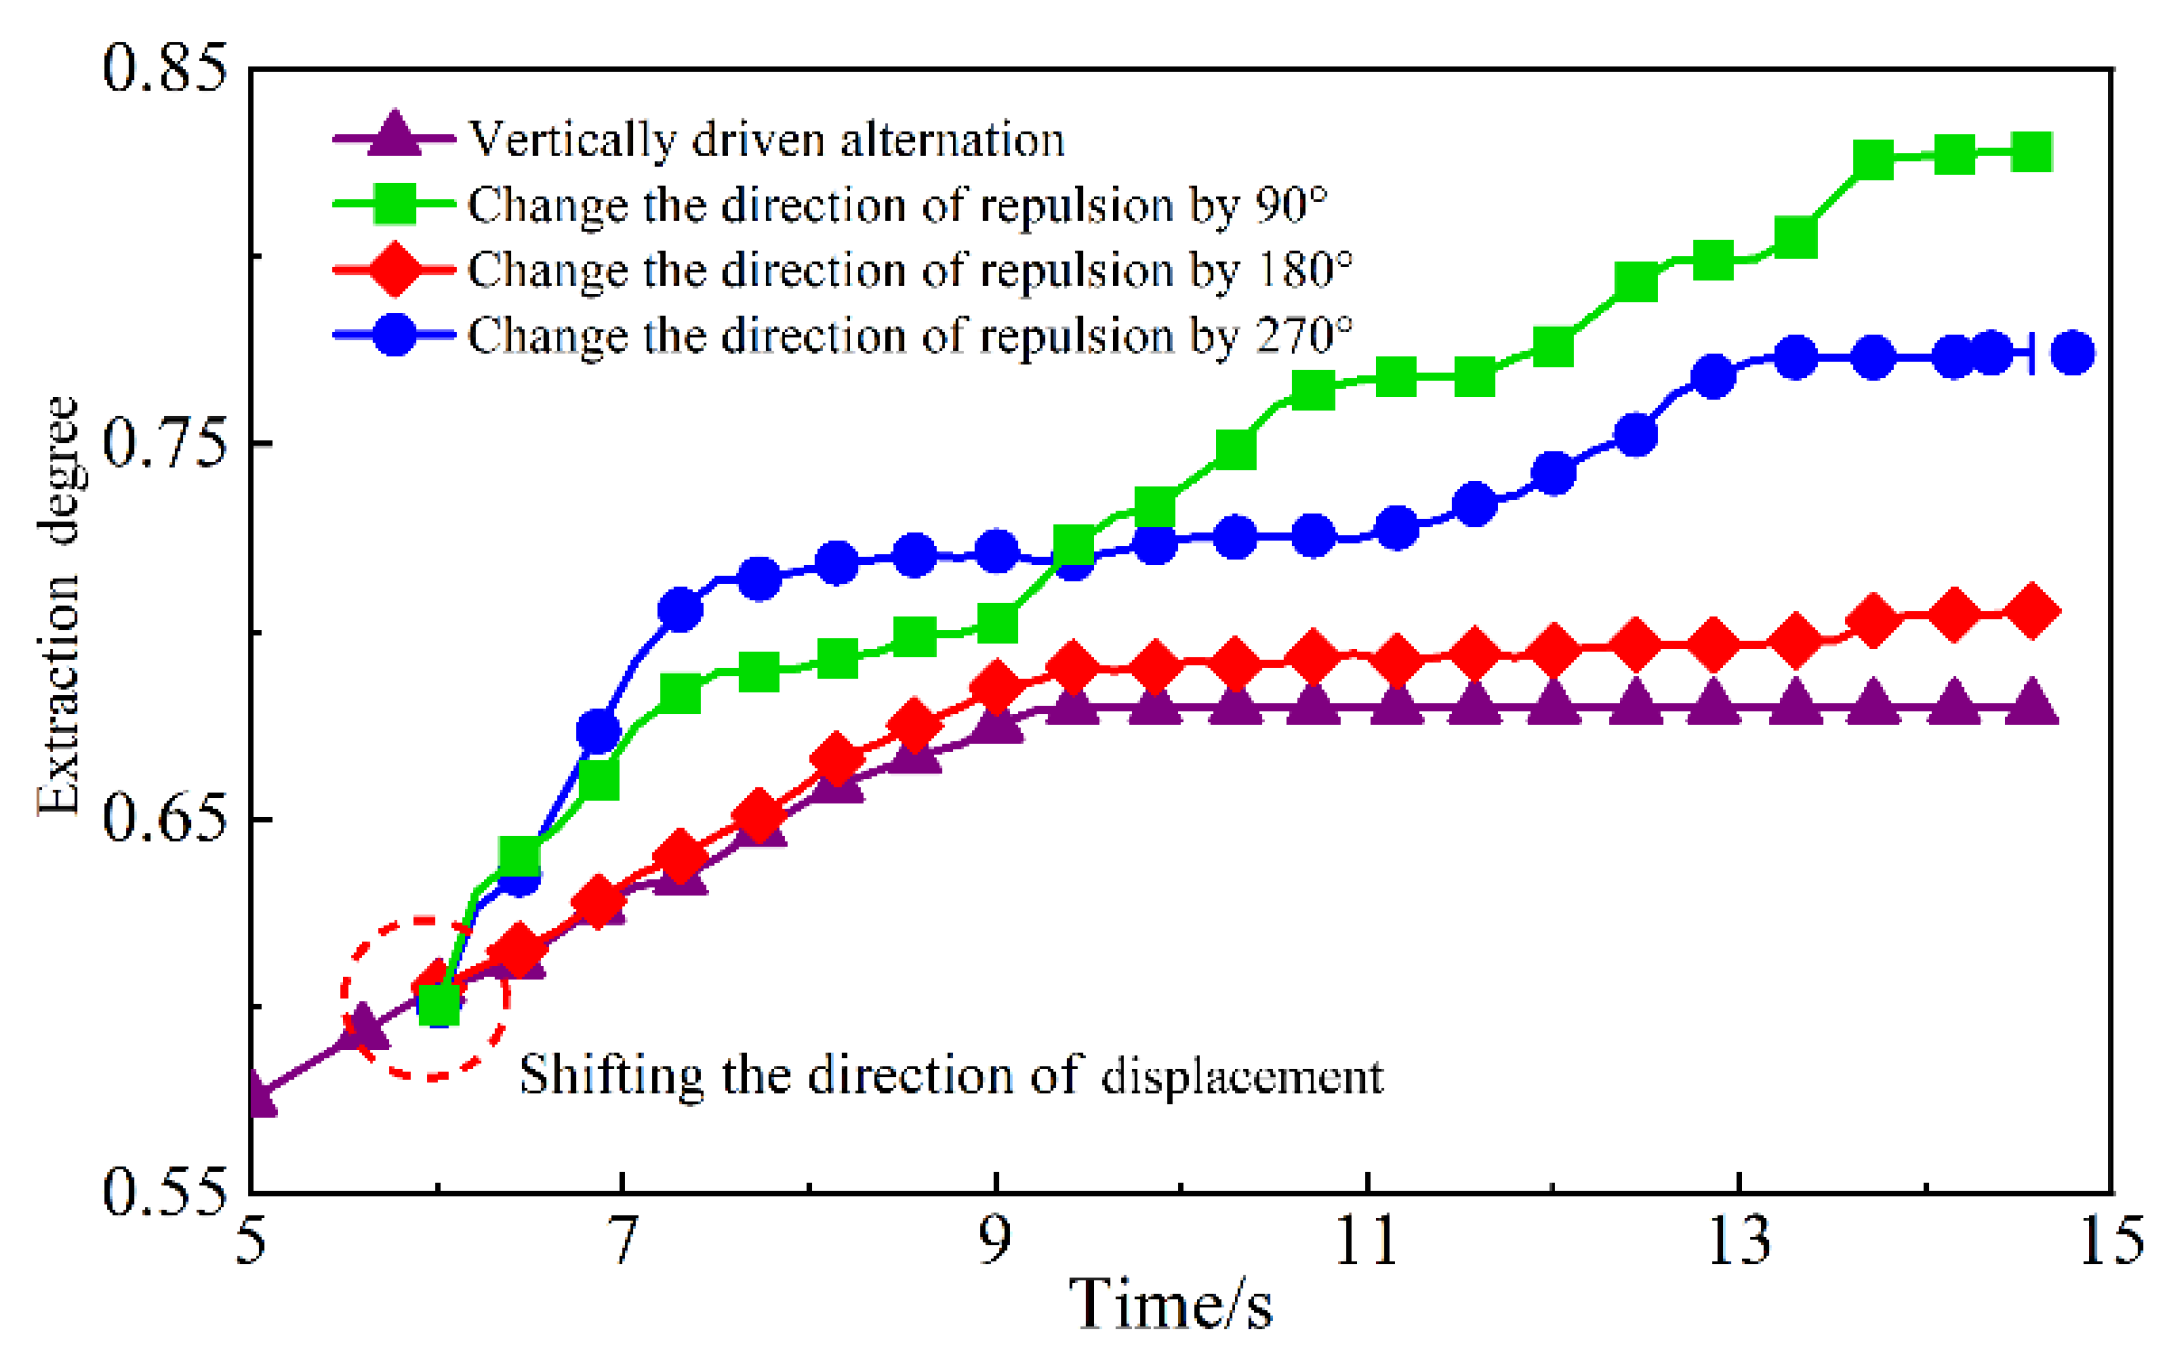
When the displacement direction changed to counter displacement after reaching the high-water stage, there was a certain improvement in the recovery degree. However, due to no fundamental changes in the dominant channels, injected water still flowed out along the original dominant channels with lower resistance, resulting in ineffective water circulation. On the other hand, lateral displacement during the high-water stage can effectively change the distribution position and type of residual oil, resulting in a better recovery rate. The final recovery rates for displacement directions are 90°, 180°, and 270° are 82.79%, 70.55%, and 77.43%, respectively, which are increases of 22.12%, 4.07%, and 14.22% compared to the vertical displacement.

Author Contributions

Conceptualization, R.W. and J.L.; methodology, X.M.; software, Z.C.; validation, Z.C. and C.Y.; formal analysis, C.S. and Y.Z.; investigation, C.S.; resources, R.W. and Y.Z.; data curation, J.L.; writing—original draft preparation, R.W.; writing—review and editing, C.Y.; visualization, X.M.; supervision, Z.C.; project administration, R.W.; funding acquisition, J.L. All authors have read and agreed to the published version of the manuscript.

Funding

This work was financially supported by the National Natural Science Foundation of China (No. 42272153 and 42472195), the Research Fund of PetroChina Tarim Oilfield Company (No. 671023060003), and the Research Fund of China National Petroleum Corporation Limited (No. 2023ZZ16YJ04).

Data Availability Statement

The data supporting the conclusions of this study can be obtained from the corresponding authors.

Conflicts of Interest

Authors Rujun Wang, Yintao Zhang and Chong Sun were employed by PetroChina Tarim Oilfield Company and R&D Center for Ultra-Deep Complex Reservoir Exploration and Development, China National Petroleum Corporation. Authors Jing Li, Xiaoyu Meng, Chengqiang Yang and Zhaoyang Chen were employed by State Key Laboratory of Deep Oil and Gas, China University of Petroleum (East China). The PetroChina Tarim Oilfield Company and China National Petroleum Corporation had no role in the design of the study; in the collection, analyses, or interpretation of data; in the writing of the manuscript, or in the decision to publish the results.

References

  1. Li, P.; Ou, Y.; Chen, H.; Li, Q.; Zhao, L.; Yan, J. Pore throat distributions and movable fluid occurrences in different diagenetic facies of tight sandstone reservoirs in the Triassic Chang 6 reservoirs, Wuqi Area, Ordos Basin, China. J. Pet. Explor. Prod. Technol. 2024, 14, 1783–1797. [Google Scholar] [CrossRef]
  2. Mohammed, S.; Anumah, P.; Sarkodie-kyeremeh, J.; Acheaw, E. A production-based model for a fractured well in unconventional reservoirs. J. Pet. Sci. Eng. 2021, 201, 109036. [Google Scholar] [CrossRef]
  3. Xie, Y.T.; Li, J.; Liu, H.; Zhang, K.; Li, J.; Liu, C.; Zhu, R. Study on hydro-mechanical-damage coupling seepage in digital shale cores: A case study of shale in Bohai Bay Basin. Energy 2023, 268, 123759. [Google Scholar] [CrossRef]
  4. Aguilera, R. Flow units: From conventional to tight-gas to shale-gas to tight-oil to shale-oil reservoirs. SPE Reserv. Eval. Eng. 2014, 17, 190–208. [Google Scholar] [CrossRef]
  5. Li, J.; Yang, L.; Gao, B.; Cheng, B.; Meng, F.; Xu, H. Effects of microscopic pore structure heterogeneity on the distribution and morphology of remaining oil. Pet. Explor. Dev. 2018, 45, 1112–1122. [Google Scholar] [CrossRef]
  6. Mustafa, A.; Mahmoud, M.; Abdulraheem, A. A review of pore structure characterization of unconventional tight reservoirs. In Proceedings of the Abu Dhabi International Petroleum Exhibition & Conference, Abu Dhabi, United Arab Emirates, 11–14 November 2019. [Google Scholar] [CrossRef]
  7. Wang, J.; Song, L.; Song, K. The reasonable development technology policy in sweet spot of tight gas reservoir. J. Pet. Explor. Prod. Technol. 2018, 8, 1235–1241. [Google Scholar] [CrossRef]
  8. Gao, J.; Wang, X.; Zhang, D.; Wang, J. The Formation Mechanism of Residual Oil and Methods of Enhanced Oil Recovery in a Fractured Low-Permeability Metamorphic Rock Reservoir in Bohai Bay. Processes 2024, 12, 2281. [Google Scholar] [CrossRef]
  9. Lai, J.; Wang, G.; Wang, Z.; Chen, J.; Pang, X.; Wang, S.; Zhou, Z.; He, Z.; Qin, Z.; Fan, X. A review on pore structure characterization in tight sandstones. Earth-Sci. Rev. 2017, 177, 436–457. [Google Scholar] [CrossRef]
  10. Jiang, N.; Zhang, Z.; Qu, G.; Zhi, J.; Zhang, R. Distribution Characteristics of Micro Remaining Oil of Class III Reservoirs after Fracture Flooding in Daqing Oilfield. Energies 2022, 15, 3385. [Google Scholar] [CrossRef]
  11. Yue, M.; Zhu, W.; Han, H.; Song, H.; Long, Y.; Lou, Y. Experimental research on remaining oil distribution and recovery performances after nano-micron polymer particles injection by direct visualization. Fuel 2018, 212, 506–514. [Google Scholar] [CrossRef]
  12. Shi, L.; Jin, Z.; Yan, W.; Zhu, X.; Xu, X.; Peng, B. Influences of overpressure on reservoir compaction and cementation: A case from northwestern subsag, Bozhong sag, Bohai Bay Basin, East China. Pet. Explor. Dev. 2015, 42, 339–347. [Google Scholar] [CrossRef]
  13. Wang, W.-Y.; Pang, X.-Q.; Wang, Y.-P.; Chen, Z.-X.; Jiang, F.-J.; Chen, Y. Quantitative prediction model for the depth limit of oil accumulation in the deep carbonate rocks: A case study of Lower Ordovician in Tazhong area of Tarim Basin. Pet. Sci. 2024, 21, 115–124. [Google Scholar] [CrossRef]
  14. Zhou, R.; Wu, C. 3D reconstruction of digital rock guided by petrophysical parameters with deep learning. Geoenergy Sci. Eng. 2023, 231, 212320. [Google Scholar] [CrossRef]
  15. Wang, E.; Liu, G.; Pang, X.; Wu, Z.; Li, C.; Bai, H.; Zhang, Z. Sedimentology, diagenetic evolution, and sweet spot prediction of tight sandstone reservoirs: A case study of the third member of the Upper Paleogene Shahejie Formation, Nanpu Sag, Bohai Bay Basin, China. J. Pet. Sci. Eng. 2020, 186, 106718. [Google Scholar] [CrossRef]
  16. Teng, Y.; Liu, Y.; Jiang, L.; Song, Y.; Zhao, J.; Zhang, Y.; Wang, D. A visualization study on two-phase gravity drainage in porous media by using magnetic resonance imaging. Magn. Reson. Imaging 2016, 34, 855–863. [Google Scholar] [CrossRef]
  17. Jungreuthmayer, C.; Steppert, P.; Sekot, G.; Zankel, A.; Reingruber, H.; Zanghellini, J.; Jungbauer, A. The 3D pore structure and fluid dynamics simulation of macroporous monoliths: High permeability due to alternating channel width. J. Chromatogr. 2015, 1425, 141–149. [Google Scholar] [CrossRef] [PubMed]
  18. Jia, P.; Guo, H.; Wang, Y.; Peng, C.; Cheng, L.; Ke, X. COMSOL-based investigation of the characteristics of microscopic water flooding and residual oil distribution in carbonate reservoirs. Front. Earth Sci. 2022, 10, 1016941. [Google Scholar] [CrossRef]
  19. Xia, H.; Wang, L.; Han, P.; Cao, R.; Zhang, S.; Sun, X. Microscopic residual oil distribution characteristics and quantitative characterization of producing degree based on core fluorescence analysis technology. Geofluids 2021, 2021, 8827721. [Google Scholar] [CrossRef]
  20. Guo, Y.; Zhang, L.; Zhu, G.; Yao, J.; Sun, H.; Song, W.; Yang, Y.; Zhao, J. A pore-scale investigation of residual oil distributions and enhanced oil recovery methods. Energies 2019, 12, 3732. [Google Scholar] [CrossRef]
  21. Iglauer, S.; Fernø, M.A.; Shearing, P.; Blunt, M.J. Comparison of residual oil cluster size distribution, morphology and saturation in oil-wet and water-wet sandstone. J. Colloid Interface Sci. 2012, 375, 187–192. [Google Scholar] [CrossRef] [PubMed]
  22. Ekechukwu, G.K.; Khishvand, M.; Kuang, W.; Piri, M.; Masalmeh, S. The effect of wettability on waterflood oil recovery in carbonate rock samples: A systematic multi-scale experimental investigation. Transp. Porous Media 2021, 138, 369–400. [Google Scholar] [CrossRef]
  23. Wang, Y.; Sun, S. Multiscale pore structure characterization based on SEM images. Fuel 2021, 289, 119915. [Google Scholar] [CrossRef]
  24. Li, J.; Liu, D.; Yao, Y.; Cai, Y.; Guo, X. Physical characterization of the pore-fracture system in coals, Northeastern China. Energy Explor. Exploit. 2013, 31, 267–285. [Google Scholar] [CrossRef]
  25. Jacqmin, D. Calculation of two-phase Navier–Stokes flows using phase-field modeling. J. Comput. Phys. 1999, 155, 96–127. [Google Scholar] [CrossRef]
  26. Wang, Z.; Dong, S.; Triantafyllou, M.S.; Constantinides, Y.; Karniadakis, G.E. A stabilized phase-field method for two-phase flow at high Reynolds number and large density/viscosity ratio. J. Comput. Phys. 2019, 397, 108832. [Google Scholar] [CrossRef]
  27. Cai, J.; Wei, W.; Hu, X.; Liu, R.; Wang, J. Fractal characterization of dynamic fracture network extension in porous media. Fractals 2017, 25, 1750023. [Google Scholar] [CrossRef]
  28. Badalassi, V.E.; Ceniceros, H.D.; Banerjee, S. Computation of multiphase systems with phase field models. J. Comput. Phys. 2003, 190, 371–397. [Google Scholar] [CrossRef]
  29. Gudala, M.; Govindarajan, S.K. Numerical investigations on two-phase fluid flow in a fractured porous medium fully coupled with geomechanics. J. Pet. Sci. Eng. 2021, 199, 108328. [Google Scholar] [CrossRef]
  30. Zhang, Z.; Nemcik, J.; Ma, S. Micro-and macro-behavior of fluid flow through rock fractures: An experimental study. Hydrogeol. J. 2013, 21, 1717. [Google Scholar] [CrossRef]
  31. Zhou, C.; Yue, P.; Feng, J.; Ollivier-Gooch, C.F.; Hu, H. 3D phase-field simulations of interfacial dynamics in Newtonian and viscoelastic fluids. J. Comput. Phys. 2010, 229, 498–511. [Google Scholar] [CrossRef]
  32. Glowinski, R.; Pironneau, O. Finite element methods for Navier-Stokes equations. J. Pet. Sci. Eng. 1992, 24, 167–204. [Google Scholar] [CrossRef]
  33. Alpak, F.; Samardžić, A.; Frank, F. A distributed parallel direct simulator for pore-scale two-phase flow on digital rock images using a finite difference implementation of the phase-field method. J. Pet. Sci. Eng. 2017, 166, 806–824. [Google Scholar] [CrossRef]
  34. Hirasaki, G.J.; Huang, C.C.; Zhang, G.Q. Interpretation of wettability in sandstones with NMR analysis. Petrophysics-SPWLA J. Form. Eval. Reserv. Descr. 2000, 41, SPWLA-2000-v41n3a1. [Google Scholar]
  35. Roshan, H.; Al-Yaseri, A.Z.; Sarmadivaleh, M.; Iglauer, S. On wettability of shale rocks. J. Colloid Interface Sci. 2016, 475, 104–111. [Google Scholar] [CrossRef] [PubMed]
  36. Hiraga, T.; Nishikawa, O.; Nagase, T.; Akizuki, M. Morphology of intergranular pores and wetting angles in politic schists studied by transmission electron microscopy. Contrib. Mineral. Petrol. 2001, 141, 613–622. [Google Scholar] [CrossRef]
  37. Biberg, D. An explicit approximation for the wetted angle in two-Phase stratified pipe flow. Can. J. Chem. Eng. 2009, 77, 1221–1224. [Google Scholar] [CrossRef]
  38. Kholodov, V.A.; Yaroslavtseva, N.V.; Yashin, M.A.; Frid, A.S.; Lazarev, V.I.; Tyugai, Z.N.; Milanovskiy, E.Y. Contact angles of wetting and water stability of soil structure. Eurasian Soil Sci. 2015, 48, 600–607. [Google Scholar] [CrossRef]
  39. Drummond, C.; Israelachvili, J. Surface forces and wettability. J. Pet. Sci. Eng. 2002, 33, 123–133. [Google Scholar] [CrossRef]
Figure 1. Gray scale image processing: (a) reginal grayscale image; (b) gray scale value optimization; (c) threshold segmentation; (d) median filtering.
Processes 13 00203 g001
Figure 2. Three-Dimensional digital core model composition: (a) complete digital cores; (b) internal structure of rocks; (c) isolated pores and microcracks; (d) connected pores.
Processes 13 00203 g002aProcesses 13 00203 g002b
Figure 3. Finite element modeling of M1 and M2.
Processes 13 00203 g003
Figure 4. Boundary condition of M1.
Processes 13 00203 g004
Figure 5. Microscopic residual oil distribution patterns: (a) porous residual oil; (b) droplets residual oil; (c) membranous residual oil; (d) corner residual oil; (e) columnar residual oil.
Processes 13 00203 g005
Figure 6. Residual oil in M1 (pore) and M2 (pore-crack): (a) M1 model; (b) M2 model.
Processes 13 00203 g006
Figure 7. Oil-water phases saturations at various wetting angles under water-wet conditions.
Processes 13 00203 g007
Figure 8. Oil–water phase saturations at different wetting angles under oil-wet conditions.
Processes 13 00203 g008
Figure 9. Oil–water phase distribution at different displacement velocities.
Processes 13 00203 g009
Figure 10. The degree of residual oil extraction varies with different displacement velocities: (a) M1 model; (b) M2 model.
Processes 13 00203 g010
Figure 11. The distribution of oil–water phases changes with varying displacement directions: (a) vertically displacement alternation; (b) change in direction of displacement by 90° (lateral displacement); (c) change in direction of displacement by 180° (reverse displacement); (d) change in direction of displacement by 270° (lateral displacement).
Processes 13 00203 g011
Figure 12. The fluid flow of M1 model under different displacement directions: (a) reverse displace (180°); (b) lateral displace (90°); (c) lateral displace (270°).
Processes 13 00203 g012
Figure 13. The residual oil extraction degree with different water displacement directions.
Processes 13 00203 g013
Disclaimer/Publisher’s Note: The statements, opinions and data contained in all publications are solely those of the individual author(s) and contributor(s) and not of MDPI and/or the editor(s). MDPI and/or the editor(s) disclaim responsibility for any injury to people or property resulting from any ideas, methods, instructions or products referred to in the content.

