Abstract
Production management serves as a pivotal component in the operational activities of oilfield sites, with the effectiveness of management practices directly influencing the success of developmental outcomes. To enhance the maintenance-free operational period of oil production systems, elevate management standards, and reduce overall operational costs, advanced technologies such as artificial intelligence (AI) and big data analytics have been strategically integrated into oilfield operations. These technologies are able to incorporate data resources from all stages of oilfield production, thus providing a comprehensive view of oilfield production and guidance for production. This study uses a series of diagnostic and predictive methods to construct a management system that allows for the comprehensive monitoring and fault diagnosis of oil production systems, which can ensure the intelligent management of oil production systems at multiple levels throughout their life cycle. Automated monitoring workflows and proactive analytical processes are at the heart of the framework, enabling real-time monitoring and predictive decision-making. This not only minimizes the likelihood of system failure but also optimizes resource allocation and operational efficiency.
1. Introduction
The operational management of oilfield production plays a critical role in ensuring the sustainable development of oilfields. To enhance the efficiency and effectiveness of production management, it is imperative to fully utilize the data resources generated by oil production systems [1]. This involves not only extracting valuable insights from the data but also accurately assessing the operational status of the production systems. The timely detection of anomalies in the system’s operational conditions is essential to mitigating potential risks and ensuring uninterrupted functionality. Furthermore, the implementation of effective optimization measures based on data-driven analysis is critical for improving system performance and achieving long-term operational stability. In order to achieve the timely diagnosis and optimization of oil production systems, many scholars put forward and studied many methods. These methods can be roughly categorized into two types, mechanism-driven and data-driven.
In a mechanism-driven method, Powers et al. [2] investigated the mechanical principles of electric submersible pump (ESP) failures, with particular emphasis on rotor failure and its impact on overall system performance. By conducting a detailed analysis of the rotor’s operating environment and failure modes, their paper provides theoretical support for ESP maintenance and fault prevention. Joseph et al. [3] found that physical properties of the fluid, such as gas–oil ratio (GOR) and density, significantly affects the efficiency of ESPs. The study discusses how different fluid properties influence ESP performance by altering suction pressure and pump speed through experimental data analysis. Rodrigues et al. [4] explored the use of vibration signals to diagnose faults in ESPs, employing frequency spectrum analysis to evaluate wear states and operational conditions, thus advancing diagnostic methods for mechanical systems. Wen et al. [5] proposed a model-driven approach to integrate multi-source fault features, enhancing the diagnostic accuracy and reliability of submersible screw pump systems under complex operational conditions. Adukwu et al. [6] provided an automatic control scheme to optimize the performance and stability of gas lift systems through experimental and theoretical analyses of stable gas lift wells. The research emphasizes the importance of system state estimation for achieving automatic control and stabilization of gas lift wells. Gilbertson et al. [7] developed a hydrodynamic model to analyze the failure modes and sensitivities of gas lift systems, including reservoir characteristics, two-phase flow in the tubing, and the geometry of gas lift valves. Through sensitivity analysis and Monte Carlo simulations, they identified the sensitive parameters and potential failure modes of the system. Carpenter et al. [8] investigated the mechanisms leading to gas lift valve failures in subsea wells, which typically involve miscommunication between the tubing and annulus. By analyzing recovered gas lift valves, they identified design and operational weaknesses to reduce the risk of recurrence of similar issues. Lv et al. [9] proposed a quantitative diagnosis method for sucker rod pump systems, emphasizing fault mechanisms such as rod parting due to mechanical wear, fatigue, and corrosion. Derek et al. [10] developed an expert system to diagnose sucker rod pumping units, addressing a broad range of mechanical link and motor issues. Tecle [11] investigated energy efficiency improvement and fault diagnosis techniques for sucker rod pumps, focusing on reducing vibration-induced mechanical failures.
Regarding data-driven types, Chen et al. [12] utilized deep learning algorithms, specifically convolutional neural networks (CNNs) and backpropagation neural networks (BPNNs), for fault prediction in ESPs. These models can extract useful features from large volumes of production data, which are then used for fault diagnosis and prediction. Zhang et al. [13] developed a simulation model based on motor power to diagnose the operating conditions of beam pumps (BPs). The study employed a sloping decision tree to diagnose the working state of the pumps. Results showed that the model could effectively predict pump failures, thereby enhancing the production efficiency of oil fields. Carpenter et al. [14] used an improved fully connected perceptron artificial neural network (ANN) to predict failures in beam pumps and validated the method by comparing it with historical wellbore data. This approach was capable of predicting faults within a 5% error margin. Shi et al. [15] developed a CNN-based fault diagnosis model for plunger gas lift systems, incorporating wavelet transform and channel attention to enhance diagnostic accuracy and adaptability in unconventional gas fields. Wang et al. [16] developed a deep learning model using CNN to diagnose screw pump failures in oilfields by analyzing correlations between electric current data and pump working status. The model, trained on current–time curves, accurately identifies fault types, enabling rapid repair and minimizing production loss. Ragab et al. [17] developed machine learning models to detect integrity anomalies and predict early well failures in oil and gas wells, enhancing well integrity management. The models, using algorithms like random forest and boosting, analyze processed WI data to accurately assess risk levels, improving operational efficiency and safety in mature fields. Liu et al. [18] used a hybrid model of long and short-term memory networks and convolutional neural networks to improve fault warning and diagnosis of electric submersible pumps and increase the productivity of oil wells. Abdelaziz et al. [19] investigated an advanced predictive failure analysis technique for electric submersible pumps, using artificial intelligence and physical data analysis methods to predict the remaining service life of electric submersible pumps and the causes of failures, so that measures can be taken in advance to avoid failures. In addition to using a mechanism-driven model or a data-driven model alone, Silvia et al. [20] used a hybrid artificial intelligence and physics-based model to predict electric submersible pump failures. By analyzing historical sensor data, the model can predict short- and long-term events that may lead to electric submersible pump failures. Orrù et al. [21] proposed a machine learning model for early fault prediction of centrifugal pumps in the oil and gas industry, using sensor data and applying support vector machine (SVM) and multilayer perceptron (MLP) algorithms to detect faults and support maintenance decisions. Saghir et al. [22] applied machine learning methods to monitor and improve progressive cavity pump (PCP) performance in Queensland’s coal seam gas wells, using time-series data and image conversion techniques to detect anomalies and enhance real-time monitoring. Ruan et al. [23] combined steady-state real-time optimization (SSRTO) with deep reinforcement learning (DRL) to improve optimization and reduce computational costs in oil and gas processes, outperforming dynamic real-time optimization (DRTO).
Although mechanism-driven and data-driven fault diagnosis and optimization techniques for oil production systems have addressed numerous challenges, these methods often focus on diagnosing and resolving specific types of faults. Both approaches are subject to inherent limitations and are typically applicable only under certain conditions. Mechanism-driven methods rely heavily on the accuracy and comprehensiveness of physical or mathematical models, making them less effective in handling unanticipated or highly complex fault scenarios. Conversely, data-driven techniques depend on large volumes of high-quality historical data and may struggle to identify rare or novel fault patterns. Given the diverse and dynamic nature of faults that can occur in oil production systems, these isolated methods have not yet been effectively integrated into a unified framework. The absence of a comprehensive system capable of addressing the full spectrum of operational anomalies limits the ability to achieve holistic fault management and optimization. To meet the demands of increasingly complex oilfield operations, future advancements must focus on developing a cohesive system that synergizes mechanism-driven and data-driven approaches, enhancing the adaptability and robustness of fault diagnosis and optimization technologies. Today, several companies have developed software solutions aimed at integrating various aspects of oilfield operations. For instance, PetroBase developed PetroBase Pro, a platform that consolidates economic, production, and operational data to enable powerful analyses. This software facilitates operational optimization, cost reduction, and recovery enhancement. It is particularly suitable for managing a wide range of oil and gas activities, from well history to economic analysis, making business decisions more efficient and data-driven. Similarly, Quorum Software offers the Oil & Gas Production Operations Software, which provides tools to reduce downtime, optimize lease operating expenses, and streamline regulatory compliance. This software enables real-time data collection and visualization, empowering operators to effectively manage well performance. The platform also supports rapid cloud deployment, improving overall productivity. Another example is XSPOC by ChampionX, which integrates data management, production optimization, fault diagnosis, and prediction, as well as geological and reservoir management functionalities. This software is designed to assist engineers and managers in comprehensively optimizing oilfield development and production processes. Despite the advances these systems represent, they typically focus on specific areas, such as data and operations management or fault diagnosis, without forming a more integrated and comprehensive management system. To enhance oilfield operations and management, this study has developed an intelligent system that integrates data acquisition, analysis, diagnosis, and decision-making capabilities. This system has been applied in an electric submersible pump oilfield in the East China Sea, demonstrating its effectiveness in optimizing operations and improving management levels.
The system is built on a B/S (browser/server) architecture and uses Oracle databases as its data platform. It gathers and integrates oilfield production data to support reporting, analysis, and visualization across different time periods and parameters. Using basic statistical methods, the system sets parameter limits and applies time-series models to predict future trends in production, allowing for automated monitoring. The system also uses advanced data techniques to improve oilfield operations. It starts with data integration and processing, enabling the system to handle large amounts of production data. The system uses deep learning for data mining, self-learning, and prediction. This helps predict equipment life, issue warnings, and recognize operational conditions. Specifically, deep neural networks (DNNs) and recurrent neural networks (RNNs) are used to find patterns in the data and predict failures or inefficiencies. In addition, the system uses supervised learning for fault detection and unsupervised learning to spot unknown problems. These methods work together to create a proactive analysis workflow. The system automatically provides insights based on real-time data, helping identify problems before they cause failures.
Overall, by combining automated monitoring and predictive insights, the system improves operational efficiency. It gives timely recommendations for optimizing the oil production process, such as adjusting production rates or maintenance schedules. This system, using data-driven predictions, is a key tool for intelligent oilfield management, helping operators make better decisions and reduce downtime.
2. Architecture of the Intelligent Oil Production System
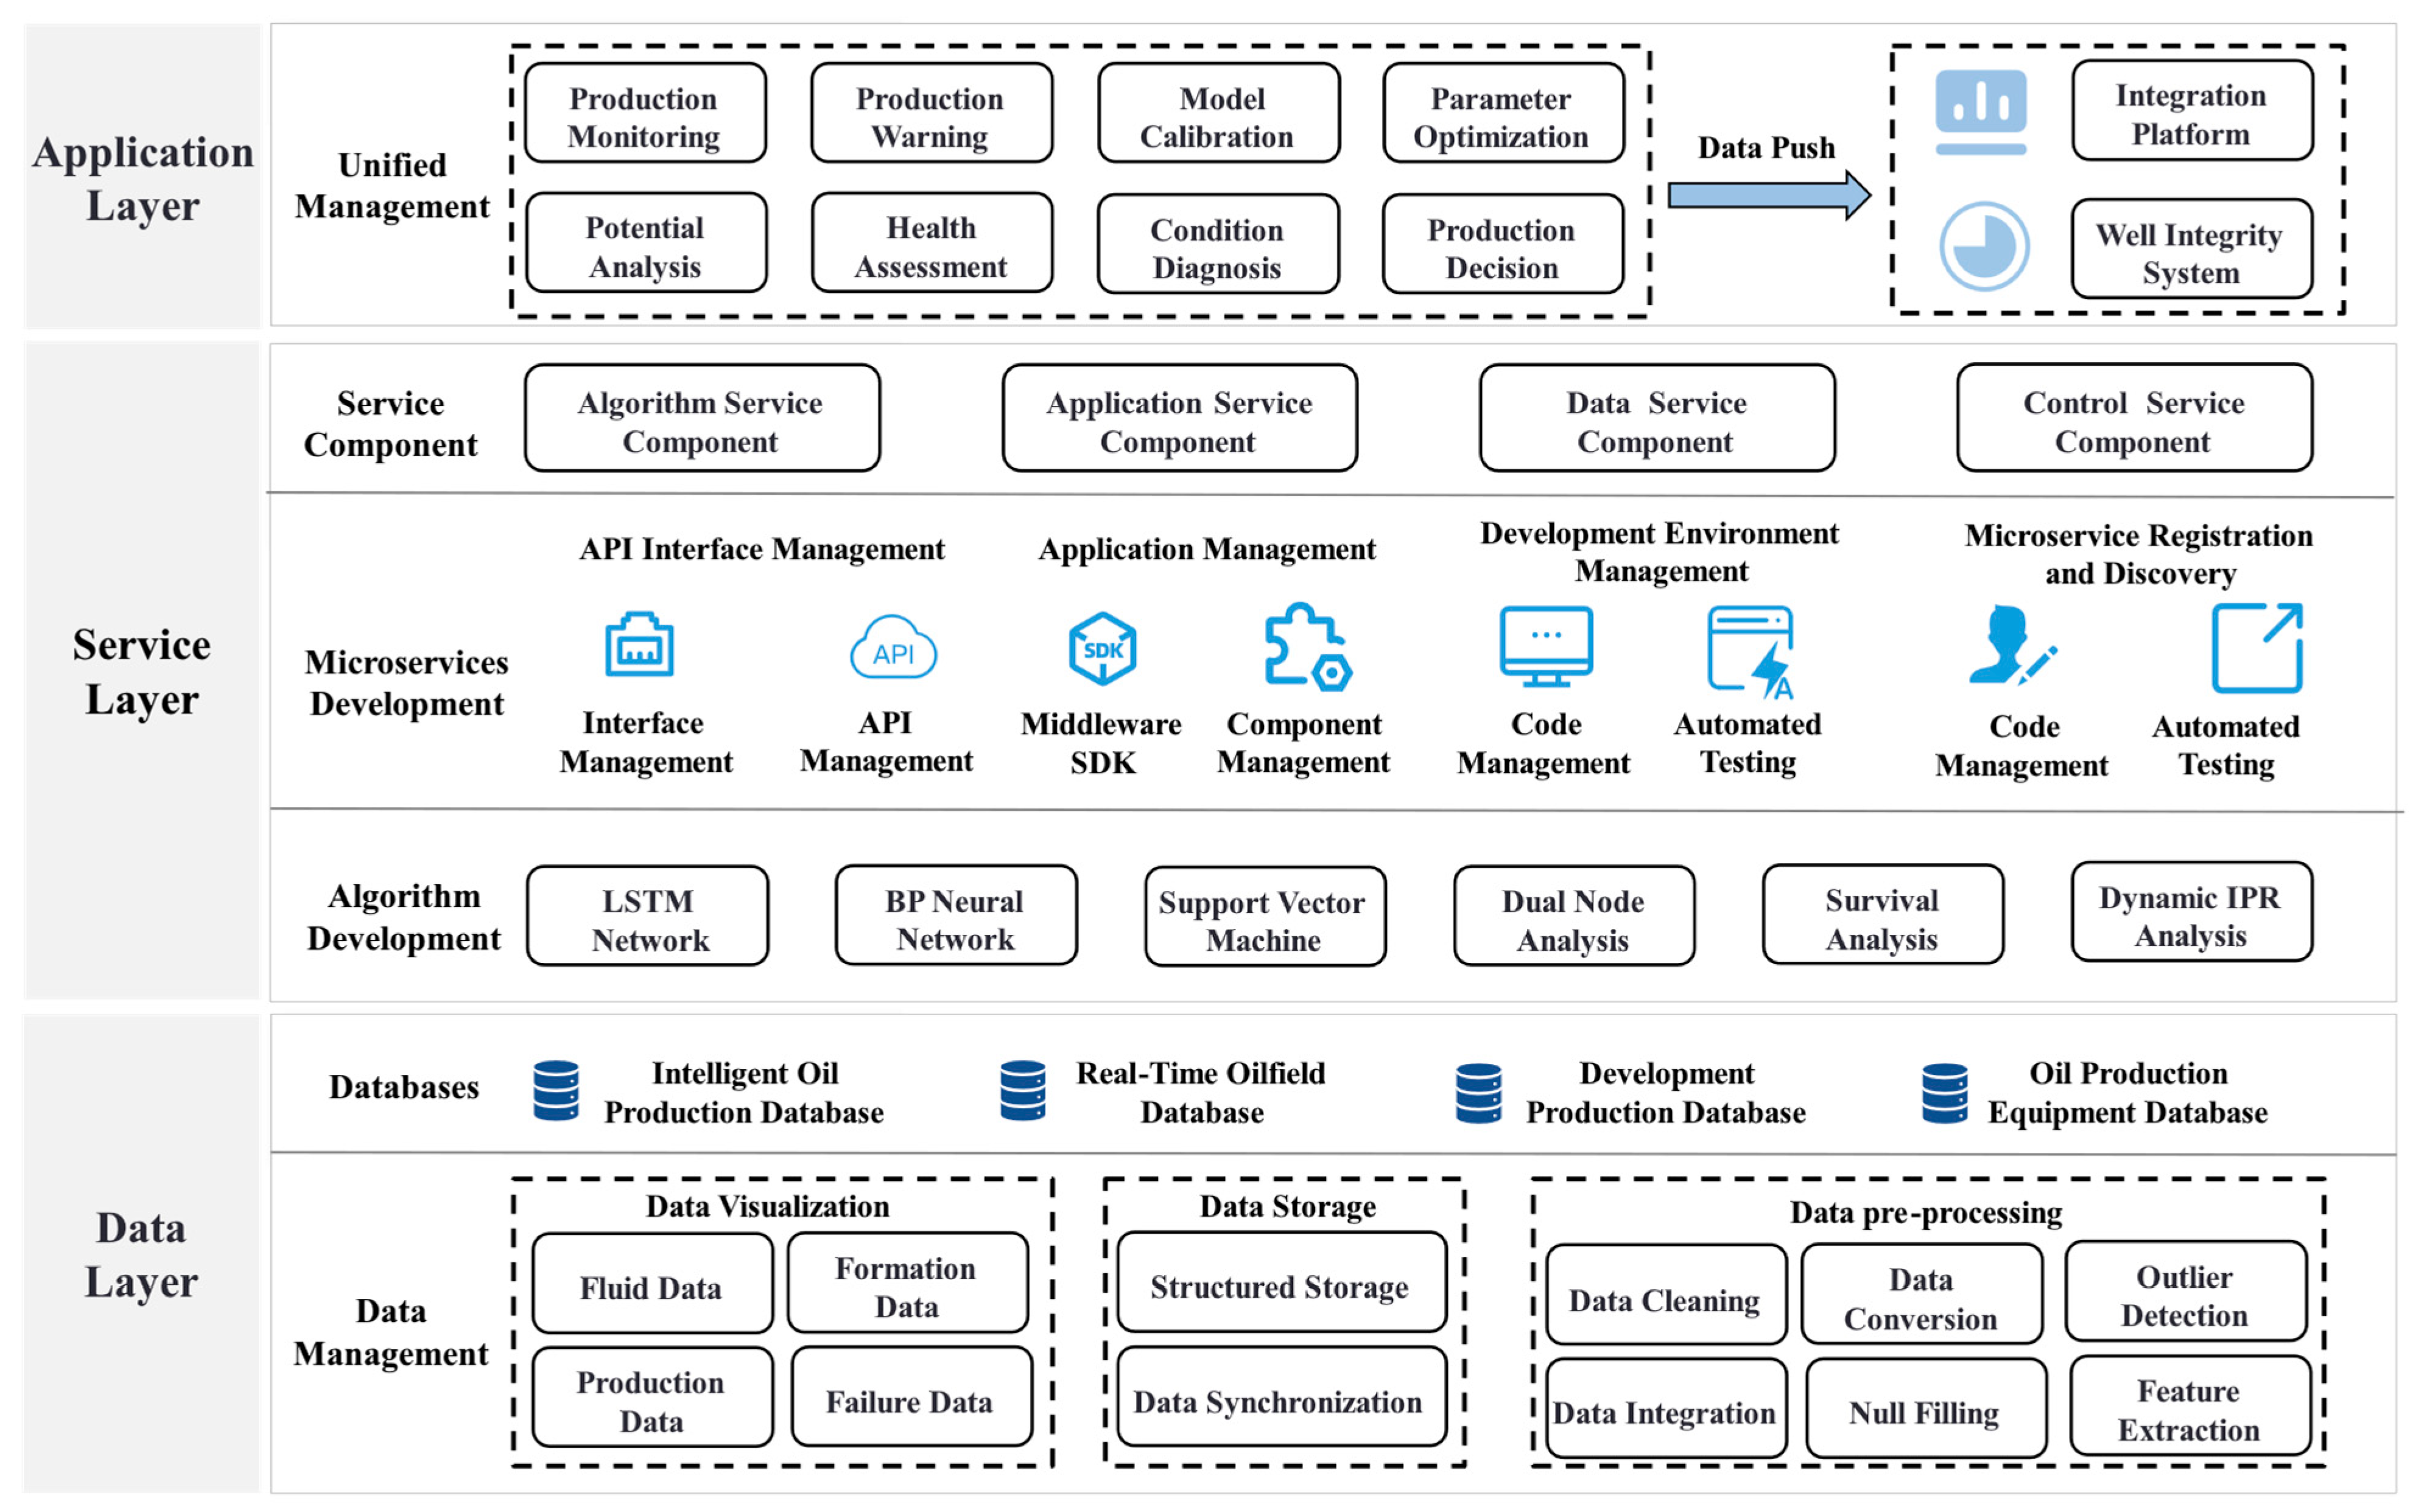
In modern industrial applications, particularly in the realm of oil production, the demand for real-time monitoring and the optimization of production processes is continuously growing. This necessitates the development of sophisticated software systems capable of handling large volumes of data in real time and providing accurate predictions and health assessments. The software architecture presented in this paper is designed to meet these demands, with a focus on scalability, modularity, and efficiency. It consists of three primary layers: the Application Layer, the Service Layer, and the Data Layer. These layers are designed to work together seamlessly, offering a comprehensive solution for production monitoring and equipment management through highly integrated components.
The Application Layer resides at the forefront of the architecture, directly interacting with users by providing data visualization and user interfaces. This layer integrates functions such as production monitoring, early warning, health assessment, and condition diagnosis. It ensures the accuracy of data processing through model calibration and parameter optimization and pushes the processed results in real time to the integrated platform to aid in decision-making. The Service Layer serves as the central component of the software architecture, supporting the operation and management of various services. Utilizing a microservice architecture, it achieves high modularity and the independent deployment of services, thereby enhancing system maintainability and scalability. This layer includes API management, middleware, and component management, as well as code management and automated testing, ensuring efficient communication between services and stable system operation. The Data Layer forms the foundation of the architecture and is responsible for the storage, processing, and analysis of large volumes of data. It encompasses intelligent oilfield production databases and real-time oilfield databases, along with key data management tasks such as preprocessing, cleaning, synchronization, and feature extraction, ensuring the quality and availability of data.
Overall, the design advantage of this three-layer architecture lies in its modular and highly integrated nature, enabling the effective handling and analysis of large-scale datasets. It also provides flexible service deployment and rapid technological adjustment capabilities. Through this approach, the architecture not only improves operational efficiency but also enhances the system’s adaptability to complex business requirements, offering crucial technical support for the development of the oil production industry. The architecture diagram of the intelligent oil production management system is shown in Figure 1.
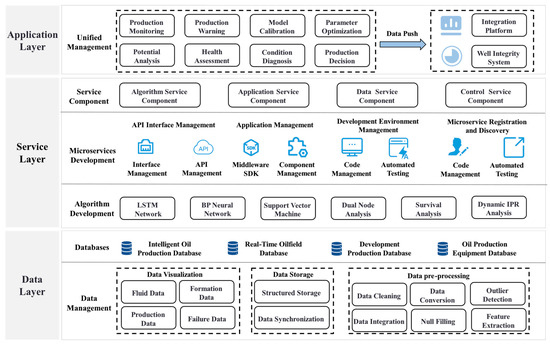
Figure 1.
Architecture of the intelligent oil production system.
3. Intelligent Oil Production System Workflow
Today, a variety of methods are utilized for monitoring and diagnosing the state of oil production operations, including traditional techniques like ammeter cards and macroscopic control charts. These methods are predominantly based on mechanistic models that diagnose production conditions by interpreting mechanical and operational data. However, the oil production system is an intricately complex structure, characterized by the integration of multiple subsystems and the interaction across various fields. This complexity often renders traditional mechanistic models insufficient for quickly and accurately identifying and responding to abnormalities. Moreover, while various monitoring and diagnostic techniques exist, they often differ significantly in their application scenarios and suitability. This variation can lead to a lack of coherence in the monitoring process, as different methods may provide conflicting or non-complementary information, complicating the decision-making process.
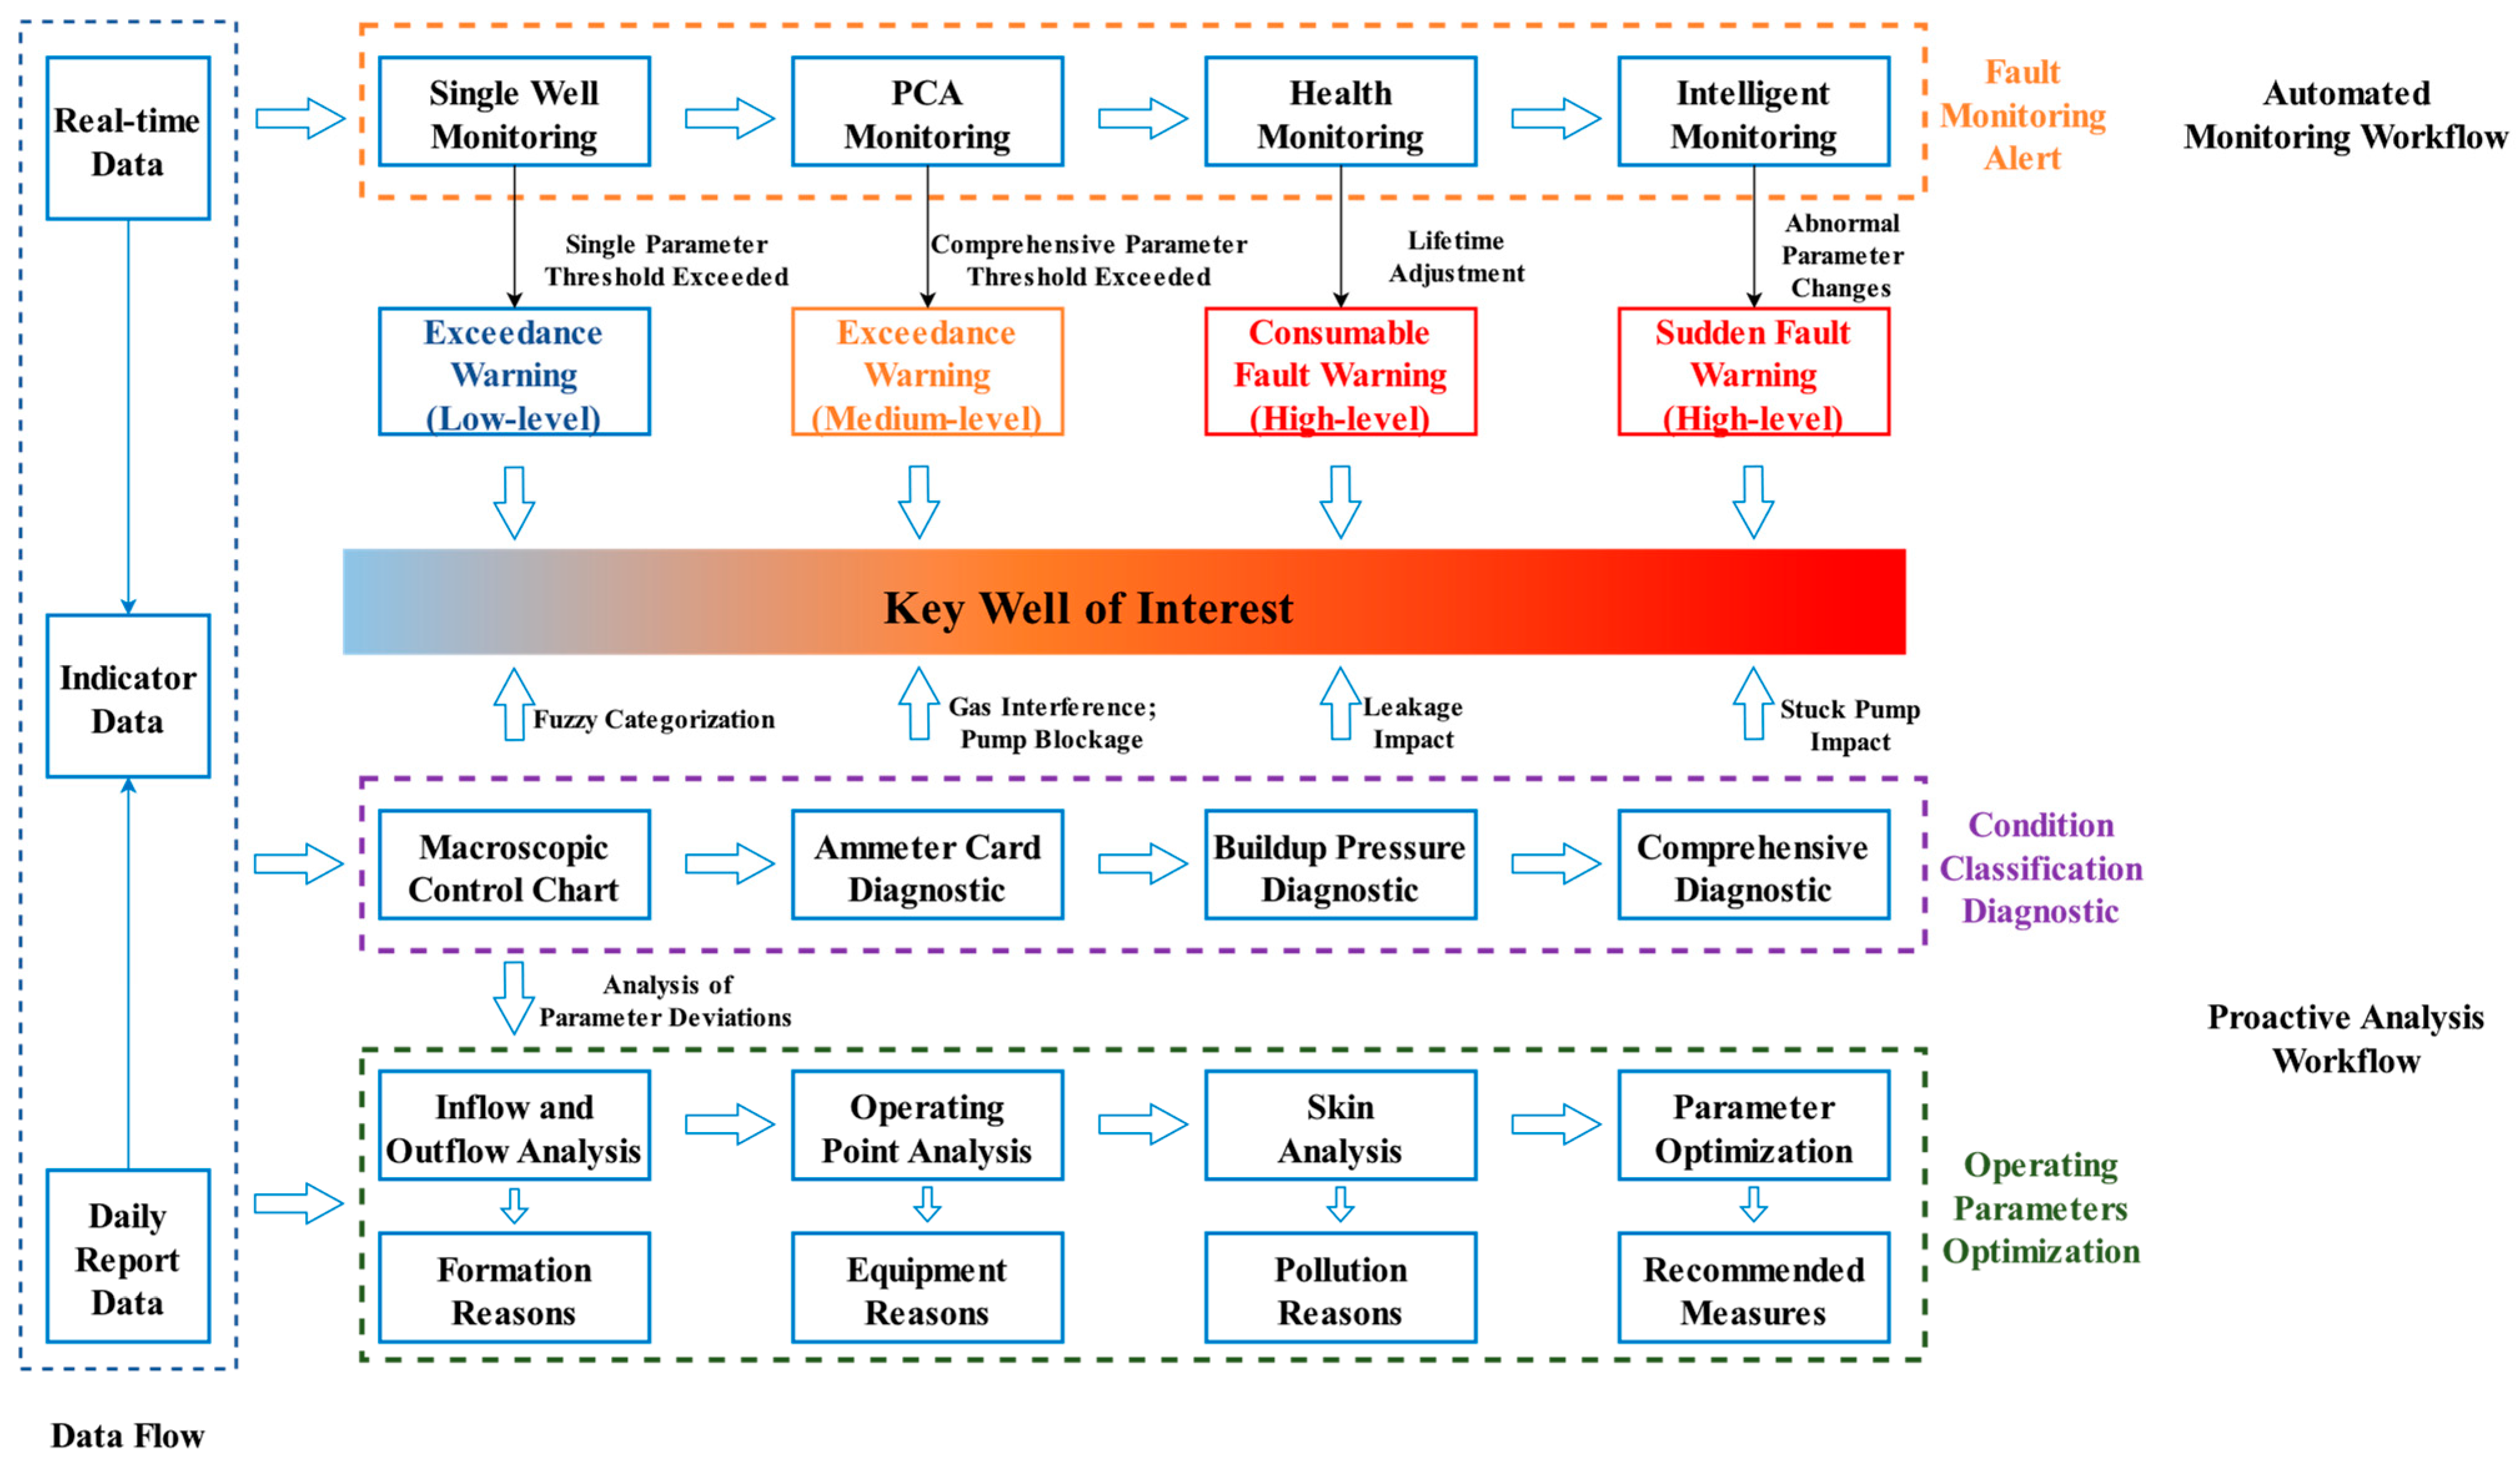
In this study, an intelligent oil production system seamlessly integrates mechanism-driven and data-driven models, utilizing the advantages of both to improve the accuracy and speed of diagnosis. By designing a comprehensive, multi-layered oil production management workflow, the system can adaptively apply the most appropriate model to specific situations and requirements. This integration not only simplifies the monitoring and control process but also improves the overall efficiency of the system and its responsiveness to changing production conditions. With this advanced approach, the intelligent oil production system is expected to significantly improve the operational oversight and management of oil production activities. The workflow of the intelligent oil production system is shown in Figure 2.
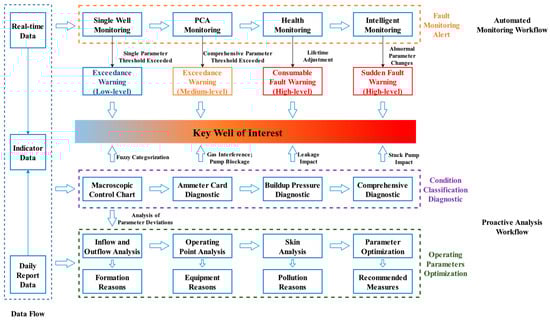
Figure 2.
The workflow of the intelligent oil production system.
The process achieves efficient management through three core components: data flow, automated monitoring workflow, and proactive analysis workflow. This integrated approach ensures the effective utilization of data and timely issue resolution while enhancing control and optimization capabilities over production status.
Data flow forms the foundation of the workflow, ensuring that all necessary input data are accurately collected, organized, and transmitted to support monitoring and analysis. This component covers the collection of real-time data and daily report data. Real-time data provides instant insight into the operational status of oil wells, while daily report data summarizes the operational conditions of the previous day. After integration and standardization, these data are transformed into indicator data, forming the data foundation for the automated monitoring and proactive analysis workflows. Efficient data flow ensures the integrity and reliability of the data, meeting the data requirements for subsequent processes.
Built upon data flow, the automated monitoring workflow further enhances the system’s response capability. This workflow relies on advanced algorithms to automatically identify and categorize potential issues in the production process. From low-level parameter exceedance warnings to high-level consumptive fault warnings, the system can automatically adjust monitoring strategies and response measures according to different warning levels. For example, when a sudden failure is detected, the system not only triggers an alarm but also automatically initiates emergency response procedures based on the nature and severity of the failure, ensuring that issues are resolved within the shortest possible time. The proactive analysis workflow represents the advanced segment of the process, not only responding to current data changes but also predicting future potential issues through in-depth analysis, thereby enabling preventive measures. This workflow encompasses the entire process from parameter optimization to the recommendation of actions. Through the continuous monitoring and analysis of high-risk wells, such as the detailed diagnosis of gas interference and pump blockage, the system can anticipate and optimize operational points in advance. Additionally, the system performs an in-depth analysis of well operating conditions through comprehensive diagnosis and condition classification, proposing specific optimization recommendations to maximize production efficiency and ensure the safety of equipment operation.
The primary advantage of this workflow lies in its high degree of automation and intelligence, effectively integrating and analyzing information from various data sources to promptly identify and respond to a variety of production issues. By comprehensively utilizing both real-time monitoring data and daily report data, the system not only achieves rapid fault diagnosis but also predicts potential risks, providing scientific decision support for operators.
3.1. Data Flow
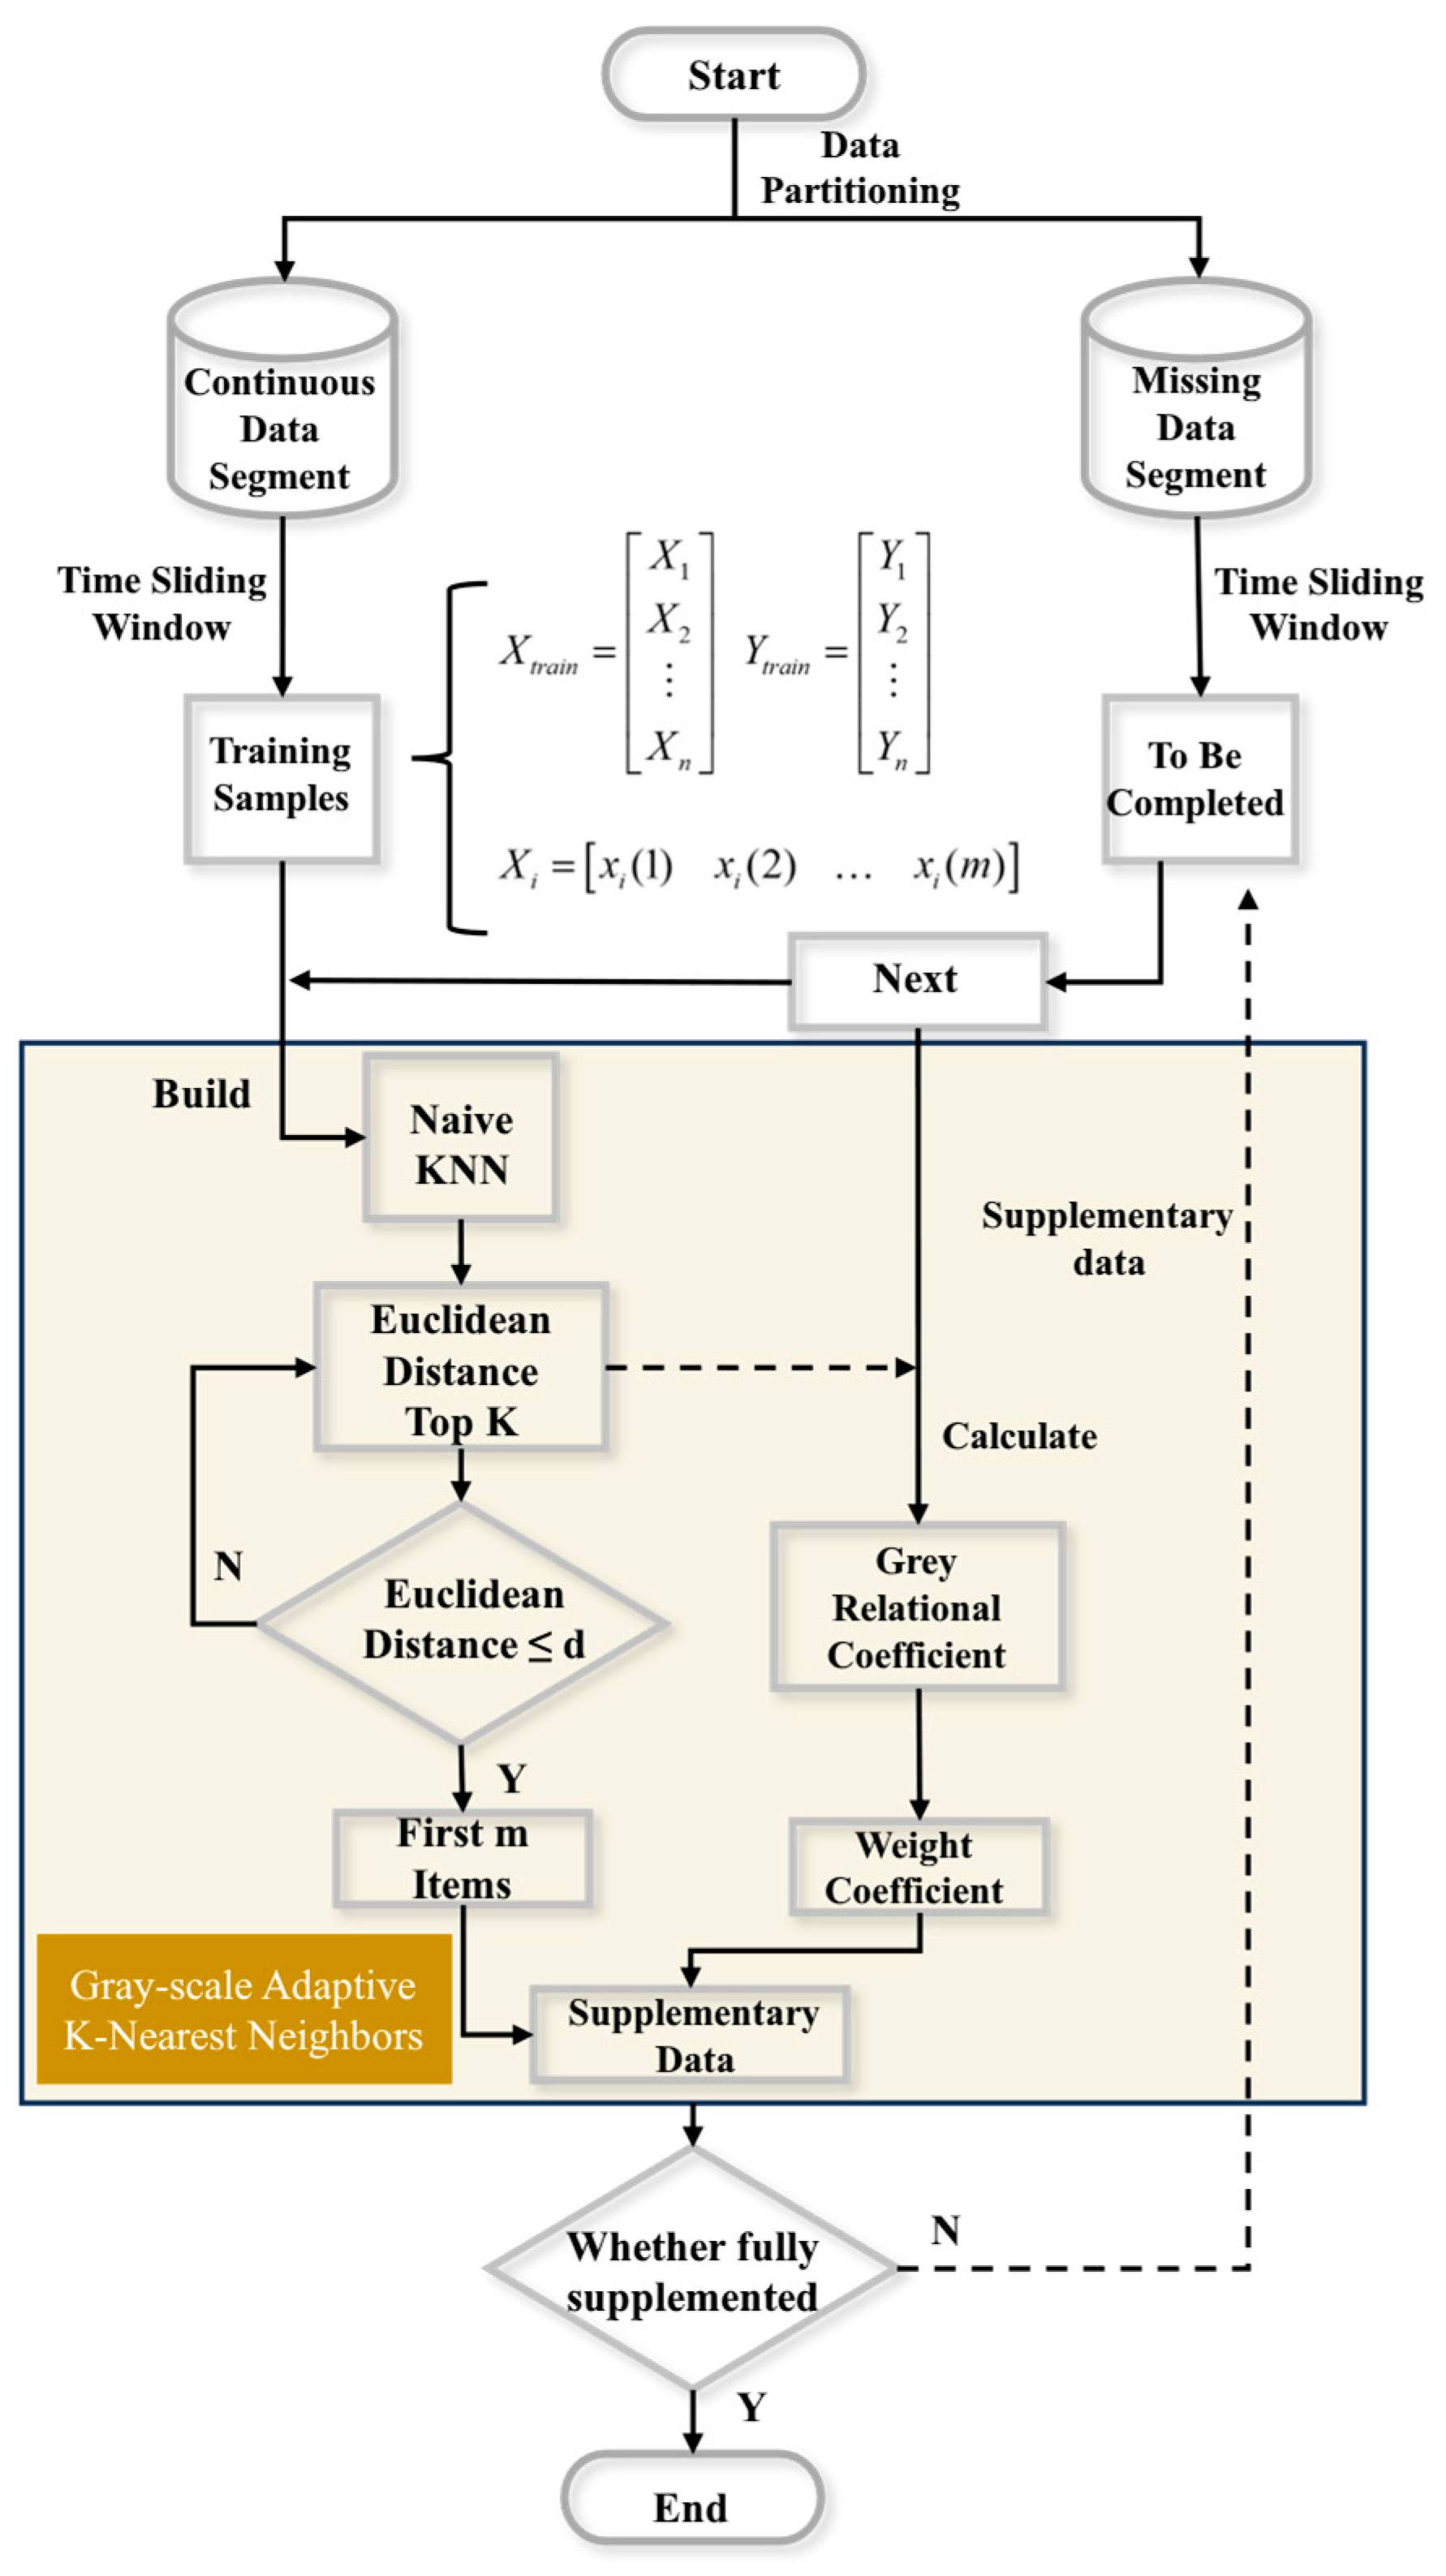
The intelligent oil production system integrates multiple data sources, including fluid dynamics, formation characteristics, production metrics, and fault diagnostics. These datasets are consolidated into a real-time database, a development production database, and an intelligent oil production database, forming a comprehensive data flow architecture that underpins advanced analytical processes. This integration provides the foundation for precise diagnostics, predictive monitoring, and optimized decision-making in oil production. However, challenges often arise during production operations. Equipment malfunctions or anomalies in the transmission medium can result in data loss or generate outlier data that deviates from expected ranges. Such inconsistencies pose significant obstacles to accurate diagnostics and effective system monitoring, potentially compromising the performance and reliability of the system. To mitigate the impact of missing or erroneous data, the intelligent oil production management system incorporates a robust data imputation methodology based on the gray adaptive K-nearest neighbor (GAKNN) [24] algorithm. This approach is specifically designed for time-series datasets with missing entries. The GAKNN method leverages the classical K-nearest neighbor (KNN) [25] algorithm to identify proximate neighbors within the dataset. It then employs gray relational analysis to calculate weight coefficients, enhancing the selection process for imputation. Sequential imputation is performed to iteratively reconstruct missing data, ensuring continuity and accuracy in the dataset. The detailed workflow of the data imputation process using the GAKNN method is illustrated in Figure 3. This method not only addresses missing data effectively but also enhances the system’s resilience to data irregularities, enabling more reliable monitoring and analysis.
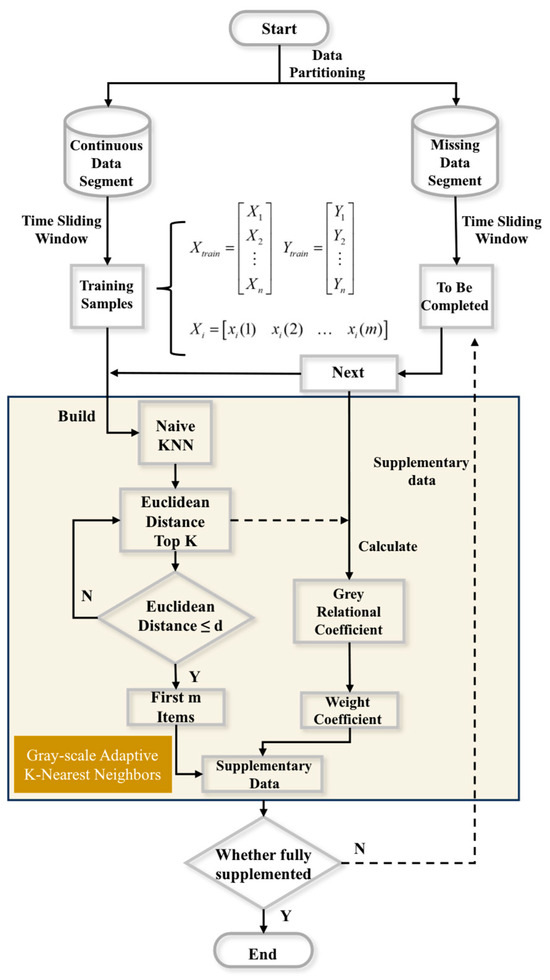
Figure 3.
The data imputation process based on the GAKNN method.
While the GAKNN method offers substantial benefits in addressing missing and irregular data, its implementation introduces additional computational overhead that must be considered in real-world applications. The iterative nature of the imputation process, combined with the calculation of gray relational weights for each missing entry, increases the system’s computational load compared to simpler methods like mean or median imputation. For example, the GAKNN algorithm requires the identification of K-nearest neighbors for each missing data point, followed by repeated gray relational coefficient calculations, which are computationally intensive, especially for large datasets with high dimensionality. In our implementation, the preprocessing time for datasets using GAKNN was observed to increase by approximately 30–40% compared to basic imputation methods, depending on the size and complexity of the data. However, this computational cost is offset by the significant improvement in data quality, as measured by metrics such as root mean square error (RMSE) and predictive model accuracy. Despite the higher resource requirements, the enhanced reliability and precision in monitoring and diagnostics make GAKNN a valuable component of the intelligent oil production system.
To address significantly anomalous data that exceed normal ranges, the intelligent oil production system employs Chauvenet’s criterion [26] to eliminate outliers, thereby improving the accuracy of subsequent analyses. Let the data sample be represented as with the mean and variance of the data sample denoted as and , respectively. The following criterion is used to determine if a data sample is anomalous:
If the sample data meet , then the sample data are considered anomalous. The data flow not only focuses on data in the current state, it also considers the vast historical data stored on-site in the oilfield. Utilizing time series analysis models, such as the ARIMA model, as well as deep learning methods like RNN, the system extracts trends from historical data to better understand future trends, enabling the proactive prevention of impending dangers and abnormal conditions.
To further distinguish between simple outliers and early fault signals, the intelligent oil production system employs a multi-step process that integrates statistical, temporal, and contextual analyses. After identifying initial anomalies using Chauvenet’s criterion, the system applies time-series models, such as ARIMA, to analyze the progression of these anomalies over time. This allows the detection of trends or repetitive patterns that may indicate early-stage equipment degradation. For example, a gradual increase in current fluctuations or pressure inconsistencies, even if still within normal ranges, can suggest potential problems in submersible pumps. Additionally, the system combines multiple operational parameters to cross-validate the anomalies. By correlating data such as current, temperature, and vibration levels, the system identifies whether multiple parameters exhibit simultaneous deviations that align with historical failure patterns. Anomalies that meet these multi-parameter criteria are flagged as high-risk and passed to a machine learning model for further evaluation. The machine learning model, trained on historical fault data, classifies these flagged anomalies into noise or early fault signals based on features like frequency, amplitude, and persistence.
This approach ensures that the system not only eliminates irrelevant noise but also retains and identifies potential early warnings of equipment issues. By distinguishing between harmless outliers and meaningful fault signals, the system provides actionable insights that help operators proactively address potential failures, reducing downtime and maintenance costs while improving overall operational reliability.
3.2. Automated Monitoring Workflow
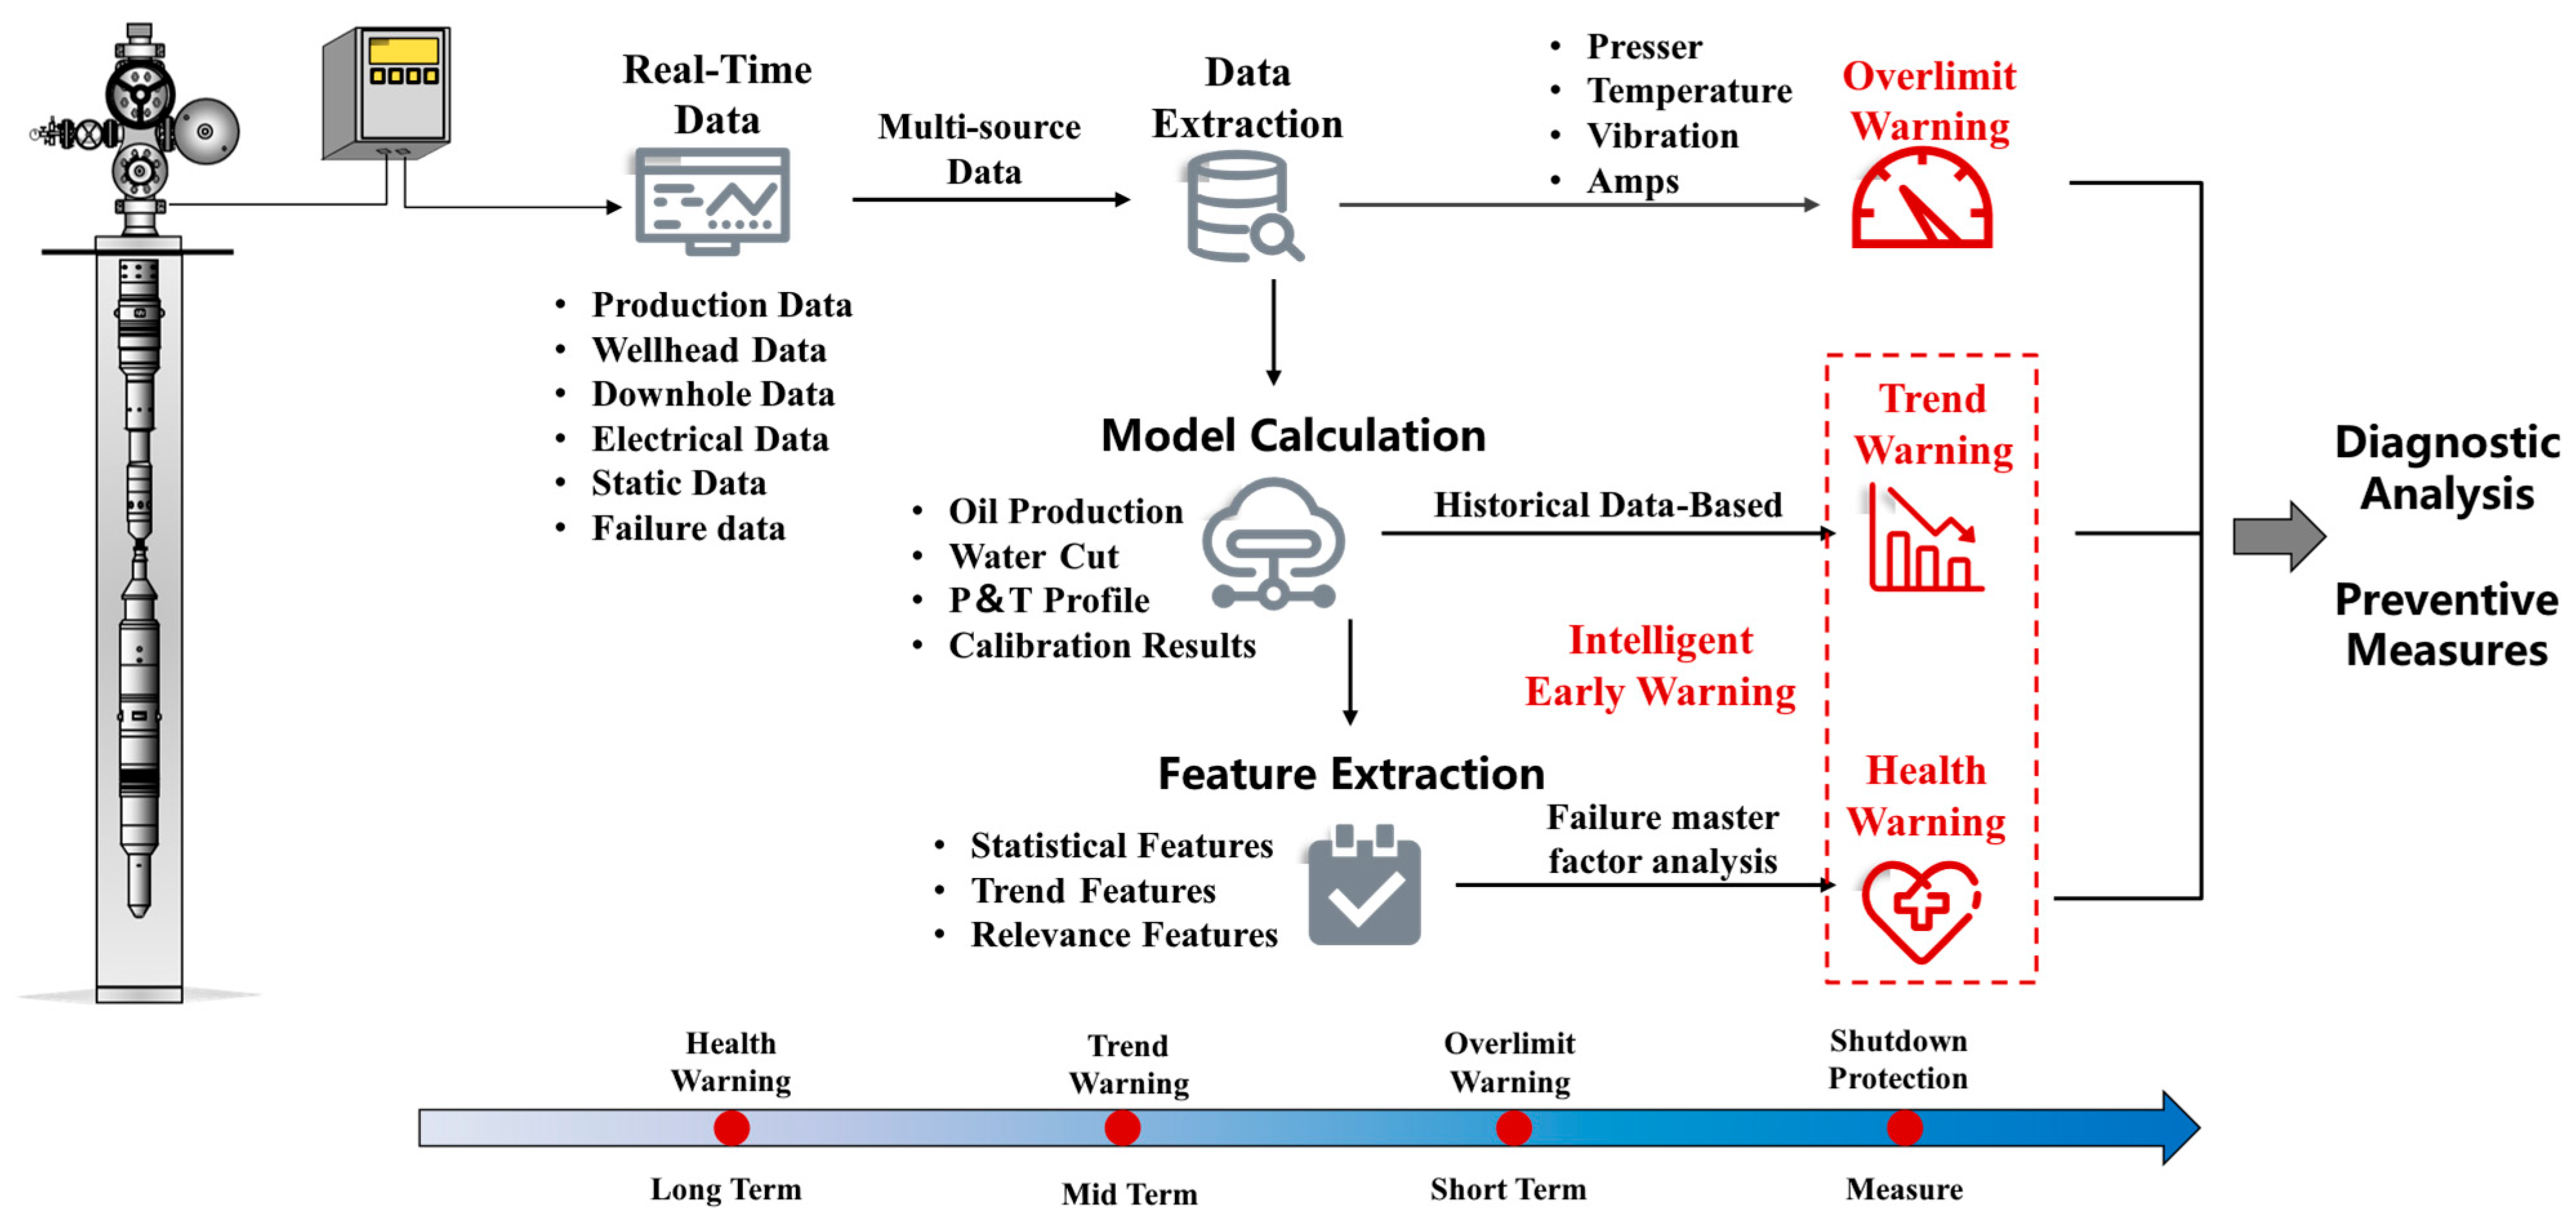
Supported by a complete data flow, a multi-level, hierarchical automated monitoring workflow has been established. The entire automated monitoring task flow is based on real-time data to ensure the timeliness of the monitoring workflow. The architecture of the automated monitoring workflow is shown in Figure 4.
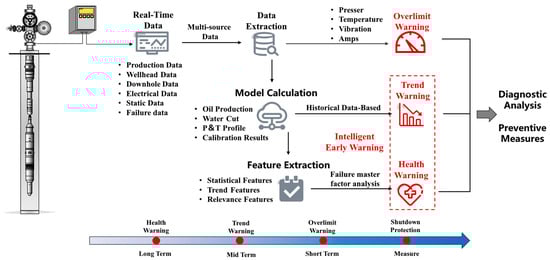
Figure 4.
Automated monitoring workflow.
The automated monitoring workflow begins with real-time data acquisition, where diverse multi-source data streams are continuously gathered and consolidated. This integrated data are subjected to data extraction and processing, where key features such as statistical attributes, trend indicators, and relevance factors are identified and isolated. The processed data are then fed into model calculations, which derive vital operational parameters such as oil production rates, water cut levels, pressure and temperature profiles, and calibration results. These calculations enable a deep understanding of the current state of the system. Based on this robust data foundation, the system executes a three-level warning mechanism that spans short-term, medium-term, and long-term timeframes. Overlimit warnings are triggered in real time when operational parameters, such as pressure, temperature, vibration, or electrical current, exceed predefined safety thresholds. This ensures that immediate risks are addressed promptly. Trend warnings, derived from historical data analysis and predictive modeling, identify evolving medium-term risks by highlighting abnormal trends or patterns that may indicate emerging issues. Finally, health warnings leverage advanced machine learning techniques and failure feature extraction to assess the long-term integrity and reliability of the system, identifying potential failures well before they occur.
The system operates as a dynamic feedback loop, where warnings at each level guide subsequent steps in the monitoring and decision-making process. Diagnostic analyses are continuously performed based on the generated warnings, enabling the implementation of preventive measures tailored to the specific conditions of the oil well. By classifying warnings into long-term, medium-term, and short-term categories, the system provides a structured and proactive approach to identifying and addressing potential problems early, without requiring expert intervention on-site. This ensures that targeted measures can be implemented in a timely manner, significantly enhancing operational efficiency, reducing downtime, and improving overall production safety.
3.2.1. Single-Parameter Warning
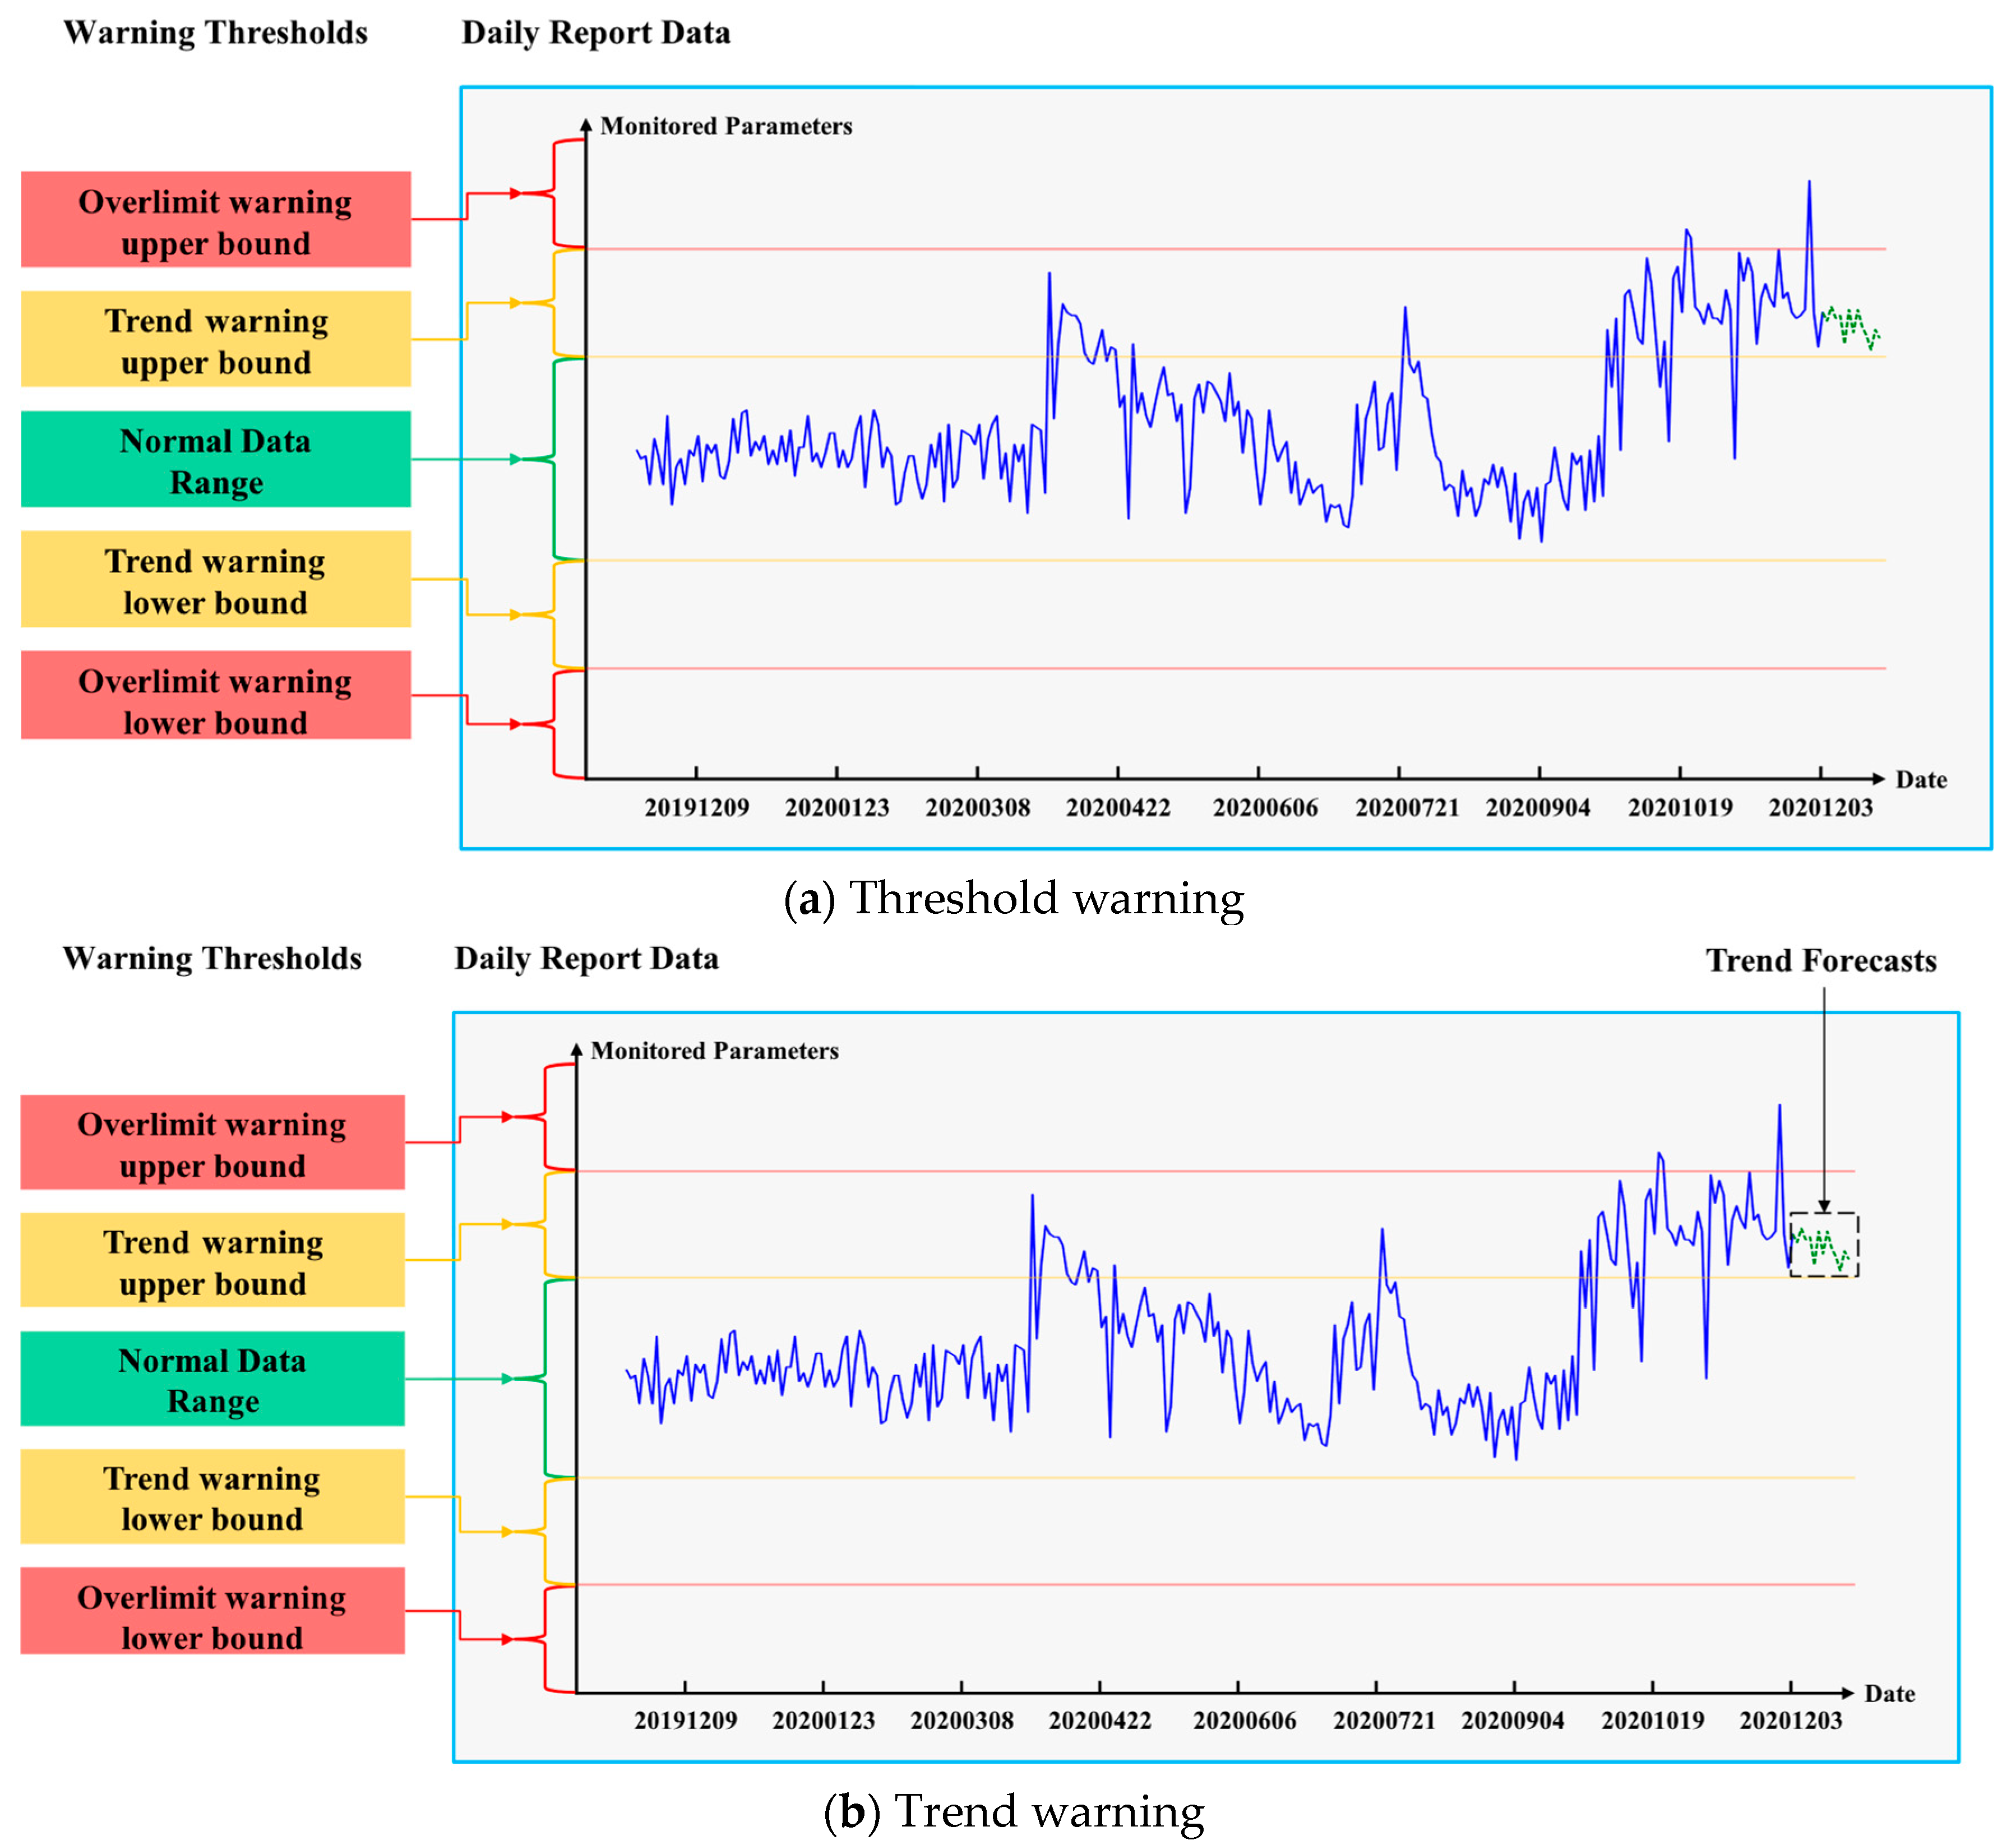
In highly automated industrial applications, accurate monitoring and timely warning of equipment operational parameters are crucial for maintaining system stability and safety. The intelligent oil production system introduces a technique called “Single Parameter Warnings”, designed to monitor and respond promptly to clear parameter exceedances, such as unusually high temperatures or exceptionally high currents in submersible pumps. This technology is divided into two main components: threshold warnings and trend warnings.
Threshold alerts are based on the 3σ (sigma) principle [27], a standard method in statistics used to measure data distribution and variability. According to this principle, the normal operating range of a parameter is defined as the mean (μ) plus or minus three times the standard deviation (σ), covering approximately 99.73% of normal operation data. This range is calculated as follows:
By continuously monitoring and comparing with historical data, the system dynamically adjusts the warning thresholds to adapt to changes in environmental or production conditions. Trend alerts employ advanced machine learning technologies, specifically recurrent neural networks (RNNs) [28]. RNNs are particularly suited for time series data analysis as they can capture temporal dependencies within the data, thereby effectively predicting future states. In our system, the RNN model is trained to forecast the potential trends of parameters over the next 30 days. If the predictions indicate any risk of exceeding the safety thresholds, the system automatically issues an alert. This method enhances the predictive nature of the warnings and significantly improves the responsiveness and effectiveness in addressing potential issues. Traditional methods typically rely on simple threshold-based alerts, which cannot account for future trends and may fail to predict issues before they occur. In contrast, the predictive model in our system allows for the early detection and proactive management of potential risks. The predictive model can be expressed in its simplest form as
where is the hidden state at time ; is the input at time ; and are the weights and bias of the network; and represents the activation function. The schematic of the threshold warning and the trend warning is shown in Figure 5.

Figure 5.
Schematic diagram of single parameter warning.
By integrating these two warning mechanisms, the single parameter warning technique provides a robust tool for early fault detection, helping to prevent equipment failures, optimize maintenance schedules, and thereby reduce downtime and associated operational costs.
3.2.2. Comprehensive Parameter Warnings
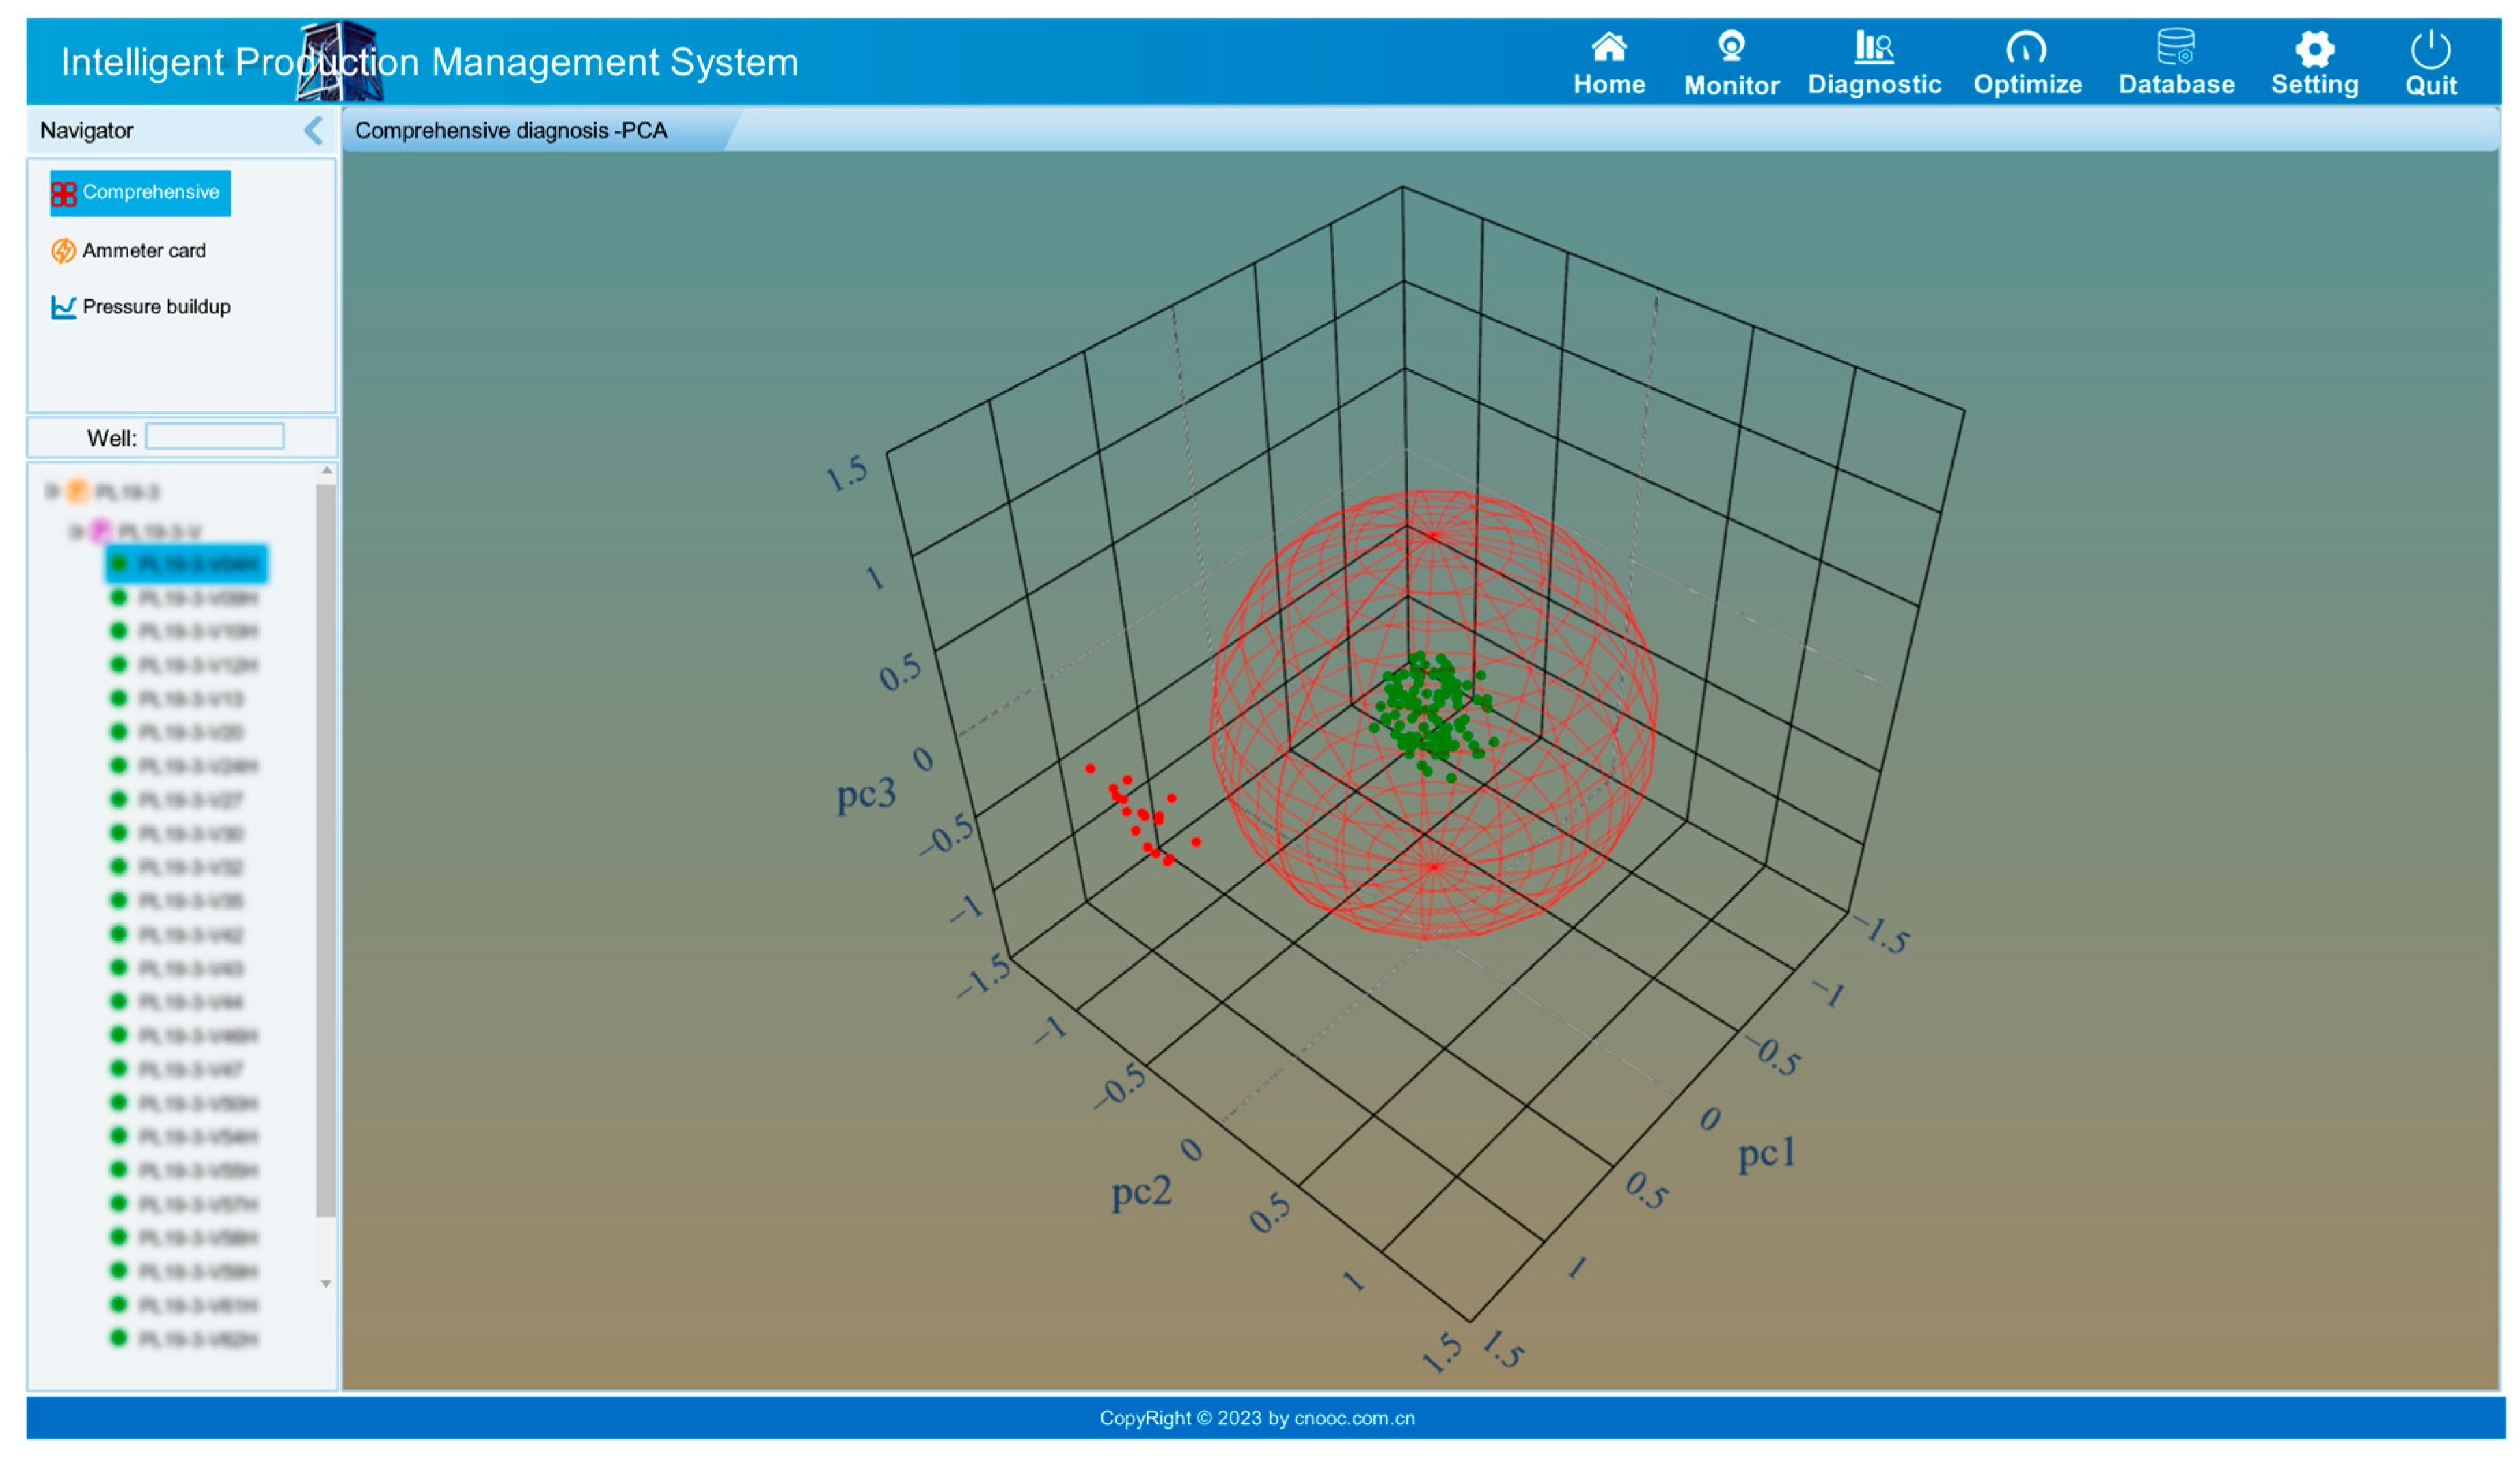
In the field of intelligent oil production, monitoring complex multivariate systems necessitates advanced diagnostic tools that can accurately predict and preempt potential disruptions. The innovative fault detection method of intelligent oil production system integrates principal component analysis (PCA) [29] and the density-based spatial clustering of applications with noise (DBSCAN) [30] clustering algorithm to provide a comprehensive solution for analyzing the interactions of multiple operational parameters in ESP systems. PCA is pivotal in processing high-dimensional data by reducing its complexity while retaining essential information. This statistical technique transforms the original correlated variables into a new set of uncorrelated variables known as principal components. These components are derived by calculating the eigenvectors and eigenvalues from the covariance matrix of the data, ensuring that the first principal component has the highest variance, followed by the second, and so on. The transformation can be expressed mathematically as:
where is the matrix of standardized data, and is the matrix whose columns are the eigenvectors of the covariance matrix of . This method effectively condenses thirteen critical operational parameters into a three-dimensional space that captures the most significant variance, thus simplifying the visualization and analysis without significant loss of information. The DBSCAN clustering algorithm further analyzes this reduced data to segregate operational states into clusters. Unlike traditional clustering methods, DBSCAN does not require prior knowledge of the number of clusters. It classifies points into clusters based on their density connectivity, using two main parameters, namely , a specified radius that determines the neighborhood around a point, and , the minimum number of points required to form a dense region. For a point to qualify as a core point under this framework, it must satisfy the condition
where is the set of points within the -neighborhood of . Points that are not reachable from any other points are marked as outliers, which is indicative of potential anomalies or faults. Through the integration of PCA and DBSCAN, the intelligent oil production system not only identifies operational anomalies but also provides a robust framework for real-time monitoring and fault prediction. The three-dimensional PCA plot offers an intuitive visual representation of the state of the system, where different clusters indicate varying operational regimes and anomalies are clearly marked. This level of insight allows operators to quickly identify and respond to deviations from normal operational patterns, significantly enhancing system reliability and reducing the risk of unforeseen failures. The schematic diagram of the comprehensive parameter warning based on PCA and DBSCAN is shown in Figure 6.
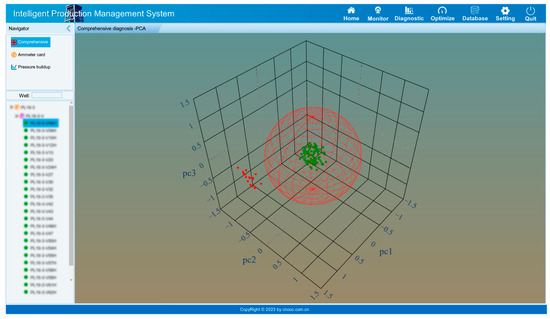
Figure 6.
Schematic diagram of the comprehensive parameter warning.
This method contrasts with traditional fault detection techniques commonly used in oilfields, which often rely on simpler, univariate monitoring approaches. In traditional methods, each operational parameter, such as temperature or pressure, is monitored independently with predefined threshold limits. If a parameter exceeds the threshold, an alarm is triggered. However, these approaches fail to capture the complex interactions between multiple parameters and may not detect faults that result from the combined effect of several parameters. In contrast, PCA allows for the analysis of the relationships between multiple parameters simultaneously, identifying subtle variations that may not be noticeable when parameters are considered in isolation.
3.2.3. Health Condition Warnings
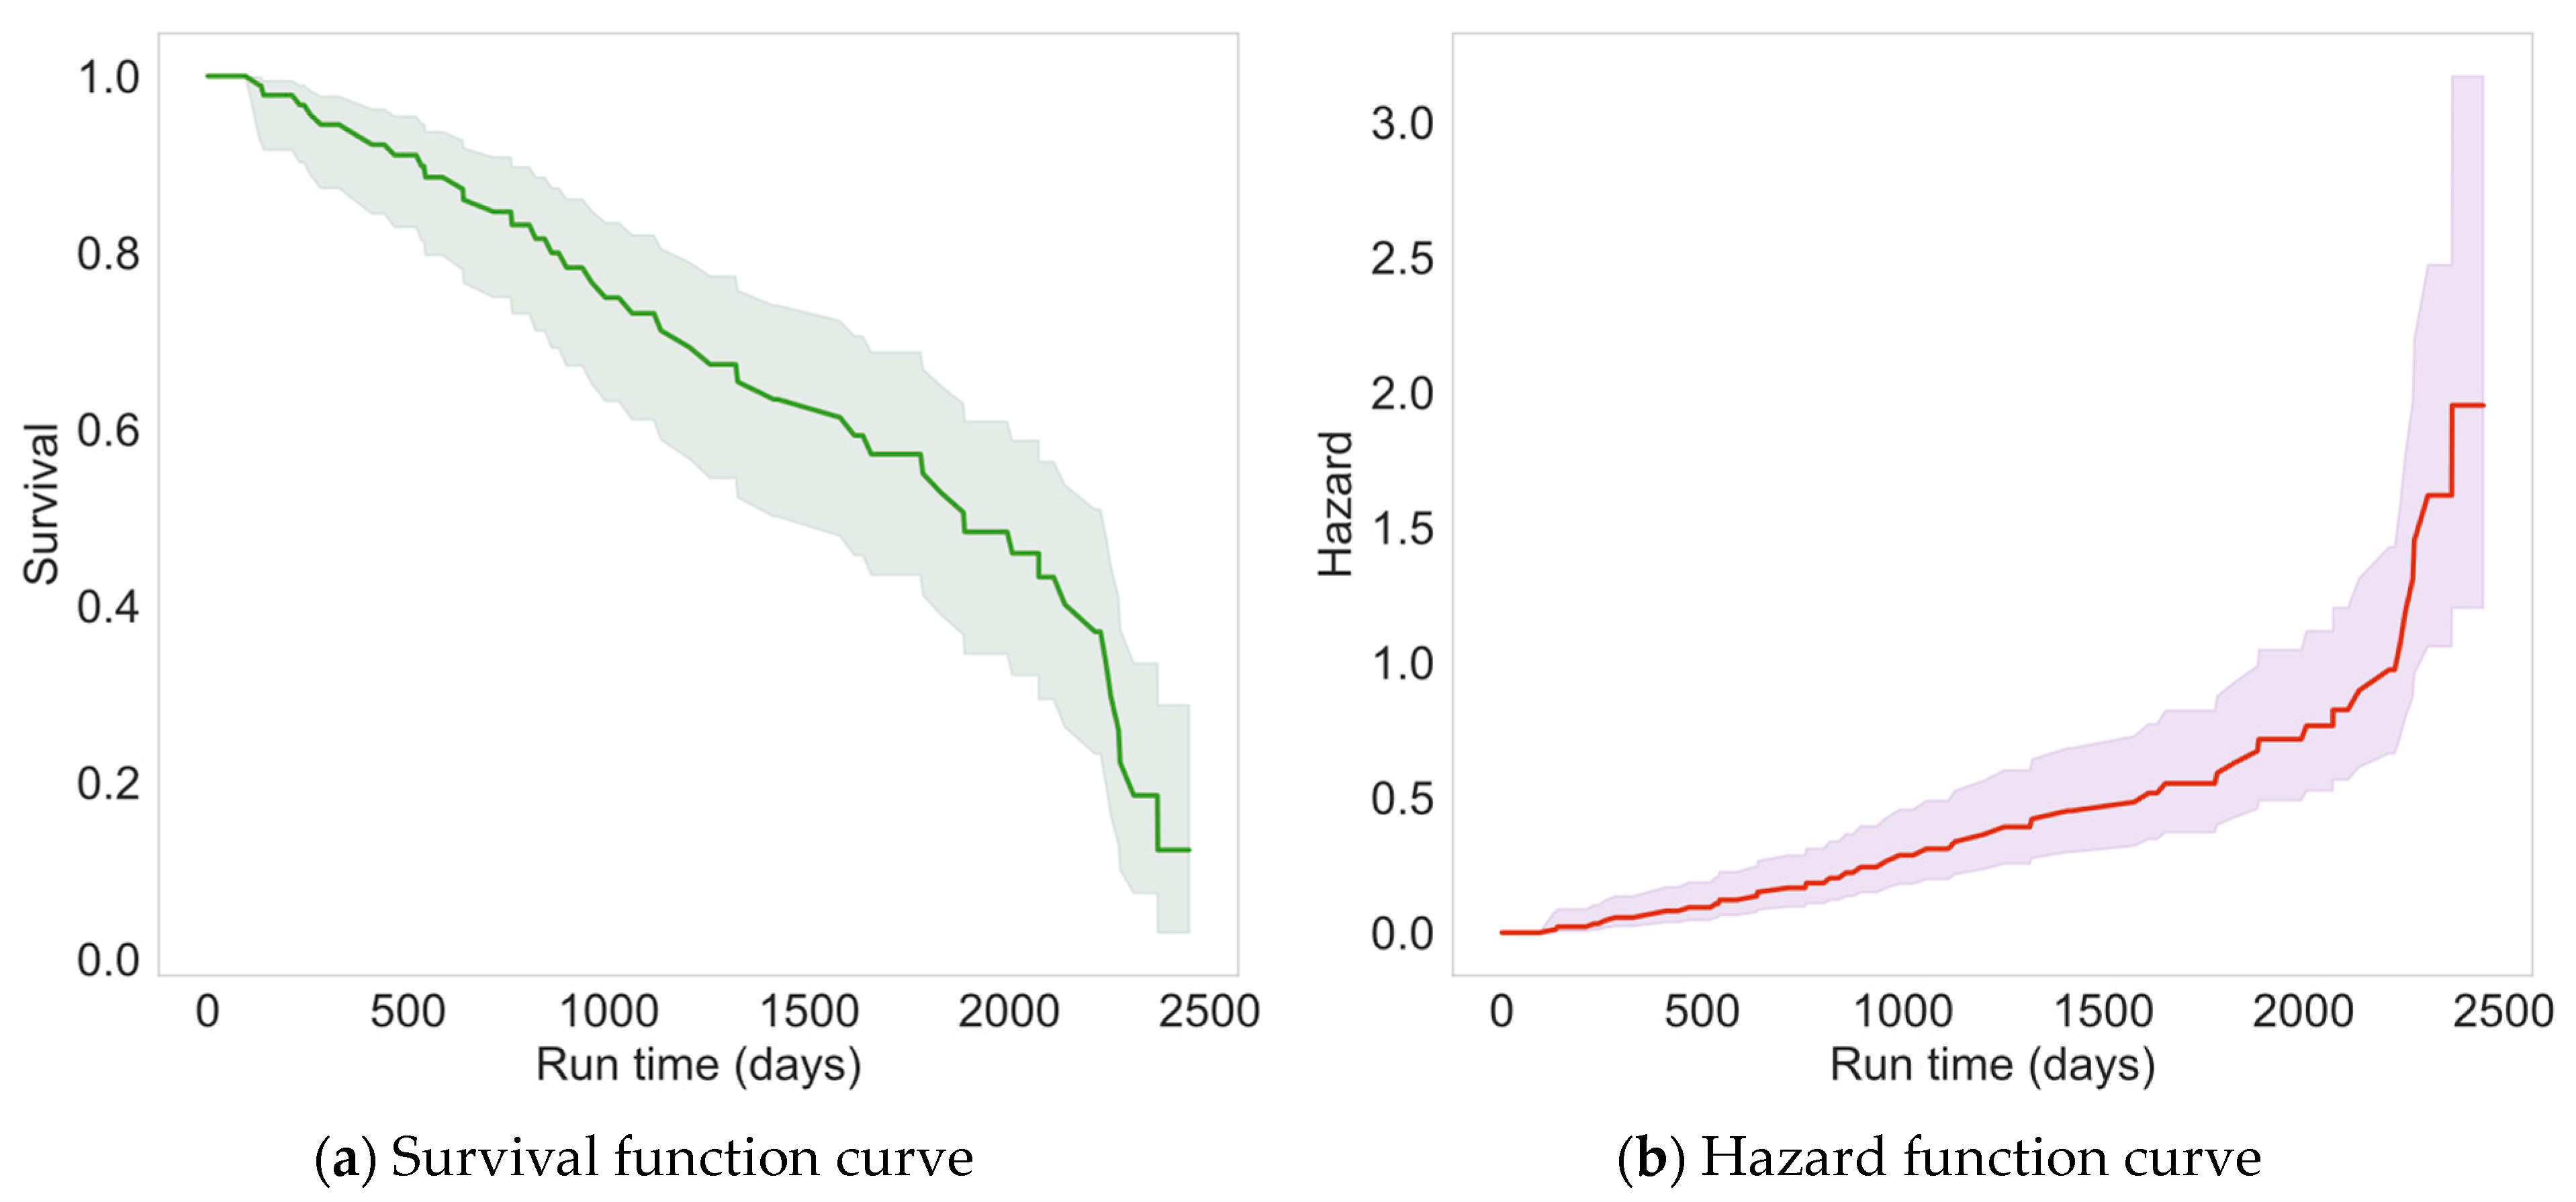
In the production process, certain faults, such as insulation aging, do not manifest early but rather cause the system to gradually degrade over time, eventually leading to failure at a specific moment. To address these types of wear-and-tear failures, the concept of survival analysis [31], originally developed in the medical field, has been adapted to develop health condition warnings for industrial systems. Survival analysis is commonly employed to estimate the probability that a time-to-event, such as system failure, occurs before a certain time , provided that it has not occurred earlier. Utilizing historical data from failed pump jack systems in the oil field, survival analysis methods are applied to derive the hazard function for the oil production system. This hazard function quantifies the instantaneous probability that a specified failure event will occur at time , conditioned on the event not having occurred prior to . The mathematical formulation of the hazard function is given by
where represents the failure time. The hazard function effectively measures the rate of failure at time , assuming survival until that point. In tandem with the risk function, survival analysis also employs the survival function, which is fundamental in quantifying the likelihood that the system will continue to operate beyond a certain time without failure. The survival function can be derived from the hazard function, which can be written as
The survival function curve and the hazard function curve are shown in Figure 7.
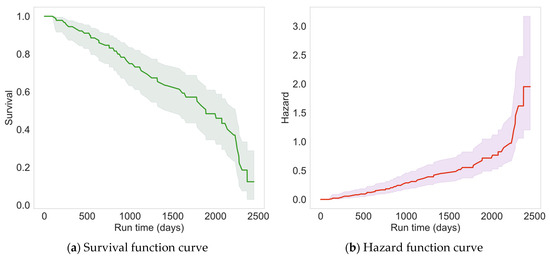
Figure 7.
Schematic diagram of survival function curve and hazard function curve.
Another critical concept in survival analysis is the hazard ratio (HR) [32], an essential statistical metric that quantifies the impact of various operational parameters on the likelihood of system failure. The hazard ratio for each variable indicates the relative risk of failure for every unit increase in that variable, holding all other factors constant. For instance, a hazard ratio greater than 1.0 suggests that an increase in the variable is associated with an increased risk of failure in the oil production system, whereas a hazard ratio of less than 1.0 indicates a protective effect. Understanding the hazard ratios of different variables is pivotal in guiding the optimization of the health status of oil production systems. The hazard ratio for each variable of the oil production system is shown in Figure 8.
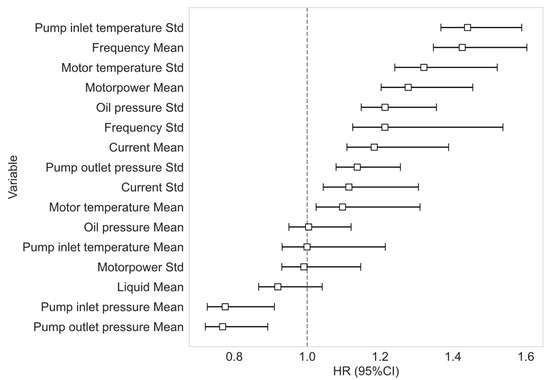
Figure 8.
Hazard ratio of different variables.
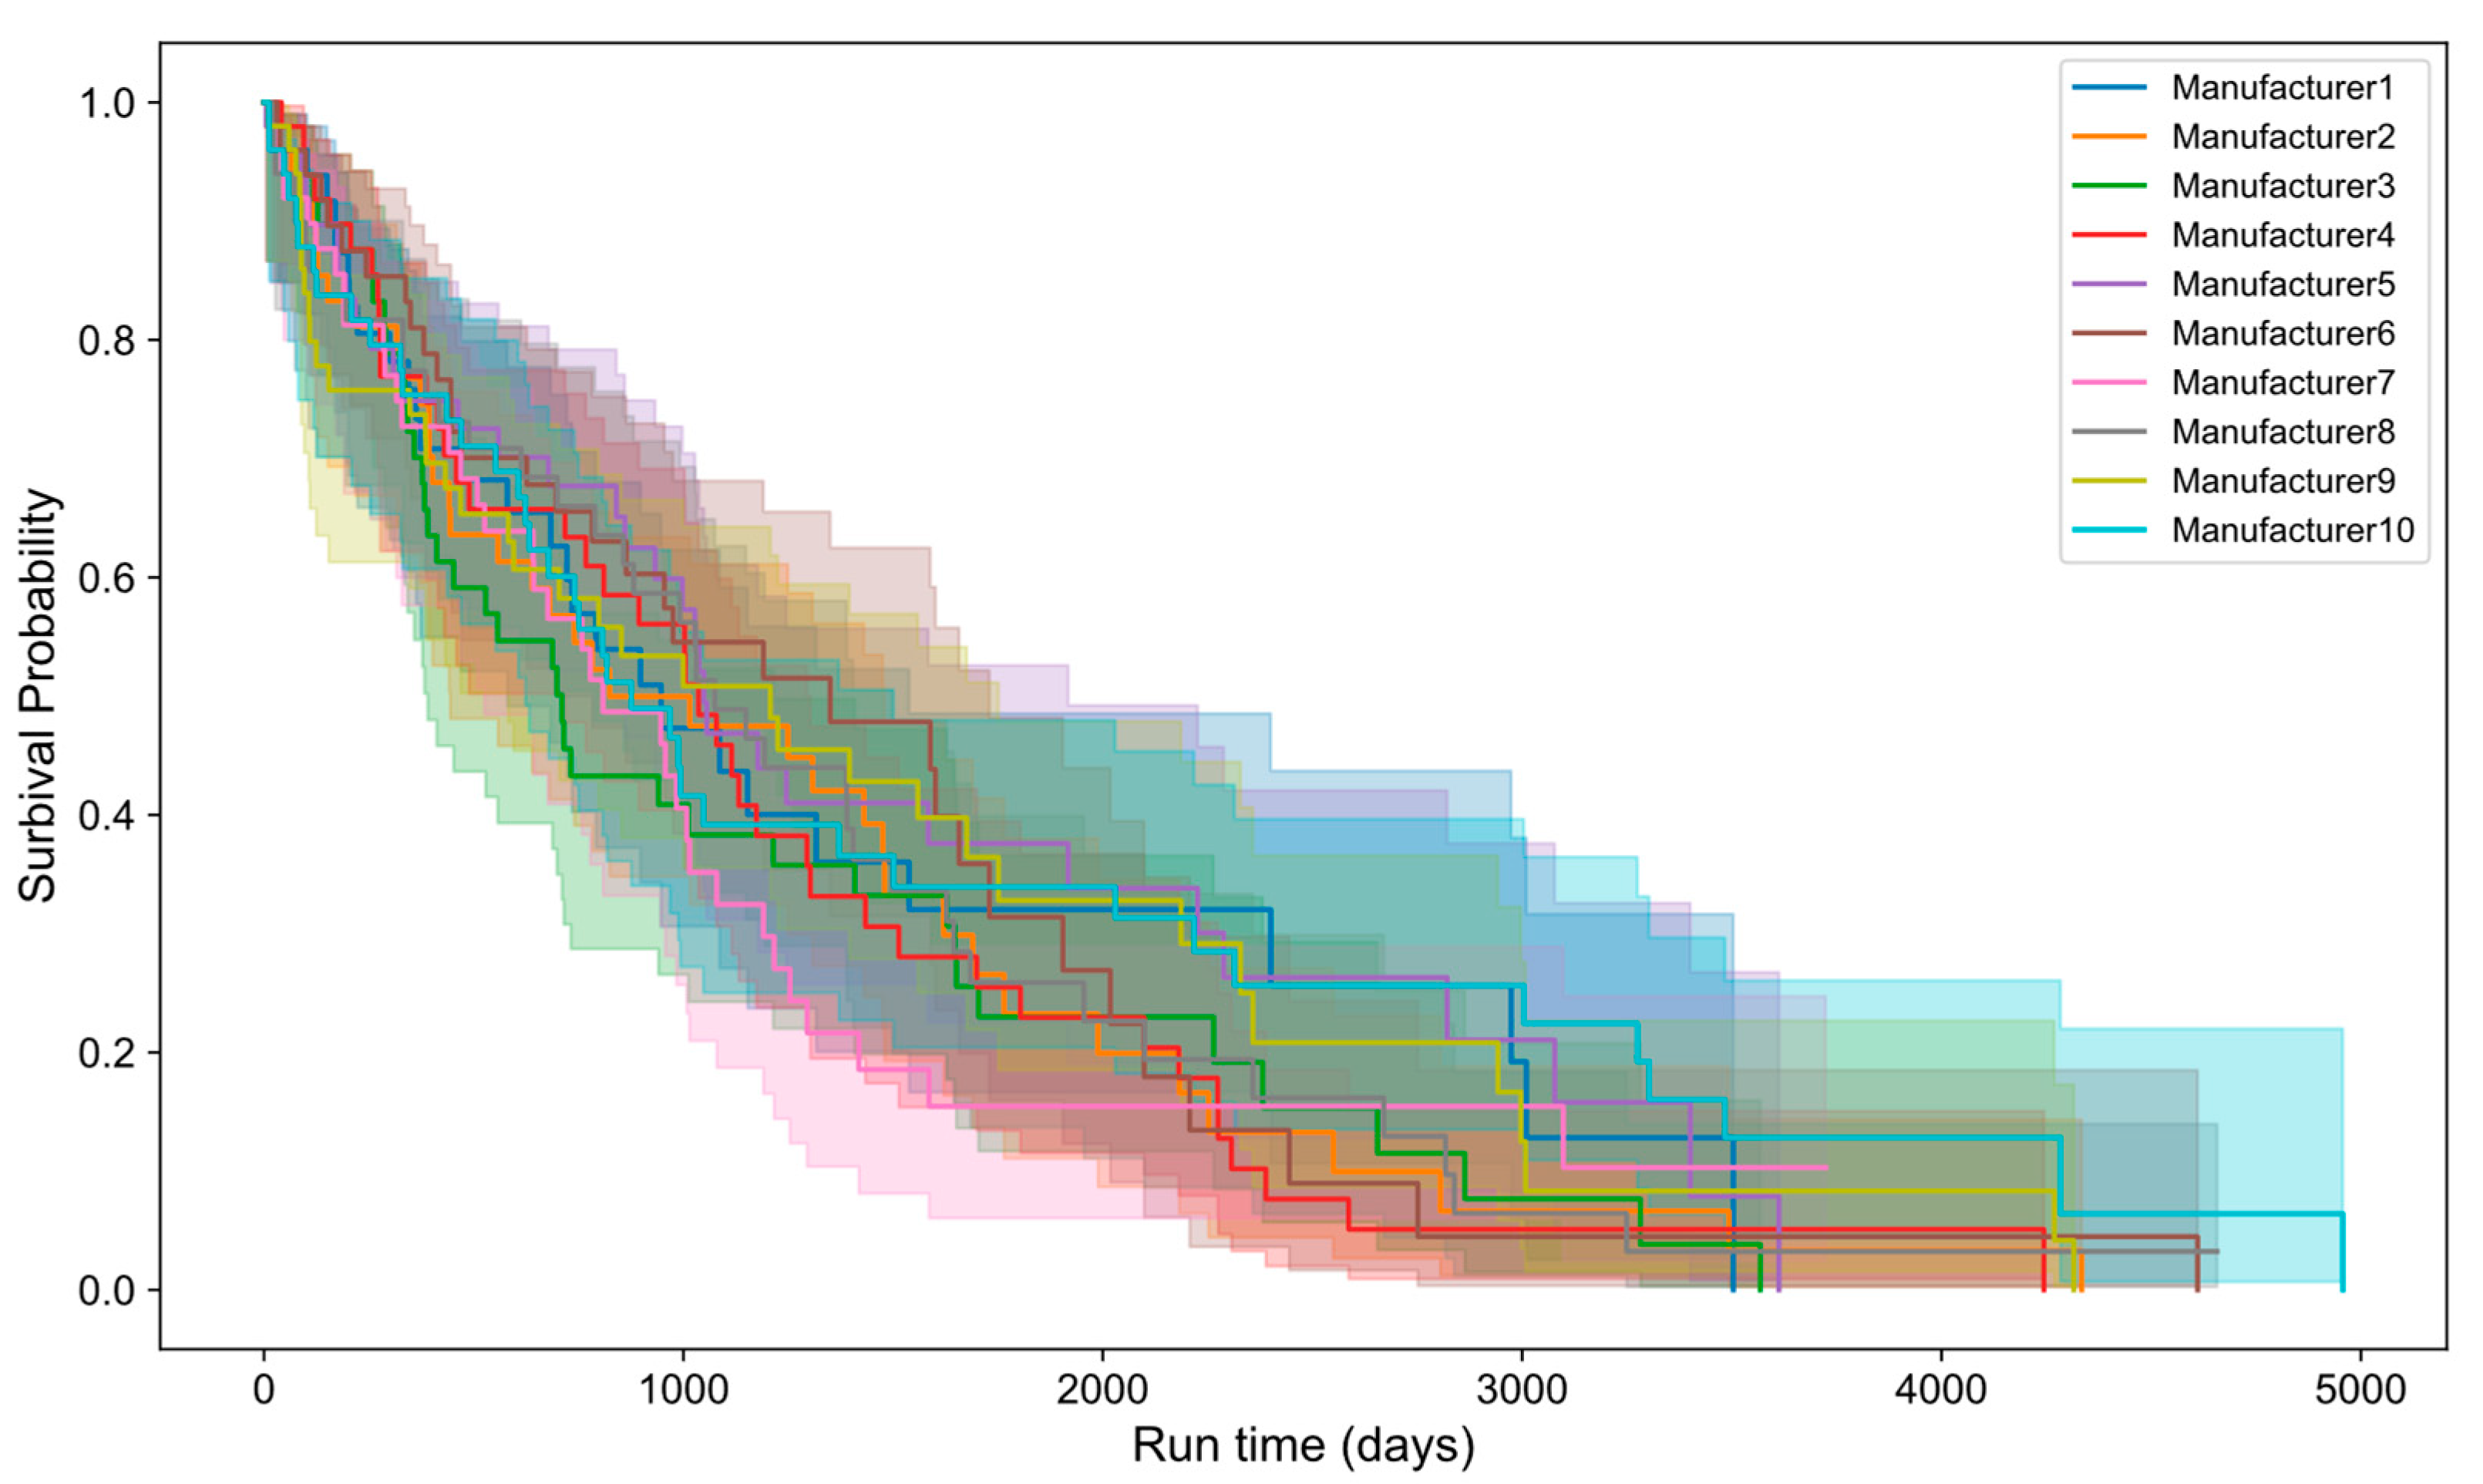
Furthermore, survival analysis offers a robust framework for examining the effects of specific variables on the system’s survival probability. This analytical approach is instrumental in identifying not just when failures are likely to occur but also how different factors contribute to the risk of such failures. As illustrated in Figure 9, the analysis extends to evaluating the impact of various machine production equipment manufacturers on the survival probability of the system.

Figure 9.
The impact of different machine production equipment manufacturers on the system survival probability.
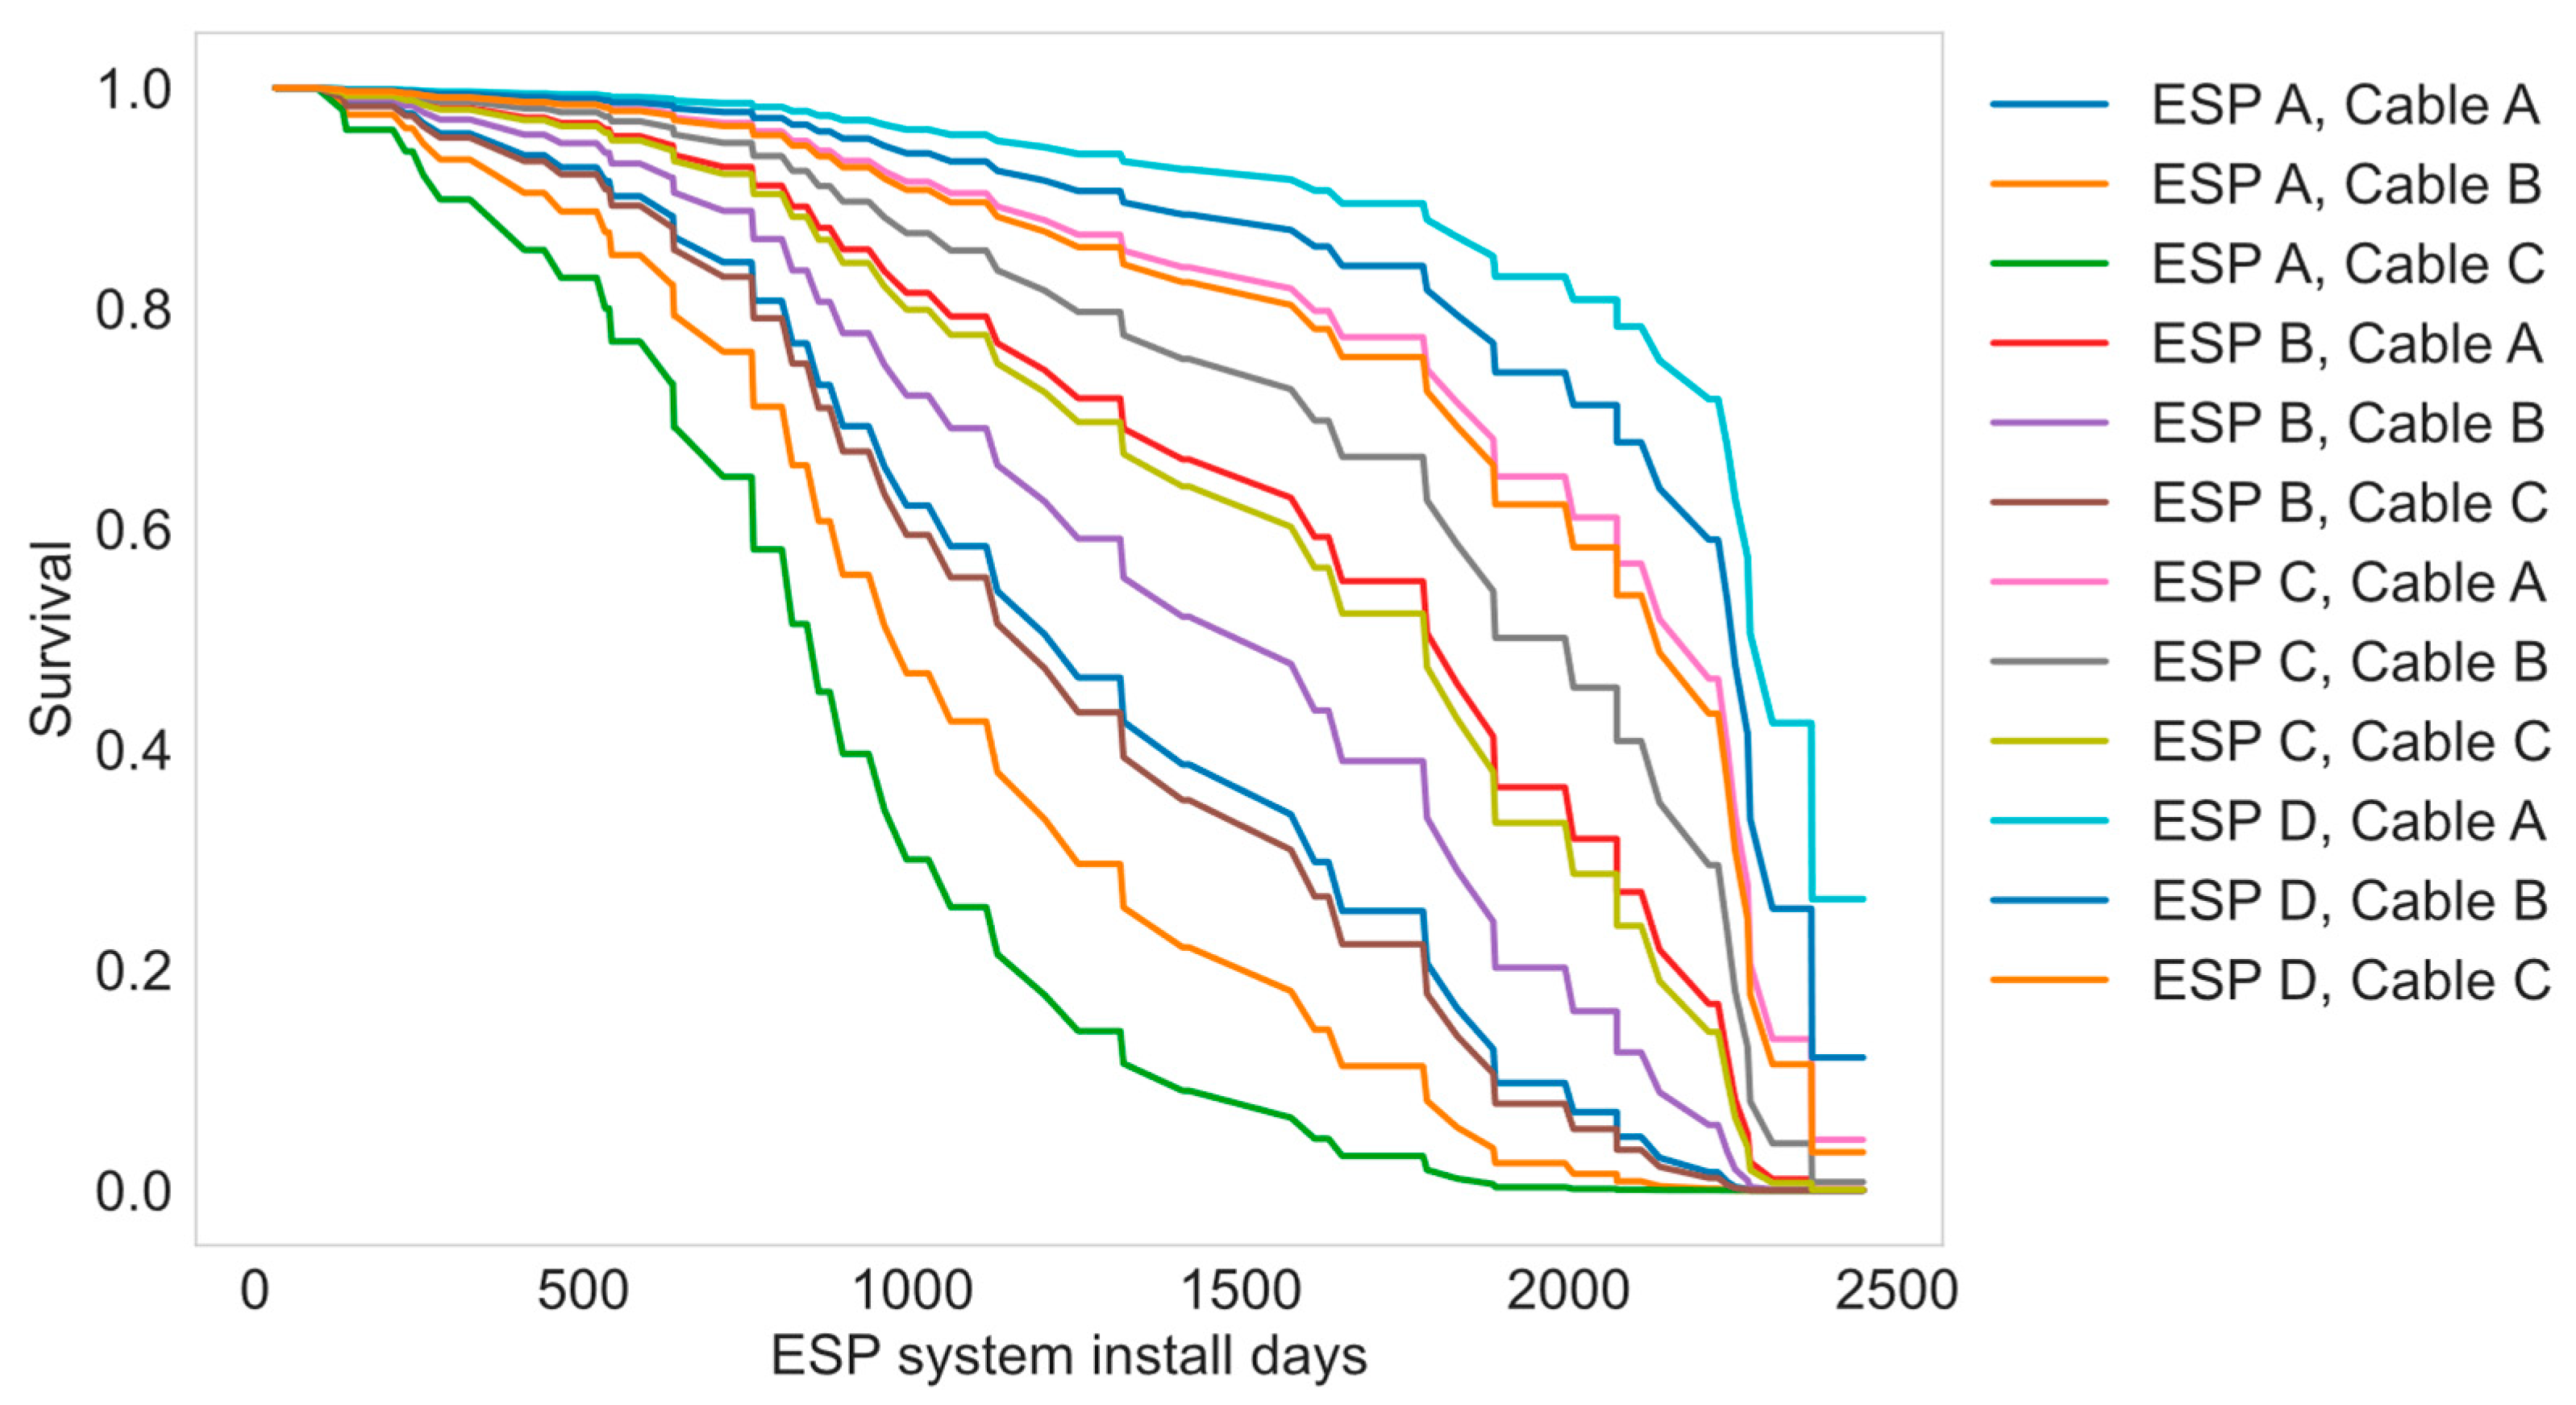
Thanks to the multivariate analysis capabilities of survival analysis [33], it is also possible to optimize the best combination of equipment. Figure 10 illustrates the survival probabilities for different ESP manufacturers and different cable manufacturer combinations.
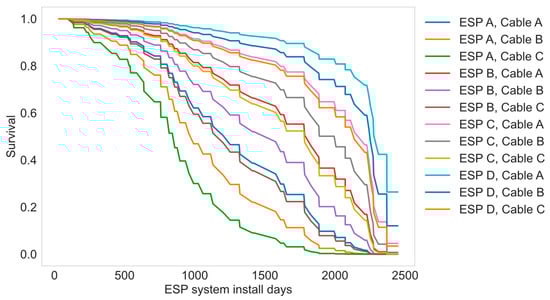
Figure 10.
Comparison of survival curves for different combinations of ESP manufacturer and cable manufacturer.
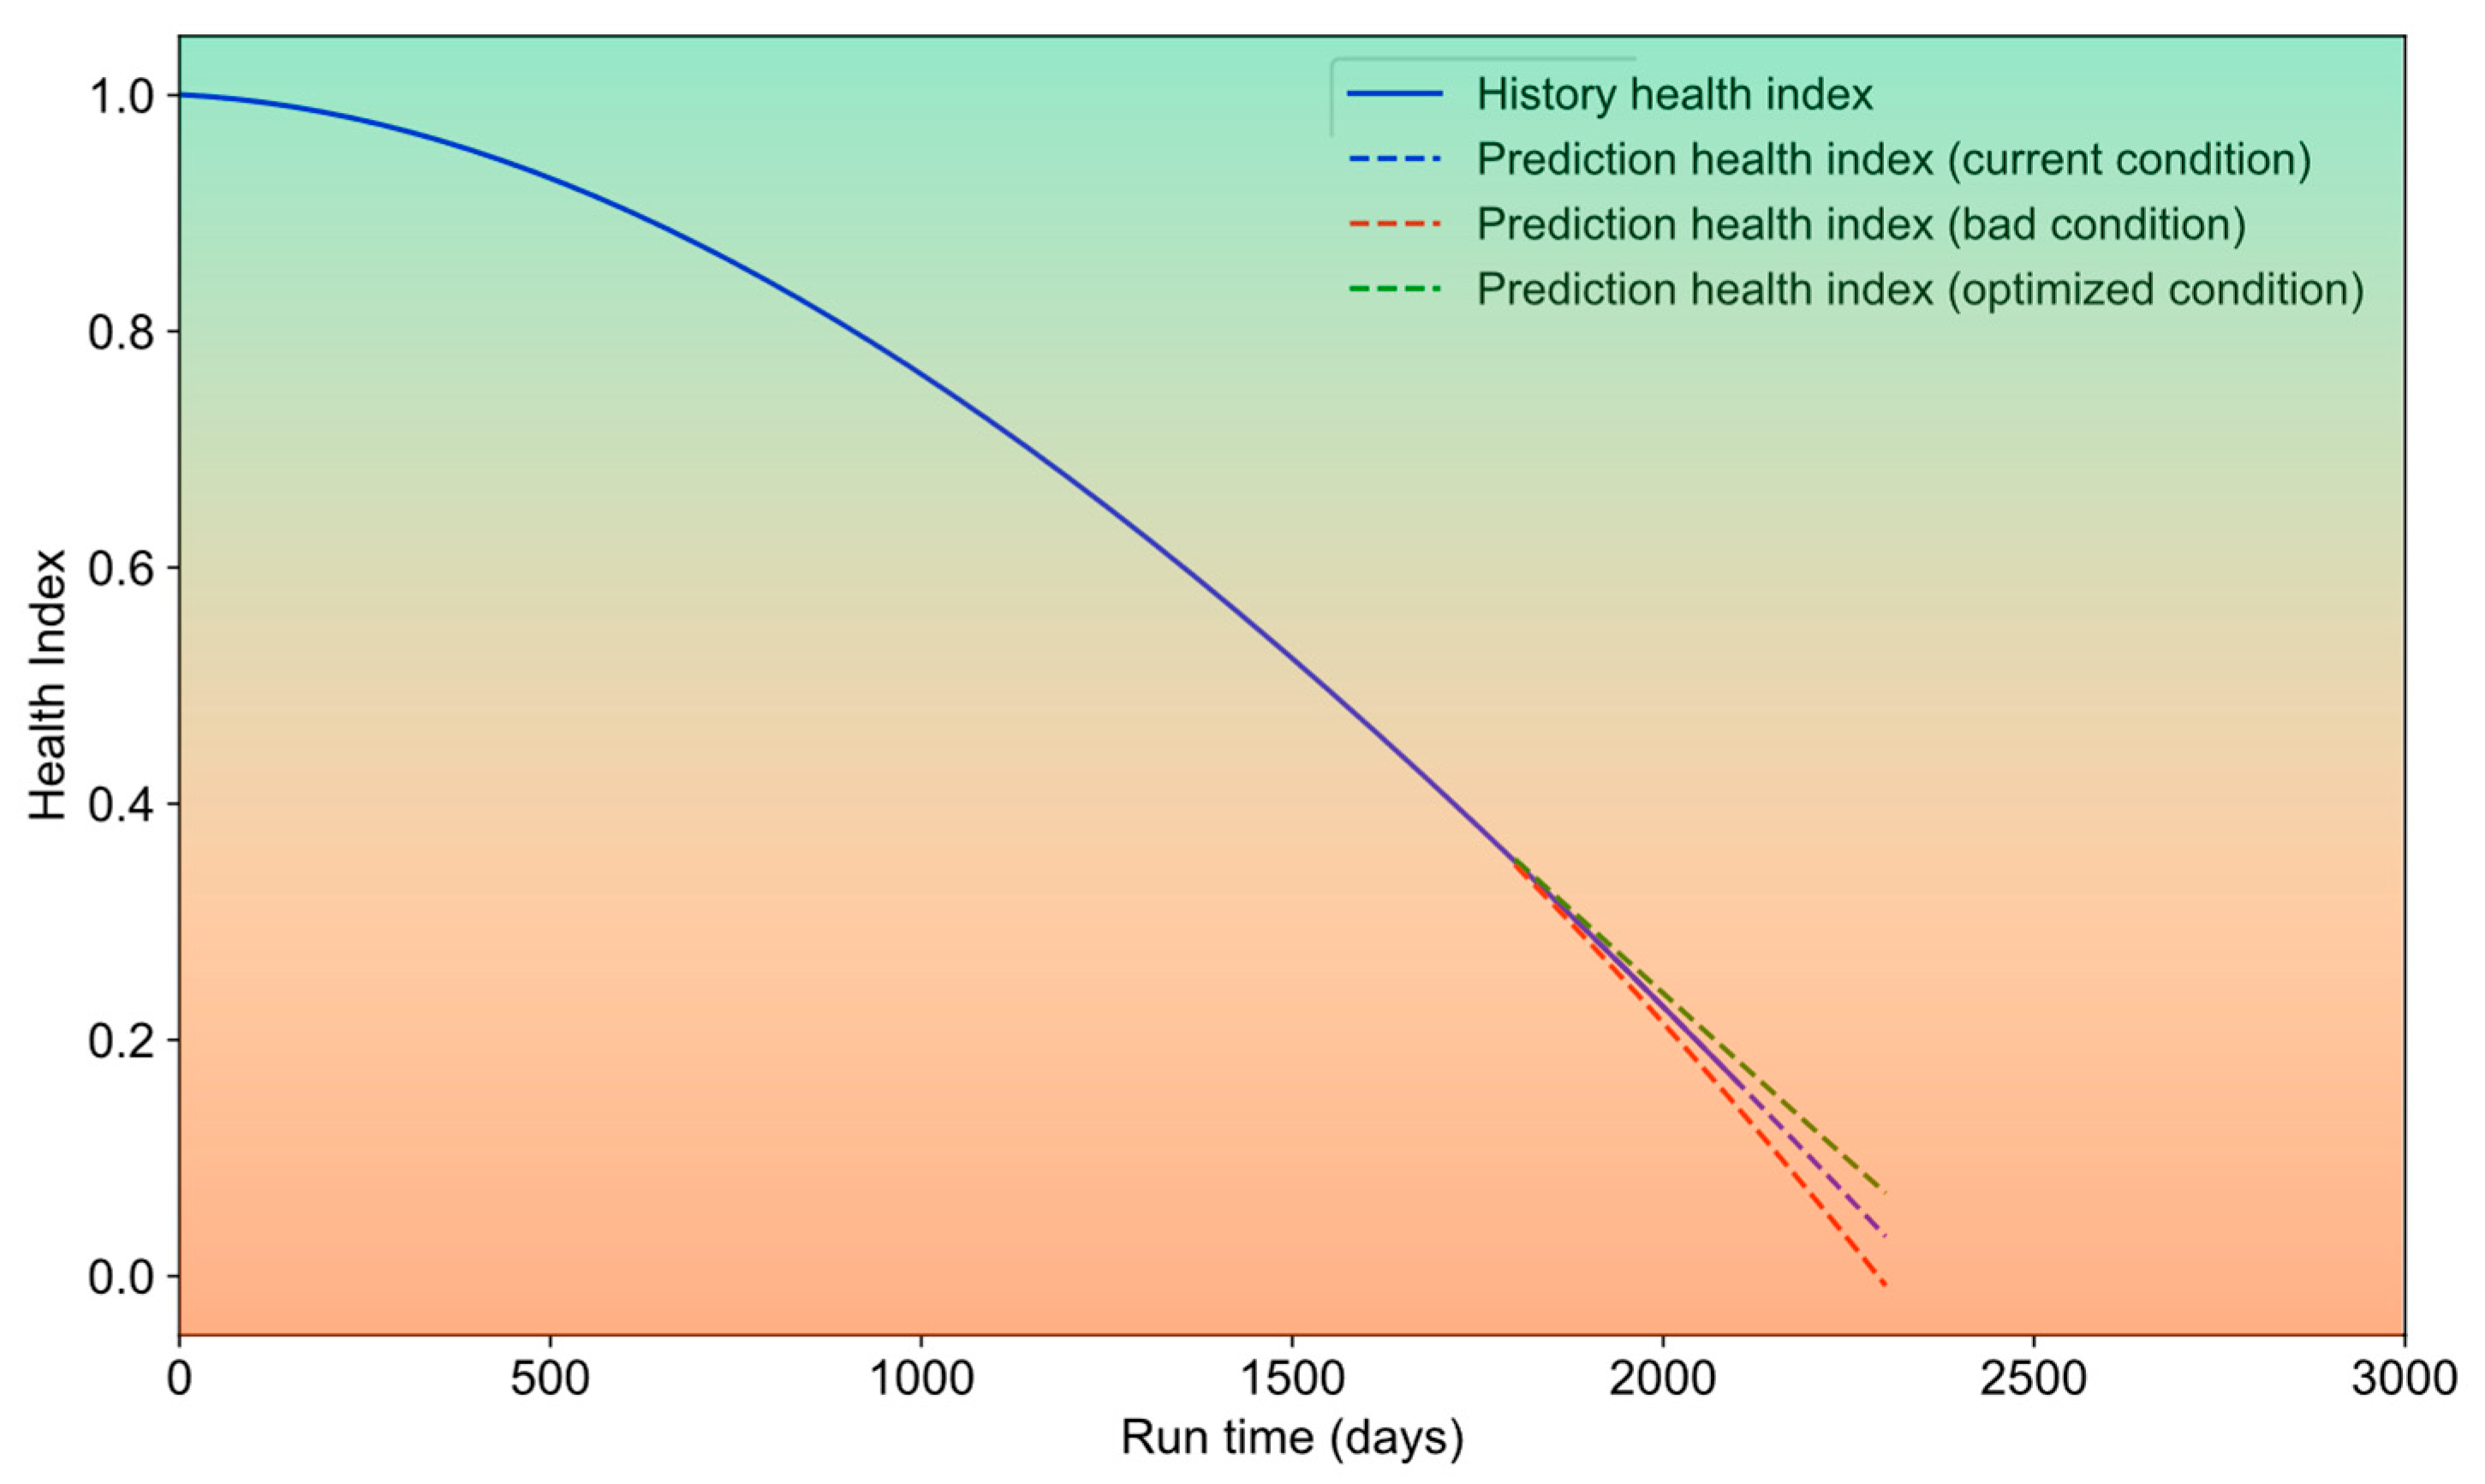
Under the guidance of the hazard ratio analysis, the operating parameters of the oil production system can be optimized so that the operating parameters are in a range that is less harmful to the oil production system. This optimization helps to enhance the survival probability or overall health status of the oil production system. The optimization results based on survival analysis for oil production systems are shown in Figure 11.
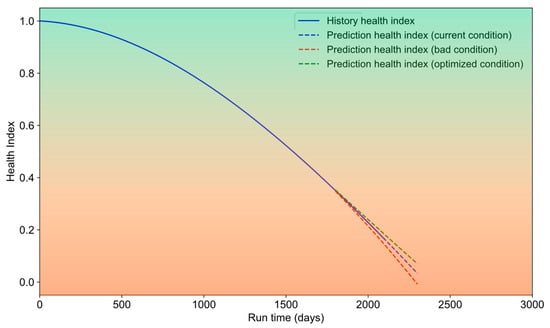
Figure 11.
The result of health state optimization.
This method represents a significant advancement over traditional oilfield equipment health monitoring techniques. Traditional methods typically rely on threshold-based monitoring or condition-based maintenance, where operators track individual parameters (such as temperature, pressure, or vibration) and trigger maintenance actions when these parameters exceed predefined thresholds. While this approach is simple and widely used, it often fails to predict failures caused by gradual system degradation, as it does not take into account the accumulation of wear-and-tear over time. In contrast, survival analysis offers a more nuanced approach by estimating the time-to-failure based on historical data and allowing for the prediction of failure probabilities over time. This approach does not rely solely on real-time parameter monitoring; instead, it integrates past operational data to model the likelihood of failure, offering a predictive advantage over traditional threshold-based methods. Furthermore, survival analysis allows for the continuous assessment of system health, helping operators understand the remaining useful life of equipment and enabling proactive maintenance strategies that are not limited to responding to exceedance of simple thresholds.
3.2.4. Intelligent Comprehensive Warning
In the complex and demanding environment of oil production, sudden equipment failures such as sand jams and pump shaft breakages present significant operational challenges. These failures can abruptly render systems inoperable, causing costly downtimes and safety risks. Traditional mechanistic models often fall short in predicting these types of rapid malfunctions due to their unpredictable nature. To address this critical issue, we have employed an advanced predictive technique using long short-term memory (LSTM) [34] networks to estimate the remaining useful life (RUL) [35] of the oil production system. The definition of remaining useful life is as follows:
where denotes the RUL at the time ; is the failure time; and is the current time. LSTM networks, a specialized type of recurrent neural network, are well-suited for analyzing time-series data, a common characteristic of operational equipment data streams. Unlike standard neural networks, LSTMs are designed to remember and utilize past information over extended periods, which is pivotal for recognizing complex patterns and dependencies in sequential data. This capability is particularly crucial in environments where operational conditions can vary significantly, influencing the wear and performance of critical components. Thus, utilizing the feature extraction capabilities and temporal dependencies of LSTM, a method for predicting the remaining life of the oil production system based on LSTM networks has been constructed. The model is set up with six layers, employing two LSTM layers to extract sequence information; a batch normalization layer is used to unify dispersed data, making it easier to learn data patterns; and a DropOut layer is included to improve the model’s overfitting phenomenon. The network structure of the model is shown in Figure 12.
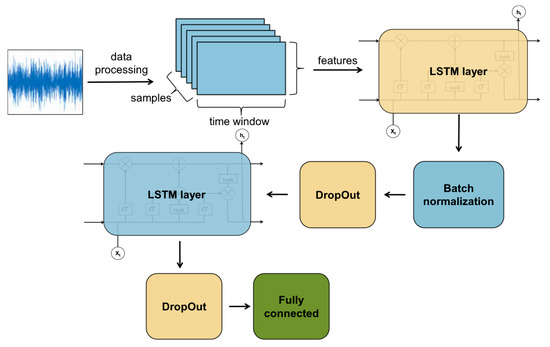
Figure 12.
The structure of the RUL prediction network.
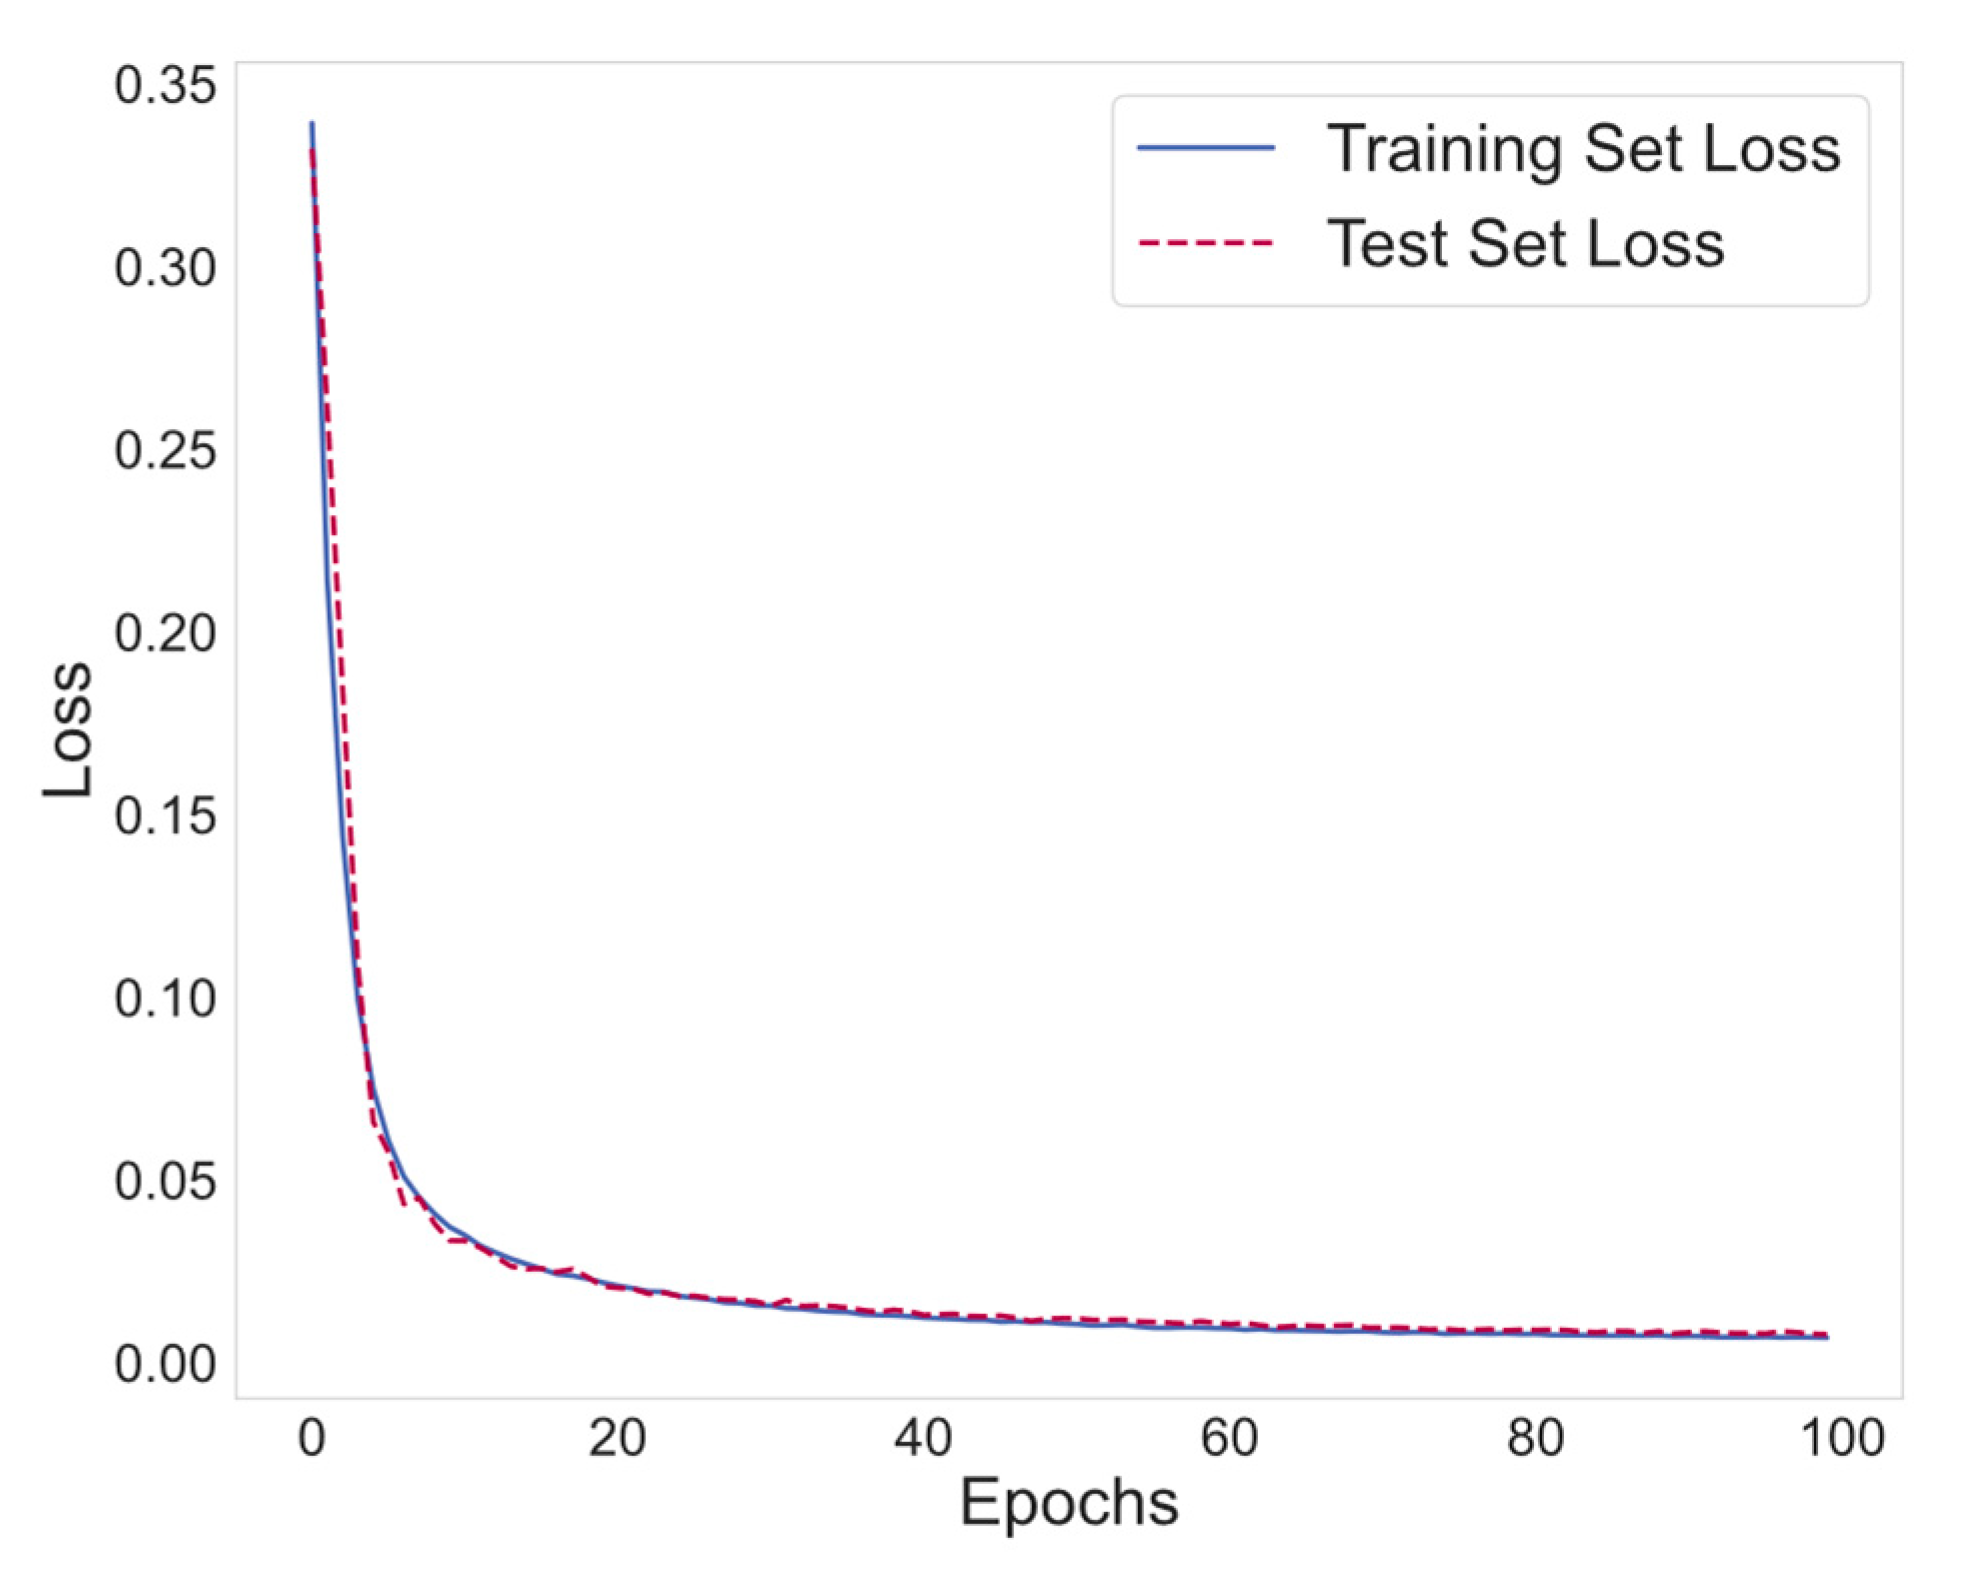
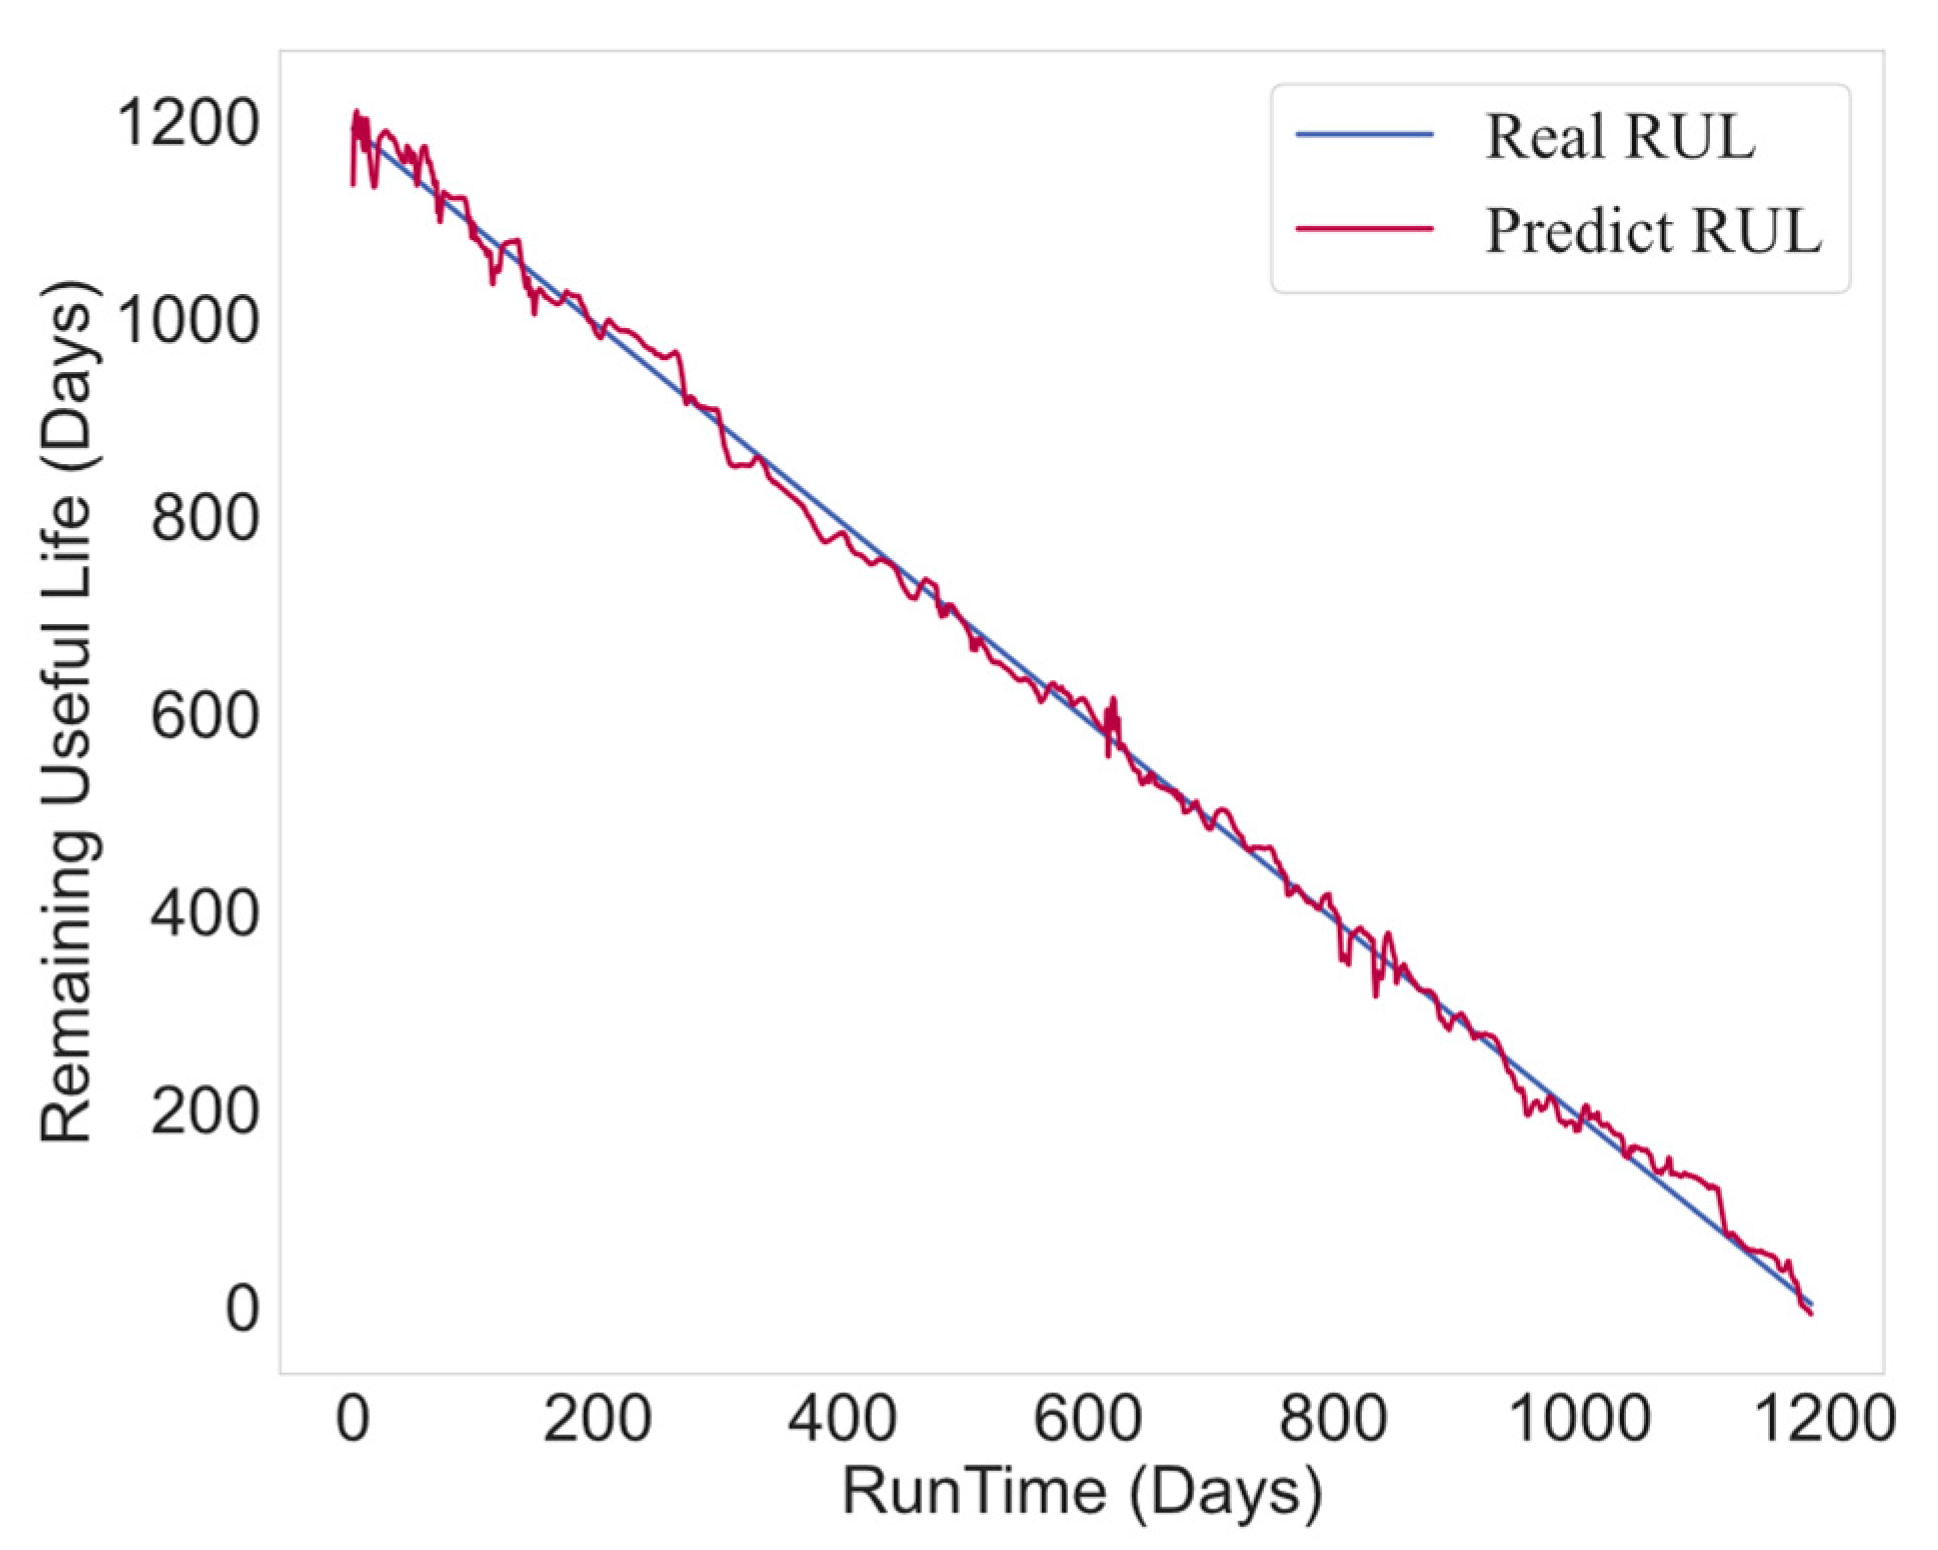
By leveraging a vast repository of historical data from failed production systems, the RUL prediction network has achieved remarkable accuracy. This high level of precision in predictions is evidenced by the low training set error rate of 0.0126 and a similarly low validation set error of 0.0145, indicating the model’s robustness and its capability to generalize well on unseen data. The performance of the network during training is documented in Figure 13, which details the trend of decreasing error rates as the model iteratively learns and adjusts its parameters. Furthermore, the effectiveness of this predictive model is visually represented in Figure 14, which displays the remaining life prediction curve. This curve illustrates the estimated operational lifespan of the system based on current operational conditions and historical failure patterns. The graph provides a clear, intuitive visualization of how long the equipment is expected to perform before requiring maintenance or reaching the end of its service life, enabling proactive decision-making in maintenance scheduling.
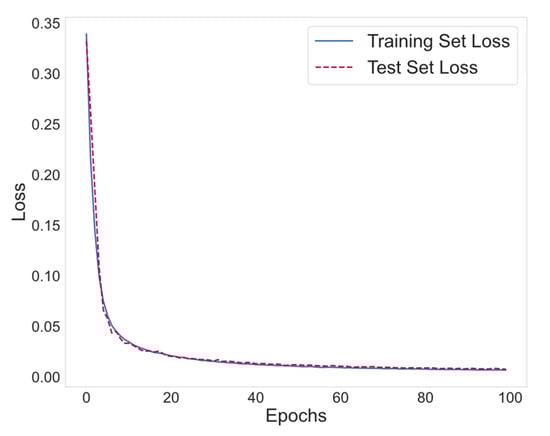
Figure 13.
Training error of prediction network.
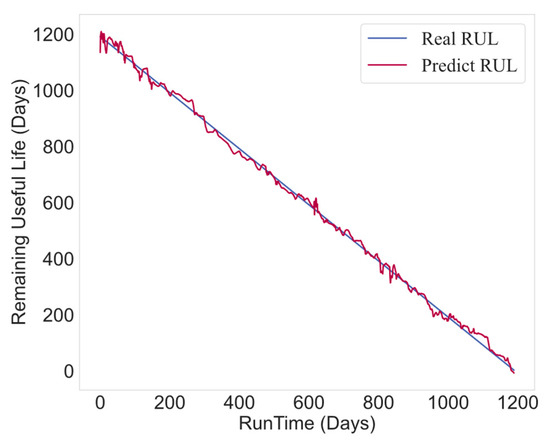
Figure 14.
Remaining life prediction curve.
This method significantly differs from traditional fault detection and equipment life prediction approaches commonly used in oilfield operations. Traditional methods typically rely on rule-based or threshold-based approaches, where fixed limits are set for key operational parameters like temperature, pressure, and vibration. When these parameters exceed predefined thresholds, maintenance or corrective actions are triggered. While effective in some cases, these traditional methods are reactive and often unable to predict sudden, unexpected failures like sand jams or pump shaft breakages, which may occur without any clear prior signs. In contrast, the LSTM-based approach is predictive and proactive. By analyzing historical time-series data, the model can identify patterns and trends that may not be immediately obvious through simple parameter monitoring. LSTMs excel in capturing long-term dependencies and subtle changes in operational conditions, allowing for the more accurate prediction of equipment degradation and failure. This predictive capability enables operators to take action before failures occur, reducing downtime and maintenance costs and improving overall system reliability.
3.3. Proactive Analysis Workflow
The automatic monitoring workflow, by design, identifies high-risk wells and seamlessly transmits their data to the proactive analysis workflow for further examination. This subsequent phase involves a tiered approach to diagnostics, employing various levels of analytical rigor tailored to the specific risk profile of each well. It also focuses on optimizing operational parameters to enhance safety, efficiency, and productivity.
3.3.1. Single Well Working Point Analysis
The intelligent oil production systems fully utilize measured values of temperature and pressure from specific locations within the wellbore, alongside parameters related to geological formations, fluid properties, and well structure. By leveraging the principles of multiphase flow mechanics, the system executes precise calculations and fittings to modify the temperature and pressure distributions along the wellbore. These adjusted distributions serve as a reliable computational basis for further in-depth analyses, enabling a robust evaluation of wellbore conditions.
Furthermore, the system features a single well working point analysis module, which visually represents the production system. This module facilitates an intuitive display that allows users to conveniently monitor the operational status of various production units within the system. Through this visualization, users can easily access and interpret data, enhancing their ability to quickly identify and address potential issues in the production process. The single well working point analysis is shown in Figure 15.
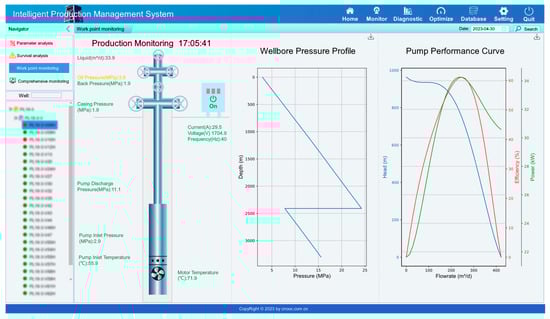
Figure 15.
The single well working point analysis.
By providing a clear and comprehensive view of the production system, the module supports informed decision-making and strategic operational adjustments, thereby increasing the overall productivity and safety of the oil production process.
3.3.2. Single Well Condition Identification
In the context of the intelligent oil production system, the rapid identification and diagnosis of high-risk wells are crucial for maintaining operational efficiency and preventing potential failures. However, traditional diagnostic methods, often reliant on manual inspection and rudimentary data analysis techniques, are not only time-consuming but also prone to inaccuracies, especially in complex systems where multiple variables influence outcomes. These conventional approaches lack the capacity to analyze large datasets effectively, resulting in delayed responses and the potential oversight of subtle anomalies that could precede critical failures. To address the limitations of traditional methods, the intelligent oil production system integrated an online current signature diagnosis feature, which utilizes sophisticated feature engineering methods to extract significant characteristics from the current data during the operation of oil production equipment. Upon the detection of a high-risk well, the system leverages advanced diagnostic technology to swiftly analyze and pinpoint abnormal conditions.
The technology processes various key features, including the mean current, fluctuation amplitude, cumulative fluctuation amplitude, the kurtosis of current fluctuations, fluctuation intensity, and non-zero value duration, among others. These features are derived from both the time domain and waveform characteristics of the current, providing a comprehensive view of the electrical behavior of the oil production equipment. This detailed analysis aids in distinguishing normal operational conditions from potential faults. Subsequently, these extracted features are input into a backpropagation (BP) neural network [36], a type of machine learning model renowned for its efficiency in pattern recognition and fault diagnosis. The BP neural network is trained on both internal fault condition data and external fault samples, enhancing its ability to generalize and accurately identify fault conditions across different wells. This process of continuous learning and adaptation enables the neural network to refine its diagnostic capabilities, ensuring precise and expedited fault detection. The single well condition identification module is shown in Figure 16.
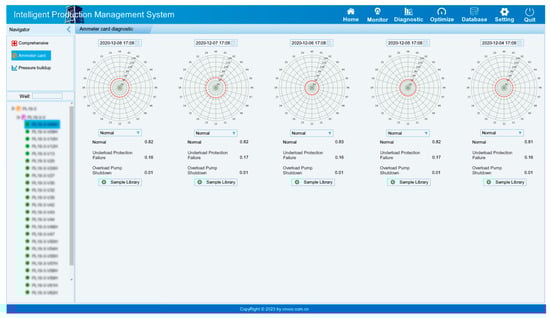
Figure 16.
The single well condition identification module.
It is worth stating that the fault sample library for the single well condition identification function can dynamically expand as production continues, allowing for the continuous integration of new fault data into the existing database. As the system encounters new and varied fault conditions, these instances are captured and added to the library, enriching the dataset with a broader spectrum of fault scenarios. This ever-expanding fault sample library significantly improves the system’s diagnostic capabilities. With each new fault condition added, the machine learning models, particularly the neural networks employed for fault diagnosis, can learn from a wider array of data. This process of continuous learning enables the models to adapt to evolving conditions and more complex fault patterns, thereby increasing the accuracy and reliability of fault detections.
3.3.3. Macroscopic Control Chart
The macroscopic control diagram is an essential tool for optimizing the operation of the oil production system, as it provides a comprehensive visualization of dynamic well conditions, enabling efficient monitoring and decision-making. The need for such a diagram arises from the complex interplay between production parameters, pump performance, and reservoir dynamics, where imbalances can lead to issues such as inefficiencies, equipment damage, or production losses.
The diagram is created using a systematic approach: the x-axis represents the pump’s production rate, while the y-axis denotes the pump suction pressure or equivalent head, forming a coordinate system that defines five operational zones—optimal operating zone, oversized parameter zone, undersized parameter zone, data verification zone, and abnormal operating zone. These zones are delineated as follows: the optimal operating zone is identified by pump performance curves where suction pressure and production rate are well-balanced, ensuring efficient operation; the oversized parameter zone represents conditions with excessive production rates or insufficient suction pressure, indicating risks like cavitation or gas locking; the undersized parameter zone reflects low production rates and high suction pressures, often caused by underutilization or supply restrictions; the data verification zone captures operational points where measured parameters conflict, requiring further validation and recalibration; and the abnormal operating zone indicates extreme conditions such as pump overloading or insufficient fluid supply, potentially leading to operational failure. These boundaries are determined based on pump performance data, critical thresholds such as minimum suction pressure and maximum allowable flow rate, and historical or real-time production data, ensuring an accurate depiction of operational dynamics. The macroscopic control chart module is shown in Figure 17.
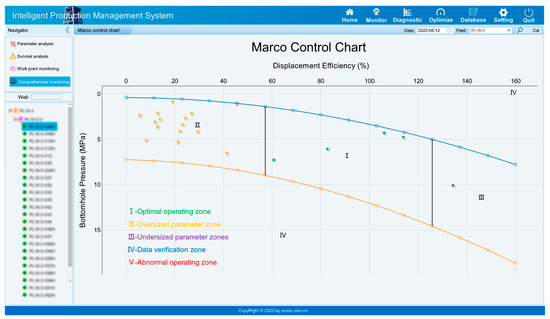
Figure 17.
Macroscopic control chart.
Furthermore, the diagram offers interactive functionality: by clicking on the coordinate point of a specific well that appears in an abnormal zone, operators can seamlessly navigate to a detailed single-well workpoint analysis or operational condition assessment interface. This capability facilitates a deeper investigation into the well’s specific parameters, such as pump efficiency, fluid production rate, and reservoir performance, allowing for precise troubleshooting and corrective action. In the context of intelligent oil recovery systems, this integration not only enhances real-time monitoring but also streamlines operational management by bridging macroscopic field-wide insights with microscopic well-specific analyses, ultimately improving overall production performance and operational reliability.
In the context of intelligent oil recovery systems, the macroscopic control diagram plays a pivotal role in enhancing decision-making and operational efficiency by enabling real-time monitoring, diagnosing faults, and optimizing pump parameters. This integration supports a smarter, more adaptive approach to oilfield management, reducing downtime and maximizing production performance.
3.3.4. Parameter Optimization Measures
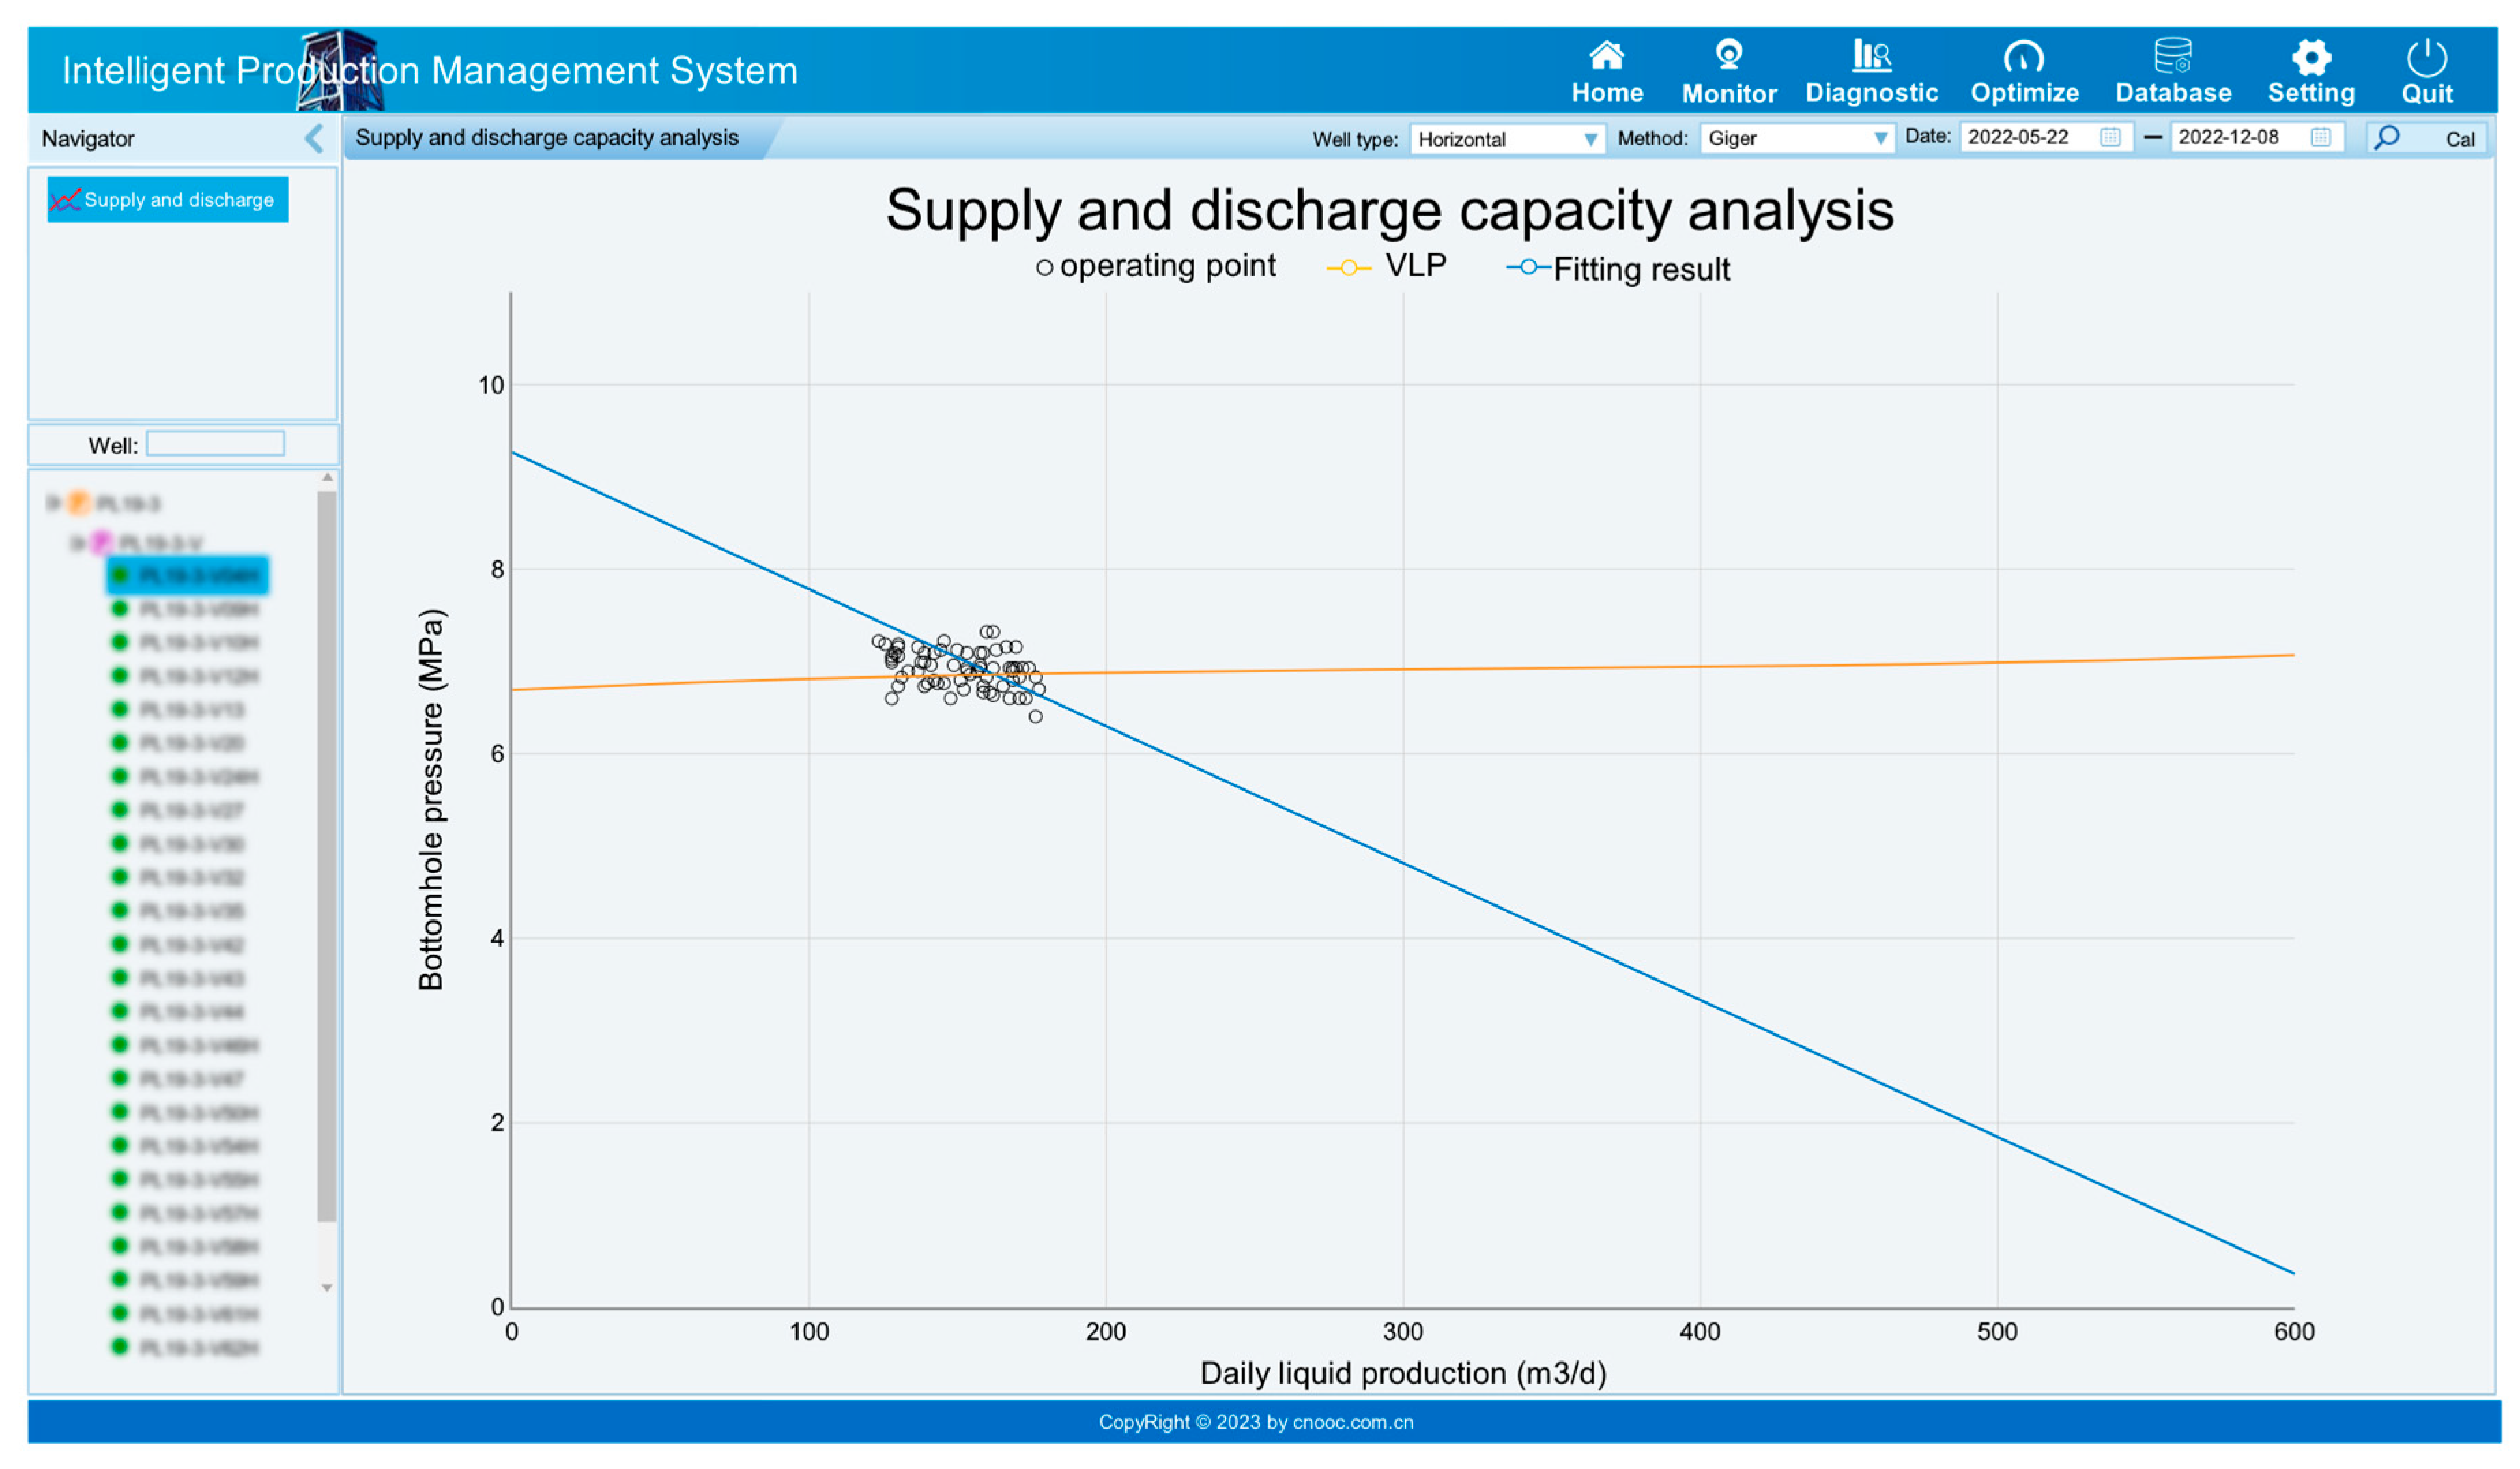
The supply and discharge capacity analysis module leverages a robust integration of historical production data, well structure information, reservoir fluid properties, and wellbore temperature and pressure calculation mechanisms to perform accurate IPR (inflow performance relationship) fitting and VLP (vertical lift performance) calculations for various well types. By harmonizing these complex parameters, the system determines coordinated production rates, providing a solid foundation for data-driven optimization design. The supply and discharge capacity analysis module is shown in Figure 18.
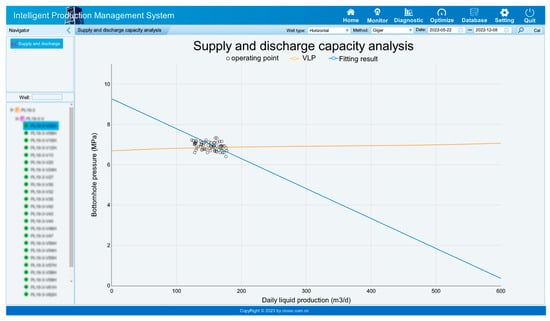
Figure 18.
Supply and discharge capacity analysis.
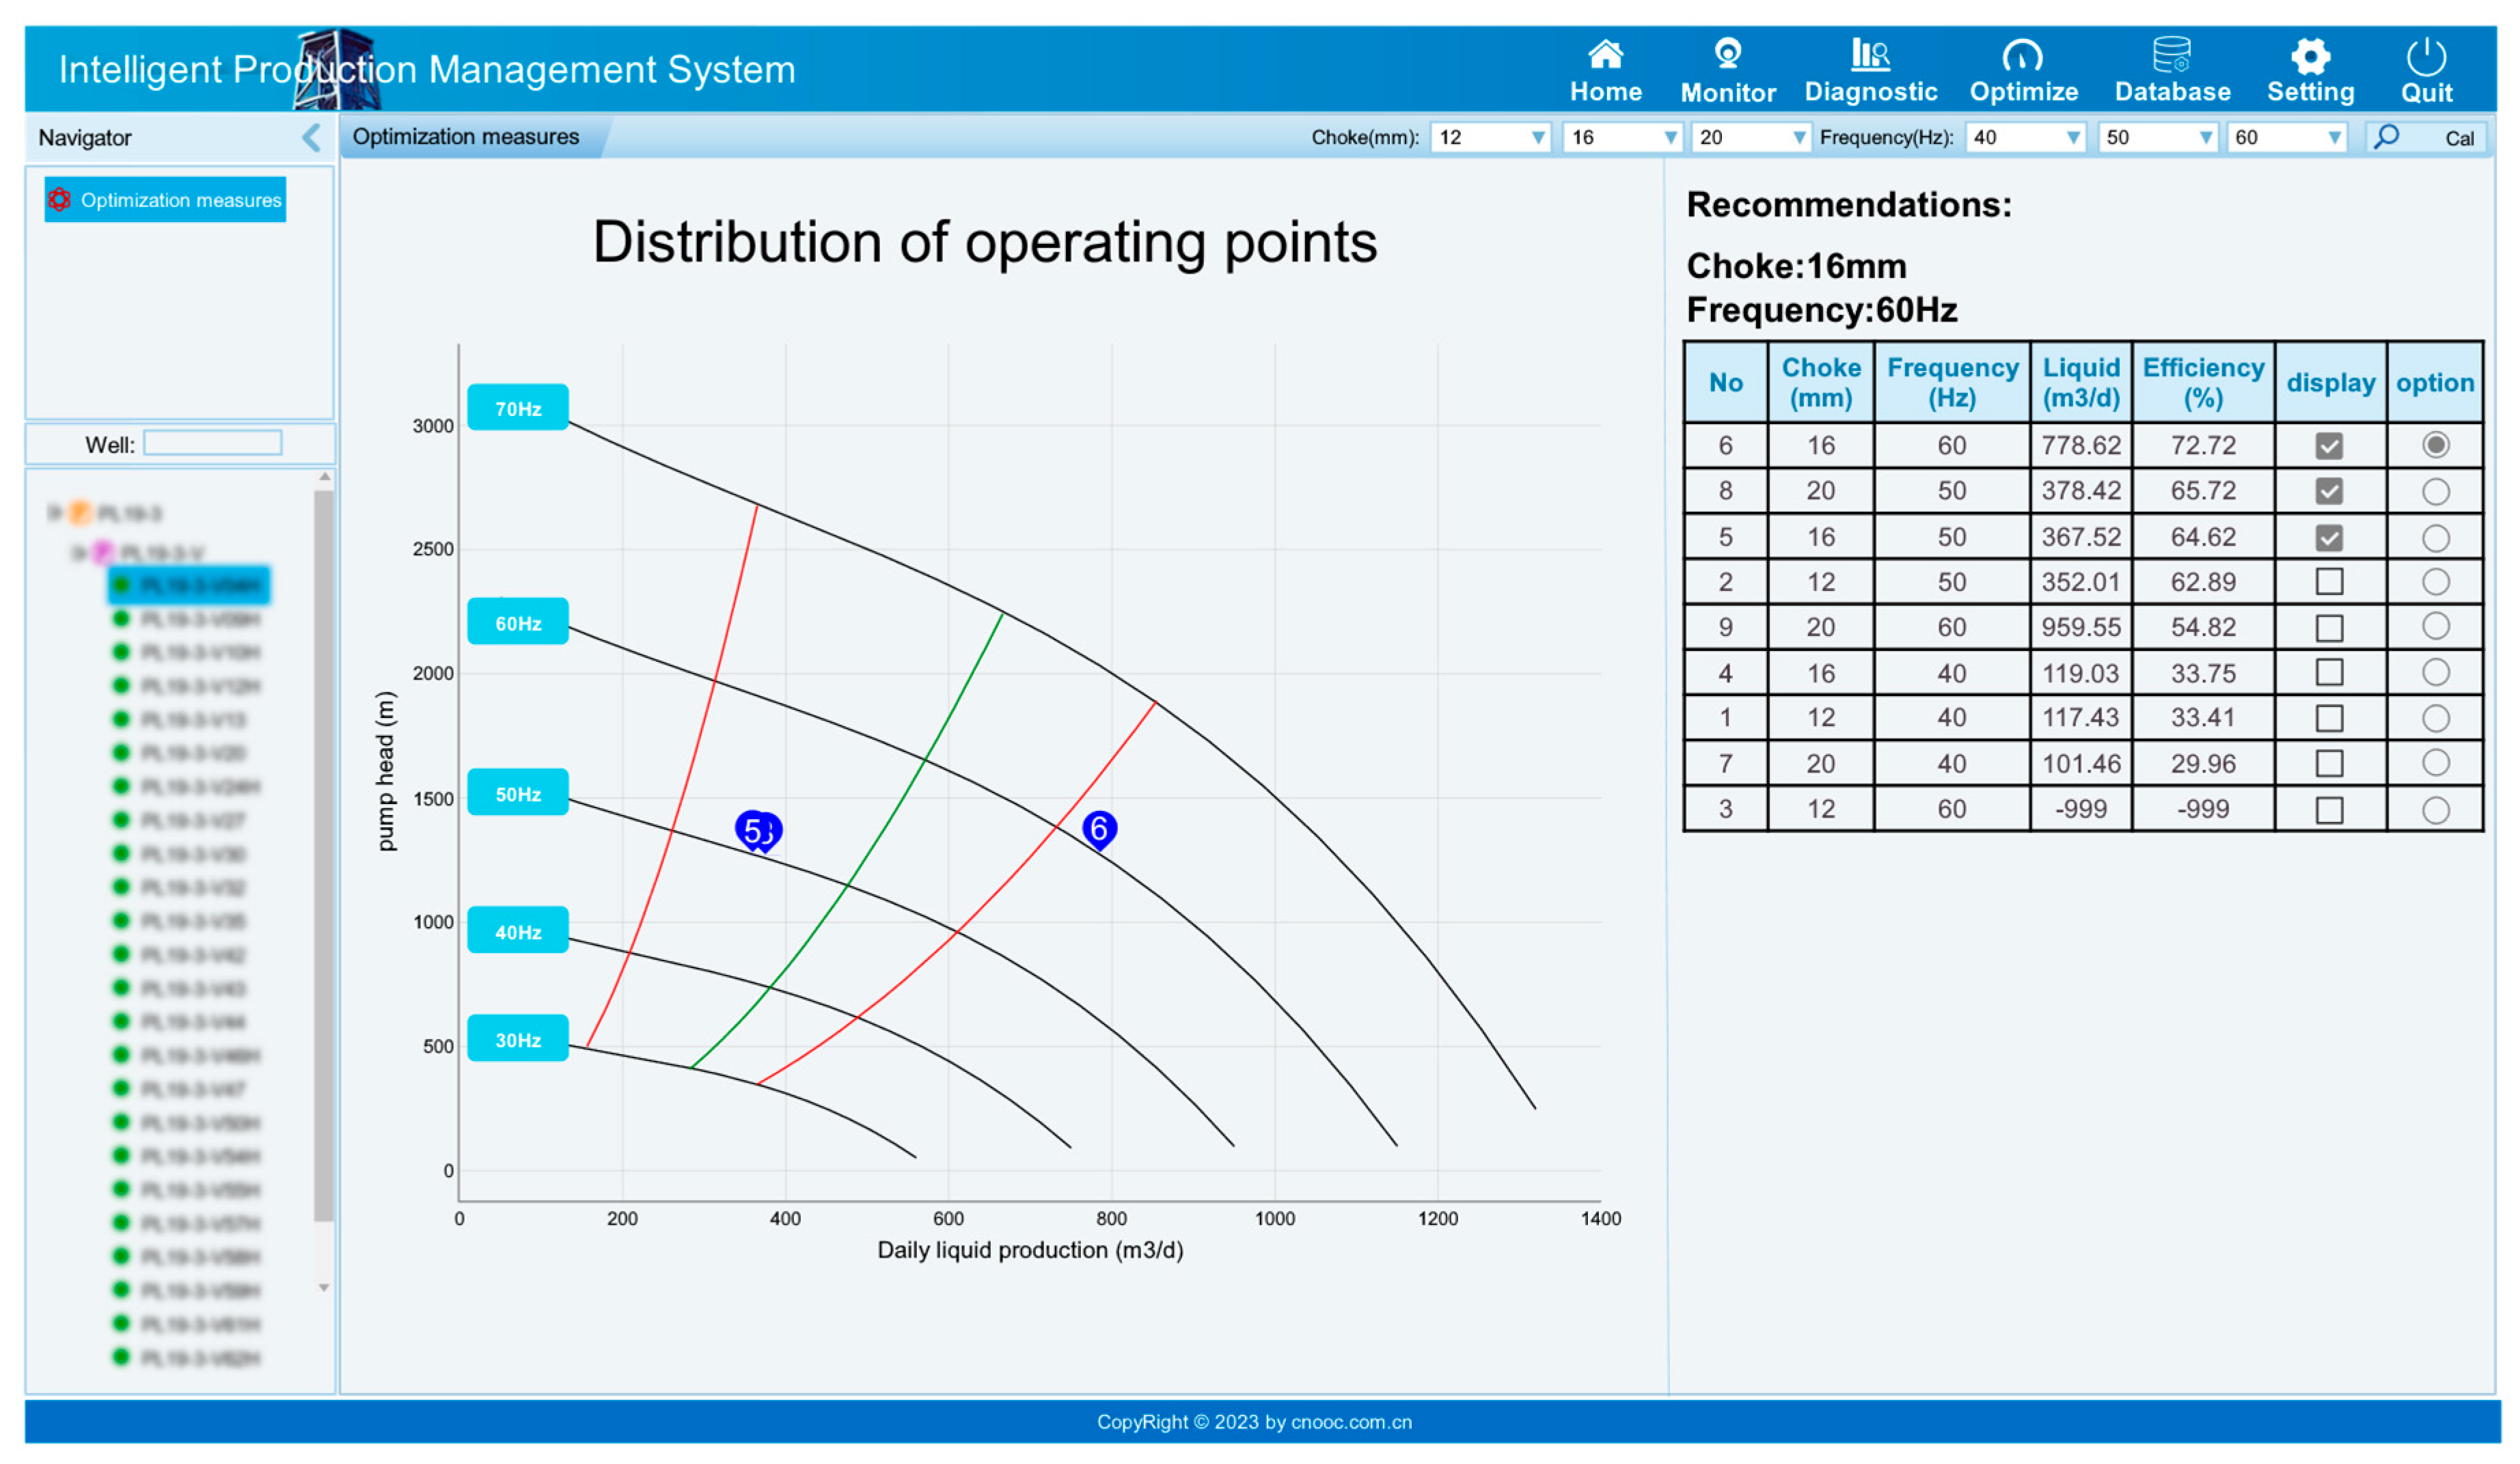
Through the application of advanced algorithms and multiple functional modules, the model enables automated optimization processes tailored to specific objectives, such as maximizing production efficiency, reducing energy consumption, or prolonging equipment lifespan. The resulting optimization schemes are dynamically generated and include a precise combinations of production parameters that align with operational goals. These schemes can be directly transmitted to the field production platform for real-time review, adjustment, and implementation by on-site staff, fostering a collaborative environment between automated systems and human oversight. The automated optimization module is shown in Figure 19. In addition to facilitating immediate operational improvements, this system promotes the gradual realization of long-term objectives, such as the intelligent and integrated development of oilfields. By continuously learning from updated production data and refining optimization strategies, it supports predictive maintenance, enhanced recovery methods, and adaptive responses to reservoir dynamics.
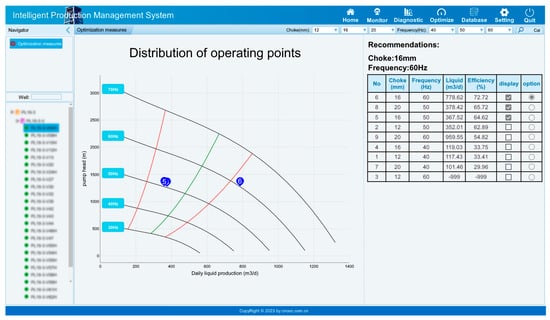
Figure 19.
Automated optimization module.
4. Application Examples
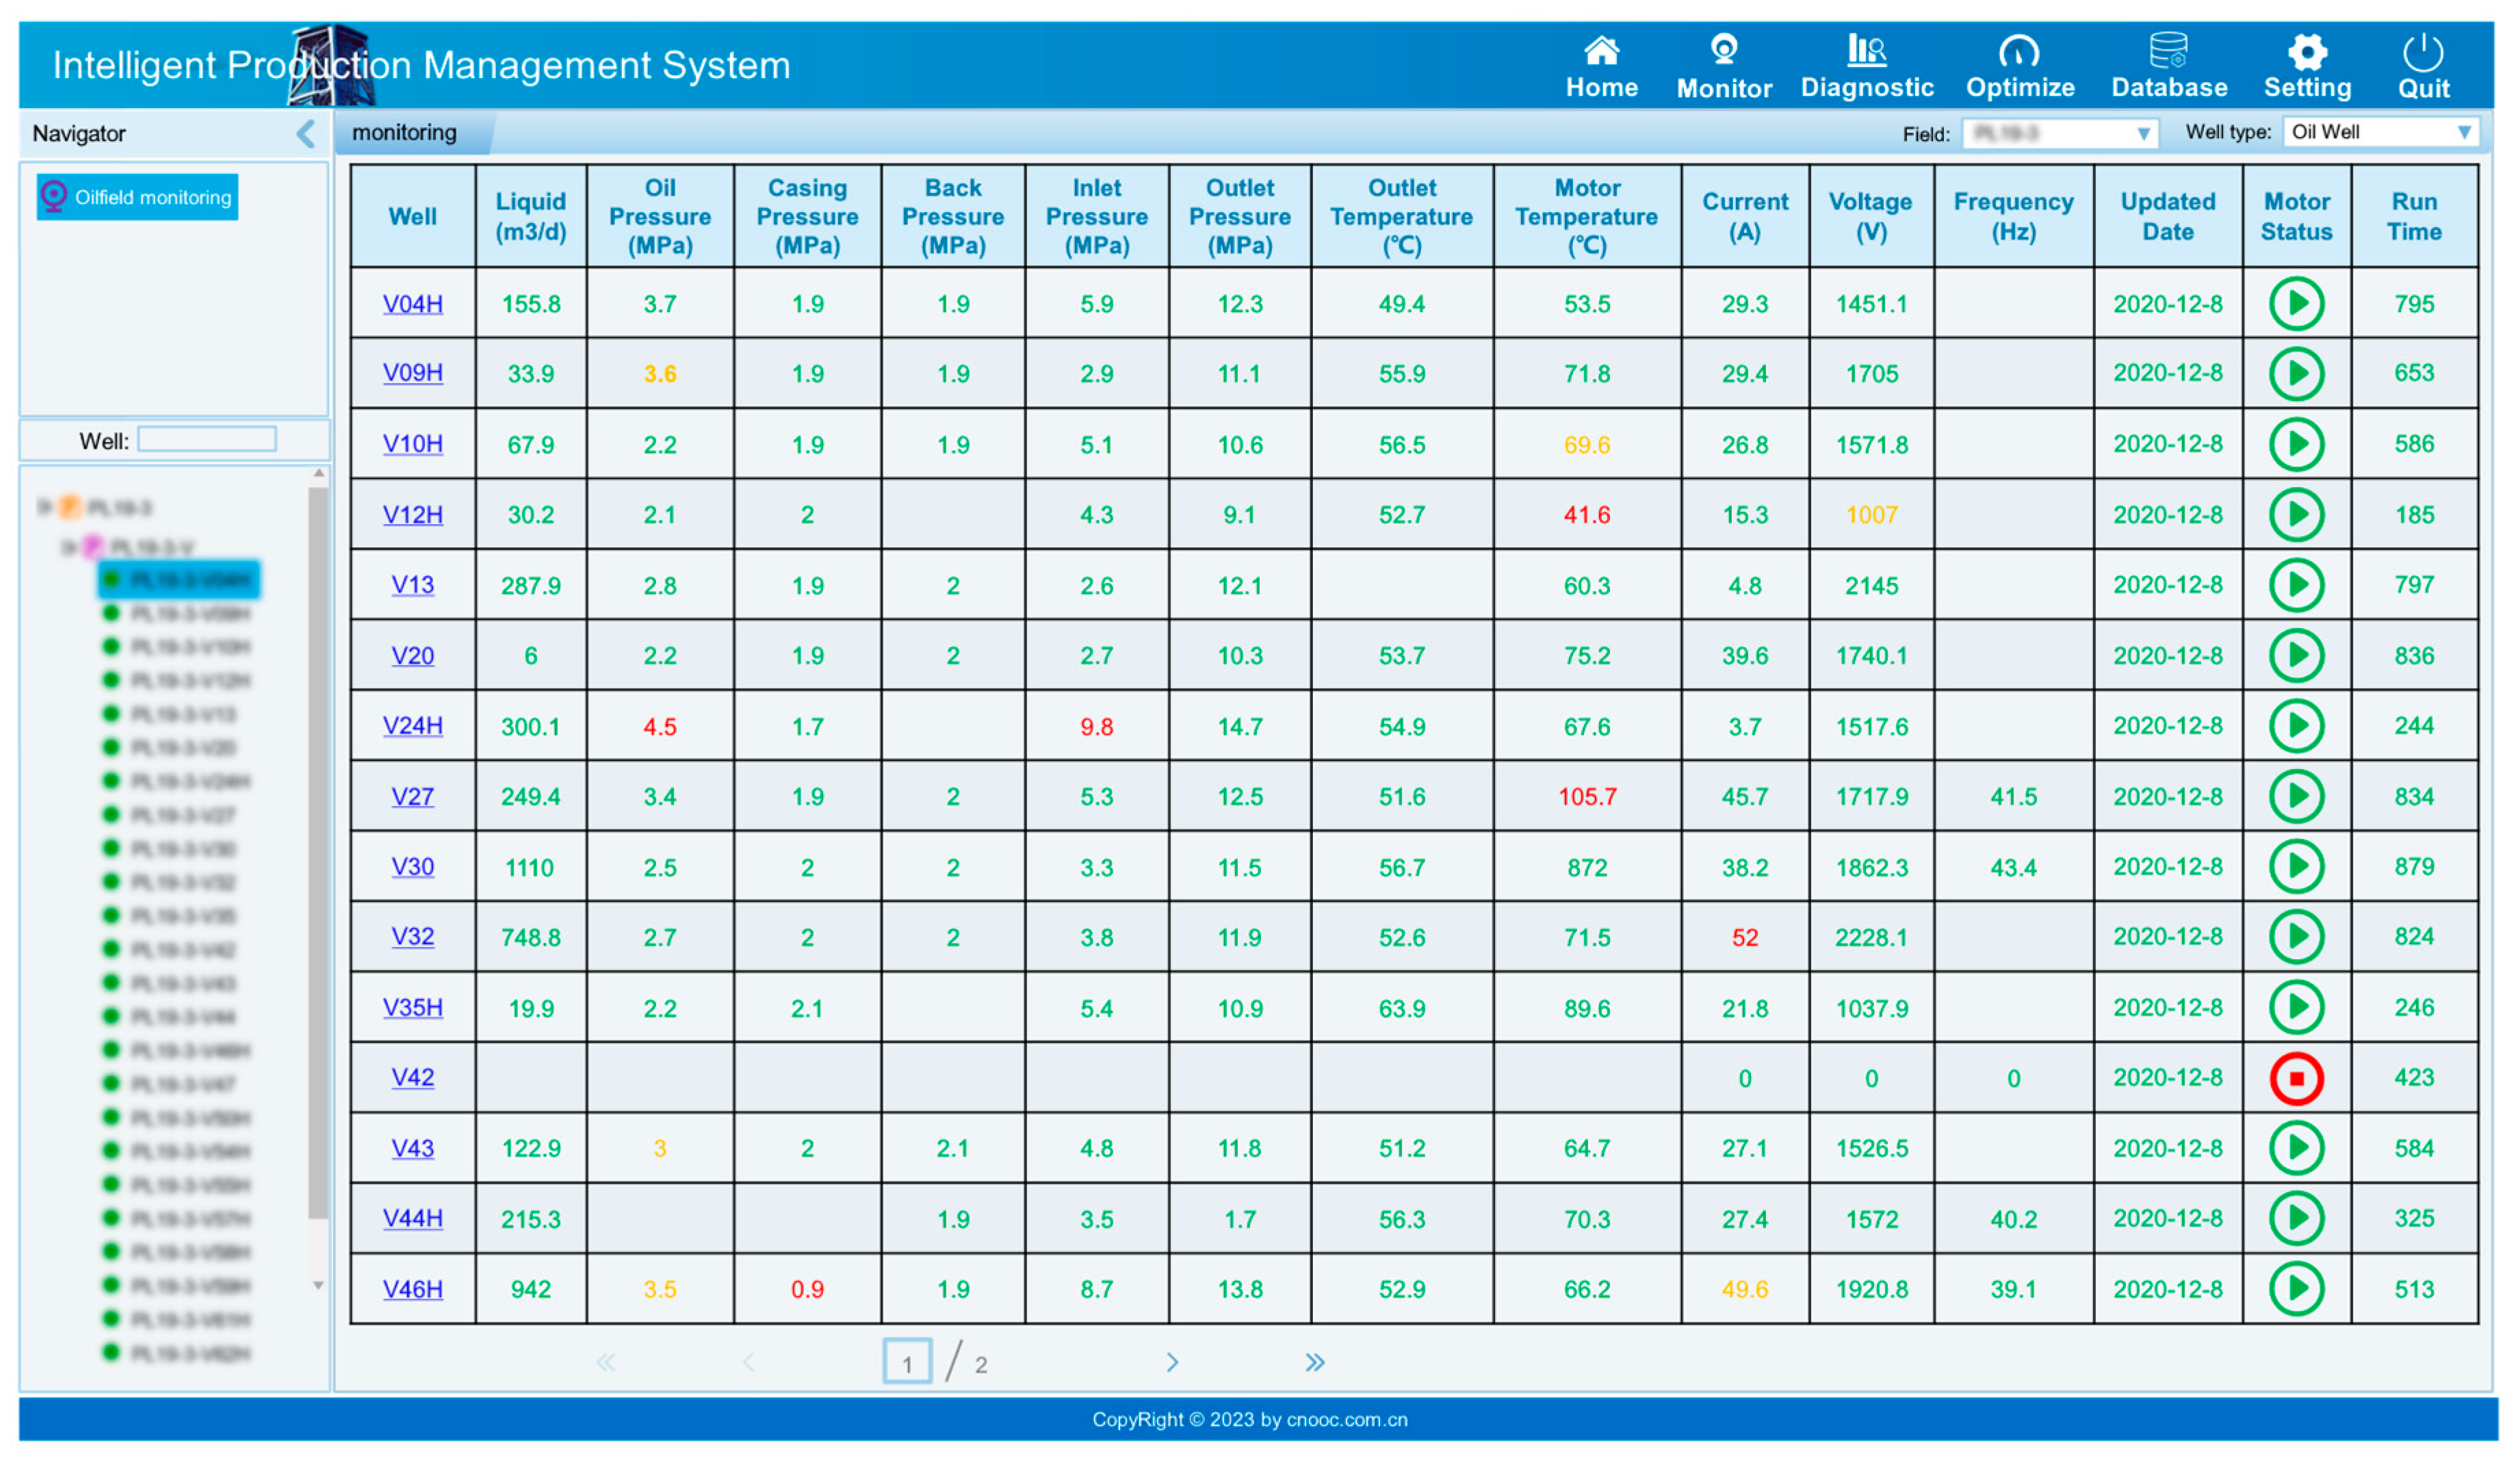
In the monitoring workflow of our intelligent oil production system, real-time operational parameters are continuously captured directly from sensors strategically placed throughout the oil well infrastructure. This real-time data acquisition allows for an immediate and precise assessment of the well’s operating conditions. On the user interface, different colors are utilized to denote the current status of well parameters, providing a clear and intuitive visual cue that helps operators quickly understand the operational state. The interface is designed for real-time refresh, ensuring that the data presented to the users are always up to date, as demonstrated in Figure 20.
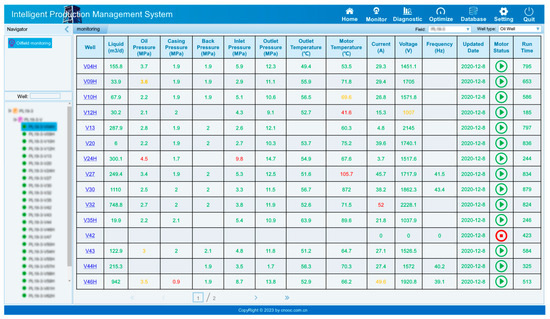
Figure 20.
Oilfield monitoring module: Green (Normal), Yellow (Exceeds Limit), Red (Severe Exceedance).
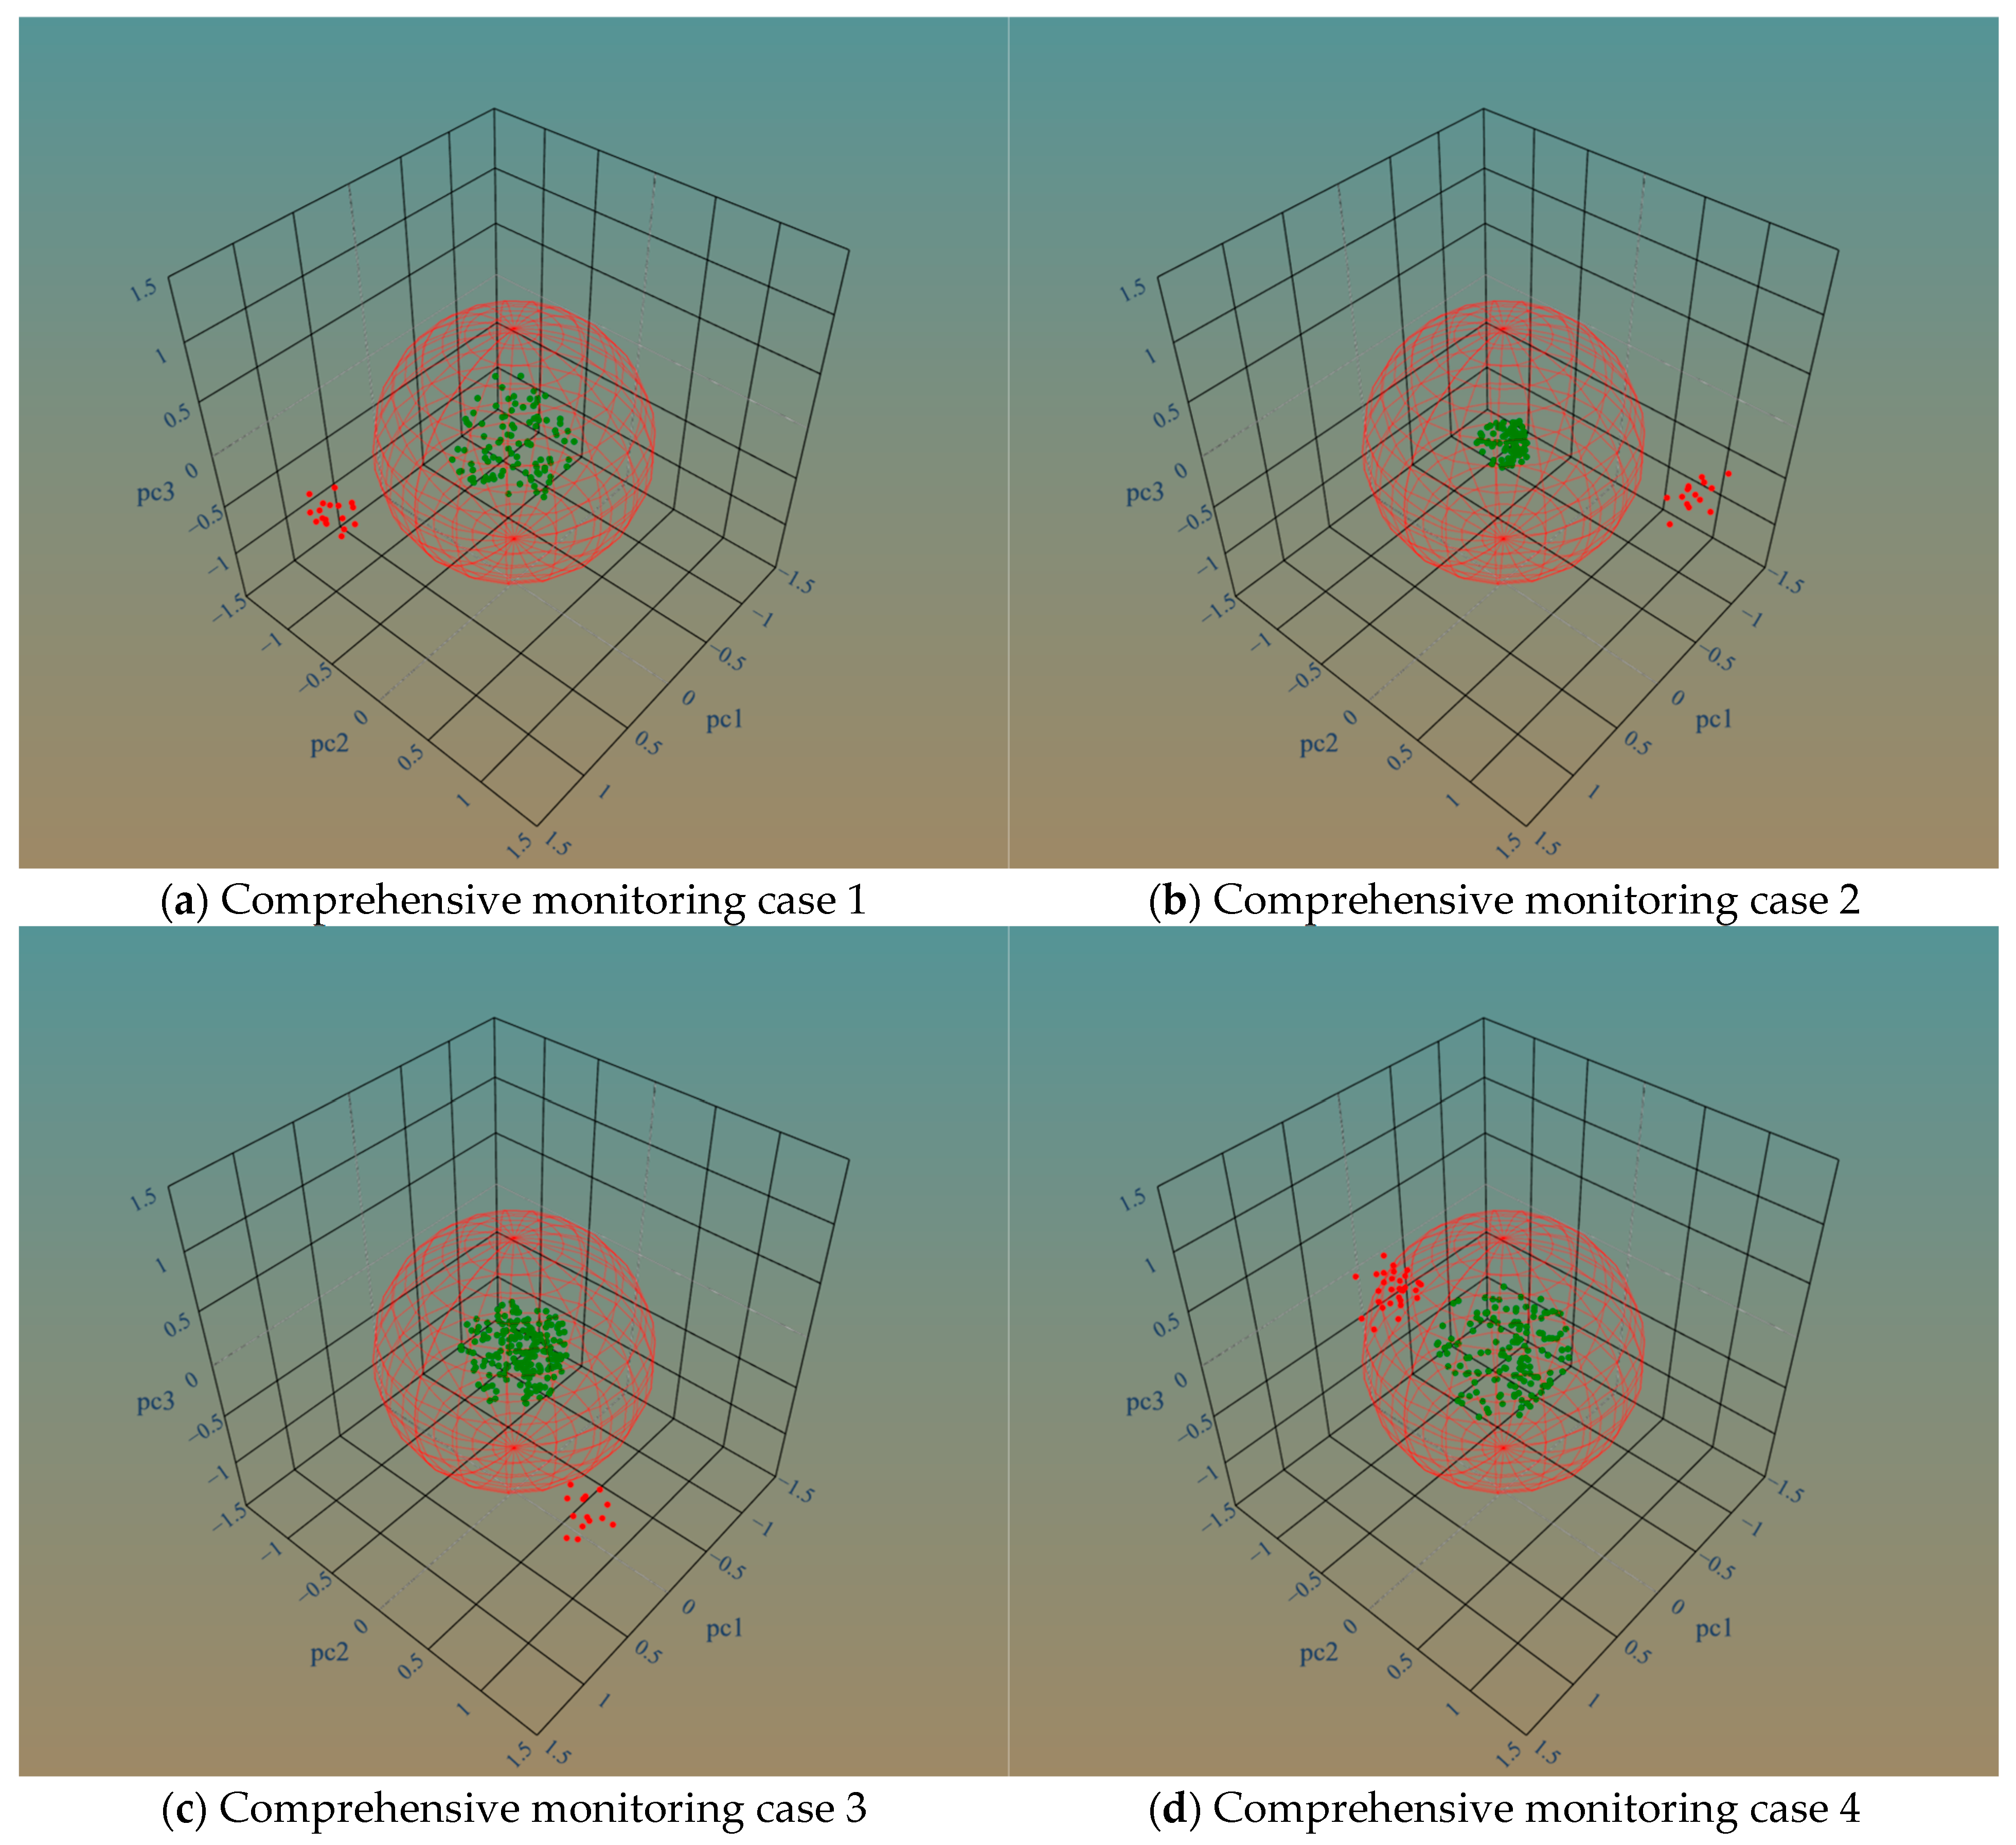
The comprehensive monitoring module, a critical component of this system, plays a pivotal role in identifying potential issues before they escalate into serious problems. It has been specifically designed to detect and alert operators to any abnormal data that exceeds predefined thresholds. During the production process, this module has repeatedly identified such anomalies, effectively preventing potential downtime and equipment failures, as illustrated in Figure 21.
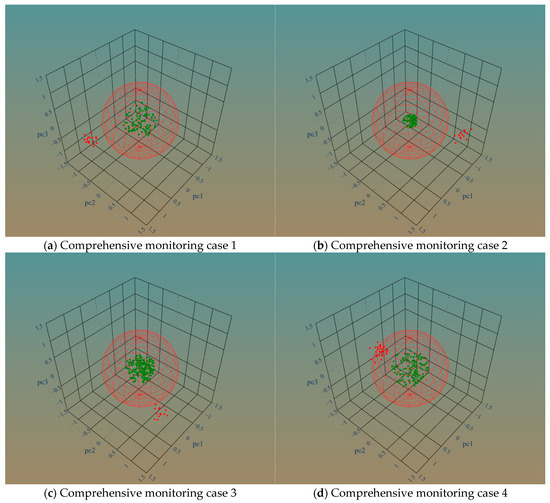
Figure 21.
Comprehensive monitoring cases.
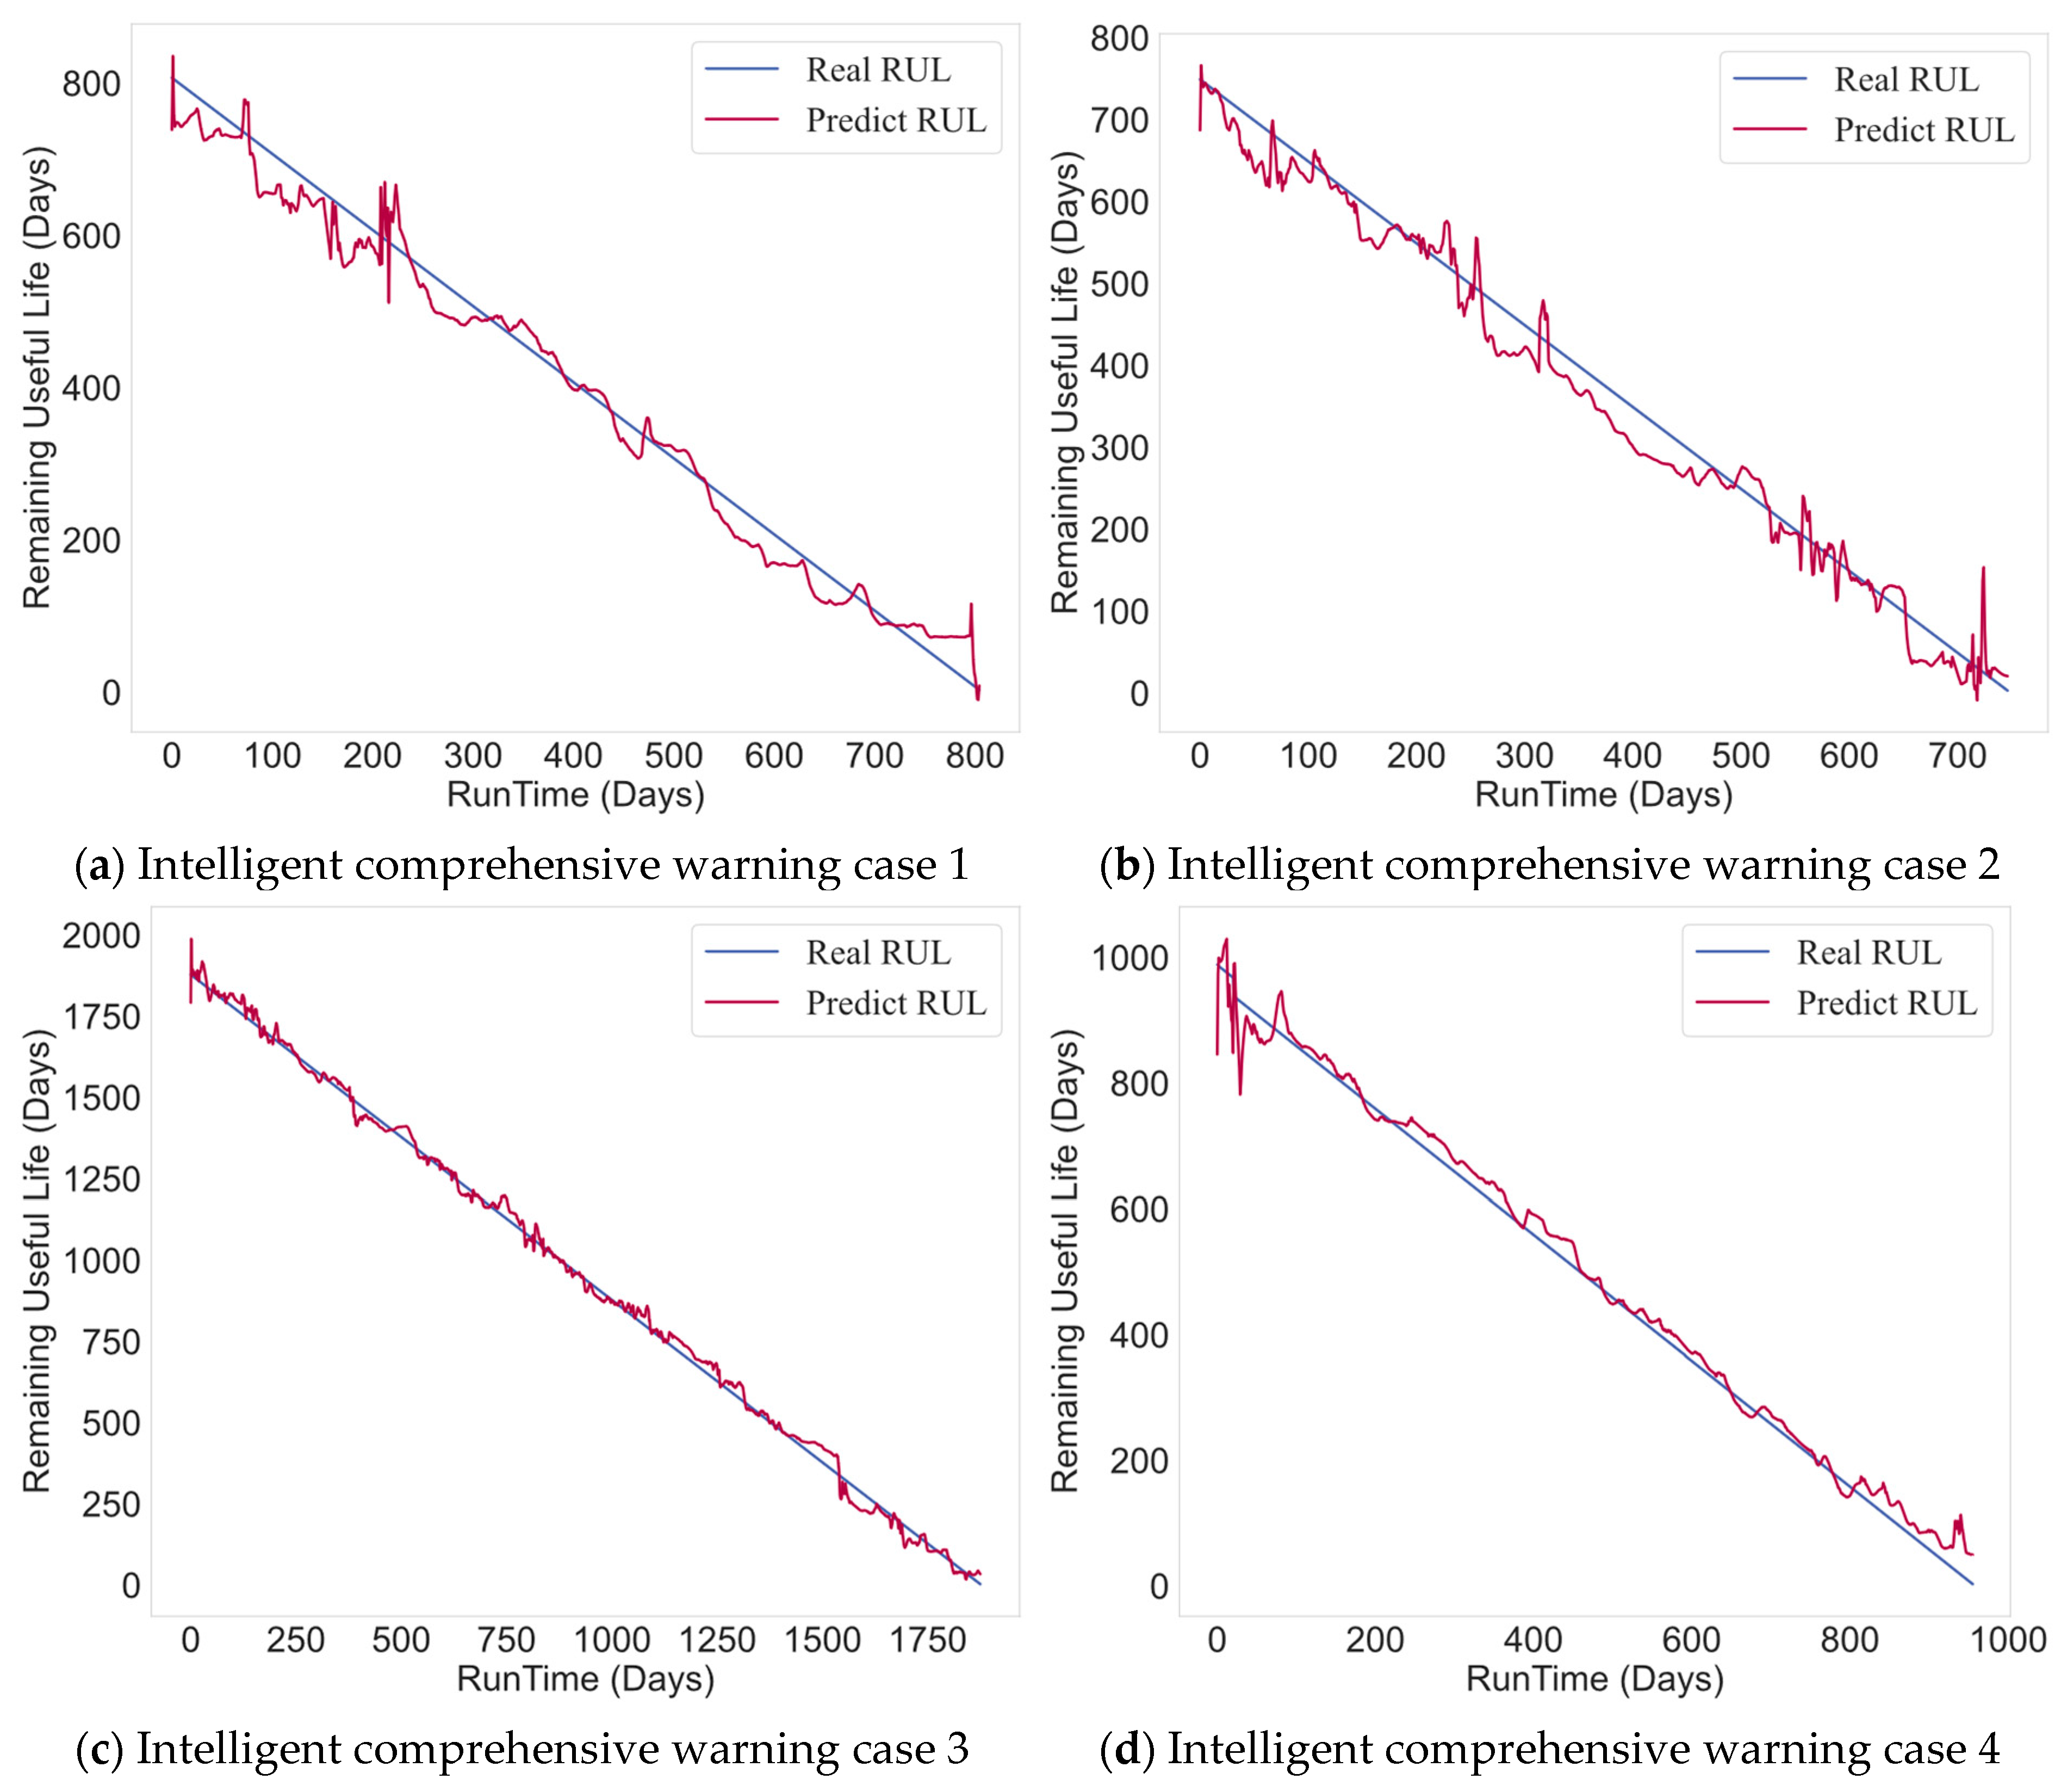
Moreover, the intelligent comprehensive warning module employs advanced predictive analytics to forecast the remaining life of the oil production equipment. Utilizing historical data alongside real-time operational metrics, this module calculates and updates predictions regarding the equipment’s lifespan. These predictions are made with a high degree of accuracy, which is essential for planning maintenance and avoiding unexpected failures. The reliability and precision of this predictive capability are highlighted in Figure 22.
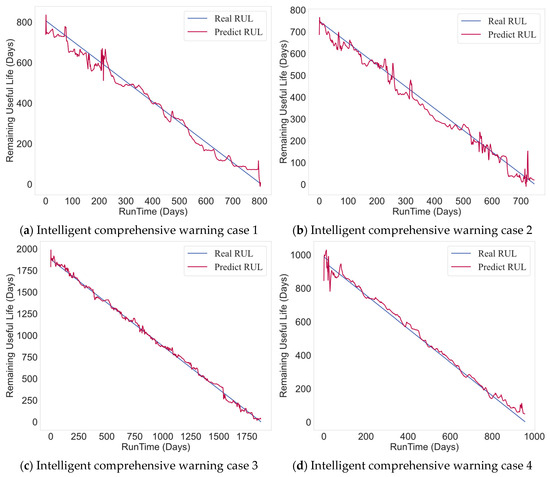
Figure 22.
Intelligent comprehensive warning cases.
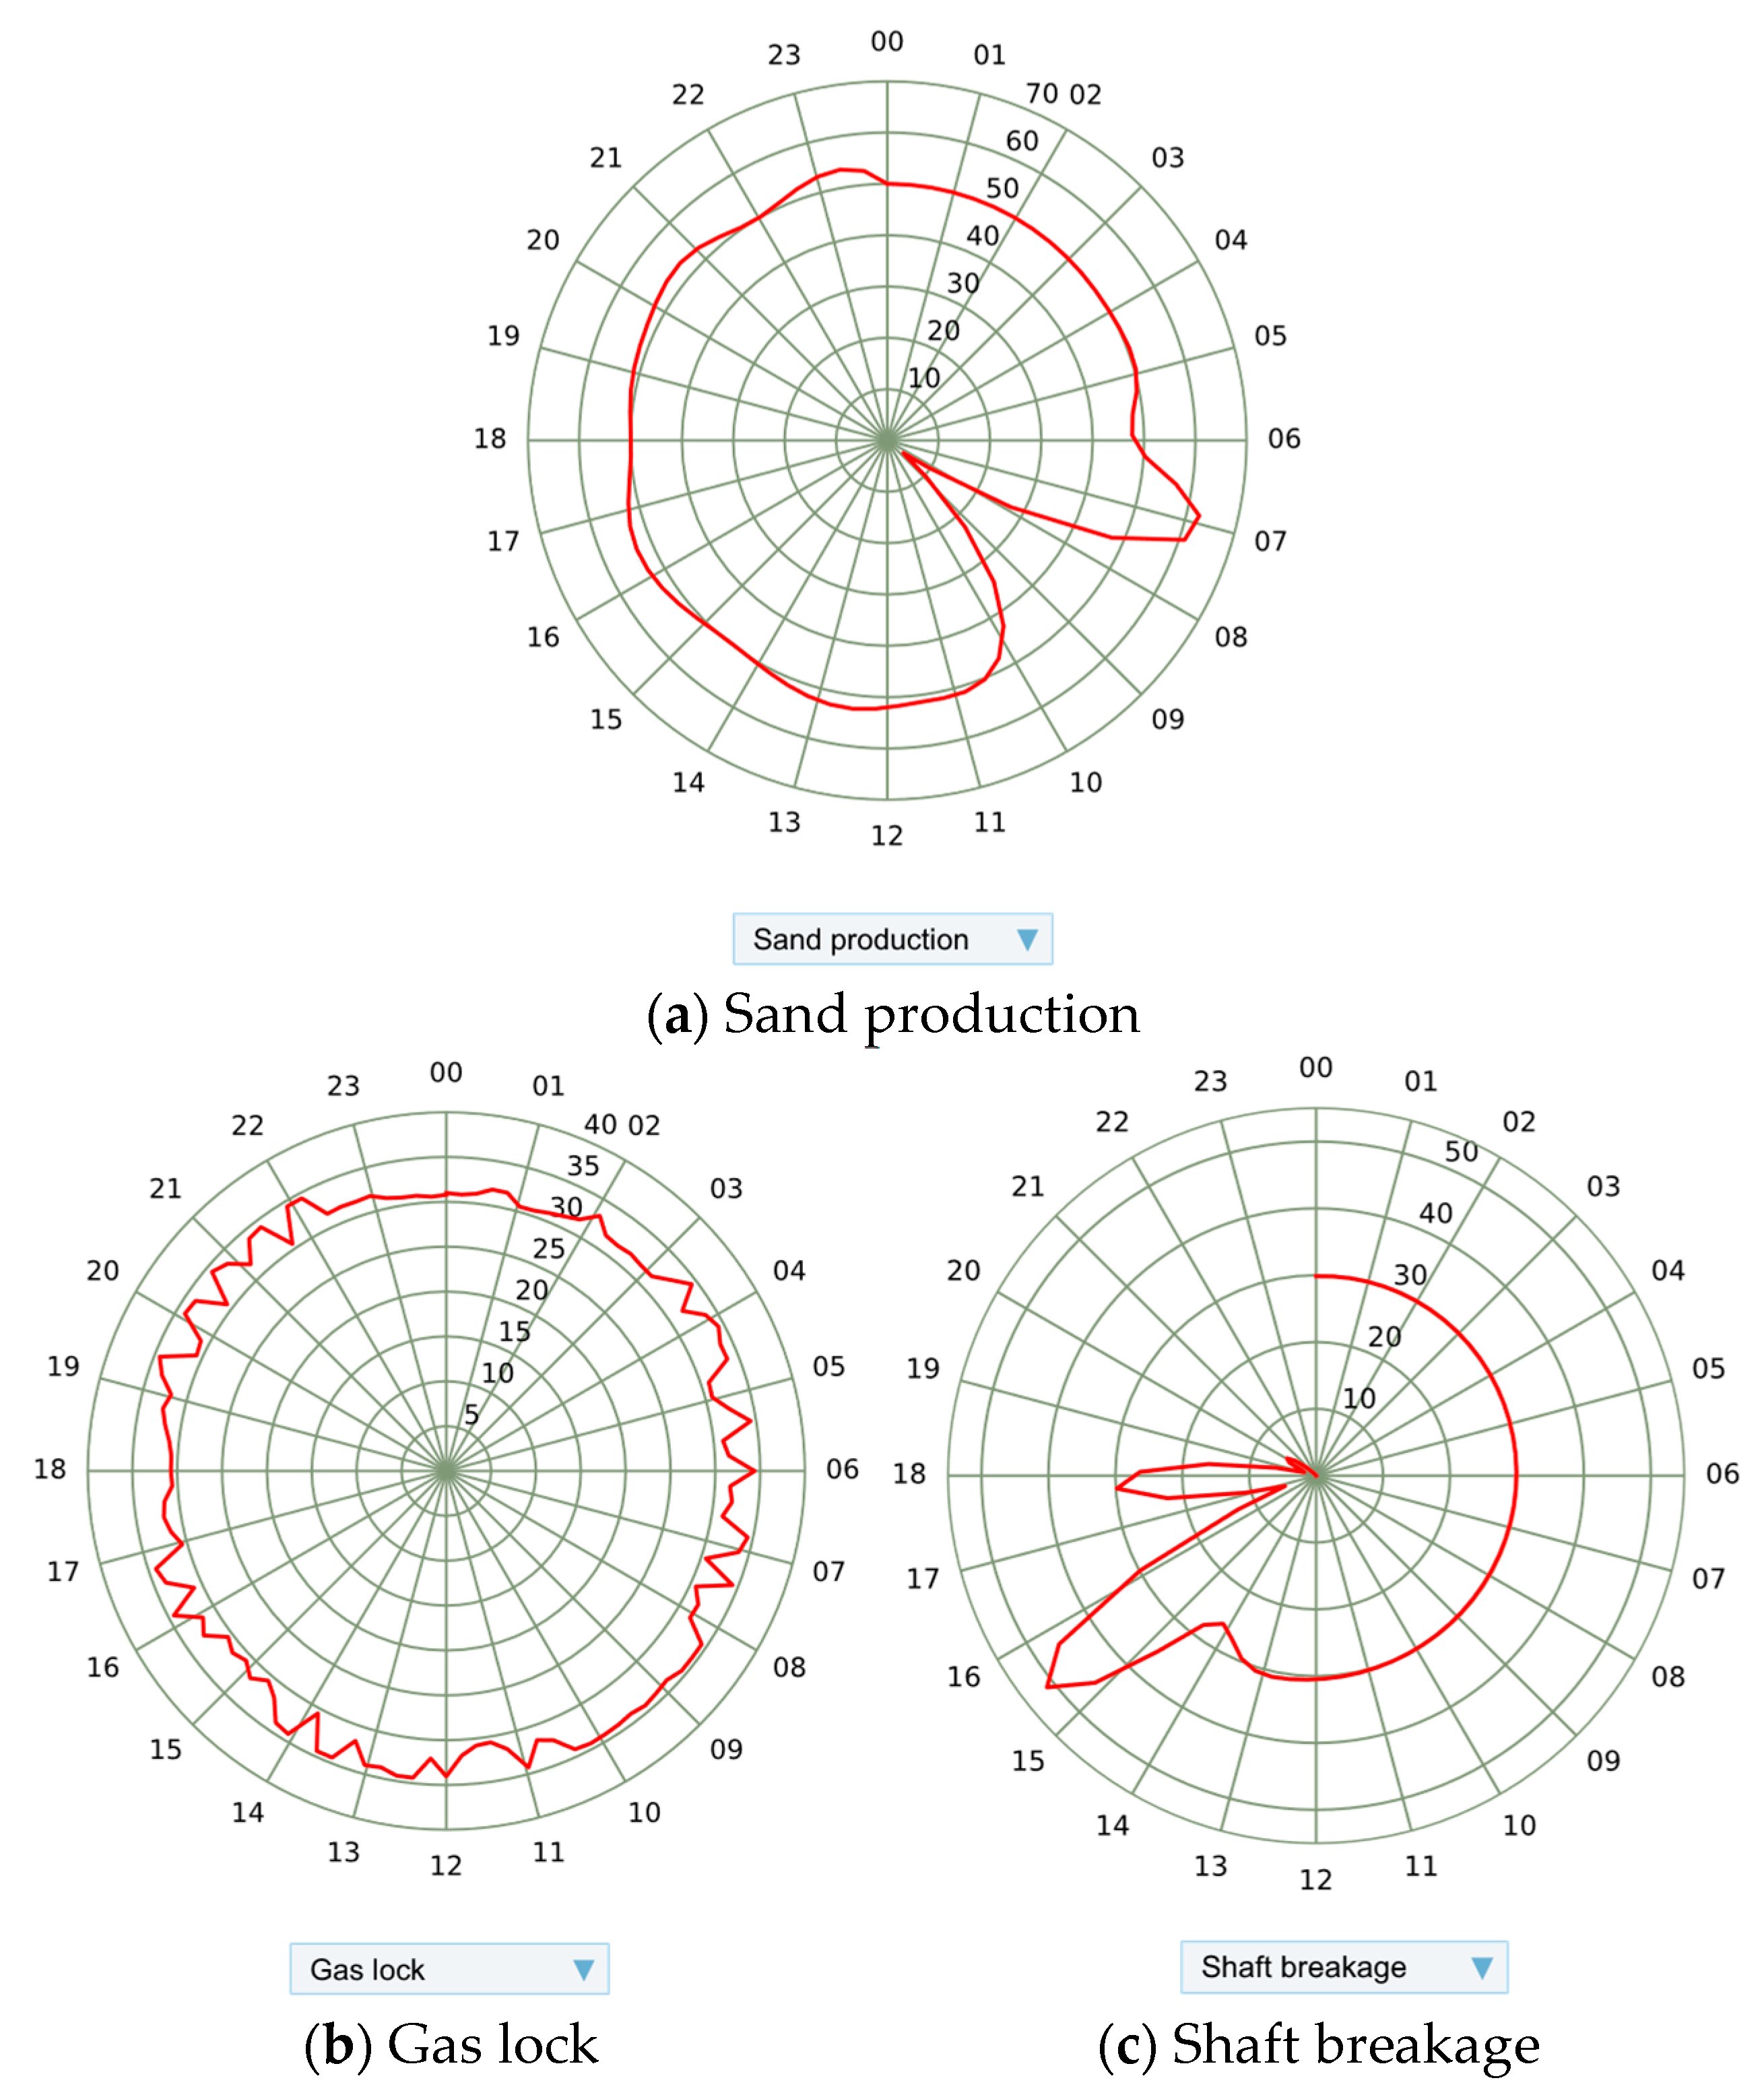
In terms of diagnostics, the single well condition identification feature within our intelligent oil production system has proven highly effective in promptly identifying abnormal conditions. This capability is particularly valuable as it correlates closely with the exceptional situations recorded by field engineers. The system’s ability to detect deviations in current signatures allows for the immediate recognition of potential issues, often before they become apparent through traditional monitoring methods. Some examples of single well condition identification are shown in Figure 23.
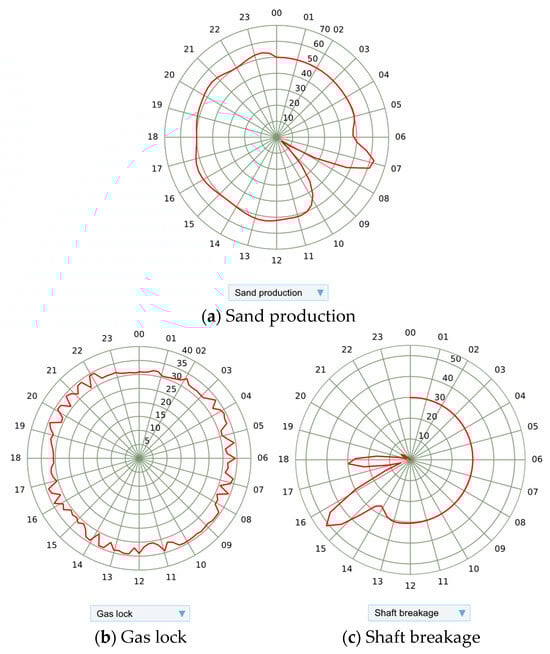
Figure 23.
Single well condition identification cases.
5. Discussion
In this study, several machine learning models were used to improve oil production management, such as models for handling missing data, predicting future trends, reducing dimensionality, clustering operational conditions, and predicting the lifespan and faults of ESPs. These models have shown their value in different parts of the system, but they also reveal some challenges when applied in real oil production environments. Table 1 summarizes the advantages and limitations of these methods.

Table 1.
Overview of machine learning models used in oil production management.
First, many models, like RNN and LSTM, require large amounts of data to work well. However, data in oil production systems are often incomplete, noisy, or sparse, which can limit the performances of these models. GAKNN is good at handling missing data, but it becomes slow and needs more resources when working with large datasets. To improve this, future works could look at better ways to fill in missing data and improve model performance when there are not enough data. Second, some models, especially LSTM and BP, need a lot of computing power. This can be a problem when trying to use them in real-time systems, especially in remote oil fields with limited computing resources. In the future, we could explore ways to make these models smaller and faster without losing accuracy, like using simpler architectures or methods to reduce model size. Another challenge is overfitting, which happens when models, such as the BP neural network, learn too much from the training data and cannot perform well on new data. This is important in tasks like fault detection and predicting when equipment will fail, where the system needs to work well even with changing conditions. To solve this, future research could focus on improving regularization techniques or using multiple models together to prevent overfitting and make predictions more reliable. Finally, many of these models, such as LSTM and BP neural networks, are not easy to understand. This is a problem in environments where operators need to trust the model’s decisions and act on them quickly. To improve this, future work should focus on developing methods to make these models easier to explain, so operators can understand why a model made a certain prediction.
In contrast, supervised learning offers several advantages for oil production management. Supervised learning methods, such as regression and classification, rely on labeled historical data, which allows for accurate predictions and fault detection. These methods are particularly useful in situations where the patterns of equipment failure or performance degradation are well-defined, enabling the model to learn from past data and make reliable predictions on new data. Supervised learning also provides clearer insights into the relationships between input parameters and outcomes, making it easier to interpret the model’s decisions and build trust with operators.
In conclusion, while the machine learning models used in this study show great potential for improving oil production management, there are still challenges. These challenges include the need for large amounts of data, high computing power, the risk of overfitting, and the lack of model interpretability. Future research should aim to address these issues by improving data efficiency, reducing model complexity, preventing overfitting, and making the models more understandable. These improvements will help make machine learning more practical and effective in real-world oil production systems.
While these machine learning models show great potential for improving oil production management, their implementation also brings clear economic benefits. The system can help reduce downtime and minimize maintenance costs by predicting failures early and optimizing maintenance schedules. This leads to substantial savings by avoiding unplanned repairs and improving resource use. For example, even a 15–20% reduction in downtime can result in significant cost savings. The initial costs of implementing the system, such as software development, integration, and training, are offset by long-term savings. A rough estimate suggests that for an investment of USD 5 million, the system could save around USD 1.5 million annually, leading to an ROI of 30%. As the system improves over time, this ROI is expected to increase. In addition, the system boosts productivity by providing real-time insights for better decision-making. This increases equipment uptime and production throughput, potentially improving production yield by 10–15% annually.
However, when considering large-scale deployment or integration with existing infrastructure, there are challenges to address. One of the main obstacles is the system’s scalability. As production systems expand or new data sources are added, the system must handle increasingly larger datasets in real time. Ensuring that the system can scale without losing performance or efficiency requires the careful planning and optimization of its architecture. Another challenge is integration with existing infrastructure. Many oil production systems already use legacy technologies, and integrating new machine learning-based systems with these can be complex. It requires adapting the system to work seamlessly with different data formats, protocols, and hardware. This may involve upgrading existing systems, retraining staff, and ensuring that the new system can coexist with current operational processes.
Overall, while the system shows significant promise in improving both operational efficiency and financial performance, successful large-scale deployment will require addressing challenges related to scalability, integration, and adapting to the evolving needs of the oil production industry.
6. Conclusions
The intelligent oil production management system encapsulates three pivotal functions: fault monitoring and early warning for offshore mechanical production wells, operational condition classification and diagnosis, and parameter optimization measures. It furnishes a comprehensive platform tailored for management personnel, equips technical staff with sophisticated analytical tools, and provides on-site personnel with an intelligent assistant to enhance operational efficiency.
In practice, the system employs a closed-loop optimization management model for oil and gas wells, which operates through three sequential steps: data collection, processing, and output. This robust framework ensures continuous monitoring, evaluation, diagnosis, prediction, optimization, and effective decision-making, thereby markedly enhancing the management level and operational efficiency of electric pump wells. As the variety and quality of field data continue to evolve, the intelligent electric submersible pump oil production management system is increasingly pivotal in advancing the automation and unmanned management of offshore electric pump wells. This evolution underscores its potential to significantly impact the future of oil production processes by driving efficiencies and reducing the need for direct human intervention.
Author Contributions
Conceptualization, X.S. and Y.Y.; methodology, X.L.; software, Y.J. and M.L.; validation, Y.Y., Y.J. and J.P.; formal analysis, X.L. and M.L.; investigation, J.P. and M.L.; resources, X.S. and G.H.; data curation, Y.J. and Y.Y.; writing—original draft preparation, X.L.; writing—review and editing, X.S. and Y.Y.; visualization, Y.J. and J.P.; supervision, G.H.; project administration, X.S.; funding acquisition, G.H. All authors have read and agreed to the published version of the manuscript.
Funding
This research was funded by the Science Foundation of China University of Petroleum, Beijing (no. 2462023YJRC019) and the National Natural Science Foundation of China (no. 52204059).
Data Availability Statement
The raw data supporting the conclusions of this article will be made available by the authors on request.
Conflicts of Interest
Authors Xianfu Sui, Yuchen Ji, Yang Yang, Jianlin Peng, and Menglong Li were employed by the CNOOC Research Institute. The remaining authors declare that the research was conducted in the absence of any commercial or financial relationships that could be construed as a potential conflict of interest.
References
- Haouel, C.; Nemeslaki, A. Digital transformation in oil and gas industry: Opportunities and challenges. Period. Polytech. Soc. Manag. Sci. 2024, 32, 1–16. [Google Scholar] [CrossRef]
- Powers, M.L. Mechanics of an Electric Submersible Pump Failure Mode. SPE Prod. Facil. 2002, 17, 62–67. [Google Scholar] [CrossRef]
- Joseph, A.; Adeoti, A.O. Impact of Fluid Properties on Electric Submersible Pumps (ESP) Performance and Run Life in a Well. J. Appl. Sci. Environ. Manag. 2021, 25, 139–143. [Google Scholar] [CrossRef]
- Rodrigues, D.A.; Martins, G.S.O.; David, E.R.; Reis, F.L.M.; Carneiro, L.E.M.; Correia, J.R.; Lima, L.M.; Silva Freire, A.P. Fault diagnosis of electric submersible pumps using vibration signals. J. Braz. Soc. Mech. Sci. Eng. 2023, 45, 445. [Google Scholar] [CrossRef]
- Wen, W.; Qin, J.; Xu, X.; Mi, K.; Zhou, M. A Model-Driven Approach to Extract Multi-Source Fault Features of a Screw Pump. Processes 2024, 12, 2571. [Google Scholar] [CrossRef]
- Adukwu, O. Fault Diagnosis in Gas Lift System Using PDF Data. J. Eng. Adv. 2023, 4, 35–39. [Google Scholar] [CrossRef]
- Gilbertson, E.; Hover, F.; Colina, E. Failure Mode and Sensitivity Analysis of Gas Lift Valves. In Proceedings of the ASME 2010 29th International Conference on Ocean, Offshore and Arctic Engineering, Shanghai, China, 6–11 June 2010; Volume 2, pp. 305–314. [Google Scholar]
- Carpenter, C. Analysis Clarifies Failures of Gas Lift Valves in Subsea Wells. J. Pet. Technol. 2024, 76, 79–81. [Google Scholar] [CrossRef]
- Lv, X.; Feng, L.; Wang, H.; Liu, Y.; Sun, B. Quantitative diagnosis method of the sucker rod pump system based on the fault mechanism and inversion algorithm. J. Process Control. 2021, 104, 40–53. [Google Scholar] [CrossRef]
- Derek, H.J.; Jennings, J.W.; Morgan, S.M. Sucker Rod Pumping Unit Diagnostics Using an Expert System. In Proceedings of the Permian Basin Oil and Gas Recovery Conference, Midland, TX, USA, 10–11 March 1988. [Google Scholar]
- Tecle, S.I. Development and Research on Fault Diagnosis and Energy Efficiency Improvement Methods for Sucker Rod Pumps Driven by an Induction Motor: Dissertation Degree of Candidate of Technical Sciences: 2.4.2. Ph.D. Thesis, Ural Federal University, Ekaterinburg, Russia, 2023. [Google Scholar]
- Chen, J.; Li, W.; Yang, P.; Chen, B.; Li, S. Prediction and classification of faults in electric submersible pumps. AIP Adv. 2022, 12, 045215. [Google Scholar] [CrossRef]
- Zhang, B.; Gao, X.; Li, X. Complete Simulation and Fault Diagnosis of Sucker-Rod Pumping (includes associated comment). SPE Prod. Oper. 2021, 36, 277–290. [Google Scholar] [CrossRef]
- Carpenter, C. Analytic Solutions Help Predict Sucker-Rod-Pump Failure. J. Pet. Technol. 2022, 74, 62–64. [Google Scholar] [CrossRef]
- Shi, H.; Su, Y.; Pan, Y.; Zhang, W.; Chen, Z.; Liao, R. Research on failure diagnosis analysis of plunger gas lift system using convolutional neural network with multi-scale channel attention mechanism based on wavelet transform. Chem. Eng. Sci. 2024, 304, 121031. [Google Scholar] [CrossRef]
- Wang, Z.; Dong, Y.; Zheng, X.; Wang, X.; Gao, P.; Zhang, L.; Huang, Y.; Sun, W.; Zhang, P. A Deep Learning Model to Intelligently Identify the Working Status of Screw Pumps for Oil Well Lifting. In Proceedings of the SPE/IATMI Asia Pacific Oil & Gas Conference and Exhibition, Virtual, 12–14 October 2021. [Google Scholar]
- Ragab, A.M.S.; Yakoot, M.S.; Mahmoud, O. Application of Machine Learning Algorithms for Managing Well Integrity in Gas Lift Wells. In Proceedings of the SPE/IATMI Asia Pacific Oil & Gas Conference and Exhibition, Virtual, 13–15 October 2021. [Google Scholar]
- Liu, D.; Feng, G.; Feng, G.; Xie, L. Hybrid Long Short-Term Memory and Convolutional Neural Network Architecture for Electric Submersible Pump Condition Prediction and Diagnosis. SPE J. 2024, 29, 2130–2147. [Google Scholar] [CrossRef]
- Abdelaziz, M.; Lastra, R.; Xiao, J.J. ESP Data Analytics: Predicting Failures for Improved Production Performance. In Proceedings of the Abu Dhabi International Petroleum Exhibition & Conference, Abu Dhabi, United Arab Emirates, 13–16 November 2017. [Google Scholar]
- Silvia, S.; Gilad, Y.; Wilson, T.A.; Akbari, B.; Furlong, E.R. Case Study: Predicting Electrical Submersible Pump Failures Using Artificial Intelligence and Physics-Based Hybrid Models. In Proceedings of the SPE Gulf Coast Section—Electric Submersible Pumps Symposium, The Woodlands, TX, USA, 2–6 October 2023. [Google Scholar]
- Orrù, P.F.; Zoccheddu, A.; Sassu, L.; Mattia, C.; Cozza, R.; Arena, S. Machine Learning Approach Using MLP and SVM Algorithms for the Fault Prediction of a Centrifugal Pump in the Oil and Gas Industry. Sustainability 2020, 12, 4776. [Google Scholar] [CrossRef]
- Saghir, F.; Perdomo, M.E.G.; Behrenbruch, P. Application of machine learning methods to assess progressive cavity pumps (PCPs) performance in coal seam gas (CSG) wells. APPEA J. 2020, 60, 197–214. [Google Scholar] [CrossRef]
- de Rezende Faria, R.; Capron, B.D.O.; Secchi, A.R.; de Souza, M.B.J. Gas-Lift Optimization Using Physics-Informed Deep Reinforcement Learning. Ind. Eng. Chem. Res. 2024, 63, 14199–14210. [Google Scholar] [CrossRef]
- Feng, L.; Wang, S.; Liang, Q. Completion method for missing time series data of distribution station based on GAKNN method. Electr. Power Autom. Equip. 2021, 41, 187–192. [Google Scholar] [CrossRef]
- Fix, E. Discriminatory Analysis: Nonparametric Discrimination, Consistency Properties; USAF School of Aviation Medicine: Randolph, TX, USA, 1985; Volume 1. [Google Scholar]
- Ni, W.; Qi, J.; Liu, L.; Li, S. A Pulse Signal Preprocessing Method Based on the Chauvenet Criterion. Comput. Math. Methods Med. 2019, 2019, 2067196. [Google Scholar] [CrossRef] [PubMed]
- Kriegel, H.-P.; Kröger, P.; Zimek, A. Outlier detection techniques. Tutor. KDD 2010, 10, 1–76. [Google Scholar]
- Schmidt, R.M. Recurrent Neural Networks (RNNs): A gentle Introduction and Overview. arXiv 2019. [Google Scholar] [CrossRef]
- Abdi, H.; Williams, L.J. Principal component analysis. WIREs Comput. Stats 2010, 2, 433–459. [Google Scholar] [CrossRef]
- Ester, M.; Kriegel, H.-P.; Sander, J.; Xu, X. A density-based algorithm for discovering clusters in large spatial databases with noise. In Proceedings of the KDD’96: Proceedings of the Second International Conference on Knowledge Discovery and Data Mining, Portland, OR, USA, 2 August 1996; Volume 96, pp. 226–231. [Google Scholar]
- George, B.; Seals, S.; Aban, I. Survival analysis and regression models. J. Nucl. Cardiol. 2014, 21, 686–694. [Google Scholar] [CrossRef]
- Spruance, S.L.; Reid, J.E.; Grace, M.; Samore, M. Hazard Ratio in Clinical Trials. Antimicrob. Agents Chemother. 2004, 48, 2787–2792. [Google Scholar] [CrossRef] [PubMed]
- Crowder, M.J. Multivariate Survival Analysis and Competing Risks; CRC Press: Boca Raton, FL, USA, 2012. [Google Scholar]
- Sherstinsky, A. Fundamentals of recurrent neural network (RNN) and long short-term memory (LSTM) network. Phys. D Nonlinear Phenom. 2020, 404, 132306. [Google Scholar] [CrossRef]
- Ahmadzadeh, F.; Lundberg, J. Remaining useful life estimation: Review. Int. J. Syst. Assur. Eng. Manag. 2014, 5, 461–474. [Google Scholar] [CrossRef]
- Hecht-Nielsen, R. Theory of the backpropagation neural network. In Neural Networks for Perception; Elsevier: Amsterdam, The Netherlands, 1992; pp. 65–93. [Google Scholar]


Disclaimer/Publisher’s Note: The statements, opinions and data contained in all publications are solely those of the individual author(s) and contributor(s) and not of MDPI and/or the editor(s). MDPI and/or the editor(s) disclaim responsibility for any injury to people or property resulting from any ideas, methods, instructions or products referred to in the content. |
© 2025 by the authors. Licensee MDPI, Basel, Switzerland. This article is an open access article distributed under the terms and conditions of the Creative Commons Attribution (CC BY) license (https://creativecommons.org/licenses/by/4.0/).