1. Introduction
In the field of environmental engineering and sustainable development, anaerobic digestion has long been recognized as a vital technology for organic waste treatment, wastewater management, and renewable energy production. Its importance lies in its ability to efficiently process organic waste while contributing to the shift from non-renewable energy sources to sustainable alternatives [
1,
2,
3]. Despite its widespread adoption, this complex process remains a focus of research due to its sensitivity to numerous biological and operational factors. Efforts continue to optimize performance and enhance efficiency for specific applications [
4,
5,
6,
7]. Building on the authors’ previous work [
8], which explored the stability of anaerobic digestion by monitoring dissolved hydrogen concentrations, this study delves deeper into stability indicators and potential optimization strategies.
Here, we introduce a novel parameter—the ratio of dissolved hydrogen concentration to total inorganic carbon (TIC)—as a potential predictor of anaerobic digestion stability. Although the VFA/TIC ratio is widely employed to assess the balance between acid production and the system’s buffering capacity, this alternative approach aims to provide complementary insights into process stability. Dissolved hydrogen plays a pivotal role in microbial metabolic processes and syntrophic interactions, which are essential to maintain the balance required for efficient anaerobic digestion. Effective hydrogen transfer, particularly through hydrogen transfer between species (IHT), is a critical factor for the stability of the system [
9].
Although anaerobic digestion is naturally a relatively stable process that occurs in ecosystems without precise control, disturbances such as high organic loadings can disrupt this balance. Such disturbances often lead to reduced or stopped biogas production, primarily due to acidification. In single-stage anaerobic digestion systems, interspecies electron transfer (IET) is crucial for maintaining chemical equilibrium. This process, which involves electron exchange between microbial species, ensures the efficient conversion of organic matter into methane [
10].
However, elevated hydrogen levels can strongly inhibit the degradation of volatile fatty acids (VFAs), such as propionic and butyric acids [
11], by suppressing the activity of hydrogen-producing microorganisms. This inhibition causes the accumulation of VFA, which, while serving as carbon sources for anaerobic digestion, can also lower pH [
12]. Lower pH negatively affects digestion efficiency, creating toxic conditions that further suppress methane-producing microorganisms [
13].
In addition, VFA production is a reliable indicator of metabolic pathways. For example, in processes aimed at maximizing H
2 production, butyric acid formation pathways are preferred, as their presence reduces substrate utilization rates and limits VFA accumulation. Furthermore, the presence of butyrate can change the dynamics of the microbial community, decreasing the dominance of hydrogen-producing species such as Clostridium while promoting non-hydrogen-producing bacteria, including
Pseudomonas,
Klebsiella,
Acinetobacter, and
Bacillus [
14].
1.1. Phases of Single-Stage Anaerobic Digestion Process
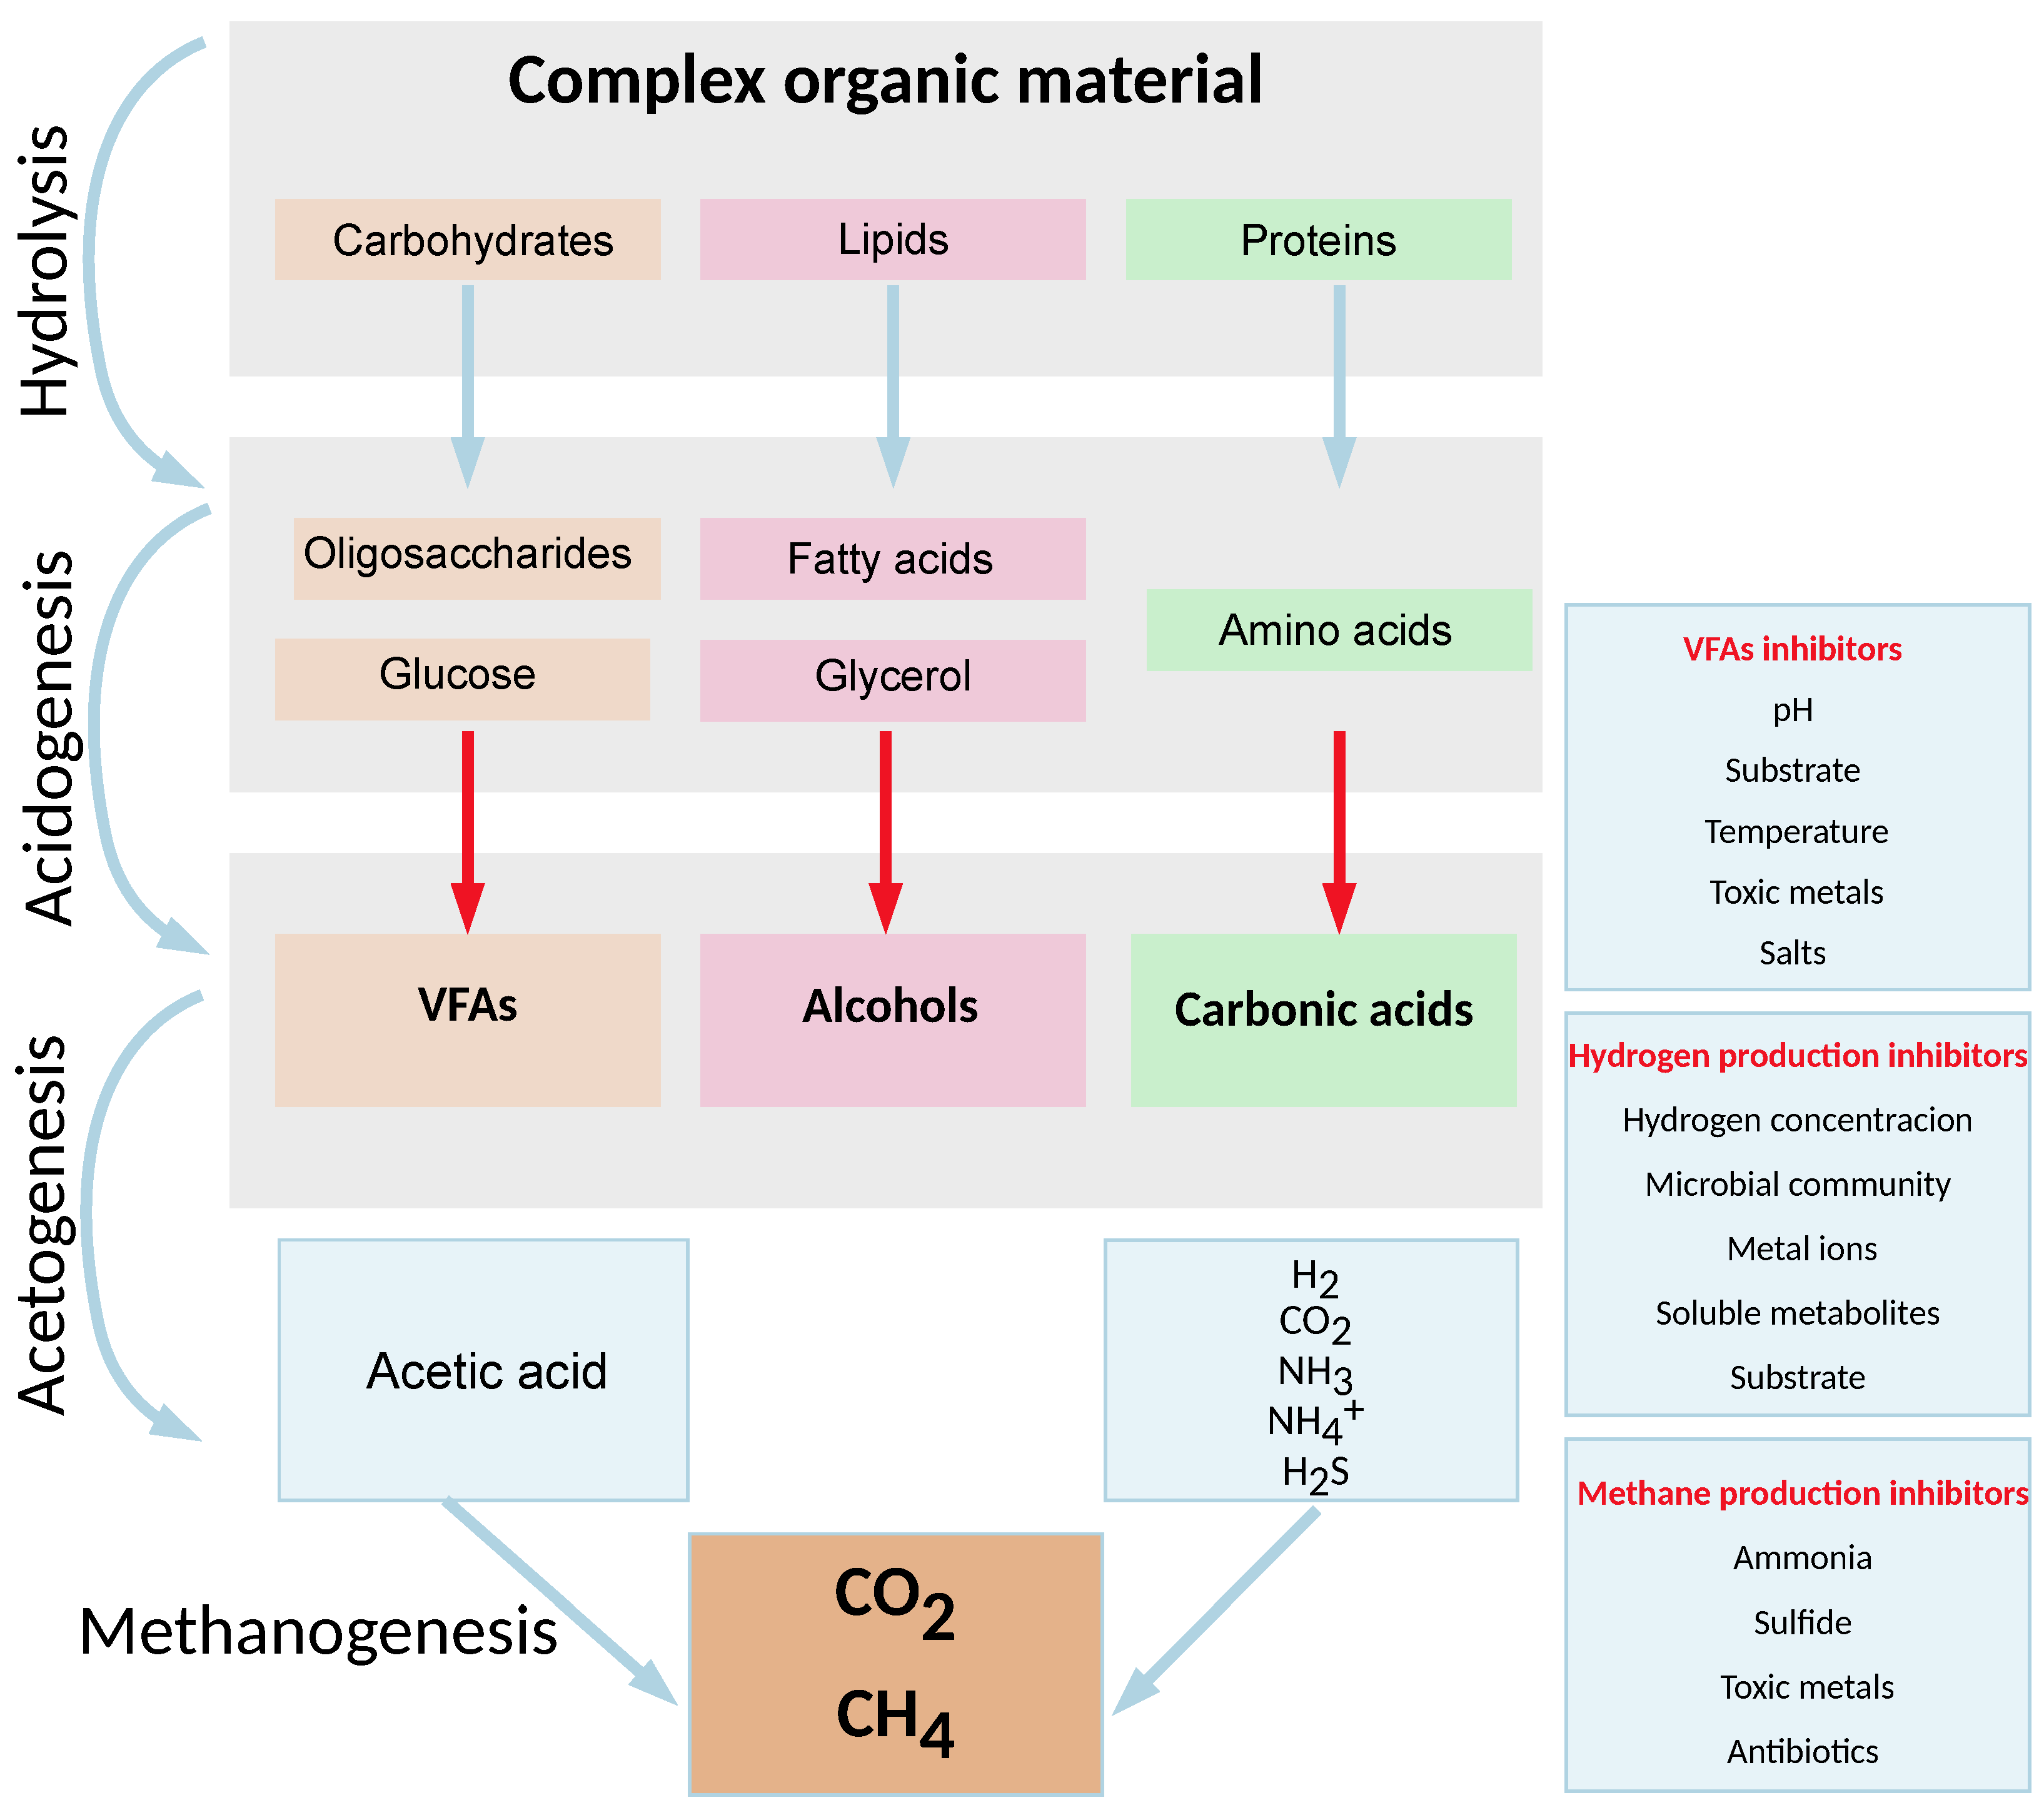
Single-stage anaerobic digestion is a process in which complex organic compounds are converted to the most oxidized and reduced forms of monoatomic carbon, carbon dioxide, and methane, respectively [
15]. This process is generally described as a four-phase process involving hydrolysis, acidogenesis, acetogenesis, and methanogenesis [
16]. Each phase of single-stage anaerobic digestion is carried out by different groups of microorganisms, each with its own respective environmental optimum [
17].
Single-stage AD begins with microbial hydrolysis to break down insoluble organic polymers, such as carbohydrates, and make them available to other microorganisms [
18]. Polymeric substances in the substrate are broken down by extracellular enzymes called hydrolases secreted by the microbial community into low-molecular-weight soluble intermediates (sugar, fatty acids, amino acids), which are then absorbed by microbial cells and further used [
19]. Hydrolytic enzymes, i.e., cellulase, amylase, lipase, protease, and xylanase, may exist freely in the fluid phase or can be bound to microbial membranes, or they are part of multi-enzyme complexes, such as cellulosomes [
20,
21]. The representatives of hydrolytic bacteria belong to five different phyla, such as
Firmicutes,
Bacteroidetes,
Fibrobacteres,
Spirochaetes, and
Thermotogota. However,
Firmicutes and
Bacteroidetes are considered to be the most abundant taxa of hydrolytic bacteria in single-stage anaerobic digestion. The relative abundance of hydrolytic bacteria usually depends on the type of inoculum and operating temperature [
19].
Acidogenic bacteria are responsible for the degradation reactions of hydrolyzed compounds, converting the resulting sugars and amino acids into carbon dioxide, hydrogen, ammonia, and organic acids. Unlike other phases, acidogenesis is generally assumed to proceed faster than all other phases of single-stage anaerobic digestion, with acidogenic bacteria having a recovery time of less than 36 h. Acidogenic bacteria are mostly members of
Firmicutes,
Bacteroidetes,
Proteobacteria, and
Actinobacteria. Various operating parameters and factors, including fermentor design, temperature, cell retention time, and substrate type, can alter the amount and population of acidogenic bacteria in the process. Among all other factors, substrate composition and concentration are considered the most influential [
22].
Acetogenesis is the process in which acetogenic bacteria convert higher fatty acids and other intermediates to acetate through the Wood–Ljungdahl pathway, along with by-products such as ammonia, hydrogen, and carbon dioxide [
23]. Although acetogenesis produces hydrogen, excessive partial pressure of hydrogen has been shown to inhibit acetogenic microorganisms, thereby impeding the breakdown of higher fatty acids. This inhibition occurs due to a metabolic shift towards the production of lactate, ethanol, acetone, and butanol [
24,
25]. Many acetogenic bacteria belong to the genus
Syntrophomonas (e.g.,
Syntrophobacter wolinii and
Syntrophomonas wolfei) [
26]; other species of acetogenic bacteria include
Methanobacterium suboxydans and
Methanobacterium propionicum [
27]. In the subsequent phase, methanogenesis, methanogenic bacteria consume hydrogen, and in this context, a high partial hydrogen pressure becomes advantageous [
28]. This syntrophic relationship, where one group of organisms utilizes the products of another, facilitates the thermodynamic feasibility of the acetogenesis phase. As a result, interspecies hydrogen transfer plays a crucial role in determining the overall rate of single-stage anaerobic digestion [
29].
Methanogenesis refers to the final, highly sensitive phase of single-stage anaerobic digestion, during which the available intermediates are consumed by methanogenic microorganisms to produce methane. Due to the sensitivity of single-stage anaerobic digestion, imbalances caused by the excessive accumulation of certain intermediates in the digester can easily lead to inhibition or failure of the process. Methanogens are slow-growing, strictly anaerobic microorganisms that can degrade only a limited range of organic compounds as a source of carbon and energy. These microorganisms belong to several well-known orders of archaea:
Methanobacteriales,
Methanococcales,
Methanomicrobiales,
Methanosarcinales, and
Methanopyrales. Furthermore, methanogens are classified into three groups based on substrate utilization: methylotrophic methanogens, which utilize methyl and other one-carbon compounds; hydrogenotrophic methanogens, which consume CO
2 and H
2 as carbon and energy sources, converting them into methane; and acetoclastic methanogens, which convert acetate into methane [
30,
31,
32,
33,
34].
Given these facts and the differing metabolic requirements of the various organisms involved in each stage, measuring the dissolved hydrogen concentration during single-stage anaerobic digestion appears to be a good indicator of the quality of the process. Adjusting the optimal dissolved hydrogen concentration at certain stages can then optimize the process and increase its overall efficiency. The schematic representation of the single-stage anaerobic digestion process, including significant inhibitors of VFAs, hydrogen, and methane production, is shown in
Figure 1.
1.2. Sensors
Hydrogen sensors are gaining increasing significance because of the expanded use of hydrogen gas as both an energy carrier and a chemical reactant. In biogas production, most hydrogen sensors monitor the concentration of H
2 in the gas phase of the fermentor. The concentration of dissolved H
2 in the digestate is subsequently estimated from the gas phase concentration, assuming unrestricted hydrogen transfer between the gas and liquid phases. However, the H
2 mass transfer coefficients in anaerobic digesters are significantly lower than those typically observed in aerobic digesters. This reduces the rate of increase in concentration of H
2 in biomass, which can be detected in the gas phase, and can lead to a critical fermentation overload. Consequently, the development of a practical, reliable, and cost-effective device capable of continuous in situ measurement of dissolved hydrogen in anaerobic digesters is highly advantageous [
35].
The amperometric gas sensor is frequently referenced in the literature [
36] under various terms, including polarographic, electrolytic, voltammetric, amperometric, or micro fuel cell. However, most amperometric gas sensors are neither polarographic, as they lack a mercury electrode, nor strictly electrolytic, as many operate as galvanic cells. Furthermore, none produce enough power to qualify as fuel cells. An amperometric gas sensor is specifically designed to measure the concentration of a gaseous compound. It functions as an electrochemical cell, where gas detection occurs via the electro-oxidation or electro-reduction of the compound at the surface of an electrode in contact with a liquid. The sensing electrode, typically a noble-metal-catalyzed gas-diffusing electrode, retains the electrolyte within the cell while remaining porous enough to permit gas diffusion to the electrode/electrolyte interface. The most widely used sensor is the Clark amperometric gas sensor, which features a planar membrane electrode. This sensor generally operates as a two-electrode system, although three-electrode configurations are also possible.
The electrochemical cell incorporates a solid or liquid electrolyte that enables ion transport between the electrodes. For hydrogen sensing, the electrolyte is typically a proton-conducting material. Among liquid electrolytes, sulfuric acid is the most commonly used; however, solid electrolytes are often preferred as they eliminate challenges like leakage and corrosion. Proton-conducting solid polymer electrolytes are widely utilized, while ceramic materials are favored for applications requiring high-temperature stability.
A gas-permeable layer is positioned over the sensing electrode, which serves multiple purposes. It limits gas diffusion by acting as a rate-determining step, it prevents electrolyte leakage or drying, and if made of a suitable material, it selectively permits the passage of the target gas while minimizing interference from other gases. Consequently, gas permeability becomes a critical factor in the choice of suitable material for accurate gas measurement [
37,
38]. In many designs, this layer is composed of a perfluorinated polymer. The hydrogen gas passes through this layer and undergoes oxidation at the sensing electrode, as described by the relevant reaction equation.
This results in a change in the potential of the sensing electrode. On the counter electrode, oxygen reduction proceeds as follows:
Amperometric sensors can be used in the temperature range −20 to 80 °C provided the electrolyte does not freeze in this range. It can be used for in situ hydrogen monitoring in high-temperature, high-pressure aqueous solutions for temperatures <300 °C. Operation at higher temperatures is possible with ceramic electrolytes. The effect of pressure is mainly due to an increase in absolute hydrogen concentration, which must be taken into account. Ambient humidity can affect the sensor signal because of its influence on the water content of the electrolyte and thus on its proton conductivity. The advantages of these sensors are sensitivity up to 100 ppm, low power consumption, no heating of the sensor element, and operation at high ambient temperature. Reported disadvantages may include the narrow temperature range when using certain electrolytes, the limited lifetime, and the need for periodic calibration. At constant cell voltage, the current varies linearly with the square root of the hydrogen concentration in water [
39,
40,
41,
42].
2. Materials and Methods
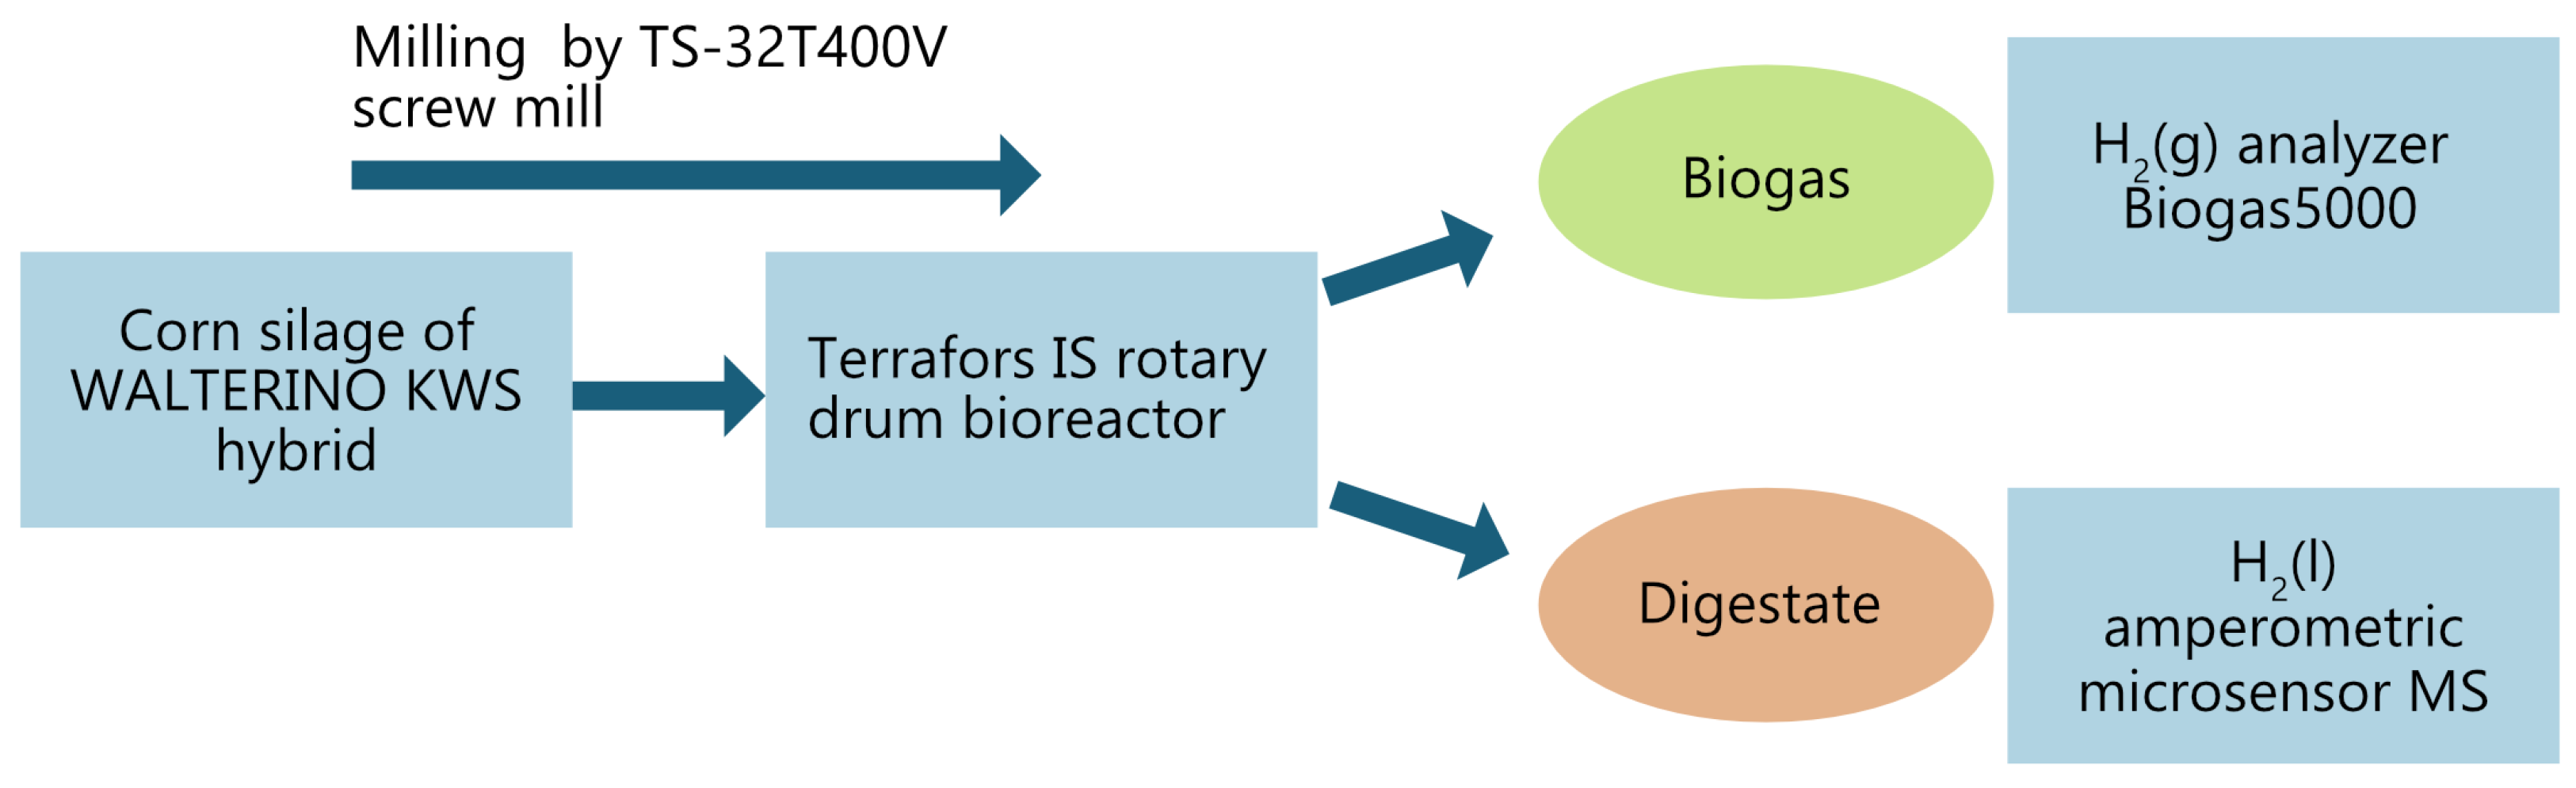
The test was carried out at the Institute of Environmental Technologies, VŠB-TU Ostrava, Czech Republic, where a 150-day single-stage mesophilic monodigestion experiment was conducted. A simple schematic of the experiment is shown in
Figure 2, and the individual parts of the experiment will be described in the following sections.
2.1. Pre-Treatment Procedure
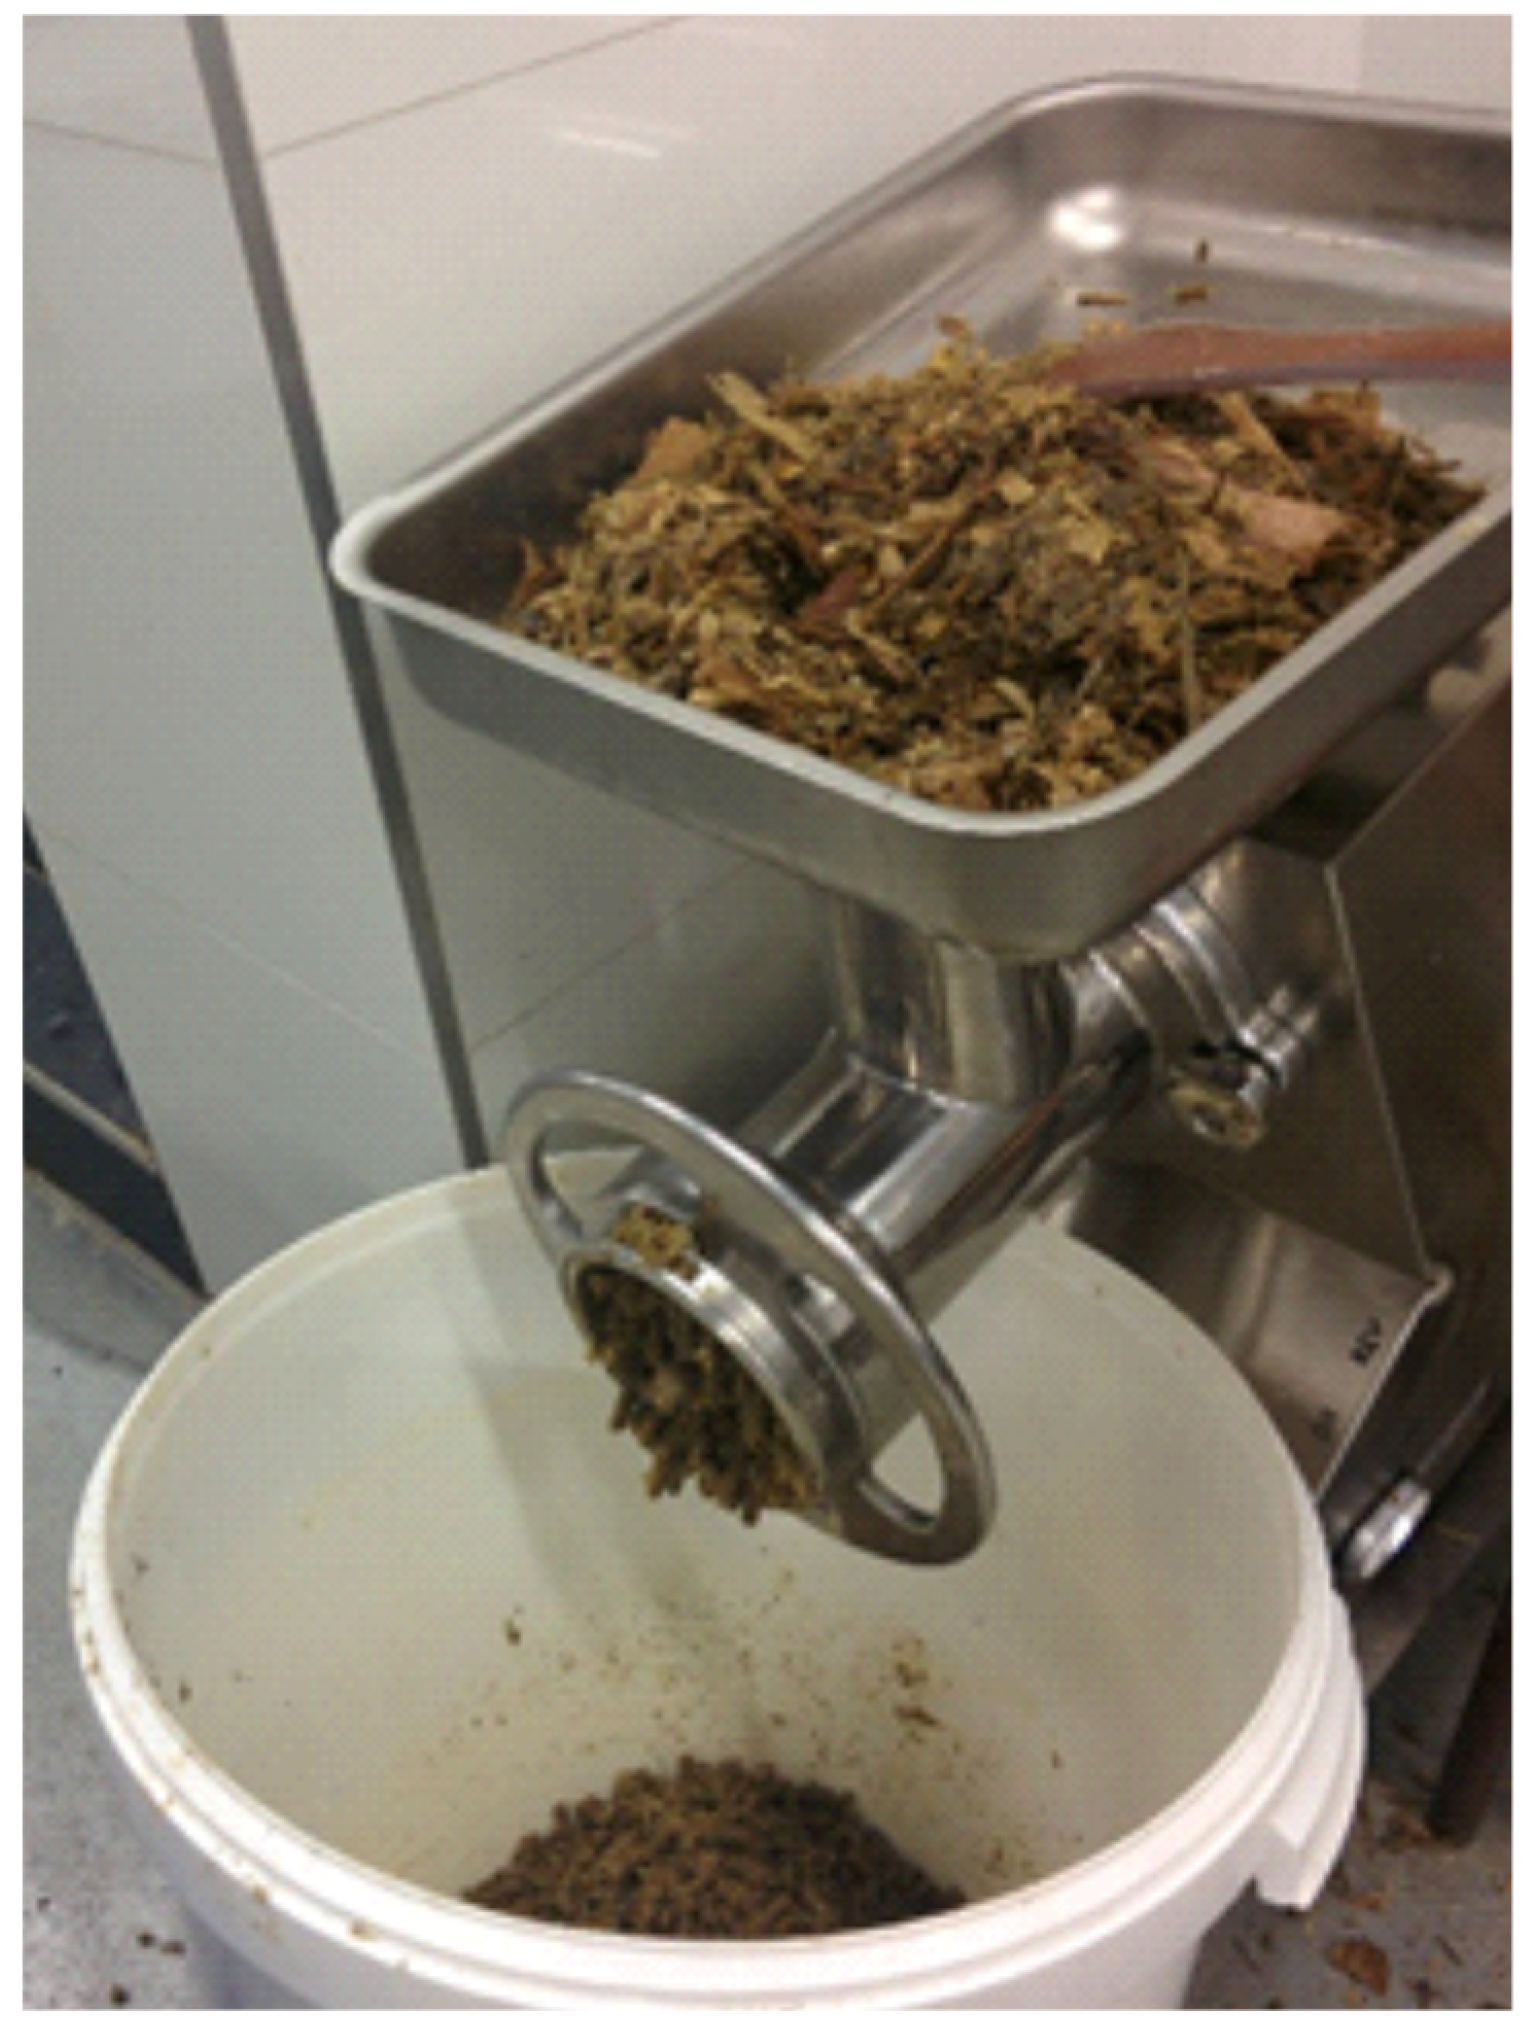
The substrate chosen for the experiment was maisee silage (WALTERINO KWS hybrid). To ensure homogeneity, the silage was milled using a TS-32T400V screw mill (RM Gastro sro., Prague, Czech Republic) passing through a matrix with round holes with a diameter of 6 mm (
Figure 3). After milling, the corn silage was kept in a refrigerator at 4–6 °C, which helped to suppress possible acidification and keep the substrate in optimal condition for use throughout the experiment. The reasons why maize is the most widely used crop for single-stage anaerobic digestion are the high yield potential of this crop, its favorable quality characteristics, the possibility of preserving the matter by ensiling, the easy ensilation of maize biomass, and the possibility of using the ensilable matter to supply the biogas plant throughout the year. The ensiling process increases the methane yield by up to 25% compared to fresh material due to the fact that lactic, acetic, and formic acids and alcohols, which are precursors to methane formation, are formed during ensiling. Another reason may be the partial decomposition of fiber, which improves the availability of nutrients for methanogenic bacteria. Another advantage of maize silage production technology is that it can be cut into very small pieces at harvest, since the shorter the cut, the greater the surface area of the individual particles and the better the degradability of the organic matter in the fermentor. According to [
43], the shortening of the cuttings increases the biogas yield by up to 10%.
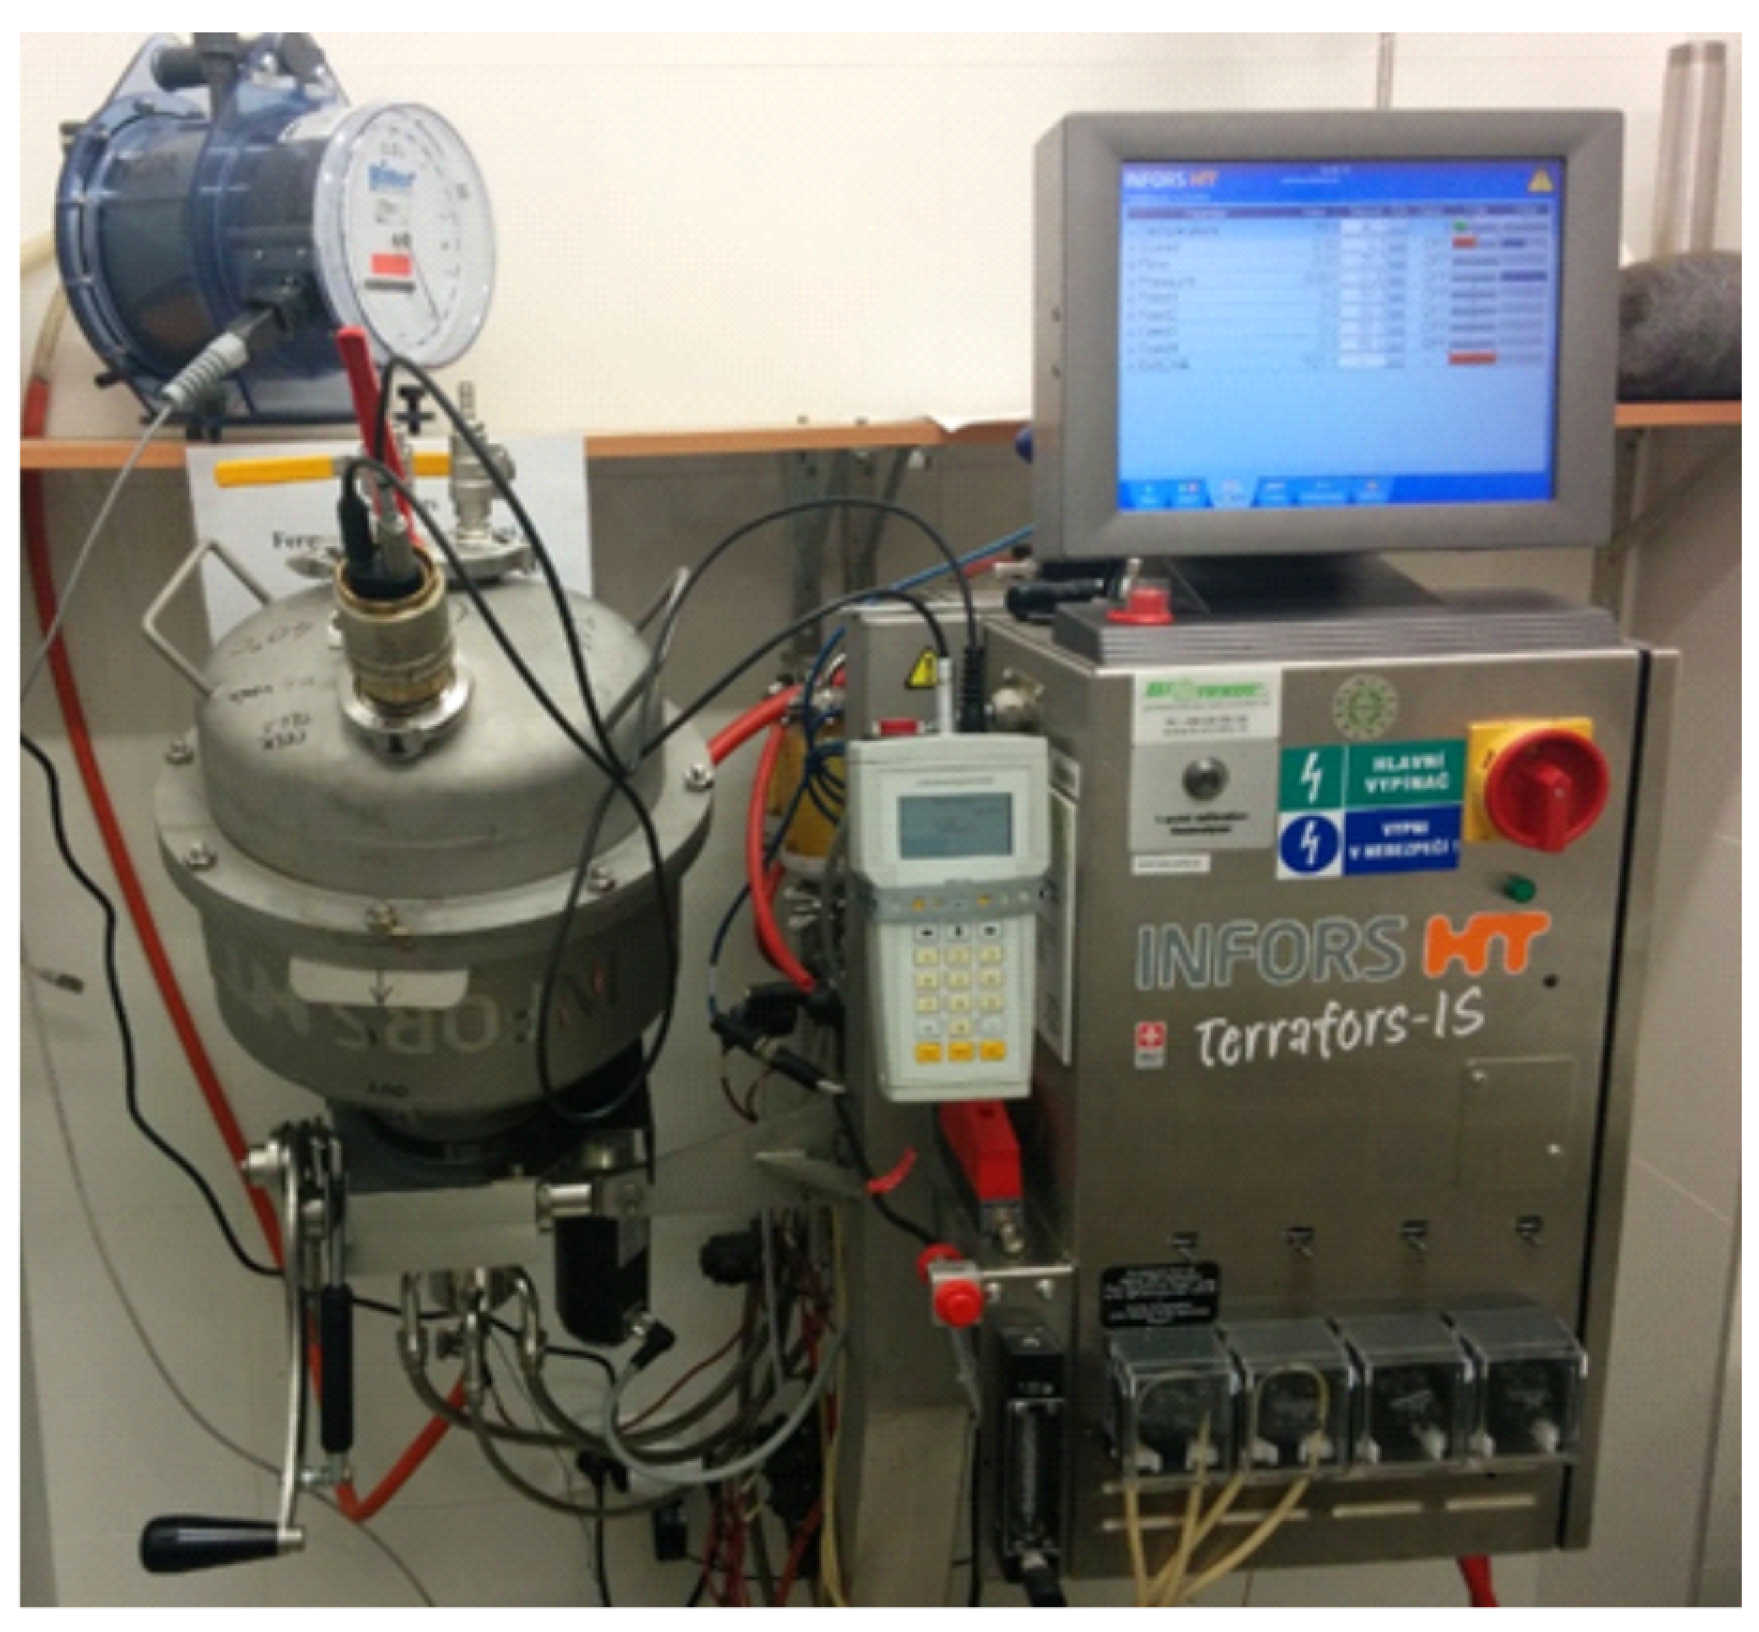
The process was implemented in a Terrafors IS rotary drum bioreactor (INFORS HT, Bottmingen, Switzerland), which is illustrated in
Figure 4.
A drum reactor with a total volume of 0.0187
was filled with 15.0 kg (approximately 0.015
) of liquid inoculum, which was anaerobic digestate obtained from the Pustějov II plant from fermenter 1. The inoculum was treated on a screw grinder passing through a matrix with 6 mm diameter holes to minimize the formation of floating crusts. During the experiment, the suspension was continuously stirred, which was ensured by rotating the reactor drum around the horizontal axis. The rotation speed was set at 0.7 min
−1. The temperature of the experiment was fixed at 40 °C, representing the optimum conditions for a mesophilic anaerobic process. The substrate was fed into the drum reactor a total of 66 times. The average substrate dose was 286 g. However, during overload, up to 1500 g of substrate was administered on some days. The main substrate parameters such as composition, nutritional value, and other relevant information are detailed in
Table 1, providing important data to monitor and interpret the experimental results.
2.2. Monitoring the Experiment Progress
The temperature of the suspension was continuously measured by a thermocouple that passed through the horizontal shaft of the reactor in the center of its compartment. Data were recorded manually once a day, ensuring regular monitoring of temperature conditions throughout the experiment. The biogas stream exiting the reactor passed through a pipe that axially led from the gas compartment through the horizontal shaft of the reactor. The amount of biogas produced was continuously measured using a rotary drum gas meter TG05 (RITTER GmbH, Schwabmünchen, Germany), with gas volume increments manually recorded once a day. The biogas composition was analyzed using a Biogas5000 portable analyzer (GEOTECH Ltd., Coventry, UK) on working days prior to digestate sampling and substrate dosing. This analyzer used infrared sensors for methane (CH4) and carbon dioxide (CO2) and electrochemical sensors for oxygen (O2) and sulphane (H2S). During gas composition analysis, the reactor rotation was stopped, and the biogas sample was collected through one valve and then returned to the reactor gas space via an adjacent valve. To verify the dissolved hydrogen content, a sensor was placed in the liquid phase and introduced into the compartment using a 32 mm diameter valve, commonly used for digestate sampling and substrate dosing. The sensor was sealed with silicone rubber, and stabilization of the sensor in the anaerobic slurry typically took 15 min. The rotation of the reactor was restored only after the sensor was removed and a batch of substrate was inserted, which ensured the safe conduct of the experiment and the reliability of the measured data.
2.3. Measurement of Dissolved Hydrogen
The dissolved hydrogen sensor, model AM 08 (AMT Analysenmesstechnik GmbH, Rostock, Germany), used amperometric detection with a declared detection limit of 0.2 μg dm−3 H2(l) and a measurement range of up to 1.5 mg dm−3 H2(l). The tips of both sensors were located approximately 30 mm below the substrate surface. After measuring the dissolved hydrogen content, a digestate sample (approximately 0.9 times the volume of the substrate batch) was taken for further analysis, and then the substrate batch was introduced into the reactor. The digestate sampling was performed at a frequency corresponding to the substrate sampling.
2.4. Determination of Substrate and Digestate Characteristics
The following analyses were systematically performed on the substrate and digestate samples to characterize their chemical composition and properties in detail.
2.4.1. Determination of pH
The method involved the use of a 340i meter and a SenTix 41 probe (WTW, Weilheim, Germany). This analysis is crucial for monitoring the acidity or alkalinity of the samples, which has an impact on microbial activity and the overall process of anaerobic biogas production.
2.4.2. Determination of Total Solids
This parameter was obtained by drying the samples at 105 °C in an oxygen atmosphere until a constant mass was reached. A DLB 160 3A moisture analyzer with halogen lamp (KERN, Balingen, Germany) was used for this purpose. The accuracy of this analysis was determined to be 2.0% relative standard deviation (RSD).
2.4.3. Determination of Volatile Solids
The weight loss method was used to determine the organic content by annealing the samples at 550 °C in an oxygen atmosphere using a TGA 701 thermogravimetric analyzer (LECO, Benton Harbor, MI, USA). The accuracy of this analysis was determined to be 5.0% RSD.
2.4.4. Determination of Volatile Fatty Acids/Total Inorganic Carbon
The VFA/TIC ratio is important for evaluating the fermentation activity and the stability of the anaerobic biogas production process. It was determined using a TIM BIOGAS V02.2 automatic titrator (HACH Lange, Düsseldorf, Germany) [
44]. This set of analyses provided comprehensive information on the chemical composition of the substrates and their changes during the anaerobic biogas generation process. This information is crucial to optimizing the process and maximizing the performance of the anaerobic biogas plant.
2.5. Data Analysis
We conducted a correlation analysis on the selected set of characteristics, which includes H2 in its liquid and gaseous forms, as well as VFA/TIC (FOS/TAC). We utilized two widely recognized correlation coefficients: Pearson’s and Spearman’s. Pearson’s correlation coefficient was chosen for its ability to assess the linear relationship between two continuous variables, particularly when changes in one variable correspond proportionally to changes in the other. In contrast, the Spearman correlation coefficient was used to evaluate the monotonic relationship between two continuous variables, as it relies on the ranked values of the variables rather than their raw data, making it effective regardless of the proportionality of the changes. Data analysis was carried out in Python (v. 3.11) using the SciPy (v. 1.14.1), Pandas (v. 1.5.3), and NumPy (v. 1.24.2) libraries to perform statistical tests, dataset manipulation, and preprocessing.
3. Results and Discussion
The main parameters of the inoculum, substrate, and digestate measured during the experiment are given in
Table 1.
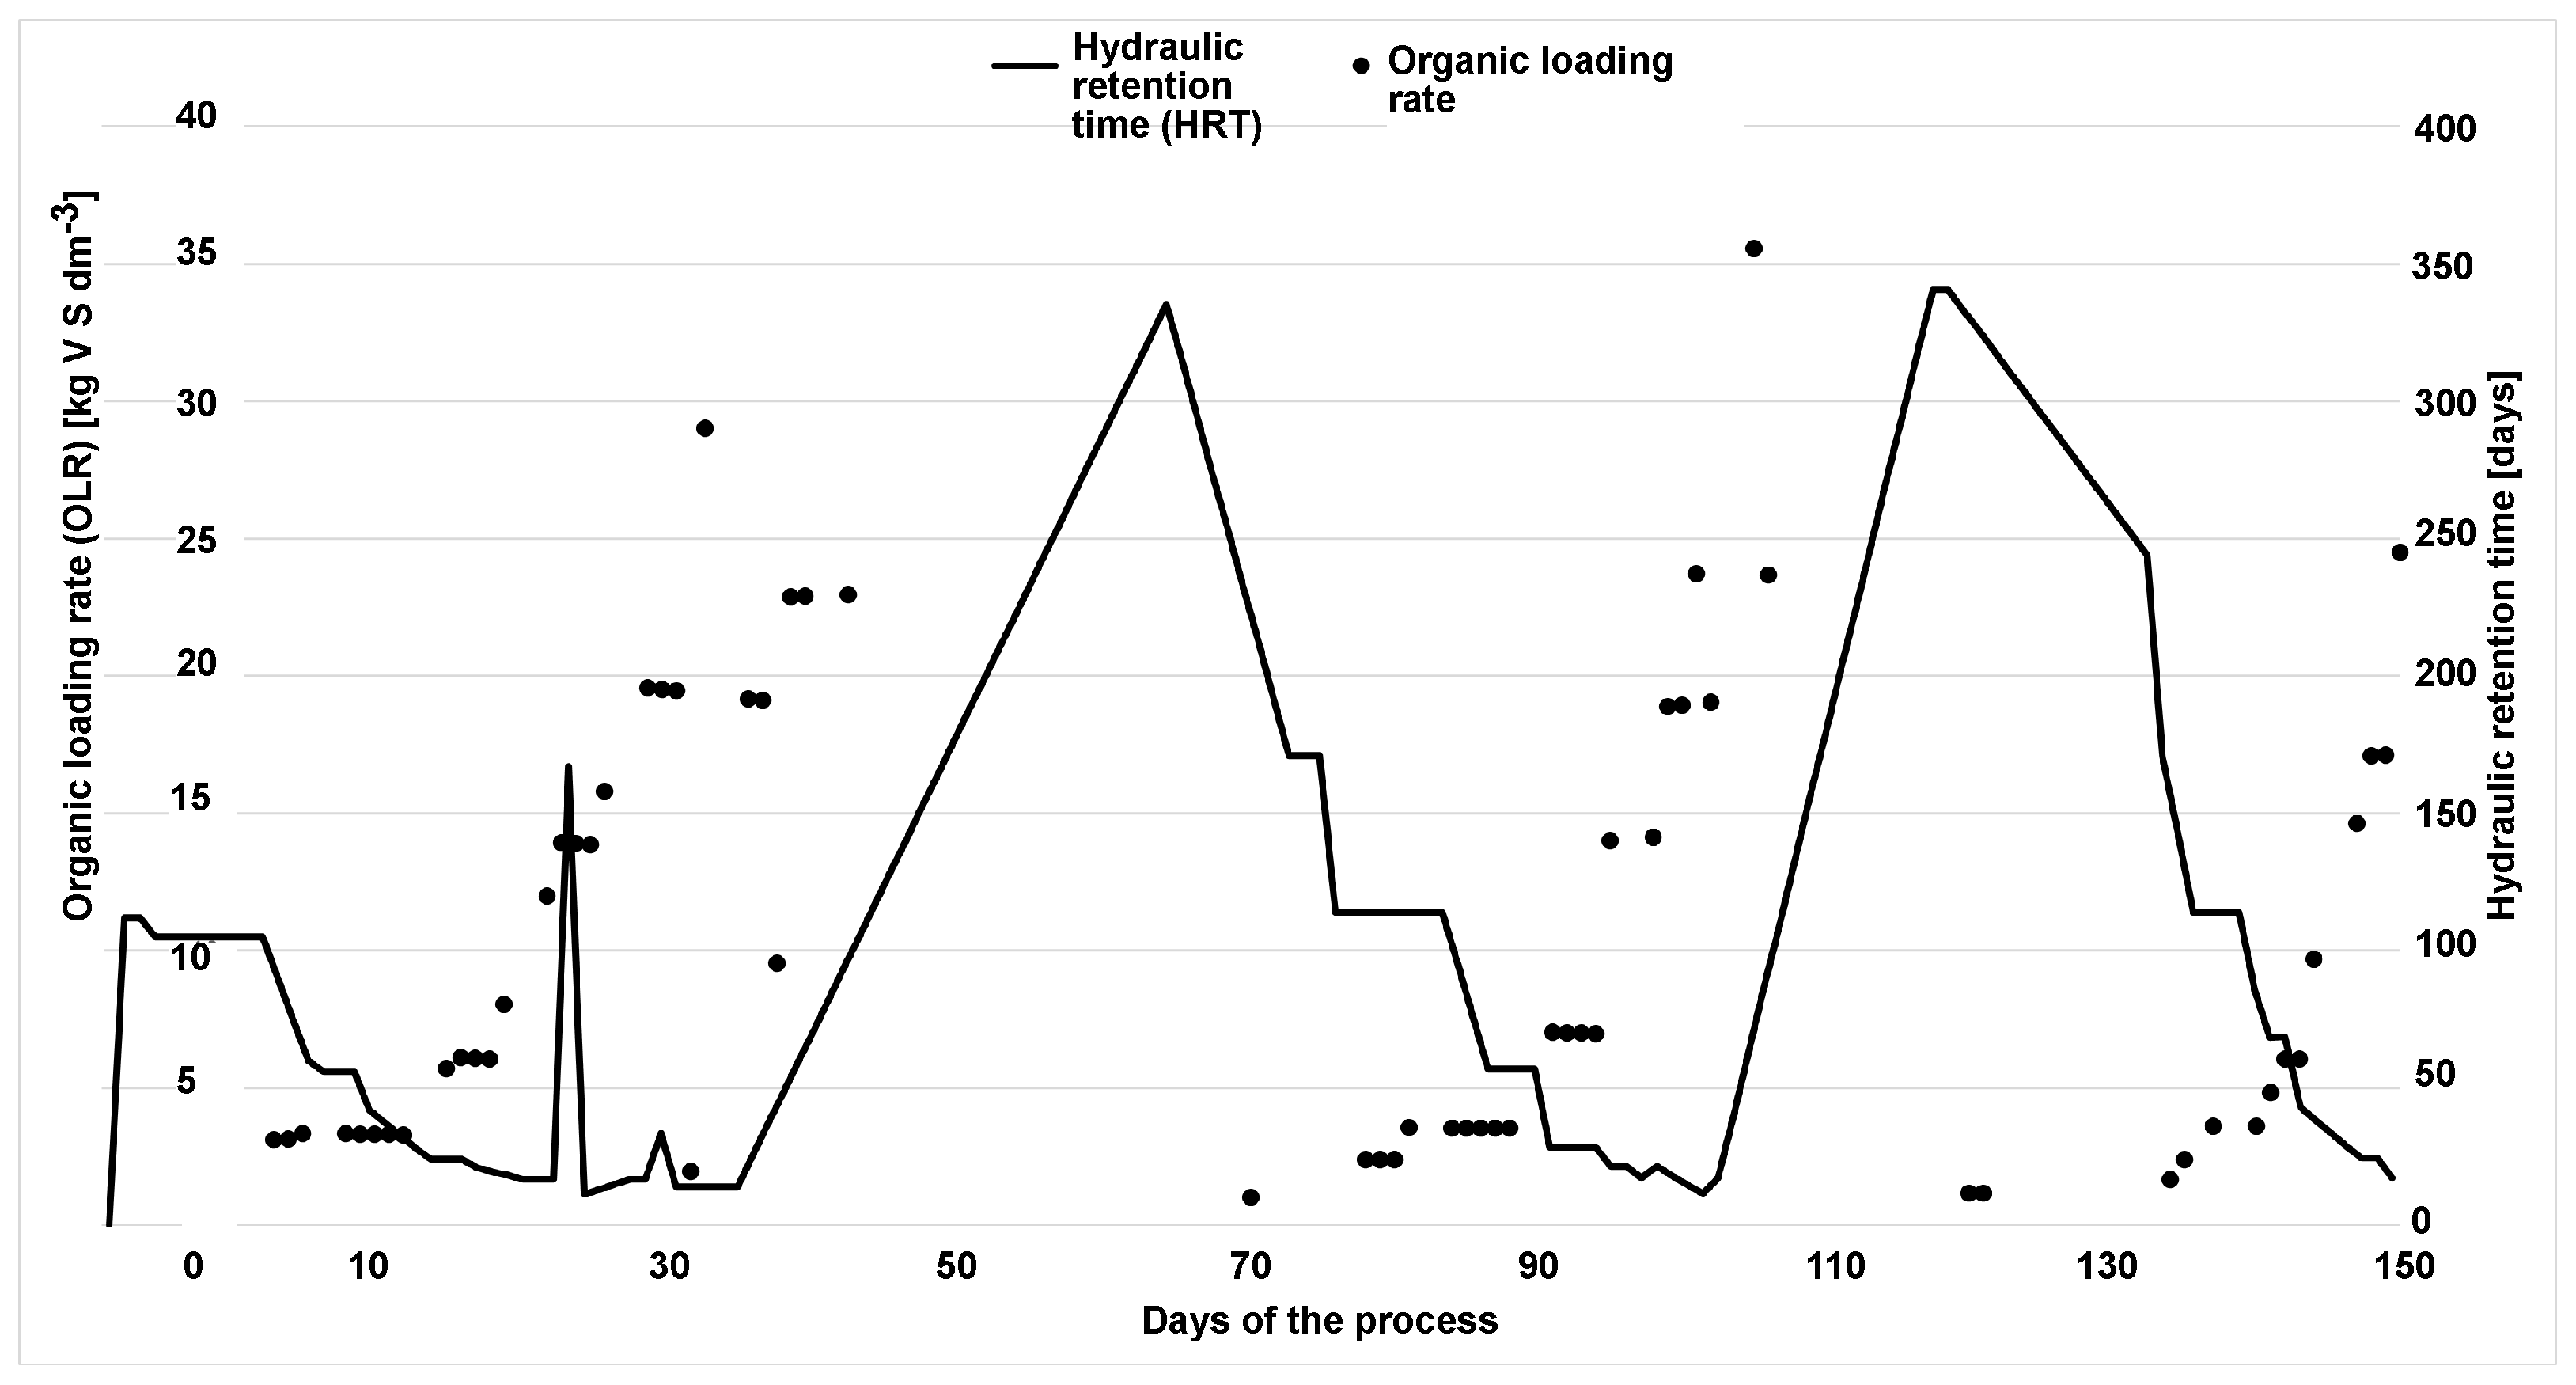
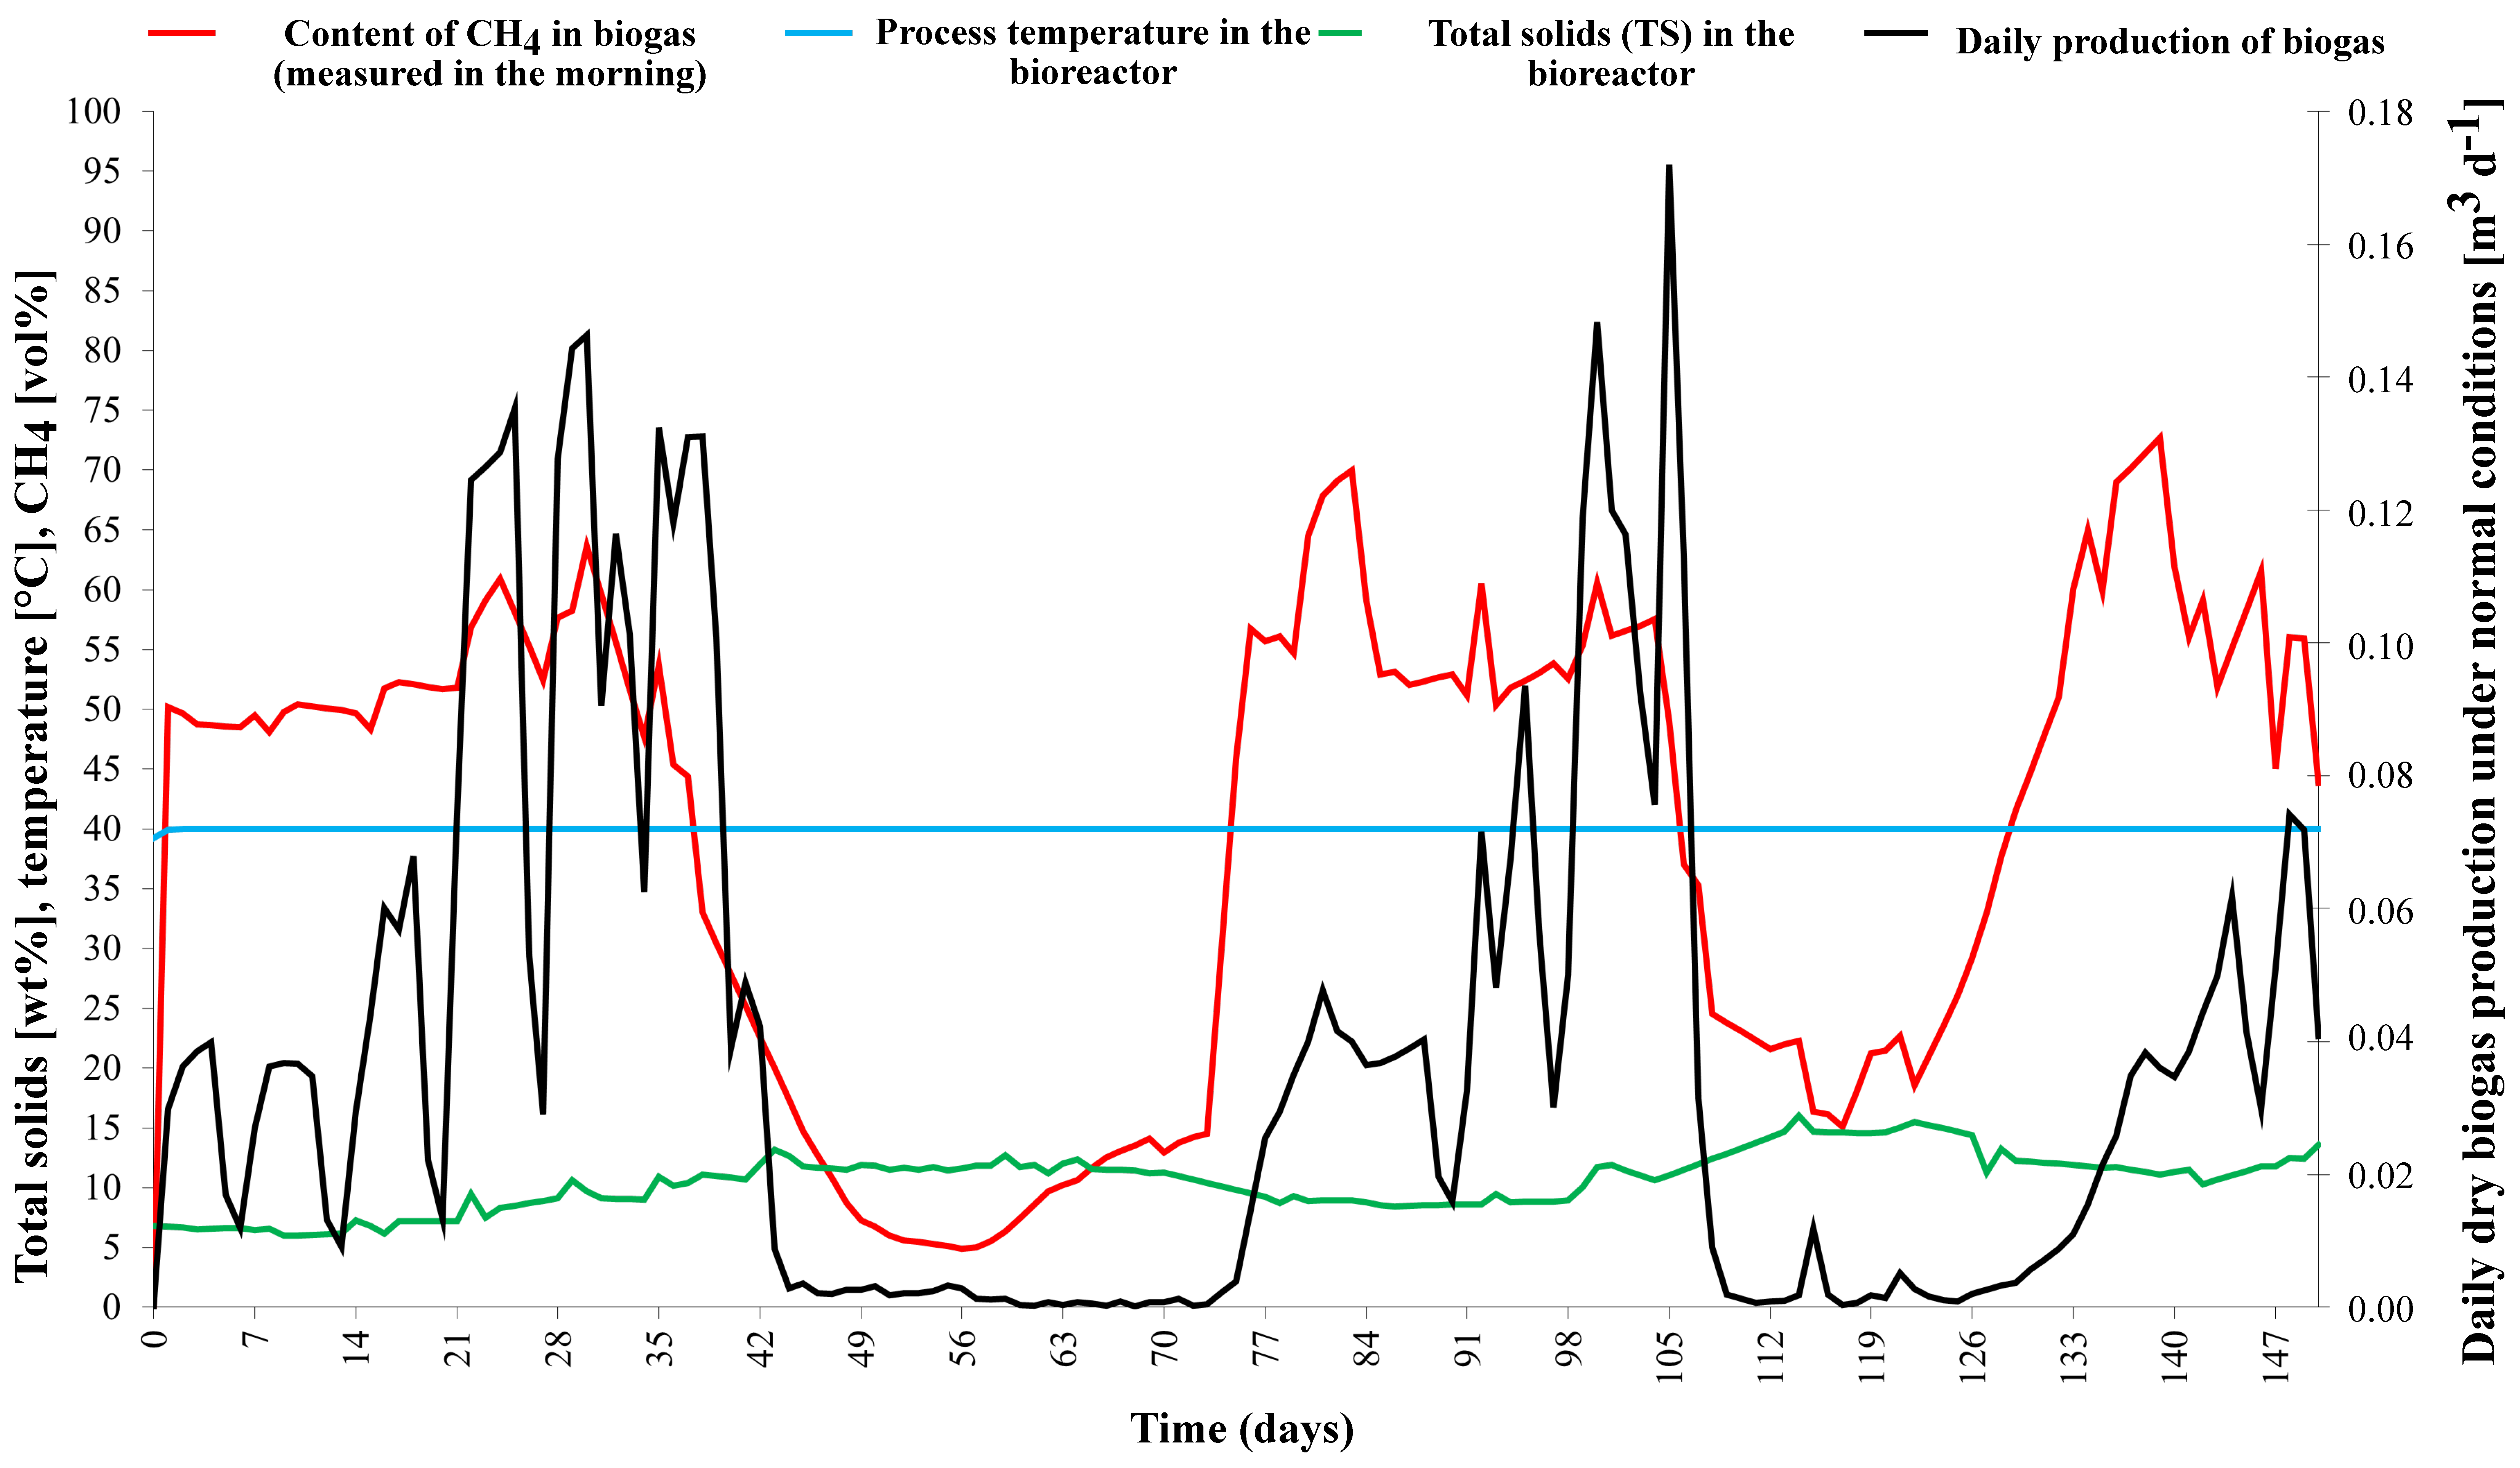
During the 150 days of monodigestion, the total solid content of the substrate was mainly around 32.99%, with an average loss by annealing of approximately 94.81% of total solids (see
Figure 5). The organic loading rate (OLR) was deliberately altered so that significant overloading was caused by hydrogen evolution and subsequent regeneration occurred. Calculated for all 150 days of the experiment, the OLR ranged from 0 to 35.56 kgVS m
−3 d
−1 with an average of 4.45 kgVS m
−3 d
−1. Calculated for feeding days only, the average OLR was 1.396 kgVS m
−3 d
−1, which is still a relatively low load for a mesophilic reactor. The average hydraulic retention time (HRT) was 55 days. The correlation between OLR and HRT can be seen in
Figure 5. During overload, the methane content in the biogas was 70.4%.
After stabilization of the process, there was a gradual increase in biogas production on day 21, when biogas production increased dramatically. The most efficient process occurred at a load of approximately 13.93 kgVS m
−3 d
−1 and a hydraulic retention time (HRT) of 24 days. The methane content remained high until the 40th day, but gas production decreased due to overload. Around the 70th day, the process stabilized again due to the omission of substrate doses and the subsequent low load (see
Figure 6). The second loading of the process occurred on the 90th day, when biogas production increased dramatically again. The most efficient process occurred at a load of approximately 18.87 kgVS m
−3 d
−1 and a hydraulic retention time (HRT) of 21 days. Shortly after the equalization, the methane production was unusually high, an expected phenomenon due to the methanization of accumulated volatile acids.
The main digestate parameters are described in detail in
Table 1. From the analysis in
Figure 7, it is clear that the pH drop in the reactor occurred later, before overloading started, leading to the accumulation of volatile fatty acids (VFAs). This situation is a well-known phenomenon in the field of anaerobic treatment of organic materials. The limiting value for the ratio of volatile fatty acids to total inorganic carbon (VFA/TIC), which determines the stability of the process, appears to be approximately 0.4. This value is consistent with the commonly reported range [
45,
46] and indicates that the process was within the expected parameters.
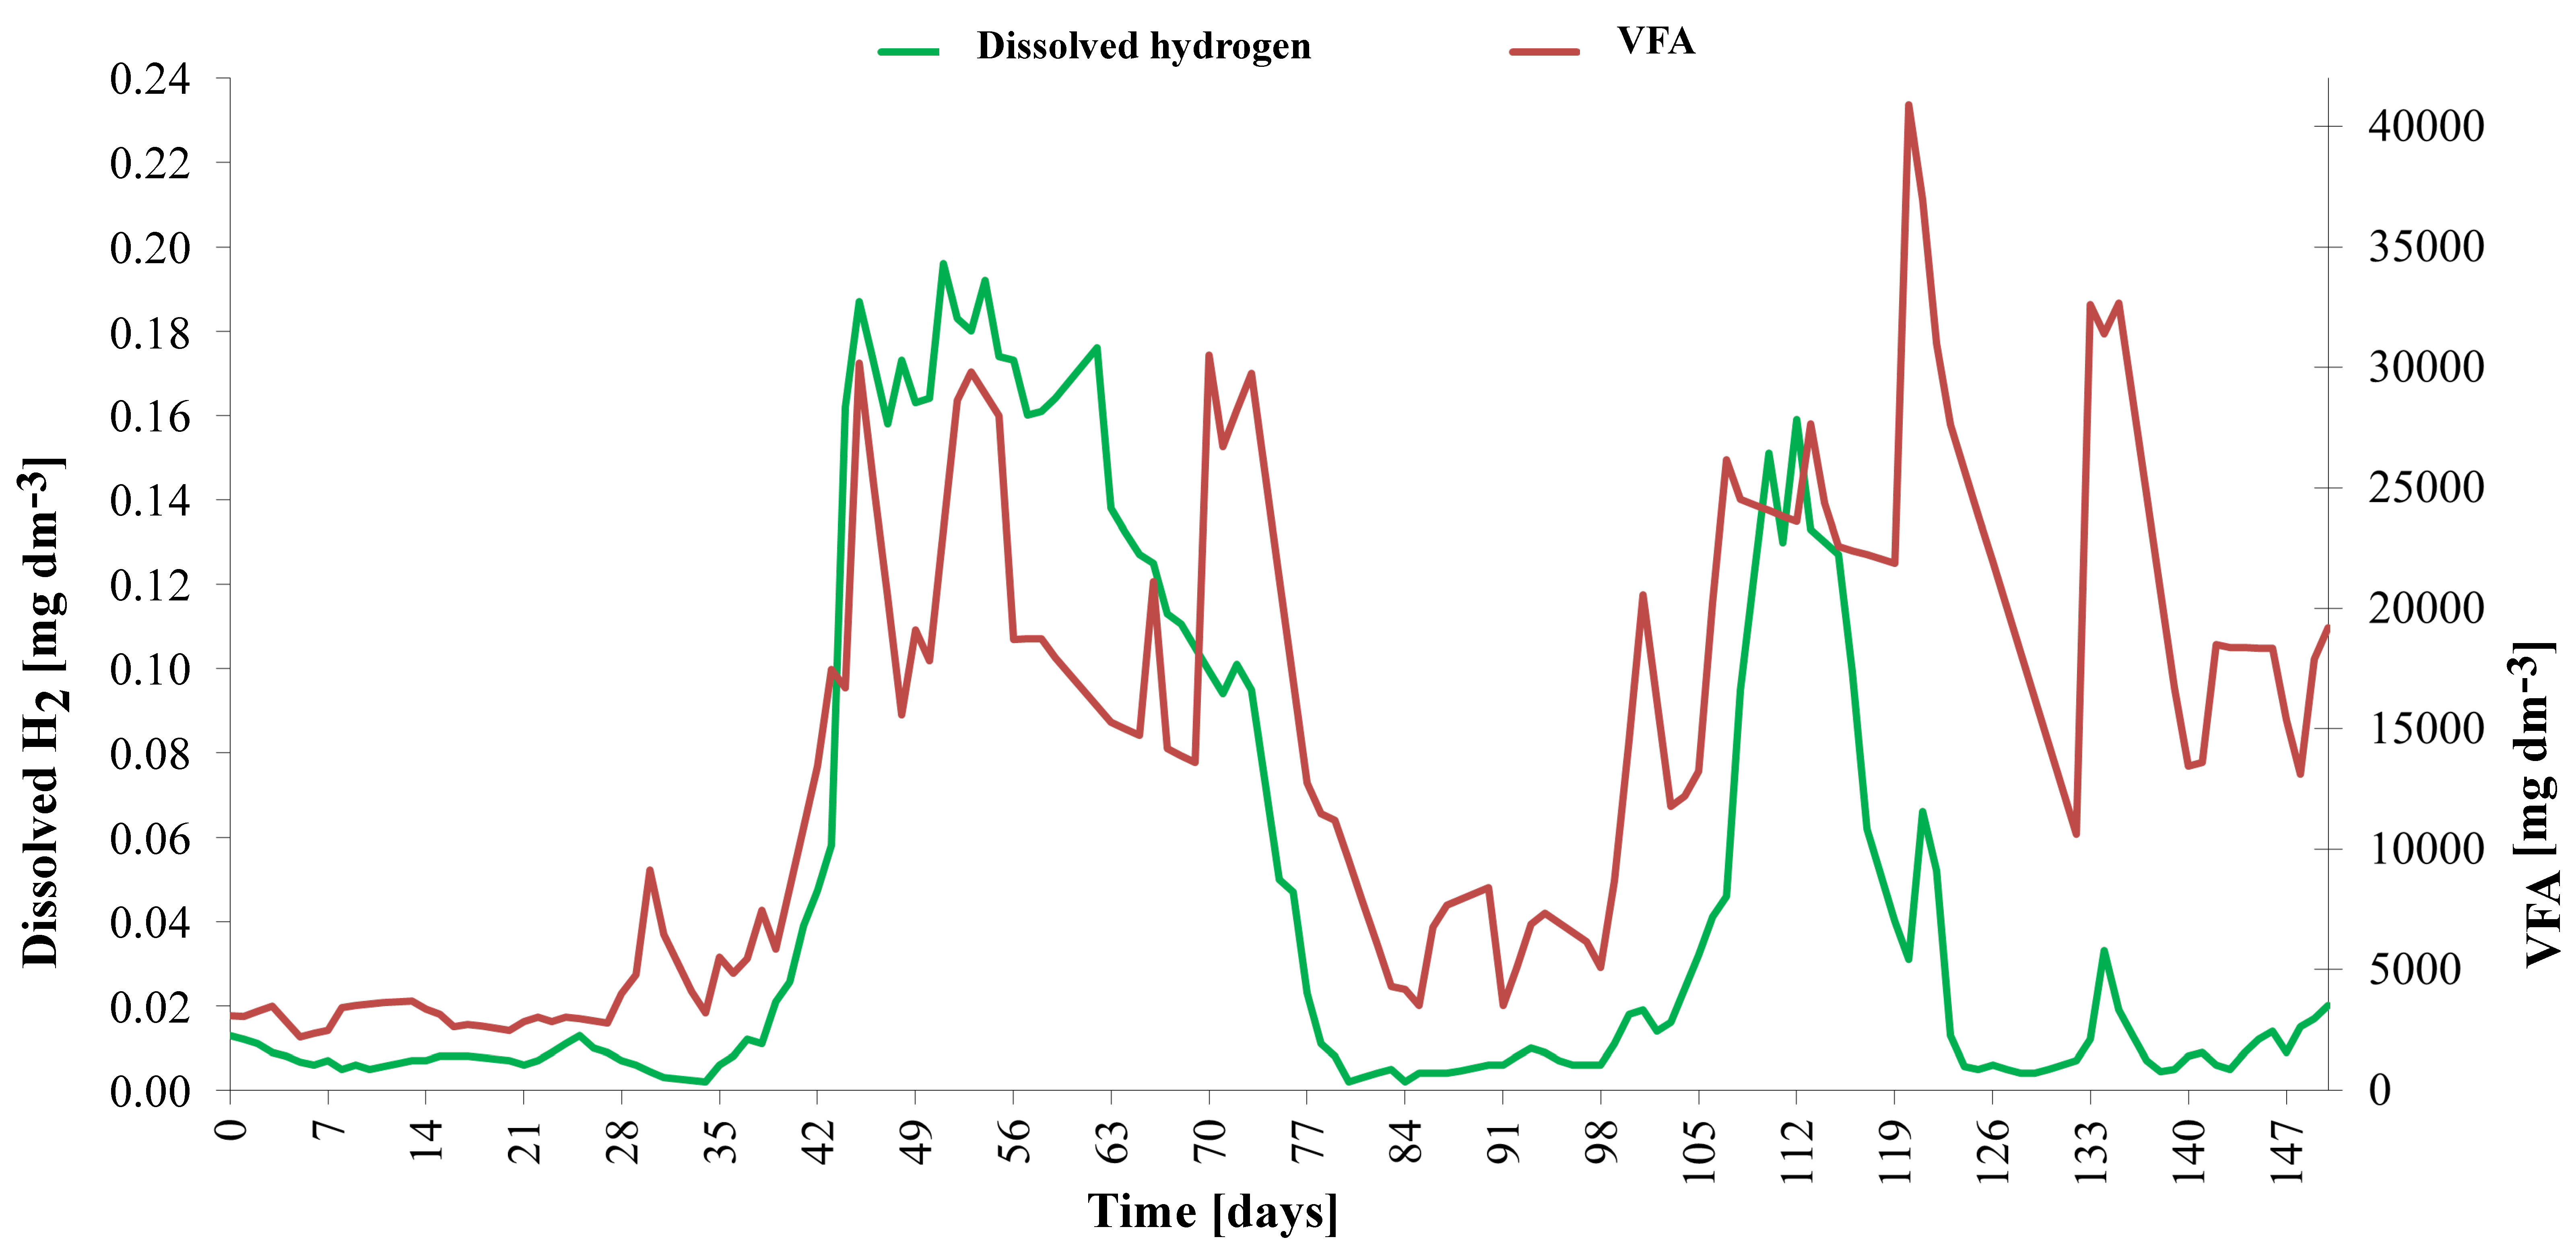
Due to a significant dose reduction, the extreme overload (peak VFA/TIC of 4.62) was overcome in approximately 48 days. The evolution of the dissolved hydrogen concentration is shown in detail in
Figure 8. The dissolved hydrogen concentration, measured using an amperometric microsensor, oscillated between 0.390 mg dm
−3 and 0.425 mg dm
−3. During the non-overload period, the typical concentration of H2(l) was 0.12(4) mg dm
−3, corresponding to a partial pressure of approximately 6000 Pa. During overload, H
2(l) concentration reached 0.40 mg dm
−3, corresponding to a partial pressure of about 20,000 Pa. Similarly, high values were measured after initial heating of the inoculum at the beginning of the experiment. If elevated hydrogen concentrations persist for several days, they lead to a rapid increase in volatile fatty acid (VFA) content. Under such conditions, fermentation pathways shift toward the production of more reduced metabolites, such as propionate and butyrate, rather than acetate, which is more easily converted to methane. This shift results in the accumulation of VFAs within the system. Furthermore, the buildup of VFAs lowers the pH of the digestate, creating a feedback loop that further inhibits methanogenic activity and destabilizes the anaerobic digestion process [
47].
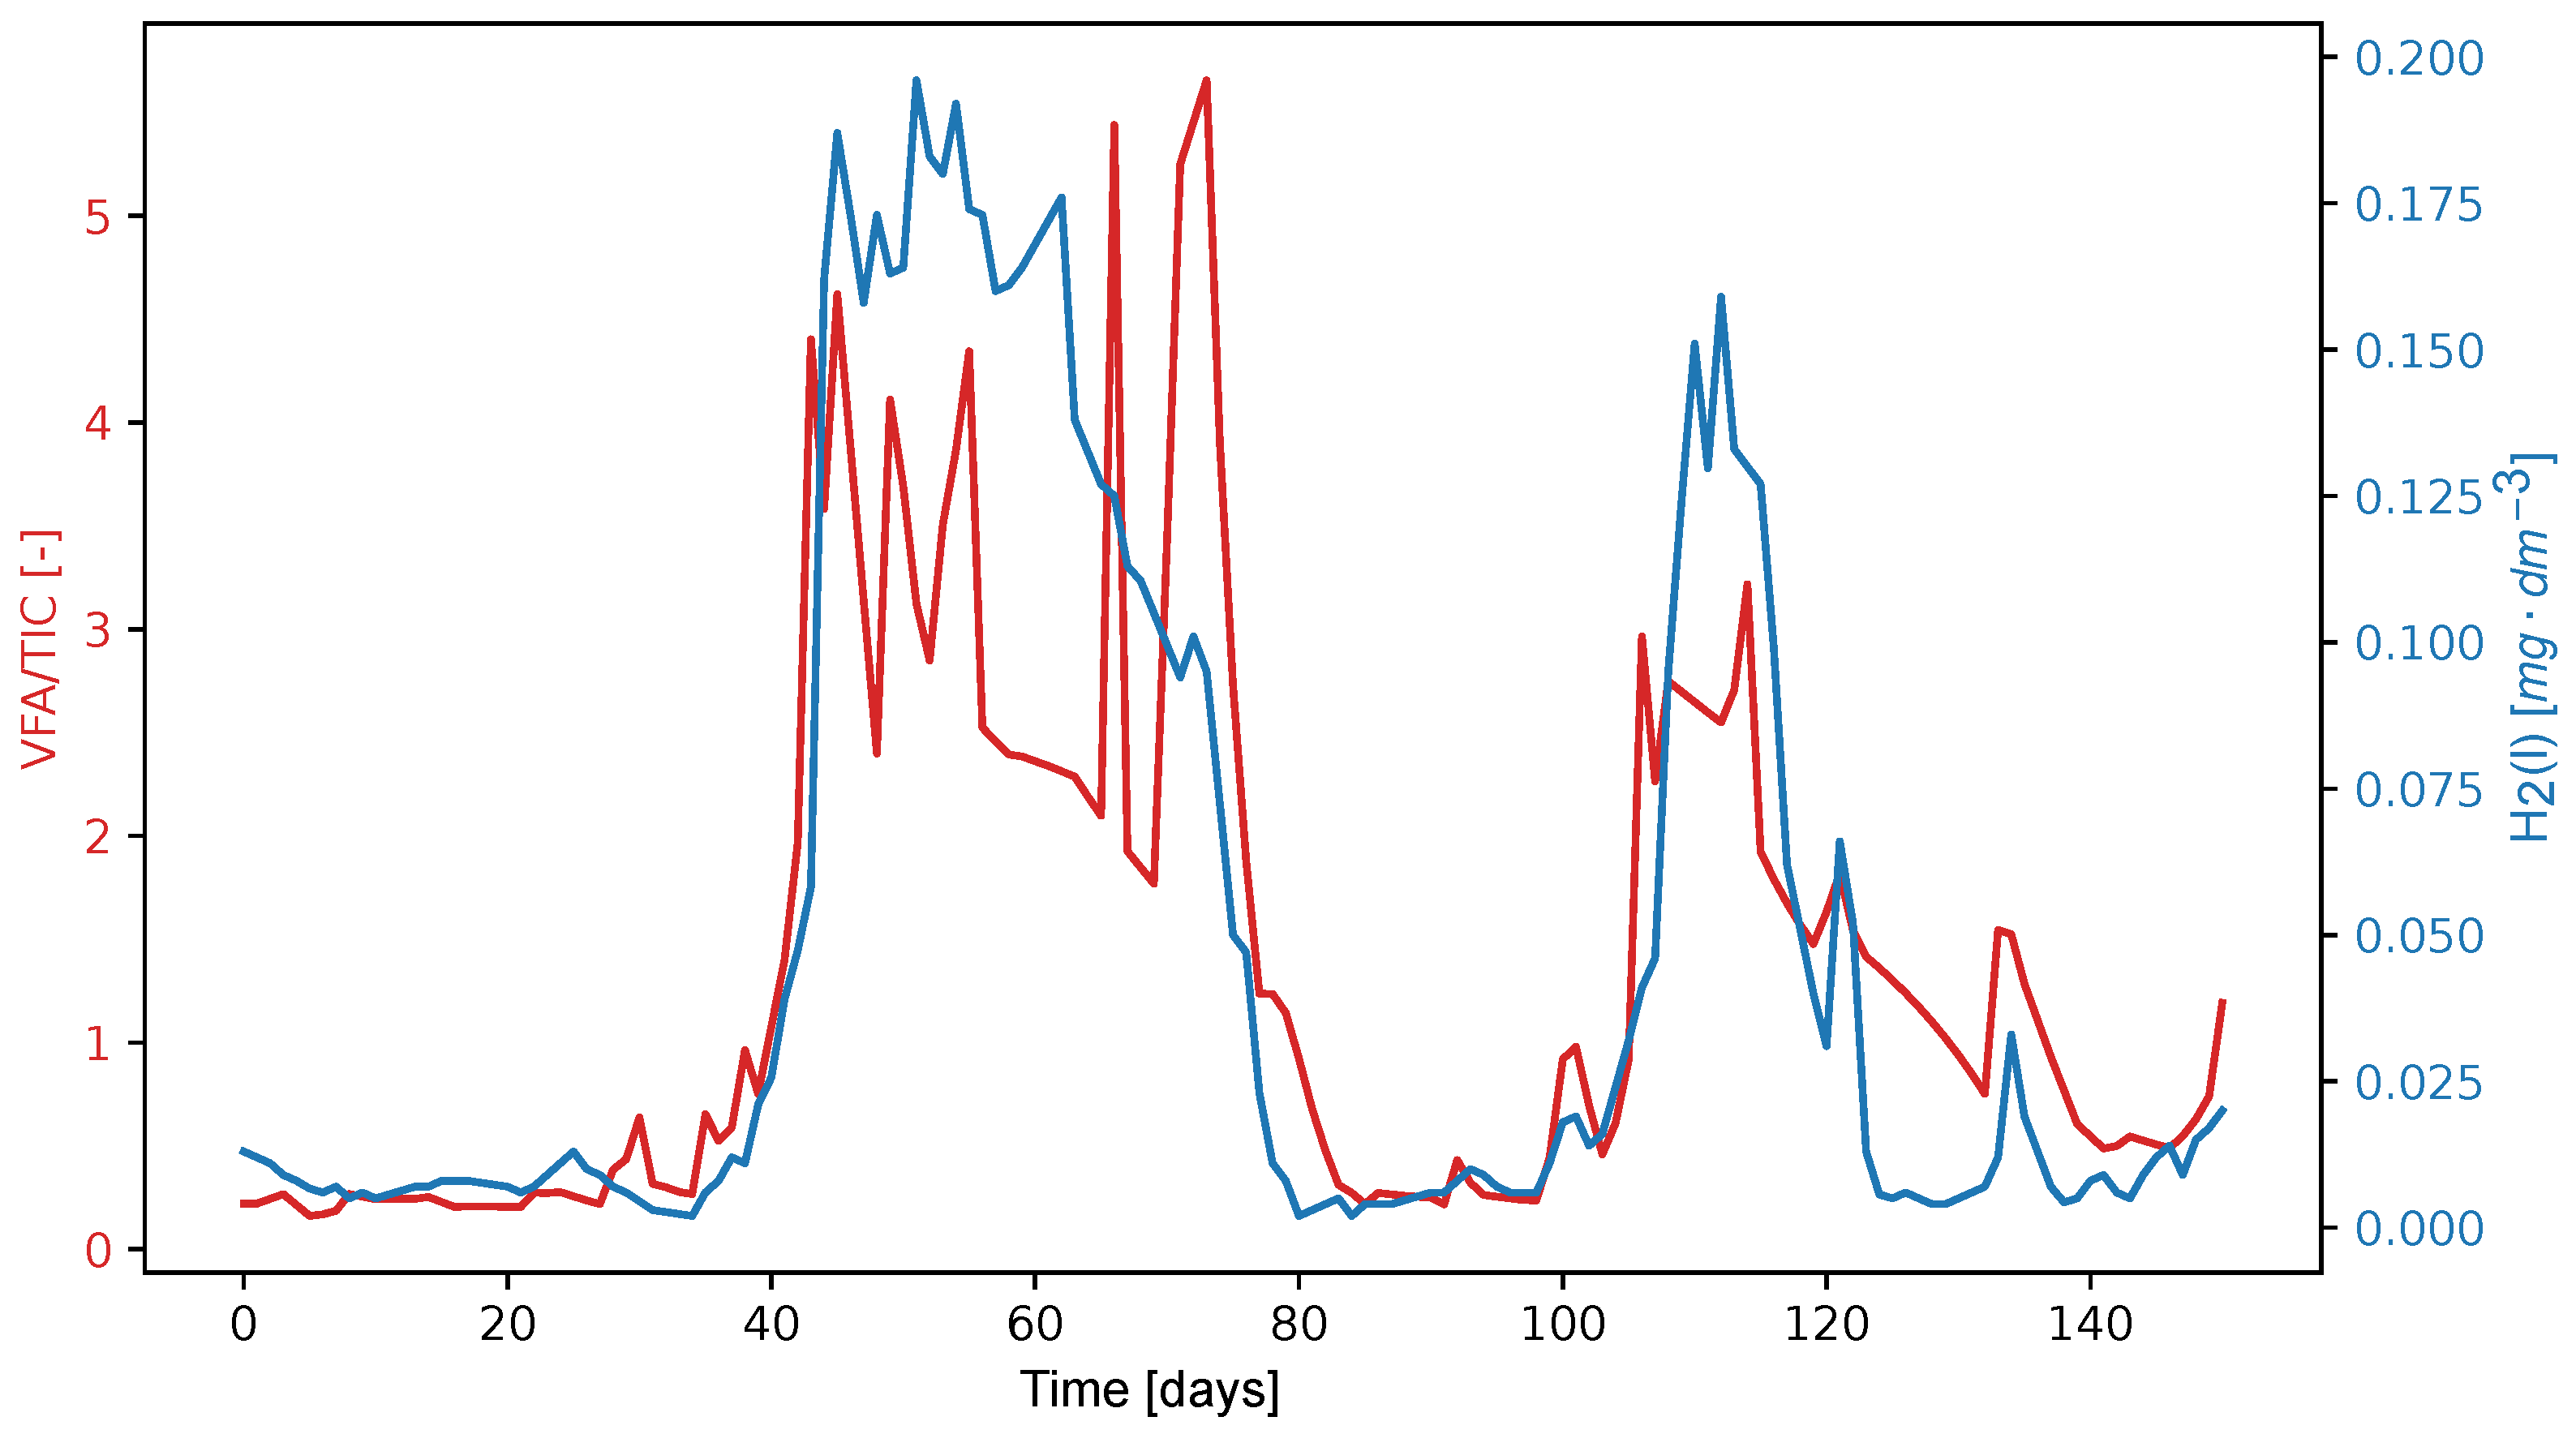
An alternative parameter for assessing process stability, defined as the ratio of dissolved hydrogen concentration to the TIC, is presented in detail in
Figure 9. To date, this parameter has not demonstrated significantly higher sensitivity than the commonly used VFA/TIC ratio. After aligning the maxima of both peaks, it appears that the leading edges of both peaks coincide on the same process day. This behavior will require further validation across different co-fermentation processes. In the case of the observed process, the new value of the parameter (H
2(l)/TIC) * 48,000 reached a value of 1.0, which was a signal of instability. However, this signal appeared almost simultaneously when the VFA/TIC ratio increased above 0.4, indicating that acid formation is occurring rapidly. Some processes probably require overload suppression in the early stages. Since the detection limit of H
2(l) amperometric sensor is 0.5 μg dm
−3, which corresponds to a partial pressure of H
2(g) of 10 Pa, and some studies mention incipient instabilities as low as 2 Pa [
48], it is advisable to look for a more sensitive sensor. Another challenge is the robustness and durability of the amperometric sensor in a sludge environment, which is not yet satisfactory. Although a thermal conductivity detector can meet the requirements, there may be a problem with its sensitivity. Furthermore, it is important to correlate the concentration profile H
2(l) with the acid concentration determined by GC-MS or isotachophoresis.
The measurement of dissolved hydrogen in anaerobic systems has previously been addressed by Kuroda et al. [
11], who used a voltammetric membrane electrode for continuous monitoring. Their setup included a Pt-Pt black and Ag-AgCl-covered FEP membrane combined with an electrolyte solution of 0.1 M KCl and 0.1 M HCl. This method demonstrated a strong performance, showing a good correlation (r = 0.85) between the theoretical values calculated based on the partial pressure of H
2 and the measured output signals.
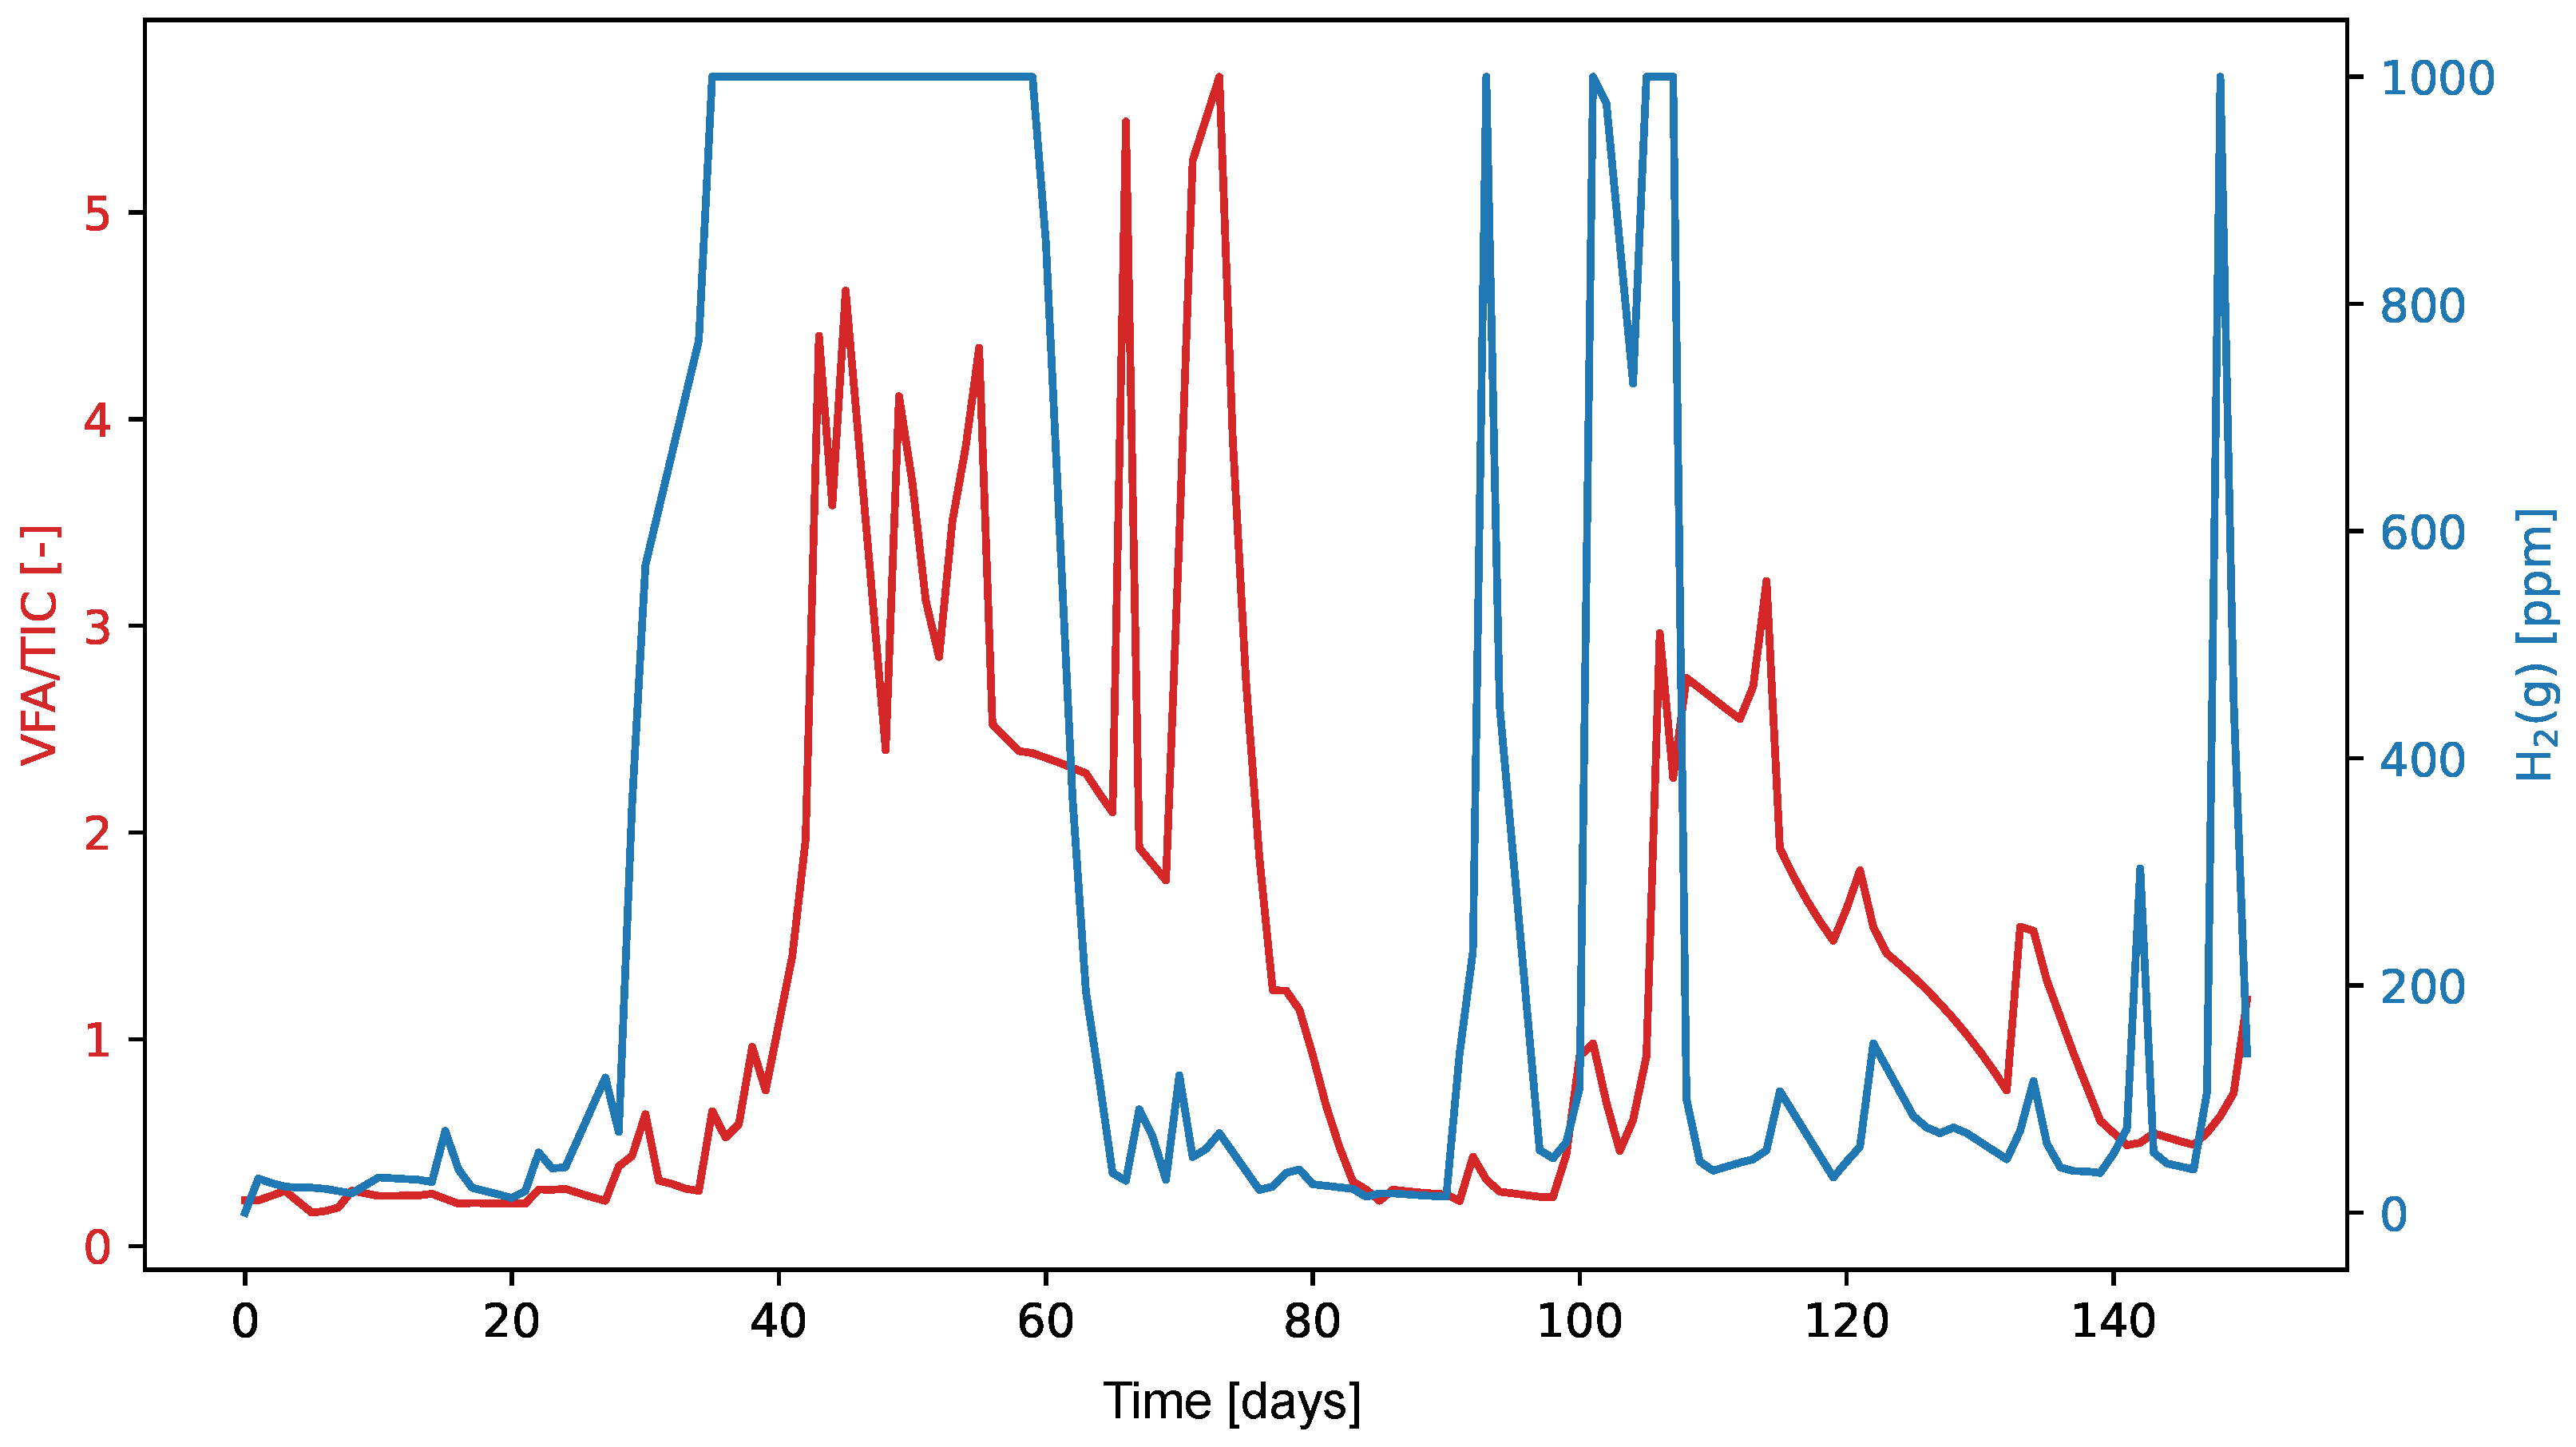
The graphs in
Figure 9 and
Figure 10 show the values of the VFA/TIC and H
2(l) and H
2(g) throughout the experiment. The high Pearson correlation coefficient of 0.76 between H
2 in liquid form and VFA/TIC suggests a likely linear relationship between these two variables, while the lower Spearman correlation coefficient of 0.55 indicates that the relationship may not be strictly monotonic. On the other hand, for H
2 in its gaseous form, the Pearson correlation coefficient is relatively low at 0.34, but the higher Spearman correlation coefficient of 0.55 suggests that the relationship is more likely non-linear yet monotonic.
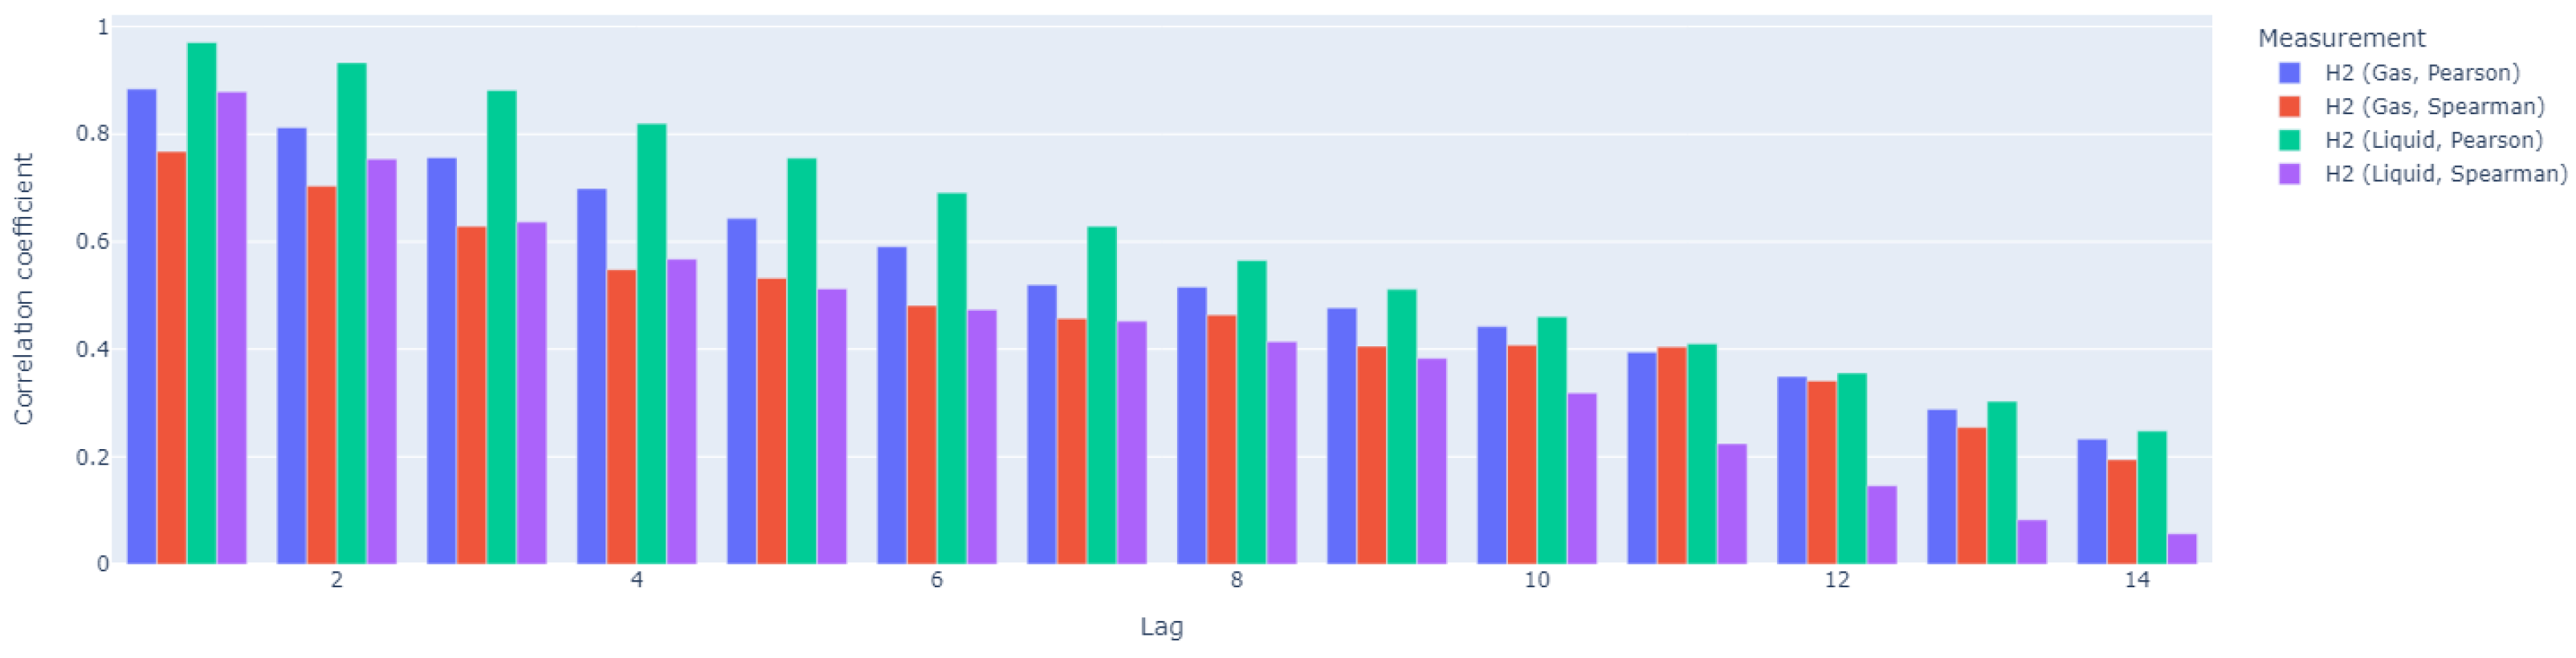
Subsequently, our analysis focused on the time dependency in the data; thus, we calculated autocorrelation coefficients (
Figure 11) and cross-correlation coefficients (
Figure 12) for 14-day-long time windows. H
2 exhibits significant autocorrelation in both its gaseous and liquid states, although the duration of this autocorrelation differs. Gaseous H
2 shows strong autocorrelation up to lag 5, while liquid H
2 maintains autocorrelation for a longer period, up to lag 8. This suggests that the dissolved form of H
2 retains its correlated structure over a longer period of time or a sequence of observations compared to the gaseous form. In both forms of H
2, the Pearson correlation coefficient is higher than the Spearman coefficient, indicating that the relationship between variables is more linear than monotonic.
As shown in
Figure 12, for H
2 in its gaseous form, the Spearman correlation coefficient is higher, indicating a more monotonic relationship. The cross-correlation coefficient increases over time, reaching its peak after lag 7, suggesting that the variables become cross-correlated after approximately one week. In contrast, for H
2 in its liquid form, the Pearson correlation coefficient is higher, indicating a stronger linear relationship. However, the cross-correlation gradually decreases and becomes relatively weak after about one week (lag 8), suggesting that any linear dependency between the variables is likely short-term. In conclusion, H
2 in its gaseous form shows a sustained monotonic relationship with VFA/TIC, becoming cross-correlated after about a week. In contrast, H
2 in its liquid form exhibits a stronger but short-lived linear relationship, with a weakening of the cross-correlation after a week. This indicates that while both forms of H
2 interact with VFA/TIC, the gaseous form maintains a more prolonged interaction, whereas the dissolved form has a brief linear dependency.
Reliable real-time monitoring of the single-stage anaerobic digestion process is crucial to stable and efficient biogas production operations and to prevent potential digestion process failures. Dissolved hydrogen (H
2(l)) concentration is one of the key parameters for the control of the biogas process [
49]. This is mainly because H
2 contributes to electron transfer between fermentative and methanogenic bacteria. As a result, monitoring the hydrogen concentration could allow the quantification of the biological activity of the digester [
50,
51].
Interspecies electron transfer (IET) can proceed via two primary pathways: transfer mediated by hydrogen or formate molecules, or direct electron transfer. The concentration of dissolved hydrogen, a critical parameter closely associated with IET [
52], serves as an essential indicator to monitor the single-stage anaerobic digestion process. It reflects the dynamic balance between hydrogen-producing and hydrogen-consuming microbial activities and is intrinsically linked to the production of volatile fatty acids (VFAs). VFAs play a dual role, influencing production pathways and acting as precursors for biogas generation [
53,
54]. Given the above results, it was particularly interesting to investigate whether the ratio of dissolved hydrogen to total inorganic carbon (TIC) could serve as a more accurate indicator of process instability in anaerobic digestion than that of VFA/TIC.


