1. Introduction
Conventional oil and gas resources in the shallow layer (within 5000 m) are progressively being depleted worldwide due to ongoing exploration and mining activities. Most oil and gas remaining to be mined is in the form of unconventional resources with deep and narrow distribution. As an unconventional resource, shale gas possesses ultra-low porosity and permeability [
1]. Moreover, natural productivity is rare due to the ultra-tight shale gas reservoirs and the complex pore structure of formation development [
2]. In exploiting shale gas reservoirs, the application of conventional methods cannot effectively increase shale gas productivity. Field cases have demonstrated horizontal wells and hydraulic fractures to be the key technologies for effective exploitation of shale gas [
3,
4]. Notably, water can reduce the structural and strength parameters of fractured rocks during shale gas development, resulting in failure propagation [
5]. Reasonable horizontal well design and an effective reconstruction scheme for hydraulic fracturing contribute to favorable conditions that stimulate shale gas production potential. Shale gas productivity evaluation and simulation of its influencing factors are prerequisites for guiding design and reconstruction schemes.
Due to the heterogeneity between reservoir media and changes in the pore structures of shale gas reservoirs after reconstruction, characterizing shale reservoir media and pore characteristics is highly challenging. A majority of the existing models typically consider the reservoir media as unstimulated reservoir volume (USRV) and stimulated reservoir volume (SRV). SRV is defined as a fracture area with high conductivity after fracturing and can be regarded as a box or oval structure [
6]. In contrast, USRV is the remaining part of the initial reservoir after excluding the SRV, and it maintains the most primitive pore characteristics of shale gas reservoirs [
7]. Both serve as crucial reservoir media for the shale gas reservoir production model [
8,
9,
10]. Despite these contributions, many researchers have proposed that the reservoir media should not be limited to USRV and SRV; they have further highlighted consideration of the irreversibly damaged area during drilling and completion [
11]. The geometric features of damaged areas can generally be regarded as conical and angular structures [
6]. The occurrence of damage can largely affect shale gas production. In this sense, these areas represent an important part of the shale gas reservoir media that deserves further consideration [
12,
13]. Multiple media should be considered in modeling to simulate the characteristics of shale reservoirs accurately.
The pore characteristics of shale gas reservoirs are typically divided into micropores and micro-cracks [
14]. The former are the accumulation areas of shale gas, and the latter serve as micro-channels for shale gas flow. Natural fractures can be categorized into structural and non-structural types according to various causes [
15]. These fractures act as the natural flow channels of shale gas in reservoirs. However, many models neglect the existence of natural fractures [
12,
13,
14,
15,
16]. Hydraulic fractures also exist in shale gas reservoirs due to hydraulic fracturing; main, secondary, and micro-hydraulic fractures are the key classes contributing to transporting the shale gas flow [
17]. Most analytical and semi-analytical models consider the existence of main fractures only, ignoring the other types of hydraulic fractures [
17,
18,
19]. This limitation has led to the low accuracy of simulation results in modeling shale gas productivity. The existence of diverse fractures should be considered comprehensively to construct a shale gas production model with desirable performance.
Given the complex flow of shale gas production, investigation into seepage characteristics and their influencing factors has been conducted continuously since the 1970s. In a previous study, a production model considering the finite conductivity of fractures was established, with limited applicability to single fractures [
20]. Commingled reservoir concepts were developed to correct shale gas productivity; however, these ideas neglected the desorption and diffusion of shale gas [
21]. By means of pore images and geochemical techniques, researchers found that the single-phase flow of shale gas was consistent with the non-Darcy flow in nano-micron pores and Darcy flow in fracture systems [
22]. Considering the diffusion and non-Darcy flow in the bedrock pores, as well as the Darcy flow in stress-sensitive fractures, another shale gas production model was established. Due to the lack of comprehensive area division of the reservoir, i.e., failure to fully consider the existence of various regions, the model’s errors increased with the decrease in permeability [
23]. Furthermore, the diffusion effect, adsorption effect, Knudsen diffusion effect, and gas slippage effect of simulated gas were considered in a study simulating nanopore shale flow. However, this research disregarded the dissolved gas in kerogen [
24]. The accuracy of the Langmuir isothermal adsorption equation for the shale gas adsorption process has been validated [
25,
26,
27,
28]. Despite the fruitful results of different effects influencing shale gas production, the existing models do not take into account the dynamic gas viscosity and changes in reservoir temperature and pressure. This factor also affects model simulations of shale gas productivity. Based on the above analysis, in addition to the migration process and influencing factors affecting shale gas, the influence of dynamic viscosity on shale gas productivity should be underscored in shale gas production modeling.
This study constructs a more detailed shale gas reservoir structure, based on previous modeling experience, to improve the accuracy of assessing shale gas productivity. In addition, we introduce Lee’s correlation for gas viscosity, which is widely used in the oil and gas industry, to replace the traditional constant value method for gas viscosity. A multi-media and multi-permeability coupled flow model that is capable of simulating the dynamic viscosity of shale gas is established. This novel model can achieve high prediction accuracy close to the actual data, providing theoretical support for shale gas production and the formulation of reservoir reconstruction plans.
2. Simulation Model
2.1. Physical Model
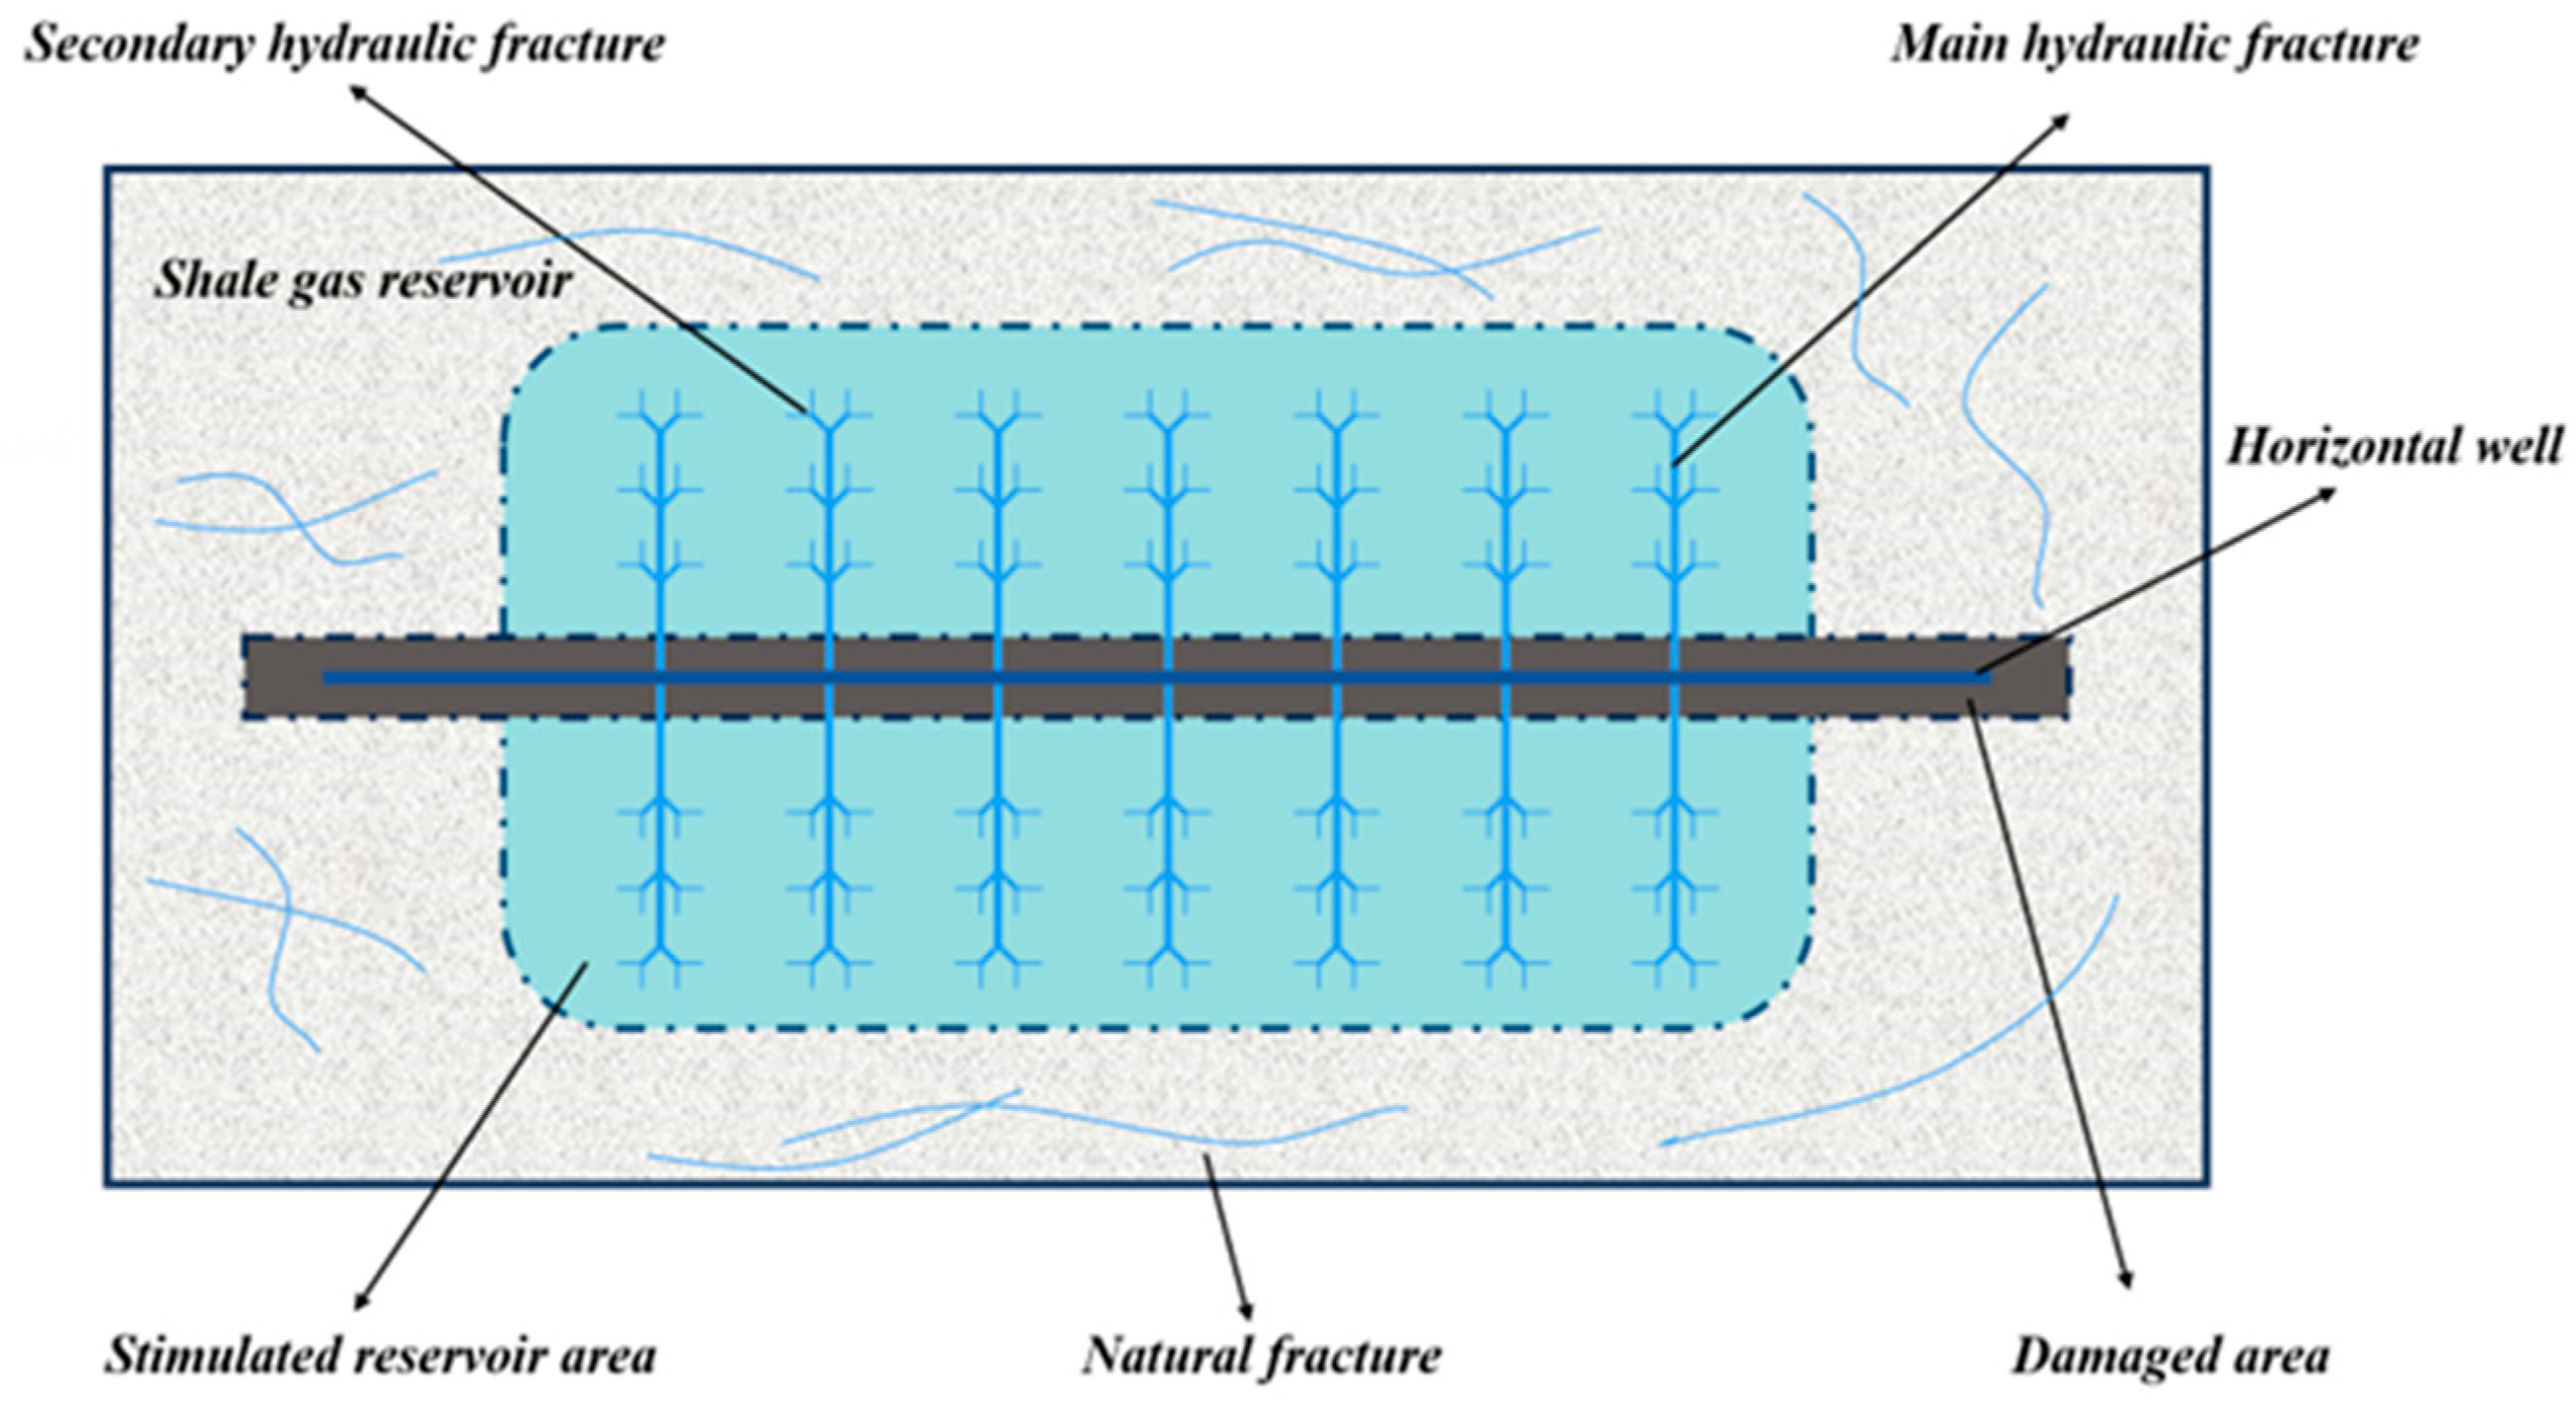
Based on the Barnett Shale data from southeastern New Mexico, a physical model of a multi-stage fractured horizontal well in the center of a two-dimensional single-phase shale gas reservoir was constructed, as shown in
Figure 1. During shale gas reservoir exploitation, three conductivity media can form in shale gas reservoirs, including unstimulated, stimulated, and damaged areas, depending on different development processes and transformation methods. In addition to natural fractures, main, secondary, and micro-hydraulic fractures tend to occur after hydraulic fracturing. In this study, micro-fractures are treated as secondary fractures, and their conductivity is assumed to be consistent. The reason for this assumption is that the conductivity of secondary fractures is close to that of micro-fractures; by comparison, a pronounced difference in conductivity exists between main and secondary hydraulic fractures [
29,
30].
Considering the complexity of reservoir conditions throughout shale gas production and the non-uniform structures of media and fractures, this study appropriately simplified the model for ease of investigation. The assumptions were as follows:
The reservoir permeability is isotropic;
The mining fluid is single-phase shale gas;
The fluid flow always follows Darcy’s law;
The reservoir boundary pressure is constant;
The reservoir temperature remains unchanged;
Horizontal well production occurs under constant pressure conditions.
The permeability and porosity in the unstimulated area are consistent with the original values of shale gas reservoirs, since this region has been less affected by drilling, completion, and volume fracturing [
8]. In contrast, the stimulated area exhibits relatively high permeability due to hydraulic fracturing, which reconstructs and connects natural fractures in the original reservoir. Additionally, the size of this area is greatly affected by artificial fractures. Typically, the spacing between the stimulated area and the hydraulic fractures is 35 feet [
7]. The damaged area is formed due to the infiltration of chemicals and additives into the formation during drilling and completion operations; it is mainly distributed around the horizontal well. The permeability of the damaged area is low, generally representing 30–50% of the permeability of the unstimulated area. The damage radius can be obtained using the Hawkins reservoir damage skin factor [
20]. The main hydraulic fracture is considered the “artery” of shale gas production and transportation. It is characterized by large width, strong conductivity, small frictional pressure drops along the fracture, and symmetrical distribution on both sides of the wellbore. The secondary fracture is a high-conductivity branch fracture from the main hydraulic fracture. Secondary fractures typically occur in all scenarios; they stop expanding along the main hydraulic fracture after a period of time [
18]. Three pairs of secondary fractures are evenly distributed along both sides of the main hydraulic fracture. The formation angle is 45°, and the lengths are varying of about 5–15% of the main hydraulic fracture [
19]. The existing natural fractures in the reservoir, when poorly connected with the main hydraulic fractures, contribute little to the improvement in productivity [
29]. In addition, due to the closed reservoir boundary, the main hydraulic fractures possess consistent half-length and spacing. The reservoir material is considered a porous medium primarily characterized by porosity and permeability.
In this study, the porosity of the Barnett Shale (i.e., 0.05) was defined as the porosity value for all reservoir materials in the physical model [
8,
9]. In addition, the permeability was determined according to the zone-specific characteristics combined with the actual measurements. The specified permeability in the USRV zone was k = 2 × 10
−19 m
2, and the values corresponding to SRV zone and the damaged zone were 6 k and 0.4 k, respectively [
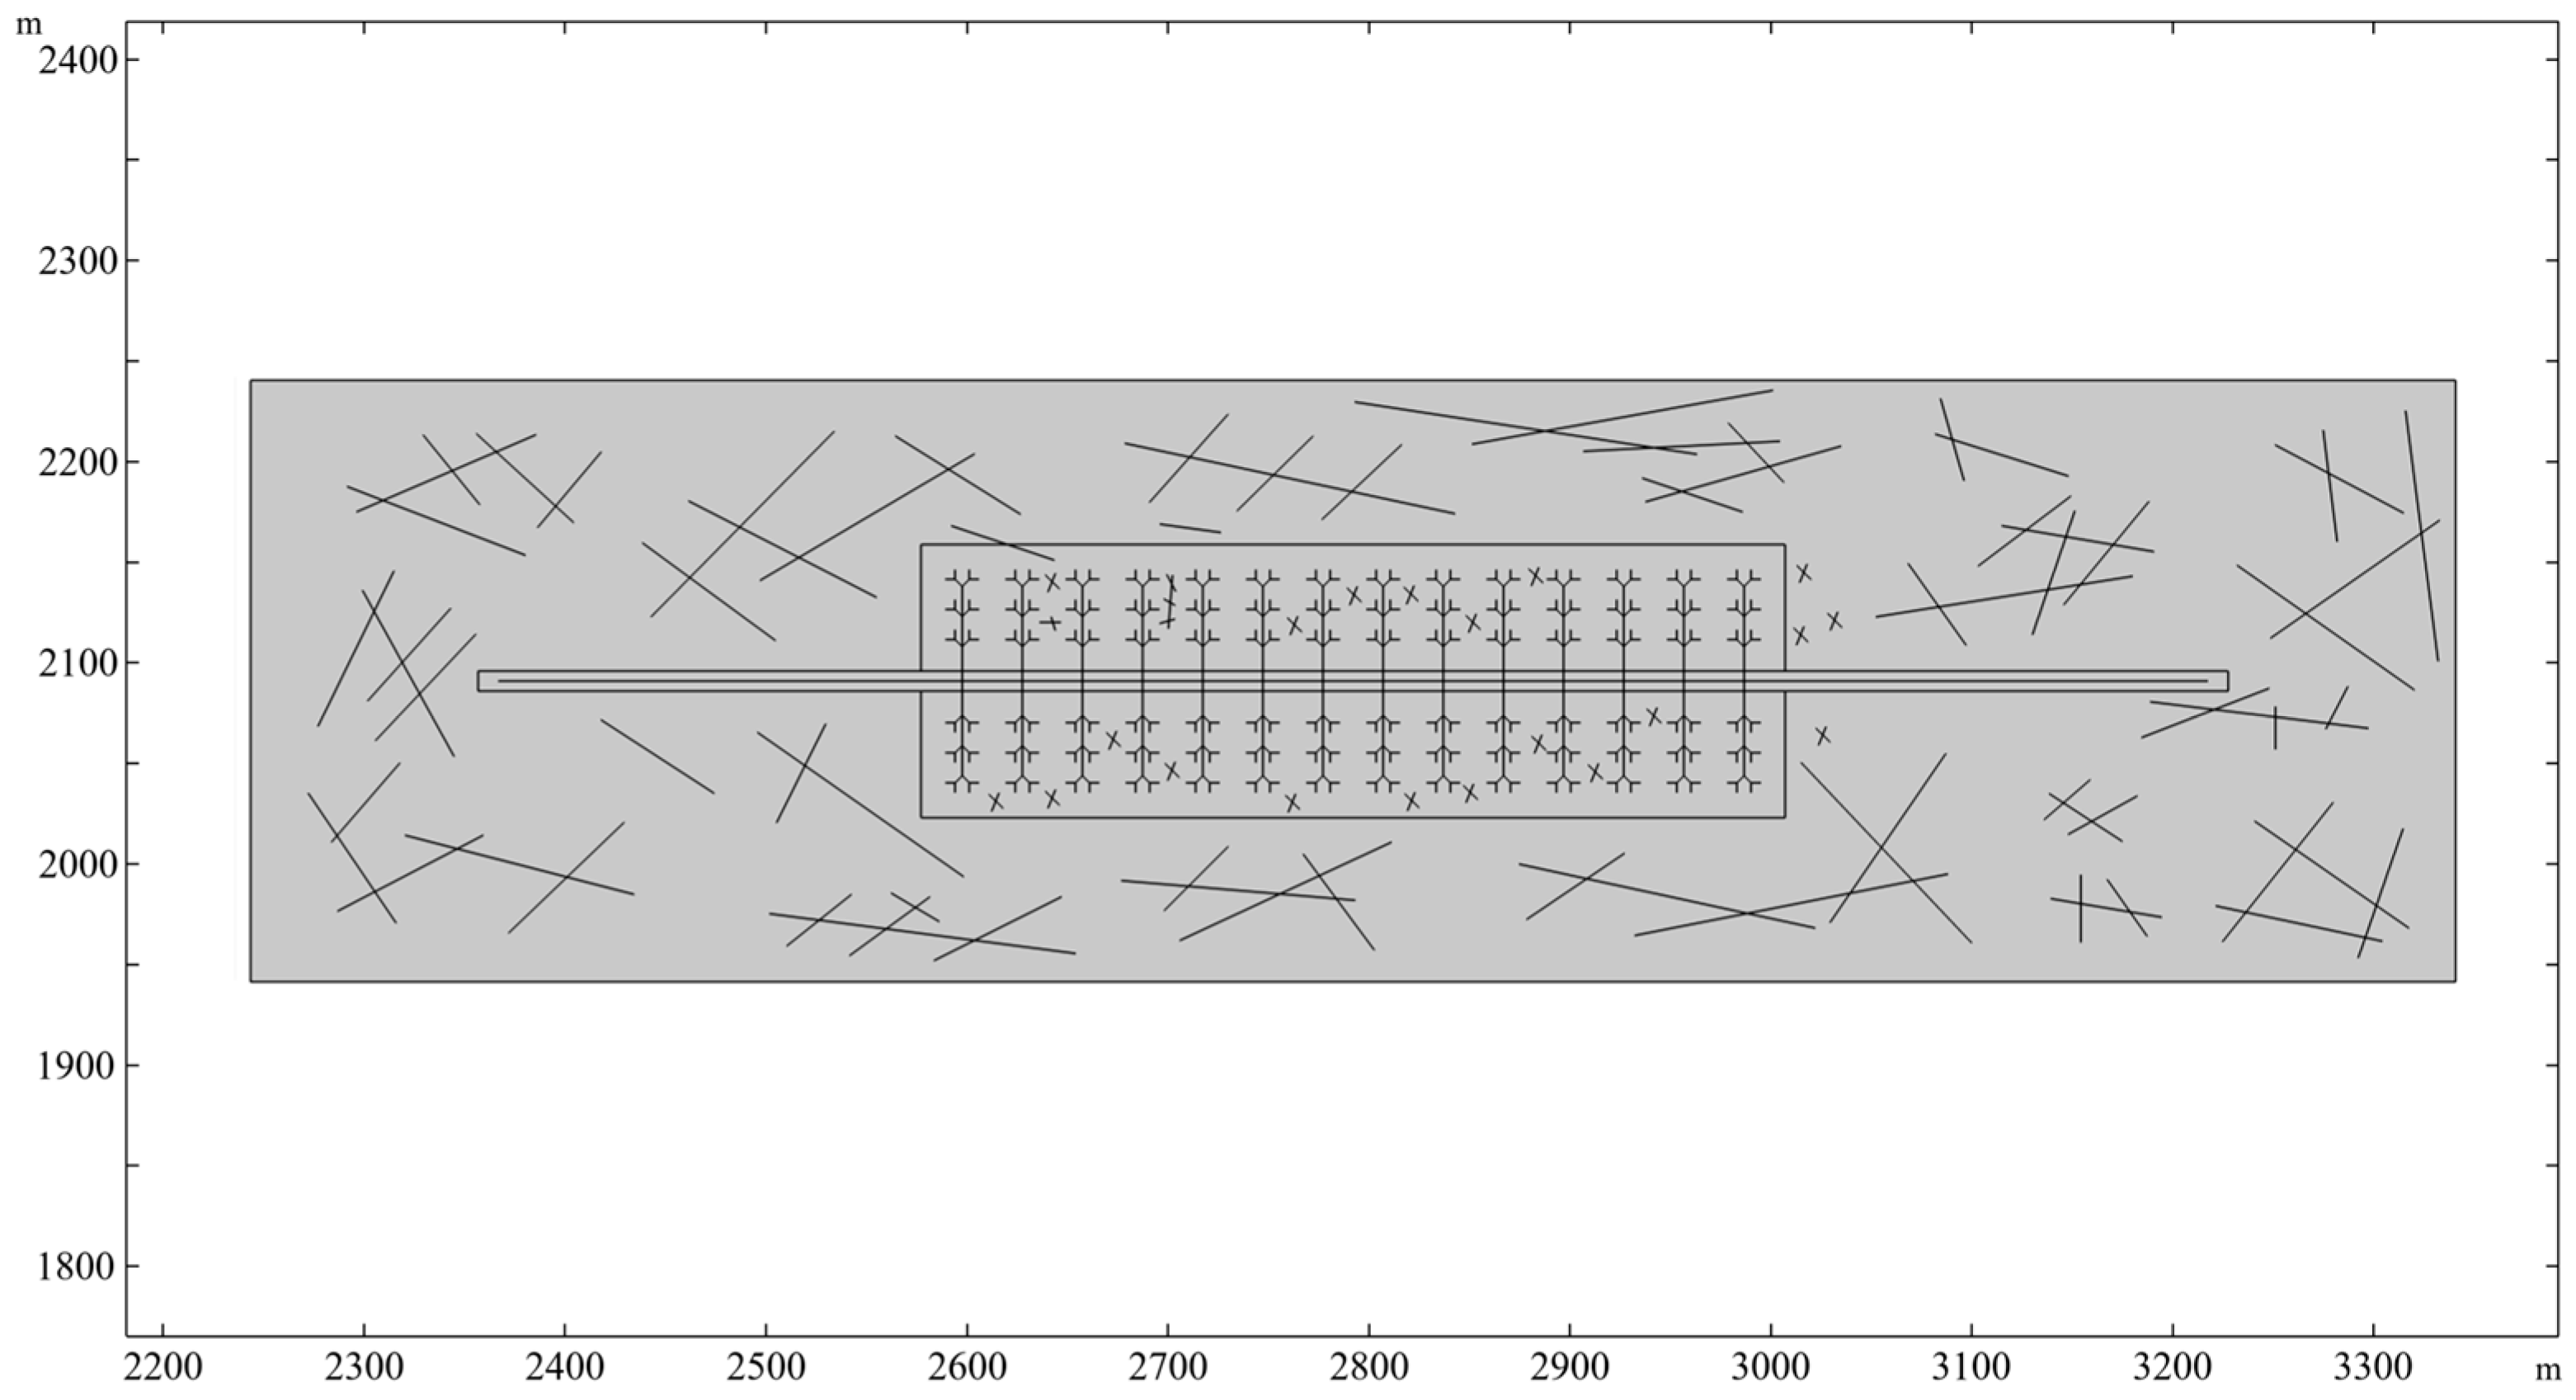
19]. Considering the fluid and matrix’s slight compressibility, gravity’s influence can be ignored. Accordingly, the physical model was built using COMSOL Multiphysics 5.4 commercial simulation software, based on the data for the Barnett Shale from southeastern New Mexico, USA. The parameters of the Barnett Shale are listed in detail in the next section. The model’s construction is illustrated in
Figure 2.
2.2. Grid Division
Different meshing conditions are used for various research areas to ensure the stability and accuracy of model calculations. Regarding shale gas productivity, the unstimulated area makes a small contribution; similarly, natural fractures alone contribute in a minor way. The above analysis indicated that over-detailed mesh differentiation between the two areas was not necessary. The basic parameters for the grid generation are illustrated in
Table 1.
In contrast, for this research into shale gas productivity, we focused on the stimulated area, damaged area, hydraulic fracture, and horizontal well. Particular attention was paid to the junction of these areas, where the shale gas flow is more complex, requiring a finer grid to restore corresponding data.
For the SRV and damaged areas, a finer mesh size and smaller mesh growth rate were adopted to ensure mesh precision. The basic parameters for the grid generation are listed in
Table 2.
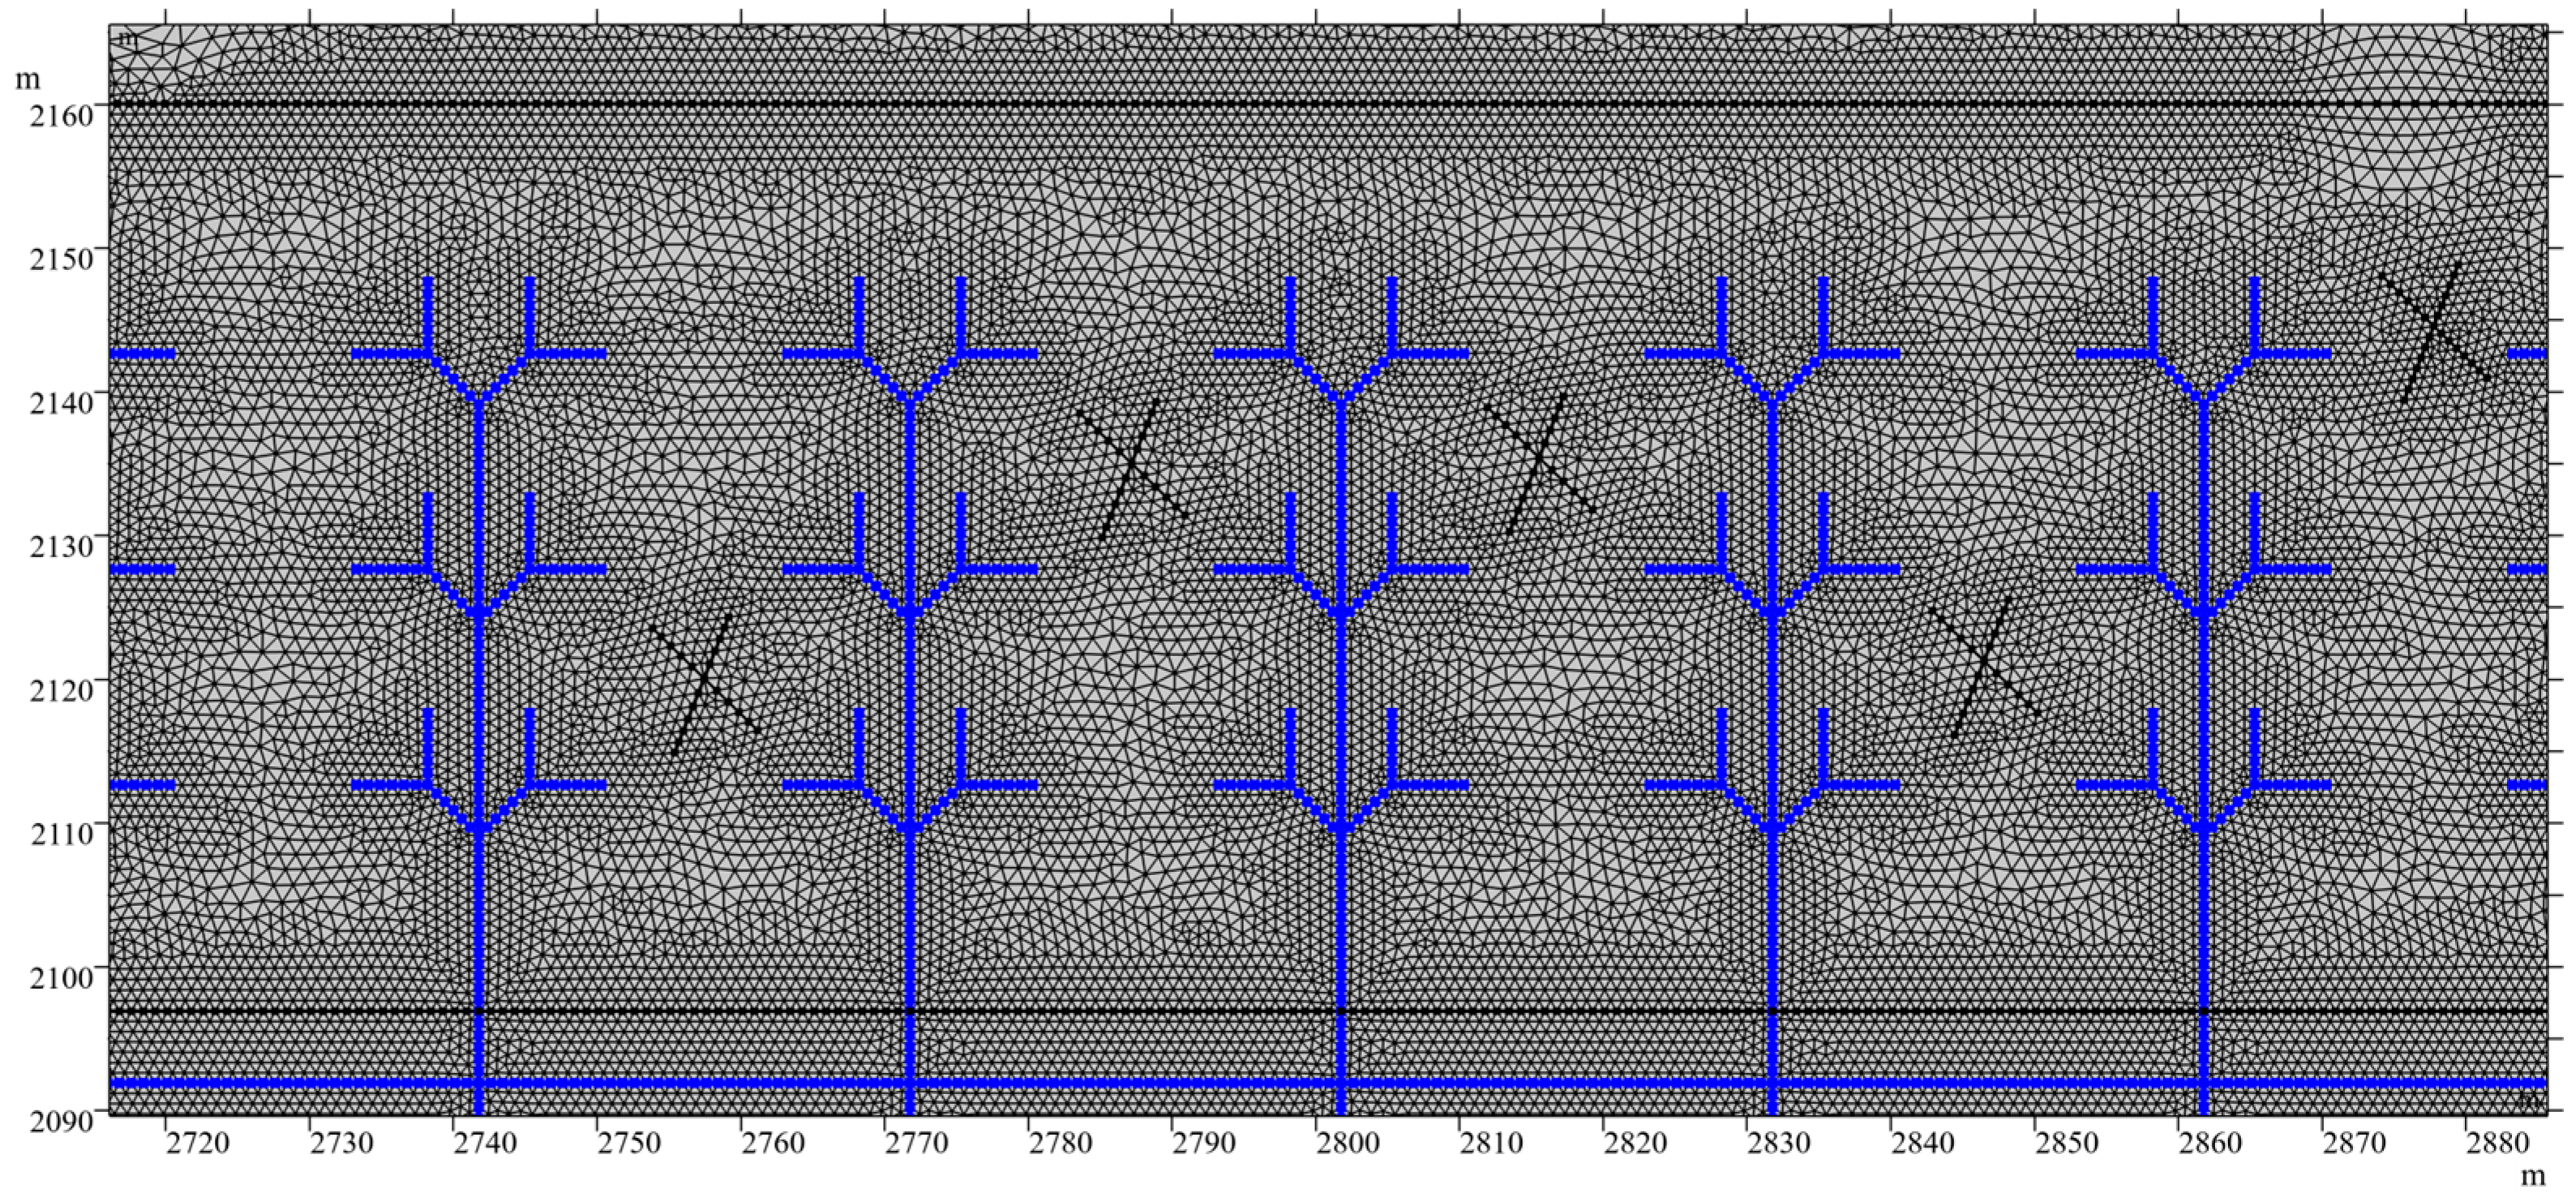
Mesh refinement was carried out for the main hydraulic fracture, secondary fracture, and the area surrounding the horizontal well. Specifically, meshing conditions consistent with the reconstruction and damaged areas were used; in contrast, the grid resolution was increased in narrow areas. The fundamental parameters for the grid refinement are presented in
Table 3.
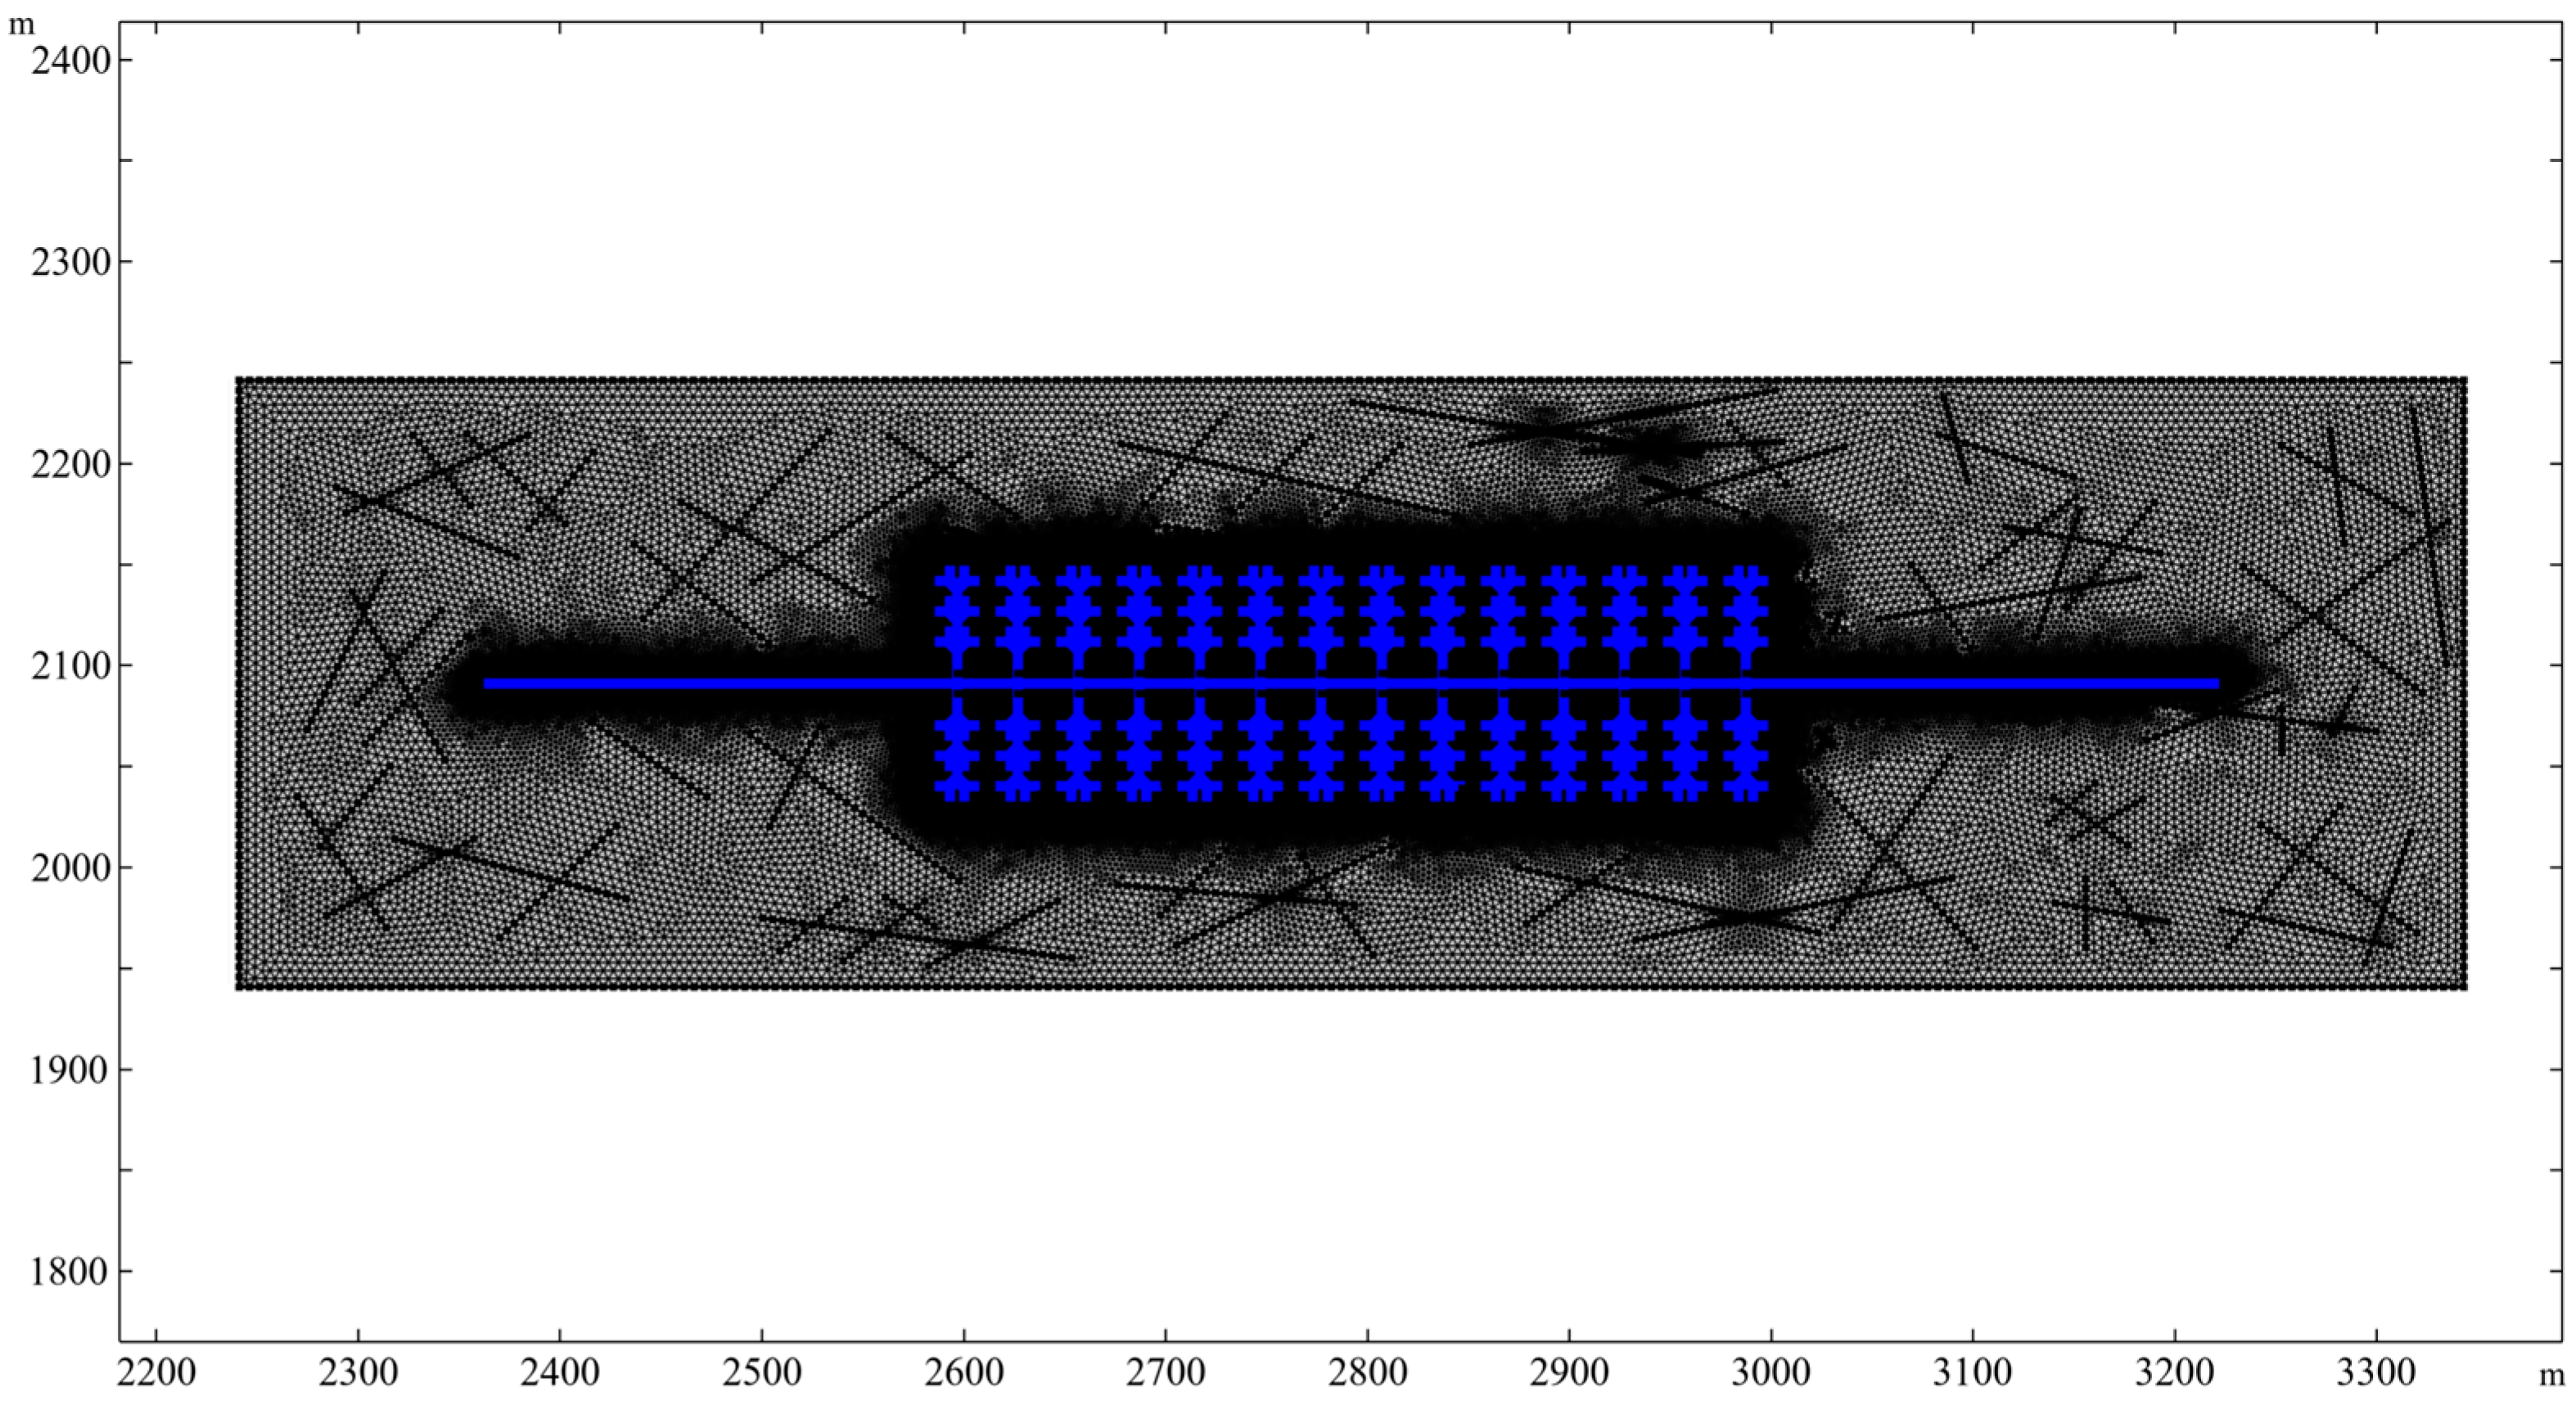
Consequently, nearly 500,000 grids were generated. The overall division of the model is schematically represented in
Figure 3. The grid refinements for the areas near hydraulic fractures and horizontal wells are shown in
Figure 4. Here, grid division methods specific to the corresponding grid parameters were used to characterize the complex flow of the shale gas under production. This allowed the real flow characteristics of the shale gas in complex areas to be restored and the calculation efficiency to be improved to ensure the model’s accuracy and convergence.
2.3. Mathematical Model
The mathematical model of shale gas productivity in reservoirs was derived based on Darcy’s law. By incorporating pseudo-pressure, non-Darcy coefficient, and equivalent skin coefficient, the productivity prediction for reservoir shale gas production was obtained. Lee’s correlation for gas viscosity was introduced to dynamically characterize the viscosity change in the real shale gas produced and to improve the accuracy of the productivity prediction formula. This part of the study assumed that the shale gas reservoir was a circular structure, and the gas flow from the horizontal well was ellipsoid-shaped, isotropic, and in a steady state of seepage.
When Darcy’s law is applied to oil and gas production, it can be expressed as follows:
where
Q is the open hole completion production, STB/d;
A is the cross-sectional area of the wellbore in an open hole completion, m
2;
K is the reservoir permeability, md;
B0 is the gas formation volume factor, RB/STB;
is the gas viscosity, cP.
Due to the elliptical production volume, the radial area of the downhole fluid production flow can be calculated as follows:
where
is the short half-axis of the cross-section, m;
is the long half-axis of the cross-section, m.
By substituting Equation (2) into Equation (1), Equation (3) can be obtained:
By integrating the above equation, we can obtain Equation (4):
where
denotes the radial distance from the well circumference, m;
represents the well radius, m.
The mathematical model of reservoir productivity can be obtained by further simplifying Equation (4):
where
stands for the reservoir pressure, Pa;
denotes the flowing well pressure, Pa.
Notably, Equation (5) can be applied to oil production only. To obtain an equation suitable for simulating shale gas reservoir productivity, the concepts of pseudo-pressure and total skin coefficient [
6,
12] were introduced to modify Equation (5). The derived equation is written as follows:
The total skin coefficient can be expressed as follows:
The pseudo-pressure equation is as follows:
where
is the damaged area permeability, md;
is the radius of the damaged area, m;
is the non-Darcy flow coefficient;
is the gas compressibility factor;
is the reservoir temperature, K;
is the equivalent or average formation damage;
is the inertial or turbulent flow factor, d/Mcf.
Lastly, in order to characterize the dynamic viscosity in the shale gas, Lee’s correlation for gas viscosity is introduced into Equation (6). Additionally,
is used to replace
to obtain the shale gas reservoir productivity simulation equation, allowing for characterization of the shale gas dynamic viscosity:
where:
where
is the gas viscosity at a specific temperature and pressure, md;
is the gas molecular weight, g/mol;
is the density at a specific temperature and pressure, kg/m
3.
The boundary conditions mainly include internal and external boundary conditions. In this study, the constant external boundary conditions of the reservoir are applied to the mathematical model, and the physical model adopts the constant flow pressure conditions at the bottom hole.
The external boundary conditions are expressed as follows:
The expression of internal boundary conditions is below:
3. Model Validation
In order to verify the reliability and accuracy of the proposed model, we referred to the Barnett Shale data from southeastern New Mexico, United States; the parameters are shown in
Table 4 [
8,
19]. The simulation model of the multi-stage fractured horizontal well in the shale gas reservoir is schematically presented in
Figure 1. The production from the Barnett Shale lasted for 1650 days, and the stable production period occurred on the 800th day. In this study, the modelled simulated production spanned 2000 days, and the time step was set to 1.
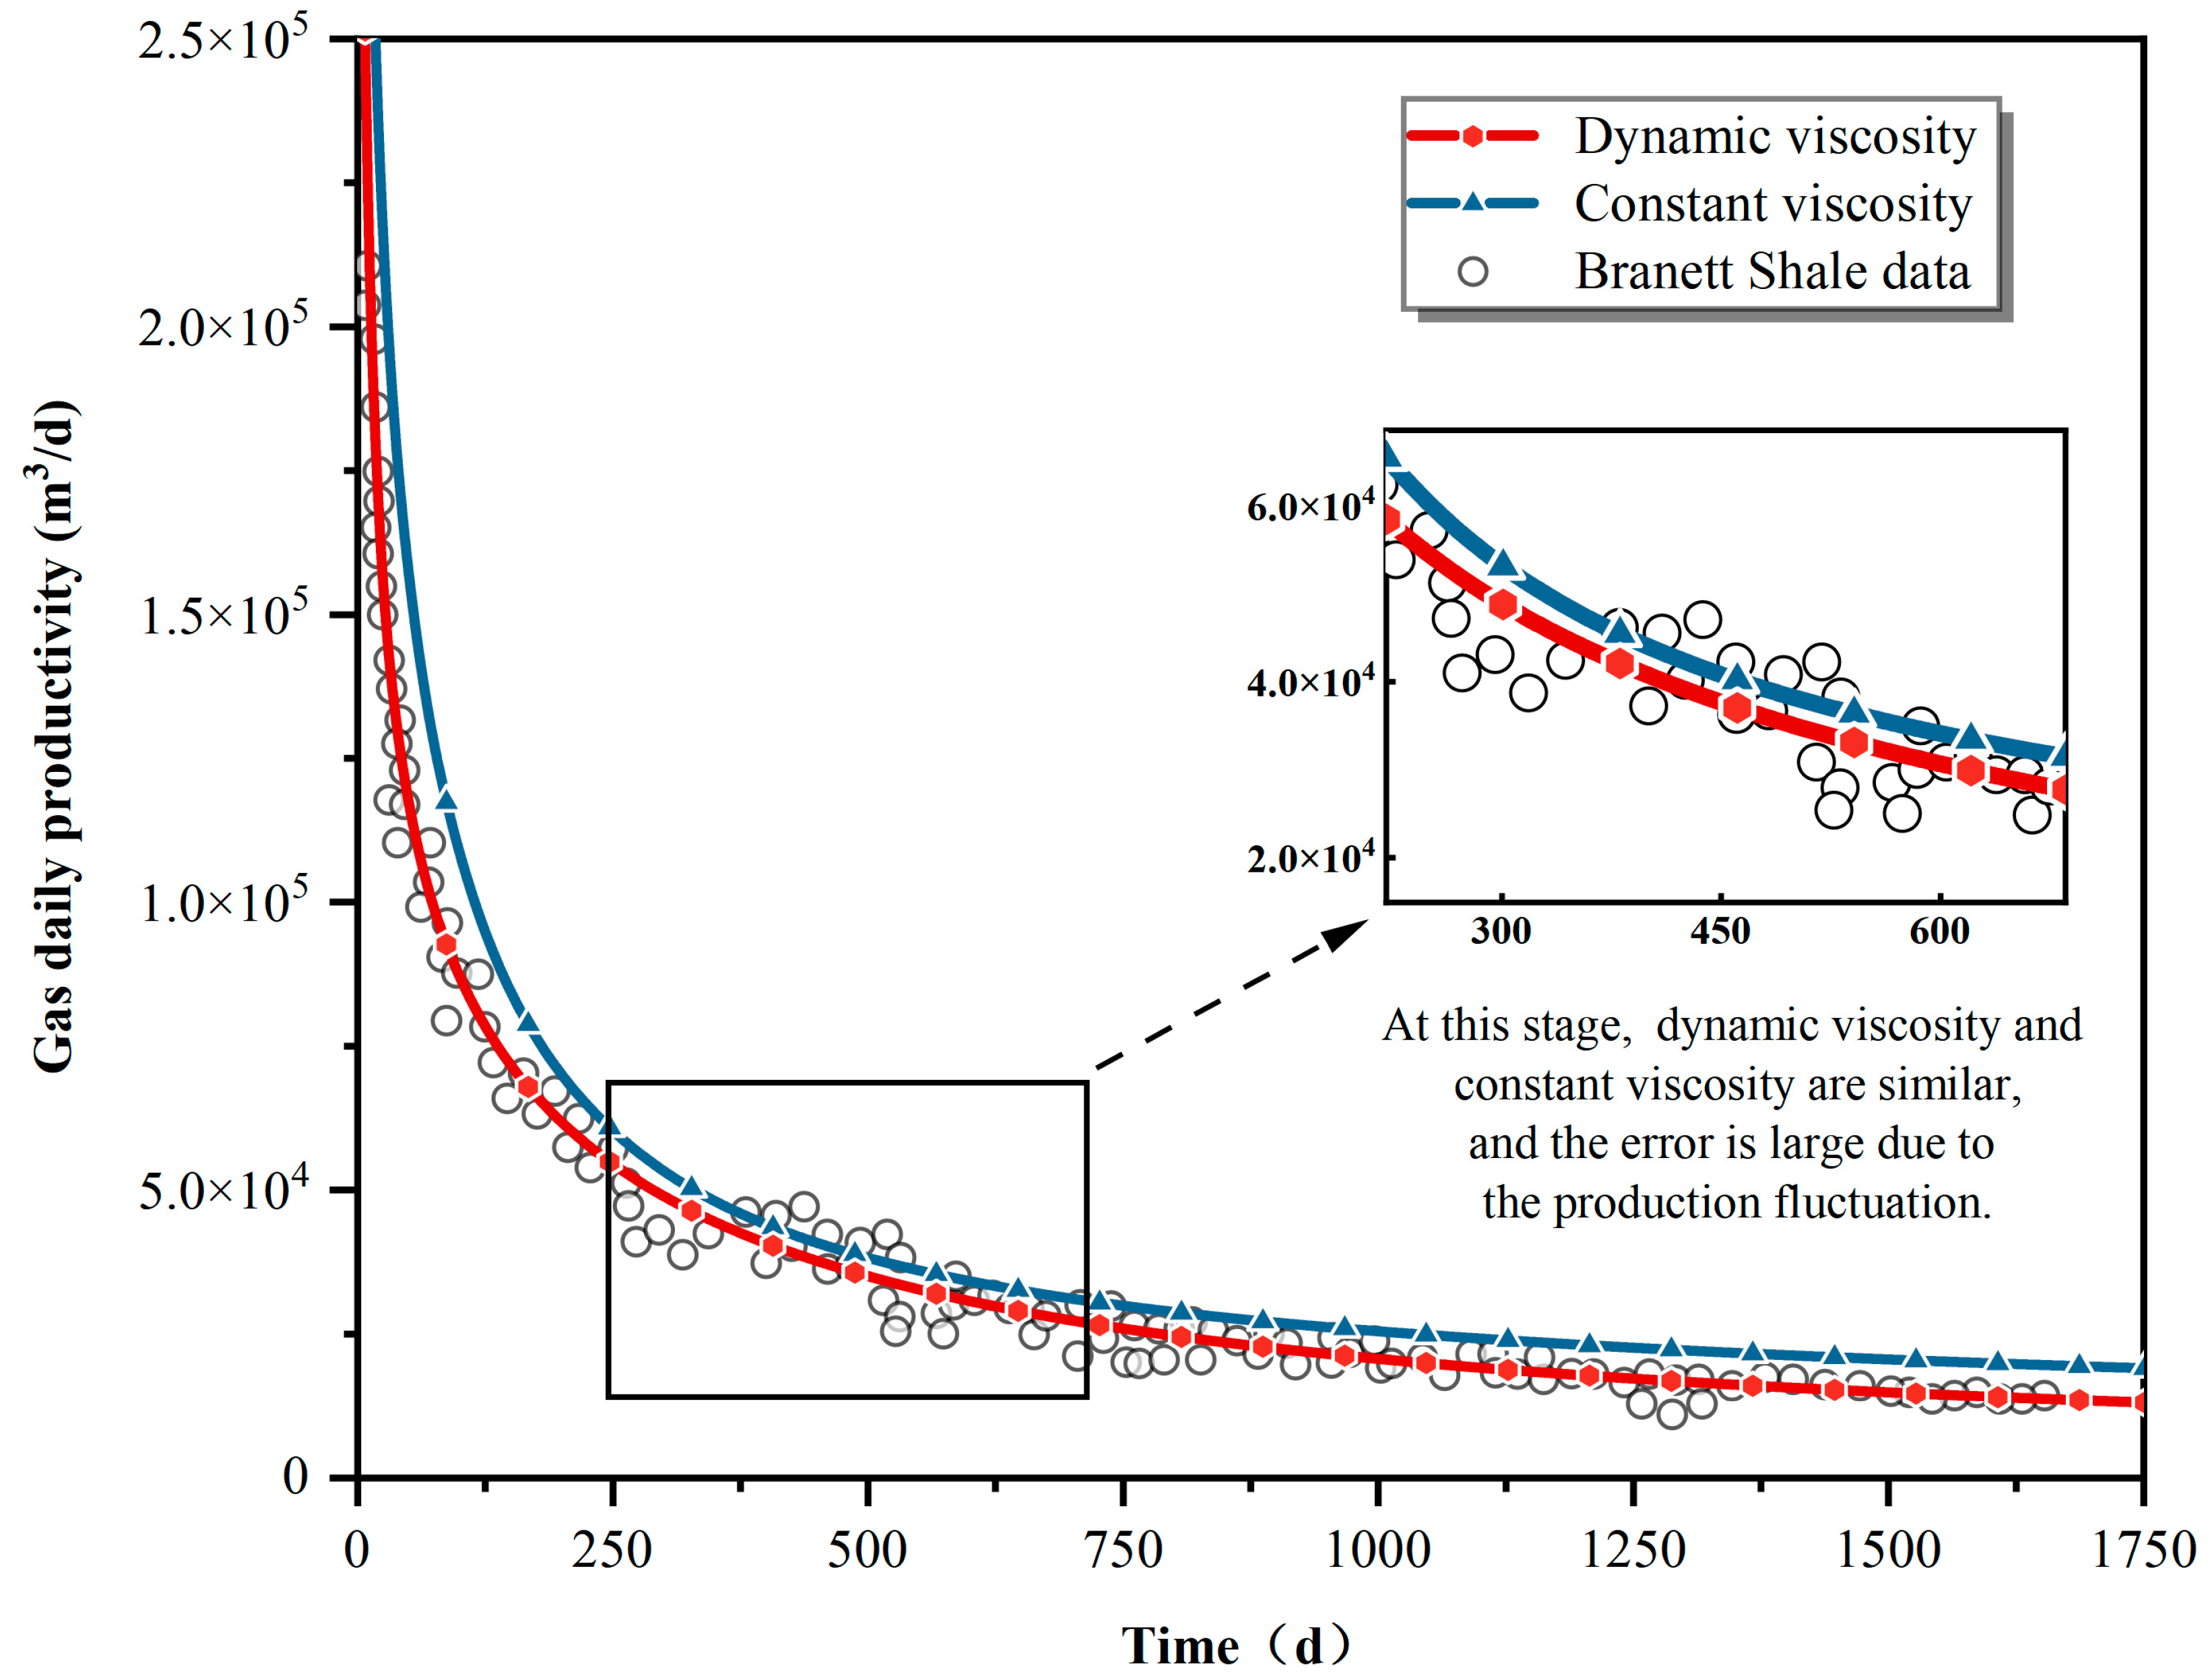
Figure 5 compares the daily productivity and dynamic viscosity in this study with the Barnett productivity and constant viscosity. The introduction of Lee’s correlation into the shale gas productivity model contributed to the consistency between the simulation results and the Barnett Shale data. The maximum and average errors were 9.316% and 5.902%, respectively, indicating high simulation accuracy. The gas viscosity is 2 × 10
−5 Pa·s in Liu’s model, which does not incorporate Lee’s correlation [
9]. The maximum error of daily productivity exceeded 50%, and the error on average was greater than 20%. Due to the influence of temperature and pressure, the gas viscosity of shale gas changes dynamically throughout production. Despite constant gas viscosity, the real shale gas flow could not be accurately represented. After introducing Lee’s correlation, the accuracy of the simulation results was greatly improved, proving the feasibility and necessity of incorporating this correlation into the shale gas production model.
The daily productivity from previous model results was also used for comparison [
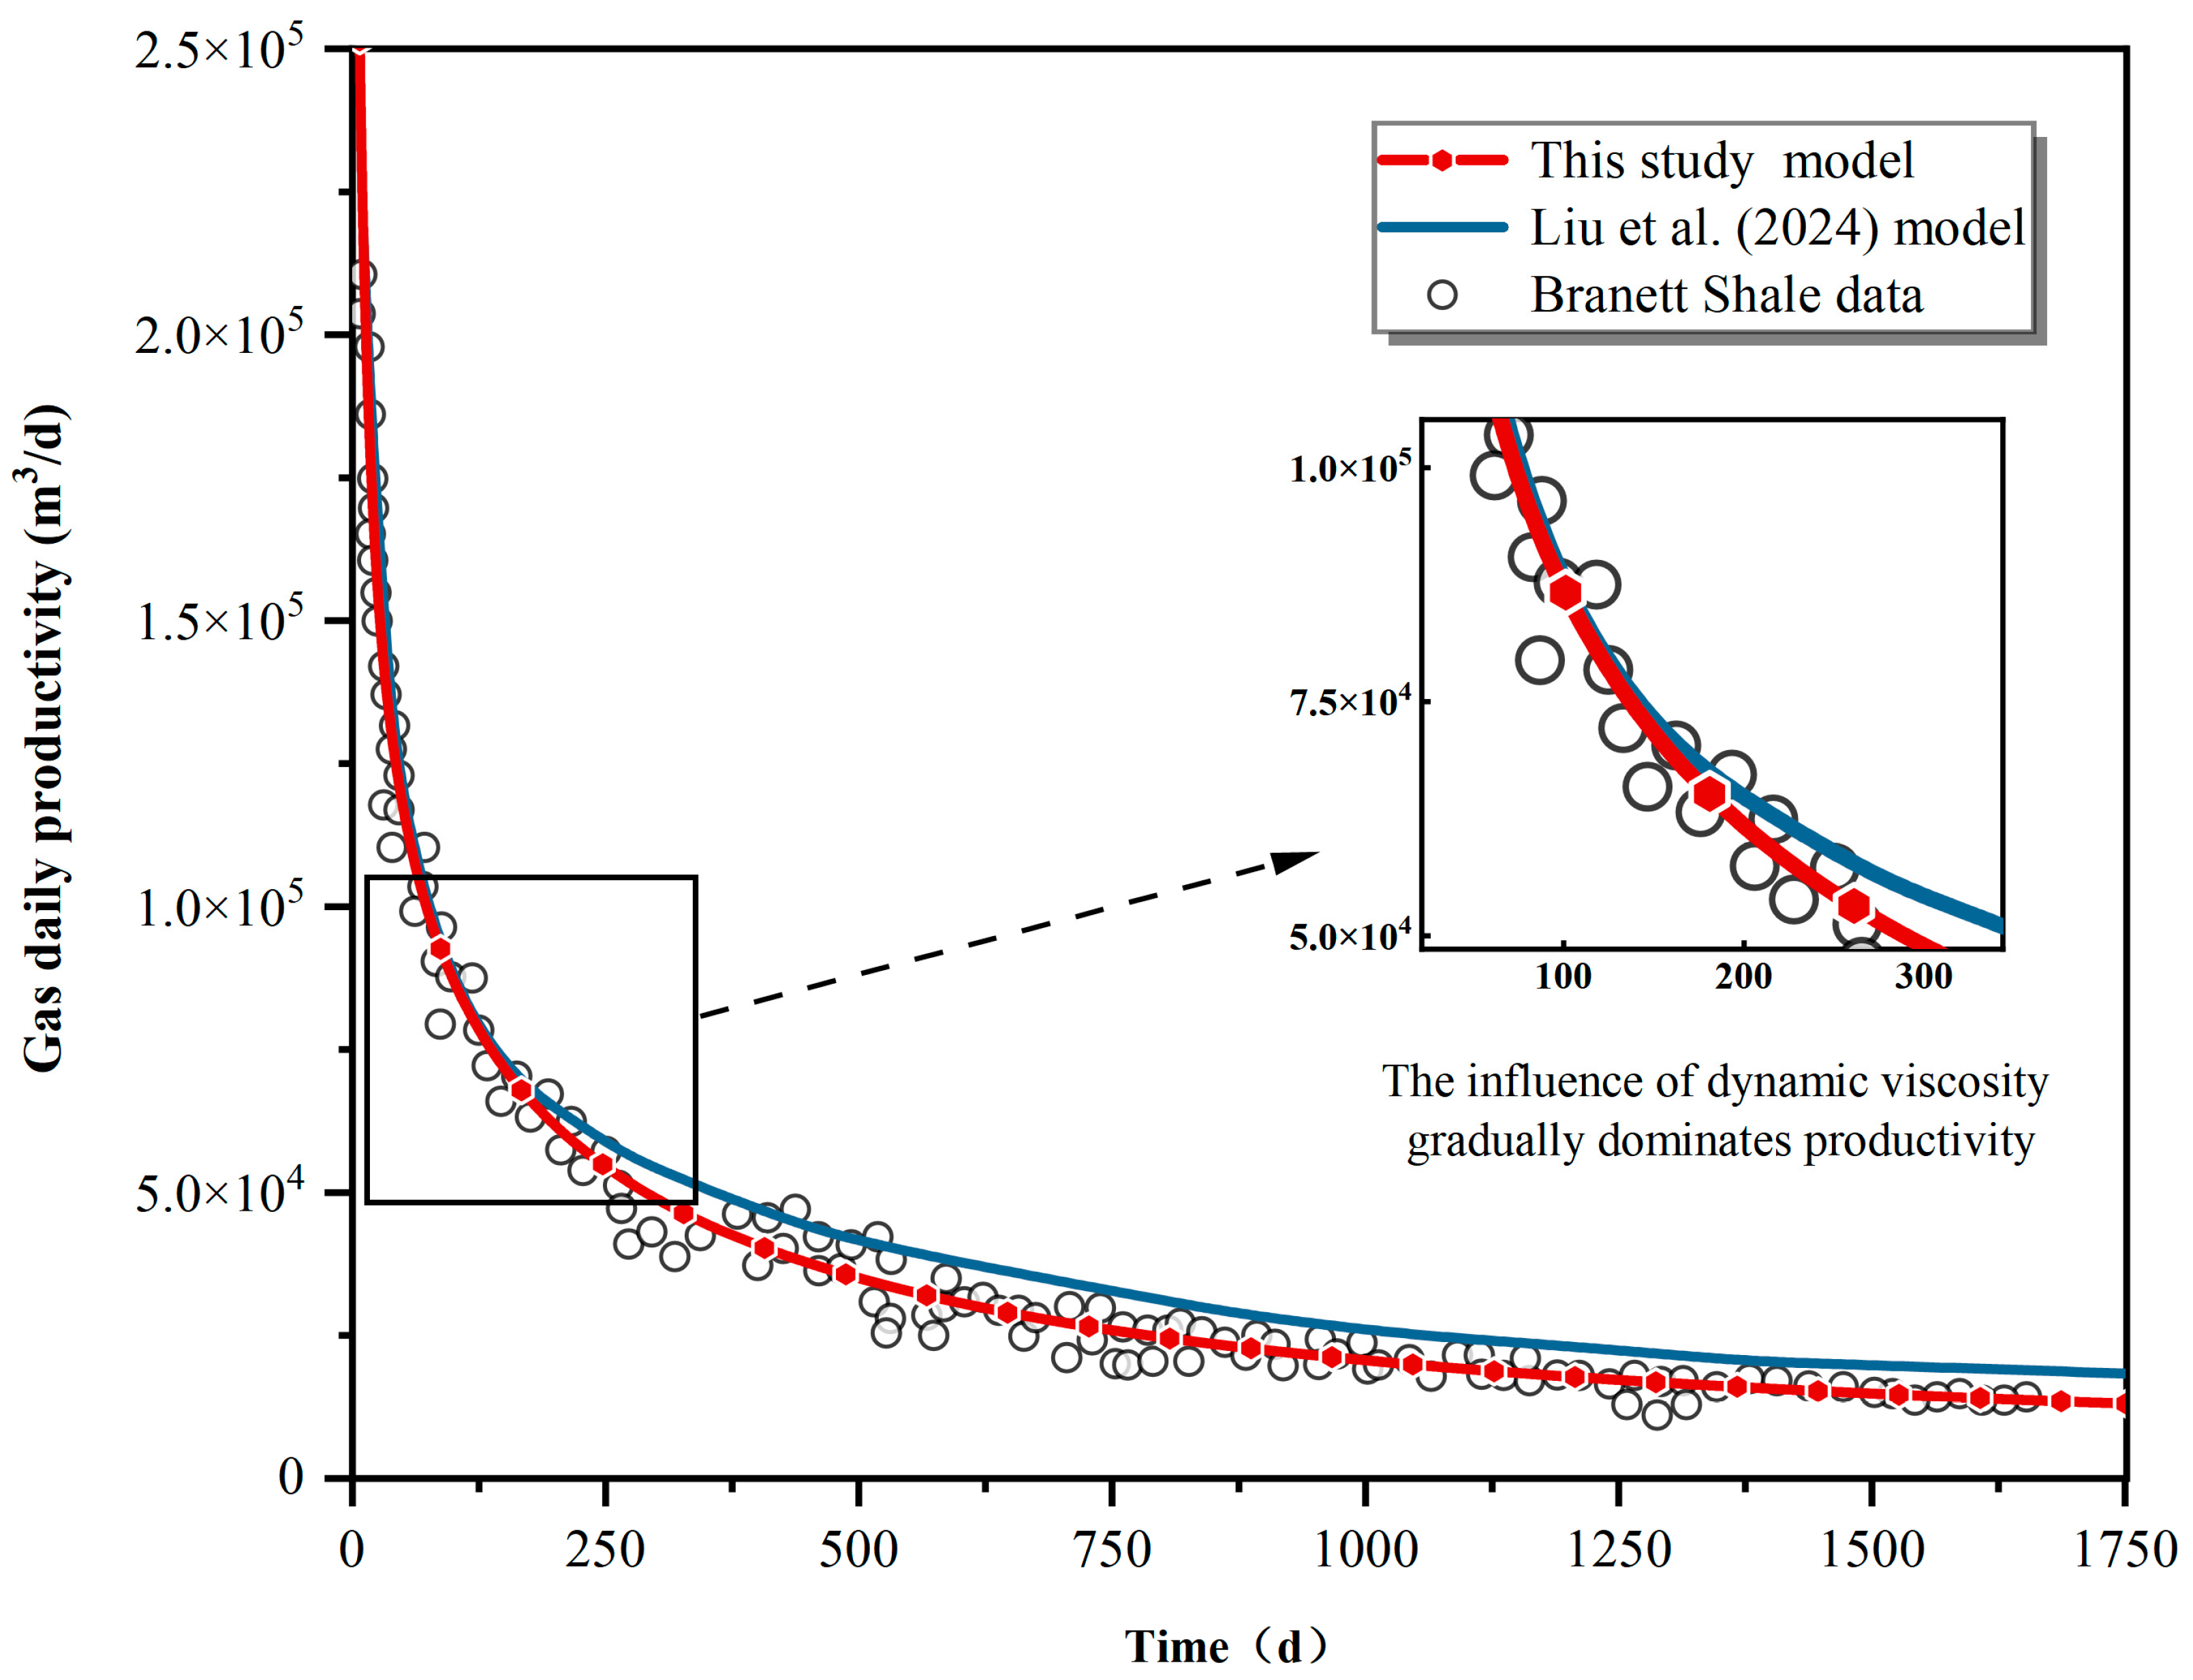
9]. The simulation results of Liu’s model exhibited good agreement with the real data 150 days before production, demonstrating a maximum error of 15% and an average error of 5.12%. However, this error increased when the production progressed. Specifically, the maximum error exceeded 50%, and the average error approached 30%. This indicates that this model cannot accurately estimate the full lifecycle productivity of shale gas.
We summarize two reasons for the large error of the Liu model results, based on analysis. The comparison results are shown in
Figure 6. Firstly, the characteristics of different regions in the formation were not fully considered. The model structure included only the shale gas layer, main hydraulic fracture, and horizontal well. Due to the modeling method, the value of the reservoir’s permeability could not be confirmed. In addition, the initial permeability of the reservoir was applied to the whole reservoir. As a result, the SRV data were produced under the initial reservoir permeability conditions instead of improved permeability after simulation. This deviation potentially reduced the shale gas productivity. The damaged area also limits the inflow of shale gas, leading to a further decrease. Secondly, the most noticeable problem is the use of fixed gas viscosity to simulate the dynamic viscosity of actual shale gas. Such a design can lead to a large overall value for the productivity of shale gas, as shown in the productivity change trend in
Figure 5.
In summary, using the initial permeability to simulate the permeability of the main hydraulic fracture production environment can potentially lead to low shale gas productivity in the simulation results. In contrast, applying constant gas viscosity to characterize dynamic viscosity in Barnett Shale tends to increase the simulated shale gas productivity. Under the combined effect of both schemes, an “illusion” of better consistency with the actual data is presented in the early stages of production. When the production continues, the production range expands to the unstimulated area, where the permeability aligns with the initial reservoir permeability, consistent with the real production situation. Consequently, only the influence of constant gas viscosity on productivity can be reflected in the middle and late stages of production. In contrast, the restriction effect of the damaged zone is not visible. This leads to the large simulation values and high errors of the Liu model.
The established multi-medium and multi-permeability shale gas productivity model accurately divides the reservoir and introduces Lee’s correlation to characterize the dynamic viscosity during shale gas production. The model results aligned well with the real Barnett Shale productivity data. Specifically, the maximum error was less than 10%, and the average error was only 5.902%, proving the feasibility and necessity of using Lee’s correlation for gas viscosity when modeling shale gas production. The comparison with previous simulation results was used to analyze the error of the existing model. The analysis results validated the correctness of the introduced correlation and the accuracy of the model proposed in this study.
4. Shale Gas Flow and Productivity Characteristics Analysis
Due to the dynamic attribute, the production flow of shale gas is affected by different fluid transport mechanisms [
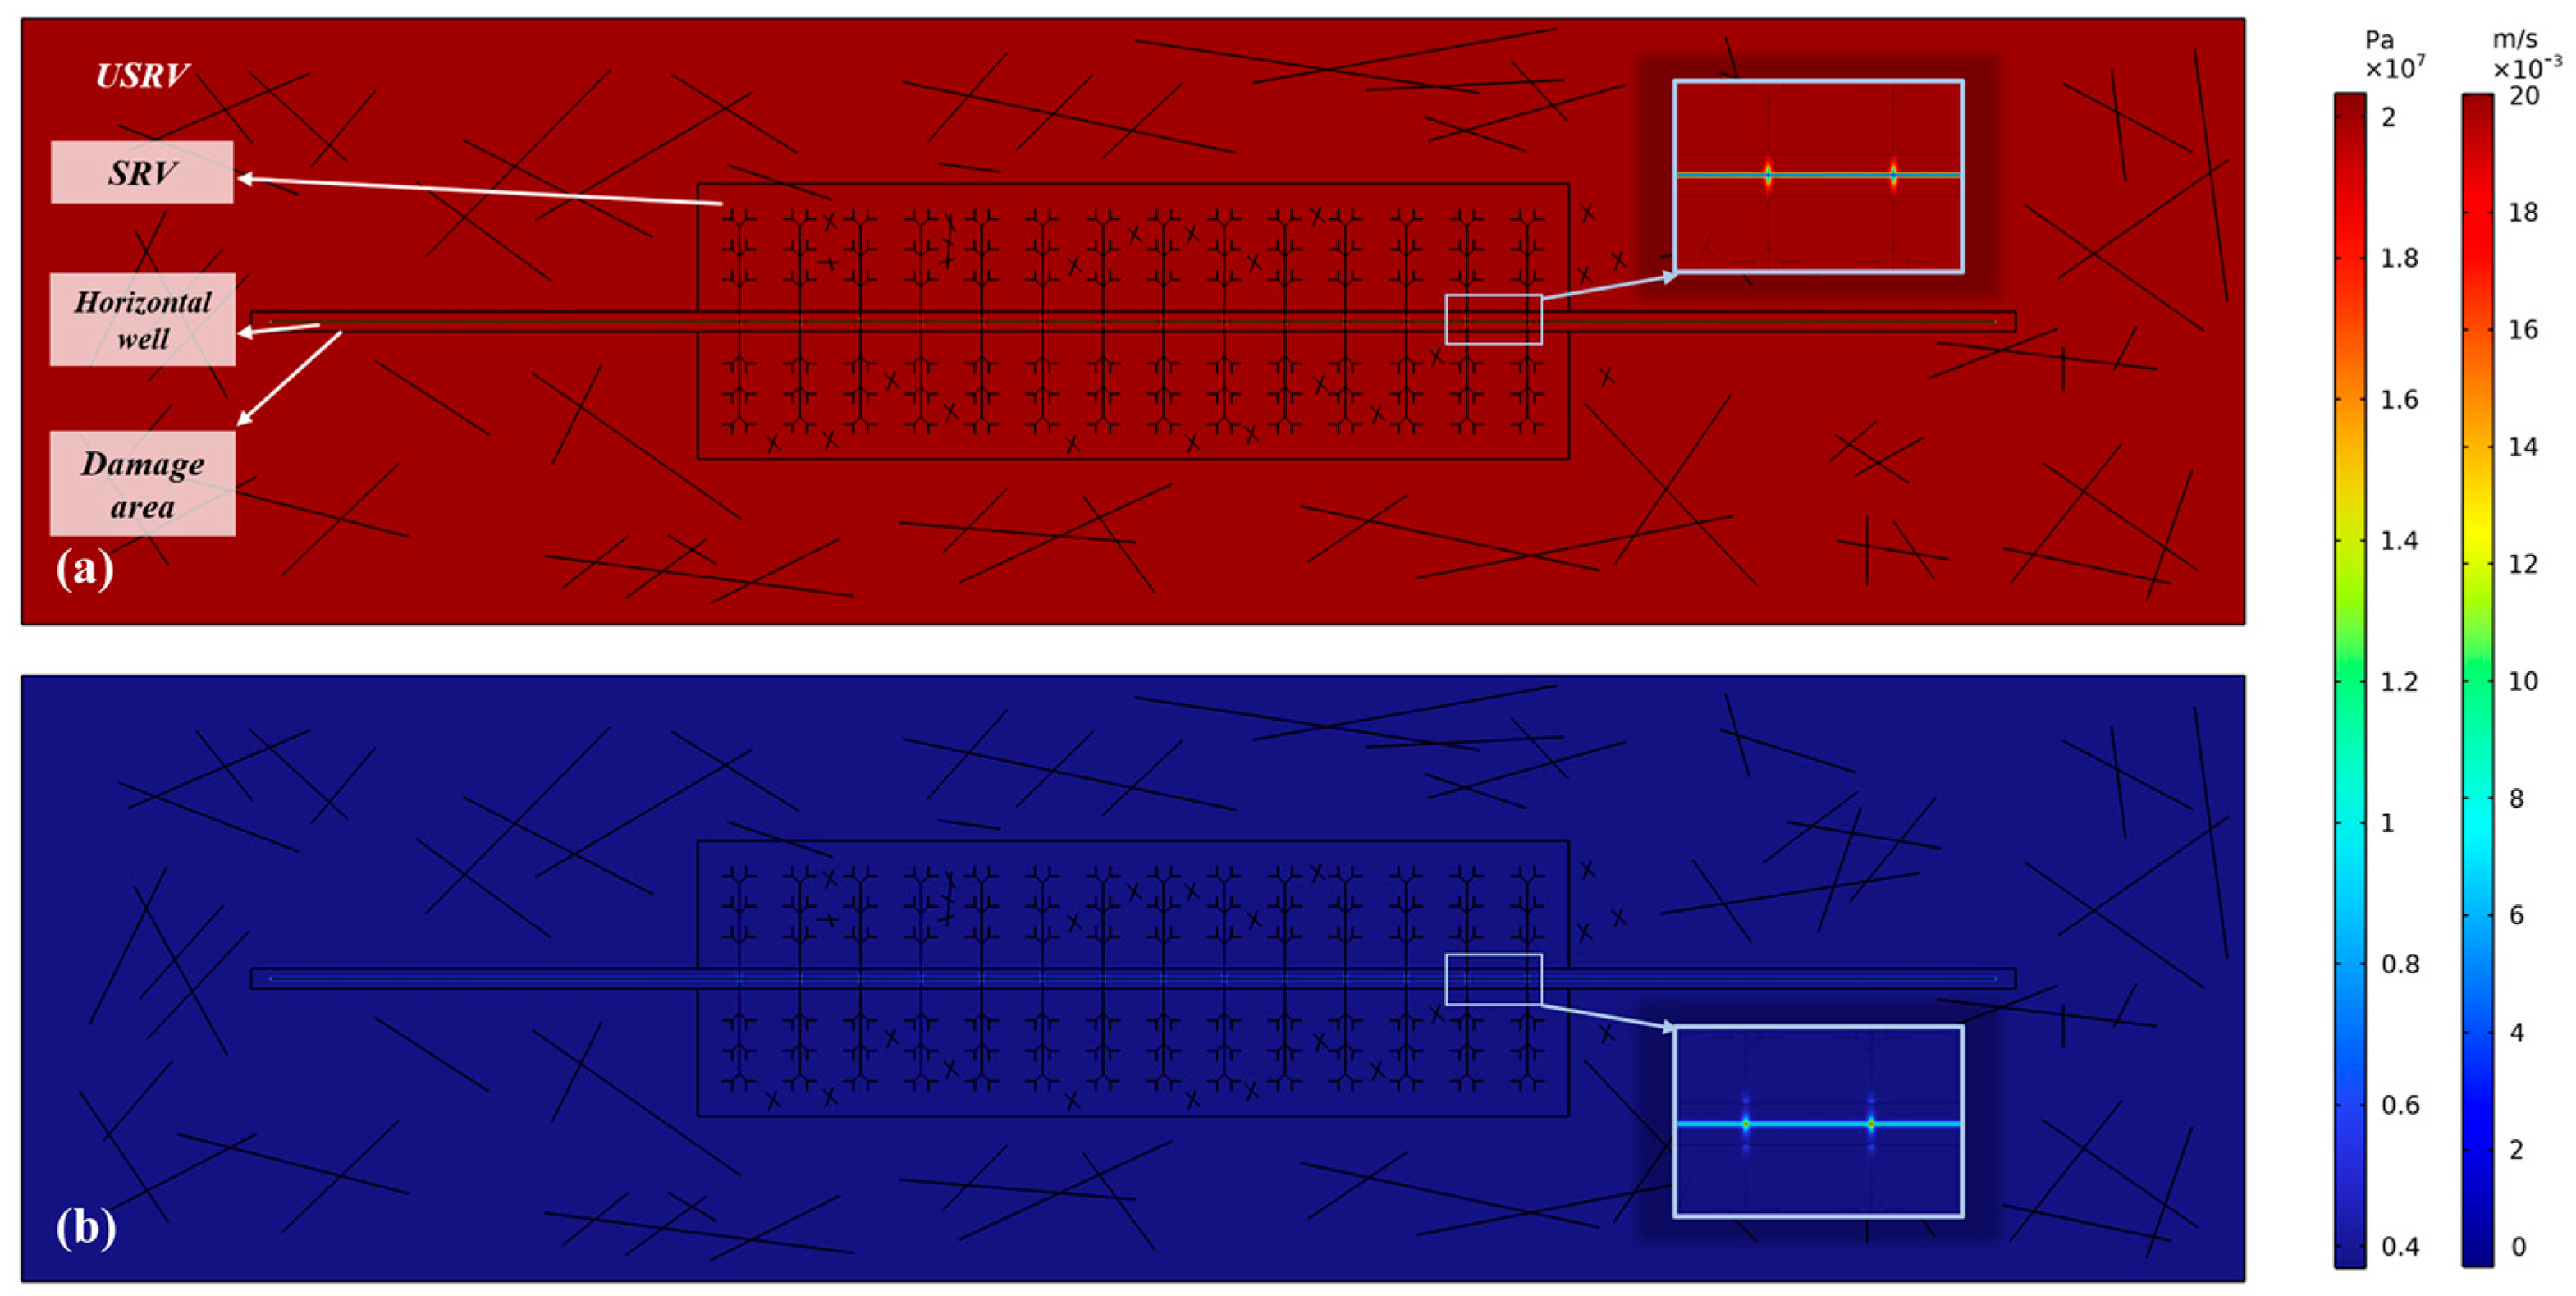
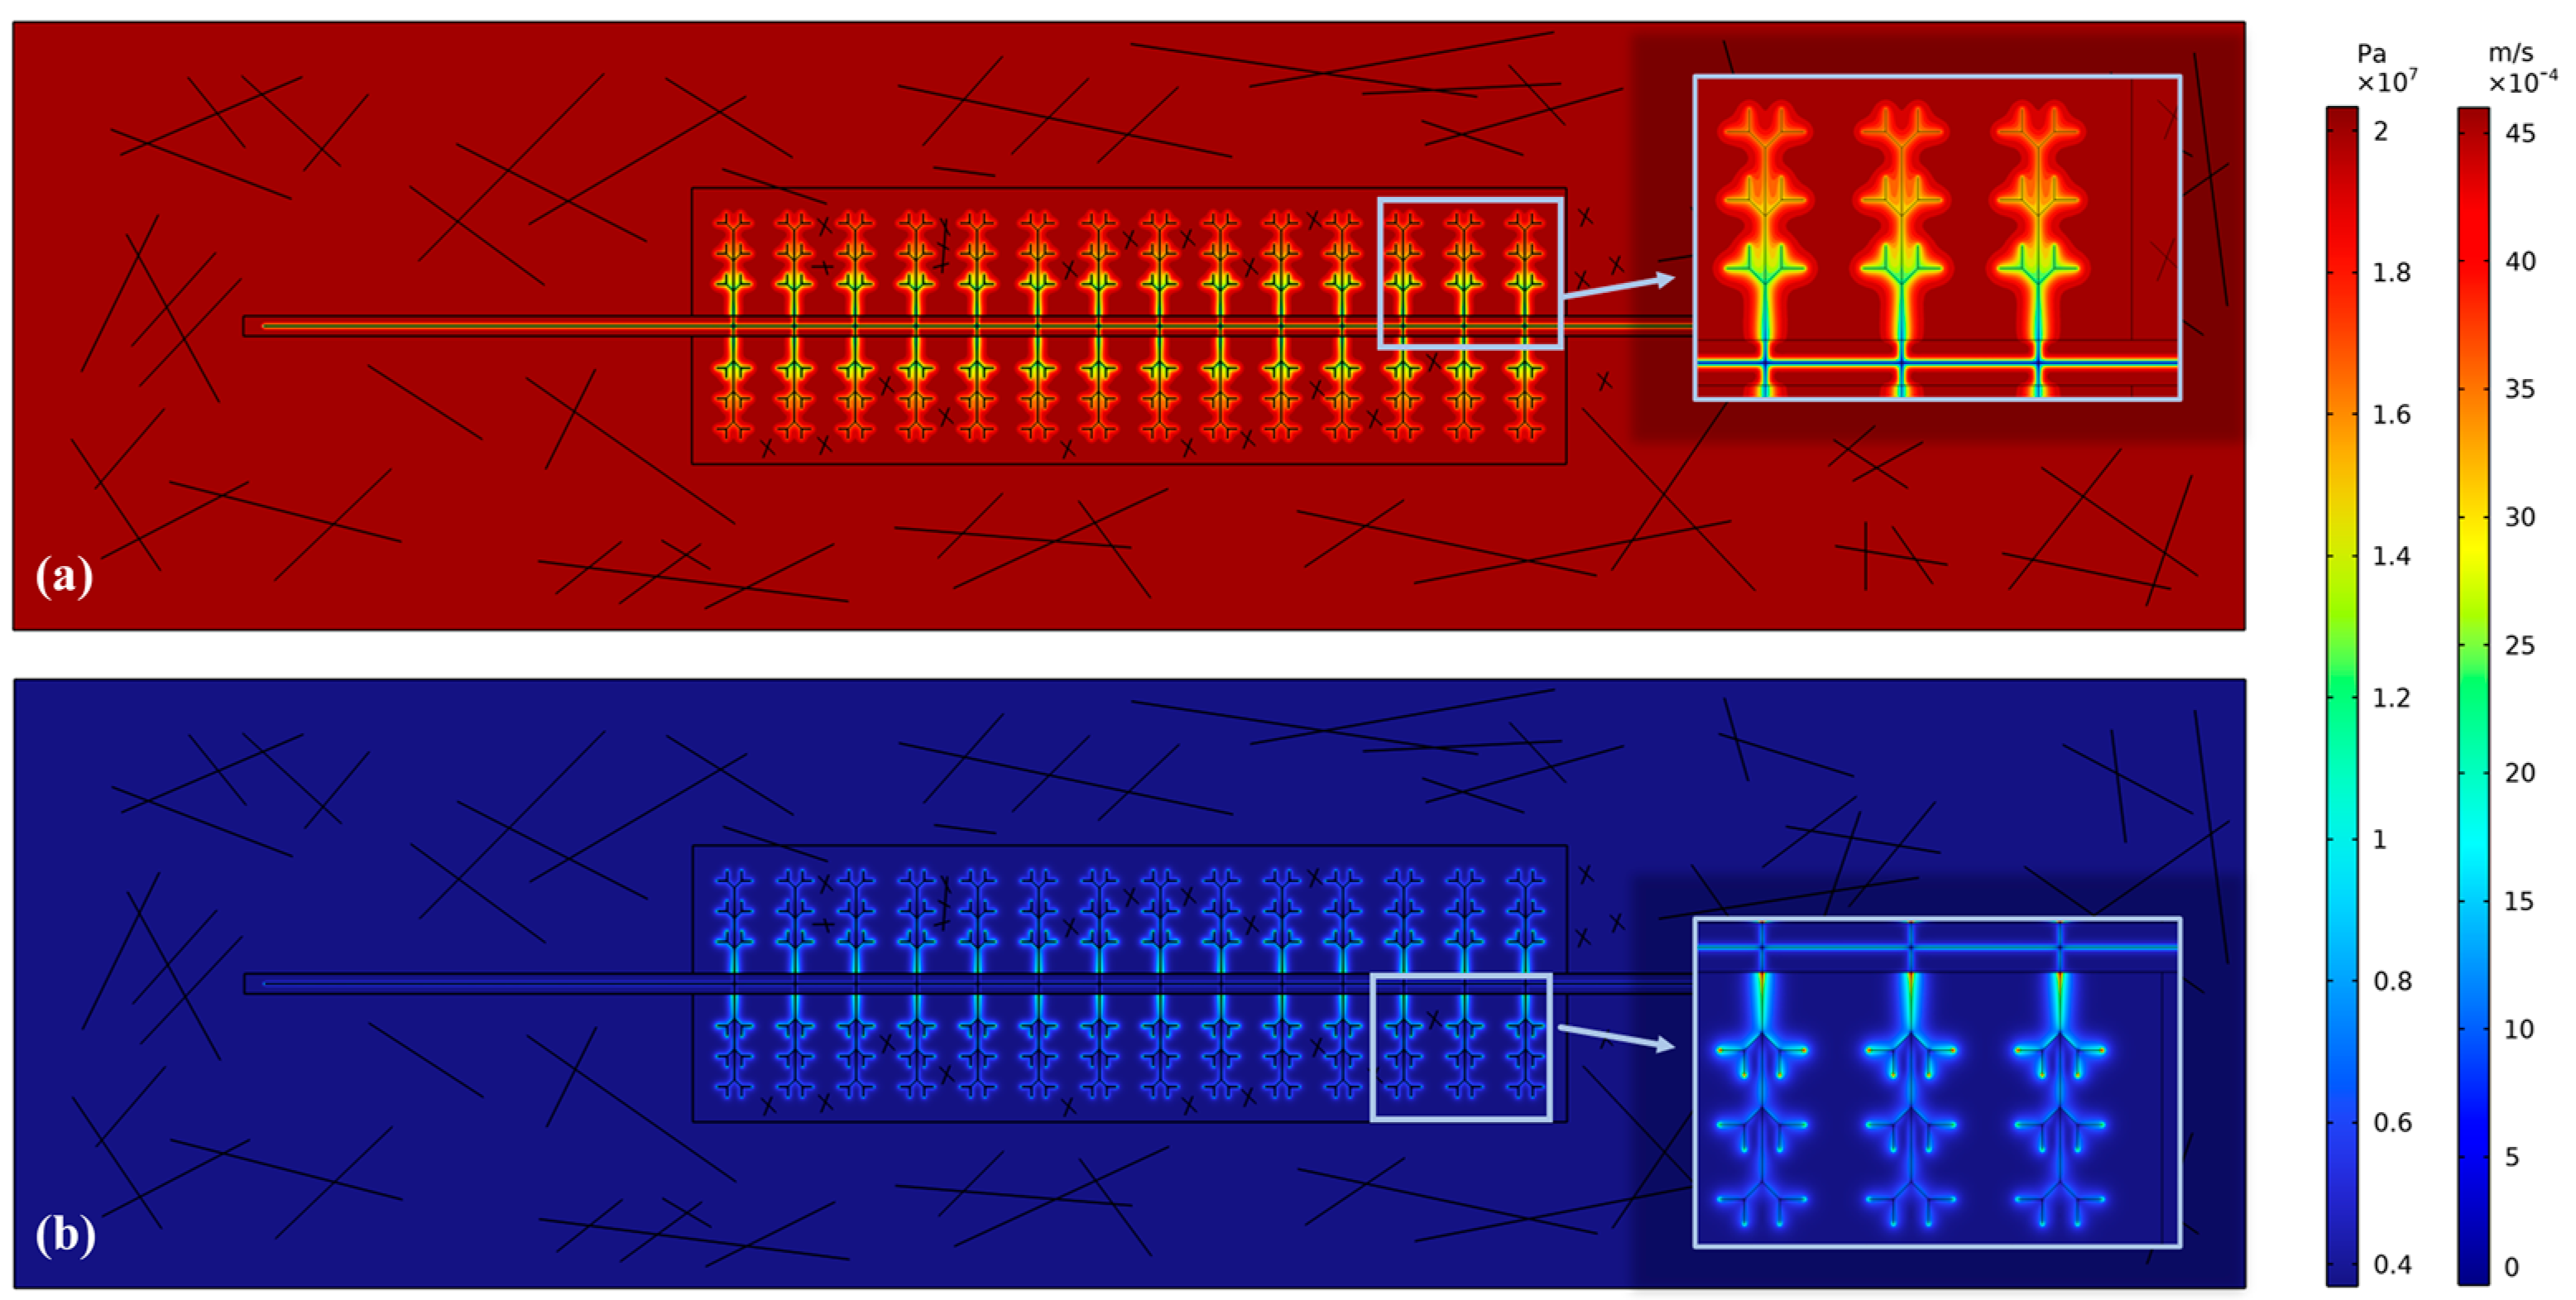
28]. To characterize the shale gas production flow, this part of the current study analyzed the flow and productivity characteristics of shale gas in different periods, considering reservoir pressure and Darcy velocity. The reservoir pressure diagram intuitively represents the production flow of shale gas. The Darcy velocity represents the average flow velocity of shale gas in a reservoir. A greater Darcy velocity indicates that shale gas flows to horizontal wells at a higher rate. Using the Darcy velocity diagram, the inflow position and production of shale gas can be quantitatively analyzed.
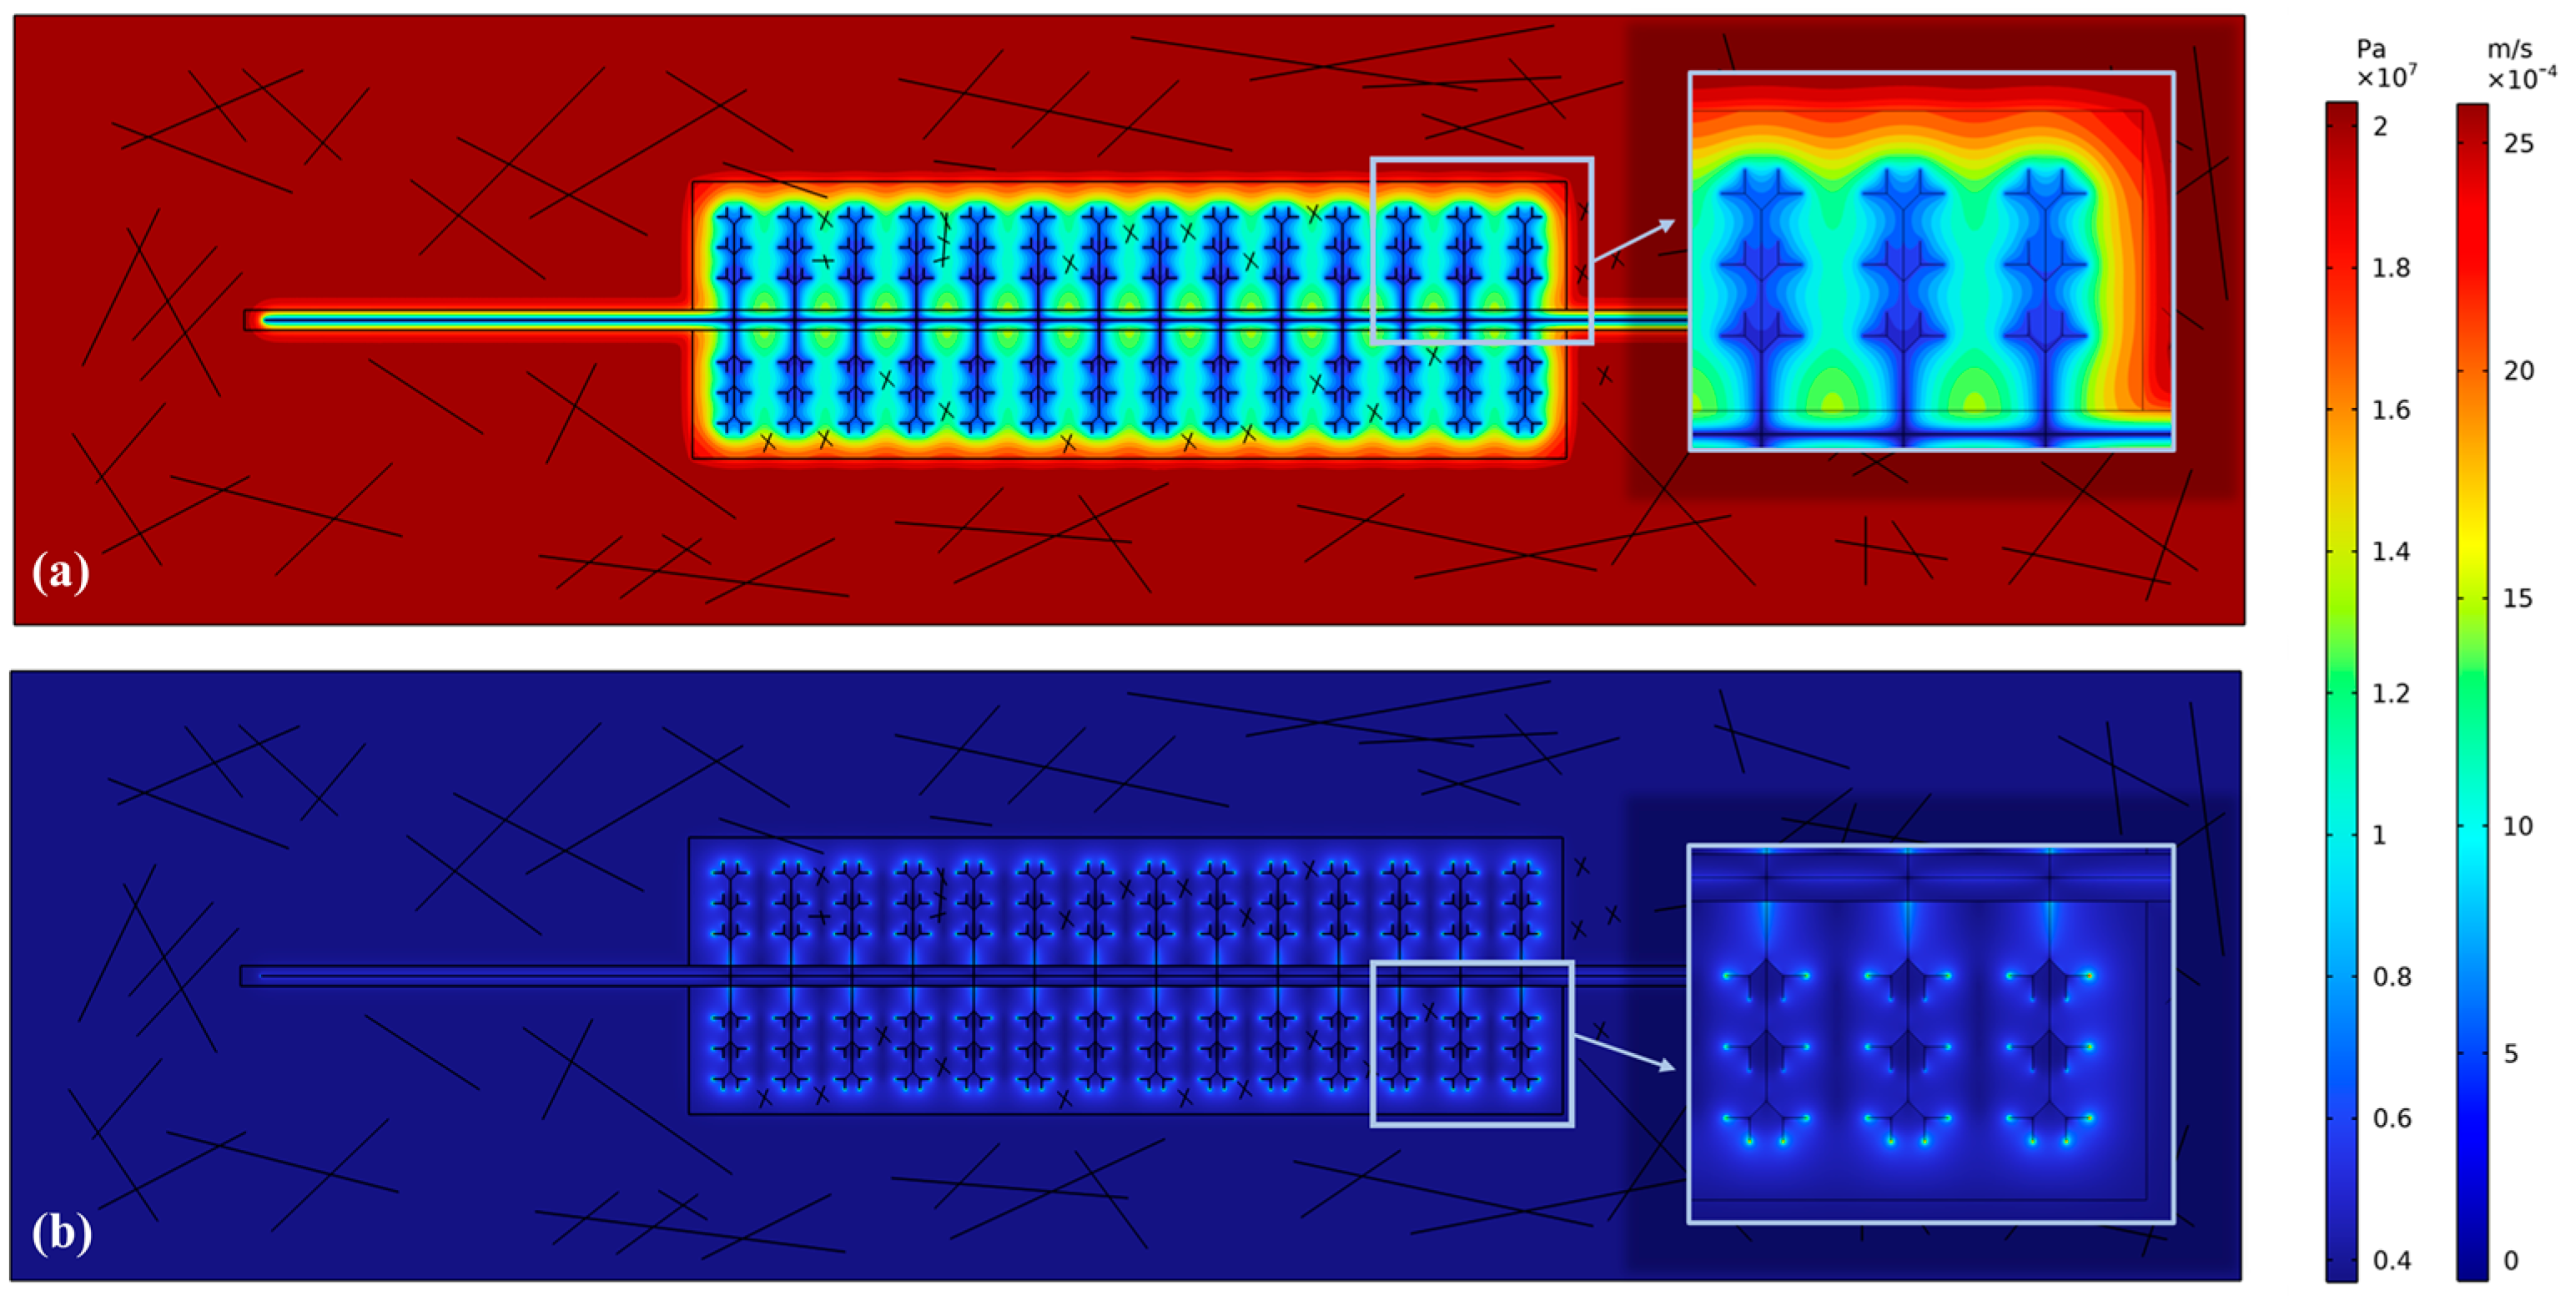
Figure 7 shows the initial reservoir pressure and shale gas flow on the 0th day. The pressure of the horizontal well is a constant flow pressure at the lowest hole. Due to the large pressure difference between the horizontal well and the reservoir, the area near the fracture origin in the horizontal well is prone to pressure drop. Notably, the production range mainly consists of the horizontal well and the fracture origin. According to the Darcy velocity, the whole horizontal well section and the fracture origin are areas ready for shale gas diversion. The supply range of shale gas is located near the horizontal well, and the pressure difference between the horizontal well and the reservoir is large.
Figure 8 shows the initial reservoir pressure and the shale gas flow on the 10th day. A large pressure drop has occurred near the hydraulic fracture, tending to decrease progressively with increasing distance from the horizontal well. This change shows that shale gas is mainly being exploited around the fracture. In addition, a closer fracture to the horizontal well experiences greater exploitation of the surrounding shale gas. This feature can also be identified using the Darcy velocity. Around the hydraulic fracture exhibiting a closer vicinity to the horizontal well, the inflow of shale gas is faster, and the productivity per unit time is greater. Notably, the damaged area restricts the fracture conductivity and the shale gas inflow in the reservoir. Consequently, fracture expansion is largely impeded in the damaged areas due to the limited conductivity and production range, greatly limiting shale gas productivity.
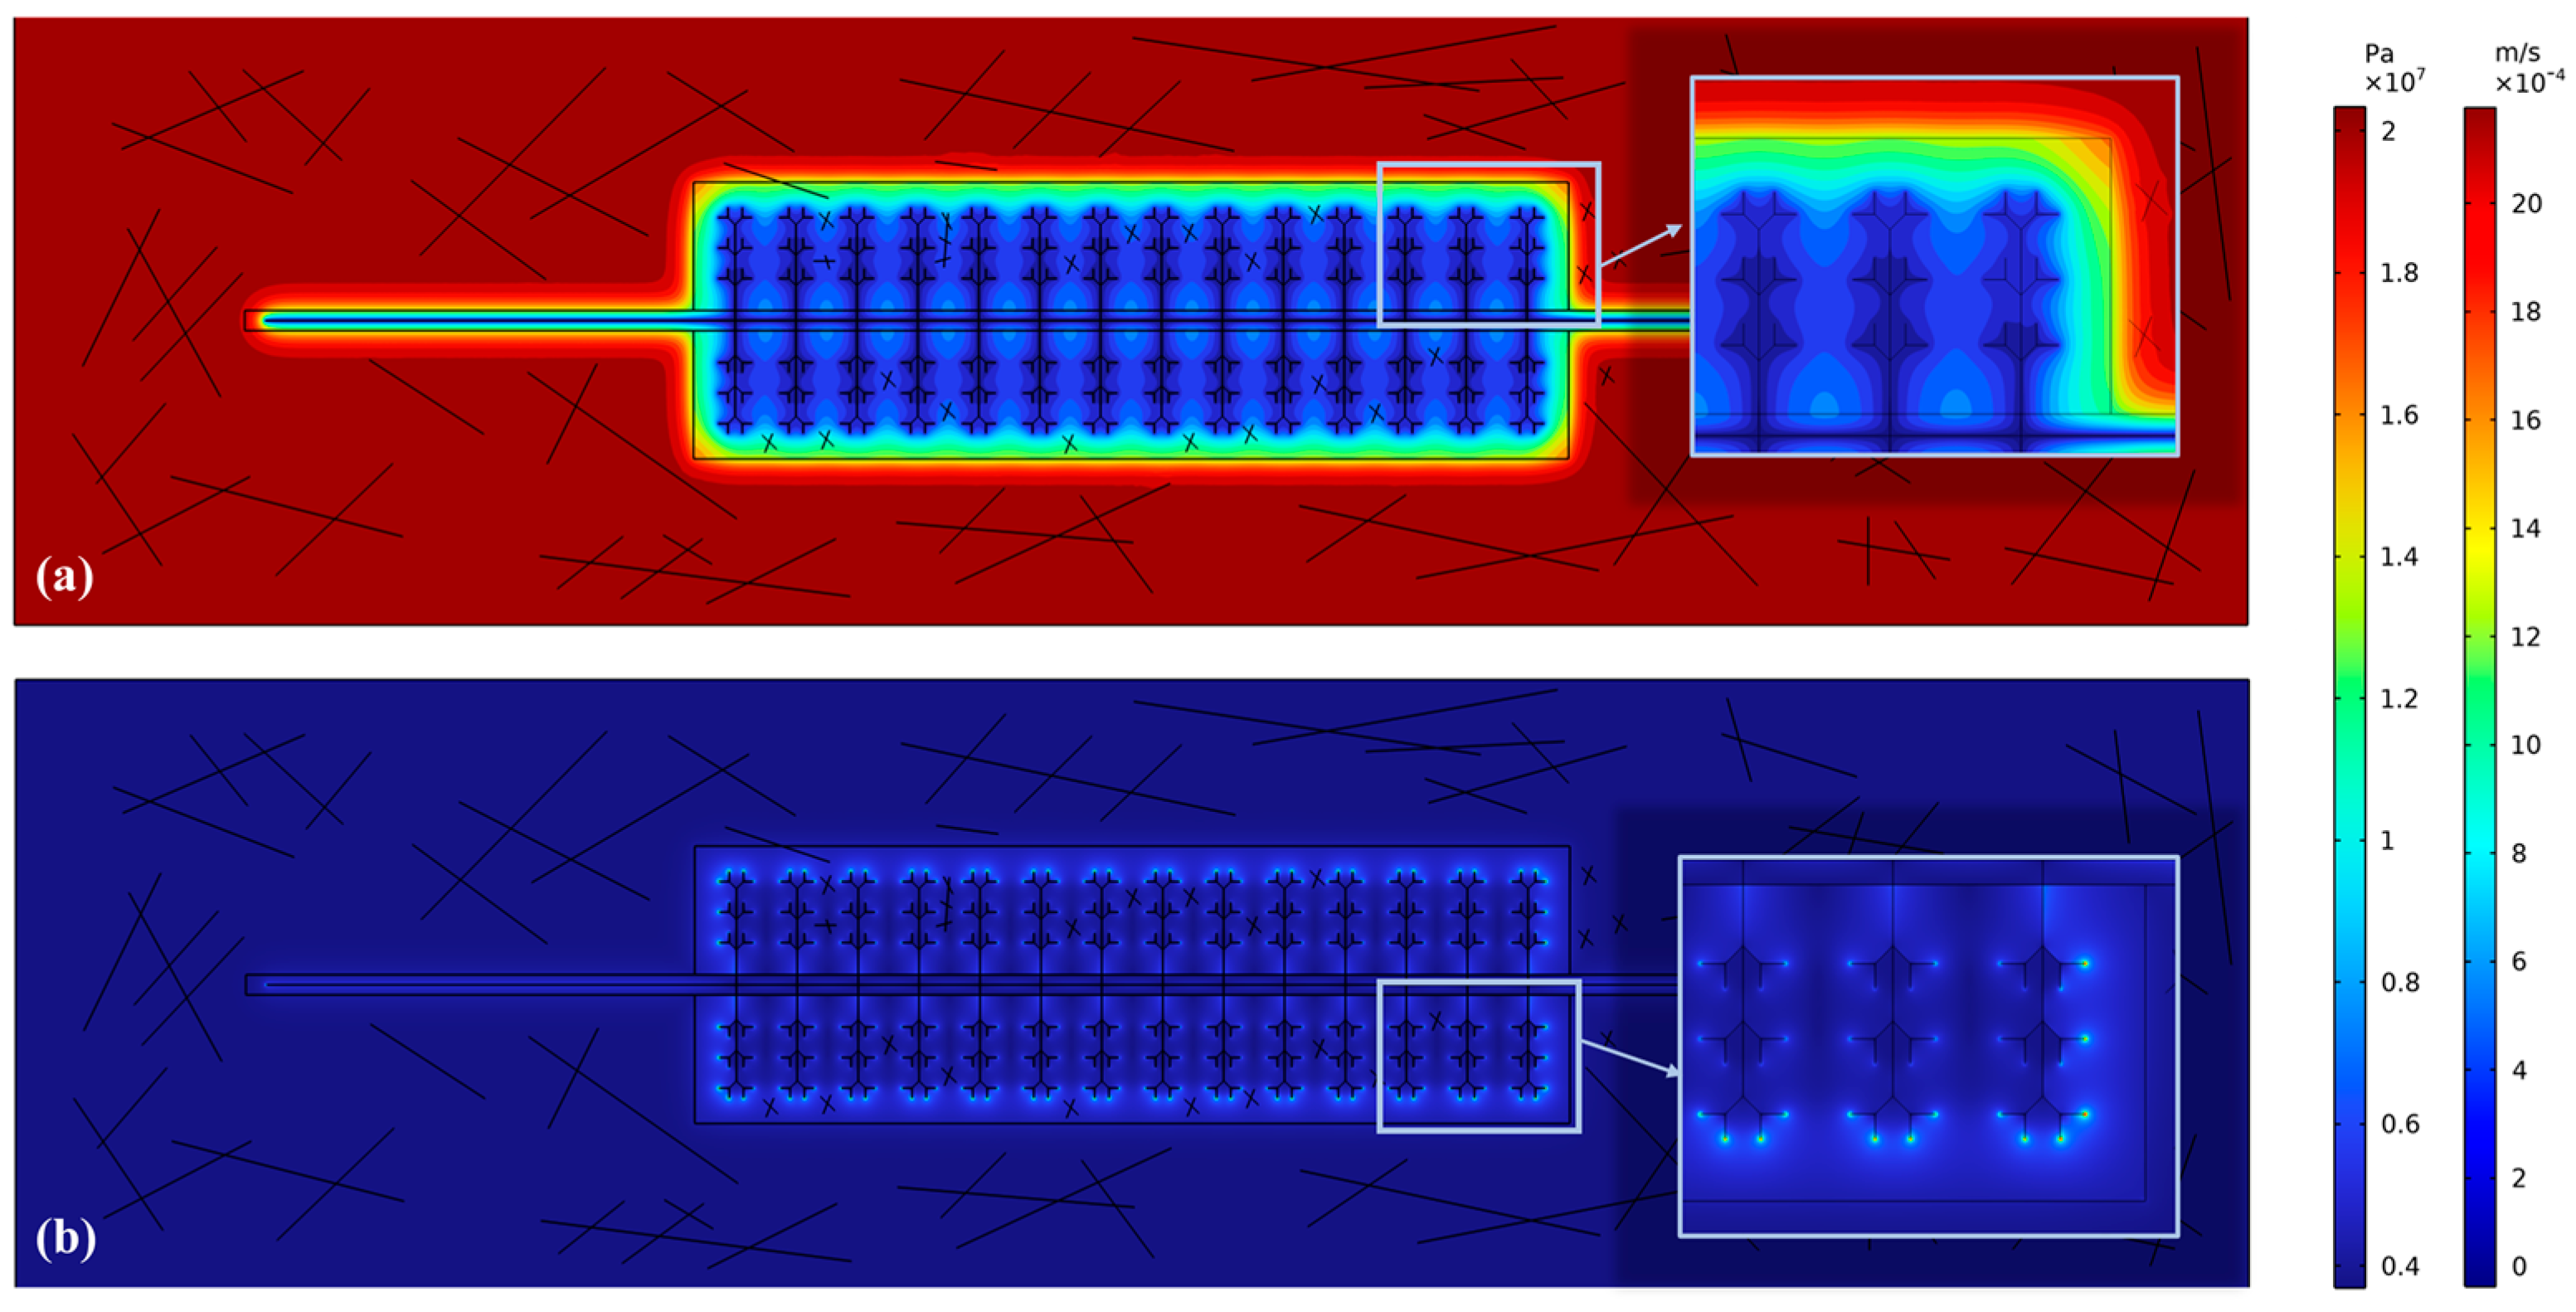
Figure 9 shows the initial reservoir pressure and shale gas flow on the 300th day. Various degrees of pressure drop are observed across the entire stimulated area, indicating the rapid expansion of the production range. When moving closer to the hydraulic fracture, the pressure drop is more pronounced, and the shale gas development at this location is more extensive. At this time, compared with the 10th day, the shale gas also flows into horizontal wells through hydraulic fractures; notably, the increase in productivity becomes less pronounced with increasing proximity to the horizontal well, due to progressive stimulation of the hydraulic fractures; moreover, fewer differences exist in the productivity of shale gas inflow per unit time for a single main hydraulic fracture and its extended secondary fractures. With the expansion of the shale gas supply area, the flow distance required for shale gas to enter hydraulic fractures and horizontal wells is prolonged, the seepage resistance is increased, and the shale gas productivity undergoes reduction.
The initial reservoir pressure and shale gas flow on the 800th day are presented in
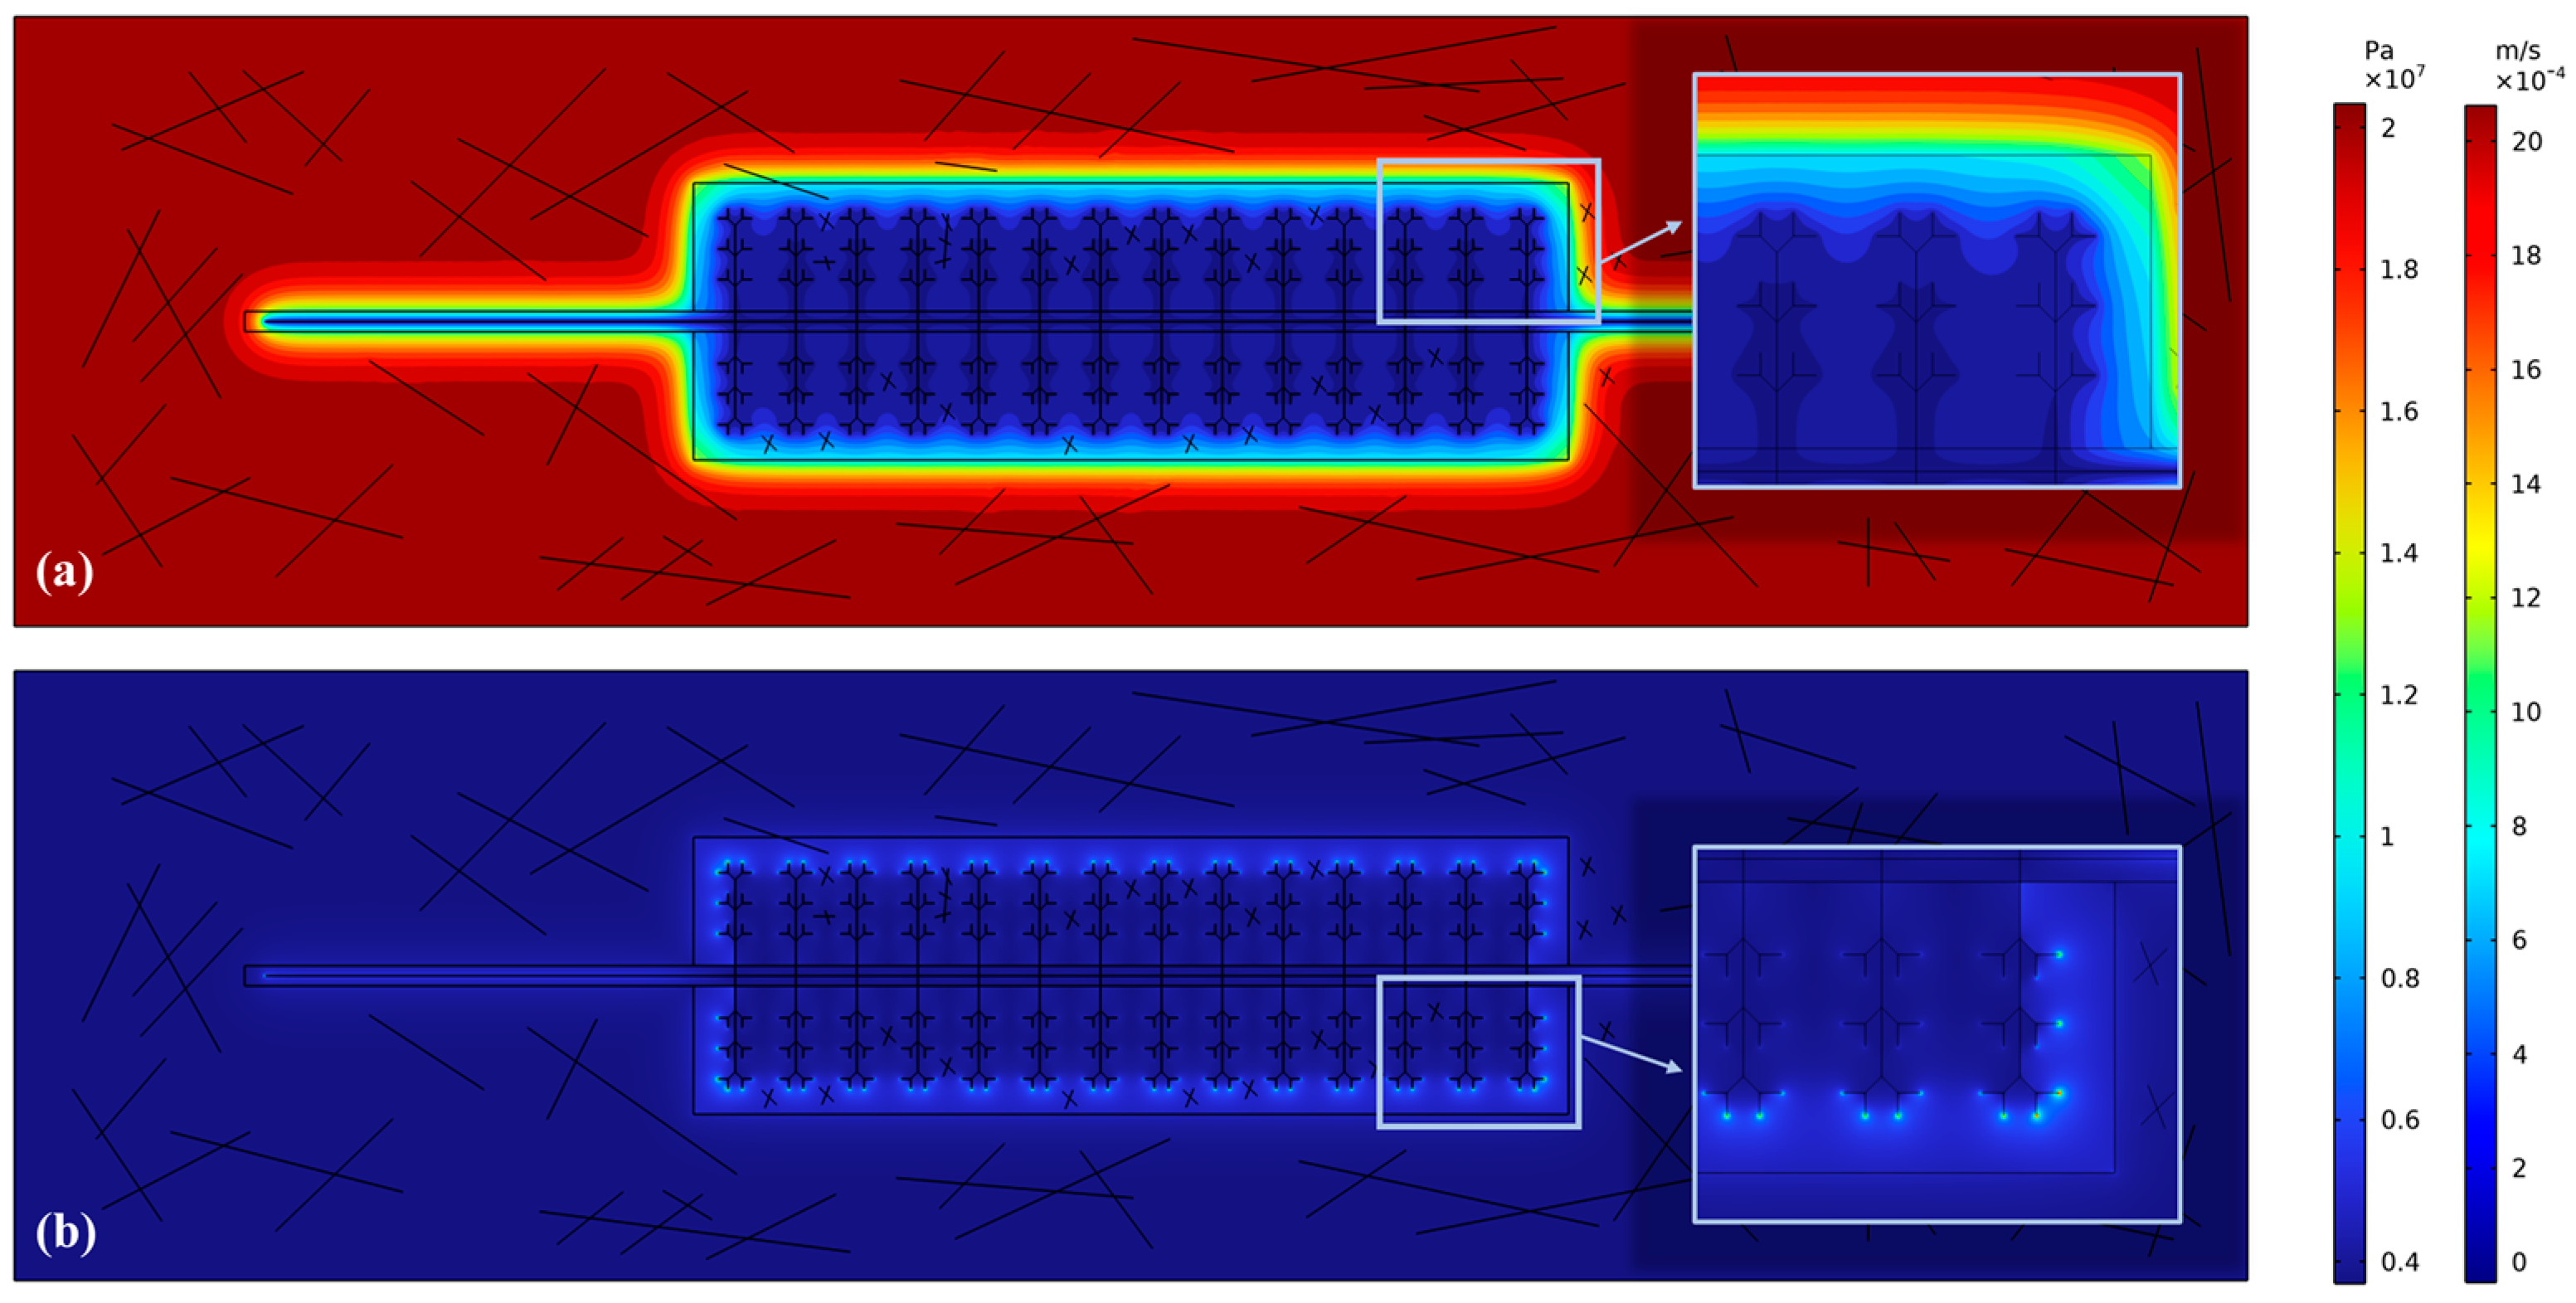
Figure 10. In the real Barnett Shale production data, shale gas enters a stable production period on the 800th day. At this time, the unstimulated area also experiences a pressure drop, indicating shale gas production in the USRV area. Since some shale gas in the SRV area is still not fully developed, the shale gas productivity is mainly achieved through the remaining resources in the SRV area. According to the Darcy velocity of the reservoir in
Figure 10, the shale gas flowing through the outer boundary fractures of the fracture network has a high flow rate. In contrast, the shale gas flows into the internal fractures at a relatively low rate, resulting in a pronounced difference in contribution to productivity. This is attributed to the relatively smaller amount of shale gas, due to previous mining in the internal hydraulic fracture network. Consequently, the reservoir cannot provide sufficient shale gas to flow readily toward the fractures. Compared with the previous stage, the shale gas supply area expands and the seepage resistance of the gas flow into hydraulic fractures increases. These increases continuously reduce the shale gas productivity. On the 800th day of production, the shale gas production enters a stable production period. This period indicates that most of the readily available shale gas in the reservoir has been extracted.
In
Figure 11, the initial reservoir pressure and shale gas flow on the 2000th day are presented. The production flow characteristics in this period are consistent with those on the 800th day, because the shale gas mining continued with further extraction of the residual shale gas around the outer boundary after the 800th day. The remaining shale gas in the reservoir is mainly stored in the untransformed area. This accumulation region has comparatively low porosity and low permeability and is a great distance away from the hydraulic fracture. As a result, the shale gas in this area can only rely on the reservoir pressure to overcome the large seepage resistance. In addition, the flow rate of gas flowing toward the hydraulic fracture and into the horizontal well is low.
Shale gas production was also compared between the two periods. The results demonstrated small differences regarding the flow channels (such as from the position where shale gas flowed into hydraulic fractures) and the flow velocities; notably, on the 2000th day, with the gradually increasing area of shale gas supply, the shale gas flowed in the untransformed area. With the gradual increase in the seepage resistance to the horizontal well, the production decreased, and the production characteristics persisted until the well was shut down.
5. The Influence of Different Parameters on Shale Gas Productivity
In the previous chapter, the flow characteristics of shale gas throughout the life cycle have been introduced. Shale gas productivity is related to multiple factors. Some are uncontrollable, such as the size of the shale gas reservoir, the initial reservoir permeability, and the initial reservoir permeability. As the initial properties of the reservoir, these are not discussed here. Among the controllable factors, the degree of damage to the reservoir, the stimulation intensity, and fracture spacing are three important variables of interest. These factors can greatly affect shale gas productivity in reservoirs. In this sense, they are worth comprehensive consideration in shale gas production modeling and actual production. This part of the current study analyzes the influence of these three factors on shale gas production.
Most of the existing simulation models for shale oil and gas do not consider the existence of damaged areas. Consequently, traditional models cannot accurately reflect the influence of different media in the reservoir on the production flow of shale gas. In this study, the damage coefficient is introduced to express the degree of damage to the corresponding zone. The dimensionless expression of the damage coefficient is as follows:
where
is the permeability of the damaged area, md;
is reservoir permeability, md.
The damage coefficient is typically dimensionless and is used to describe the degree of failure of a damaged area. A smaller coefficient indicates a larger permeability of this area and less severe damage to the damaged layer. The minimum damage coefficient is 0, indicating the integrity of the investigated area, and the corresponding permeability is the reservoir’s initial permeability. In contrast, the maximum damage coefficient is 1, indicating zero permeability and extremely severe damage. The values of this coefficient are listed in
Table 5.
Similarly, this study employs the stimulation coefficient to represent the intensity of stimulation in the SRV. Its dimensionless expression can be obtained as follows:
where
is the permeability of stimulated area, md;
is the reservoir permeability, md.
Stimulation coefficient is also dimensionless. It has been introduced in this model to describe the stimulation degree of an SRV area. A larger coefficient value represents a higher permeability and a greater stimulation degree in the zone of interest. The minimum value of the stimulation coefficient is 0, which suggests a poor hydraulic fracturing effect and basically unchanged reservoir permeability. Theoretically, the transformation coefficient can be taken as extremely large. Here, the real permeability of Barnett Shale was determined as the standard, taking the value of the corresponding transformation coefficient. The values of the stimulation coefficient are given in
Table 5.
Fracture spacing is a highly important feature in the complex fracture networks formed by hydraulic fracturing. It affects the stimulation of shale gas production potential in reservoirs and subsequent reservoir reconstruction planning. The Barnett Shale fracture spacing was used as the standard to study the effect of equidistant increase or decrease in fracture spacing on shale gas productivity under real conditions, and the values are summarized in
Table 5.
To investigate the influence of the above three factors, the daily productivity, the pressure around the fracture, and the cumulative productivity were studied separately. Firstly, the influence of different factors on the daily curve of shale gas productivity was analyzed. Then, considering the reservoir pressure at the position of the complex shale gas flow, the daily productivity change law was established. Combined with the cumulative productivity during the production life cycle of horizontal wells, the optimal control range of each factor was obtained. Subsequently, we compared the simulation results with the actual production values, taking into account the influence of various factors. On this basis, reasonable suggestions for increasing production and stabilizing production are given. This part of the study can clarify the laws of various factors influencing shale gas productivity, theoretically guiding actual shale gas production.
5.1. Effect of Various Degrees of Damage on Shale Gas Productivity
Figure 12 plots the daily productivity of shale gas under different values of damage coefficient. Accordingly, the daily productivity of shale gas decreases rapidly with progressive production until it reaches a stable period. This trend is consistent with the actual trend of shale gas production. When the damage coefficient decreases, the daily productivity increases at a reduced growth rate. Moreover, the degree of damage affects shale gas production throughout the life cycle. The pressure drops around the fracture on the 800th day are presented in
Figure 13. With the rising damage coefficient, a “difficult production area” of shale gas emerges in the damaged area. The conductivity of this region greatly influences local shale gas exploitation. Specifically, in the case of a low damage coefficient, the shale gas flowing into the horizontal well encounters low seepage resistance. Consequently, the shale gas in the “difficult production area” is fully exploited, contributing to high shale gas productivity. In contrast, when the damaged coefficient is excessively large, the stored shale gas needs to overcome considerable seepage resistance to flow into the horizontal well through the damaged area, resulting in low flowing rates. This largely decreases shale gas productivity. It is worth noting that when the damage coefficient is 1, the damaged area contains almost no shale gas flow, and no pressure drops occur in this zone. The exploitation of shale gas is blocked, and the productivity plummets. This phenomenon is a major source of pollution during the development of shale gas reservoirs.
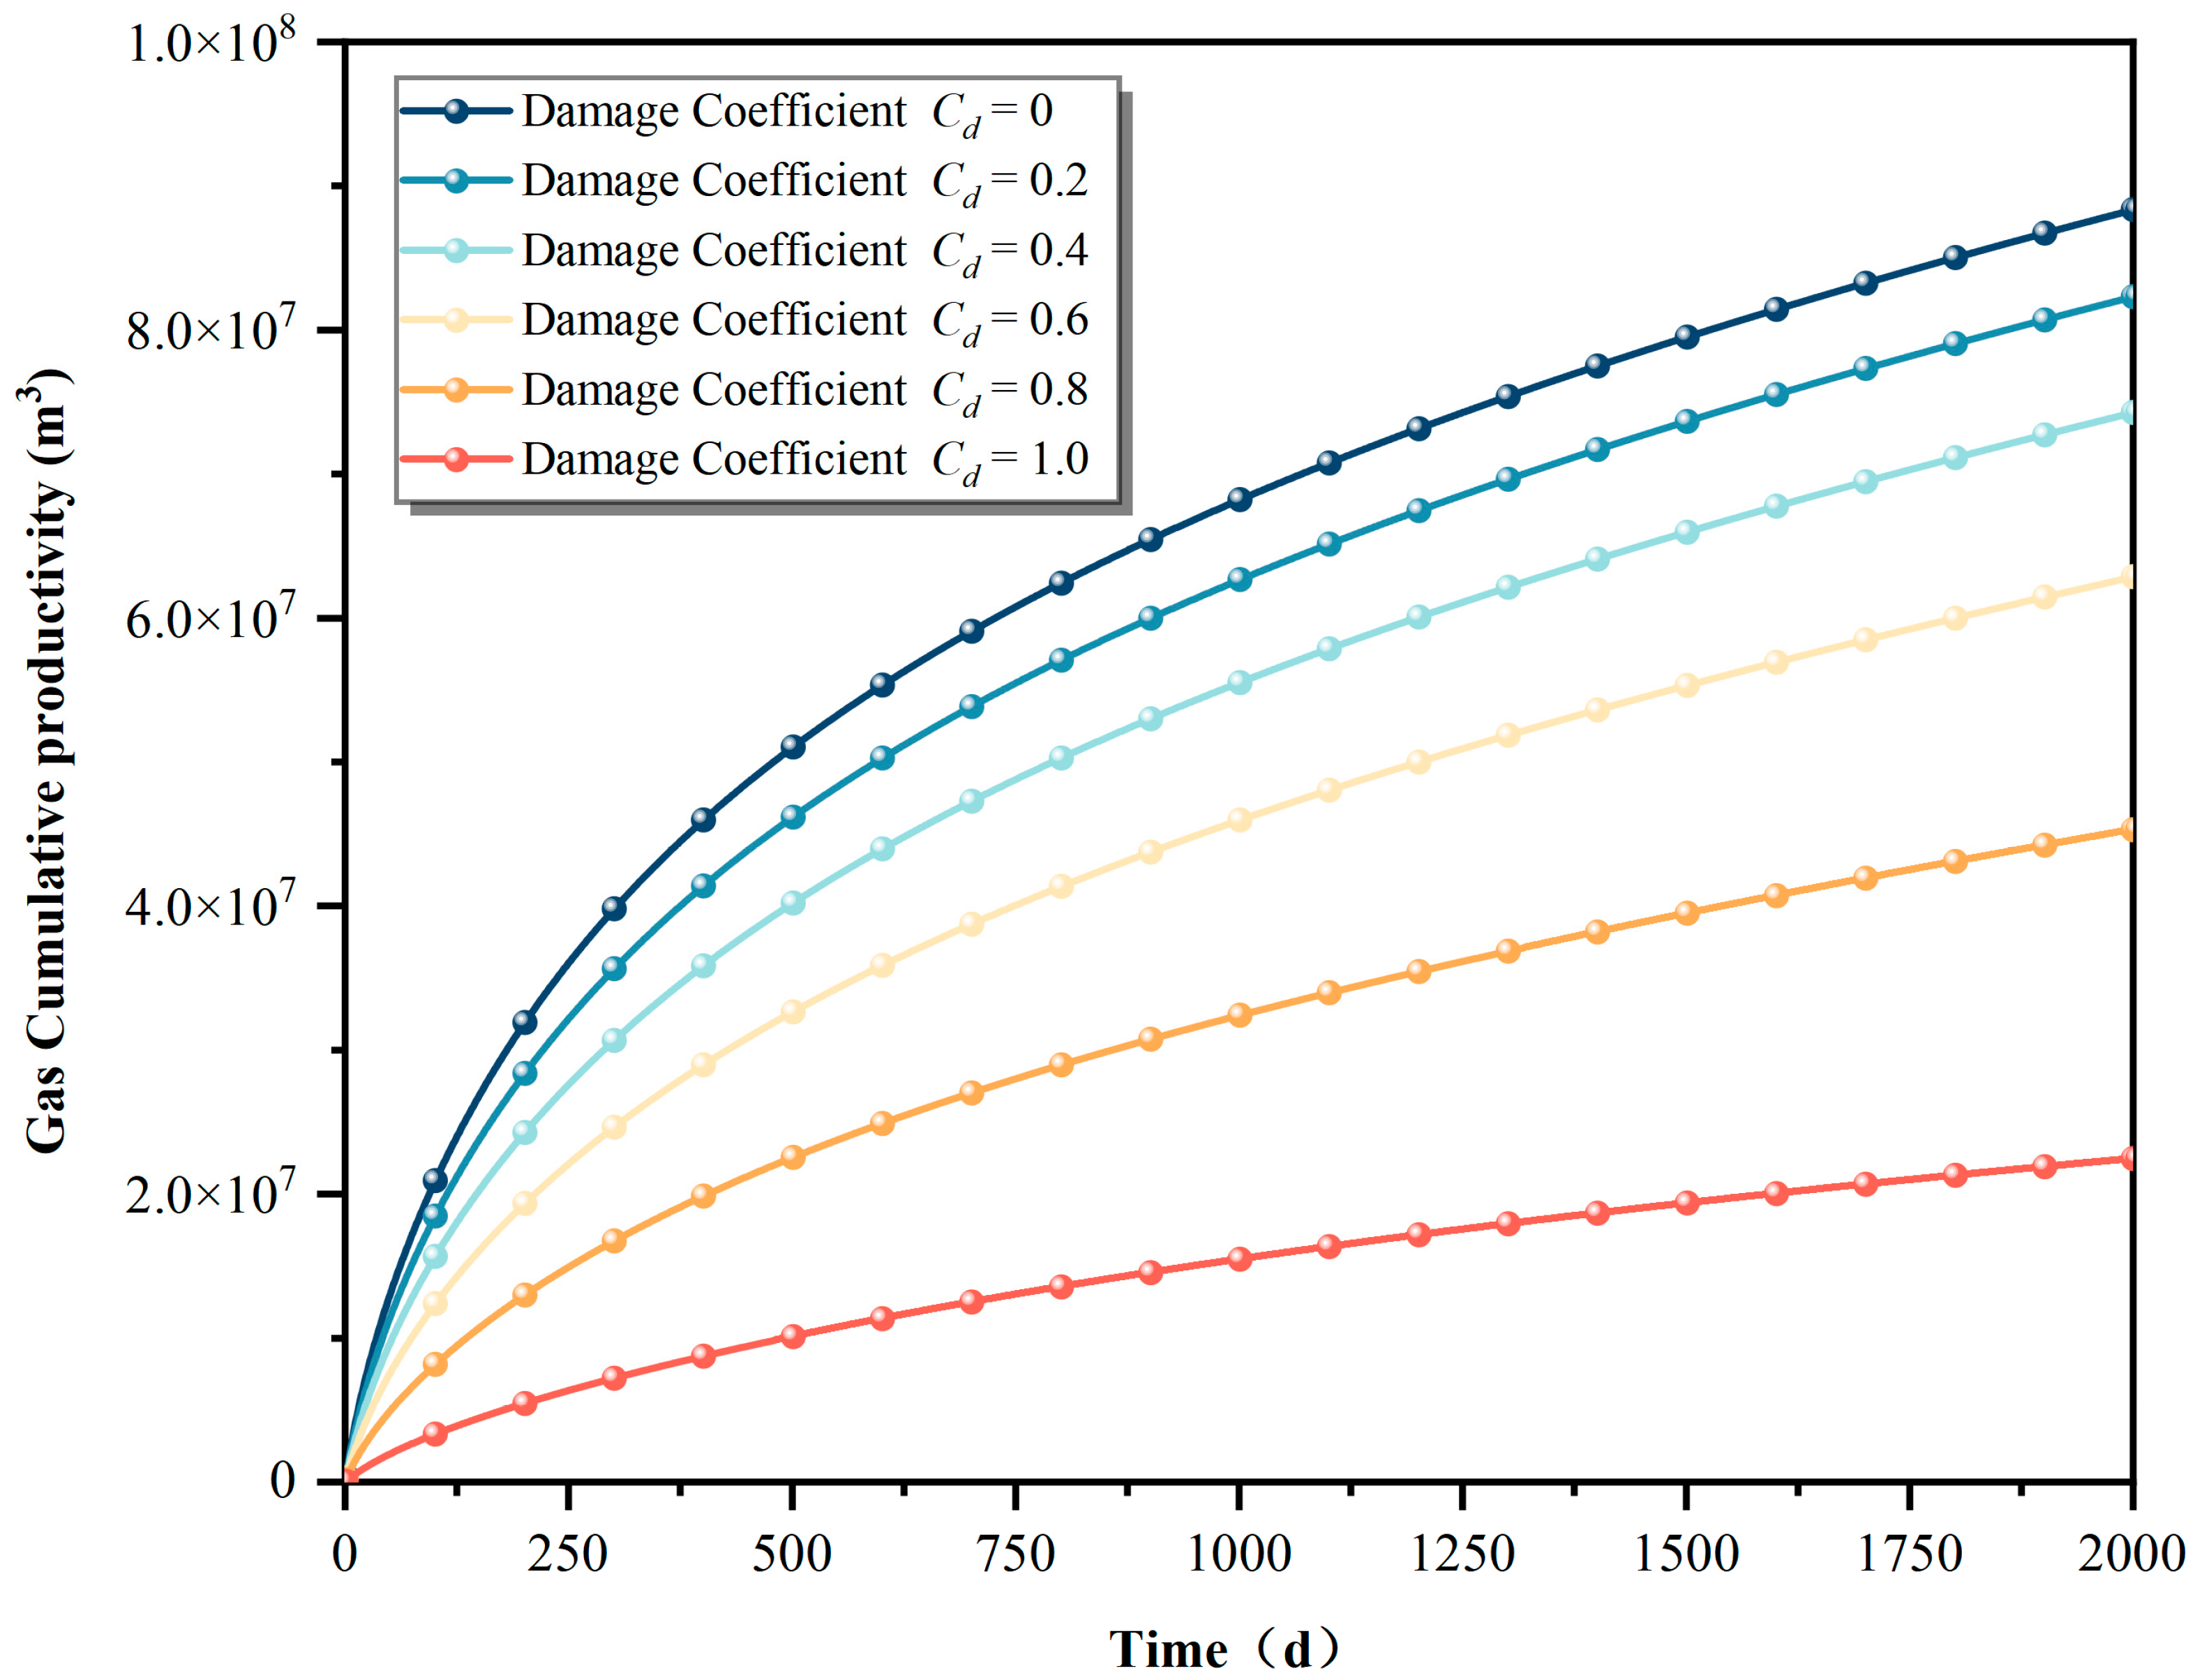
The changes in the cumulative shale gas productivity with varying damage coefficient values are illustrated in
Figure 14. The cumulative productivity of shale gas increases rapidly at the beginning of production. In contrast, this growth rate decreases with progressive production. When the damage coefficient drops from 1 to 0.8, the cumulative productivity increases by 50%. With further decreases from 0.8 to 0.6, greater than 30% increases in cumulative productivity are observed. After reductions from 0.6 to 0.4, this cumulative productivity experiences an increase of about 15%. Following additional decreases from 0.4 to 0.2, the cumulative shale gas productivity increases by 8%, and the change in damage coefficient has no obvious effect.
A smaller damage coefficient contributes to greater cumulative shale gas production capacity. Notably, an excessively high damage coefficient pollutes the reservoir and largely restricts shale gas production. In comparison, an overly small damage coefficient improves shale gas productivity only slightly. Based on the above analysis, the control range of the damage coefficient should be determined according to the actual reservoir conditions. According to the analysis of the model results, the recommended range of damage coefficient for Barnett Shale is between 0.4 and 0.6. This range the shale gas production capacity to be increased. It can also save reservoir development and transformation costs and increase profits. In the case of Barnett Shale, the damaged area’s permeability is about 40% of the reservoir’s permeability, and the damaged coefficient is 0.6, falling within the recommended interval. These figures verify the reliability and correctness of our model [
8,
19].
5.2. Impact of Different Stimulation Intensities on Shale Gas Productivity
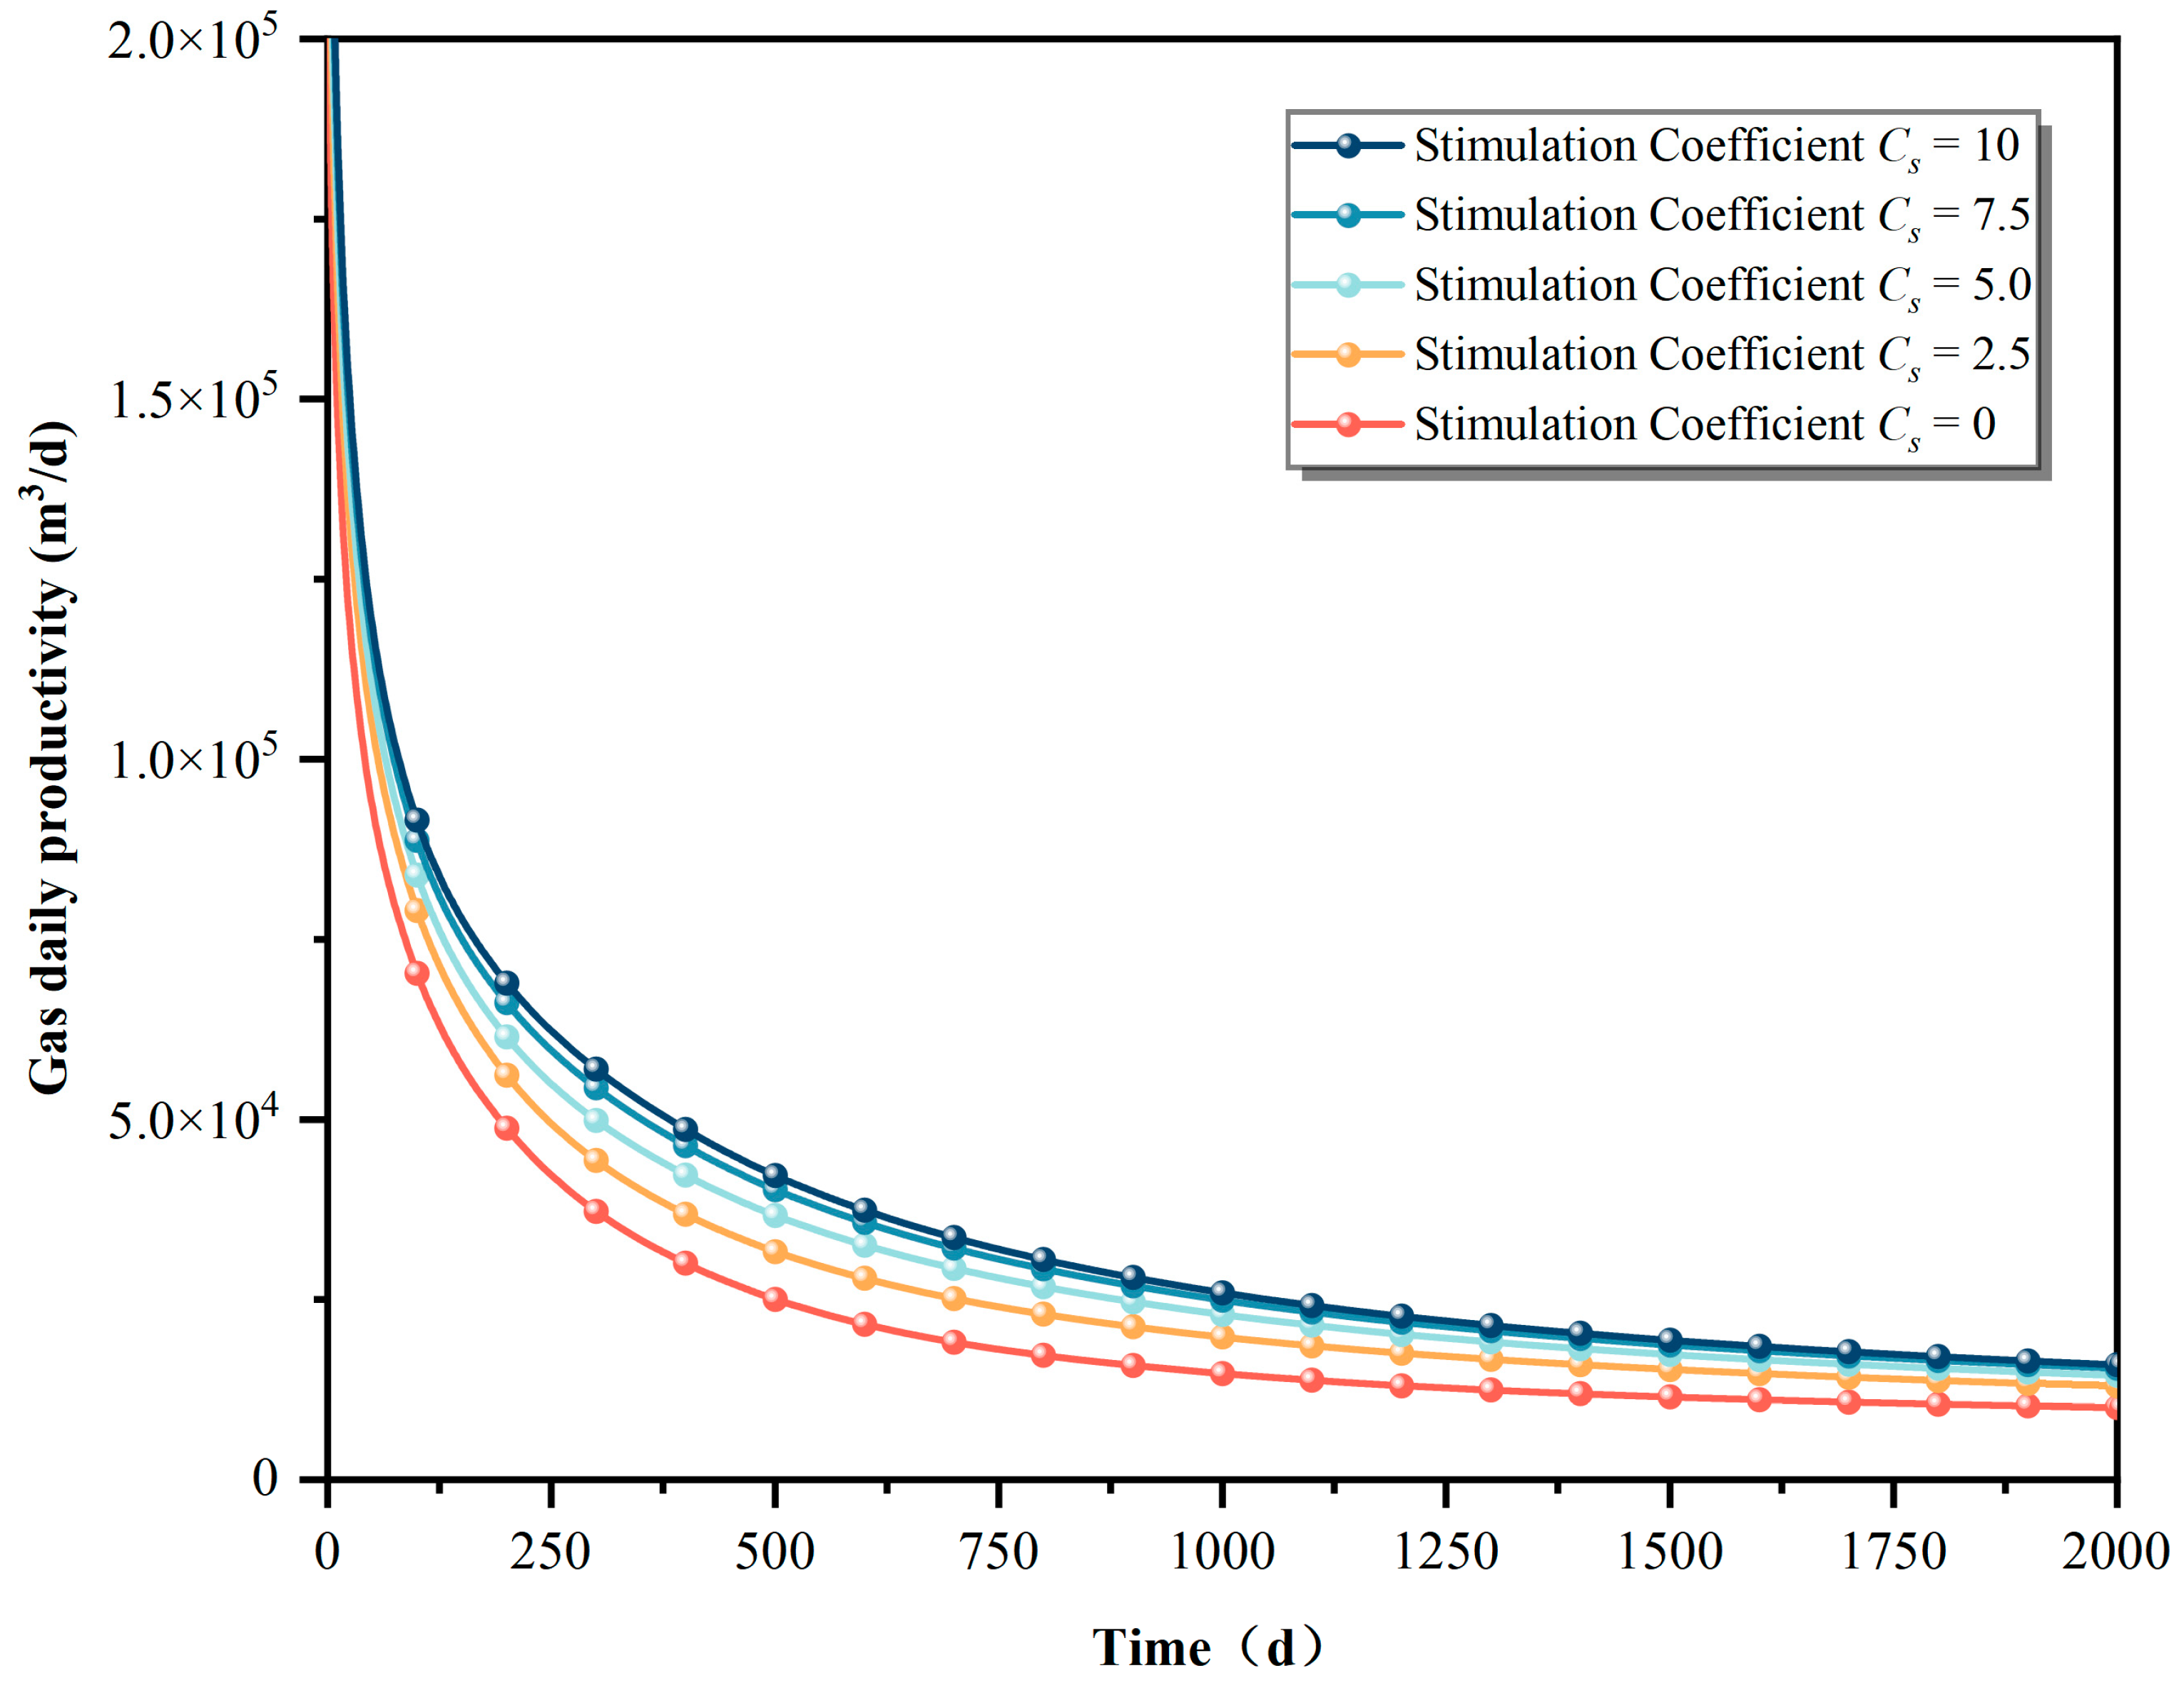
Figure 15 schematically presents the daily productivity of shale gas under different stimulation coefficients. The daily productivity of shale gas decreases rapidly with varying stimulation coefficients before the stable production period. With intensified stimulation in the SRV area, the daily productivity of shale gas increases. Notably, the degree of these increases is reduced with the rise in the stimulation coefficient. The change in stimulation coefficient mainly affects shale gas production in the middle and late stages.
Figure 16 shows the pressure in the SRV on the 800th day of shale gas production. With the increase in the stimulation coefficient, the pressure drop in the reservoir intensifies and expands. This consequence indicates that increasing the stimulation coefficient can improve shale gas exploitation in the stimulated area. In addition, it can expand the shale gas supply area, improving daily productivity. In the early stage of shale gas production, since the production area is mainly distributed around the fracture, a short distance must be travelled by the shale gas to enter the hydraulic fracture. In this case, the intensity of stimulation has no obvious effect on the shale gas flow, leading to a negligible effect on initial shale gas productivity. With ongoing production, the shale gas supply area expands, and the shale gas productivity greatly depends on the conductivity of the SRV. Stronger conductivity contributes to a weaker obstruction of the shale gas flow, increasing daily productivity. This effect persists throughout the subsequent production of shale gas.
Figure 17 shows the changes in the cumulative shale gas productivity under varying stimulation coefficients. This trend is consistent with the change trend of the cumulative productivity under various damage coefficients. Specifically, the cumulative productivity increases rapidly in the early stage of production due to the high shale gas productivity at that stage. When the gas supply area expands, the seepage resistance increases, and the elevation in cumulative productivity slows down. With the coefficient rising from 0 to 2.5, the corresponding cumulative productivity increases by more than 25%. When it further increases from 2.5 to 5, the cumulative shale gas productivity undergoes a 13% increase. With another increase from 5 to 7.5, the growth in cumulative productivity is only slightly more than 5%. The effect of increasing the stimulation coefficient is reduced.
The stimulation degree of the SRV area should be controlled within a reasonable range. In the case of low stimulation coefficients, increasing the degree of stimulation of the SRV area greatly improves the shale gas productivity. However, excessive intensity of stimulation delivers a minor effect. In actual shale gas production, the degree of stimulation of the SRV area should be strictly formulated to avoid inefficiency in shale gas productivity improvements with rising development costs.
5.3. Influence of Fracture Spacings on Shale Gas Productivity
Figure 18 shows the daily shale gas productivity under different main fracture spacings. The daily shale gas productivity decreases rapidly and then stabilizes, consistent with the change trend of shale gas productivity in actual production. With the increase in fracture spacing, the daily shale gas production capacity also increases. Notably, as the spacing continues to expand, the increase in production capacity becomes much smaller.
Figure 19 presents the pressure drop in the reservoir under conditions of varying fracture spacings. In the early stage of shale gas production, the production area is mainly near the hydraulic fracture, and the shale gas productivity exhibits small differences with different fracture spacings. As production progresses, the supply range of the shale gas expands. If the distance is too short, interference between hydraulic fractures tends to occur. The shale gas supply areas of the main fractures and their secondary fractures largely overlap, decreasing the shale gas productivity. A shorter fracture spacing results in a more obvious phenomenon of interference with productivity. In sum, increasing the fracture spacing can greatly improve the mutual interference between these fractures and increase shale gas productivity. However, excessively large fracture spacings influence shale gas productivity in only a minor way.
The cumulative change in shale gas productivity under conditions of different fracture spacings is presented in
Figure 20. This change trend first evolves fast and then slows down. This tendency is consistent with that under the influence of the damage degree and stimulation intensity. In addition, it conforms to the change trend in real shale gas production. When the fracture spacing increases from 20 m to 25 m, the cumulative productivity increases by nearly 25%. With a further increase to 30 m, an approximately 15% enhancement in cumulative productivity is obtained. When the fracture spacing extends from 30 m to 35 m, the cumulative productivity experiences a relatively small increase of about 7%. In the case of 40 m spacing, the improvement in cumulative productivity is less than 5%.
In summary, fracture spacing and distribution need to be strictly controlled within optimal ranges. This conclusion is consistent with that of other scholars [
8,
9]. When the fracture spacing is small, mutual interference tends to occur between fractures, resulting in low rates of daily and cumulative shale gas productivity. In contrast, excessively large fracture spacing cannot effectively improve shale gas productivity, with limited contributions of less than 5%. For Barnett Shale, it is suggested that the fracture spacing should be controlled at about 30 m, and the main hydraulic fracture be controlled at 30.5 m in real fracture design, validating the correctness and accuracy of our model.
