
Construction of Carbon Dioxide Responsive Graphene Point Imbibition and Drainage Fluid and Simulation of Imbibition Experiments

Abstract
1. Introduction
2. Material and Methods
2.1. Experimental Materials
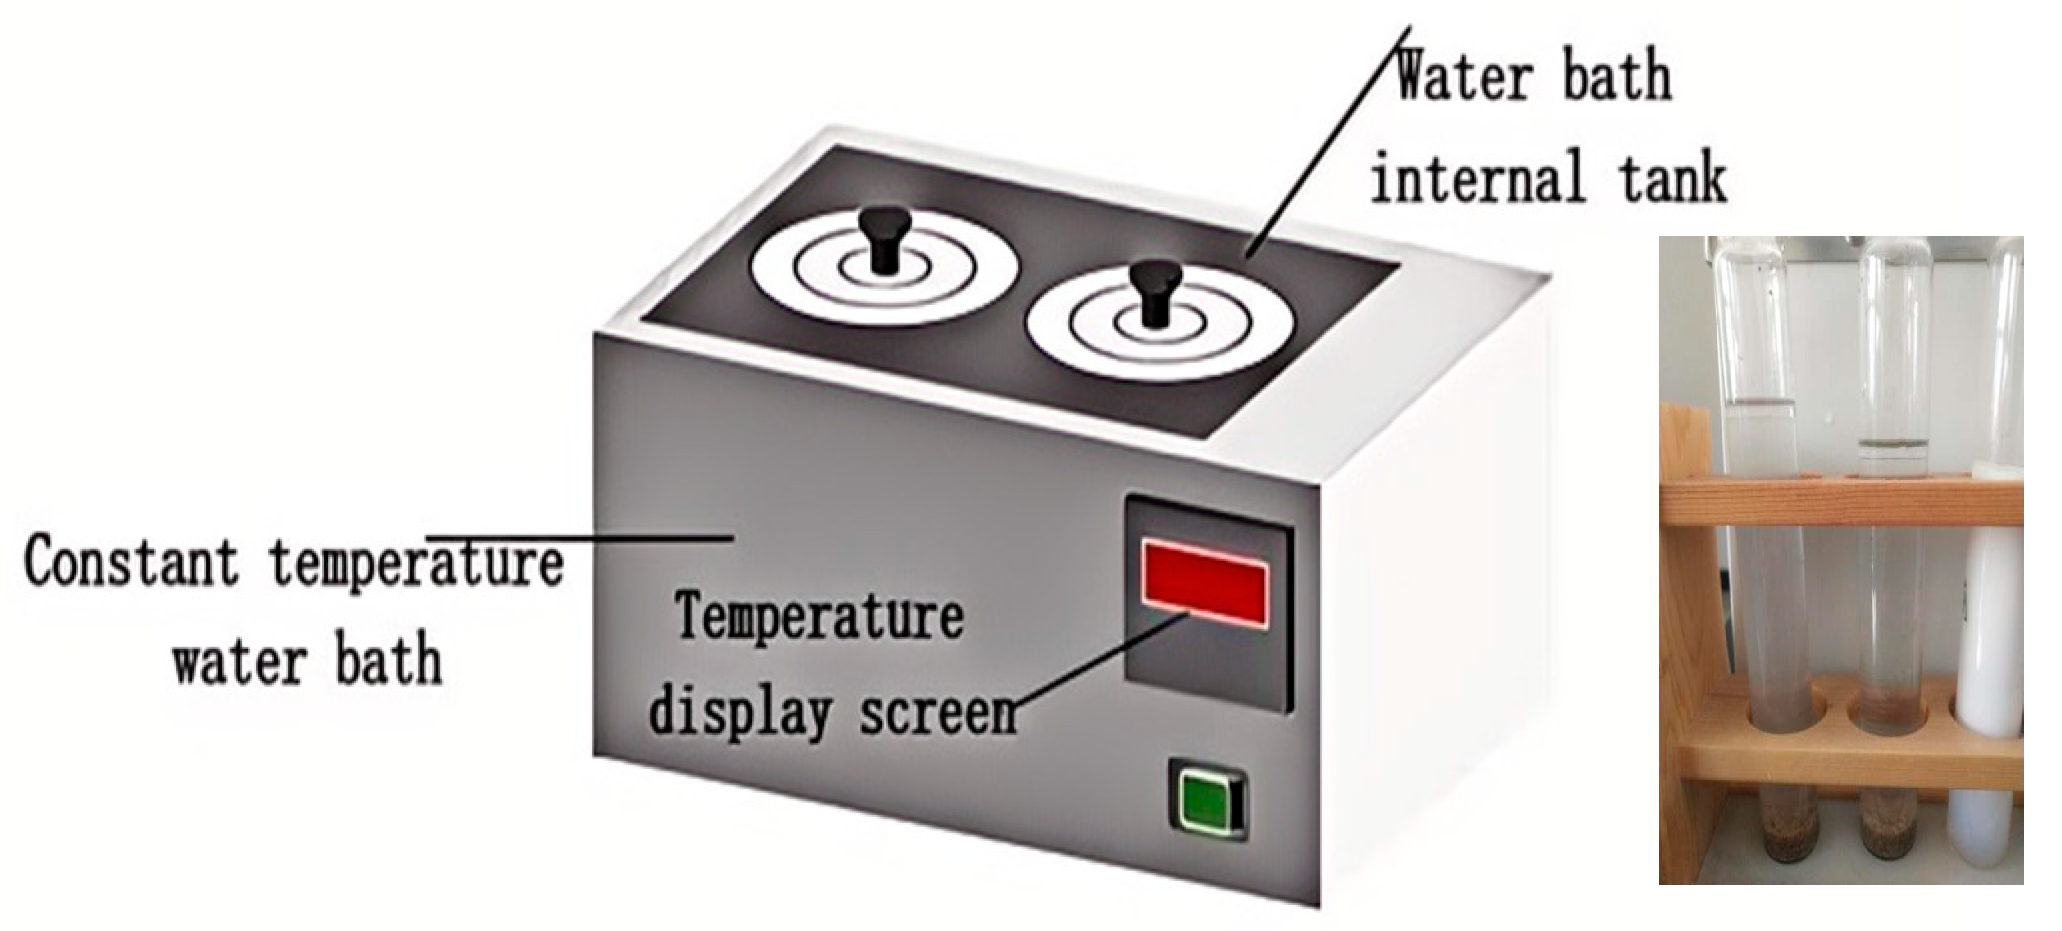
2.2. Experimental Procedures
2.3. Structural Characterization
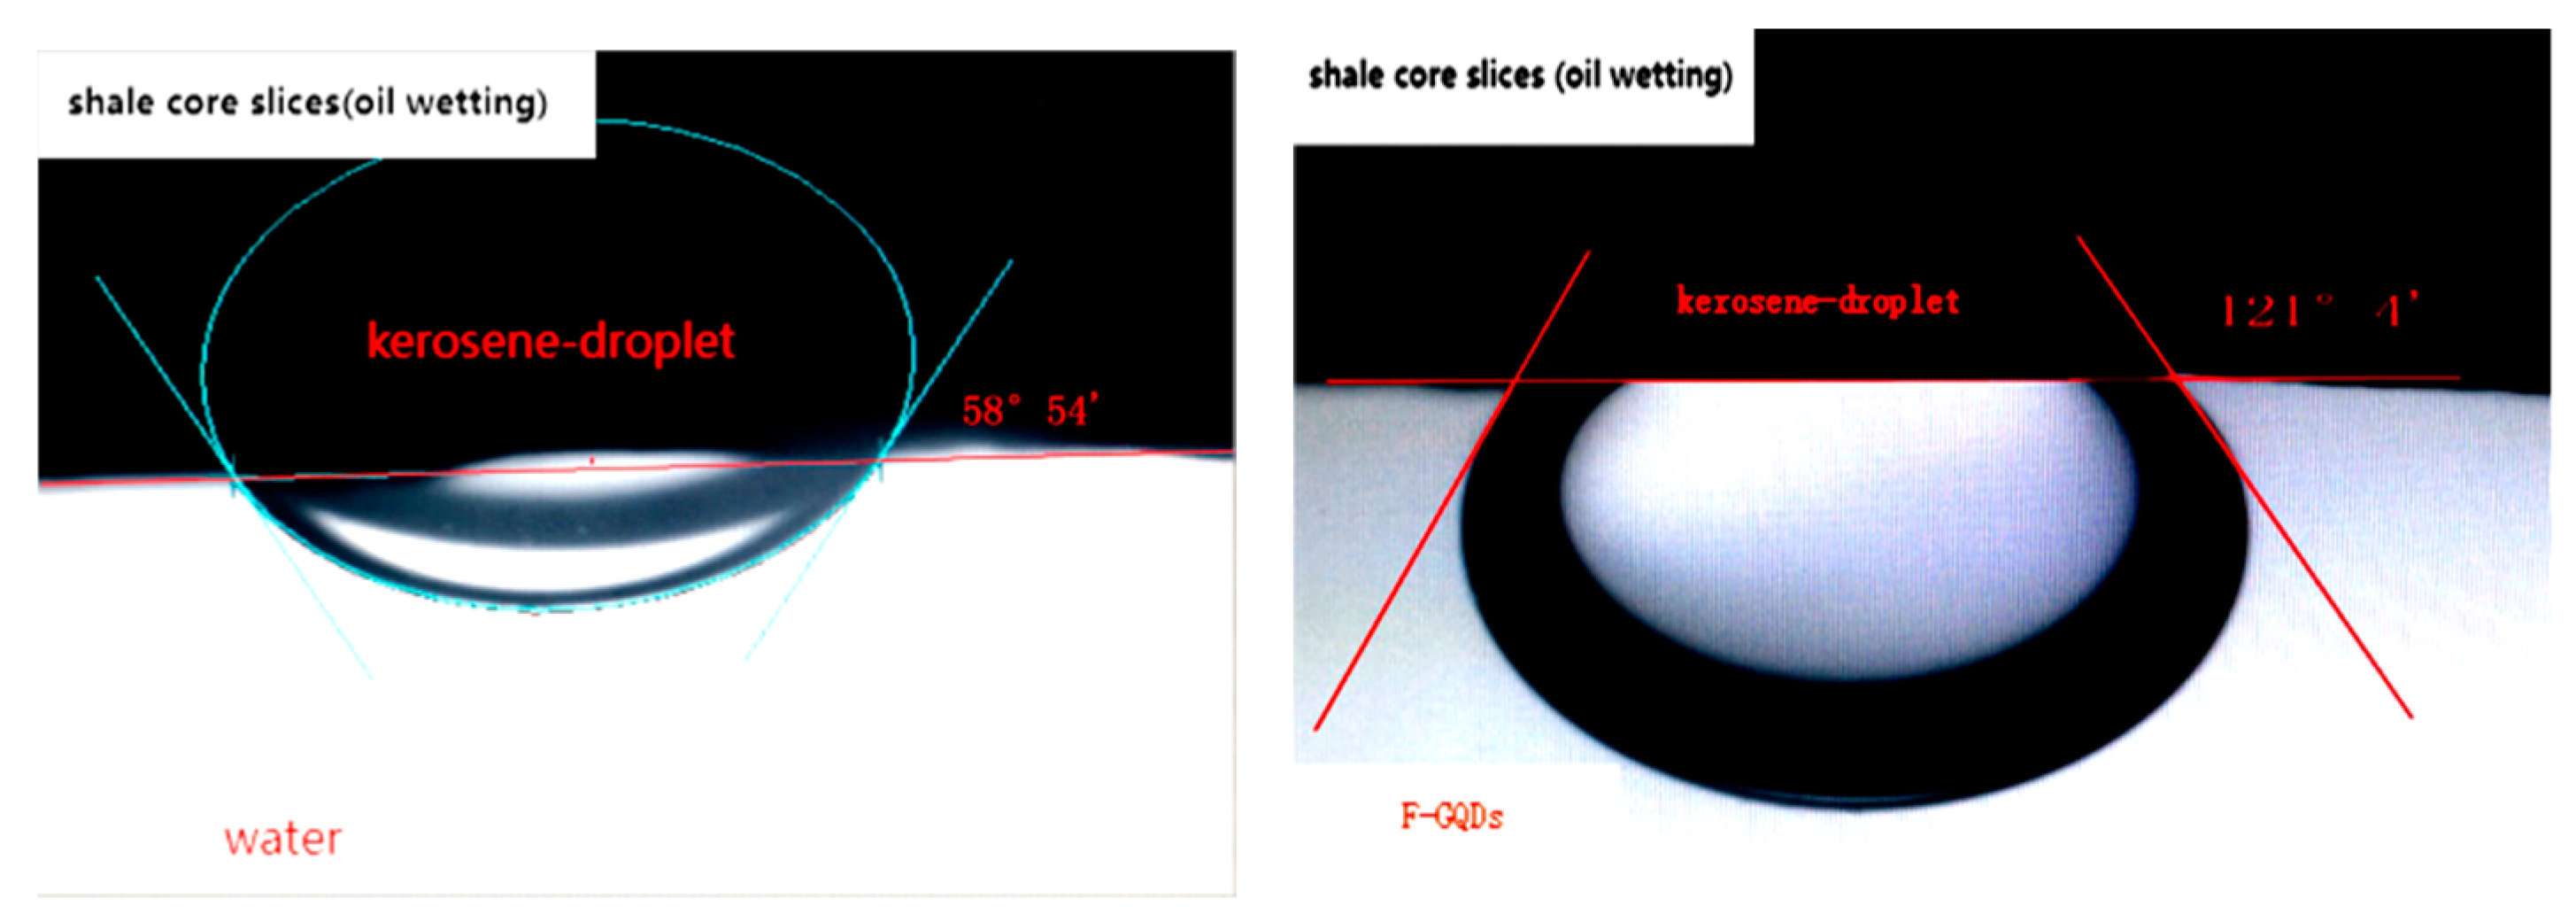
2.4. Wetting Reversal Characteristic Experiment
2.5. Surface Tension and Interfacial Tension Determination Experiments
2.6. Calculation of Adhesion Work Reduction Value
2.7. Oil Washing Experiment
2.8. Imbibition Experiment
3. Results and Discussion
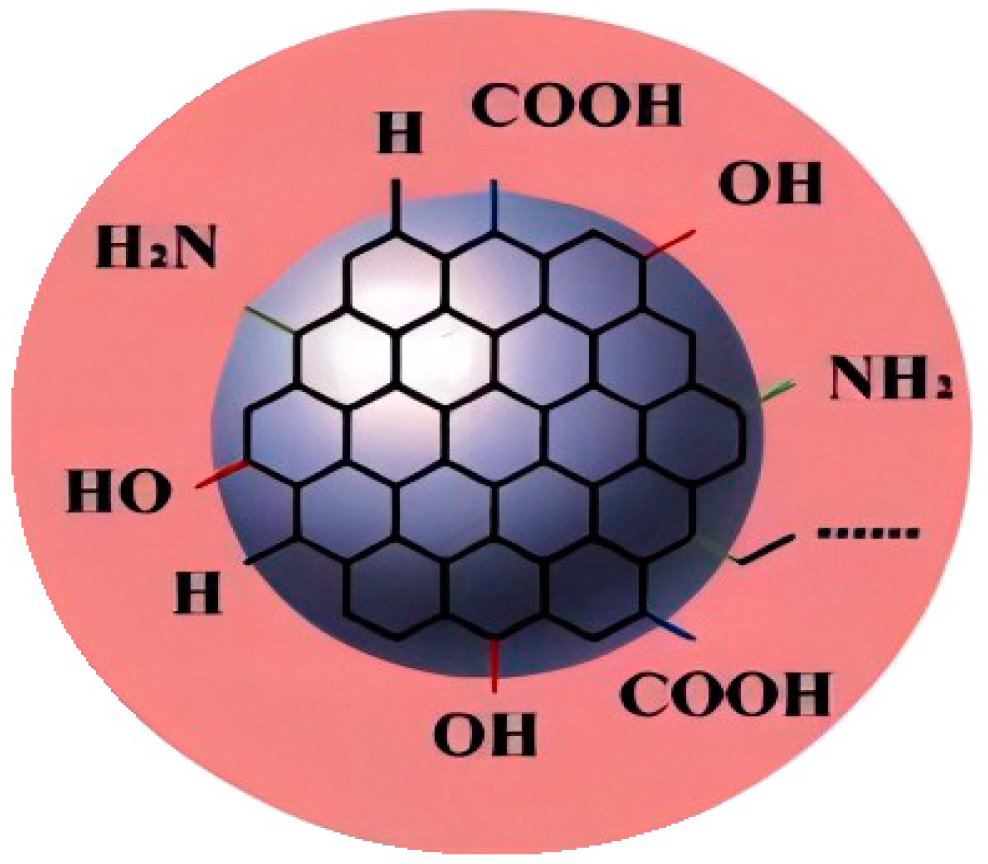
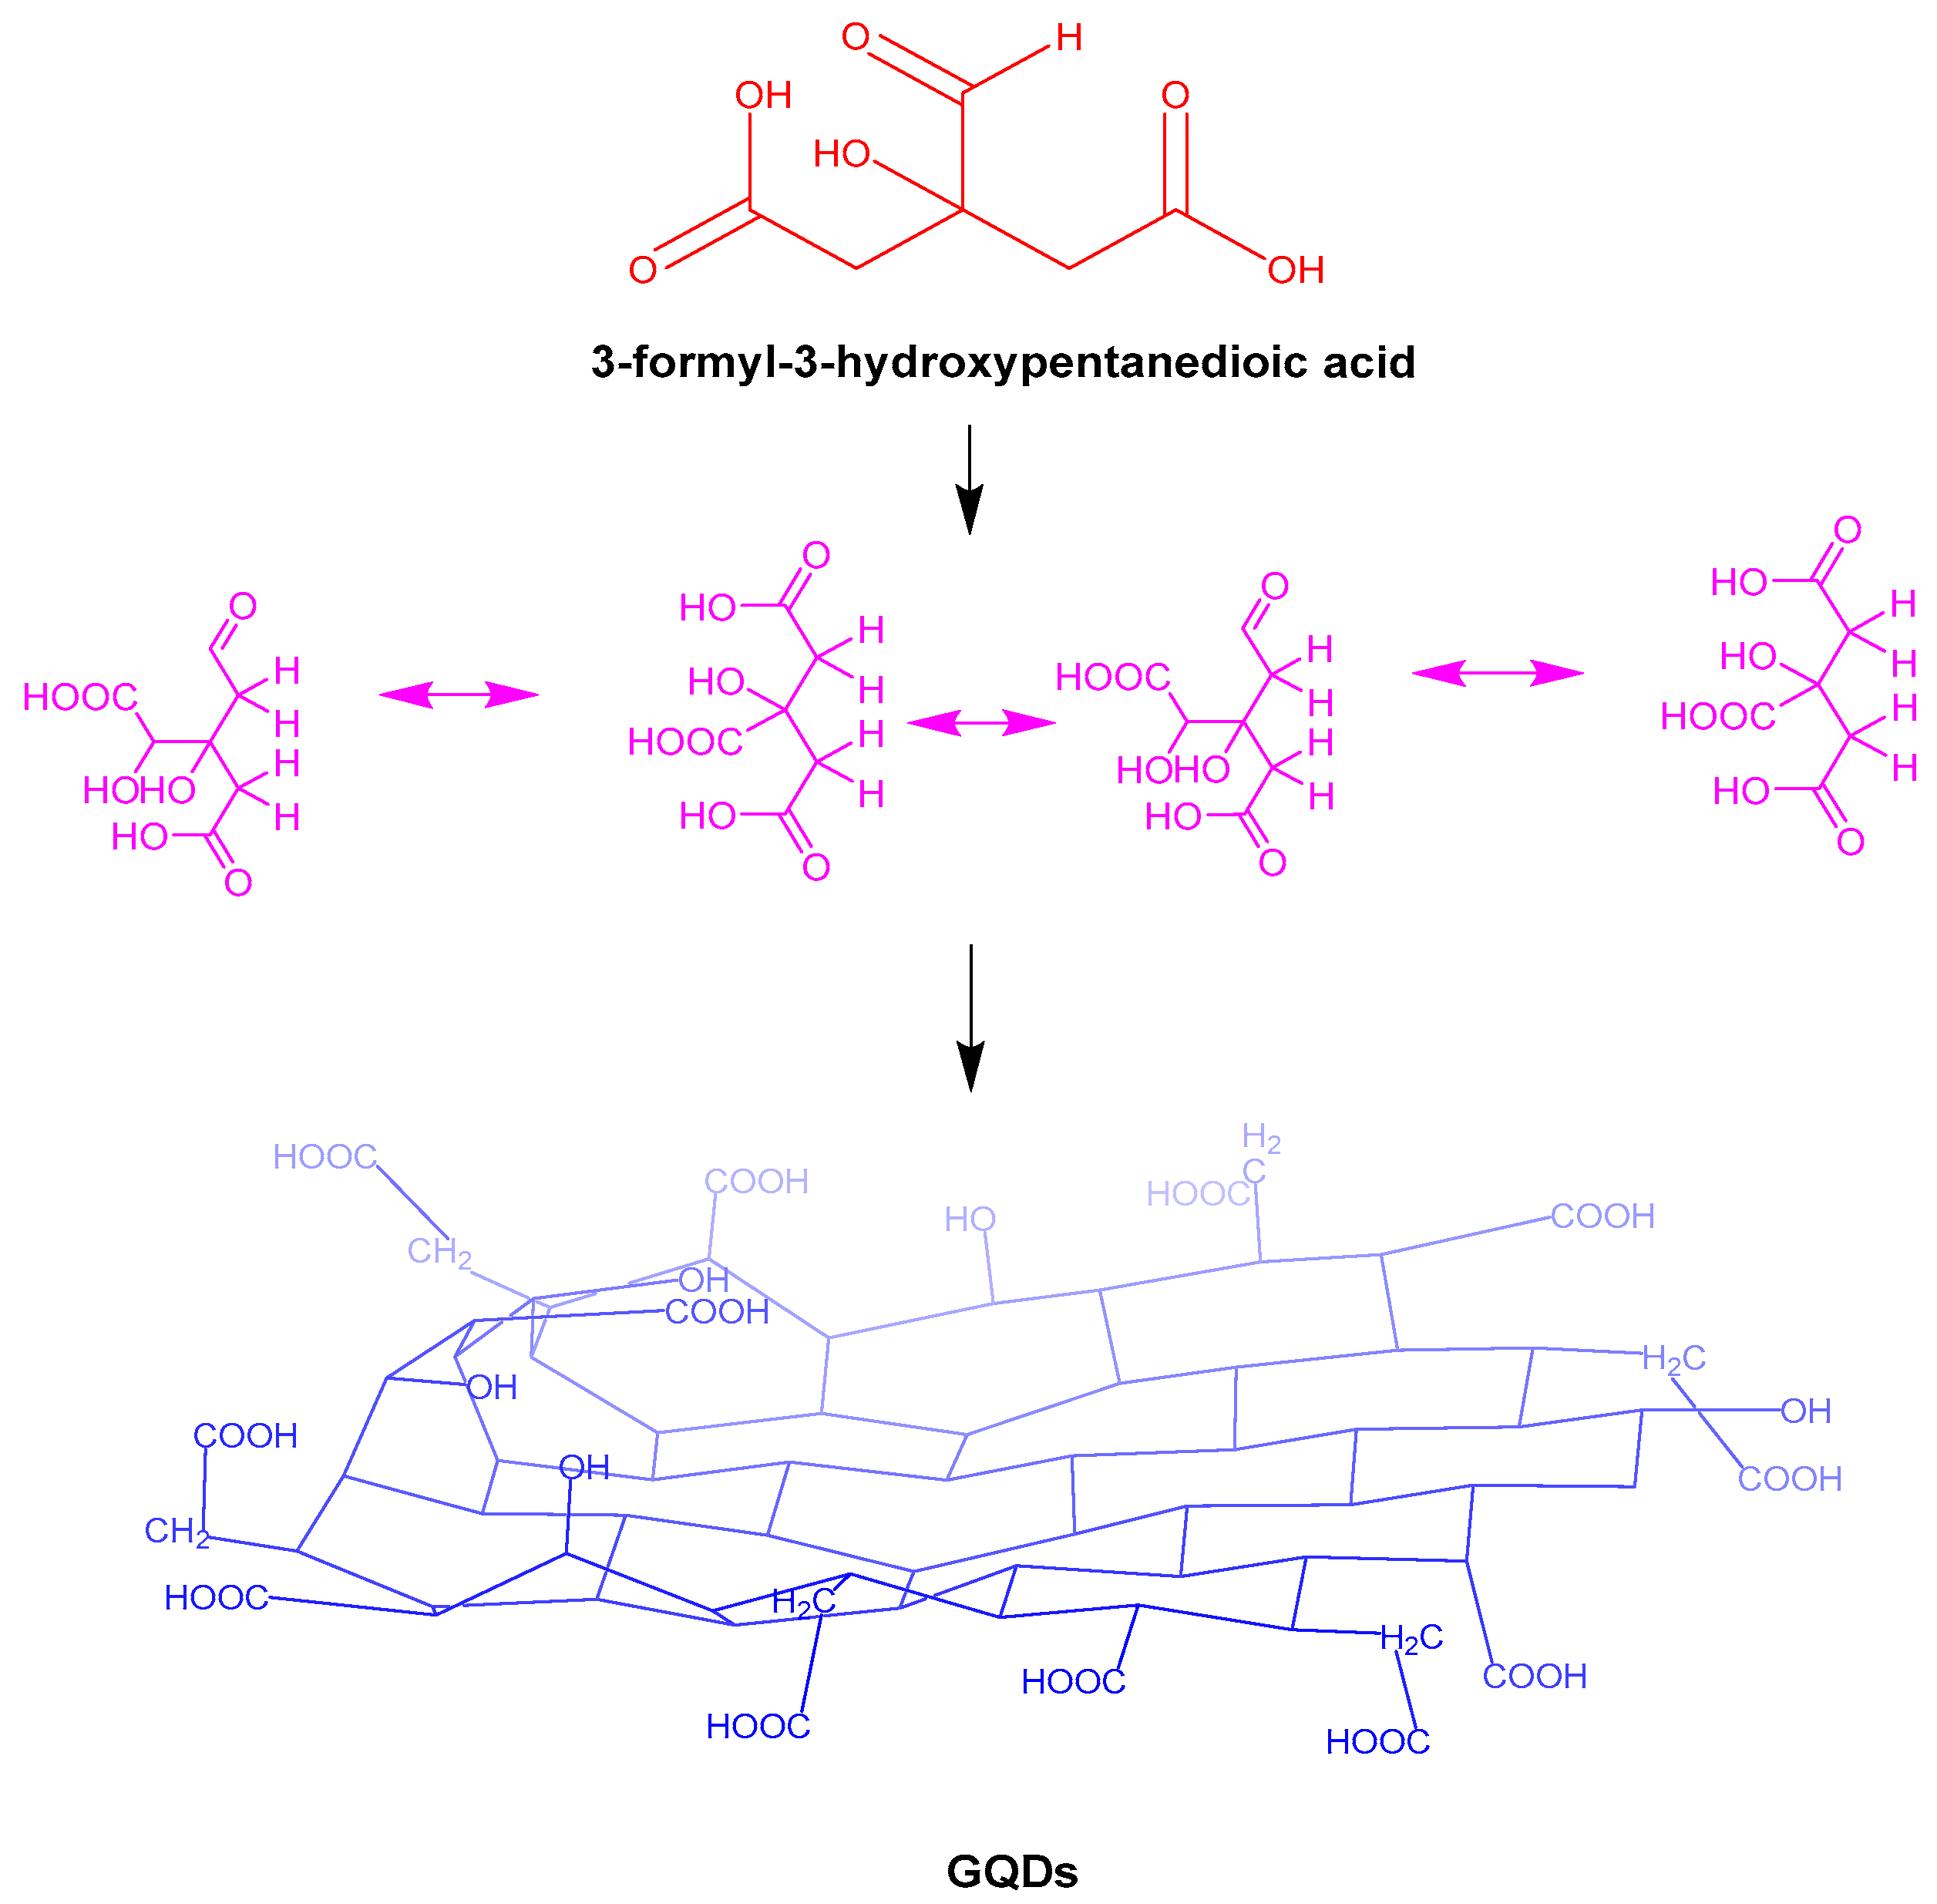
3.1. Characterization of Graphene Quantum Dots
3.1.1. Morphology and Particle Size of Graphene Quantum Dots
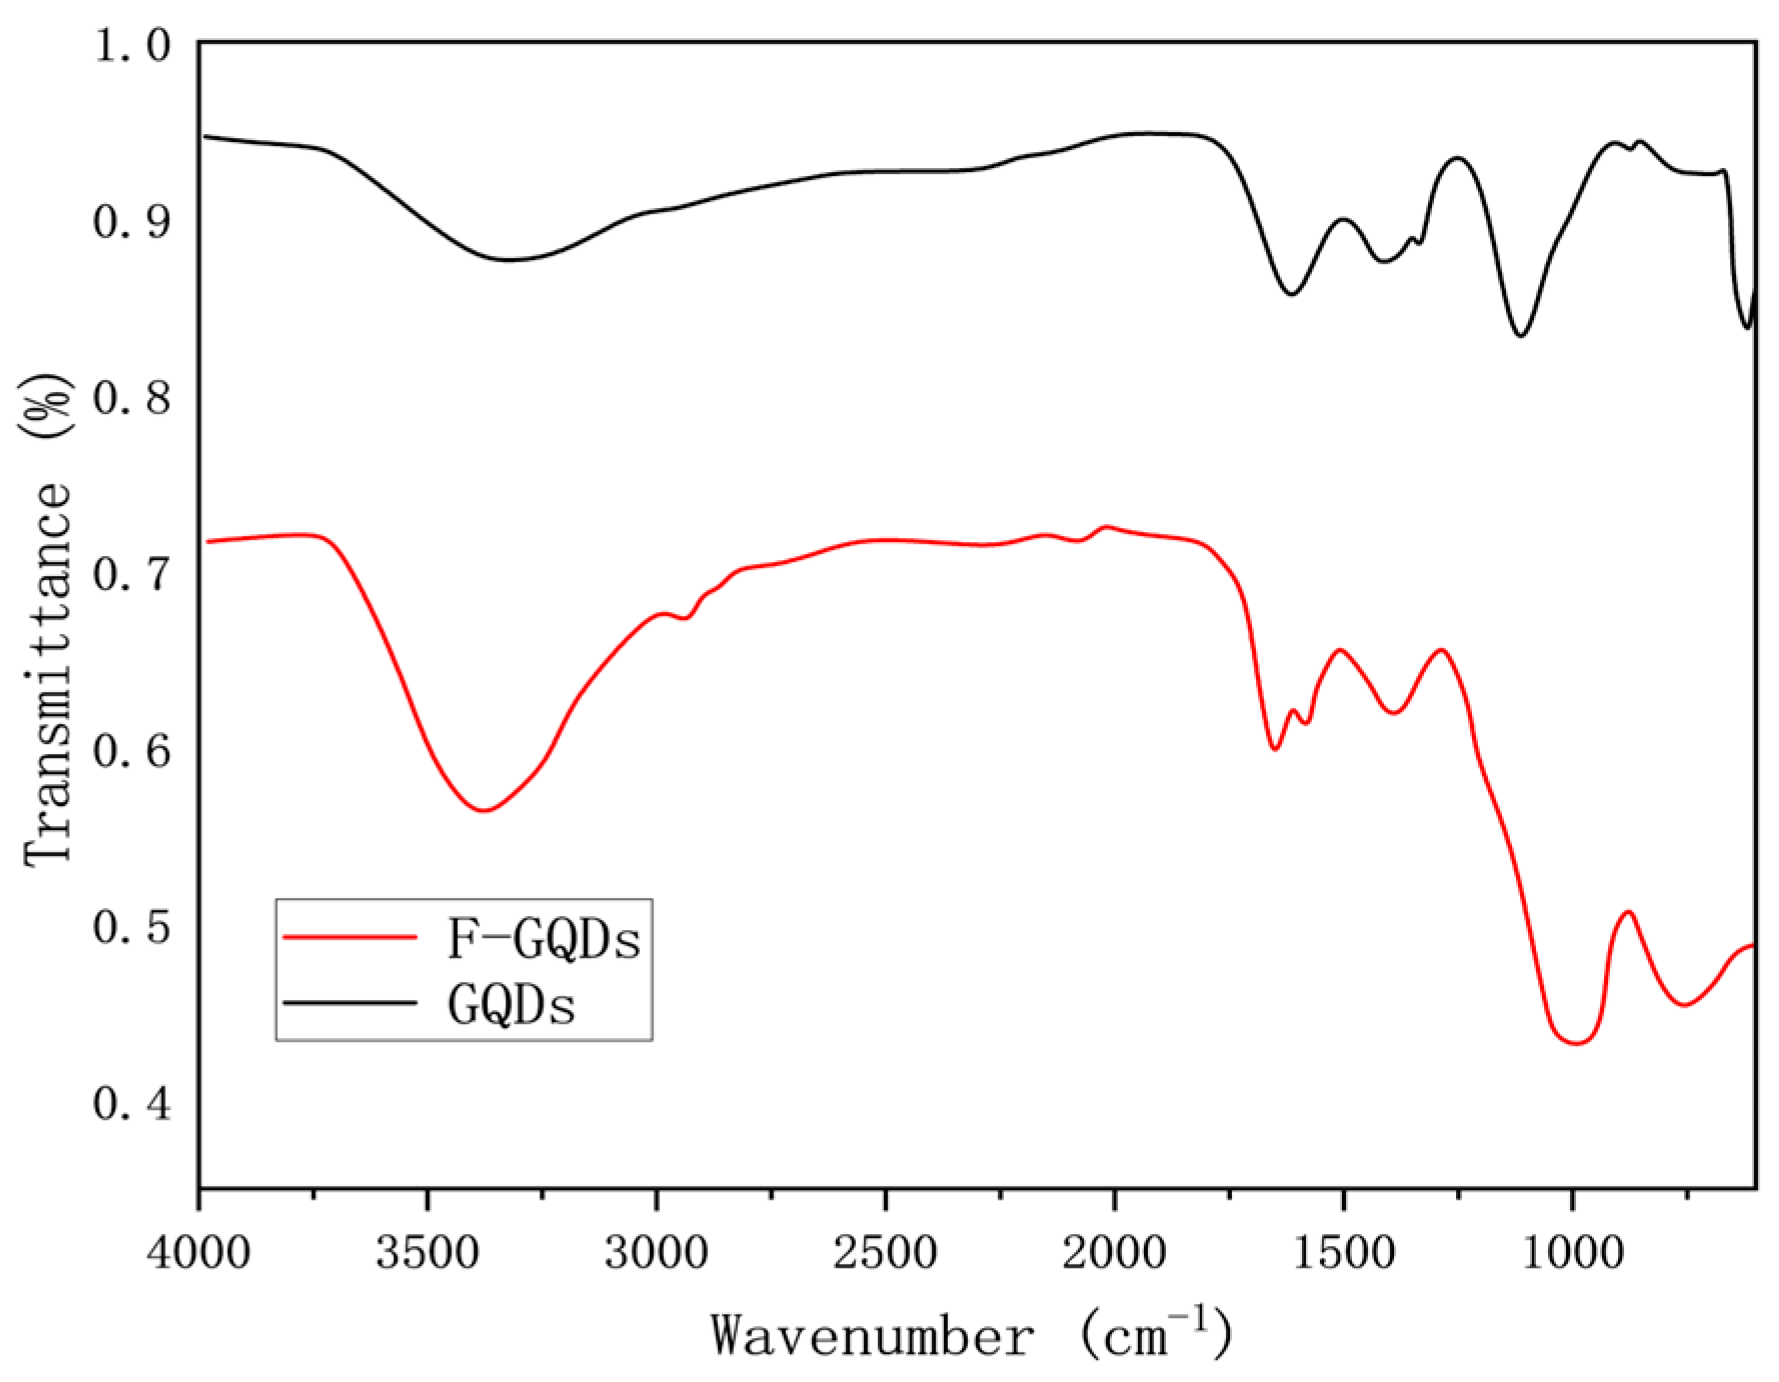
3.1.2. Infrared Spectra of Graphene Quantum Dots
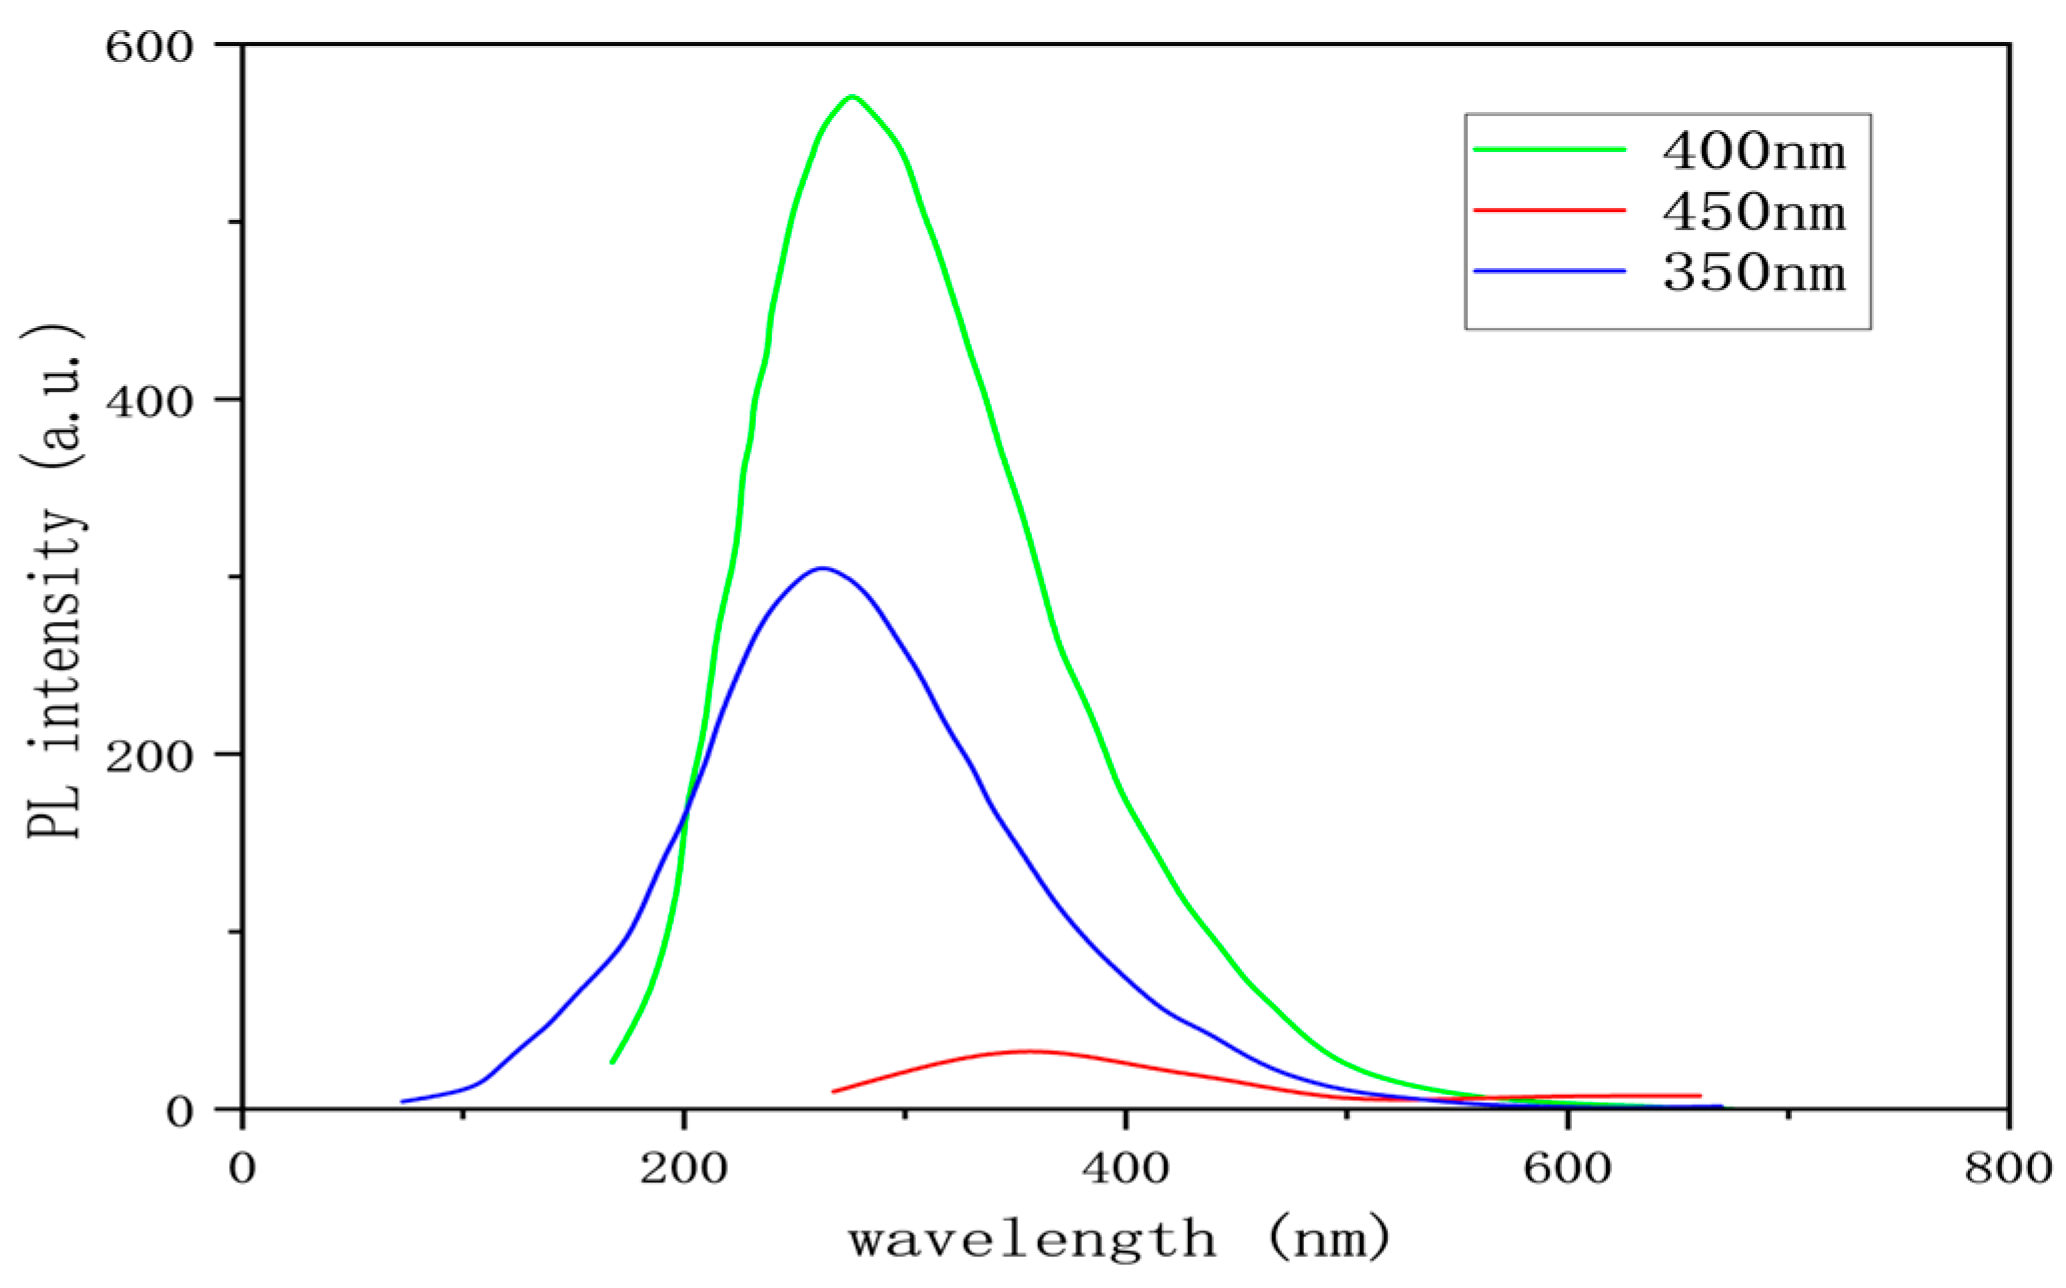
3.1.3. Determination of Fluorescence Intensity of Graphene Quantum Dots
3.2. Wetting Reversal Characteristic
3.3. Surface Tension and Interfacial Tension Determination
3.4. Calculation of Adhesion Reduction Value
3.5. Oil Washing Experiment Analysis
3.6. Imbibition Experiment Analysis
4. Conclusions
Author Contributions
Funding
Data Availability Statement
Conflicts of Interest
References
- Zhang, Y.; Wang, L.; Liu, Y.; Zhang, J.; Zhou, D.; Ge, H. Progress and Challenges in the Integration of Fracturing and Extraction of Shale Oil Reservoirs. Pet. Drill. Technol. 2024, 52, 84–95. [Google Scholar]
- Wu, X.; Liu, Z.X.; Wang, J.; Zheng, M.; Chen, X.; Qi, X. Petroleum resource potential, distribution and key exploration fields in China. Earth Sci. Front. 2022, 6, 146–155. [Google Scholar]
- He, W.; Meng, Q.; Feng, Z.; Zhang, J.; Wang, R. Theoretical understanding and exploration and development practice of in-situ reservoir formation of Gulong shale oil in Songliao Basin. J. Pet. 2022, 1, 1–14. [Google Scholar]
- Sun, L.; Liu, H.; He, W.; Li, G.; Zhang, S.; Zhu, R.; Jin, X.; Meng, S.; Jiang, H. Exploration of Major Scientific Issues and Research Paths in Daqing Gulong Shale Oil. Pet. Explor. Dev. 2021, 48, 453–463. [Google Scholar] [CrossRef]
- Al-Anssari, S.; Barifcani, A.; Keshavarz, A.; Iglauer, S. Impact of nanoparticles on the CO2-brine interfacial tension at high pressure and temperature. J. Colloid Interface Sci. 2018, 532, 136–142. [Google Scholar] [CrossRef] [PubMed]
- Hu, Z.; Zhao, J.; Gao, H.; Nourafkan, E.; Wen, D. Transport and Deposition of Carbon Nanoparticles in Saturated Porous Media. Energies 2017, 10, 1151. [Google Scholar] [CrossRef]
- Lai, N.; Zhu, Q.; Qiao, D.; Chen, K.; Tang, L.; Wang, D.; He, W.; Chen, Y.; Yu, T. CO2 Capture with Absorbents of Tertiary Amine Functionalized Nano–SiO2. Front. Chem. 2020, 8, 146. [Google Scholar] [CrossRef]
- Shaikh, A.; Caili, D.; Yonpeng, S.; Foutou, V.; Bakhsh, A.; Ali, I.; Ansari, U.; Guang, Z. A Novel CO2 Responsive Viscoelastic Surfactant based Clear Fracturing Fluid for High-Temperature Unconventional Reservoir. In Proceedings of the 5th International Conference on Environmental Engineering and Sustainable Development (CEESD 2020), Xishuangbanna, China, 3–6 December 2021; p. 012020. [Google Scholar]
- Wu, Y.; Liu, Q.; Liu, D.; Cao, X.P.; Yuan, B.; Zhao, M. CO2 responsive expansion hydrogels with programmable swelling for in-depth CO2 conformance control in porous media. Fuel 2023, 332, 126047. [Google Scholar] [CrossRef]
- Shi, F.; Wu, J.; Zhao, Y.; Zhao, B.; Kong, X. Controllable Assembly and Application of Janus Smart Nanosheets for Oil Displacement. Front. Chem. 2020, 8, 154. [Google Scholar] [CrossRef]
- Dordanihaghighi, S.; Allahbakhsh, A.; Kuur, C.; Arjmand, M. Synthesis, Applications, and Prospects of Graphene Quantum Dots: A Comprehensive Review. Small 2021, 18, 2102683. [Google Scholar]
- Konstantatos, G.; Badioli, M.; Gaudreau, L.; Osmond, J.; Bernechea, M.; de Arquer, F.P.G.; Gatti, F.; Koppens, F.H.L. Hybrid graphene-quantum dot phototransistors with ultrahigh gain. Nat. Nanotechnol. 2012, 7, 363–368. [Google Scholar] [CrossRef] [PubMed]
- Tetsuka, H.; Asahi, R.; Nagoya, A.; Okamoto, K.; Tajima, I.; Ohta, R.; Okamoto, A. Optically Tunable Amino-Functionalized Graphene Quantum Dots. Adv. Mater. 2012, 24, 5333–5338. [Google Scholar] [CrossRef] [PubMed]
- Yeh, T.-F.; Teng, C.-Y.; Chen, S.-J.; Teng, H. Nitrogen-Doped Graphene Oxide Quantum Dots as Photocatalysts for Overall Water Splitting under Visible Light Illumination. Adv. Mater. 2014, 26, 3297–3303. [Google Scholar] [CrossRef] [PubMed]
- Dinda, D.; Park, H.; Lee, H.-J.; Oh, S.; Park, S.Y. Graphene Quantum Dot with Covalently Linked Rhodamine Dye: A High Efficiency Photocatalyst for Hydrogen Evolution. Carbon 2020, 167, 760–769. [Google Scholar] [CrossRef]
- Yang, J.; Miao, H.; Jing, J.; Zhu, Y.; Choi, W. Photocatalytic activity enhancement of PDI supermolecular via π-π action and energy level adjusting with graphene quantum dots. Appl. Catal. B 2021, 281, 119547. [Google Scholar] [CrossRef]
- Chung, S.; Revia, R.A.; Zhang, M. Graphene Quantum Dots and Their Applications in Bioimaging, Biosensing, and Therapy. Adv. Mater. 2021, 33, 1904362. [Google Scholar] [CrossRef]
- Gao, W.; Gou, W.; Zhou, X.; Ho, J.C.; Ma, Y.; Qu, Y. Amine Modulated/Engineered Interfaces of NiMo Electrocatalysts for Improved Hydrogen Evolution Reaction in Alkaline Solutions. ACS Appl. Mater. Interfaces 2018, 10, 1728–1733. [Google Scholar] [CrossRef]
- Zhou, F.; Tien, H.N.; Dong, Q.; Xu, W.L.; Li, H.; Li, S.; Yu, M. Ultrathin, Ethylenediamine-Functionalized Graphene Oxide Membranes on Hollow Fibers for CO2 Capture. J. Membr. Sci. 2019, 573, 184–191. [Google Scholar] [CrossRef]
- Fujishima, A.; Honda, K. Electrochemical Photolysis of Water at a Semiconductor Electrode. Nature 1972, 238, 37–38. [Google Scholar] [CrossRef]
- Chen, X.; Shen, S.; Guo, L.; Mao, S.S. Semiconductor-Based Photocatalytic Hydrogen Generation. Chem. Rev. 2010, 110, 6503–6570. [Google Scholar] [CrossRef]
- Yang, Y.; Niu, S.; Han, D.; Liu, T.; Wang, G.; Li, Y. Progress in Developing Metal Oxide Nanomaterials for Photoelectrochemical Water Splitting. Adv. Energy Mater. 2017, 7, 1700555. [Google Scholar] [CrossRef]
- Guo, Y.; Park, T.; Yi, J.W.; Henzie, J.; Kim, J.; Wang, Z.; Jiang, B.; Bando, Y.; Sugahara, Y.; Tang, J.; et al. Nanoarchitectonics for Transition-Metal-Sulfide-Based Electrocatalysts for Water Splitting. Adv. Mater. 2019, 31, 1807134. [Google Scholar] [CrossRef] [PubMed]
- Zhao, H.; Li, X.; Cai, M.; Liu, C.; You, Y.; Wang, R.; Channa, A.I.; Lin, F.; Huo, D.; Xu, G.; et al. Role of Copper Doping in Heavy Metal-Free InP/ZnSe Core/Shell Quantum Dots for Highly Efficient and Stable Photoelectrochemical Cell. Adv. Energy Mater. 2021, 11, 2101230. [Google Scholar] [CrossRef]
- Rahman, M.Z.; Davey, K.; Qiao, S.-Z. Carbon, Nitrogen and Phosphorus Containing Metal-Free Photocatalysts for Hydrogen Production: Progress and Challenges. J. Mater. Chem. A 2018, 6, 1305–1322. [Google Scholar] [CrossRef]
- Endo, T.; Nagai, D.; Monma, T.; Yamaguchi, H.; Ochiai, B. A novel construction of a reversible eixation—Release system of carbon dioxide by amidines and their polymers. Macromolecules 2004, 37, 2007–2009. [Google Scholar] [CrossRef]
- Lu, H.; Jiang, J.; Huang, Z.; Dai, S. A water-Soluble CO2-triggered viscosity-responsive copolymer of N,N-dimethylaminoethyl methacrylate and acrylamide. Appl. Polym. Sci. 2014, 131, 2. [Google Scholar] [CrossRef]
- Bates, E.D.; Mayton, R.; Ntai, I.; Davis, J.H., Jr. CO2 capture by a task-specific ionic liquid. J. Am. Chem. Soc. 2002, 124, 926–927. [Google Scholar] [CrossRef]
- Pan, D.Y.; Zhang, J.C.; Li, Z.; Wu, M. Hydrothermal route for cutting graphene sheets into blue-luminescent graphene quantum dots. Adv. Mater. 2010, 22, 734–738. [Google Scholar] [CrossRef]


| Serial Number | Functional Group | Advantage | Boundedness |
|---|---|---|---|
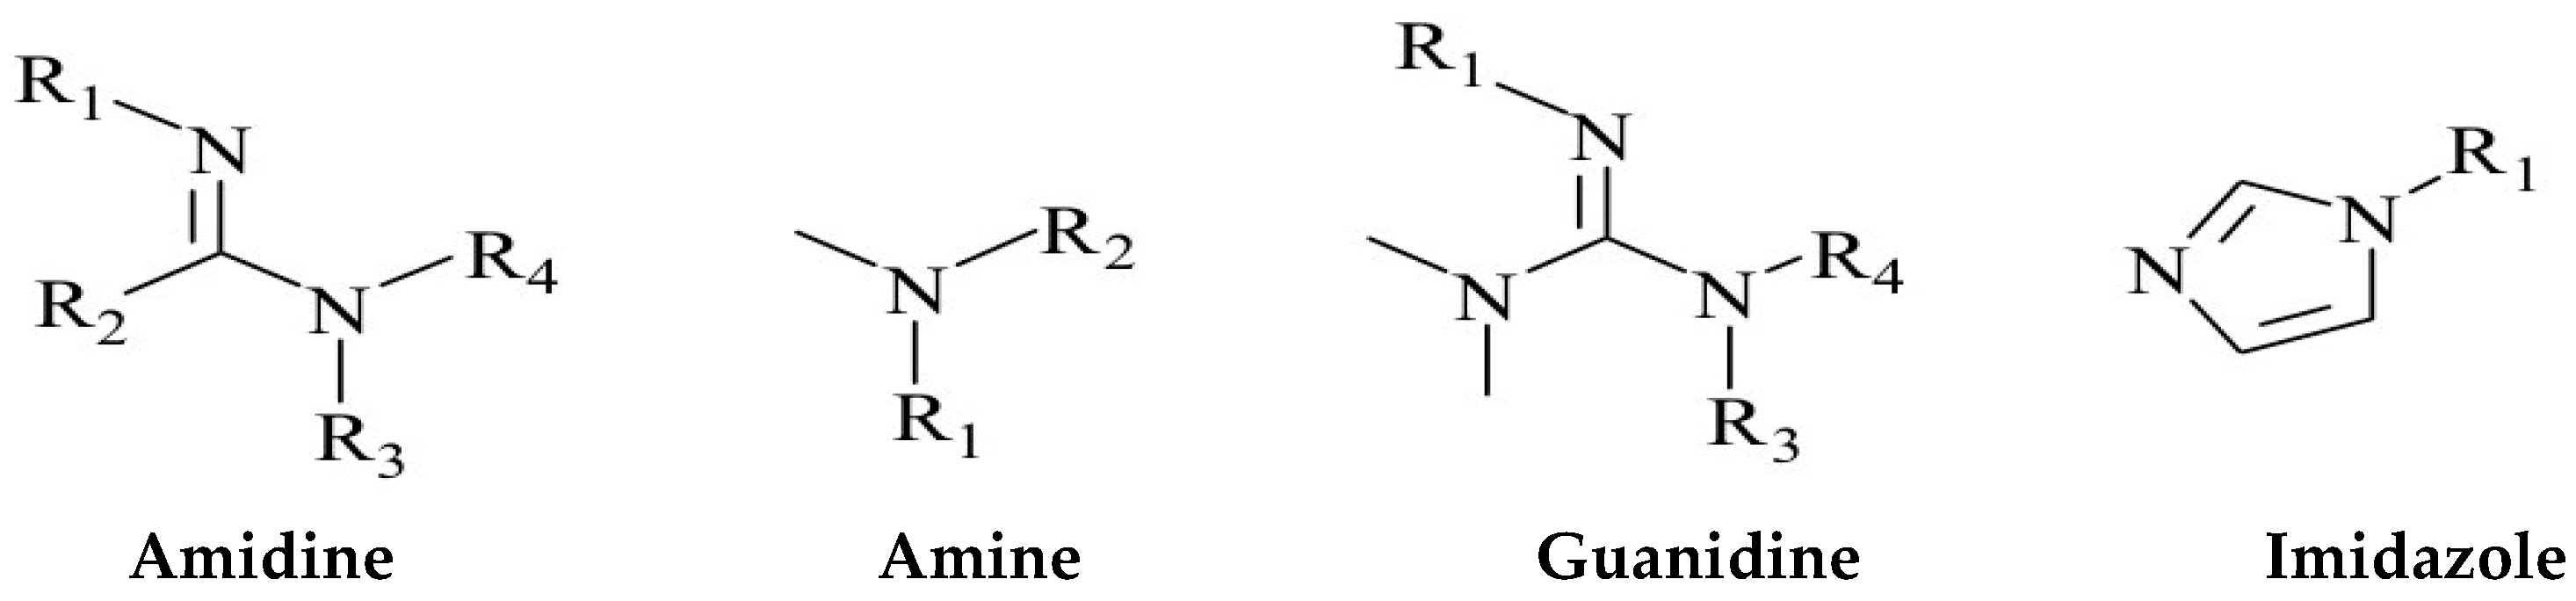
| 1 | Amidine | Strong sensitivity to carbon dioxide; A very small amount of carbon dioxide can quickly respond | The amidine group is alkaline and undergoes a certain degree of hydrolysis in water. But cyclic amidines have the characteristics of simple preparation process and good stability |
| 2 | Amine | Weakly alkaline functional group; Boramine absorbs carbon dioxide at room temperature 2.8 times more than the commonly used reagent ethanolamine, but its response speed is slow; Tertiary amines are more sensitive to carbon dioxide response than primary amines, with better repeatability and efficiency | The protonation reaction between the tertiary amino group and carbon dioxide is slow and requires continuous introduction of carbon dioxide for stimulation and regulation. |
| 3 | Guanidine | Guanidine and amidine groups have similar properties | Organic strong base |
| 4 | Imidazole | The alkalinity is weak, and the protonated imidazole functional group is more stable compared to the amidine and tertiary amine groups | High viscosity, with certain biological toxicity |
| No. | Name of Instrument | Model Specifications | Supplier | Purpose |
|---|---|---|---|---|
| 1 | Fourier transform infrared spectrometer | Nicolet iS50 | Thermo Fisher Scientific Molecular Spectroscopy Company, Shanghai, China | Structural characterization of synthetic products |
| 2 | Laser particle size analyzer | Mastersizer (from 3.8 nm to 100 µm) | Pudi Biotechnology Co., Ltd., Shanghai, China | Evaluation of particle size distribution in dispersed systems |
| 3 | Fluorescence spectrophotometer | LS55 | Perkin-Elmer Co., Ltd., Shanghai, China | fluorescence spectroscopy measurement |
| 4 | UV Visible Absorption Spectrometer | U-3010 | Hitachi High-Tech Co., Ltd., Shanghai, China | UV Visible Absorption Spectroscopy Determination |
| 5 | Transmission Electron Microscope | H-7650B TEM (80 kV) | Hitachi High-Tech Co., Ltd., Shanghai, China | GQDs morphology observation |
| 6 | Contact angle tester | OCA200 | Otellino Instrument Co., Ltd., Beijing, China | Wetting reversal characteristic test |
| Number | T/°C | Detection Index/ mN/m | Results/ mN/m |
|---|---|---|---|
| 1 | 45 | surface tension | 25.58 |
| interfacial tension | 0.92 × 10⁻² | ||
| 2 | 90 | surface tension | 20.35 |
| interfacial tension | 0.11 × 10⁻² |
| No. | IFT (10−2 mN/m) | Contact Angle θ (°) | cosθ | W0 (10−2 mN/m) | W1 (10−2 mN/m) | Wettability |
|---|---|---|---|---|---|---|
| 1 | 0.92 | 121.51 | −0.52 | 0.92 | 1.40 | lipophilicity |
| 2 | 0.92 | 58.53 | 0.52 | 0.92 | 0.44 | hydrophily |
| 3 | 0.11 | 121.51 | −0.52 | 0.11 | 0.17 | lipophilicity |
| 4 | 0.11 | 58.53 | 0.52 | 0.11 | 0.05 | hydrophily |
| Number | Sample | Oil Sand Contains Oil Volume (mL) | Wash Oil Volume (Ml) | Oil Washing Rate (%) | Average Value (%) | Standard Deviation |
|---|---|---|---|---|---|---|
| 1 | F-GQDs | 1.25 | 1.10 | 88.00 | 86.00 | 2.828 |
| 2 | F-GQDs | 1.25 | 1.05 | 84.00 | ||
| 3 | CO2 + F-GQDs | 1.25 | 1.20 | 96.00 | 97.00 | 1.414 |
| 4 | CO2 + F-GQDs | 1.25 | 1.22 | 98.00 | ||
| 5 | CO2 + Water | 1.25 | 0.05 | 4.00 | 4.80 | 1.131 |
| 6 | CO2 + Water | 1.25 | 0.07 | 5.60 |
Disclaimer/Publisher’s Note: The statements, opinions and data contained in all publications are solely those of the individual author(s) and contributor(s) and not of MDPI and/or the editor(s). MDPI and/or the editor(s) disclaim responsibility for any injury to people or property resulting from any ideas, methods, instructions or products referred to in the content. |
© 2024 by the authors. Licensee MDPI, Basel, Switzerland. This article is an open access article distributed under the terms and conditions of the Creative Commons Attribution (CC BY) license (https://creativecommons.org/licenses/by/4.0/).
Share and Cite
Yin, P.; Shi, F.; Luo, M.; Wu, J.; Yu, Y.; Zhang, C.; Zhao, B. Construction of Carbon Dioxide Responsive Graphene Point Imbibition and Drainage Fluid and Simulation of Imbibition Experiments. Processes 2024, 12, 2052. https://doi.org/10.3390/pr12092052
Yin P, Shi F, Luo M, Wu J, Yu Y, Zhang C, Zhao B. Construction of Carbon Dioxide Responsive Graphene Point Imbibition and Drainage Fluid and Simulation of Imbibition Experiments. Processes. 2024; 12(9):2052. https://doi.org/10.3390/pr12092052
Chicago/Turabian StyleYin, Peng, Fang Shi, Mingjian Luo, Jingchun Wu, Yanan Yu, Chunlong Zhang, and Bo Zhao. 2024. "Construction of Carbon Dioxide Responsive Graphene Point Imbibition and Drainage Fluid and Simulation of Imbibition Experiments" Processes 12, no. 9: 2052. https://doi.org/10.3390/pr12092052
APA StyleYin, P., Shi, F., Luo, M., Wu, J., Yu, Y., Zhang, C., & Zhao, B. (2024). Construction of Carbon Dioxide Responsive Graphene Point Imbibition and Drainage Fluid and Simulation of Imbibition Experiments. Processes, 12(9), 2052. https://doi.org/10.3390/pr12092052