Article

Application of Seagull Optimization Algorithm-BP Neural Network in Oil-Water Two-Phase Flow Pattern Forecasting

Key Laboratory of Exploration Technologies for Oil and Gas Resources, Yangtze University, Ministry of Education, Wuhan 430100, China
*
Author to whom correspondence should be addressed.
Processes 2024, 12(9), 2012; https://doi.org/10.3390/pr12092012
Submission received: 18 August 2024 / Revised: 7 September 2024 / Accepted: 16 September 2024 / Published: 19 September 2024
(This article belongs to the Section Automation Control Systems)

Abstract

:
With the ongoing increase in global energy demand, the significance of innovations in oil exploration and development technologies is rising, especially in relation to the development of unconventional reservoirs. The application of horizontal wells is becoming increasingly important in this particular situation. However, accurately monitoring and analyzing fluids in horizontal wells remains challenging due to the complex and fluctuating flow patterns of oil-water two-phase flow within the wellbore. Several elements, including well slope angle, flow rate, and water content, are involved. This study aimed to explore and develop an effective method for forecasting flow patterns, improving the precision of the dynamic monitoring of oil-water two-phase flow in horizontal wells. By analyzing the flow patterns in different experimental conditions, a predictive model using the SOA-BP neural network was developed, providing a scientific basis for dynamic monitoring in actual production scenarios. Initially, the simulated experiment for oil-water two-phase flow was carried out at room temperature and pressure utilizing a multiphase flow simulator. An optically transparent wellbore, with a diameter comparable to that of a real downhole well, was utilized, and No. 10 industrial white oil and tap water were employed as the experimental fluids. The experiment considered multiple contributing factors, including different well deviation, total flow, and water cut. The flow characteristics of oil and water were observed via visual monitoring and high-definition video, followed by detailed analysis. After collecting the experimental data, flow regimes for various scenarios were classified based on the established theory of oil-water two-phase flow in horizontal wells; then, detailed flow distribution diagrams were drawn. These data and diagrams presented offer a visual representation of the behavioral patterns exhibited by oil-water two-phase flow under varying situations and form the basis for subsequent model training and testing. Subsequently, based on the experimental data, this study combined the Seagull Optimization Algorithm (SOA) with a BP neural network to effectively learn and predict the experimental data. The SOA optimized the weights and biases of the BP neural network, improving the model’s convergence speed and prediction accuracy. Through rigorous training and testing, an oil-water two-phase flow pattern forecasting model was established, effectively predicting flow patterns under different well deviation, total flow, and water cut conditions. Finally, to validate the efficiency of the established model, a total of 15 data points were chosen from a sample well for validation. By comparing the flow patterns predicted by the model with actual logging data, the results indicate that the model’s accuracy in identifying flow pattern was 86.67%. This demonstrates that the flow pattern prediction model based on the SOA-BP neural network achieved a high level of accuracy under different complicated working conditions. This model effectively fulfills the requirements for dynamic monitoring in actual production. This indicates that the SOA-BP neural network-based flow pattern forecasting method is highly valuable due to its practical application value and provides an efficient technical approach for the development of unconventional reservoirs and the dynamic monitoring of horizontal wells in the future.

1. Introduction

Multiphase flow is the term used to describe a mixture of fluids that has two or more phases. This type of flow is commonly observed in the petroleum industry. The system can encompass gas-oil, gas-water, oil-water two-phase flow, or even more intricate oil-gas-water three-phase flow. The intricate nature of this flow condition renders the research and implementation of multiphase flow a crucial discipline in the petroleum industry. Since the 1980s, with the increasing complexity of offshore oil extraction tasks, non-straight well drilling techniques have become prevalent. Horizontal and directional wells provide substantial benefits compared to conventional straight well drilling methods. The most notable advantage is the capacity to effectively decrease the overall cost of oilfield development while substantially enhancing the recovery rate. The implementation of non-straight well technology increases the productivity of wells by providing greater access to the reservoir, resulting in a substantial improvement in the overall development efficiency of the field. Compared to traditional straight well drilling, these methods result in a significant alteration in fluids’ flow patterns within the wellbore due to the well slope [1,2]. The main factor causing this alteration is gravity, leading to significant differences in the distribution and movement of fluids in nonlinear wells compared to straight wells. The technical disparities not only impact the flow characteristics but also have a direct impact on the design of related equipment, the choice of instruments, and the implementation of extraction methods.
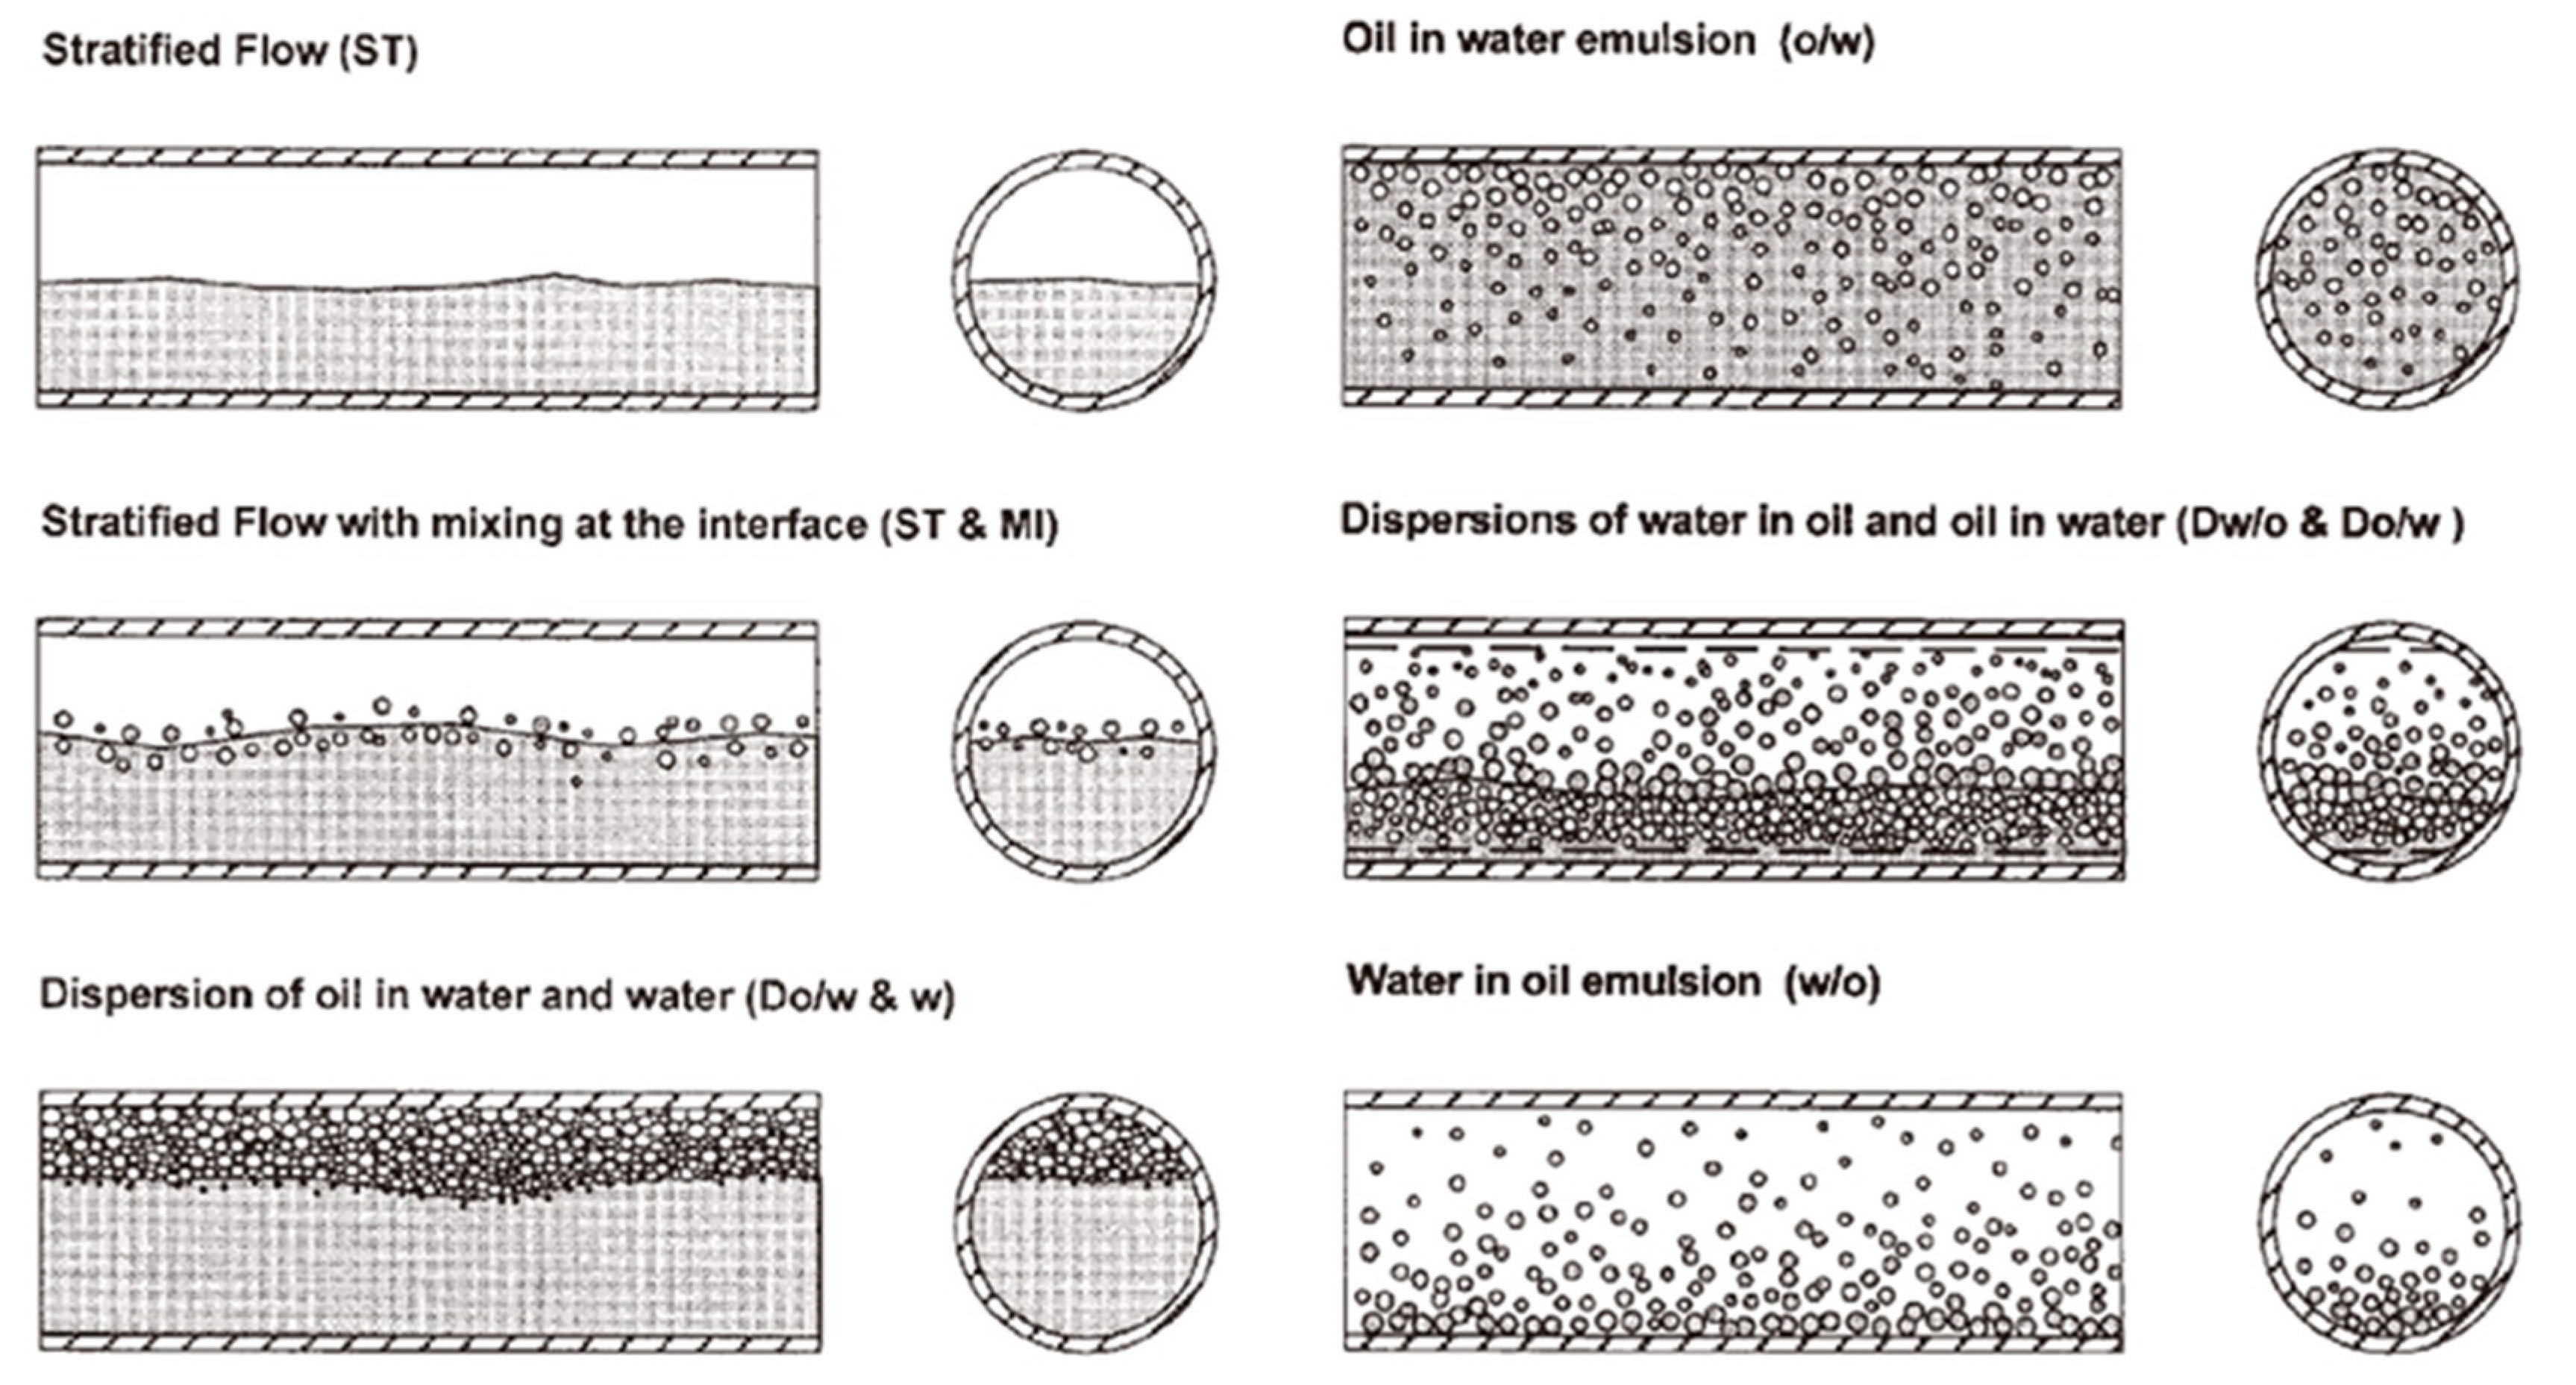
In recent years, with the development of the petroleum industry, significant progress has been made by scholars both domestically and internationally in the research of multiphase flow patterns. The topic is challenging because flow states are impacted by multiple elements, and the behavior of flow patterns changes under different conditions. Therefore, accurately predicting flow patterns is both theoretically significant and practically valuable. In order to tackle this difficulty, researchers have employed a range of methods, including experimental studies and modeling, to systematically investigate the properties of multiphase flow. In 1995, Trallero proposed a systematic classification method approach to characterize the flow patterns of oil-water two-phase flows in horizontal wells [
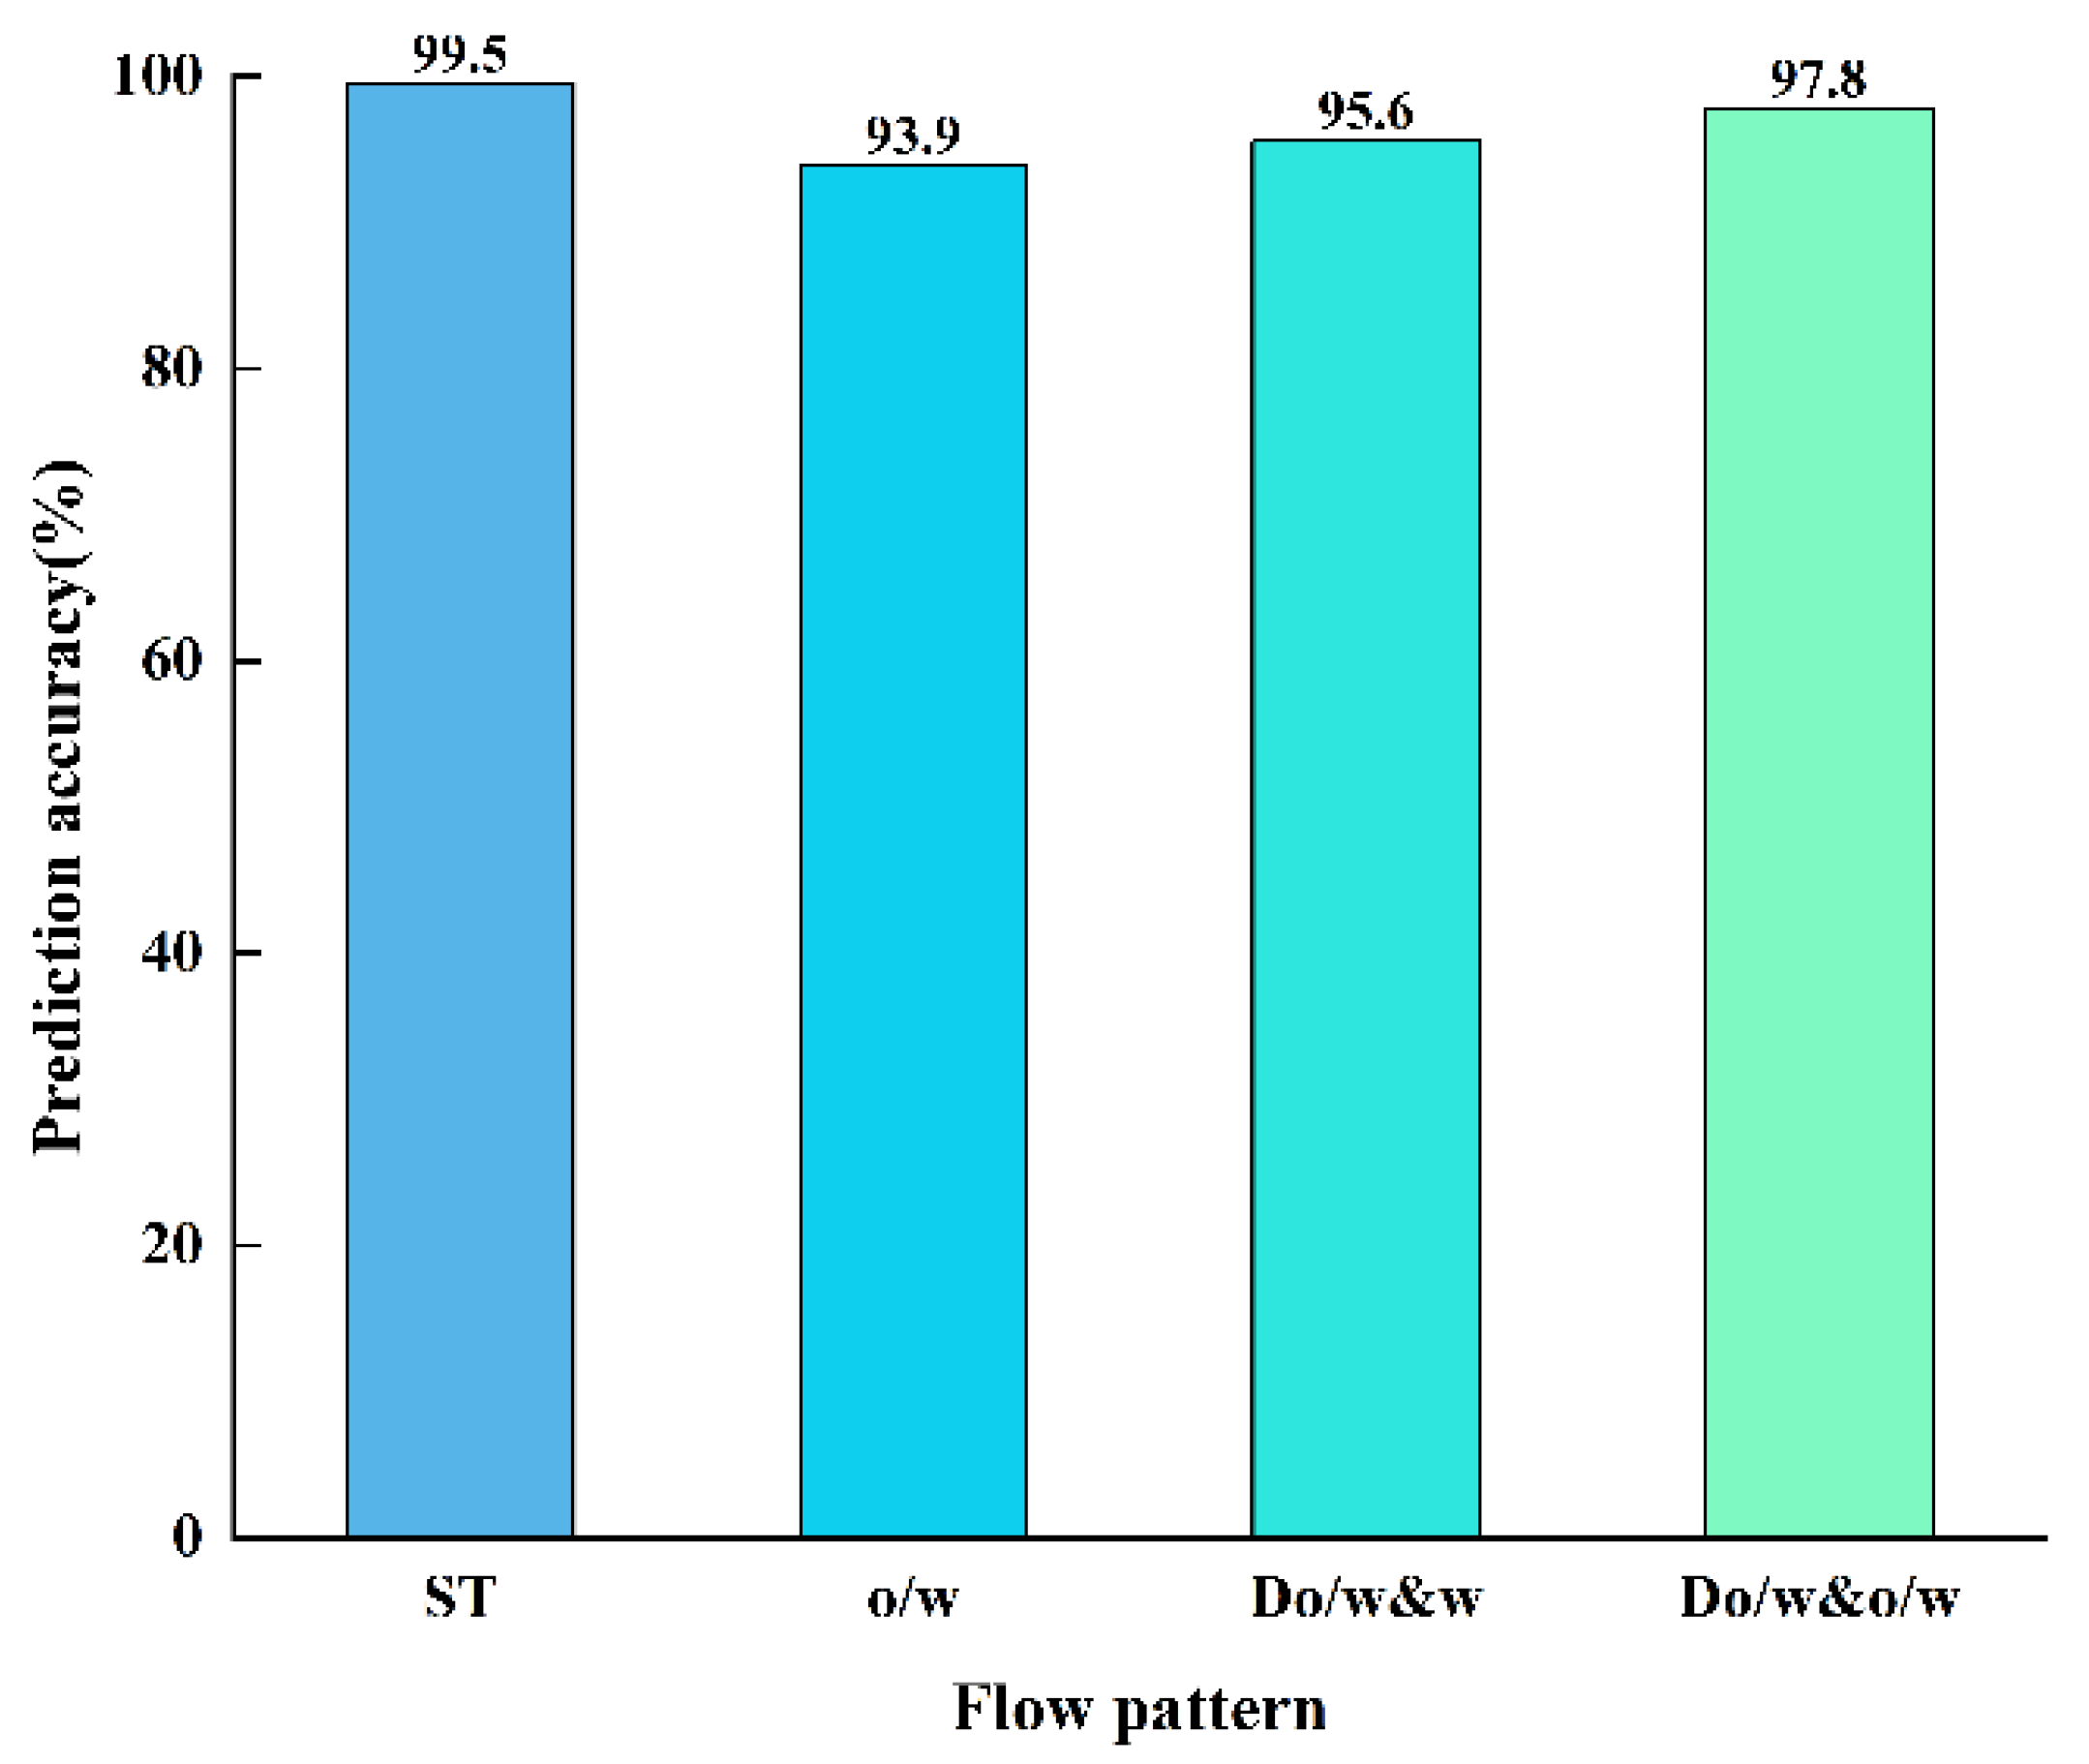
3]. He classified flow patterns into six unique types: stratified flow (ST), interfacially mixed stratified flow (ST&MI), the dispersed flow of oil and water in water (Do/w&w), oil in water emulsion flow (o/w), the dispersed flow of oil in water and water in oil (Do/w&o/w), and water in oil emulsion flow (w/o). This categorization offers a theoretical foundation for comprehending the complex behavior of oil-water flow in horizontal wellbores and has been extensively embraced in subsequent research and practical monitoring. Research has shown that the development of flow patterns is impacted by a multitude of elements. The main parameters that directly impact the flow condition of the oil-water mixture in a wellbore are the slope of the well, the rate at which the fluid flows, and the amount of water present. Secondary elements, such as fluid density, temperature, pressure, viscosity, and tubing wall roughness, can have significant influences on the formation and development of flow patterns. In 2007, Keskin conducted physical experiments to study the different patterns of multiphase flow. Using a simulated wellbore and advanced camera technology, he precisely documented the distribution of flow pattern at different total flows. This experimental study yielded valuable data for comprehending the behavior of oil-water two-phase flow in actual wellbores and established a strong basis for subsequent modeling [4]. In 2010, Reza Ettehadi Osgouei developed a gas-liquid multiphase flow regime model applicable to horizontal annular geometries using second-order discriminant analysis. The model examined the apparent velocities of the liquid and gas phases, formulated appropriate generalized expressions [5], and was compared to the classical Beggs and Brill and Beggs and Brill flow models [6,7]. The results indicated that the new model offers superior accuracy in predicting two-phase flow in horizontal annuli, hence offering a more precise tool for predicting oil and gas two-phase flow. In 2015, A.S. Izwan Ismail conducted experimental investigations to investigate variations in pressure drop and liquid content in oil-water two-phase flow at varied flow rates. He discovered that the occurrence of the oil-water slide phenomena is greatly influenced by the lowest flow rate, which is a crucial insight for comprehending the intricate flow dynamics of oil and water in horizontal wells [8].
The precision of forecasting flow patterns has been a crucial concern in the initial phases of multiphase flow investigations. Early research approaches faced challenges in effectively capturing and predicting the complicated flow patterns of multiphase flow regimes due to their increasing complexity. These investigations commonly depended on visual observation and measurement, which were not only labor-intensive and tedious but also prone to subjectivity, leading to the poor reliability of the prediction outcomes. Furthermore, the technological constraints in that period resulted in a lack of adequate theoretical support and experimental validation for the classification and identification of flow patterns. As a result, early research faced challenges in meeting practical application requirements. In 2015, a method was developed by G.H. Roshan et al. for identifying gas-liquid multiphase flow models and predicting porosity. This method relies on gamma-ray attenuation and artificial neural networks [9]. This approach utilizes three characteristics offered by two gamma-ray detectors to identify gas-liquid multiphase flow regimes using a multilayer perceptron network. It effectively improves the accuracy of flow pattern identification. It significantly enhances the precision of identifying flow patterns and provides a novel method for predicting multiphase flow in intricate conditions. In 2017, Hanafizad P. et al. performed an empirical investigation on fluid flow patterns in a simulated wellbore by employing a high-speed camera [10]. They conducted a thorough analysis of flow behavior in non-straight wells by examining the variations in flow patterns at different well inclination degrees and total oil flows. The implementation of high-speed camera technology has enhanced the intuitive and exact monitoring of flow patterns, thereby establishing a strong experimental basis for gaining a deeper comprehension of the intricate flow phenomena in wellbores. In 2019, Wen Qingsong et al. developed an image-processing-based method for identifying the characteristics of oil and water two-phase distributions in wellbores that slope upwards [11]. While this method did address the issue of flow pattern recognition to some extent, there is still room for improvement in terms of accuracy. This is because there is a loss of feature information during the process of picture processing. This study indicates that although image processing algorithms have the capacity to recognize flow patterns, their application still needs to be further optimized and enhanced. In 2021, Song et al. and Liu et al. combined laboratory tests with computational simulations to thoroughly examine the velocity, composition, and spatial regimes of oil-water two-phase flow. The researchers utilized Doppler sensors and conductivity sensors to enhance the classification of flow patterns, offering a novel instrument for the comprehensive examination of oil-water two-phase flow. These investigations not only enhance the comprehension of the behavior of oil-water two-phase flow, but also provide more accurate technical approaches for future research on multiphase flow [12,13]. To summarize, physical simulation and numerical simulation are two commonly used research methodologies in the investigation of oil-water two-phase flow behavior: (1) The physical simulation method accurately recreates the actual conditions within a flow loop by adjusting different experimental parameters to mimic the real behavior of oil-water multiphase flow in a wellbore. This method has the ability to accurately replicate flow phenomena, but its effectiveness is restricted because it requires a significant amount of work and has a limited number of data points. In addition, physical simulation incurs expensive costs and necessitates strict equipment and operating conditions. On the other hand, the numerical simulation method uses computational fluid dynamics software to simulate flow under various conditions on a computer. This approach is cost-effective and enables the production of substantial quantities of simulation data within a brief timeframe. Nevertheless, numerical simulations frequently diverge from actual flow conditions, especially in intricate multiphase flows, where the simulation outcomes may not precisely correspond to the genuine flow characteristics. These deviations need to be rectified and confirmed by thorough experimental data.
Due to the swift advancement of artificial intelligence (AI) technology, researchers have progressively utilized AI algorithms in the domain of multiphase flow pattern prediction to improve the precision and effectiveness of flow pattern identification. This development highlights the significant potential of AI algorithms in tackling intricate multiphase flow difficulties. In 2004, Osman utilized artificial neural networks (ANNs) to analyze the properties of gas-liquid multiphase flow in horizontal wells using a database, achieving successful predictions of flow patterns and liquid content rates. This study showcased the ability of artificial neural networks (ANNs) to accurately capture intricate flow properties. This achievement serves as a foundation for future endeavors in predicting flow patterns [14]. In 2013, Li et al. carried out a thorough examination of the characteristics of oil-water multiphase flow in nearly horizontal wells and accurately predicted the transitions between different flow regimes under different viscosity conditions. This research is crucial for accurately predicting pressure drops in the wellbore, providing valuable insights for well design and optimization [15]. In 2016, Al-Naser applied artificial neural networks to identify fluid flow pattern. They used three dimensionless input variables (liquid Reynolds number, gas Reynolds number, and pressure drop multiplier) to establish an effective flow pattern classification model [16]. The model demonstrated an impressive accuracy of 97% in identifying flow patterns, highlighting the robust capabilities of AI algorithms in predicting multiphase flow. In 2019, Gene Mask explored the characteristics of gas-water flow. The study utilized a dimensionless approach derived from a dataset and evaluated the effectiveness of several deep learning algorithms in forecasting gas-liquid flow patterns. According to the study, deep learning algorithms offer notable benefits in dealing with intricate multiphase flow issues, resulting in more precise forecasts of flow patterns [17]. In 2020, Mayadah Alhashem utilized the Stanford multiphase flow dataset to pinpoint critical parameters of gas-liquid multiphase flow in horizontal wells and evaluated the effectiveness of five machine learning algorithms in forecasting flow patterns. The work showcased the superior performance of machine learning algorithms in predicting flow patterns, providing a novel technical tool for the real-time monitoring of multiphase flow [18]. In 2022, Wu et al. obtained 60 sets of sample data through multiphase flow physical experiments and developed the Mamdani fuzzy model to forecast oil-water multiphase flow patterns. This work emphasized the benefits of using fuzzy logic to handle uncertainty and complexity, providing a new method for predicting multiphase flow patterns [19]. In 2023, Shi et al. combined Genetic Algorithm (GA) and BP neural networks to learn and predict experimental data on multiphase flow. The efforts resulted in the development of prediction models for four distinct experimental flow patterns [20]. Although the studies stated above are important in both theory and practice, they frequently depend on experimental data driven by databases. This type of datum may not be able to visually examine the dynamic changes in fluid flow patterns or may lack confirmation from sample well data.
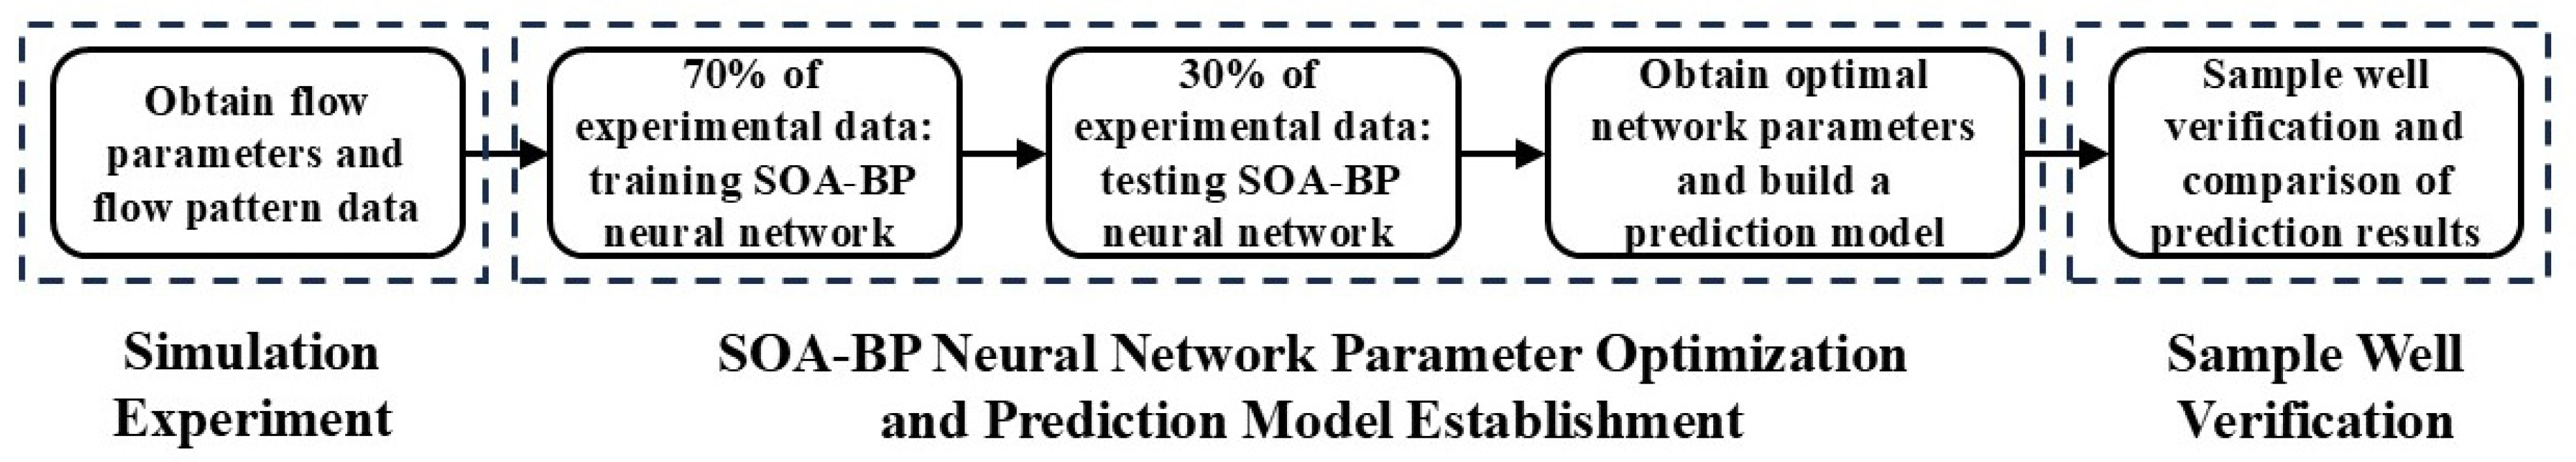
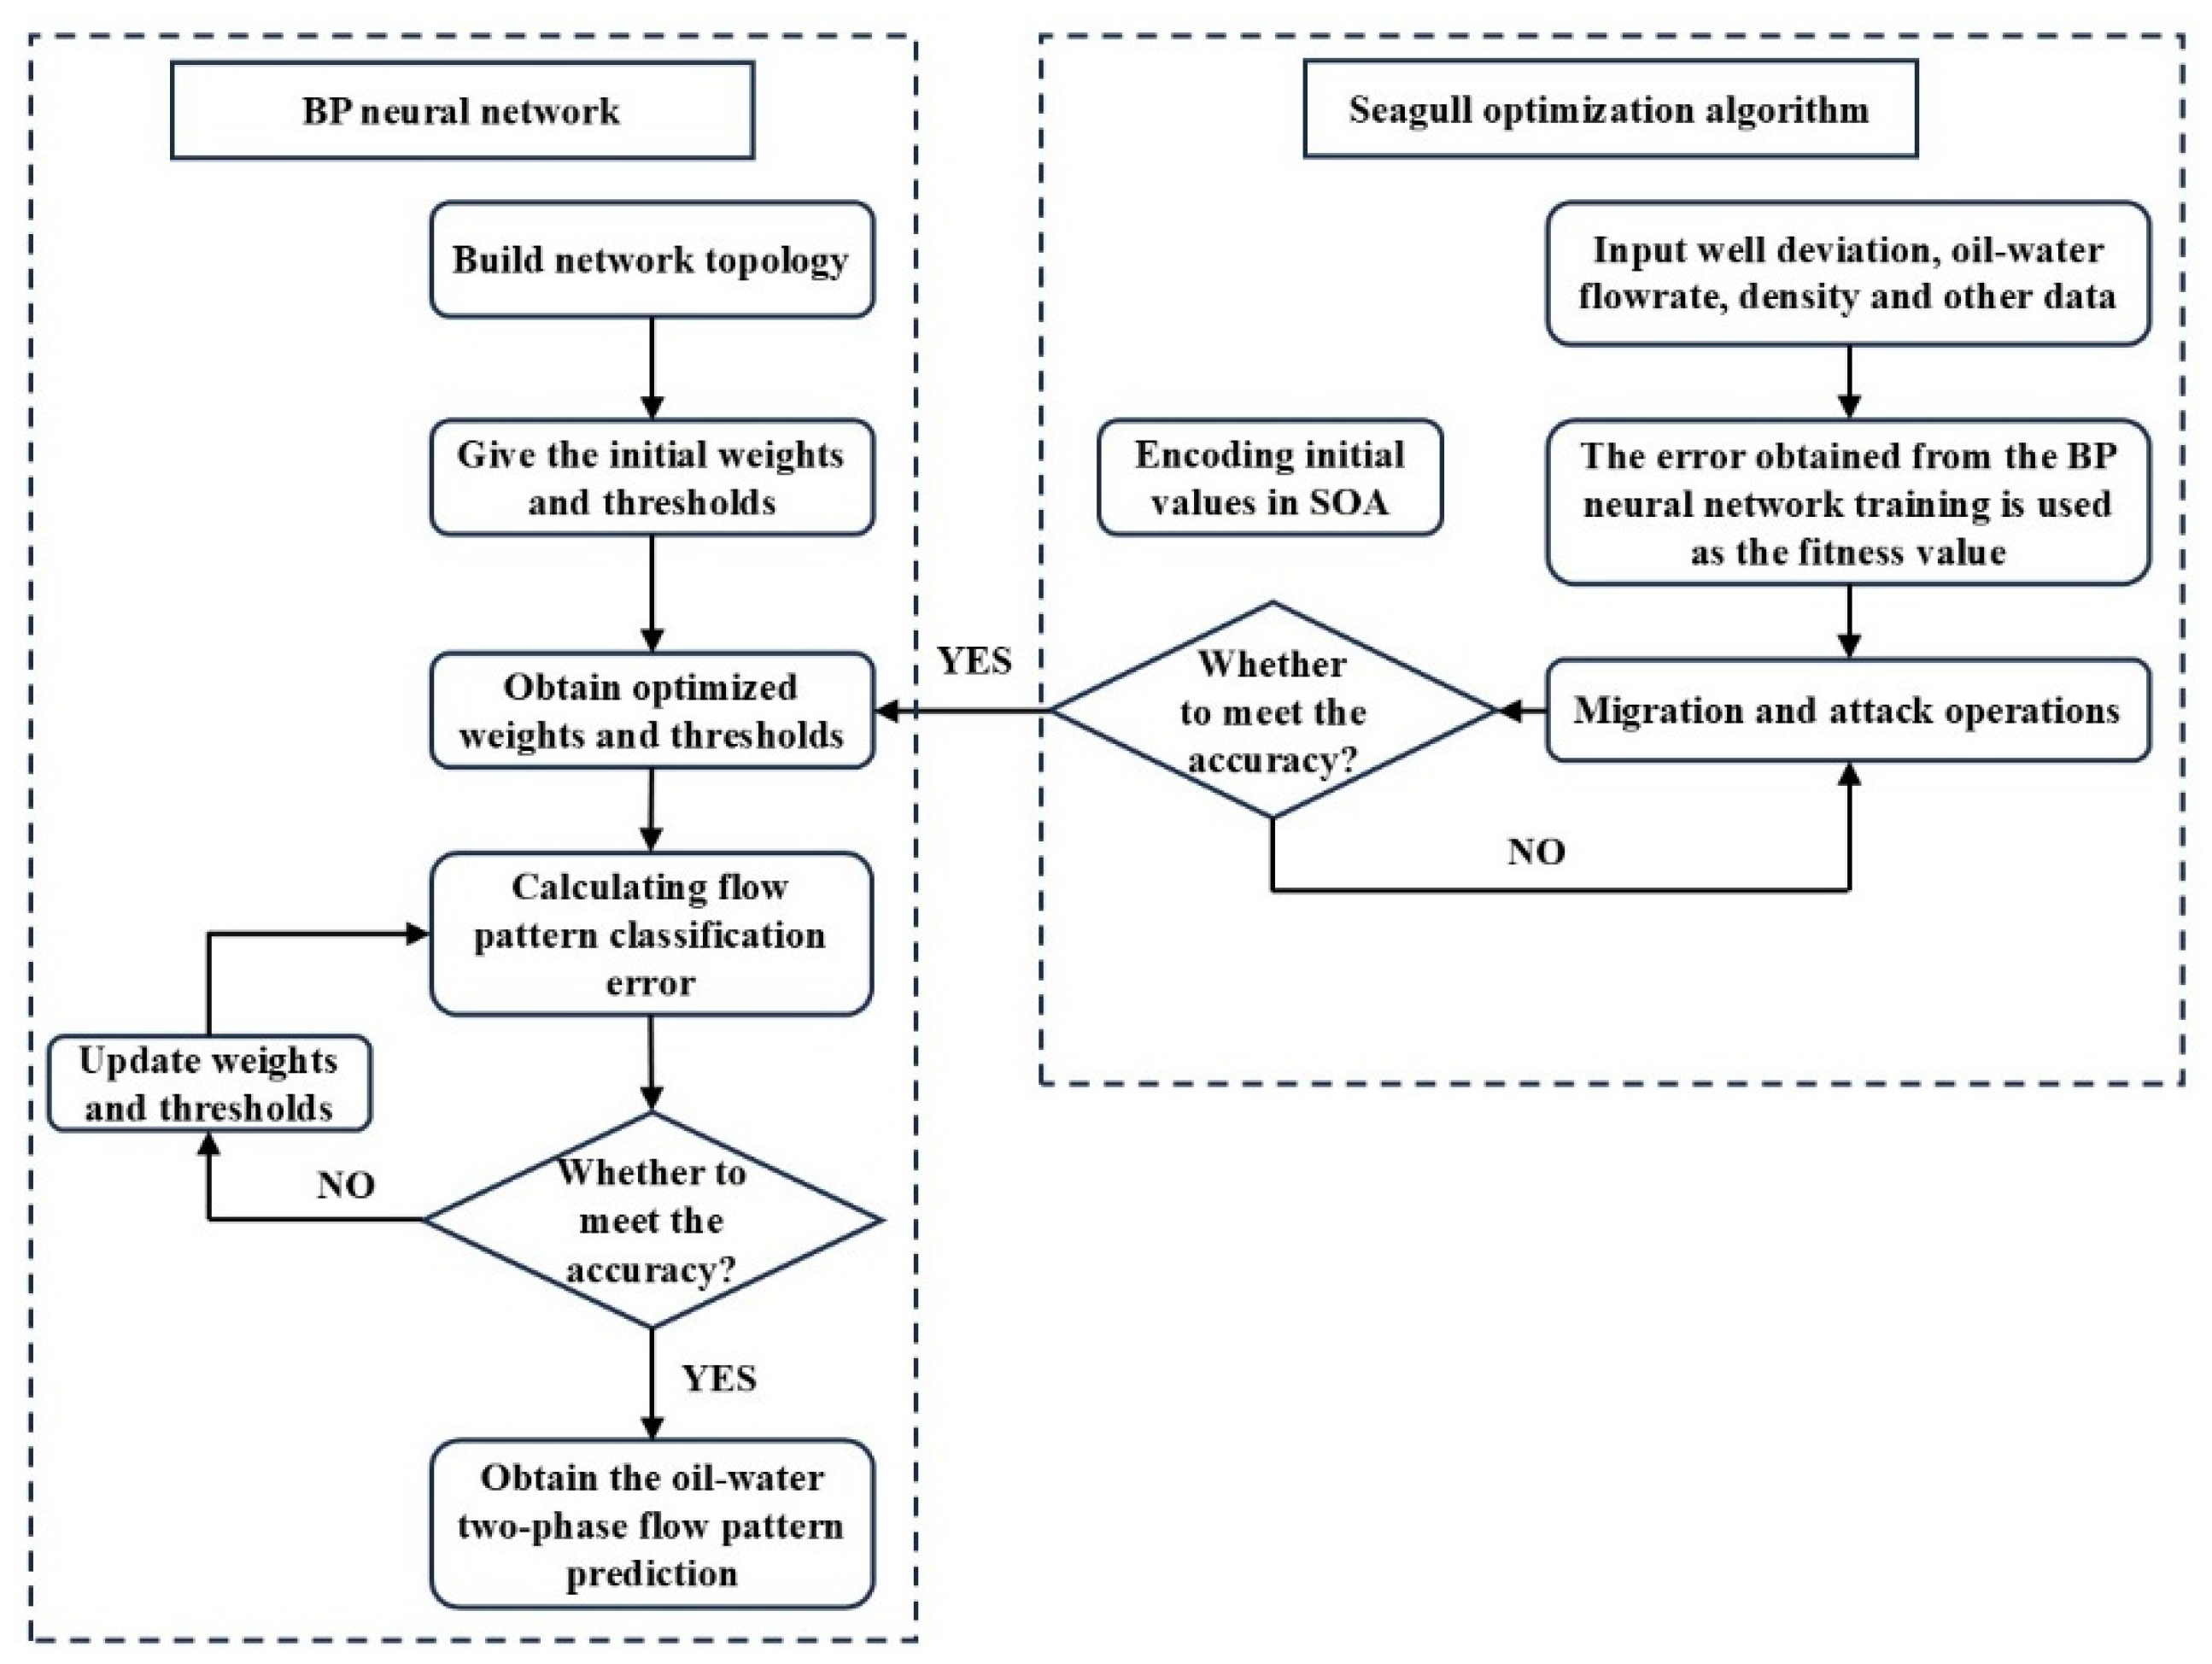
The variability in flow conditions in horizontal wells adds layers of complexity to the characteristics of oil-water two-phase flow. This flow is not only affected by factors such as well slope angle, total flow, and water cut. Additionally, it displays various flow patterns as a result of the intricate geological and physical conditions in the downhole. The accurate prediction of these flow patterns is crucial for the dynamic monitoring of production logging and the accurate processing and interpretation of logging data. This paper employed a multiphase flow simulation experimental device to recreate the oil-water multiphase flow patterns in a wellbore. The experimental equipment was designed to mimic an actual wellbore in terms of size. By adjusting the experimental parameters, such as well inclination angles, flow rates, and water contents, the researchers were able to investigate different multiphase flow regimes. Data on the oil-water two-phase flow state were collected and captured using video during the trials. The main benefit of this experimental technique is its simulation apparatus, which accurately replicates actual downhole conditions, resulting in more precise flow parameters and flow pattern data. Compared with small-well-size multiphase flow simulation experiments, numerical simulations, and studies that depend on multiphase flow databases, this method offers higher realism and accuracy, resulting in a dependable data foundation for subsequent modeling. Based on the experimental data obtained, a flow pattern prediction model for oil-water two-phase flow was constructed by combining the Seagull Optimization Algorithm (SOA) with the BP neural network. The SOA-BP neural network model leverages the global search capabilities of the SOA to optimize the initial weights and biases of the BP neural network, hence improving the model’s learning capacity. This approach enables the model to learn and interpolate flow pattern data for predictions based on limited physical experimental data. The SOA-BP neural network has the advantage of efficiently capturing the intricate nonlinear connections among various flow parameters (such as well inclination angle, flow rate, and water content) and the flow pattern. Additionally, the optimization algorithm reduces the likelihood of overfitting, thereby enhancing the model’s ability to generalize. In order to validate the effectiveness of the prediction model, this study randomly selected data points from sample wells with varying well inclination angles, flow rates, and water content conditions, which were then used in the forecasting model for validation, and the outcomes indicate that the SOA-BP neural network model achieves a high level of accuracy in predicting outcomes under various working conditions.
The prediction model utilizing the SOA-BP neural network exhibits extensive potential for practical applications. By inputting downhole fluid parameters, the model can accurately identify the oil-water two-phase flow pattern in horizontal wells. This provides strong support for the dynamic monitoring of production logging. Compared with traditional methods, this AI-based prediction model not only enhances the accuracy of logging data processing and interpretation but also adapts to the complex and changing downhole conditions, providing more precise technical support for oilfield development.
The paper is organized as follows: Section 2 summarizes the experimental procedure. Section 3 analyzes the oil-water two-phase flow patterns. Section 4 discusses the prediction of oil-water two-phase flow patterns using the SOA-BP neural network. Section 5 validates the prediction model with sample well data. Finally, conclusions and suggestions are presented.

2. Experimental Summary

This study conducted an oil-water multiphase flow experiment in the multiphase flow laboratory of the Key Laboratory of the Ministry of Education for Oil and Gas Resource Exploration Technology at Yangtze River University in order to replicate the oil-water flow dynamics in a wellbore and evaluate the distribution of flow patterns. The experiment replicated the behavior of oil-water two-phase flow while adjusting the well slopes, flow rates, and water contents. 
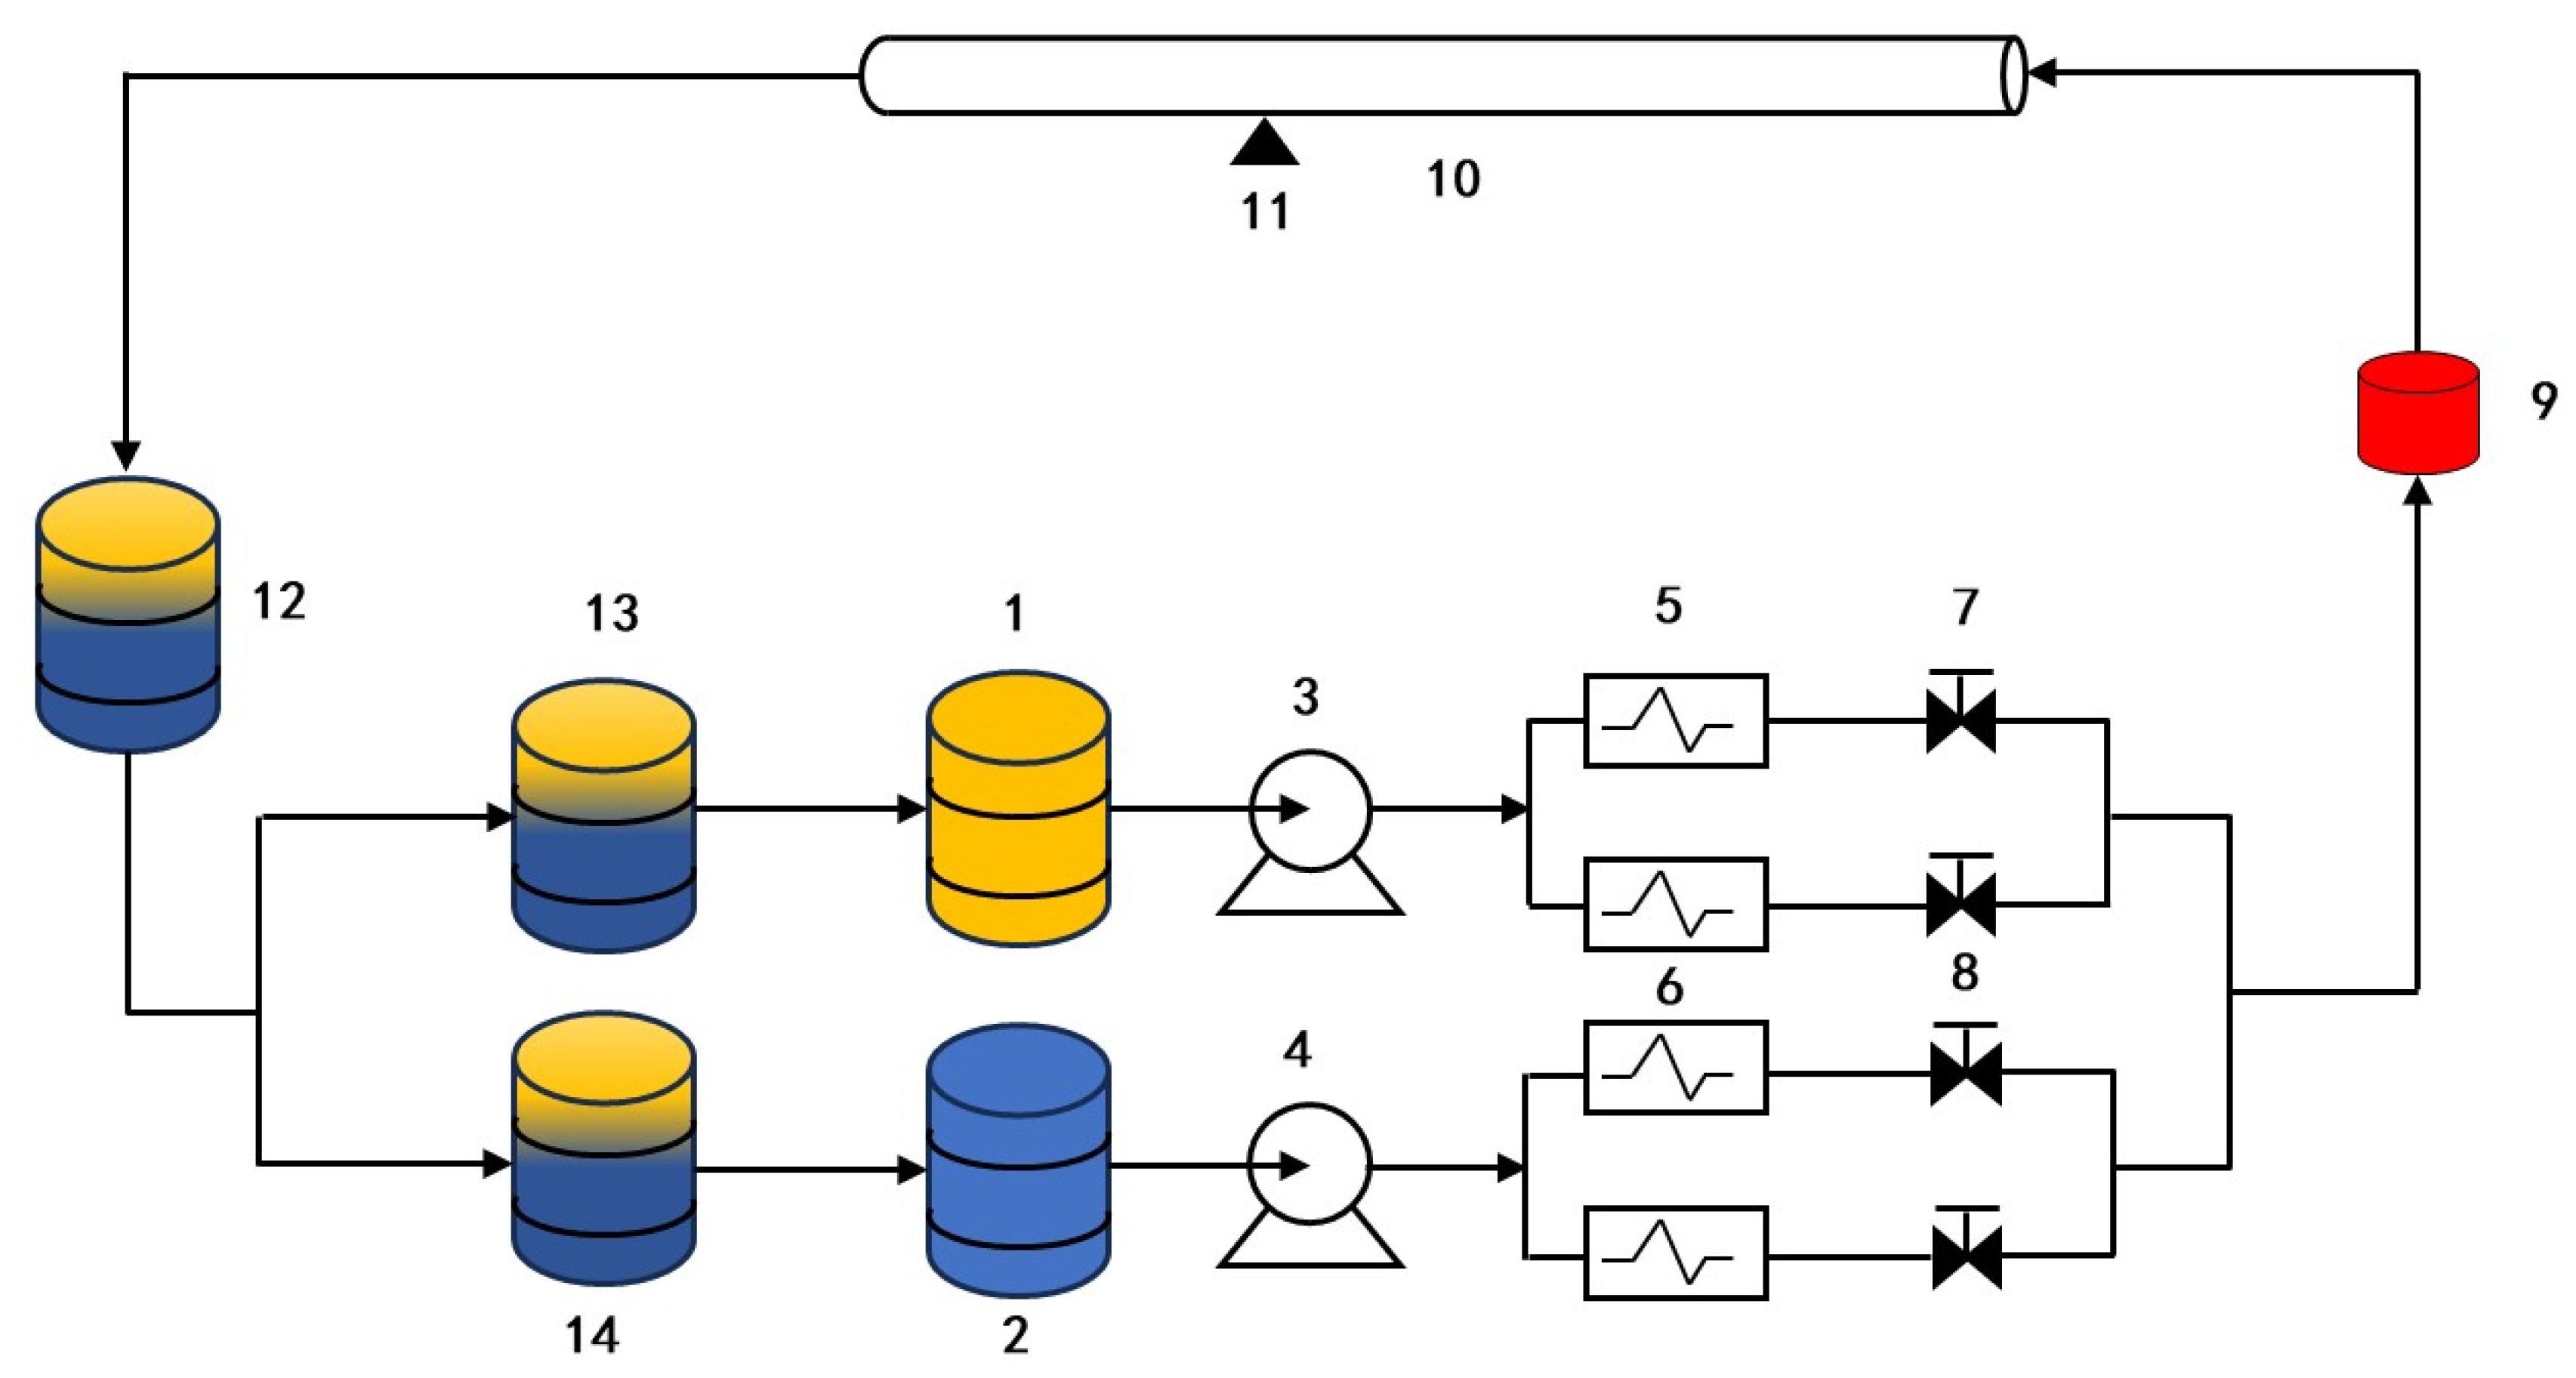
Figure 1 displays a schematic diagram of the laboratory equipment. To realistically replicate the downhole conditions, a transparent Plexiglas wellbore with an outer diameter of 156 mm (similar to the actual wellbore size) and a length of 12 m was used. The transparent wellbore design not only facilitated the observation and recording of the flow state but also allowed real-time monitoring of changes in the flow pattern. Under ambient temperature and pressure conditions (20 °C, 95.89 kPa), industrial white oil (No. 10) with a density of 826.3 kg/m3 and a viscosity of 2.92 mPa∙s, coupled with tap water (988.4 kg/m3 and 1.16 mPa∙s), was utilized to simulate subsurface crude oil and reservoir water, respectively. The properties of the downhole fluids closely resembled those of real fluids, which guaranteed the correctness and reliability of the experimental results.
The fluid storage component of the experimental arrangement comprised a white oil tank, a tap water tank, and an oil-water separation tank. These tanks had a crucial function in the overall experimental configuration, since they were responsible for storing and reusing fluids. During the experiment, the oil storage tank and water storage tank stored white oil and tap water, respectively. These substances were crucial for the simulation experiment. The fluids in question were the authentic crude oil and formation water extracted from the well. It was of utmost importance to store and handle them correctly in order to ensure the experiment ran smoothly. The oil-water separation tank was used to separate the mixed fluids after the experiment, facilitating the reversion of oil and water to their respective tanks for the purpose of recycling. During the experiment, the oil and water were initially manipulated by pumps and flow meters to ensure that each fluid entered the oil-water mixer at a precise flow rate. The primary function of the oil-water mixer was to uniformly blend the two fluids in a predetermined proportion, replicating the oil-water two-phase flow conditions experienced downhole. The emulsion of oil and water was subsequently injected into the simulated wellbore, where it circulated internally. As the fluid was introduced, the interface between oil and water gradually stabilized due to gravity and the flow characteristics of the fluid itself. This stable state had a substantial impact on the establishment and evolution of the flow pattern. In order to thoroughly examine the distribution of the oil-water interface, the experimental setup incorporated an observation point located at two-thirds of the length of the simulated wellbore. At this point, a camera recorded real-time video footage of the changes occurring in the oil-water interface during the experiment.
This configuration enabled the capturing of temporary flow conditions and simplified the examination and evaluation of the complete experimental procedure, offering useful visual information to support the investigation of flow patterns. Once the oil-water mixture had flowed through the simulated wellbore and completed the flow, it was directed into the oil-water separation tank. The main purpose of this tank was to efficiently segregate the oil and water in the fluid, guaranteeing the separate recovery of pure oil and pure water.
After being separated, the uncontaminated oil was sent back to the oil storage tank, while the purified water was sent to the water storage tank. This procedure not only guaranteed the smooth flow of fluid but also reduced fluid wastage during the experiment.
As shown in Table 1, the experiments were designed with total flow rates of 60, 80, 100, 120, 140, 160, 180, 200, 300, and 600 m3/d, with water content varying from 0% to 100%, specifically at 20%, 40%, 60%, 80%, and 90%. The well inclination angles were set at 0°, 60°, 85°, and 90°, covering vertical, inclined, large inclined, and horizontal wells. A total of 200 sets of experimental data were collected during the experiment.

3. Analysis of Oil-Water Two-Phase Flow Patterns

3.1. Flow Pattern Theory of Oil-Water Two-Phase Flow

The study of the flow characteristics of oil-water multiphase flow underground is highly valuable for research in the petroleum sector, especially when it comes to using horizontal wells. To better understand and predict the flow distribution and dynamics of downhole oil-water two-phase flow, scholars have employed laboratory simulation devices to replicate these flows under various experimental conditions. Trallero et al. have made significant contributions to the research on oil-water two-phase flow. The flow pattern categorization method devised by Trallero et al. has garnered substantial acclaim and is widely employed, serving as a crucial point of reference for analyzing the behavior of oil-water two-phase flow in horizontal wells [3]. To accurately simulate downhole conditions and classify oil-water two-phase flow patterns in detail, Trallero et al. developed and employed a flow loop apparatus. This experimental setup featured a transparent glass wellbore with a diameter of 100.26 mm and a length of 15.54 m. It effectively simulated wellbore flow conditions in a laboratory environment, providing reliable data to support flow pattern classification. Based on the consistency of oil-water multiphase flow, droplet distribution, and mixing at the oil-water interface, Trallero et al. divided oil-water two-phase flow into two main categories, comprising six unique flow patterns. The first category was separated flow, including ST and ST&MI; the second category was dispersed flow, including Do/w&w, o/w, Dw/o&Do/w, and o/w. The classifications, based on the fundamental principles of fluid dynamics and backed by actual findings, provide a structured framework that allows researchers to gain a deeper understanding and accurately characterize the intricate phenomena of oil-water two-phase flow. Figure 2 displays a schematic diagram for each type of flow.

3.2. Oil-Water Two-Phase Flow Patterns from Experiments

The flow patterns of oil-water two-phase flow were identified by analyzing 200 experimental data points using the flow pattern classification approach established by Trallero et al. [3]. Despite some differences in the parameters of the experimental setup and the nature of the experimental fluid from Trallero et al.’s original simulation, five flow patterns were successfully identified, ST(a1), ST&MI(b1), o/w(c1), Do/w&w(d1), and Do/w&o/w(e1), as shown in Figure 3.
When studying the flow of oil and water in two phases, the slope angle of the well and the rate at which the phases separate are the two most important parameters that affect variations in flow patterns. Extensive research and experimental data indicate that the well slope angle directly affects the distribution and flow direction of the fluid in the wellbore, while the split-phase flow rate determines the interaction strength between the oil and water phases and their flow characteristics. As the incline of the well grows, the influence of gravity on the fluid becomes stronger, resulting in a more distinct separation between the oil and water layers in the wellbore. Changes in split-phase flow rate have a direct impact on the development and transformation of flow patterns. This is especially true when there are fluctuating water content circumstances, which can make the complexity and diversity of flow patterns more noticeable [19,21,22]. This study aimed to investigate the impact of well inclination angle and split-phase flow rate on flow pattern alterations. To do this, many sets of flow pattern maps were created. The flow pattern maps were generated by plotting data under varied conditions of total flow rate and water content, based on various well slope angles. The horizontal axis represents the oil flow rate, while the vertical axis represents the water flow rate, as depicted in Figure 4.
Figure 4 demonstrates that the boundary separating various flow patterns remains clearly defined, regardless of any alterations in the well angle. This clear boundary suggests that the transition between flow patterns follows a specific physical law.
At a well inclination angle of 90 degrees or 85 degrees, the flow regime is mainly ST when the total flow of both the oil and water phases are low. As the total flow increases, if the water flow rate predominates, the flow regime shifts to Do&w/w; however, if the oil flow rate is higher, the flow regime transitions to ST&MI. When the flow rate increases further and the difference between the oil and water flow rates becomes very small, the flow regime transitions to o/w. However, if the oil flow rate continues to dominate, the flow regime changes to Do/w&o/w.
At a well inclination angle of 60 degrees, the flow regime exhibits stratified ST when both oil and water flow rates are low. As the flow rate rises, the regime transitions to o/w when water flow is predominant and to ST&MI when oil flow is predominant. With an even higher flow rate, the regime shifts to Do/w&w with dominant water flow and to Do/w&o/w with dominant oil flow.
At a well inclination angle of 0 degrees, the flow pattern mostly exhibits ST&MI when both oil and water flow rates are low. As the flow rate rises, the pattern shifts to Do/w&w with a dominant water flow rate, to o/w when the difference between oil and water flow rates is minimal, and to Do/w&o/w when the oil flow rate prevails.

4. Predicting Oil-Water Two-Phase Flow Patterns with the SOA-BP Neural Network

This paper collected a variety of flow parameters and documented the corresponding flow patterns by conducting experimental simulations and analyzing the data, as previously described. The collected data were used to train and test the flow pattern prediction model, verifying its accuracy and reliability. In this study, the Seagull Optimization Algorithm was utilized to optimize the BP neural network, resulting in a gradual improvement in the model’s predictive accuracy. The optimized model can rapidly and accurately anticipate the flow pattern using the input flow parameters, as shown in Figure 5, during the primary implementation phase.

4.1. Algorithm Introduction

The BP neural network is a multilayer feedforward network trained through error backpropagation. It consists of input, hidden, and output layers, as shown in Figure 6 [23]. The basic principle is to minimize the mean square error between the network’s actual output and the desired output using a gradient descent search technique.
Let x l represent an input, where l denotes the overall count of nodes in the input layer, m the overall count of nodes in the hidden layer, and n the overall count of nodes in the output layer. The indices i ,   j , and k correspond to the i-th, j-th, and k-th nodes in the input, hidden, and output layers, respectively. The weight w i j connects the hidden layer to the output layer, while w j k   signifies the weight from the hidden layer to the output layer. The threshold a j corresponds to the input-to-hidden layer, while   b k represents the threshold between the hidden and output layers. The learning rate is denoted by φ , and g ( x ) represents the activation function.
According to the structure diagram of BP neural network, the hidden layer output H j can be expressed as follows:
H j = g ( i = 1 l w i j x i + a j )
The output O k of the output layer can be represented as follows:
O k = j = 1 m H j w j k + b k
The discrepancy between the anticipated result Y k and the network output O k can be expressed as follows:
E = 1 2 k = 1 n ( Y k O k ) 2 = 1 2 k = 1 m e k 2
The equation for updating weight is formulated as follows:
w i j = w i j + φ H j ( 1 H j ) x i k = 1 n w j k e k
w j k = w j k + φ H j e k
The equation of updating the threshold is formulated as follows:
a j = a j + φ H j ( 1 H j ) x i k = 1 n w j k e k
b k = b k + φ e k
The Seagull Optimization Algorithm (SOA) is a novel swarm intelligence algorithm [24] inspired by the biological behaviors of seagulls in nature, particularly the unique strategies they use during migration and foraging. Migration is the phenomenon when seagulls move from locations that are less suited to areas that are more advantageous, depending on the season or environmental conditions. The purpose of migration is to find areas with the highest concentration of food in order to gather energy. This process exhibits a significant degree of randomness while still being purposeful, demonstrating the innate tendency of organisms to enhance their chances of survival by adapting and selecting. During migration, seagulls migrate in flocks while maintaining postures that ensure they do not collide with one other. Seagulls within a group reposition themselves in order to maximize their alignment and progress in a forward direction. The seagulls’ foraging method involves attacking their target, whether it is on land or in the water, by spiraling towards it with precise and agile motions in order to grab fish and shrimp. The seagulls’ capacity to perform extremely efficient activities in intricate surroundings is demonstrated by this behavior, as illustrated in Figure 7.
The migratory tendency observed in SOA s is mainly indicative of the algorithm’s capacity for global search, which refers to its ability to locate the ideal solution that encompasses the whole search space. By emulating the migratory behavior of seagulls, SOA effectively avoids falling into local optima, thereby enhancing the algorithm’s global exploration efficiency. On the other hand, the attack behavior endows the SOA with strong local exploitation capabilities, enabling detailed search and optimization when close to the optimal solution. This enhances both the precision of the solution and the rate at which it approaches convergence. SOA s effectively solve complicated optimization problems by integrating migratory and attack tendencies, which allows for a balance between global search and local exploitation. The SOA is highly efficient in optimizing BP neural networks for weight and threshold adjustment [25]. Traditional BP neural networks are prone to falling into local optima, and their training processes can be time-consuming. The SOA enhances the architecture of BP neural networks by utilizing its strong global and local search capabilities, leading to notable enhancements in performance and generalization ability.

4.2. Development Process of the SOA-BP Neural Network

The SOA-BP neural network was trained with flow characteristics including well inclination, flow rate, and fluid density. The prediction model was ultimately established through the process of modifying the weights and thresholds, as depicted in Figure 8.
To accurately predict oil-water two-phase flow patterns under different experimental conditions, this paper proposed a prediction model based on the SOA-BP neural network and physical experimental data. The implementation procedure is outlined in a precise manner as follows: (1) Preprocessing was performed on the 200 sets of data on oil-water two-phase flow patterns collected from the experiments. (2) Since neural networks cannot handle non-numerical output, the four flow types were replaced with target values, as shown in Table 2. (3) The data were randomly divided into training and testing sets in a 7:3 ratio. (4) Temperature, pressure, total flow rate, water content, well slope, oil density, and water density were used as input parameters, while the desired flow pattern values in each dataset were recorded as the output outcomes. (5) A BP neural network was built, the data in the training set were combined, and the SOA was used to adjust and optimize the network structure, weights, and thresholds. The network was used with the test set data after achieving the optimal flow pattern classification error. (6) The trained SOA-BP neural network was then used as a flow pattern prediction model for oil-water two-phase flow in horizontal wells.

4.3. Training Outcomes

The SOA-BP neural network was trained and tested according to the specified approach. Its performance was validated using a confusion matrix and graphs that compared the output data. After making several adjustments to the hidden layers and thoroughly examining the mistakes in the prediction outcomes, it was concluded that six hidden layers were the most suitable choice. Figure 9 presents the confusion matrices for the training and testing sets. The values in the diagonal blue squares indicate the number of samples that correctly identified the flow pattern, while the red squares represent the number of samples that were incorrectly classified. The percentages within the blue and red squares show the proportion of samples with accurate and inaccurate predictions, respectively, compared to the overall number of samples for each specific flow pattern.
Prediction accuracies for each of the four flow patterns were computed and are displayed in Figure 10. The x-axis indicates the different flow patterns, and the y-axis shows the prediction accuracy for each respective flow pattern. The prediction accuracy for the ST pattern reached 99.5%, while the Do/w&w and Do/w&o/w flow patterns achieved 95.6% and 97.8%, respectively. The o/w flow pattern had a prediction accuracy of 93.9%.
Figure 11 depicts a comparison of the flow pattern prediction outcomes for both the training and test sets. The graphic represents a graph where the horizontal axis represents the number of samples, and the vertical axis is labeled as 1, 2, 3, and 4, indicating the target values for the four different flow patterns. The red lines represent the observed flow patterns, while the blue lines represent the anticipated flow patterns. The prediction accuracy for flow patterns in both the training and test sets reached 97.142%, indicating that the model performs well in learning and predicting experimental data.
In order to enhance the model’s ability to generalize and accurately forecast, the experimental data were separated into training and test sets in a reasonable manner. The training set was used to optimize the model parameters for the SOA-BP neural network, while the test set was used to verify the model’s prediction performance. The Seagull Optimization Algorithm (SOA) was utilized to optimize the weights and thresholds of the BP neural network throughout the training and testing phase. After numerous iterations and tuning, the optimal network parameters, including weights, thresholds, and the number of hidden layers, were determined. In this study, the number of hidden layers was optimized to six. This configuration guaranteed that the network efficiently captured the intricate nonlinear connections in oil-water two-phase flow. The improved network demonstrated superior prediction accuracy and accelerated convergence. The experimental results show that the network achieved high prediction accuracy of 97.14%, meeting the expected accuracy requirements. Achieving the best possible results by using the most effective parameters identified during the training and testing process, a highly effective model was created to accurately forecast oil-water two-phase flow patterns. This model is based on both theoretical derivation and experimental data. It has been optimized globally using SOA (state-of-the-art) techniques and locally tuned using the BP neural network. These optimizations ensure that the model is efficient and reliable when applied in practical situations. To further verify the model’s practical application capability, it was validated using sample well data.

5. Model Verification

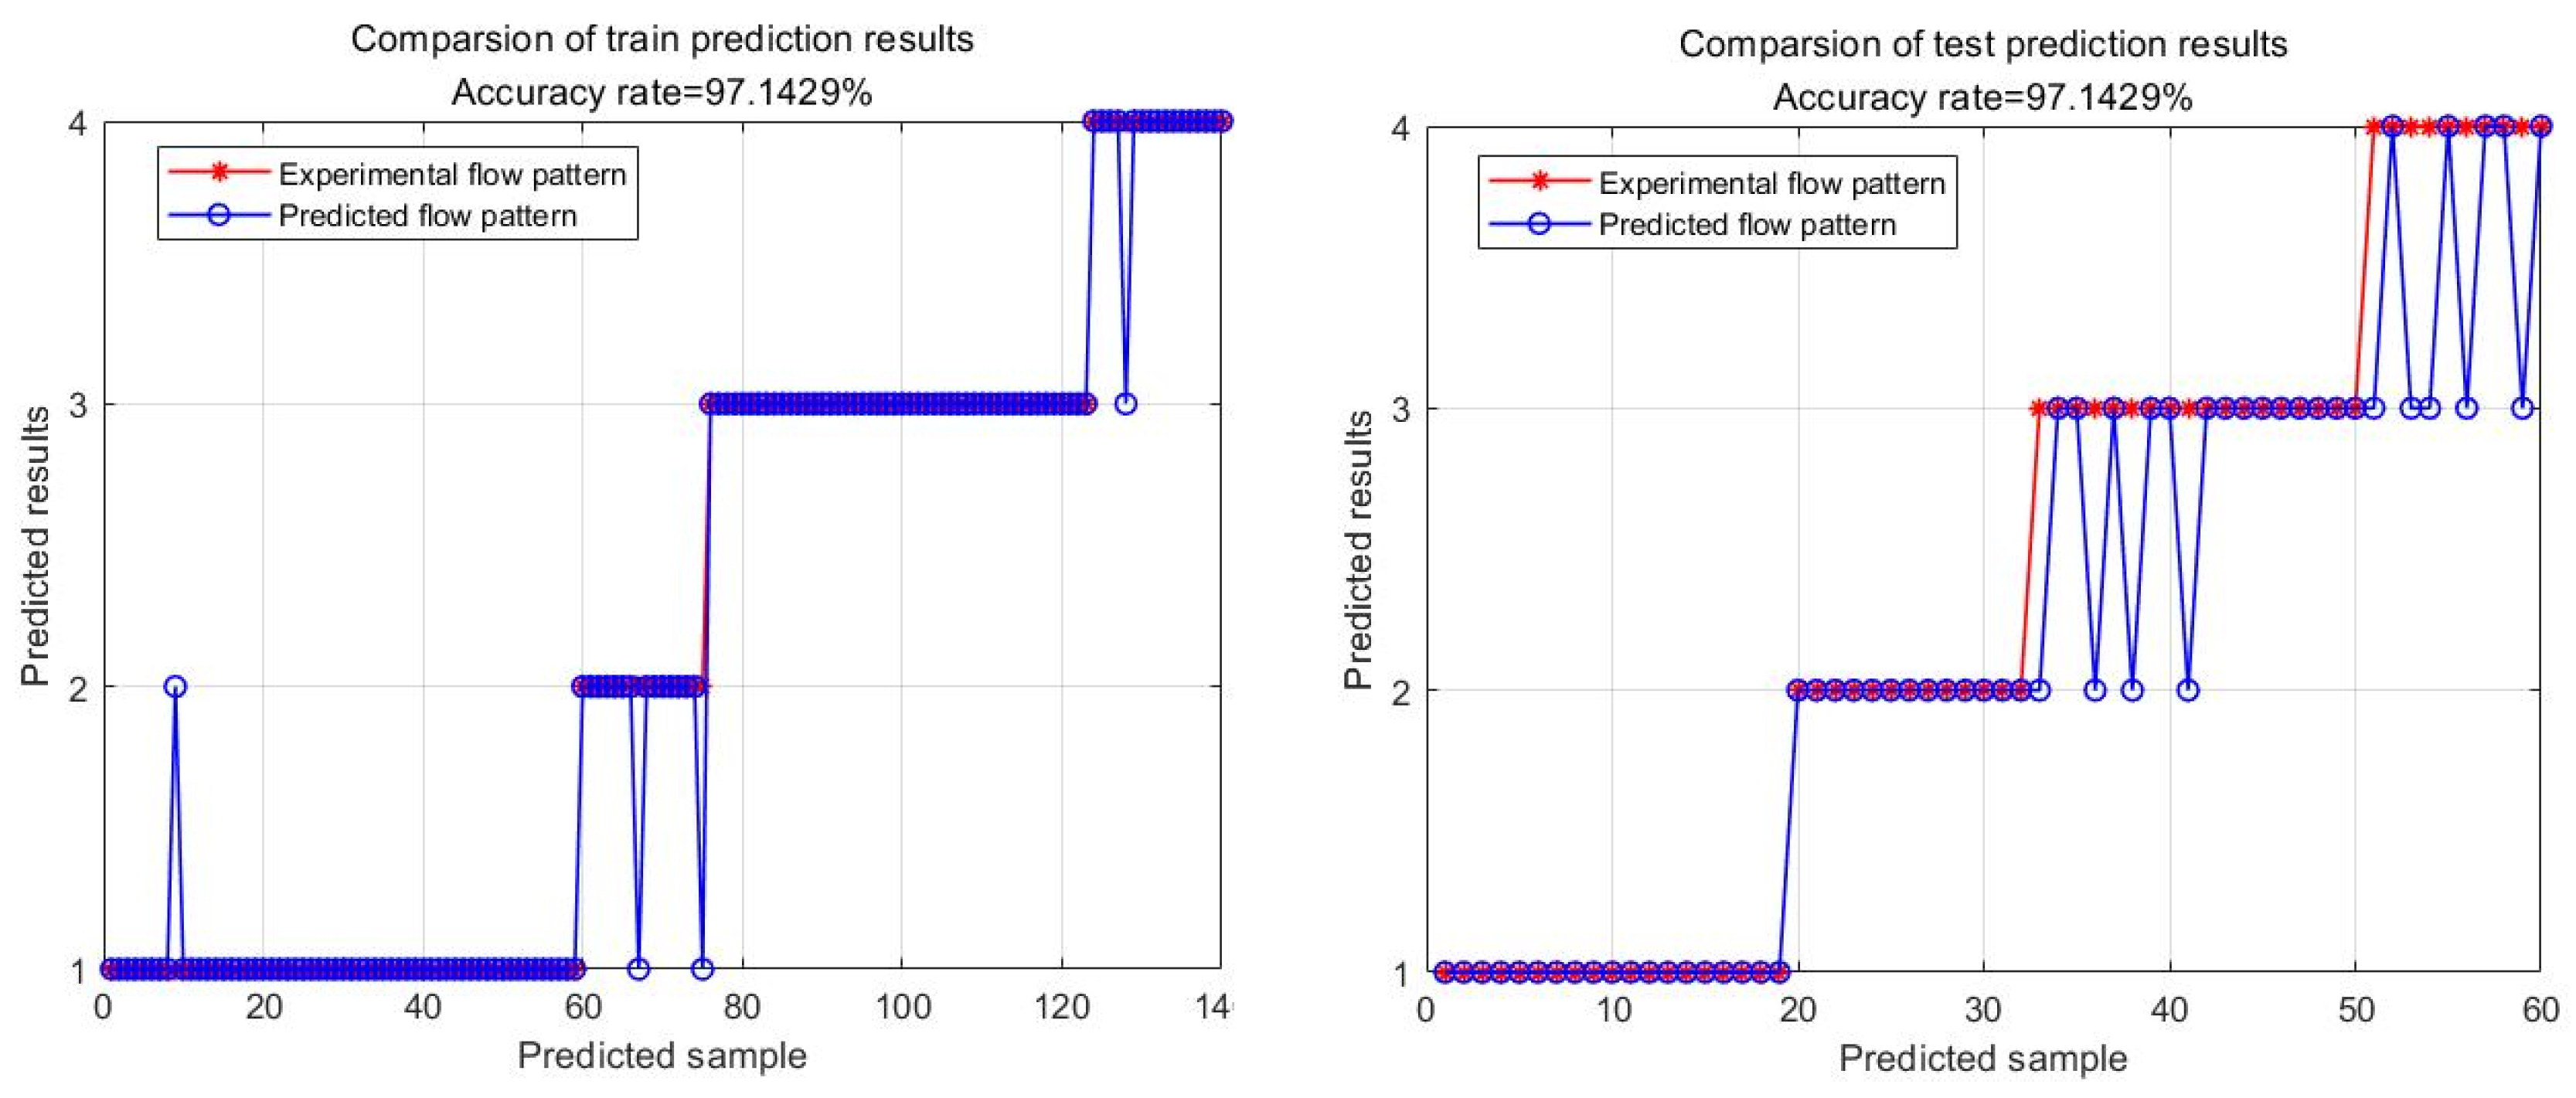
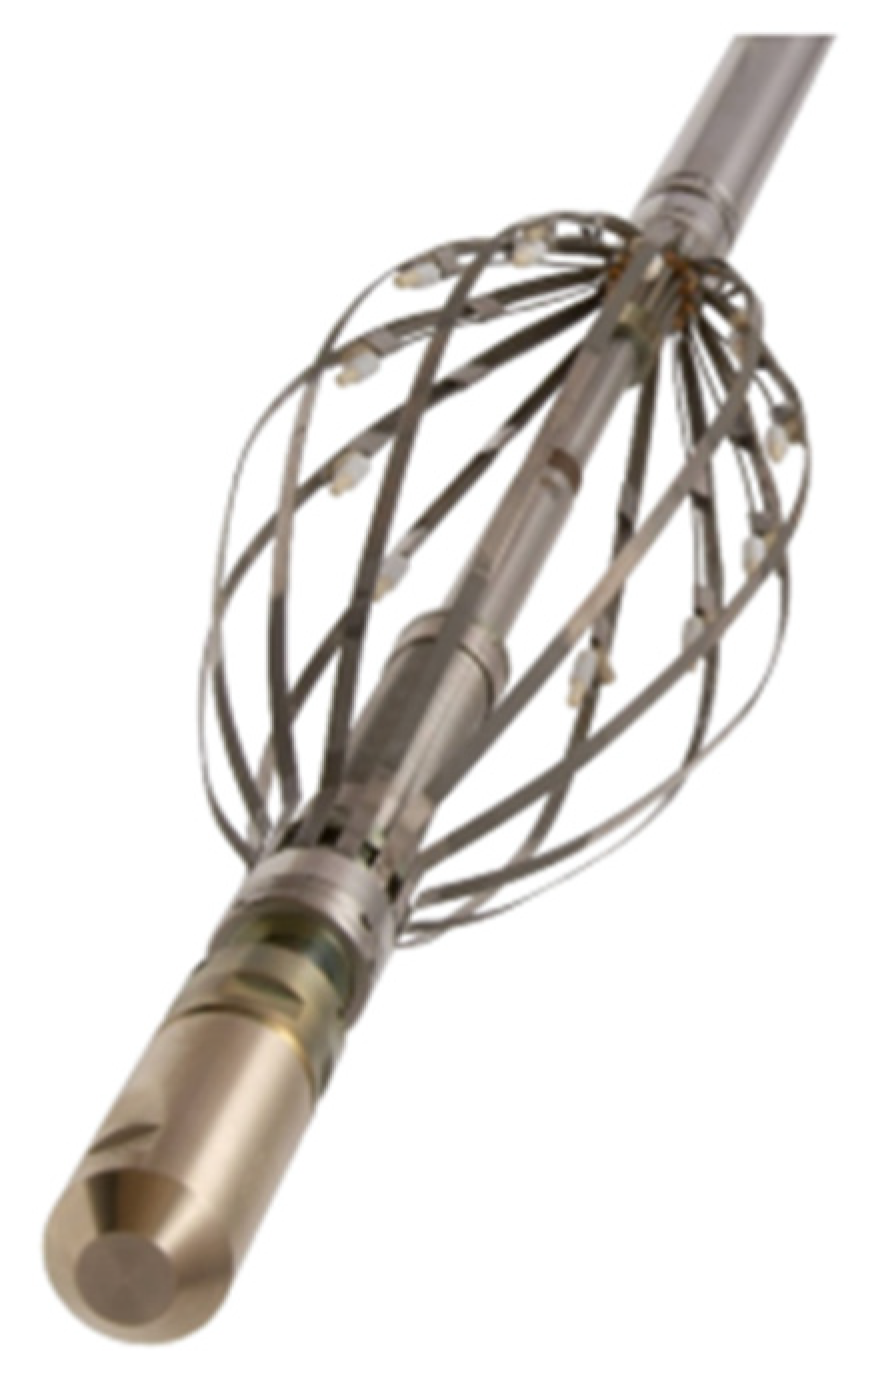
This research successfully developed a model to forecast oil-water two-phase flow patterns, leveraging the training and testing outcomes of the SOA-BP neural network. By conducting a thorough examination of the experimental data, the weights and thresholds of the neural network were fine-tuned to ensure that the model precisely captured the intricate flow features of oil-water two-phase flow. In order to evaluate the effectiveness of the model in practical situations, data from a representative well were selected to forecast flow patterns, and these forecasts were subsequently compared with the actual well logging data. The Resistive Array Tool (RAT) and the Capacitive Array Tool (CAT) were used to obtain oil-water flow pattern information in the wellbore. The RAT is a high-precision measurement tool designed to address the challenge of identifying fluid phases in oil-water two-phase flow. The RAT features a very compact structural design, consisting of twelve miniature sensors secured in a bow spring, as shown in Figure 12. These sensors precisely assess various flow properties in the wellbore. The RAT is capable of precisely measuring fluid resistivity values at various locations within the wellbore. Since water has low resistivity and high conductivity, while oil has high resistivity and low conductivity, the RAT can accurately determine the oil-to-water ratio in the wellbore by measuring these resistivity differences.
The Capacitive Array Tool (CAT) is a logging tool specifically designed to identify the flow pattern of two-phase oil and water streams. The assembly of the device comprises twelve small capacitive sensors that are installed on a bow spring plate, as depicted in Figure 13. The CAT provides critical information about the flow pattern of oil and water by accurately measuring the capacitance signal inside the wellbore. The CAT operates based on the differences in dielectric constants among fluids; gas, water, and oil have distinct dielectric constants—gas has a dielectric constant of 1, water has a dielectric constant as high as 80, and oil has a dielectric constant between that of gas and water. The significant disparity in dielectric constants enables the CAT to identify fluid phases by sensing alterations in capacitance within the wellbore. The detection principle indicates that gas and water exhibit low and high values, respectively, in CAT measurements, while oil readings are typically closer to those of gas. By detecting the circuit frequency signal corresponding to the phase state around the sensor, the CAT can accurately determine the fluid composition in the wellbore and identify the flow pattern of oil and water.
Measurement data from the RAT and CAT provide comprehensive fluid information within the wellbore. By carrying out thorough analysis of these data, it is possible to accurately deduce the distribution of oil and water in the wellbore, as well as identify different kinds of flow patterns. The measurements are essential for verifying the accuracy of the SOA-BP neural network flow pattern prediction model.
To further verify the effectiveness of the oil-water two-phase flow pattern prediction model proposed in this paper, multiple data points featuring various well inclinations and oil-water flow rates from Well A were randomly chosen for flow pattern forecasting. These forecasts were derived from real wellhead production data and interpretations of production profiles. The forecast outcomes were subsequently juxtaposed with the measurement outcomes acquired from logging equipment (RAT and CAT). The results of the prediction are displayed in Table 3.
Table 3 presents a compilation of 15 data points that were measured, along with the outcomes of both the observed and predicted flow patterns. The forecasting model shows the best performance for the ST and Do/w&o/w flow patterns, achieving an accuracy of 100%. However, there is a certain degree of inaccuracy in predicting the o/w and Do/w&w flow patterns. The overall prediction accuracy is 86.67%, which essentially meets the accuracy requirements for production dynamic monitoring. In the validation results for Well A, two flow pattern prediction errors were identified. Three potential reasons that could lead to these inaccuracies were (1) only 200 sets of data were used to train and test the prediction model, and the limited amount of data may have resulted in insufficient prediction accuracy; (2) differences in parameters such as temperature, pressure, and fluid viscosity between the simulated wellbore in the physical experiments and the actual conditions in Well A could have led to variations in the downhole flow pattern; (3) the measurement data from the logging instruments may not have accurately reflected the actual fluid flow pattern in the wellbore.

6. Conclusions

(1)
In the oil-water two-phase flow pattern simulation experiment, the well inclination angle varied between 0°, 60°, 85°, and 90°. Five distinct flow patterns were identified, each displaying distinct distribution features depending on the well slope angles and oil-water flow parameters. In order to gain a deeper comprehension of the correlation between these flow patterns, distribution diagrams were generated to depict the flow patterns associated with different oil and water flow rates. The graphics clearly depict the boundaries and distribution variations among the flow patterns, offering an intuitive foundation for their classification and prediction.
(2)
A prediction model using an SOA-BP neural network was created and trained on the flow pattern data using experimental data. The Seagull Optimization Algorithm (SOA) successfully revealed the complex nonlinear relationships between the fluid flow patterns and related parameters, such as well inclination angle, oil-water flow rate, and oil-water density, through global optimization of the BP neural network parameters. During this developmental process, the model effectively forecasted fluid flow patterns under various experimental situations. This outcome illustrates that the SOA-BP neural network prediction model successfully captured the dynamic fluctuations of oil-water two-phase flow and retained a high level of accuracy even in intricate circumstances.
(3)
To evaluate the model’s performance in practical applications, multiple data points from Well A, each with different well slopes and oil-water flow rates, were used. The prediction results were then compared with measurements from logging instruments (RAT and CAT). The fluid prediction model, which was developed, demonstrated excellent performance across different conditions in Well A and accurately anticipated the flow pattern of oil-water two-phase flow. This outcome demonstrates the model’s effectiveness in supporting the dynamic monitoring of production logging.
(4)
There are intentions to expand the experimental range, specifically targeting oil-water two-phase flow with well inclination angles exceeding 90°, in order to carry out additional experimental investigations. The objective is to enhance the accuracy of predicting oil-water two-phase flow patterns in horizontal wells with different well inclination circumstances by using additional experimental data. This addition will offer essential data assistance for further improving the model and increasing its adaptability and accuracy in predicting outcomes in more intricate downhole settings.

Author Contributions

Validation, H.G.; Formal analysis, H.L.; Investigation, D.W.; Resources, Y.S.; Writing—original draft, A.L.; Writing—review and editing, Y.G. All authors have read and agreed to the published version of the manuscript.

Funding

This research received no external funding.

Data Availability Statement

The data presented in this study are available on request from the corresponding author. The data that has been used is confidential.

Conflicts of Interest

The authors declare no conflict of interest.

References

  1. Angeil, P.; Hewitt, G.F. Flow structure in horizontal oil-water. Int. J. Multiph. Flow 2000, 26, 1117–1140. [Google Scholar] [CrossRef]
  2. Syikilili, A.M.; Nydal, O.J.; Kimambo, C.Z.; Kihedu, J.H. Effect of pipeline inclination on multiphase flow. Exp. Comput. Multiph. Flow 2022, 4, 377–381. [Google Scholar] [CrossRef]
  3. Trallero, J.L. Oil-Water Flow Patterns in Horizontal Pipes; Springer: Dordrecht, The Netherlands, 1995. [Google Scholar]
  4. Keskin, C.; Zhang, H.Q.; Sarica, C. Identification and Classification of New Three-phase Gas/Oil/Water Flow Patterns. In Proceedings of the SPE Annual Technical Conference and Exhibition? Anaheim, CA, USA, 11–14 November 2007. [Google Scholar]
  5. Osgouei, R.E.; Ozbayoglu, E.M.; Ozbayoglu, M.A.; Yuksel, E. Flow Pattern Identification of Gas-Liquid Flow Through Horizontal Annular Geometries. In Proceedings of the SPE Oil and Gas India Conference and Exhibition, Mumbai, India, 20 January 2010. [Google Scholar]
  6. Beggs, D.H.; Brill, J.P. A Study of Two-Phase Flow in Inclined Pipes. J. Pet. Technol. 1973, 25, 607–617. [Google Scholar] [CrossRef]
  7. Taitel, Y.; Dukler, A.E. A model for Predicting Flow Regime Transition in Horizontal and Nearly Horizontal Gas-Liquid Flow. Aiche J. 1976, 22, 47–55. [Google Scholar] [CrossRef]
  8. Ismail AS, I.; Ismail, I.; Zoveidavianpoor, M.; Mohsin, R.; Piroozian, A.; Misnan, M.S.; Sariman, M.Z. Experimental investigation of oil-water two-phase flow in horizontal pipes: Pressure losses, liquid holdup and flow patterns. J. Pet. Sci. Eng. 2015, 127, 409–420. [Google Scholar] [CrossRef]
  9. Roshani, G.H.; Nazemi, E.; Feghhi SA, H.; Setayeshi, S. Flow regime identification and void fraction prediction in two-phase flows based on gamma ray attenuation. Measurement 2015, 62, 25–32. [Google Scholar] [CrossRef]
  10. Hanafizadeh, P.; Shahani, A.; Ghanavati, A.; Akhavan-Behabadi, M.A. Experimental investigation of air-water-oil three-phase flow patterns in inclined pipes. Exp. Therm. Fluid Sci. 2017, 84, 286–298. [Google Scholar] [CrossRef]
  11. Wen, S.; Zhang, T.; Zhang, Q. Phase distribution identification method for oil-water two-phase flow in updip products pipelines. Transp. Storage 2019, 38, 1022–1028. [Google Scholar] [CrossRef]
  12. Song, H.; Guo, H.; Shi, H.; Wang, Q. Numerical simulation and experimental studies on velocity field oil and water stratified flow in low flow rate horizontal wells. Prog. Geophys. 2021, 36, 1103–1110. [Google Scholar]
  13. Liu, W.; Tan, C.; Dong, F. Doppler spectrum analysis and flow pattern identification of oil-water wo-phase flow using dual-modality sensor. Flow Meas. Instrum. 2021, 77, 101861. [Google Scholar] [CrossRef]
  14. Osman, E. Artificial neural network models for identifying flow regimes and predicting liquid holdup in horizontal multiphase flow. SPE Prod. Facil. 2004, 19, 33–40. [Google Scholar] [CrossRef]
  15. Li, L.; Popa, F.; Huchens, B.C. Mechanistic Prediction of Oil-Water, Two-phase Flow in Horizontal or Near Horizontal Pipes for a Wide Range of Oil Viscosities. In Proceedings of the SPE Technical Conference & Exhibition, Houston, TX, USA, 28–30 September 2015. [Google Scholar]
  16. Al-Naser, M.; Elshafei, M.; Al-Sarkhi, A. Artificial neural network application for multiphase flow patterns detection: A new approach. J. Pet. Sci. Eng. 2016, 145, 548–564. [Google Scholar] [CrossRef]
  17. Mask, G.; Wu, X.; Ling, K. An improved model for gas-liquid flow pattern prediction based on machine learning. J. Petrol. Sci. Eng. 2019, 183, 106370. [Google Scholar] [CrossRef]
  18. Alhashem, M. Machine Learning Classification Model for Multiphase Flow Regimes in Horizontal Pipes. In Proceedings of the International Petroleum Technology Conference, Dhahran, Saudi Arabia, 13–15 January 2020. [Google Scholar]
  19. Wu, Y.; Guo, H.; Song, H.; Deng, R. Fuzzy inference system application for oil-water flow patterns identification. Energy 2022, 239, 122359. [Google Scholar] [CrossRef]
  20. Shi, S.; Liu, J.; Hu, H.; Zhou, H. A research on a GA-BP neural network based model for predicting patterns of oil-water two-phase flow in horizontal wells. Geoenergy Sci. Eng. 2023, 230, 212151. [Google Scholar] [CrossRef]
  21. Tan, J.; Jing, J.; Hu, H.; You, X. Experimental study of the factors affecting the flow pattern transition in horizontal oil-water flow. Exp. Them. Fluid Sci. 2018, 98, 534–545. [Google Scholar] [CrossRef]
  22. de Oliveira, M.R.; Martins, M.F.; Belich, H.; Amorim, L. A model for predicting two-phase flow patterns transitions in an annulus: In calcinations for horizontal to near-vertical. Chem. Eng. Sci. 2022, 250, 117379. [Google Scholar] [CrossRef]
  23. MarinMarini, F. Non-linear Modeling: Neural Networks. In Comprehensive Chemometrics, 2nd ed.; Brown, S., Tauler, R., Walczak, B., Eds.; Elsevier BV: Amsterdam, The Netherlands, 2020; Volume 3, pp. 519–541. [Google Scholar]
  24. Dhiman, G.; Kumar, V. Seagull optimization algorithm: Theory and its applications for large-scale industrial engineering problems. Knowl. Based Syst. 2019, 165, 169–196. [Google Scholar] [CrossRef]
  25. Li, J.; Zhou, P. Application of seabird-inspired algorithms in neural network optimization. IEEE Trans. Neural Netw. 2023, 34, 1476–1488. [Google Scholar]
Figure 1. Multiphase flow simulation experiment set. 1. Oil tank. 2. Water tank. 3. Oil pump. 4. Water tank. 5. Oil flow meters. 6. Water flow meters. 7. Oil control valves. 8. Water control valves. 9. Oil-water mixer. 10. Simulated wellbore. 11. Experimental observation point. 12. Oil-water separation tank. 13. Oil-water separation tank. 14. Oil-water separation tank.
Processes 12 02012 g001
Figure 2. Schematic diagram of theoretic flow patterns of oil-water two-phase flow [3].
Processes 12 02012 g002
Figure 3. Comparison of theoretical and experimental flow patterns.
Processes 12 02012 g003
Figure 4. Distribution of experimental flow patterns in four different well deviations.
Processes 12 02012 g004
Figure 5. Model development and verification for flow pattern.
Processes 12 02012 g005
Figure 6. Three-layer BP neural network prediction diagram.
Processes 12 02012 g006
Figure 7. Migration and attacking behaviors of seagulls.
Processes 12 02012 g007
Figure 8. Flowchart of SOA-BP neural network.
Processes 12 02012 g008
Figure 9. Confusion matrix of training and test data.
Processes 12 02012 g009
Figure 10. Comparison of forecasting accuracy of different flow patterns.
Processes 12 02012 g010
Figure 11. Comparison of training and test prediction results.
Processes 12 02012 g011
Figure 12. Schematic diagram of RAT instrument.
Processes 12 02012 g012
Figure 13. Schematic diagram of CAT instrument.
Processes 12 02012 g013
Table 1. Schematic of oil-water two-phase experimental design.
Well Angle (°)Water Cut (%)Total Flow of Oil-Water (m3/d)
0, 60, 85, 9020, 40, 60, 80, 9060, 80, 100, 120, 140, 160, 180, 200, 300, 600
Table 2. Numerical representation of flow patterns.
Flow PatternNumerical Value
ST1
o/w2
Do/w&w3
Do/w&o/w4
Table 3. Comparison of actual flow patterns and forecasting results of Well A.
Well Angle
(°)
Oil Flowrate
(m3/d)
Water Flowrate
(m3/d)
Oil Density
(g/cm3)
Water
Density
(g/cm3)
Actual Flow PatternForecasted ResultsCorrectness
89.39165.3189.250.8751.06Do/w&o/wDo/w&o/wYES
84.9936.1157.230.8751.06STSTYES
86.8639.4352.450.8751.06STSTYES
87.95178.86120.340.8751.06Do/w&w/wDo/w&w/wYES
86.9843.5165.720.8751.06STSTYES
86.25107.8372.880.8751.06Do/w&o/wDo/w&o/wYES
87.3246.1238.840.8751.06STSTYES
84.62110.2257.660.8751.06Do/w&o/wDo/w&o/wYES
87.5750.68105.980.8751.06o/wSTNO
88.5445.99101.660.8751.06Do/w&/wDo/w&wYES
84.7169.2582.390.8751.06o/wo/wYES
89.16151.78108.560.8751.06Do/w&wDo/w&o/wNO
88.9188.5470.150.8751.06STSTYES
89.05135.62108.280.8751.06Do/w&wDo/w&/wYES
89.56195.25151.520.8751.06Do/w&o/wDo/w&o/wYES
Disclaimer/Publisher’s Note: The statements, opinions and data contained in all publications are solely those of the individual author(s) and contributor(s) and not of MDPI and/or the editor(s). MDPI and/or the editor(s) disclaim responsibility for any injury to people or property resulting from any ideas, methods, instructions or products referred to in the content.

