Article

Land Suitability Analysis for Green Ammonia Unit Implementation in Morocco Using the Geographical Information System–Analytic Hierarchy Process Approach

1
Sustainability, Energy and Mathematical Modeling, Ecole Nationale Supérieure des Mines de Rabat, Rabat 10000, Morocco
2
Graduation Academy, Anhalt University of Applied Sciences, 06406 Bernburg (Saale), Germany
3
Department of Economics, Anhalt University of Applied Sciences, 06406 Bernburg (Saale), Germany
*
Author to whom correspondence should be addressed.
Processes 2024, 12(9), 1991; https://doi.org/10.3390/pr12091991
Submission received: 31 July 2024 / Revised: 28 August 2024 / Accepted: 10 September 2024 / Published: 15 September 2024
(This article belongs to the Section Chemical Processes and Systems)

Abstract

:
Morocco contains one of the greatest phosphate deposits and is the second-largest international phosphate fertilizer producer. However, it heavily relies on imported grey ammonia. To reduce this dependency, a paradigm shift is required toward local green ammonia production to strengthen the fertilizer industry. The purpose of the study is to identify the most promising locations in Morocco for hosting a green ammonia unit through a land suitability analysis. This was carried out using multi-criteria decision-making (MCDM) and geographical information systems (GIS). Eight relevant criteria were considered, based on carefully studying the relevant literature and consultation with renewable energy experts and professionals. The land suitability analysis revealed high suitability locations and five sites were selected from the regions of Dakhla, Laayoune, Boujdour, and Tarfaya. These locations were introduced to Hybrid Optimization of Multiple Electric Renewables (HOMER) software 3.16.2 for simulation. The simulation findings showed that the levelized cost of hydrogen (LCOH) ranges from 1.67 USD/kg to 1.82 USD/kg, with the lowest LCOH at Dakhla. The corresponding levelized cost of ammonia (LCOA) ranges from 646 USD/t to 687 USD/t. Dakhla was identified as the location with the lowest LCOA, accounting for 646 USD/t. The outcomes showed a similar trend compared to other studies (Saudi Arabia, Jordan, Iran). Considering improvements in the electrolyzer’s efficiency and cost, a technical and financial sensitivity analysis was conducted, identifying highly promising LCOA in Morocco, reaching 548 USD/t.

1. Introduction

Energy and industrial sectors are responsible for 42% and 26% of CO2 emissions worldwide, respectively [1]. Ammonia production accounts for a significant amount of these emissions through the conventional natural gas process. Currently, it accounts for over 11% of worldwide industrial CO2 emissions and 1.3% of total emissions [2]. In line with the international commitments to reduce the carbon footprint, decarbonized manufacturing is extremely required. Considering the infrastructure, security, transportation, supply chain, and the anticipated decrease in the costs of green electricity, electrolyzers, and carbon capture methods, ammonia production is increasingly encouraging for use as fuel, in electricity storage, and as a raw material for chemical industries. Ammonia offers several key advantages, as it is six times more compact than hydrogen at a storage pressure of 20 MPa. It can be stored at a high hydrogen density and transported at low pressure, reducing storage and transportation costs. It offers lower storage costs than hydrogen. For example, storing ammonia for 182 days costs approximately 0.54 USD/kg, whereas hydrogen storage costs around 14.95 USD/kg [3,4]. Lee et al. [5] have concluded in their research that ammonia hydrogen storage is the most advisable technology for long-term sustainability. Regarding transport, the cost of transporting ammonia by ship is about USD 6.94 per ton of NH3, and by pipeline, it is around USD 34.4 per ton of NH3 [6,7,8]. Therefore, storing and transporting hydrogen as ammonia is extremely convenient and presents a promising solution.
Morocco has the potential to contribute significantly to the green ammonia industry development. It presents one of the greatest phosphate deposits, holding 75% of the world’s phosphate rock reserves. It is the second-largest international phosphate fertilizer producer (40 million tons in 2022 [9,10]). However, currently, the use of grey ammonia in the fertilizer industry is still dominant. The national market relies on imported grey ammonia, reaching up to 2 million tons/year [11,12]. To reduce this dependence, a paradigm shift is required towards local green ammonia production, not only to strengthen the local manufacturing of fertilizers but also to take part in the international market (green mobility). In this regard, several strategies and initiatives have been implemented to accelerate the transition. “Green Hydrogen Roadmap” targets a total production of 14 TWh by 2030 (10 TWh (71%) for export and 4 TWh (29%) for local use) [13]. “Morocco Offer” is an operational and incentive offer, where the Government has identified a million hectares of potential land, addressed to investors planning to produce green hydrogen and its derivatives. Regarding projects, the Office Chérifien des Phosphates (OCP) Group is the first company to launch the first pilot green ammonia production project. It is a pre-industrial research and production plant producing 4 tons/day of green ammonia, equipped with an electrolysis capacity of 4 MW and powered by photovoltaic/wind energy [14]. Moreover, another green ammonia unit is planned near Tarfaya (South of Morocco) with an annual production reaching 200,000 tons/year from 2026. The annual production is increasing to 1 million tons by 2027 and 3 million tons by 2032 [15].
Morocco presents sufficient resources to go for local ammonia production, either for local use or for export to the international market. The climate gives Morocco great potential in terms of renewable energies available at a competitive cost. It is noteworthy that the levelized cost of electricity (LCOE) for solar power in Morocco ranges between 0.06 and 0.09 USD/kWh [16,17,18]. For wind power, the LCOE reached 0.029 USD/kWh in Morocco according to a recent study carried out by [19]. Eventually, this will lead to a competitive cost for green hydrogen production. Thus, resulting in lower ammonia production costs. In terms of wind energy potential, the technical onshore wind potential is about 11,500 TWh [20]. Morocco already reached an installed capacity of 1.43 GW (2022) [21]. This considerable potential is due to high wind speeds, reaching 11.5 m/s at 80 m [22,23]. Regarding solar energy potential, the technical potential for photovoltaics is about 49,000 TWh [20]. Morocco reached an installed solar energy capacity of about 0.83 GW, including concentrated solar power (CSP), in 2022 [21]. This considerable potential is due to the high average solar irradiation reaching 5 kWh/m2·day [24]. Approximately 79% of Morocco’s total surface area exceeds 2000 kWh/m2·year in Global Horizontal Irradiation (GHI). These indicate a high suitability for photovoltaics (PV) power plant installation [25]. Several studies assume that the GHI in suitable areas must exceed 1460 kWh/m2 [26,27,28]. Others suggest a minimum GHI, ranging from 1000 to 1300 kWh/m2·year [29,30,31,32,33]. In addition to this remarkable potential, the strategic geographical closeness to Europe, existing and future harbors, and gas infrastructure give the country a strong position in the international market as a leading exporter of green ammonia [34].
Powering a green ammonia unit using renewable sources is a challenging task that requires careful evaluation of several parameters. It is worth mentioning that a location with abundant renewable potential may not always be a favorable option. Other factors must be considered, including closeness to infrastructure and urban areas, transport infrastructure, and water availability for the electrolysis process. These features can be challenging in the decision-making approach regarding unit implementation. In this regard, the main objective of the study is to identify suitable locations to produce green ammonia using geographic information system–multicriteria decision-making (GIS-MCDM) analysis. One of the main structured MCDM methods deployed is the analytic hierarchy process (AHP). It is strongly recommended and extensively used, especially in renewable energy project design and implementation [35,36]. The main goal behind this analysis is to assist in spatial assessment by simplifying the selection of the most optimal option among various available options [37].
Various studies have been conducted to select the optimal location for establishing a renewable energy farm using a combination of GIS and MCDM. Indeed, Islam et al. [38] conducted a location suitability assessment for solar power units in Bangladesh. In Tunisia, a study by [29] utilized an integrated GIS-based MCDM approach to evaluate land suitability and identify the optimal sites for large-scale solar PV power plant development. Another case study, depicting potential sites in Iran for solar power plants, was carried out [39]. In the Stadteregion Aachen (Germany), Hofer et al. [40] conducted a complete multi-criteria evaluation (MCE) method for enhancing site assessments for wind farms. The method includes technical and economic indicators and social, political, and environmental considerations. Another study conducted by [41] used GIS-MCE evaluation models to determine the optimal purchase price for electricity generated by wind plants in Iran. Ordered Weighted Averaging (OWA) was used as a feature of the MCE model. Moreover, another study was established by Noorollahi et al. [42] in Iran, particularly in Markazi Province, using a combination of GIS and AHP to assess wind energy potential. Continuing in Iran, where the water deficit is high, [43] developed a multi-criteria analysis for selecting a wind farm location to supply reverse osmosis facilities with renewable energy and produce fresh water. In continental Ecuador, research was conducted by [37] to select the most appropriate site for installing wind farms. Different criteria were considered, including meteorological specifications (air density, wind speed), relief (slope), location (road network, distances to substations, urban areas, charging ports, transmission lines), as well as environmental specifications (vegetation coverage). Regarding green hydrogen production, Hosseini Dehshiri [44] provided an integrated framework for suitable location identification to install wind farms for green hydrogen production purposes. Eight different criteria were studied. These criteria group technical aspects (hydrogen production potential, wind speed, slope), and economic aspects (distances to the electricity grid, urban areas, roads, railways, and centers of high hydrogen consumption). In Algeria, various studies have been conducted to explore the potential for green hydrogen production, focusing on the country’s abundant renewable energy resources and its strategic position for future energy exports. The GIS-AHP approach was widely utilized to identify high-suitability lands for implementing green hydrogen projects. These studies have considered several factors, such as proximity to renewable energy sources, water availability, existing infrastructure, and environmental constraints [45,46,47].
On a Moroccan scale, AHP and GIS approach was established by Alami Merrouni et al. to evaluate locations, where to install large-scale PV and CSP units in the eastern region [48,49]. The authors of [50] carried out an investigation focusing on offshore wind energy assessment in Morocco. The results highlighted a wide suitable offshore area for wind farm installation. Three suitable lands were identified within the Atlantic Ocean boundary of Morocco, close to Essaouira, Boujdour, and Dakhla. Recently, Amrani et al. [51] conducted a study to evaluate the national potential for installing large-scale solar hydrogen production units based on PV and CSP. These were well established using a comprehensive approach combining the AHP technique and GIS tool. The results showed that PV-to-hydrogen plants are the most advantageous option for Morocco for efficient green hydrogen production.
The literature review shows that GIS-AHP analysis has been widely used in various contexts, particularly for selecting the best locations for implementing renewable energy units and green hydrogen plants. However, in the context of green ammonia, it is essential to emphasize that no published studies have assessed suitable locations for implementing hybrid PV-wind plants and identifying the optimal configuration for powering an ammonia production unit. Thus, the novelty lies in applying the GIS-AHP methodology, particularly to land suitability for green ammonia units in Morocco. Due to its unique geographic and climatic conditions, Morocco presents specific challenges and opportunities for green ammonia implementation. Conducting a land suitability analysis within the Moroccan context provides valuable insights directly relevant to the country’s energy and strategies. The present study includes a specific criterion: proximity to the coastline for the water desalination process. Additionally, proximity to the fertilizer unit is an economic criterion incorporated into the evaluation to reduce transportation costs from the unit to Jorf Lasfar, the site of the fertilizer industry.
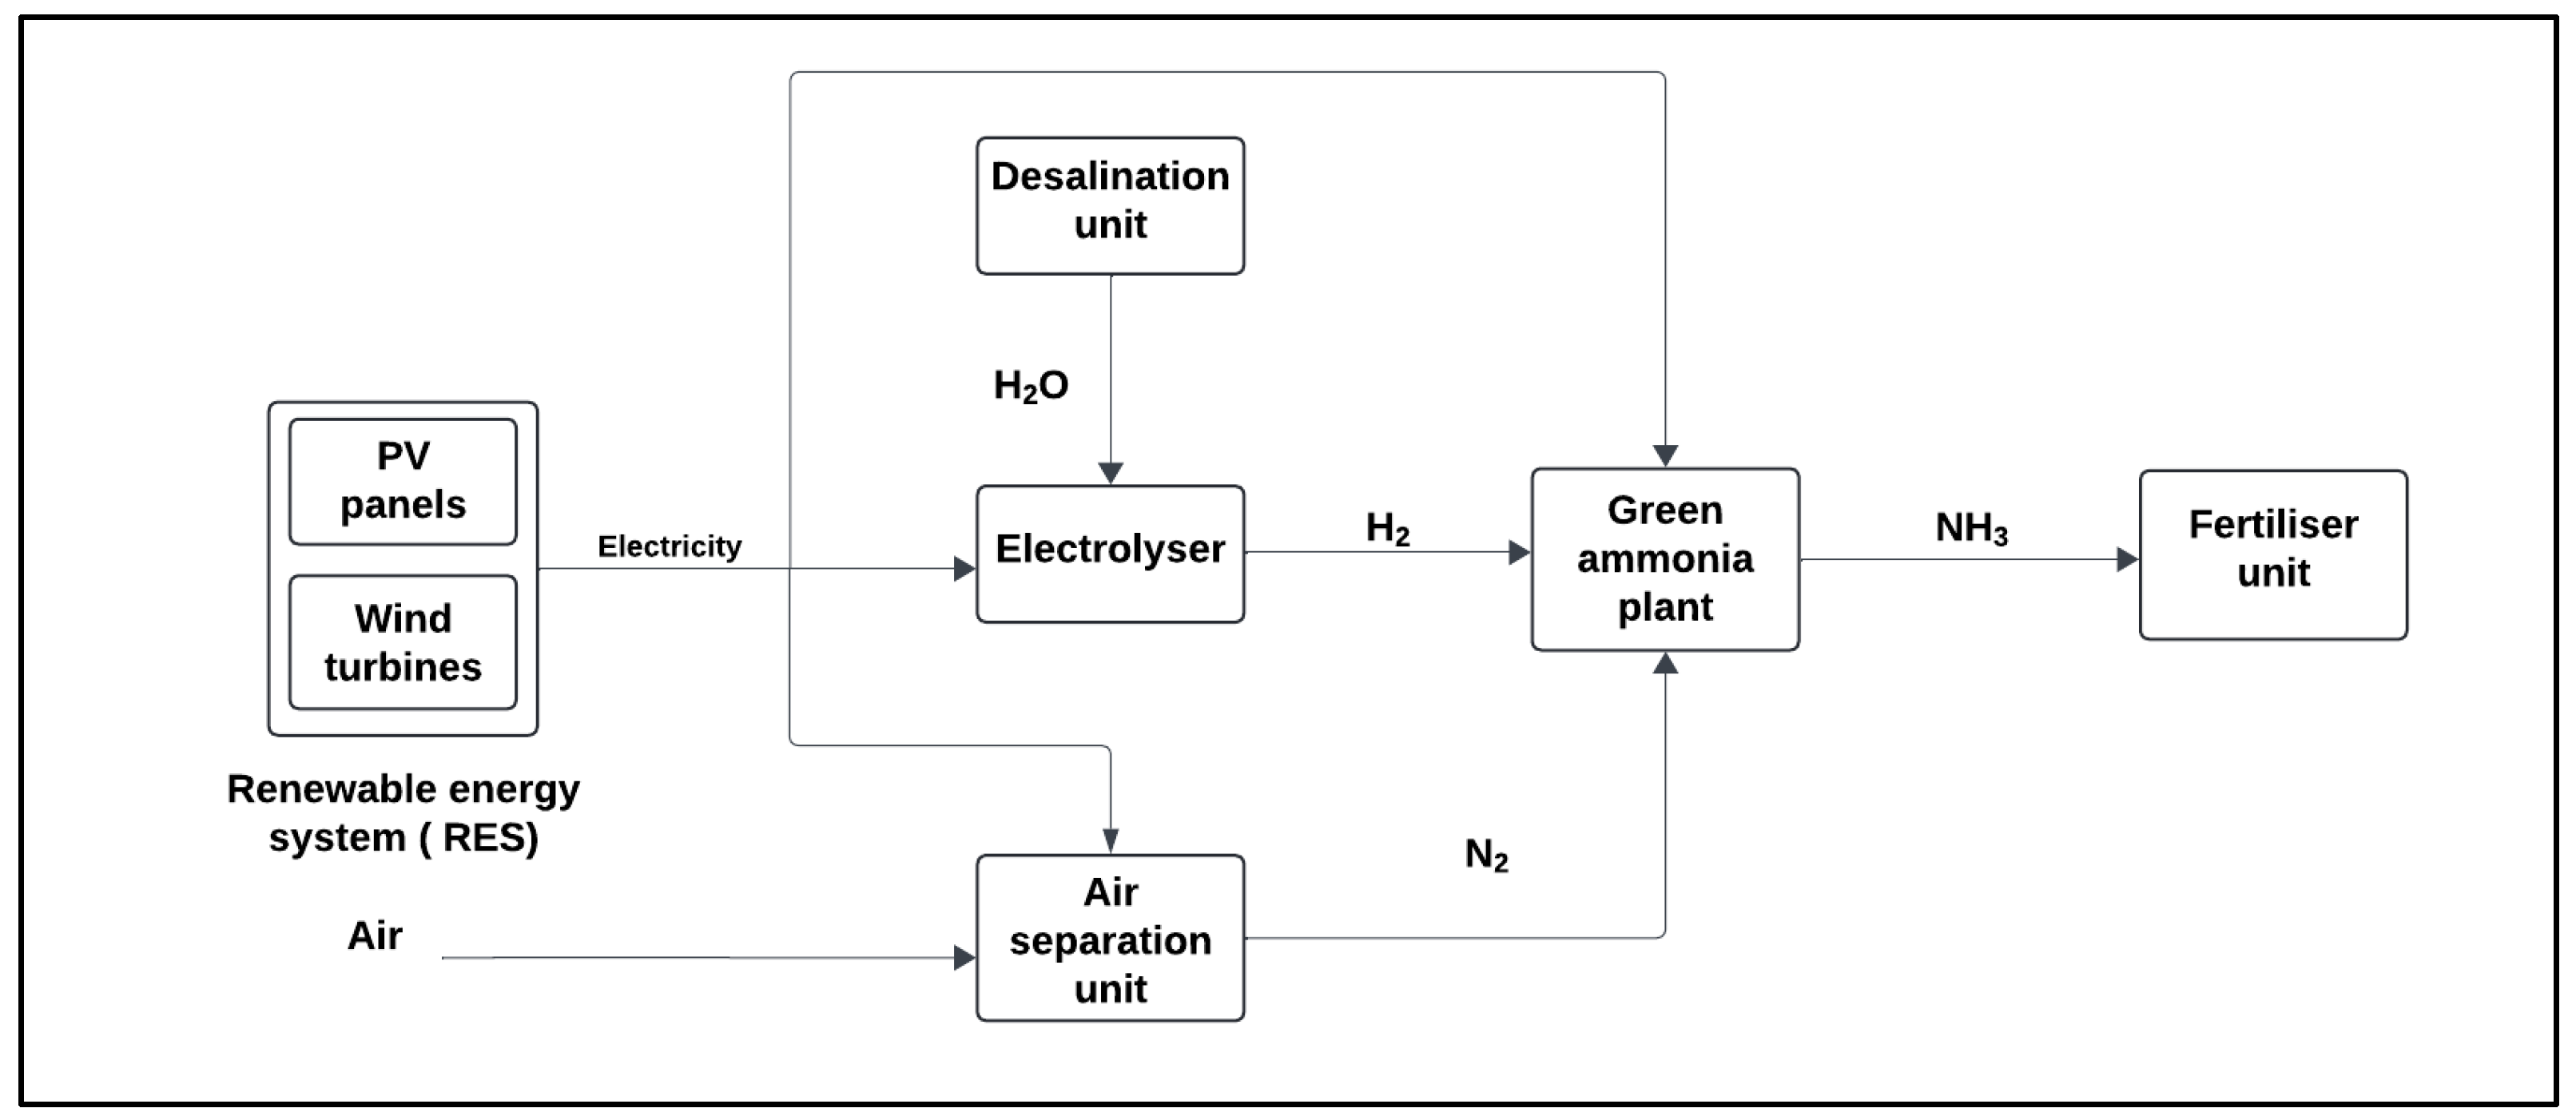
The study’s approach is divided into four major sections. In the first stage, a land suitability analysis will be carried out. The most promising locations for ammonia project installation will be identified using the GIS-AHP method. The main objective is to reach the optimal decision by considering and assessing eight relevant criteria. Once the most suitable locations are selected, a simulation for a pilot plant producing 1500 t/year of ammonia will be carried out using Hybrid Optimization of Multiple Electric Renewables (HOMER) software to determine the optimal configuration of the hybrid system. Finally, an economic assessment will be carried out to estimate the levelized cost of ammonia (LCOA).

2. Materials and Methods

2.1. Case Study Scenario

To maintain a stable electricity supply for the Haber–Bosch (HB) process and ensure continuous ammonia production, the use of both solar and wind energy sources is planned. To reduce costs, all green ammonia production facilities will be located at the same site, avoiding the expensive transport of electricity and hydrogen. Although hydrogen transport is cheaper than electricity over long distances, it still represents a significant cost, especially considering the complexities of pipeline transport [52,53,54,55]. Conversely, ammonia can be easily transported in liquified form at an affordable cost. All facilities for green ammonia production, including desalination, hydrogen, and ammonia production plants, as well as the power generation system (photovoltaic plants and wind farms), will be situated at the location identified in this study. The liquified ammonia is stored, transported to Jorf Lasfar, and then supplied to the fertilizer plant. The considered scenario is depicted in Figure 1.

2.2. Land Suitability Analysis

Using the aforementioned GIS-AHP approach, the land suitability analysis will be carried out. AHP is a structured MCDM technique designed to assist decision-makers in resolving challenging problems that involve several criteria. In the current study, the method is selected due to its structured approach and ability to ensure logical consistency in decision-making. It is extensively used in the design and implementation of renewable energy projects. Given that the criteria evaluated do not have equal weight in affecting the selection of potential wind farm and PV plant locations, the AHP method is utilized to allocate suitable weights to the criterion based on its corresponding importance [56].
The following subsections provide a detailed description of the criteria considered and the AHP approach, constraints, and sub-criteria required for mapping and GIS processing.

2.2.1. Criteria Description

To solve the decision-making problem, eight criteria are proposed for this study. The selection is carefully chosen based on relevant studies carried out, along with consulting a wide range of renewable energy experts. Table 1 summarizes the criteria selected. It should be noted that the two specific assessment parameters (C4 and C8) are considered based on the specific scope of the study and to account for Morocco’s specific case. The following subsections present a description of the different criteria suggested and their importance in the study framework.
Wind speed. In assessing a site’s suitability for green hydrogen production from hybrid solar wind or only wind sources, the presence of wind power potential is an essential criterion. Wind speed is a significant parameter since it plays an important part in evaluating the economic capacity of a wind turbine [40,57]. Various studies indicated that the annual average wind speed must exceed 6 m/s for an operational wind farm at a hub height of 135 m [50]. Wind speeds greater than 15 m/s, on the other hand, could cause turbine deterioration and require the use of complex aerodynamic force regulation devices [69]. Refs. [58,59] considered a minimum wind speed of 3 m/s.
PV power output (PVOUT). Solar irradiation is a significant variable influencing green hydrogen generation. Commonly, stronger solar irradiation is directly related to increased hydrogen and ammonia production rates.
Proximity to coastline and roads. The presence and the closeness to a water source are fundamental for areas hosting green hydrogen plants. In the present study, the unit has to be close to the coastline for the water desalination process. Indeed, transporting water over long distances poses several challenges, including technical issues related to pumping stations that usually require regular maintenance, high energy consumption, corrosion issues, etc. [70,71]. Kotb et al. [72] considered that high suitability refers to a distance ranging from 0.1 to 5 km, and distances over 40 km from the coastline refer to low suitability. The authors of [30,61] indicated that the distance must be less than 1 km for higher suitability. Another study has set a very restricted range, considering distances less than 0.1 km as high suitable and distances over 2.5 km as low [62]. Alternatively, a recent study focusing on a suitability analysis of hydrogen plants in Morocco based on CSP/PV power plants has set a larger spectrum of distances, considering that distances less than 20 km are highly suitable, whereas distances exceeding 50 km refer to low suitability [51]. Moreover, the proximity to roads remains a critical criterion in the implementation of the green ammonia production unit since facilities can be maintained more easily and effectively through convenient road access. Using the current road infrastructure minimizes the need for new infrastructures, which can mitigate the environmental impact and the disturbance of the surrounding area [73].
Proximity to fertilizer unit. This criterion is incorporated based on the scope of the study. The ammonia produced will be used locally for fertilizer production. In this regard, it will be shipped to the existing fertilizer unit once produced. Thus, the proximity of the ammonia production plant to the fertilizer unit holds high importance to avoid long-distance transportation, which can cause many issues related to security, high costs, etc.
Slope. The terrain slope is considered one of the main factors in the operation and installation of wind turbines and PV panels. As the slope increases, so does the cost of constructing a wind farm. Consequently, several studies suggest a range of 10–30% [43,74,75]. Sites with slight slopes are more strongly recommended [76]. For installing solar-powered hydrogen production plants, flat land is required [49,77]. High slopes aggravate the shading of PV panels, resulting in lower electricity production, as they act as a barrier to sunlight.
Elevation. According to previous studies, an elevation of 2200 m was reported as the highest value for wind power plants in Iran and Thailand [67]. Lands with high elevation (>1500–2200 m) must not be considered [30]. High elevations increase the machinery transportation and transmission line costs [78,79].
Wind irregularity. Wind speed irregularity represents the intermittency of this renewable energy. The most suitable sites for wind potential must have a regular wind speed over the year. Therefore, intermittency management will be reduced. The analysis of wind irregularity can be based on the assessment of statistical parameters (variance and standard deviation). A high standard deviation stands for a widely dispersed value (high intermittency).
With the criteria identified in this study, it is crucial to assess the relative importance of each criterion. The literature defines nine-point scale measurements, resulting in a pairwise comparison matrix (1) [80,81,82,83]. The scale is defined from 1 (referring to equal importance) to 9 (referring to extreme importance), as shown in Table 2.
P = p 11 p 1 m p m 1 p m m
m stands for the number of criteria (m = 7).
Table 2. Fundamental scale measurement [84].
ScaleImportance DegreeReciprocals 1
1Equal importance1
3Moderate importance1/3
5Strong importance1/5
7Very strong importance1/7
9Extreme importance1/9
2,4,6,8Intermediate values1/2; 1/4; 1/6; 1/8
1 When comparing activity y to activity x, if activity x is allocated one of the aforementioned activities, then activity y has the reciprocal value.
In this regard, an exhaustive survey was carried out to assess the relative importance of each criterion. Based on experts’ opinions (scientists and university professors, green hydrogen experts, and organizations’ members: Agence Marocaine pour l’efficacité énergétique (AMEE)), the survey’s outcomes are presented in Table 3. A detailed examination of the table reveals that each criterion carries a unique level of importance compared to the second criterion. This method of ranking the importance of criteria through judgments is well established and has been widely used in many previous studies.
The pairwise comparison matrix should be normalized by summing all the elements in each column. Then, each element in the matrix is divided by the sum of its respective columns. This process transforms the matrix into a normalized matrix, which is then used to calculate the corresponding weights for each criterion. The normalized matrix is as follows:
A = p 11 i = 1 m p i 1 p 1 m i = 1 m p i m p m 1 i = 1 m p i 1 p m m i = 1 m p i m
Then, criteria weights are determined by averaging the values in each row of the normalized matrix. The final step of the AHP method is to assess the consistency of the comparisons, enhancing the reliability and validity of the approach. This consistency is determined by calculating the degree of consistency (S) defined in Equation (3) [85]. SI is the Coherence Index, SA is the Random Index determined using Equations (4) and (5) [86]. λmax is the eigenvalue of the pairwise comparison matrix. When the degree of consistency (S) is less than 10%, the consistency level of the AHP matrix is considered adequate. Otherwise, the AHP procedure must be repeated, with the judgments revised. The flowchart for the AHP method is depicted in Figure 2.
S = S I S A
S I = λ max m m 1
S A = 1.98 ( m 1 ) m
In the current study, wind irregularity (C8) is not considered in the first prioritization based on ArcGIS since the wind irregularity map is not available. Therefore, once the most suitable sites are identified considering the seven criteria indicated in Table 1, a second prioritization is addressed, considering the wind irregularity as a criterion. The analysis of wind irregularity is based on the assessment of the standard deviation as a parameter. It is a dimensionless parameter standing for how spread out the values in a data set are around the mean (average) of the data set.
Based on these calculations, the corresponding weights for each criterion are calculated. The following step entails the acquisition and processing of data for each criterion. These data are processed and prepared for the land suitability analysis, carried out using ArcGIS software Arcmap 10.8.2.

2.2.2. Data Acquisition

The data used in ArcGIS software include maps for processing and analysis. These maps provide spatial data on the corresponding criteria required for assessing land suitability. ArcGIS software facilitates the efficient manipulation of these geographic datasets through numerous tools available within the software. All geo-information data are available online. Data sources are provided in Table 4 for comprehensive and accurate assessments. The data used in this study are sourced from highly reputable organizations, ensuring a strong foundation for the analysis. High-resolution maps are used for greater precision. However, some limitations related to the climate data must be considered. The solar and wind climate data generated from the Global Solar Atlas and Wind Global Atlas may not fully reflect recent climatic trends.

2.2.3. Data Processing

Conducting spatial analysis in GIS mapping requires a consideration of some restrictions, to exclude areas where the plant implementation is unsuitable. The literature review has revealed that areas presenting an average wind speed of less than 3 m/s are excluded. Lands with high elevations and slopes exceeding 2200 m and 15°, respectively, are excluded. The minimum PV power output is 3.5 kWh/kWp. Regarding land coverage, lands other than bare ground and rangelands are considered unsuitable. Exclusion areas considered in the current study are well defined in Table 5, with the corresponding references.
It is also necessary to define a set of sub-criteria for each criterion divided into 5 classes. Commonly, each class represents a suitability level ranging from very high to very low. All sub-criteria are defined based on a rigorous literature review, except for the proximity to the fertilizer unit, which has been defined based on experts’ opinions. Suitability classes are defined in Table 6.
The acquired maps require processing and preparation for land suitability analysis in ArcGIS. First, unsuitable lands were excluded, resulting in a single constraints map for further analysis. This constraints map is generated in ArcGIS using the “Mosaic To New Raster (Data Management)” tool, which integrates various layers into a single map based on the constraints outlined in Table 5. Then, the data for analysis are classified into sub-criteria, prioritizing some values over others within the same criterion. A classified map is generated for each criterion using the suitability classes defined in Table 3. The last step involved is conducting a weighted overlay analysis. Using the “Weighted Overlay (Spatial analysis)” technique, each suitability evaluation map is assigned a specific weight based on AHP results, and multiple reclassified geographic raster data layers were blended to produce the final suitability score for the study. This is according to the five suitability classes previously defined in Section 2.2.2: very high, high, moderate, low, and very low. After obtaining the results from the weighted overlay process, the resulting map is merged with the previously processed constraints map. This merging process is performed using the “Mosaic To New Raster (Data Management)” tool. Accordingly, the final map illustrating the land suitability for ammonia production from a hybrid energy system in Morocco is generated.

2.3. Determination of the LCOH and LCOA

Once the suitable locations for ammonia production are generated from the land suitability analysis, a simulation is carried out to determine the least LCOH and LCOA. The least LCOH that can be achieved in these locations is determined using HOMER Pro software 3.16.2. By assessing various configurations, an optimal configuration that minimizes LCOH can be deduced. HOMER is a powerful tool designed for optimizing energy systems, including those involved in hydrogen production. This tool simplifies project analysis by incorporating a variety of factors such as system sizing, location-specific meteorological data (e.g., solar radiation, wind speed), and economic parameters (e.g., capital costs, operation and maintenance costs, replacement costs, discount rates, inflation rates). This feature allows for a complete project viability analysis, with a special emphasis on the design phase.
Since HOMER does not address the ammonia value chain, the LCOA is calculated based on the optimal system configuration derived from the simulation, and using Equation (6) below:
L C O A = t = 0 n C a p E x + O P E X ( 1 + r ) t t = 0 n M N H 3 ( 1 + r ) t
M N H 3 is the amount of ammonia produced (t/year). The CapEx and OPEX are the capital and operational costs (USD/year) of the system, respectively. (n) stands for the project lifetime (25 years), and (r) is the weighted average cost of capital (WACC) fixed at 7% [93]. Capital costs and operational expenses considered are detailed in the following section.
Establishing a detailed techno-economic model requires following many methodical design phases, which are presented in the following sections.

2.3.1. System Design

The present section outlines the proposed system to supply the hydrogen feedstock for the ammonia production unit (1500 t/year). The main system devices are the renewable energy plant (wind and solar), the electrolyzer, and the hydrogen storage system. A PEM electrolyzer is selected for hydrogen production, with an efficiency ( η el) of 75% [94].
The ammonia production rate is fixed at 1500 t/year. The amount of hydrogen required is determined by referring to the ammonia synthesis reaction (7). A ratio of 5.632 kg-NH3/kg-H2 is considered [95,96,97]. To include losses, a supplement of 20% is considered. Thus, the resulting hydrogen load is 875 kg/day, which is then introduced to the model for simulation.
NH3 Synthesis: N2 + 3H2 → 2NH3
The objective function set is to minimize the levelized cost of hydrogen (LCOH). To maintain consistent production, the maximum unmet hydrogen load (%) is adjusted to 0% to ensure that all hourly hydrogen loads are met. The minimum load ratio of the electrolyzer is fixed at 0% since the PEM electrolyzer technology can accommodate variations in load [98]. The capacity shortage is set to 0% as the objective of this study is to meet a fixed hydrogen load. Moreover, the project lifetime is 25 years [99]. The nominal interest rate (i’) is fixed at 8%. The inflation rate (f) is assumed to be 6.3% (2023) [100]. The solar and wind energy statistics required for the simulation are imported using the NASA Prediction of Worldwide Energy Resource (Power) database. Table 7 presents all the required economic data for the simulation.
Once the optimal configuration of the green hydrogen system is determined, the optimal capacities for both the renewable energy system and the electrolyzer will be utilized to calculate the LCOA. The calculation considers the specific costs of each component of the unit. The green ammonia production unit includes the following:
The green hydrogen production unit is detailed in Table 7, along with the water desalination unit (WDU). The cost of water treatment was not included in the LCOH calculation, as the software does not consider water treatment. However, this cost will be included in the LCOA calculation. The investment cost of a water desalination unit fluctuates between 300 and 2500 USD/m3·day, depending mainly on the technology deployed [110]. An investment cost of 1400 USD/m3·day is considered. The operating expenses (OPEX) are obtained considering 2.5% of the specific CapEx [97].
Air separation unit (ASU). The air separation unit is utilized to separate air components and to feed the resulting nitrogen to the ammonia production loop. The capital cost is about 110 USD/tN2, and the operational cost is about 1.6 USD/kW·year [111,112].
Ammonia synthesis plant. In an ammonia synthesis plant, hydrogen and nitrogen are combined and then fed into the synthesis loop. The corresponding CapEx is about 712 USD/t-NH3 [97]. The stack lifetime in the catalytic reactor is 10 years, and 30 years for the rest of the components [111,113]. The replacement cost of the stack is assumed to be 30% of the total CapEx of the synthesis loop. The ammonia synthesis loop OPEX is 1.5% of its corresponding CapEx [111,112].
Ammonia storage tank and transport. The corresponding CapEx is 708 USD/t-NH3 [97]. The OPEX is 1% of its corresponding CapEx [111,112]. In the current study, the transportation cost of liquid ammonia is considered. According to [5], the transportation cost is about 6.94 USD/t.

2.3.2. Sensitivity Analysis

After determining the optimal location’s findings, the outperforming system is subjected to a sensitivity analysis on various inputs. First, a detailed analysis of the PEM electrolyzer is conducted, with the variation in technical and financial parameters. On the technical side, the impact of efficiency improvements is investigated, with efficiency levels increasing from 75% to 80% and 85%. Assumptions are made based on technology advancements that will result in improved electrolyzer efficiency. Commonly, it is widely predicted that efficiency will rise to 80–85% in the coming decade as technology evolves and R&D activities result in better materials. Conversely, in the financial parameter analysis, the technical inputs remained unchanged. A second sensitivity analysis is performed considering the decrease in the electrolyzer cost (capital and replacement cost) in the near and sustainable future. According to [4], the electrolyzer capital cost can reach 500 USD/kW and 200 USD/kW in the near and sustainable future, a decrease of 30% and 75%, respectively.

3. Results and Discussion

This section presents the study’s funding. Three main aspects are examined, incorporating the AHP results for combining solar PV and wind turbines (WT). These outcomes are presented and analyzed collectively, as are the suitability maps for hosting ammonia plants powered by WT and PV technologies. Then, following the identification of “highly suitable” locations for hosting wind and PV units in an ammonia production context, simulation results are presented: optimal configuration for WT and PV plants, LCOH, and LCOA.

3.1. AHP Results

Referring to the pairwise comparison matrix (P) in Table 3 and using (2) defined earlier in Section 2.2.3, the resulting normalized matrix with the corresponding weights for each criterion is presented in Table 8. Wind speed (C1) and PVOUT (C2) are the most significant criteria among the remaining ones with the highest weight. This is obvious since the main fuel for an ammonia production plant is solar irradiance and wind speed. As the solar irradiation and wind speed increase, so does the potential for higher ammonia production. The findings indicate a consistency ratio (S) of 6.19% less than 10%, which makes the pairwise comparison results acceptable and consistent. The value indicates that experts’ judgments made in the pairwise comparison matrix are coherent and reliable. Otherwise, these judgments should be reviewed and revised until reaching a degree below 10%. Maintaining a degree of consistency below 10% in the AHP method is crucial to ensuring the reliability and validity of the decision-making process.

3.2. Constraints and Decision Criteria Maps

After examining the obtained maps during the data preparation phase, a map representing the geographical data for all criteria considered is generated. For an effective map interpretation, lands colored in red present very high suitability. Orange and yellow, respectively, stand for high and moderate suitability areas. The two remaining colors stand for low-to-very-low suitability areas. The constraints map is generated based on constraints illustrated in Table 3. The unsuitable areas represent approximately 33% of the total area of Morocco (Figure 3).
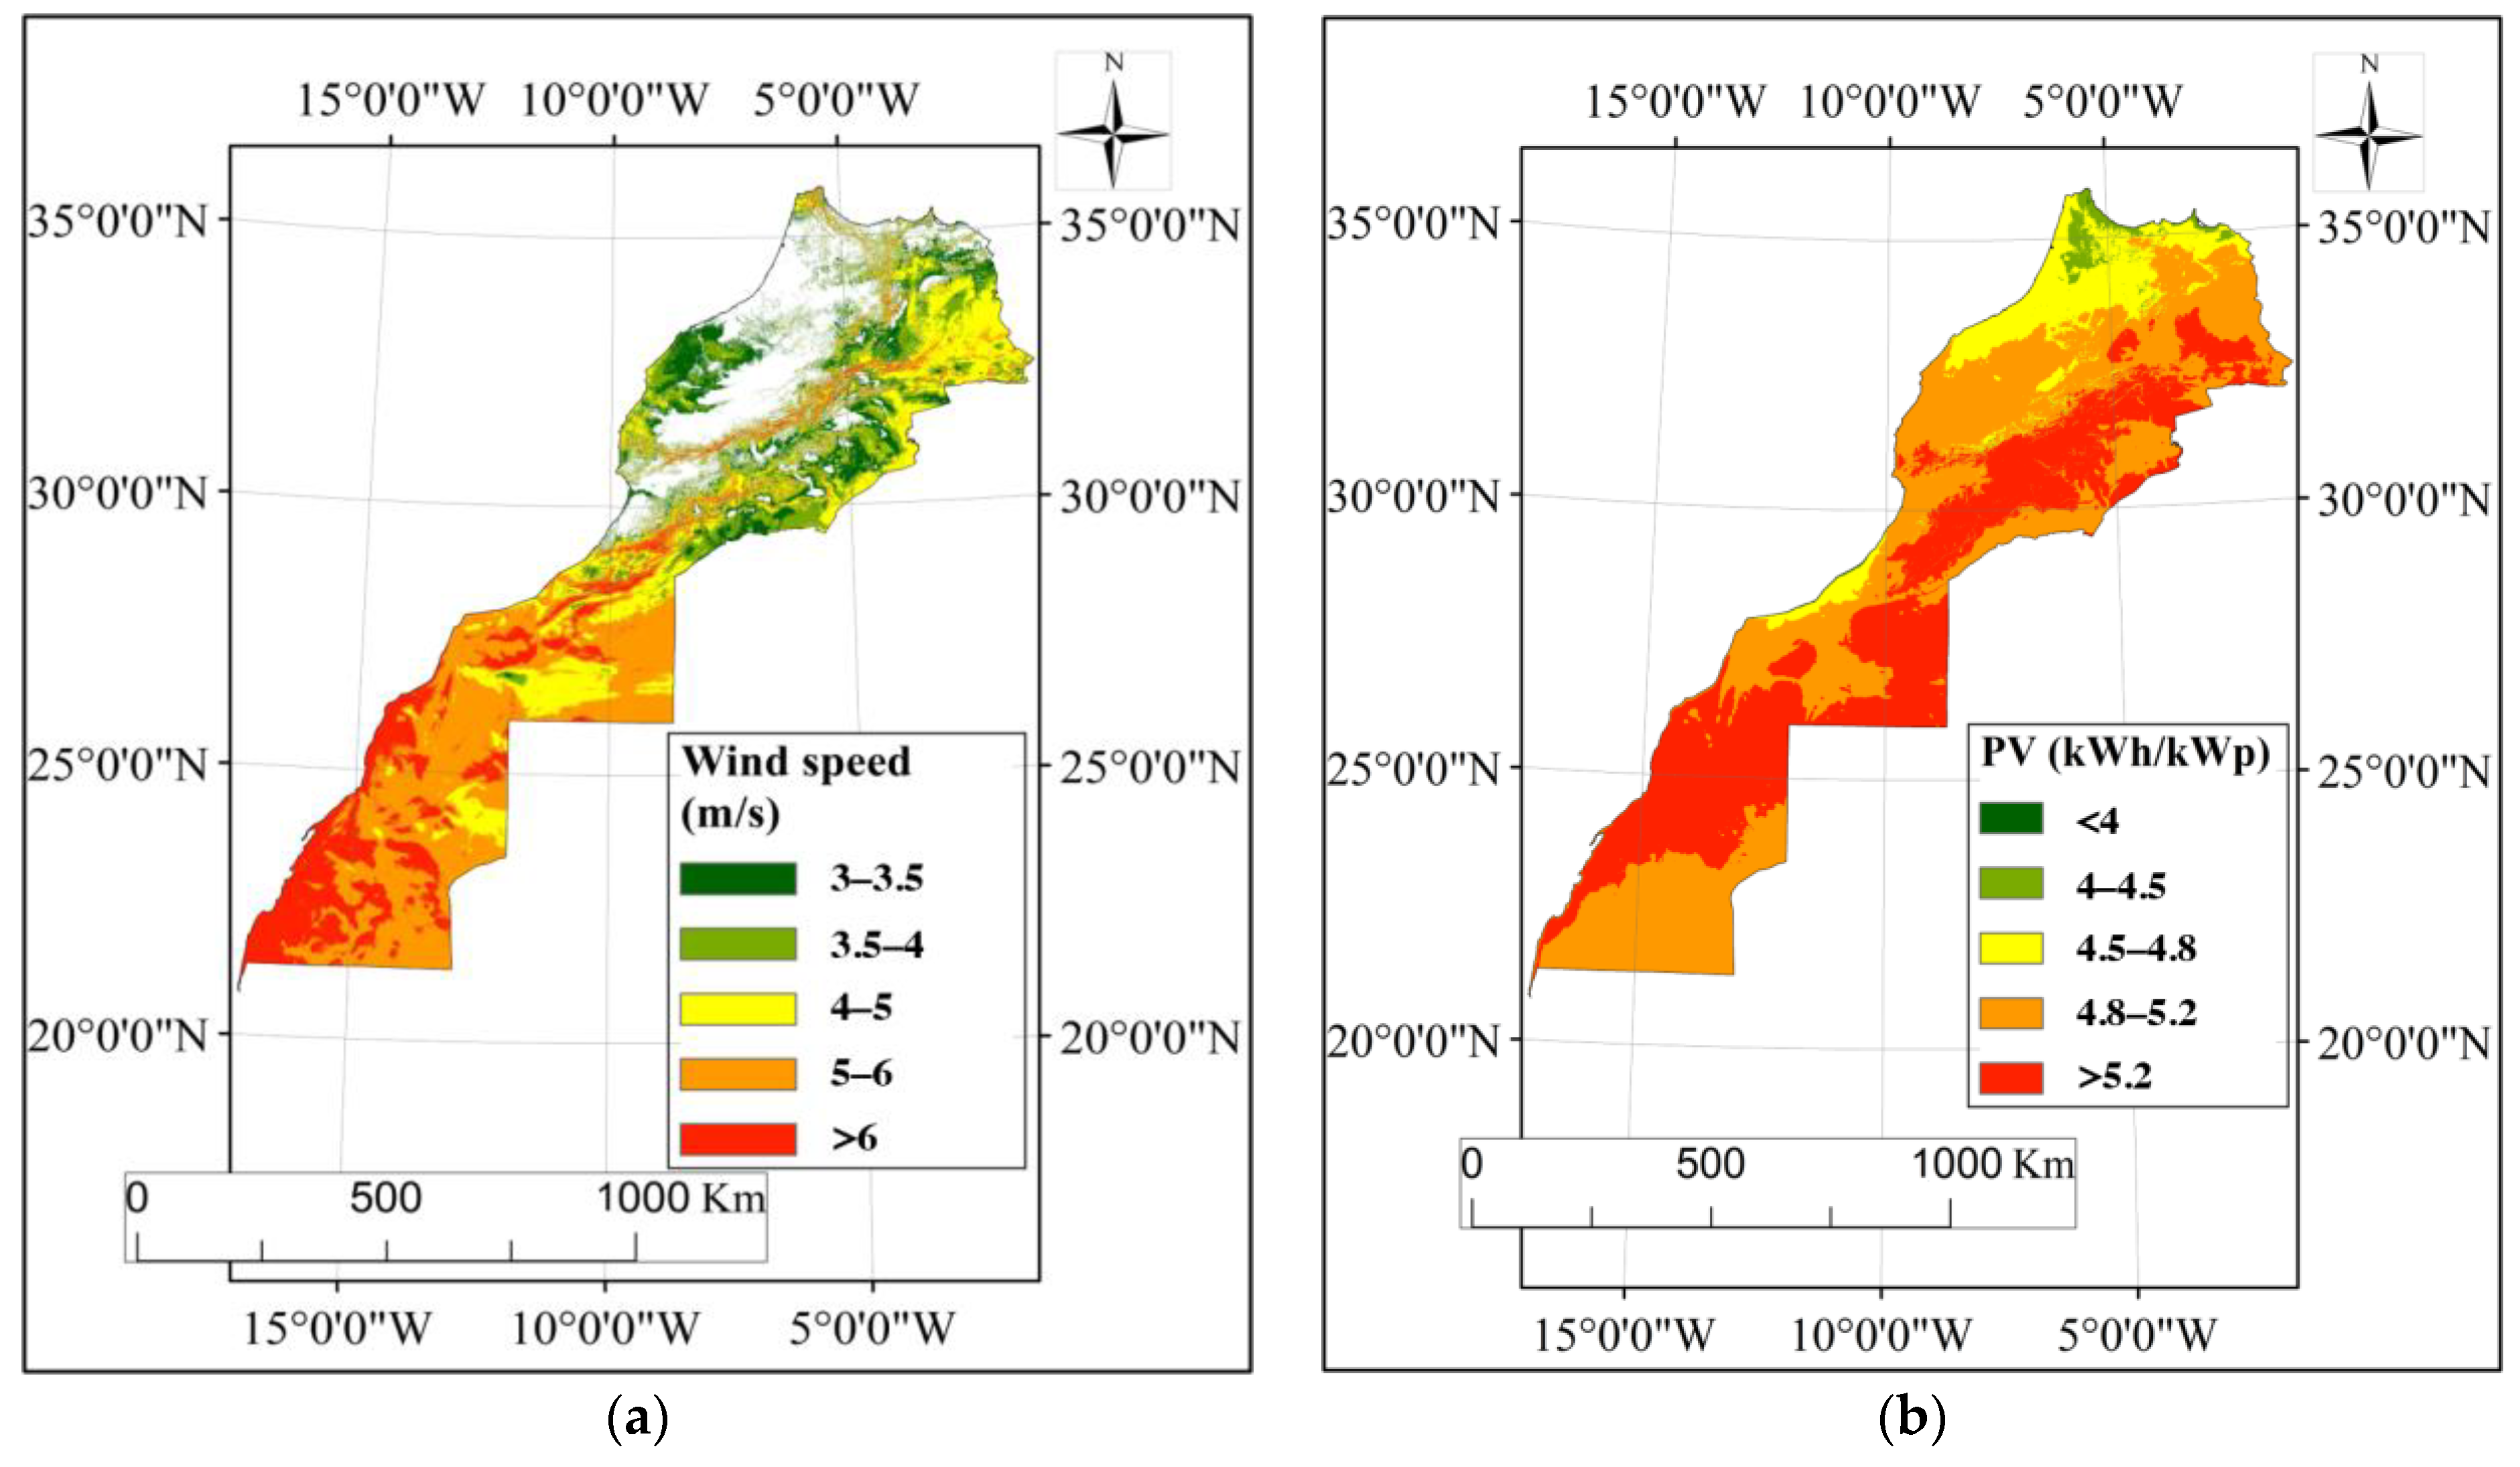
Wind speed presents a great influence on the selection of suitable wind farm locations. High wind speeds allow a quick rotation of the blades, thus generating more electricity. Nevertheless, wind speed evaluation criteria have been used to determine Morocco’s level of suitability for installing wind farms. According to the values of sub-criteria illustrated in Table 6, land classes are displayed under five suitability classes (very low, low, moderate, high, very high), referring to statistical data and the value’s frequency. Approximately 75% of the land area is suitable for wind farm construction, as depicted in Figure 4a (land colored red, orange, and yellow). In total, 18% of the land area is subject to extremely high wind speeds (>6 m/s), 35% experiences high wind speeds (5–6 m/s), and 22% experiences moderate wind speeds (4–5 m/s). For solar PV, Morocco presents a high PVOUT in all regions. In total, 98% of the land area exceeds 4.5 kWh/kWp. In total, 39% of the land area experiences extremely high PVOUT (>5.2 kWh/kWp), 48% experiences high PVOUT (4.8–5.2 kWh/kWp), and 11% experiences moderate PVOUT (4.5–4.8 kWh/kWp). Only 2% present a law/very low suitability (colored in green). The southeast regions are the most encouraging, offering high PVOUT that exceeds 5.2 kWh/kWp.
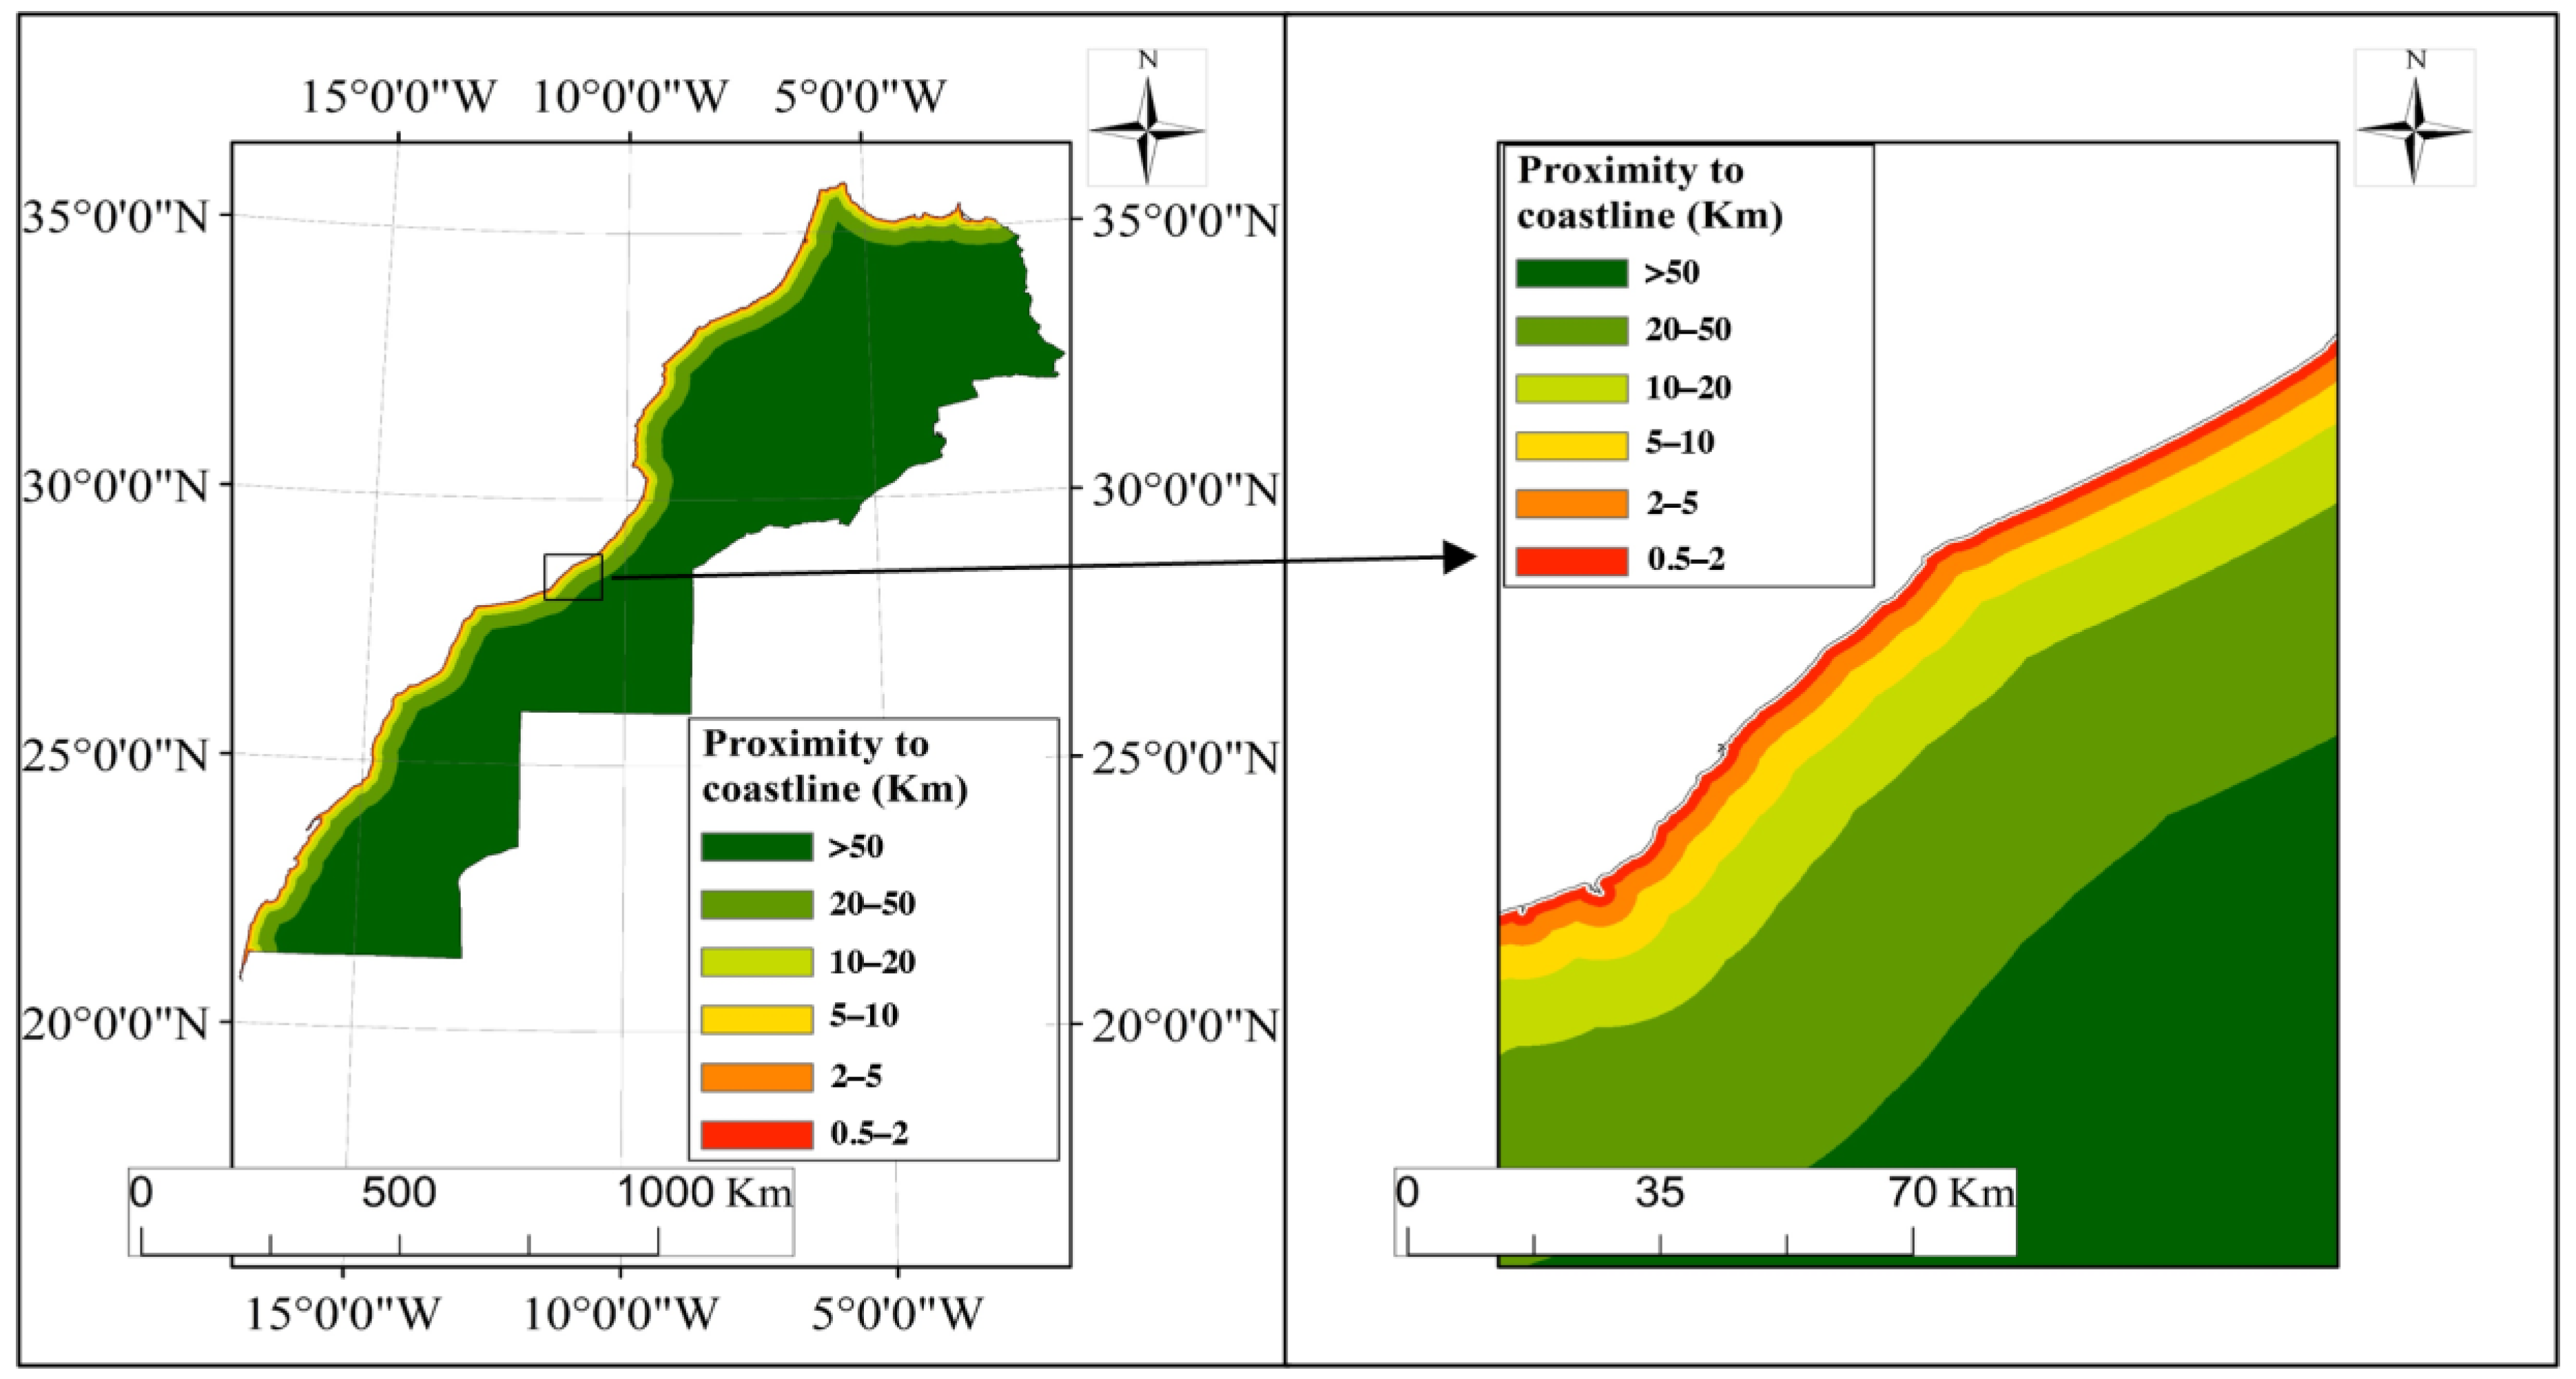
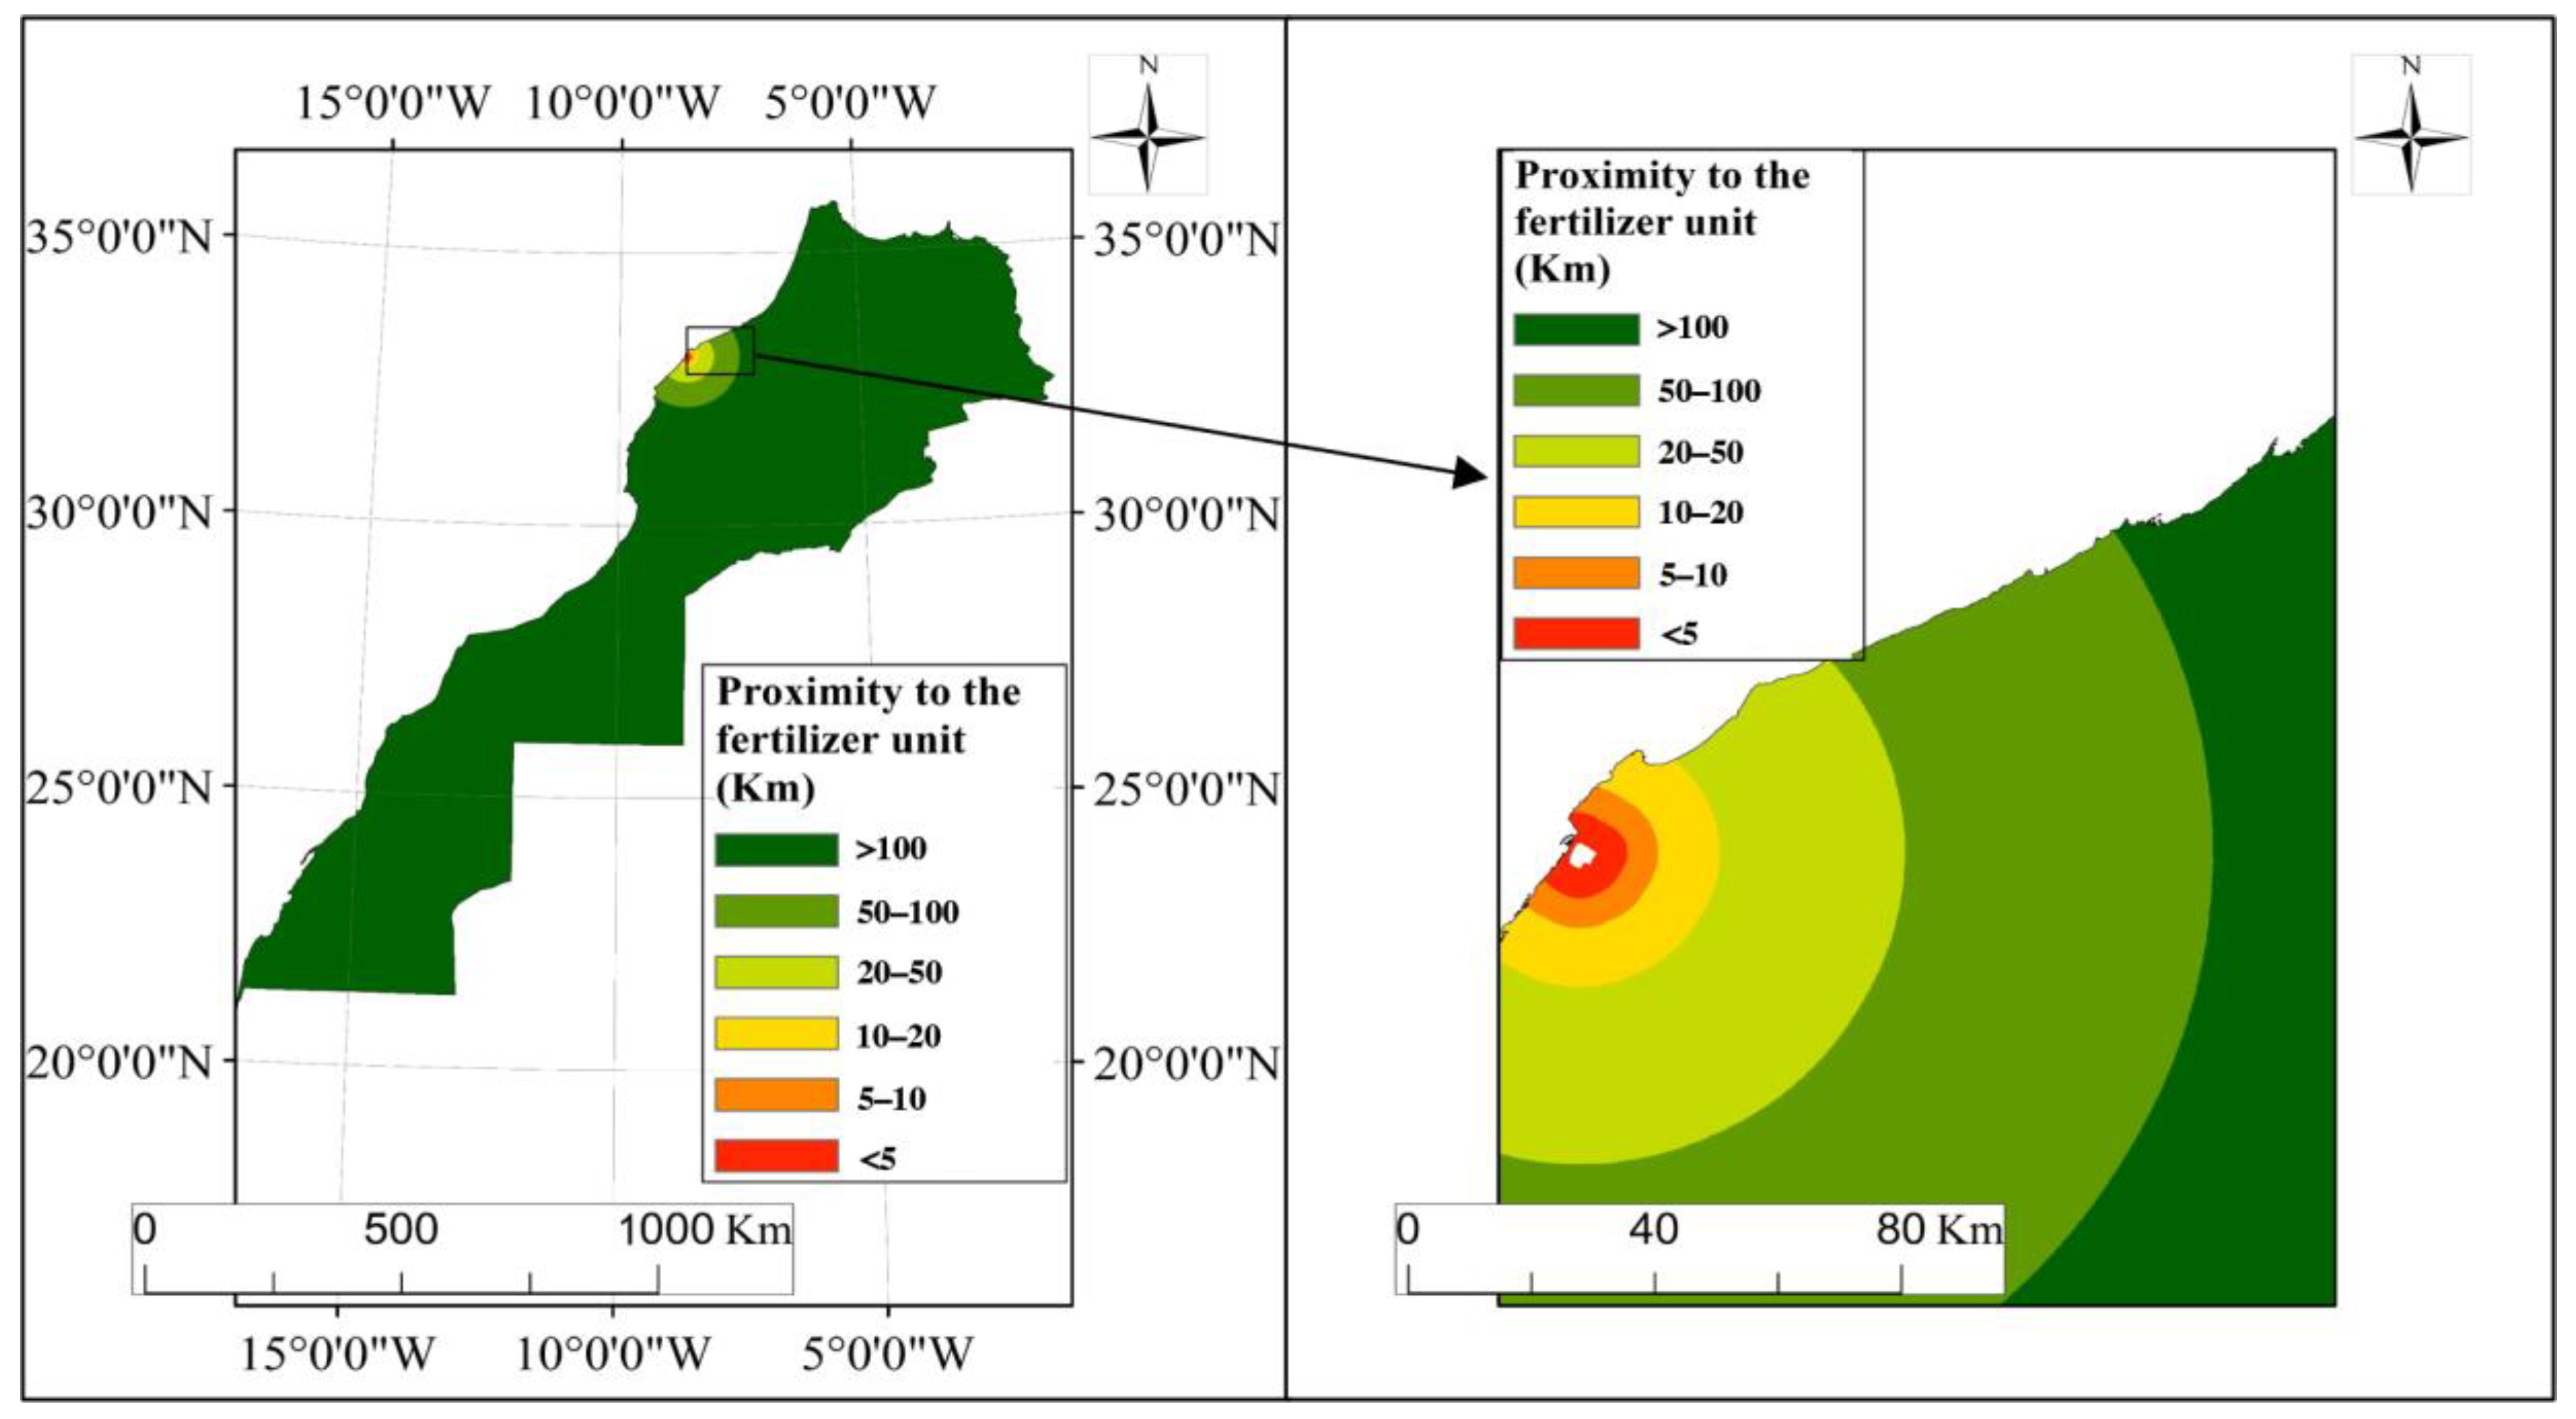
It is assumed in the current study that the electrolyzer will be fed with desalinated water, and the ammonia produced will be transported to the fertilizer plant. Thus, the proximity to the coastline as well as to the fertilizer unit remains important. Figure 5 and Figure 6 represent the map of suitability based on the proximity to the coastline and the fertilizer unit. It is important to underline once again that the distance between the ammonia unit and the main roads has a significant influence on the unit’s construction and operation. If it is too close to busy highway trucks, an unexpected accident will be highly likely to occur. However, if it is located a long distance away, the initial investment will be higher. The road map is depicted in Figure 7. It is noticed that Morocco’s road network is very restricted in the southern area compared to the north, which may be a challenge for establishing an ammonia-producing facility. However, as shown in Table 8, the weight related to proximity to roads is less important compared to other criteria, restricting its effect on the final land suitability map.
The elevation map depicted in Figure 8a shows a high elevation value exceeding 450 m for the majority of areas, accounting for 45% (lands colored in red, orange, and yellow). Even if highly elevated areas can improve the performance of both PV panels and wind turbines, the elevation should not exceed 2200 m. Indeed, the elevation impacts the cost, construction efficiency, and maintenance of the unit facilities. Higher elevation sites are difficult to access, increasing transportation costs for materials and labor. They often experience extreme weather conditions that require more robust construction practices. Access to maintenance operations is extremely challenging.
The slope map (Figure 8b) shows how almost all of Morocco’s land, accounting for 92% of the global area, presents a slope ranging between 6 and 15%. This can be considered moderately suitable for implementing the renewable energy system since the slope doesn’t exceed 15%. Otherwise, many issues related to construction and maintenance may occur. Elevated slopes require strong site preparation, which can considerably increase the initial construction costs. Sloped areas are more likely to experience erosion, construction efforts may be challenged and additional precautions may be needed. Maintenance activities can also be logistically challenging.

3.3. Land Suitability Map

The resulting map from the land suitability analysis (
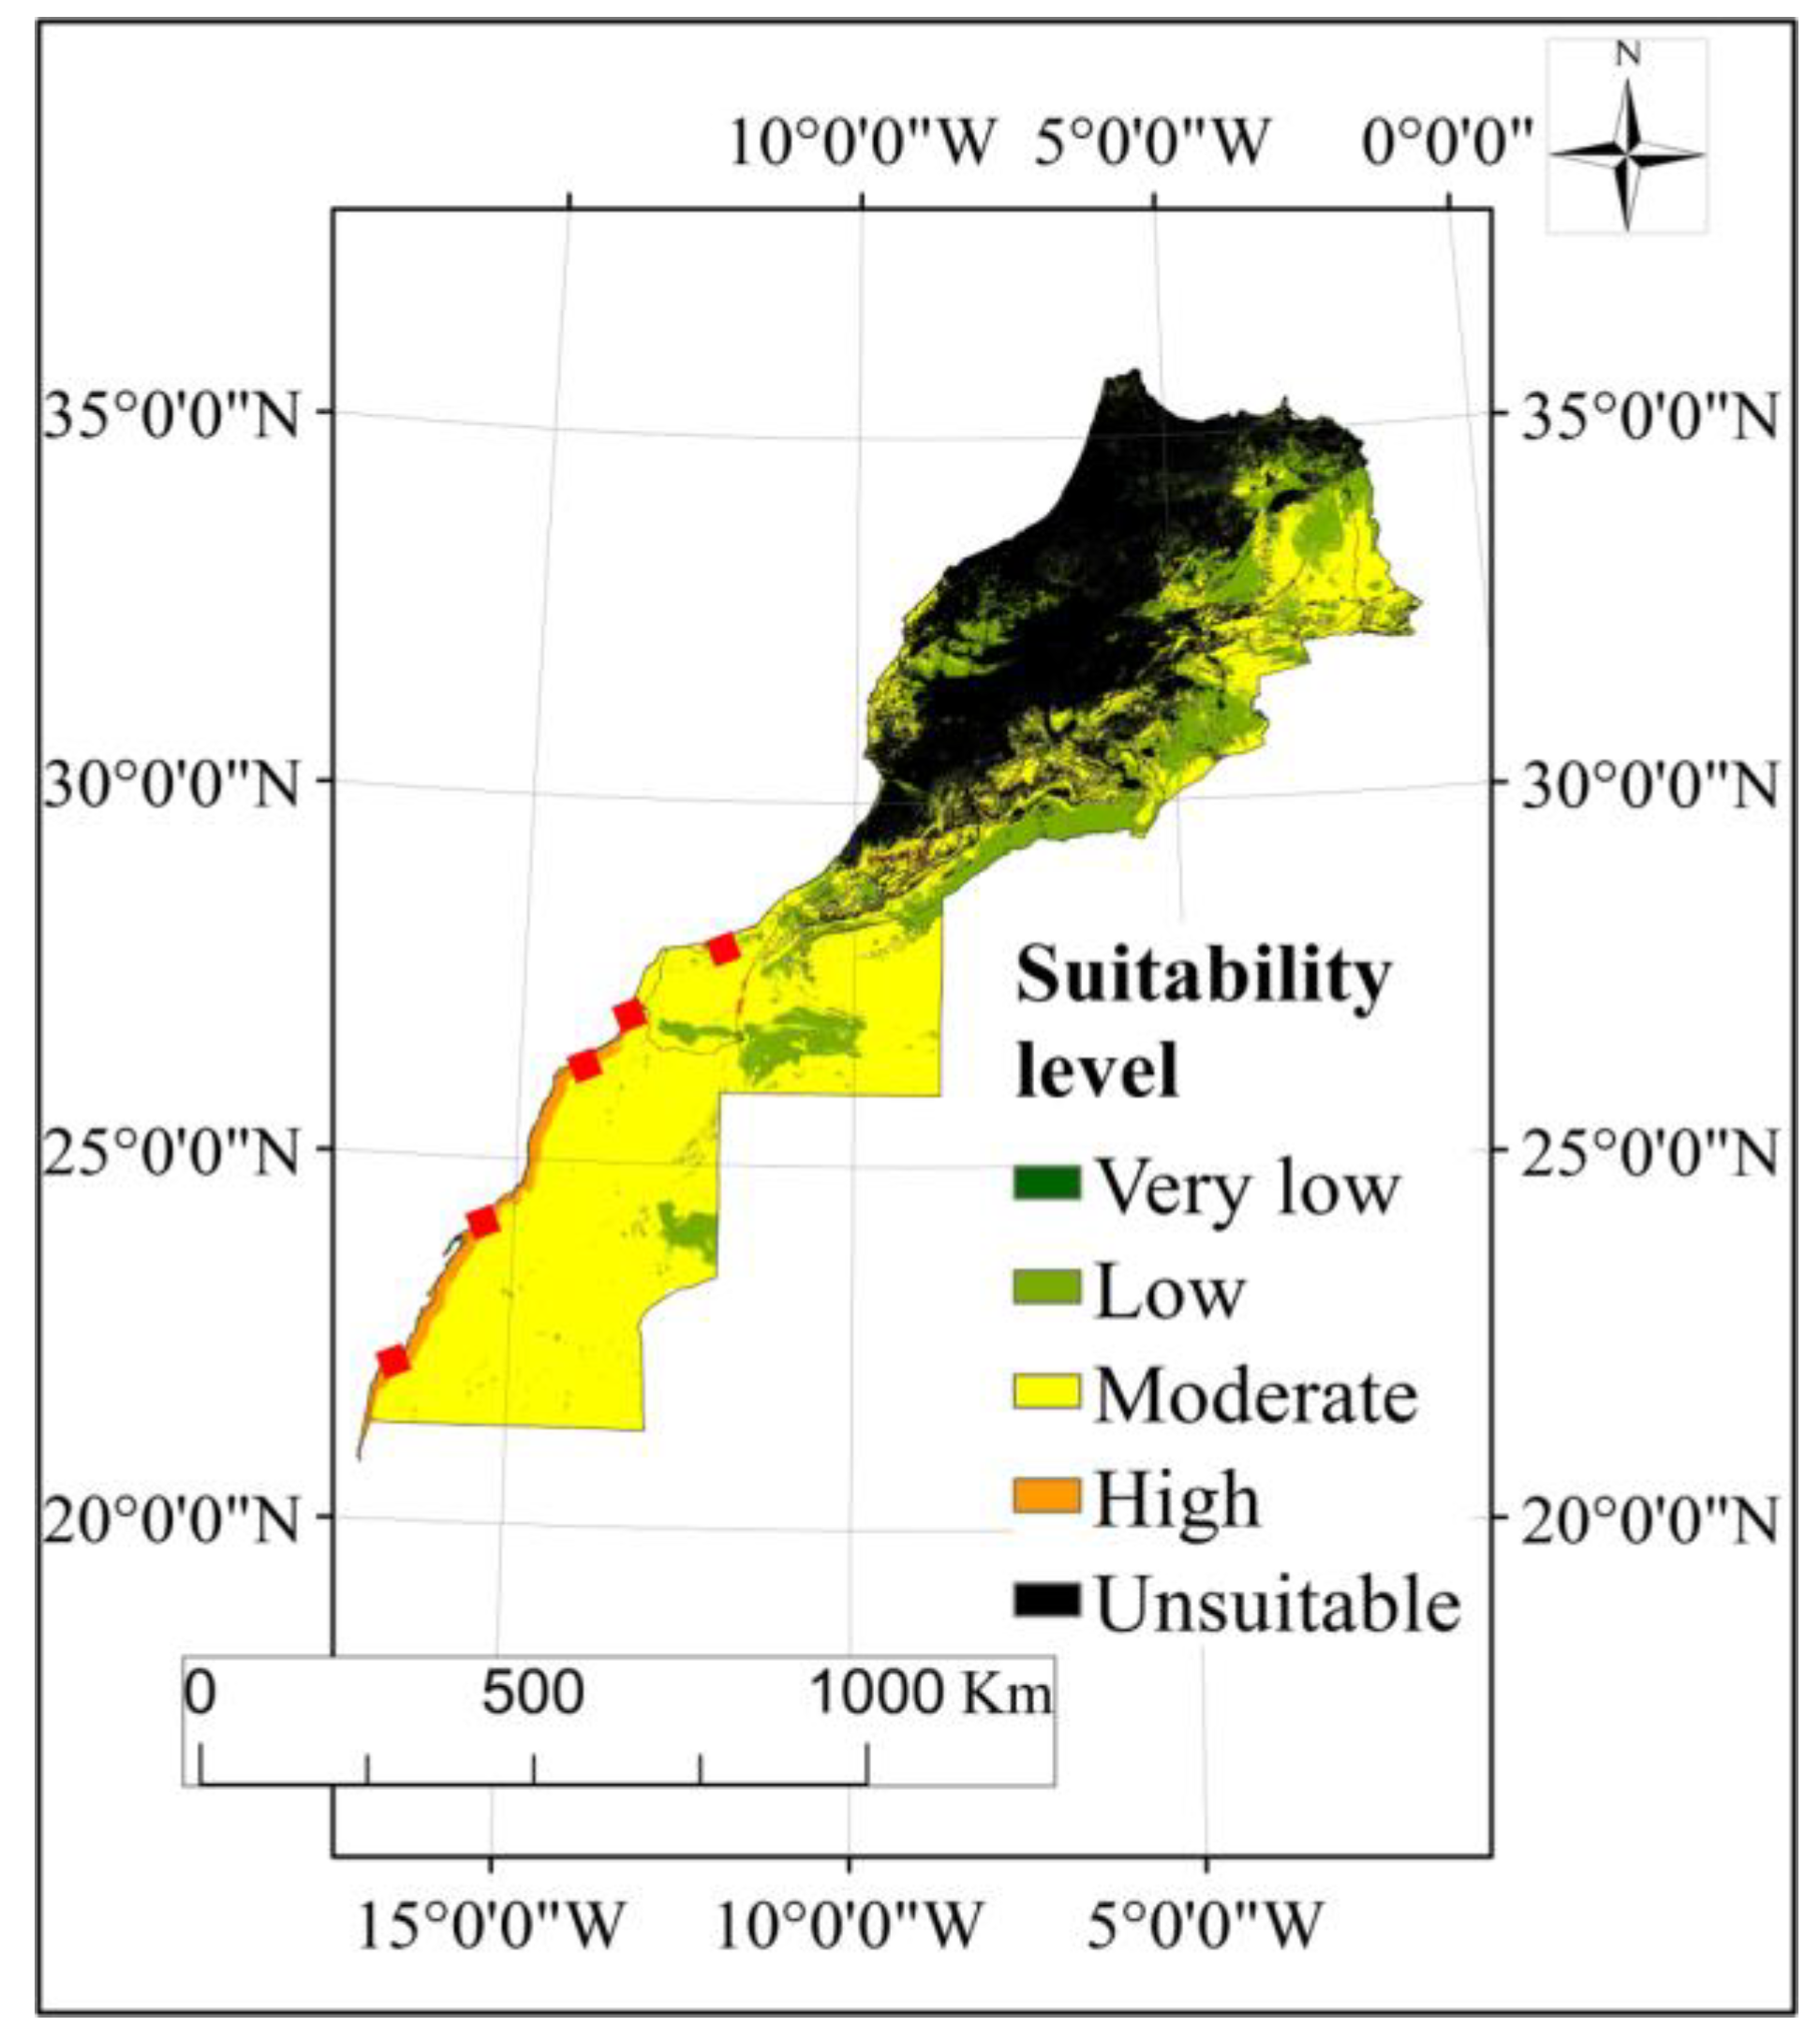
Figure 9) shows the most suitable areas for the construction of the green ammonia production plant. Table 9 also presents the numerical outcomes for each suitability class and the percentages of the total area related to each class. In total, 2.3% of the investigated land presents high suitability, 50% has moderate suitability, 15% has low suitability, and 33% is unsuitable. A high suitability level is noticed in the south. Dakhla, Laayoune, Boujdour, and Tarfaya have significant potential for a green ammonia production facility. However, it can be observed from the map that the high suitability class is very restricted and the unsuitable areas are predominant. This is because of the consideration of the proximity to the fertilizer unit and the coastline, which have also an important influence on the results. Considering these two criteria has restricted many areas even if they present high wind speeds and solar irradiation. In total, 98% of the land area is considered unsuitable because it presents a long distance from the fertilizer unit. The same goes for the proximity to the coastline; 82% of the land area is considered unsuitable.
Table 10 illustrates the most suitable lands selected across the Moroccan territory. Five sites are selected in high-suitability areas. These sites are highly favorable for ammonia production projects. 
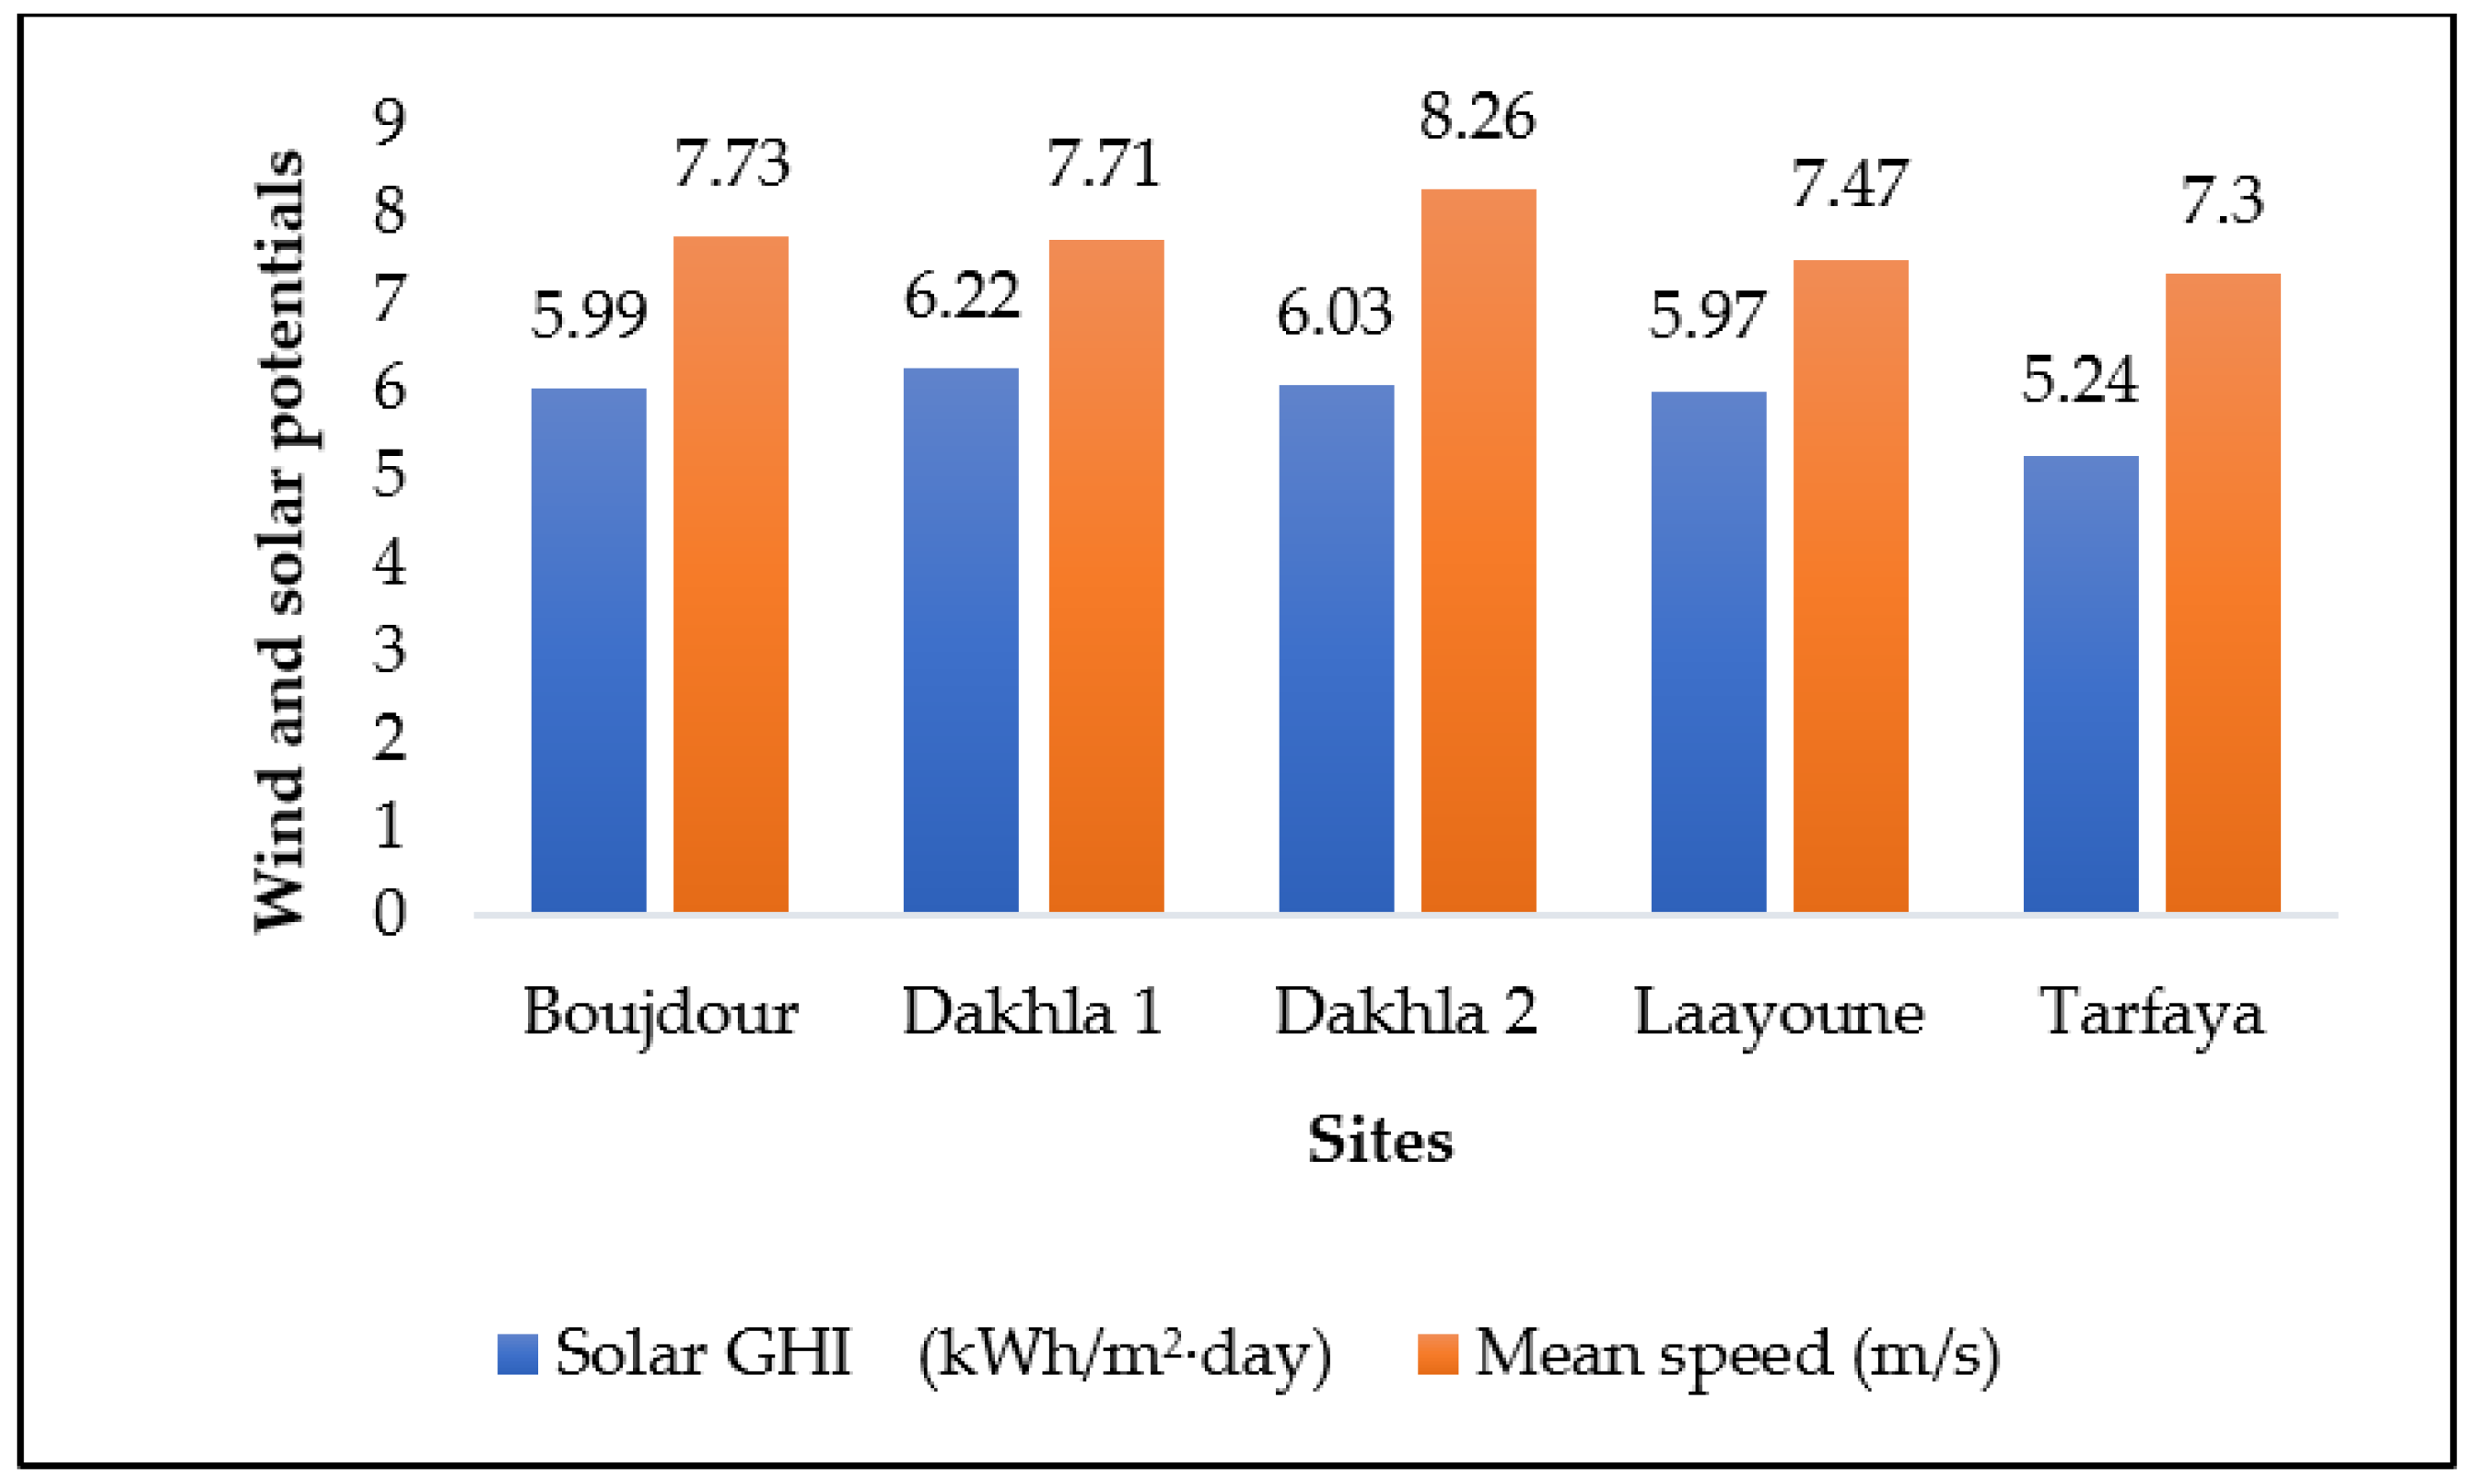
Figure 10 shows the correspondent average wind speed for each site at 50 m, as well as the solar GHI potential expressed in kWh/m2·year. These data are extracted from the HOMER software 3.16.2 database. As illustrated in Figure 10 the mean wind speed at all sites is highly significant, ranging between 7.3 and 8.26 m/s, which is very favorable for wind farm construction. The selection of appropriate turbines for high wind speeds should be addressed and many other considerations as well, given that high wind speeds have diverse implications beyond electricity production. They could affect several environmental, economic, and technical aspects. Strong winds can cause significant wind erosion, turbine wear, power grid instability, etc.
Moreover, it is important to shed light on wind irregularity as a criterion. It is the main source of the intermittency of this renewable source that mainly impacts the outcomes. Therefore, the most suitable sites for wind potential must have a regular wind speed over the year. In this regard, wind irregularity is considered in the analysis based on the assessment of the statistical parameters (standard deviation). A high standard deviation stands for widely dispersed values around the mean forming a heterogeneous series. Therefore, the intermittency would be highly significant in this case. The monthly data for the five sites are extracted from the HOMER database. The minimal standard deviation goes for the TARFAYA site, followed by DAKHLA 1 and Laayoune (Table 11). It is worth noting that these appropriate sites identified are linked to the criteria, constraints, data classification, and AHP judgments that have been considered

3.4. Techno-Economic Analysis of the Ammonia Plant

For a hydrogen load of 875 kg/day, Table 12 summarizes the optimal scenarios obtained from the simulation results for the 5 sites selected. Different renewable energy capacities are needed; thus, each site presents different costs. PV/WT ratio and levelized cost of hydrogen of the different optimal configurations are compared. The LCOA is also compared and determined based on the simulation outputs.
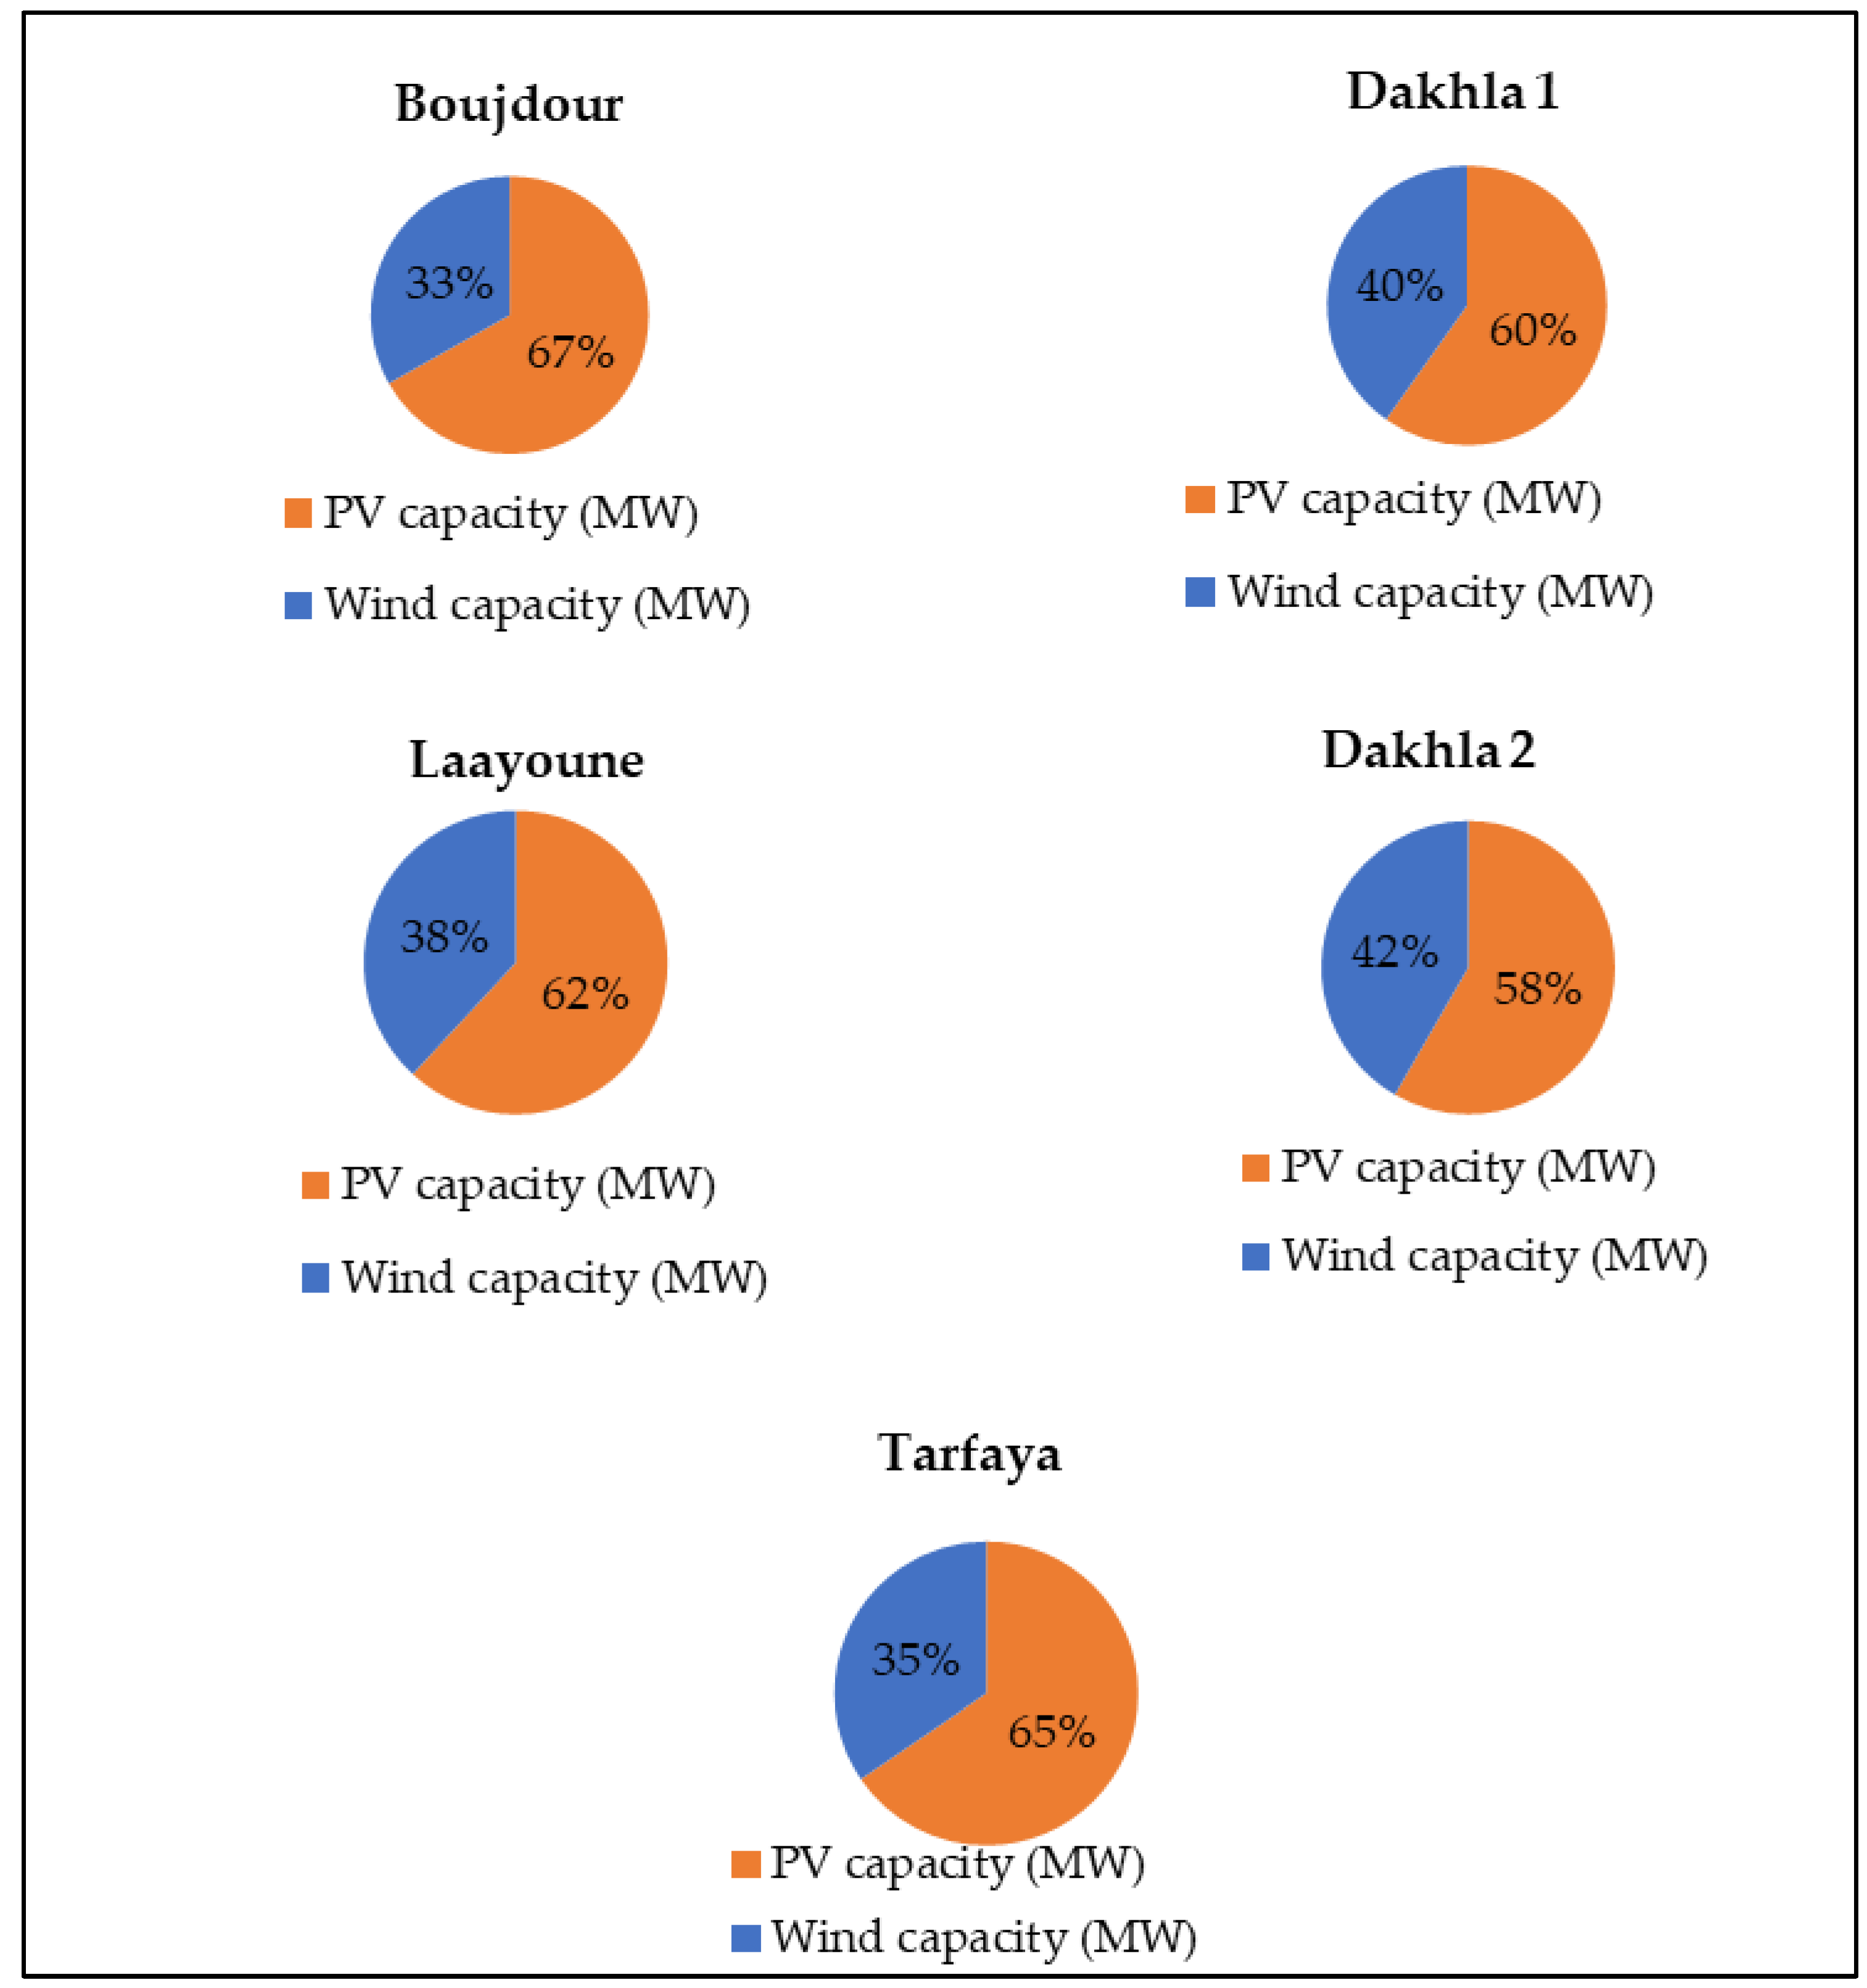
As shown in Figure 11, solar and wind energy sources are combined in all scenarios. This demonstrates the interest in producing green ammonia using hybrid renewable energy sources. The PV/WT ratio varies depending on the cases. The PV plant capacity installed is larger than the wind farm capacity in all configurations. This is explained by the low cost of photovoltaic panels. Locations with the highest solar energy ratios are Boujdour, Tarfaya, and Laayoune, with 67%, 65%, and 62% of the total energy capacity, respectively. Moreover, the solar energy ratio in Dakhla 1 and 2 represents approximately 60% of the total energy capacity. This demonstrates that even though the use of hybrid renewable energy sources is reliable and efficient, the PV/WT ratio must be selected according to the location to maximize production and reduce costs.
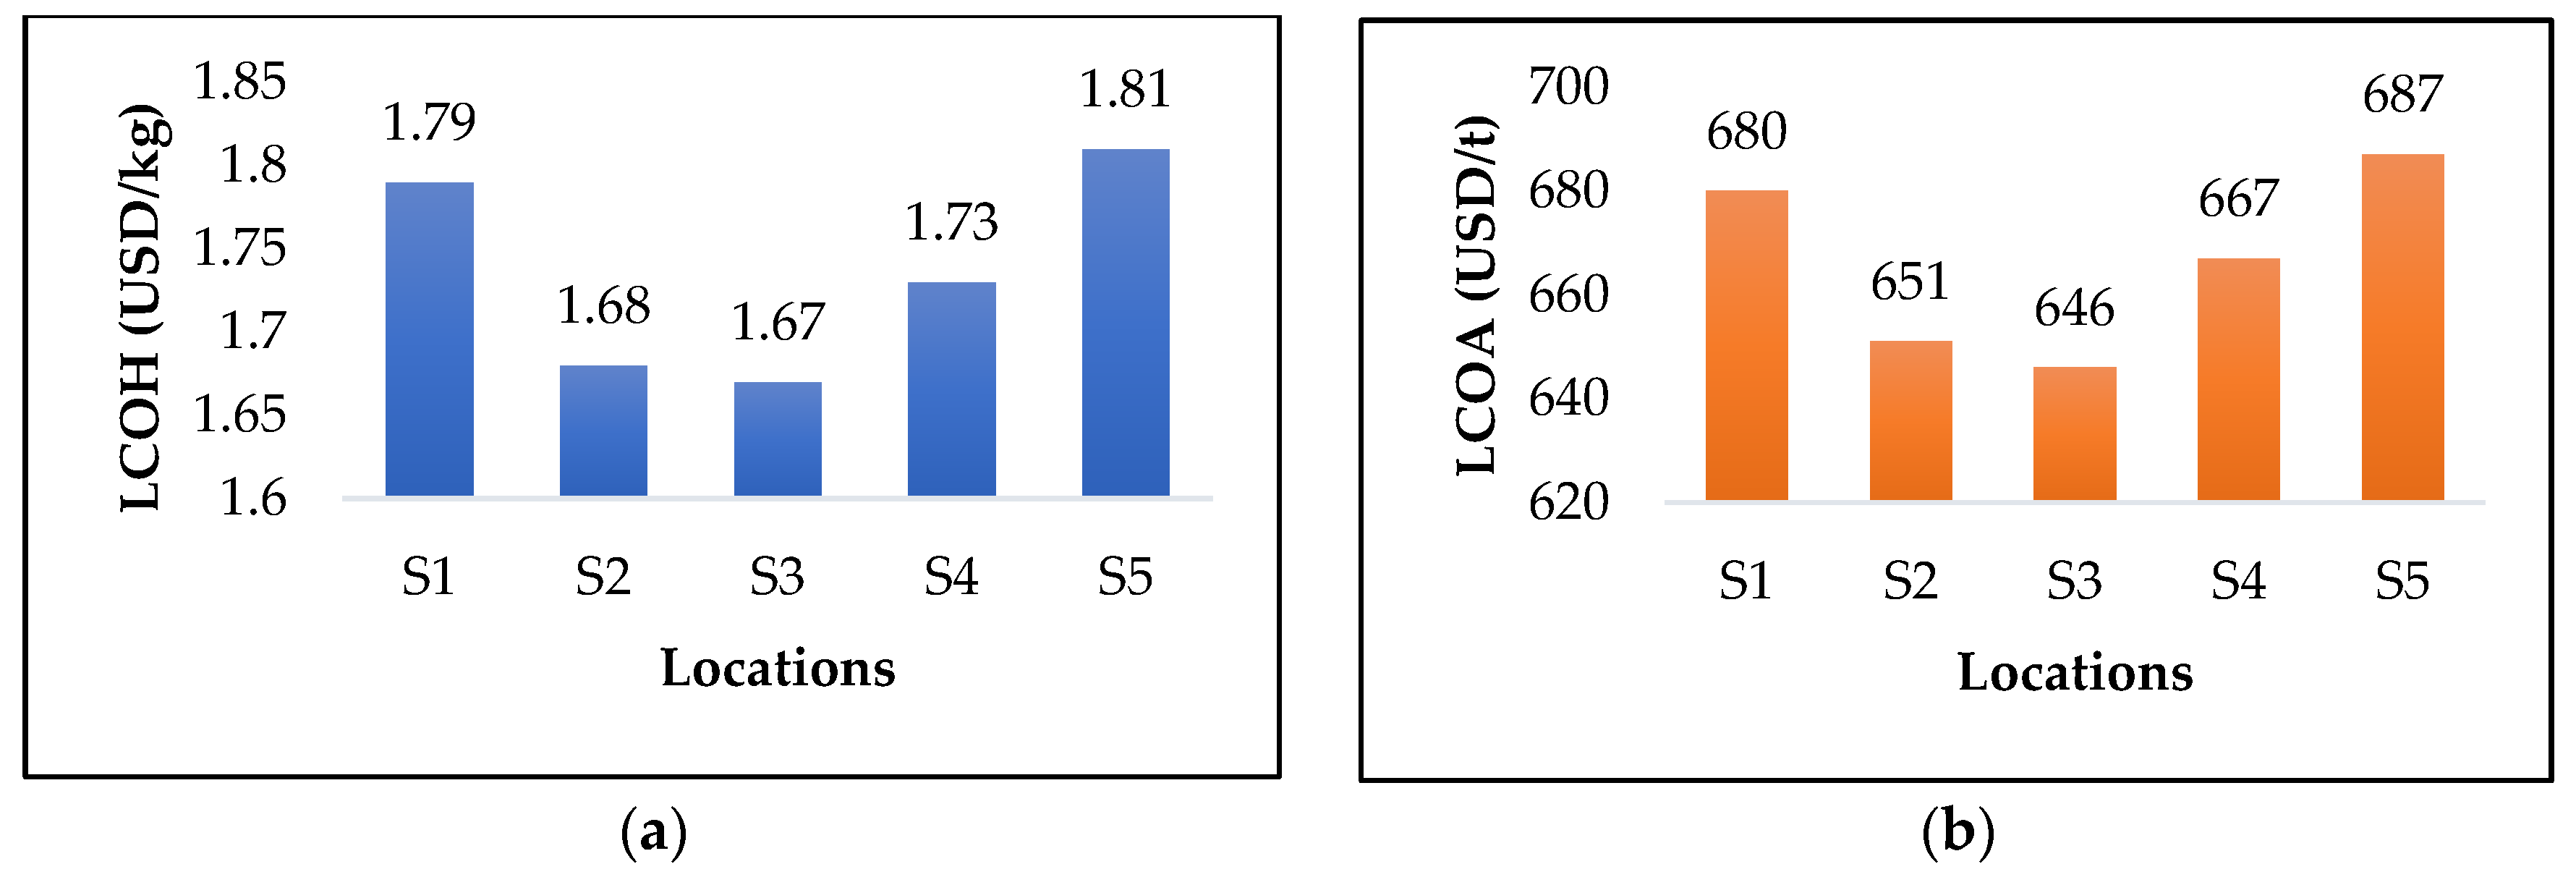
Depending on the system configuration and geographical locations under study, the resulting LCOH varies between 1.67 USD/kg and 1.81 USD/kg. The LCOA ranges between 646 USD/t and 687 USD/t (Figure 12). The lowest LCOA is observed in the two sites located in the Dakhla region, where it amounts to 646 USD/t and 651 USD/t, respectively. This is mainly due to location-specific factors—wind and solar energy potentials—that highly influence the levelized costs. Indeed, wind and solar energy potentials are more significant in these two sites than in other sites.
It should be noted that these costs depend mainly on several parameters (electrolyzer efficiency, electrolyzer cost). As the efficiency increases and the cost decreases, the impact on the LCOH becomes noticeable. In this regard, a sensitivity analysis is performed by varying the electrolyzer efficiency from 75% (base case) to 80%, 85% in the most favorable site (Dakhla 2). An increase from 75% to 80% in efficiency brings a reduction of around 0.1 USD/kg in LCOH, whereas an increase from 75% to 85% brings a decrease of around 0.18 USD/kg. Therefore, the efficiency rise leads to a significant reduction in the LCOA, moving from 646 USD/t (base case) to 597 USD/t, i.e., a 7.5% reduction. Considering the decrease in electrolyzer cost from 800 to 200 USD/kW, the LCOA can be reduced by 19%, reaching 521 USD/t. Figure 13 represents the funding of the technical and financial sensitivity analyses.
The sensitivity analysis reveals that results are highly dependent on assumptions regarding electrolyzer efficiency and cost improvement. A faster-than-expected improvement in efficiency or a greater reduction in investment costs could significantly reduce the LCOH and, thus, the LCOA. These results underline the importance of continued technological progress and favorable policy frameworks to ensure that the expected benefits of green hydrogen and ammonia materialize.
Moreover, a decrease in HB process cost is also considered. A reduction of 20% drops the LCOA by USD 636. The impact is relatively negligible. A very promising LCOA can be obtained considering the electrolyzer efficiency of about 85% and the electrolyzer cost fixed at 500 USD/kW. The resulting LCOA is about 548 USD/t obtained at the site of Dakhla.
These costs are subject to many variations with the evolution of energy prices. Indeed, lower prices for renewable electricity, together with subsidies and guaranteed feed-in tariffs for renewable electricity, directly reduce the cost of producing green hydrogen. As a result, the LCOA is also reduced. Technological progress in the electrolyzer market also impacts production costs. It focuses on increasing efficiency to improve conversion and eco-design to minimize energy losses. Technological advances can guarantee greater durability and reliability, reducing maintenance costs and downtime, which, in turn, lowers LCOH, and longer service life thanks to improved materials technologies.
To sum up, the site of Dakhla is favorable for green ammonia project implementation due to the promising cost and the proximity to the harbor (under construction) for shipping to Jorf Lasfar. However, various technical challenges regarding safety and material compatibility to avoid corrosion must be considered to achieve an integral transition, including transportation. The scaling up of the unit requires careful planning and consideration of many technical, economic, regulatory, and logistical factors. The factors include initial investment costs, potential site expansion, maintenance and labor costs, regulatory approvals, etc. Addressing these issues with strategic planning, infrastructure and technological investments, and regulatory support can make the scaling up successful and promote large-scale green ammonia production in Morocco.

3.5. Comparison of LCOA Findings with Similar Studies

The findings on the LCOA in Morocco suggest a competitive advantage due to the region’s abundant renewable energy resources, particularly when compared to similar studies conducted in the Middle East and Europe. In Iran, the minimum LCOA was obtained between 580 and 641 USD/t-NH3 [97]. In Saudi Arabia, a recent study on green ammonia production conducted by the country has shown that the country’s vast solar and wind resources could result in competitive LCOA reaching 383 USD/t-NH3 [114]. Jordan has been exploring the potential for green ammonia production, leveraging its renewable energy resources, particularly solar power, the LCOA was determined to range from 401 to 600 USD/t-NH3 [115]. In Germany, the ammonia price reached 934 USD/t-NH3 in December 2021. The authors of [116] reported a competitive cost of ammonia reaching 528 and 518 USD/t-NH3, respectively, in some locations in Denmark and Austria. Despite the high capital costs in Morocco, the achieved cost, compared to the existing studies and gray ammonia costs, is highly encouraging. The future competitiveness of ammonia depends on the development of the flexibility capabilities of the Haber–Bosch process as well as the capital costs (CapEx) linked to the renewable energy system and electrolysis over decades. Consequently, production costs have to be brought down to 450 USD/t to support the expansion of the hydrogen and ammonia economy [111]. By 2030, green ammonia will have the potential to compete economically with conventional processes using fossil fuels.

3.6. Contribution of the Local Production of Green Ammonia to Economic Growth and Sustainable Development

Local production of green ammonia remains important for the country’s energy transition. It will allow Morocco to strengthen its energy mix by expanding the installed capacity of renewable energies to reach 52% by 2030. The highly competitive cost of green ammonia considerably enhances its positioning in the international export market and the fertilizer sector. Indeed, local production will help reduce the industry’s dependence on fossil fuels as part of a decarbonization strategy, as well as fluctuations in the price of grey ammonia, and supply interruptions and disruptions linked to geopolitical tensions. The ammonia sector offers significant economic prospects in terms of economic growth by reducing its vulnerability to fuel prices and creating a new industrial sector and new green jobs. If widely adopted, it could encourage innovation, boost economic competitiveness, and foster a transition to a more sustainable and resilient economy. This paradigm shift towards green ammonia transition contributes largely to the implementation of the national strategy for sustainable development (SNDD) through sustainable development goals (SDGs). Green ammonia production is clean and responsible (SDGs 7 and 12). It is a green infrastructure stimulating technological innovation (SDG 9), and promoting the creation of green jobs (SDG 8). As part of the national green hydrogen strategy, it has been estimated that the number of jobs created could reach 16,200 in 2030, 72,000 in 2040, and 156,000 in 2050, divided between direct and indirect employment, in the development of the green hydrogen sector and its derivatives. From an environmental point of view, if Morocco succeeds in reducing its total annual energy dependence on grey ammonia (2 million tons/year), a reduction in the carbon footprint can be estimated at between 3.2 and 7.6 million tons per year.

3.7. Policy Implications, Recommendations for Government and Industry Stakeholders

To accelerate the green ammonia transition, various regulatory and policy changes are necessary, such as financial incentives, including subsidies, and grants for companies investing in the green ammonic sector; Public–Private Partnerships (PPP) to boost innovation and technological advances; regulatory frameworks by developing and implementing certification schemes for green ammonia ensuring sustainability, safety, and quality; monitoring to track in real-time the advancement of green ammonia initiatives as well as their impact on sustainable development goals. Concretely, for effective implementation of green ammonia projects, policymakers and government should develop the following: (i) The necessary infrastructure, including transportation, storage, and distribution facilities, to support the green ammonia supply chain. (ii) Supportive policies and incentives that encourage investment in green ammonia production. Therefore, facilitate the integration of these projects into Morocco’s energy sector. (iii) Training programs to build local expertise and ensure that the workforce is skilled in green ammonia technologies and practices. Collaboration with international experts, research institutions, and industry stakeholders is crucial to leveraging global knowledge and best practices in green ammonia technology. Industry stakeholders, in turn, should invest in advanced technologies and processes to enhance the efficiency of the green ammonia process. They should explore diverse applications of green ammonia, including its use in fertilizers and other industrial processes, to maximize market opportunities. By addressing these policy implications and following the recommendations, government and industry stakeholders can effectively capitalize on the opportunity presented by local green ammonia production, contributing to Morocco’s energy transition goals and strengthening its position in global markets.

4. Conclusions

Regarding its geographical location, energy interconnections, and renewable energy resources, Morocco is highly qualified to become a key actor in green ammonia industry development. The technical potential in renewable energies, particularly solar and wind, is about 62,750 TWh/year. The national strategy strongly supports the local production of ammonia. In this regard, the current study focused on assessing the viability of a local production of green ammonia for fertilizer manufacturing purposes. The specific objective was to identify the most suitable locations in Morocco for hosting a green ammonia unit. Aligned with the study’s purpose, the land suitability analysis based on GIS-AHP carried out allowed the classification of Moroccan lands based on their suitability index 2% was identified as highly suitable lands for green ammonia unit implementation, whereas moderately adequate areas cover approximately 49.5%. In high-suitability areas, the LCOA fluctuates between 646 USD/t and 687 USD/t. Dakhla was recognized as the site with the lowest LCOA. The results concluded present significant impacts on Morocco’s policy decisions in several ways related to energy policy and energy strategy: a competitive LCOA is highly encouraging to plan more investments in increasing the capacity of renewable energies. By reducing importation dependence on fossil fuels, the energy security is reinforced.
  • Economic policy: An affordable ammonia can lower production costs for the fertilizer industry and enhance its global competitiveness.
  • Environmental and climate policy: Transition-based green ammonia can help Morocco reach its climate goals fixed under Nationally Determined Contributions (NDCs).
  • Agricultural policy: The utilization of green ammonia to produce eco-friendly fertilizers, promotes a sustainable agricultural sector.
  • Infrastructure and development: Competitive LCOA encourages foreign investors interested in green energy projects, establishing global alliances and accelerating economic expansion.
Policymakers and industry stakeholders can effectively capitalize on the opportunities by developing supportive policies and incentives, adequate infrastructure, and local expertise; encouraging collaboration and innovation; and supporting the expansion of green ammonia into international markets.
The study was limited to a pilot production unit. Other operational, environmental, and social factors must be considered in the scaling-up phase. In addition, it has been assumed in this study that the fertilizer industry will be the final destination of the ammonia produced (local use) by considering a specific criterion, which is the proximity of the fertilizer industry. Changing the end use from local use to export will entail additional criteria considerations and may reveal other potential locations for this purpose. Moreover, exploiting another non-conventional water source, such as brackish water, can bring important changes and may be a more promising alternative to avoid the environmental impact of brine. For future studies, it is suggested to move towards brackish water demineralization for the electrolysis process. A life cycle assessment (LCA) of green ammonia in the Moroccan context is recommended for a detailed assessment of the product’s environmental impact over its entire life cycle. This will enable us to identify the stages where action is needed and thus better target improvement efforts. As a result, the environmental sustainability of the process can be improved while remaining economically viable. Regarding resources, Morocco’s large waste deposits could provide another alternative for green ammonia production through gasification. The techno-economic viability and optimization of the biomass-based process can be studied.

Author Contributions

Conceptualization, A.D.; Methodology, A.D., C.B. and M.H.; Software, A.D.; Supervision, C.B. and M.H.; Validation, M.H.; Writing—original draft, A.D.; Writing—review & editing, C.B., M.H. and C.S. All authors have read and agreed to the published version of the manuscript.

Funding

We acknowledge support by the German Research Foundation (Deutsche Forschungsgemeinschaft DFG) -project number 491460386 - and the Open Access Publishing Fund of Anhalt University of Applied Sciences.

Data Availability Statement

The original contributions presented in the study are included in the article, further inquiries can be directed to the corresponding author.

Acknowledgments

We sincerely thank the Green Hydrogen program of the German Academic Exchange Service (DAAD).

Conflicts of Interest

The authors declare that they have no known competing financial interests or personal relationships that could have appeared to influence the work reported in this paper.

Nomenclature

AELAlkaline electrolyzer
AHPAnalytic hierarchy process
AMEEAgence Marocaine pour l’efficacité énergétique
ASUAir separation unit
CapExCapital expenditures
CSPConcentrated Solar Power
GHGGreenhouse gas
GHIGlobal horizontal irradiation
GISGeographic information system
HBHaber–Bosch
HOMERHybrid Optimization of Multiple Electric Renewables
IEAInternational energy agency
IRENAInternational Renewable Energy Agency
LCALife cycle analysis
LCOALevelized cost of ammonia
LCOHLevelized cost of hydrogen
LCOELevelized cost of electricity
MCDMMulti-criteria decision-making
MCEMulti-criteria evaluation
NDCNationally Determined Contributions
OCPOffice Chérifien des Phosphates
OPEXOperating expenses
O&MOperation and Maintenance
OWAOrdered Weighted Averaging
PEMProton exchange membrane
PPPPublic-Private Partnerships
PVPhotovoltaics
RESRenewable energy system
SDStandard deviation
SDGSustainable development goals
SNDDNational strategy for sustainable development
SRTMShuttle Radar Topographic Mission
WDUWater desalination unit

References

  1. Global CO2 Emissions by Sector, 2019-2022—Charts—Data & Statistics. Available online: https://www.iea.org/data-and-statistics/charts/global-co2-emissions-by-sector-2019-2022 (accessed on 19 June 2024).
  2. Nayak-Luke, R.; Bañares-Alcántara, R.; Wilkinson, I. “Green” Ammonia: Impact of Renewable Energy Intermittency on Plant Sizing and Levelized Cost of Ammonia. Ind. Eng. Chem. Res. 2018, 57, 14607–14616. [Google Scholar] [CrossRef]
  3. Ojelade, O.A.; Zaman, S.F.; Ni, B.-J. Green Ammonia Production Technologies: A Review of Practical Progress. J. Environ. Manag. 2023, 342, 118348. [Google Scholar] [CrossRef] [PubMed]
  4. Nemmour, A.; Inayat, A.; Janajreh, I.; Ghenai, C. Green Hydrogen-Based E-Fuels (E-Methane, E-Methanol, E-Ammonia) to Support Clean Energy Transition: A Literature Review. Int. J. Hydrogen Energy 2023, 48, 29011–29033. [Google Scholar] [CrossRef]
  5. Lee, J.-S.; Cherif, A.; Yoon, H.-J.; Seo, S.-K.; Bae, J.-E.; Shin, H.-J.; Lee, C.; Kwon, H.; Lee, C.-J. Large-Scale Overseas Transportation of Hydrogen: Comparative Techno-Economic and Environmental Investigation. Renew. Sustain. Energy Rev. 2022, 165, 112556. [Google Scholar] [CrossRef]
  6. Ong, C.W.; Chang, N.; Tsai, M.-L.; Chen, C.-L. Decarbonizing the Energy Supply Chain: Ammonia as an Energy Carrier for Renewable Power Systems. Fuel 2024, 360, 130627. [Google Scholar] [CrossRef]
  7. Galimova, T.; Fasihi, M.; Bogdanov, D.; Breyer, C. Feasibility of Green Ammonia Trading via Pipelines and Shipping: Cases of Europe, North Africa, and South America. J. Clean. Prod. 2023, 427, 139212. [Google Scholar] [CrossRef]
  8. Bartels, J.R. A Feasibility Study of Implementing an Ammonia Economy. Master’s Thesis, Iowa State University, Digital Repository, Ames, IA, USA, 2008; p. 2807317. [Google Scholar]
  9. Morocco’s Phosphates Cache Eases Africa’s Food Crisis—DW—02/02/2022. Available online: https://www.dw.com/en/moroccos-phosphates-cache-eases-africas-food-crisis/a-60635396 (accessed on 23 April 2024).
  10. Atalayar Norway Challenges Morocco’s Position as Top Phosphate Supplier. Available online: https://www.atalayar.com/en/articulo/economy-and-business/norway-challenges-moroccos-position-top-phosphate-supplier/20230703181130187642.html (accessed on 23 April 2024).
  11. Safouane, N. Structuring of a Green Ammoniac and Green Hydrogen Production Program in Morocco. 2021. Available online: https://gggi.org/wp-content/uploads/2021/09/GGGI_Africa_Morocco_Green-Hydrogen_Project-Investment-Teaser.pdf (accessed on 19 April 2024).
  12. Morocco|Green Hydrogen Organisation. Available online: https://gh2.org/countries/morocco (accessed on 18 September 2023).
  13. Ministère de la Transition énergétique et du Développement Durable Feuille de Route de l’hydrogène Vert 2021. Available online: https://www.environnement.gov.ma/ar/133-a-la-une (accessed on 18 September 2023).
  14. Vries, L. de Proton Ventures Green Ammonia Pilot Plant. Available online: https://investinternational.nl/news-items/invest-international-provides-finance-to-proton-ventures-for-a-new-green-ammonia-pilot-plant-in-morocco/ (accessed on 11 September 2024).
  15. OCP Group: Renewable Ammonia Production Facility Planned for Southern Morocco—Ammonia Energy Association. Available online: https://ammoniaenergy.org/articles/ocp-group-renewable-ammonia-production-facility-planned-for-southern-morocco/ (accessed on 23 April 2024).
  16. Ouali, H.A.L.; Raillani, B.; Hassani, S.E.; Moussaoui, M.A.; Mezrhab, A.; Amraqui, S. Techno-Economic Evaluation of Very Large-Scale Photovoltaic Power Plant, Case Study:Eastern Morocco. In Proceedings of the 2020 5th International Conference on Renewable Energies for Developing Countries (REDEC), Marrakech, Morocco, 29–30 June 2020; IEEE: Marrakech, Morocco, 2020; pp. 1–5. [Google Scholar]
  17. Nakach, I.; Mouhat, O.; Shamass, R.; El Mennaouiy, F. Review of Strategies for Sustainable Energy in Morocco. Polityka Energetyczna—Energy Policy J. 2023, 26, 65–104. [Google Scholar] [CrossRef]
  18. Morocco Unveils Selected Bidders for 400 MW Solar Tender. Available online: https://www.pv-magazine.com/2023/07/11/morocco-unveils-selected-bidders-for-400-mw-solar-tender/ (accessed on 24 April 2024).
  19. Dahani, A.; Benqlilou, C.; Benabadji, A.S.; Holz, M.; Scott, C.; Fakhfakh, N. Assessment of Wind-to-Hydrogen Production via Electrolysis: A Case Study in Morocco. Harbin Gongcheng Daxue Xuebao/J. Harbin Eng. Univ. 2023, 44, 1439–1461. [Google Scholar]
  20. Ikken, B.; Rachidi, S.; Hirt, A.; Nabil, N.; Benmeziane, M. POWER-TO-X IN MOROCCO Driver of Mediterranean Energy Market Integration 2020. Available online: https://www.fedenerg.ma/wp-content/uploads/2020/06/2020-06-26_IKKEN_2020_IRESEN_PtX_V3.pdf (accessed on 20 April 2024).
  21. Energies Renouvelables. Available online: https://www.mem.gov.ma/Pages/secteur.aspx?e=2 (accessed on 23 April 2024).
  22. Atlas Eolien Global Numérique DU Maroc 2013. Available online: https://www.amee.ma/sites/default/files/inline-files/Atlas_Eolien_Numerique_1.pdf (accessed on 19 April 2024).
  23. Haidi, T.; Cheddadi, B.; El Mariami, F.; El Idrissi, Z.; Tarrak, A. Wind Energy Development in Morocco: Evolution and Impacts. Int. J. Electr. Comput. Eng. 2021, 11, 2811. [Google Scholar] [CrossRef]
  24. Azeroual, M.; El Makrini, A.; El Moussaoui, H.; El Markhi, H. Renewable Energy Potential and Available Capacity for Wind and Solar Power in Morocco Towards 2030. J. Eng. Sci. Technol. Rev. 2018, 11, 189–198. [Google Scholar] [CrossRef]
  25. Ouchani, F.; Jbaihi, O.; Alami Merrouni, A.; Maaroufi, M.; Ghennioui, A. Yield Analysis and Economic Assessment for GIS-Mapping of Large Scale Solar PV Potential and Integration in Morocco. Sustain. Energy Technol. Assess. 2021, 47, 101540. [Google Scholar] [CrossRef]
  26. Tarife, R.; Nakanishi, Y.; Zhou, Y.; Estoperez, N.; Tahud, A. Integrated GIS and Fuzzy-AHP Framework for Suitability Analysis of Hybrid Renewable Energy Systems: A Case in Southern Philippines. Sustainability 2023, 15, 2372. [Google Scholar] [CrossRef]
  27. Rios, R.; Duarte, S. Selection of Ideal Sites for the Development of Large-Scale Solar Photovoltaic Projects through Analytical Hierarchical Process—Geographic Information Systems (AHP-GIS) in Peru. Renew. Sustain. Energy Rev. 2021, 149, 111310. [Google Scholar] [CrossRef]
  28. Ruiz, H.S.; Sunarso, A.; Ibrahim-Bathis, K.; Murti, S.A.; Budiarto, I. GIS-AHP Multi Criteria Decision Analysis for the Optimal Location of Solar Energy Plants at Indonesia. Energy Rep. 2020, 6, 3249–3263. [Google Scholar] [CrossRef]
  29. Rekik, S.; El Alimi, S. A GIS Based MCDM Modelling Approach for Evaluating Large-Scale Solar PV Installation in Tunisia. Energy Rep. 2024, 11, 580–596. [Google Scholar] [CrossRef]
  30. Giamalaki, M.; Tsoutsos, T. Sustainable Siting of Solar Power Installations in Mediterranean Using a GIS/AHP Approach. Renew. Energy 2019, 141, 64–75. [Google Scholar] [CrossRef]
  31. Albraheem, L.; Alabdulkarim, L. Geospatial Analysis of Solar Energy in Riyadh Using a GIS-AHP-Based Technique. ISPRS Int. J. Geo-Inf. 2021, 10, 291. [Google Scholar] [CrossRef]
  32. Elboshy, B.; Alwetaishi, M.; Aly, R.M.; Zalhaf, A.S. A Suitability Mapping for the PV Solar Farms in Egypt Based on GIS-AHP to Optimize Multi-Criteria Feasibility. Ain Shams Eng. J. 2022, 13, 101618. [Google Scholar] [CrossRef]
  33. Günen, M.A. A Comprehensive Framework Based on GIS-AHP for the Installation of Solar PV Farms in Kahramanmaraş, Turkey. Renew. Energy 2021, 178, 212–225. [Google Scholar] [CrossRef]
  34. Adeli, K.; Nachtane, M.; Faik, A.; Saifaoui, D.; Boulezhar, A. How Green Hydrogen and Ammonia Are Revolutionizing the Future of Energy Production: A Comprehensive Review of the Latest Developments and Future Prospects. Appl. Sci. 2023, 13, 8711. [Google Scholar] [CrossRef]
  35. Boloorani, A.D.; Shorabeh, S.N.; Neysani Samany, N.; Mousivand, A.; Kazemi, Y.; Jaafarzadeh, N.; Zahedi, A.; Rabiei, J. Vulnerability Mapping and Risk Analysis of Sand and Dust Storms in Ahvaz, IRAN. Environ. Pollut. 2021, 279, 116859. [Google Scholar] [CrossRef] [PubMed]
  36. Ozegin, K.O.; Ilugbo, S.O. A Triangulation Approach for Groundwater Potential Evaluation Using Geospatial Technology and Multi-Criteria Decision Analysis (MCDA) in Edo State, Nigeria. J. Afr. Earth Sci. 2024, 209, 105101. [Google Scholar] [CrossRef]
  37. Villacreses, G.; Gaona, G.; Martínez-Gómez, J.; Jijón, D.J. Wind Farms Suitability Location Using Geographical Information System (GIS), Based on Multi-Criteria Decision Making (MCDM) Methods: The Case of Continental Ecuador. Renew. Energy 2017, 109, 275–286. [Google Scholar] [CrossRef]
  38. Islam, M.R.; Aziz, M.T.; Alauddin, M.; Kader, Z.; Islam, M.R. Site Suitability Assessment for Solar Power Plants in Bangladesh: A GIS-Based Analytical Hierarchy Process (AHP) and Multi-Criteria Decision Analysis (MCDA) Approach. Renew. Energy 2024, 220, 119595. [Google Scholar] [CrossRef]
  39. Shorabeh, S.N.; Firozjaei, M.K.; Nematollahi, O.; Firozjaei, H.K.; Jelokhani-Niaraki, M. A Risk-Based Multi-Criteria Spatial Decision Analysis for Solar Power Plant Site Selection in Different Climates: A Case Study in Iran. Renew. Energy 2019, 143, 958–973. [Google Scholar] [CrossRef]
  40. Höfer, T.; Sunak, Y.; Siddique, H.; Madlener, R. Wind Farm Siting Using a Spatial Analytic Hierarchy Process Approach: A Case Study of the Städteregion Aachen. Appl. Energy 2016, 163, 222–243. [Google Scholar] [CrossRef]
  41. Shorabeh, S.N.; Firozjaei, H.K.; Firozjaei, M.K.; Jelokhani-Niaraki, M.; Homaee, M.; Nematollahi, O. The Site Selection of Wind Energy Power Plant Using GIS-Multi-Criteria Evaluation from Economic Perspectives. Renew. Sustain. Energy Rev. 2022, 168, 112778. [Google Scholar] [CrossRef]
  42. Noorollahi, Y.; Yousefi, H.; Mohammadi, M. Multi-Criteria Decision Support System for Wind Farm Site Selection Using GIS. Sustain. Energy Technol. Assess. 2016, 13, 38–50. [Google Scholar] [CrossRef]
  43. Razeghi, M.; Hajinezhad, A.; Naseri, A.; Noorollahi, Y.; Moosavian, S.F. Multi-Criteria Decision for Selecting a Wind Farm Location to Supply Energy to Reverse Osmosis Devices and Produce Freshwater Using GIS in Iran. Energy Strategy Rev. 2023, 45, 101018. [Google Scholar] [CrossRef]
  44. Hosseini Dehshiri, S.S.; Hosseini Dehshiri, S.J. Locating Wind Farm for Power and Hydrogen Production Based on Geographic Information System and Multi-Criteria Decision Making Method: An Application. Int. J. Hydrogen Energy 2022, 47, 24569–24583. [Google Scholar] [CrossRef]
  45. Tiar, B.; Fadlallah, S.O.; Benhadji Serradj, D.E.; Graham, P.; Aagela, H. Navigating Algeria towards a Sustainable Green Hydrogen Future to Empower North Africa and Europe’s Clean Hydrogen Transition. Int. J. Hydrogen Energy 2024, 61, 783–802. [Google Scholar] [CrossRef]
  46. Messaoudi, D.; Settou, N.; Negrou, B.; Settou, B. GIS Based Multi-Criteria Decision Making for Solar Hydrogen Production Sites Selection in Algeria. Int. J. Hydrogen Energy 2019, 44, 31808–31831. [Google Scholar] [CrossRef]
  47. Suitable Sites for Wind Hydrogen Production Based on GIS-MCDM Method in Algeria. Available online: https://www.springerprofessional.de/en/suitable-sites-for-wind-hydrogen-production-based-on-gis-mcdm-me/18298710 (accessed on 24 August 2024).
  48. Alami Merrouni, A.; Elwali Elalaoui, F.; Mezrhab, A.; Mezrhab, A.; Ghennioui, A. Large Scale PV Sites Selection by Combining GIS and Analytical Hierarchy Process. Case Study: Eastern Morocco. Renew. Energy 2018, 119, 863–873. [Google Scholar] [CrossRef]
  49. Alami Merrouni, A.; Elwali Elalaoui, F.; Ghennioui, A.; Mezrhab, A.; Mezrhab, A. A GIS-AHP Combination for the Sites Assessment of Large-Scale CSP Plants with Dry and Wet Cooling Systems. Case Study: Eastern Morocco. Sol. Energy 2018, 166, 2–12. [Google Scholar] [CrossRef]
  50. Taoufik, M.; Fekri, A. GIS-Based Multi-Criteria Analysis of Offshore Wind Farm Development in Morocco. Energy Convers. Manag. X 2021, 11, 100103. [Google Scholar] [CrossRef]
  51. Amrani, S.; Alami Merrouni, A.; Touili, S.; Ait Lahoussine Ouali, H.; Dekhissi, H. An AHP-GIS Combination for Site Suitability Analysis of Hydrogen Production Units from CSP &PV Solar Power Plants in Morocco. Int. J. Hydrogen Energy 2024, 56, 369–382. [Google Scholar] [CrossRef]
  52. van Wijk, A. Chapter 19: Hydrogen as Carbon-Free Energy Carrier and Commodity. In Handbook on the Geopolitics of the Energy Transition; Edward Elgar Publishing: Northampton, MA, USA, 2023; ISBN 978-1-80037-043-2. [Google Scholar]
  53. DeSantis, D.; James, B.D.; Houchins, C.; Saur, G.; Lyubovsky, M. Cost of Long-Distance Energy Transmission by Different Carriers. iScience 2021, 24, 103495. [Google Scholar] [CrossRef]
  54. Borsboom-Hanson, T.; Patlolla, S.R.; Herrera, O.E.; Mérida, W. Point-to-Point Transportation: The Economics of Hydrogen Export. Int. J. Hydrogen Energy 2022, 47, 31541–31550. [Google Scholar] [CrossRef]
  55. Erdener, B.C.; Sergi, B.; Guerra, O.J.; Lazaro Chueca, A.; Pambour, K.; Brancucci, C.; Hodge, B.-M. A Review of Technical and Regulatory Limits for Hydrogen Blending in Natural Gas Pipelines. Int. J. Hydrogen Energy 2023, 48, 5595–5617. [Google Scholar] [CrossRef]
  56. AHP Approach—An Overview|ScienceDirect Topics. Available online: https://www.sciencedirect.com/topics/economics-econometrics-and-finance/ahp-approach (accessed on 4 January 2024).
  57. Ayodele, T.R.; Ogunjuyigbe, A.S.O.; Odigie, O.; Munda, J.L. A Multi-Criteria GIS Based Model for Wind Farm Site Selection Using Interval Type-2 Fuzzy Analytic Hierarchy Process: The Case Study of Nigeria. Appl. Energy 2018, 228, 1853–1869. [Google Scholar] [CrossRef]
  58. Saraswat, S.K.; Digalwar, A.K.; Yadav, S.S.; Kumar, G. MCDM and GIS Based Modelling Technique for Assessment of Solar and Wind Farm Locations in India. Renew. Energy 2021, 169, 865–884. [Google Scholar] [CrossRef]
  59. Islam, M.R.; Islam, M.R.; Imran, H.M. Assessing Wind Farm Site Suitability in Bangladesh: A GIS-AHP Approach. Sustainability 2022, 14, 14819. [Google Scholar] [CrossRef]
  60. Keroglou, I.; Tsoutsos, T. Optimal Siting of Solar Desalination Plants in Crete, Greece Employing a GIS/MCDM Approach. Renew. Energy 2024, 224, 120168. [Google Scholar] [CrossRef]
  61. Huang, P.; Sun, Y.; Gu, D.; Yan, W.; Chen, Y.; Wang, E. Quantitative Suitability Evaluation and Spatial Zoning for Seawater Desalination Water Intake Site Selection. Front. Environ. Sci. 2022, 10, 842253. [Google Scholar] [CrossRef]
  62. García-Bartolomei, E.; Vásquez, V.; Rebolledo, G.; Vivallo, A.; Acuña-Ruz, T.; Rebolledo, J.; Orrego, R.; Barra, R.O. Defining Priority Areas for the Sustainable Development of the Desalination Industry in Chile: A GIS Multi-Criteria Analysis Approach. Sustainability 2022, 14, 7772. [Google Scholar] [CrossRef]
  63. Aly, A.; Jensen, S.S.; Pedersen, A.B. Solar Power Potential of Tanzania: Identifying CSP and PV Hot Spots through a GIS Multicriteria Decision Making Analysis. Renew. Energy 2017, 113, 159–175. [Google Scholar] [CrossRef]
  64. Noorollahi, E.; Fadai, D.; Akbarpour Shirazi, M.; Ghodsipour, S. Land Suitability Analysis for Solar Farms Exploitation Using GIS and Fuzzy Analytic Hierarchy Process (FAHP)—A Case Study of Iran. Energies 2016, 9, 643. [Google Scholar] [CrossRef]
  65. Sánchez-Lozano, J.M.; Henggeler Antunes, C.; García-Cascales, M.S.; Dias, L.C. GIS-Based Photovoltaic Solar Farms Site Selection Using ELECTRE-TRI: Evaluating the Case for Torre Pacheco, Murcia, Southeast of Spain. Renew. Energy 2014, 66, 478–494. [Google Scholar] [CrossRef]
  66. Tahri, M.; Hakdaoui, M.; Maanan, M. The Evaluation of Solar Farm Locations Applying Geographic Information System and Multi-Criteria Decision-Making Methods: Case Study in Southern Morocco. Renew. Sustain. Energy Rev. 2015, 51, 1354–1362. [Google Scholar] [CrossRef]
  67. Ali, S.; Taweekun, J.; Techato, K.; Waewsak, J.; Gyawali, S. GIS Based Site Suitability Assessment for Wind and Solar Farms in Songkhla, Thailand. Renew. Energy 2019, 132, 1360–1372. [Google Scholar] [CrossRef]
  68. Azizi, A.; Malekmohammadi, B.; Jafari, H.R.; Nasiri, H.; Amini Parsa, V. Land Suitability Assessment for Wind Power Plant Site Selection Using ANP-DEMATEL in a GIS Environment: Case Study of Ardabil Province, Iran. Environ. Monit. Assess. 2014, 186, 6695–6709. [Google Scholar] [CrossRef] [PubMed]
  69. Wu, B.; Lang, Y.; Zargari, N.; Kouro, S. Power Conversion and Control of Wind Energy Systems; Wiley: Hoboken, NJ, USA, 2011. [Google Scholar]
  70. Mahjoobi, M.; Behzadi, S. Solar Desalination Site Selection on the Caspian Sea Coast Using AHP and Fuzzy Logic Methods. Model. Earth Syst. Environ. 2022, 8, 4529–4537. [Google Scholar] [CrossRef]
  71. Mohamed, S.A. Application of Geo-Spatial Analytical Hierarchy Process and Multi-Criteria Analysis for Site Suitability of the Desalination Solar Stations in Egypt. J. Afr. Earth Sci. 2020, 164, 103767. [Google Scholar] [CrossRef]
  72. Kotb, K.M.; Elkadeem, M.R.; Sharshir, S.W.; Abido, M.A.; Elsayed, M.M.; Abu Ghazala, M.O.; Younes, A. Harnessing Solar and Wind Power for Sustainable Seawater Desalination: A Multi-Criteria Geospatial Suitability Analysis. Renew. Energy 2024, 222, 119814. [Google Scholar] [CrossRef]
  73. Al Garni, H.Z.; Awasthi, A. Solar PV Power Plant Site Selection Using a GIS-AHP Based Approach with Application in Saudi Arabia. Appl. Energy 2017, 206, 1225–1240. [Google Scholar] [CrossRef]
  74. Baseer, M.A.; Rehman, S.; Meyer, J.P.; Alam, M.M. GIS-Based Site Suitability Analysis for Wind Farm Development in Saudi Arabia. Energy 2017, 141, 1166–1176. [Google Scholar] [CrossRef]
  75. Latinopoulos, D.; Kechagia, K. A GIS-Based Multi-Criteria Evaluation for Wind Farm Site Selection. A Regional Scale Application in Greece. Renew. Energy 2015, 78, 550–560. [Google Scholar] [CrossRef]
  76. Demir, A.; Dinçer, A.E.; Yılmaz, K. A Novel Method for the Site Selection of Large-Scale PV Farms by Using AHP and GIS: A Case Study in İzmir, Türkiye. Sol. Energy 2023, 259, 235–245. [Google Scholar] [CrossRef]
  77. Asrami, R.F.; Sohani, A.; Sayyaadi, H.; Moradi, M.H. Geographical Information System as an Approach for PV Power Plants Allocation with 3E Criteria. Sol. Energy 2023, 264, 111966. [Google Scholar] [CrossRef]
  78. Gass, V.; Schmidt, J.; Strauss, F.; Schmid, E. Assessing the Economic Wind Power Potential in Austria. Energy Policy 2013, 53, 323–330. [Google Scholar] [CrossRef]
  79. Schallenberg-Rodríguez, J.; Notario-del Pino, J. Evaluation of On-Shore Wind Techno-Economical Potential in Regions and Islands. Appl. Energy 2014, 124, 117–129. [Google Scholar] [CrossRef]
  80. Elghazouly, H.G.; Elnaggar, A.M.; Ayaad, S.M.; Nassar, E.T. Framework for Integrating Multi-Criteria Decision Analysis and Geographic Information System (MCDA-GIS) for Improving Slums Interventions Policies in Cairo, Egypt. Alex. Eng. J. 2024, 86, 277–288. [Google Scholar] [CrossRef]
  81. Ameen, R.F.M.; Mourshed, M. Urban Sustainability Assessment Framework Development: The Ranking and Weighting of Sustainability Indicators Using Analytic Hierarchy Process. Sustain. Cities Soc. 2019, 44, 356–366. [Google Scholar] [CrossRef]
  82. Lakicevic, M.; Srdjevic, B.; Velichkov, I. Combining AHP and Smarter in Forestry Deci- Sion Making. Balt. For. 2018, 24, 42–49. [Google Scholar]
  83. Ramanathan, R. Multicriteria Analysis of Energy. In Encyclopedia of Energy; Cleveland, C.J., Ed.; Elsevier: New York, NY, USA, 2004; pp. 77–88. ISBN 978-0-12-176480-7. [Google Scholar]
  84. Saaty, T.L. A Scaling Method for Priorities in Hierarchical Structures. J. Math. Psychol. 1977, 15, 234–281. [Google Scholar] [CrossRef]
  85. Halder, B.; Bandyopadhyay, J.; Sandhyaki, S. Impact Assessment of Environmental Disturbances Triggering Aquaculture Land Suitability Mapping Using AHP and MCDA Techniques. Aquacult. Int. 2023, 32, 2039–2075. [Google Scholar] [CrossRef]
  86. Ourya, I.; Abderafi, S. Clean Technology Selection of Hydrogen Production on an Industrial Scale in Morocco. Results Eng. 2022, 17, 100815. [Google Scholar] [CrossRef]
  87. Global Wind Atlas. Available online: https://globalwindatlas.info (accessed on 17 January 2024).
  88. Solar Irradiance Data. Available online: https://solargis.com/ (accessed on 29 January 2024).
  89. OpenTopography—Shuttle Radar Topography Mission (SRTM GL1) Global 30 m. Available online: https://portal.opentopography.org/raster?opentopoID=OTSRTM.082015.4326.1 (accessed on 6 March 2024).
  90. ArcGIS Portal Directory. Available online: https://www.arcgis.com/sharing/rest/content/items/83535020ce154bd5a498957c159e3a99 (accessed on 6 March 2024).
  91. Settou, B.; Settou, N.; Gouareh, A.; Negrou, B.; Mokhtara, C.; Messaoudi, D. A High-Resolution Geographic Information System-Analytical Hierarchy Process-Based Method for Solar PV Power Plant Site Selection: A Case Study Algeria. Clean Techn Env. Policy 2021, 23, 219–234. [Google Scholar] [CrossRef]
  92. Zalhaf, A.S.; Elboshy, B.; Kotb, K.M.; Han, Y.; Almaliki, A.H.; Aly, R.M.H.; Elkadeem, M.R. A High-Resolution Wind Farms Suitability Mapping Using GIS and Fuzzy AHP Approach: A National-Level Case Study in Sudan. Sustainability 2021, 14, 358. [Google Scholar] [CrossRef]
  93. Cesaro, Z.; Ives, M.; Nayak-Luke, R.; Mason, M.; Bañares-Alcántara, R. Ammonia to Power: Forecasting the Levelized Cost of Electricity from Green Ammonia in Large-Scale Power Plants. Appl. Energy 2021, 282, 116009. [Google Scholar] [CrossRef]
  94. Lim, D.; Lee, B.; Lee, H.; Byun, M.; Lim, H. Projected Cost Analysis of Hybrid Methanol Production from Tri-Reforming of Methane Integrated with Various Water Electrolysis Systems: Technical and Economic Assessment. Renew. Sustain. Energy Rev. 2022, 155, 111876. [Google Scholar] [CrossRef]
  95. Pagani, G.; Hajimolana, Y.; Acar, C. Green Hydrogen for Ammonia Production—A Case for the Netherlands. Int. J. Hydrogen Energy 2023, 52, S0360319923032858. [Google Scholar] [CrossRef]
  96. Ozturk, M.; Dincer, I. An Integrated System for Ammonia Production from Renewable Hydrogen: A Case Study. Int. J. Hydrogen Energy 2021, 46, 5918–5925. [Google Scholar] [CrossRef]
  97. Kakavand, A.; Sayadi, S.; Tsatsaronis, G.; Behbahaninia, A. Techno-Economic Assessment of Green Hydrogen and Ammonia Production from Wind and Solar Energy in Iran. Int. J. Hydrogen Energy 2023, 48, 14170–14191. [Google Scholar] [CrossRef]
  98. Wulf, C.; Linssen, J.; Zapp, P. Chapter 9—Power-to-Gas—Concepts, Demonstration, and Prospects. In Hydrogen Supply Chains; Azzaro-Pantel, C., Ed.; Academic Press: Cambridge, MA, USA, 2018; pp. 309–345. ISBN 978-0-12-811197-0. [Google Scholar]
  99. Sadeq, M.; Sameh, A. PV-ON: An Online/Bilingual PV Sizing Tool for Grid-Connected System, Case Studies in Egypt. Int. Trans. Electr. Energy Syst. 2021, 31, e12910. [Google Scholar] [CrossRef]
  100. News, J.R.-M.W. Morocco Likely to Hold Interest Rates at 3% in 2024 as Inflation Dips. Available online: https://www.moroccoworldnews.com/2023/12/359812/morocco-likely-to-hold-interest-rates-at-3-in-2024-as-inflation-dips (accessed on 5 March 2024).
  101. Touili, S.; Merrouni, A.A.; Hassouani, Y.E.; Amrani, A.; Azouzoute, A. Techno-Economic Investigation of Electricity and Hydrogen Production from Wind Energy in Casablanca, Morocco. IOP Conf. Ser. Mater. Sci. Eng. 2020, 948, 012012. [Google Scholar] [CrossRef]
  102. Bilal, B.; Adjallah, K.H.; Yetilmezsoy, K.; Bahramian, M.; Kıyan, E. Determination of Wind Potential Characteristics and Techno-Economic Feasibility Analysis of Wind Turbines for Northwest Africa. Energy 2021, 218, 119558. [Google Scholar] [CrossRef]
  103. Al-Shamma’a, A.A.; Alturki, F.A.; Farh, H.M.H. Techno-Economic Assessment for Energy Transition from Diesel-Based to Hybrid Energy System-Based off-Grids in Saudi Arabia. Energy Transit 2020, 4, 31–43. [Google Scholar] [CrossRef]
  104. Elkadeem, M.R.; Wang, S.; Sharshir, S.W.; Atia, E.G. Feasibility Analysis and Techno-Economic Design of Grid-Isolated Hybrid Renewable Energy System for Electrification of Agriculture and Irrigation Area: A Case Study in Dongola, Sudan. Energy Convers. Manag. 2019, 196, 1453–1478. [Google Scholar] [CrossRef]
  105. Saxena, V. China Solar Panel Costs Plunge in 2023, 60% Cheaper Than US. Asia Financ. 2023. Available online: https://www.asiafinancial.com/china-solar-panel-costs-plunge-in-2023-60-cheaper-than-us (accessed on 1 September 2024).
  106. Ramasamy, V.; Feldman, D.; Desai, J.; Margolis, R. U.S. Solar Photovoltaic System and Energy Storage Cost Benchmarks: Q1 2021; NREL/TP-7A40-80694; National Renewable Energy Laboratory: Golden, CO, USA, 2021. Available online: https://www.nrel.gov/docs/fy22osti/80694.pdf (accessed on 1 September 2024).
  107. Terlouw, T.; Bauer, C.; McKenna, R.; Mazzotti, M. Large-Scale Hydrogen Production via Water Electrolysis: A Techno-Economic and Environmental Assessment. Energy Environ. Sci. 2022, 15, 3583–3602. [Google Scholar] [CrossRef]
  108. Povacz, L.; Bhandari, R. Analysis of the Levelized Cost of Renewable Hydrogen in Austria. Sustainability 2023, 15, 4575. [Google Scholar] [CrossRef]
  109. Rezk, H.; Alghassab, M.; Ziedan, H.A. An Optimal Sizing of Stand-Alone Hybrid PV-Fuel Cell-Battery to Desalinate Seawater at Saudi NEOM City. Processes 2020, 8, 382. [Google Scholar] [CrossRef]
  110. Shokri, A.; Sanavi Fard, M. Techno-Economic Assessment of Water Desalination: Future Outlooks and Challenges. Process Saf. Environ. Prot. 2023, 169, 564–578. [Google Scholar] [CrossRef]
  111. Fasihi, M.; Weiss, R.; Savolainen, J.; Breyer, C. Global Potential of Green Ammonia Based on Hybrid PV-Wind Power Plants. Appl. Energy 2021, 294, 116170. [Google Scholar] [CrossRef]
  112. Fúnez Guerra, C.; Reyes-Bozo, L.; Vyhmeister, E.; Jaén Caparrós, M.; Salazar, J.L.; Clemente-Jul, C. Technical-Economic Analysis for a Green Ammonia Production Plant in Chile and Its Subsequent Transport to Japan. Renew. Energy 2020, 157, 404–414. [Google Scholar] [CrossRef]
  113. Armijo, J.; Philibert, C. Flexible Production of Green Hydrogen and Ammonia from Variable Solar and Wind Energy: Case Study of Chile and Argentina. Int. J. Hydrogen Energy 2020, 45, 1541–1558. [Google Scholar] [CrossRef]
  114. Florez, J.; AlAbbad, M.; Vazquez-Sanchez, H.; Morales, M.G.; Sarathy, S.M. Optimizing Islanded Green Ammonia and Hydrogen Production and Export from Saudi Arabia. Int. J. Hydrogen Energy 2024, 56, 959–972. [Google Scholar] [CrossRef]
  115. Laimon, M.; Goh, S. Unlocking Potential in Renewable Energy Curtailment for Green Ammonia Production. Int. J. Hydrogen Energy 2024, 71, 964–971. [Google Scholar] [CrossRef]
  116. Nayak-Luke, R.M.; Forbes, C.; Cesaro, Z.; Bañares-Alcántara, R.; Rouwenhorst, K.H.R. Chapter 8—Techno-Economic Aspects of Production, Storage and Distribution of Ammonia. In Techno-Economic Challenges of Green Ammonia as an Energy Vector; Valera-Medina, A., Banares-Alcantara, R., Eds.; Academic Press: Cambridge, MA, USA, 2021; pp. 191–207. ISBN 978-0-12-820560-0. [Google Scholar]
Figure 1. Case study scenario.
Processes 12 01991 g001
Figure 2. AHP method flowchart.
Processes 12 01991 g002
Figure 3. Constraints map.
Processes 12 01991 g003
Figure 4. Criteria maps: (a) wind speed (m/s); (b) PVOUT (kWh/kWp).
Processes 12 01991 g004
Figure 5. Map representing the proximity to the coastline.
Processes 12 01991 g005
Figure 6. Map representing the proximity to the fertilizer unit.
Processes 12 01991 g006
Figure 7. Map representing the proximity to roads.
Processes 12 01991 g007
Figure 8. Criteria maps: (a) elevation (m); (b) slope (%).
Processes 12 01991 g008
Figure 9. Land suitability map including the five sites selected for green ammonia production.
Processes 12 01991 g009
Figure 10. Average wind speed (m/s) and solar GHI potential for the selected sites.
Processes 12 01991 g010
Figure 11. PV and WT capacities ratio for sites under study.
Processes 12 01991 g011
Figure 12. Economic assessment results: (a) LCOH (USD/kg); (b) LCOA (USD/t).
Processes 12 01991 g012
Figure 13. Sensitivity analysis results: (a) technical sensitivity analysis; (b) financial sensitivity analysis.
Processes 12 01991 g013
Table 1. Criteria considered for the study.
CriteriaReferences
C1Wind speed[40,50,57,58,59]
C2PV power output[45]
C3Proximity to the coastline[30,60,61,62]
C4Proximity to the fertilizer unitSpecific to the study
C5Proximity to roads[30,63,64,65,66]
C6Elevation[30,64,67,68]
C7Slope[30,64,67,68]
C8Wind irregularitySpecific to the study
Table 3. Assessments of each criterion’s relative importance.
CriteriaC1C2C3C4C5C6C7
C11.0000.5004.0005.0005.0005.0006.000
C22.0001.0004.0005.0004.0005.0007.000
C30.2500.2501.0003.0003.0003.0004.000
C40.2000.2000.3331.0002.0003.0002.000
C50.2000.2500.3330.5001.0003.0002.000
C60.2000.2000.3330.3330.3331.0002.000
C70.1670.1430.2500.5000.5000.5001.000
Table 4. Data sources.
DataSource
Wind speedAverage wind speed data at 10 m above the ground level downloaded from Global Wind Atlas [87].
PV power outputGenerated by Global solar Atlas [88].
Wind irregularityWindPro software 3.6 for generating the monthly average wind speed. The analysis of wind irregularity is based on the assessment of statistical parameters (standard deviation).
SlopeGenerated using ArcGIS software on the basis of the downloaded Digital Elevation Model (DEM) map.
Digital Elevation Model (DEM)High-resolution (30 m) digital topographic database [89].
ElevationNASA Shuttle Radar Topographic Mission (SRTM).
CoastlineGeographical coordinates
Fertilizer plantGeographical coordinates
Proximity to roadsA map (shapefile format) of major roads was generated from Esri’s website [90].
Table 5. Constraints considered for study.
NoConstraintSource
1Areas presenting an average wind speed of less than 3 m/s are excluded.[26,57]
2Areas presenting an elevation of more than 2200 m are excluded.[30,57,58]
3Areas presenting a slope of more than 15° are not considered.[57,58,91,92]
4A value less than 3.5 kWh/kWp for PV power output is assumed unfavorable[45]
5Distance to roads excluded: <500 m[31,59]
Table 6. Criteria classification.
CriteriaRangeSuitability Class
Wind speed (m/s) [59]3–3.5Very low
3.5–4.0Low
4.0–5.0Moderate
5.0–6.0High
>6Very high
PV power output (kWh/kWp) [45]3.5–4.0Very low
4–4.5Low
4.5–4.8Moderate
4.8–5.2High
>5.2Very high
Proximity to coastline (km) [51,60,61,62]20.0–50.0Very low
10.0–20.0Low
5.0–10.0Moderate
2.0–5.0High
0.5–2.0Very high
Proximity to fertilizer unit (km)50.0–100Very low
20.0–50.0Low
10–20Moderate
5–10High
<5Very high
Distance to roads (km) [45]20–50Very low
10–20Low
5–10Moderate
2–5High
0.5–2.0Very high
Elevation (m) [32]<200Very low
200–450Low
450–750Moderate
750–1200High
1200–2200Very high
Slope (%) [92]>15Very low
12–15Low
9–12Moderate
6–9High
3–6Very high
Table 7. Economic data required for the simulation of the hydrogen production unit.
ComponentCapExReplacement CostOPEX/YearLife Time (Year)Reference
Wind turbine (USD/kW)120004625[101,102,103,104]
PV (USD/kW)1500725[99,105]
Converter (USD/kW)5050015[106]
Electrolyzer (USD/kW)8003422113[4,107,108]
H2 Storage tank (USD/kg-H2)35003.525[97,109]
Table 8. Normalized matrix with the associated criteria weights.
CriteriaC1C2C3C4C5C6C7Weight (%)
C10.2490.1970.3900.3260.3160.2440.25028%
C20.4980.3930.3900.3260.2530.2440.29234%
C30.0620.0980.0980.1960.1890.1460.16714%
C40.0500.0790.0330.0650.1260.1460.0838%
C50.0500.0980.0330.0330.0630.1460.0837%
C60.0500.0790.0330.0220.0210.0490.0835%
C70.0410.0560.0240.0330.0320.0240.0424%
Table 9. Suitability classes for green ammonia production in Morocco.
Suitability Class
Unsuitable33.250%
Very low0.008%
Low14.868%
Moderate49.548%
High2.326%
Table 10. Sites selected for green ammonia production in Morocco.
Geographical CoordinatesLocation
LatitudeLongitude
126.303204−14.036322Boujdour
224.101098−15.444411Dakhla 1
322.151141−16.646791Dakhla 2
427.018932−13.388056Laayoune
527.961425−11.997644Tarfaya
Table 11. Standard deviation calculation.
S1S2S3S4S5
Standard deviation (SD)0.910.770.890.850.71
Table 12. Optimal configurations for each site under study.
PV Plant Capacity (MW)Wind Farm Capacity (MW)Electrolyzer Capacity (MW)H2 Storage Tank Capacity (kg)
Site no. 16.0433.521400
Site no. 24.46933.2641700
Site no. 34.19833.2571700
Site no. 44.86333.3392000
Site no. 55.6933.6091700
Disclaimer/Publisher’s Note: The statements, opinions and data contained in all publications are solely those of the individual author(s) and contributor(s) and not of MDPI and/or the editor(s). MDPI and/or the editor(s) disclaim responsibility for any injury to people or property resulting from any ideas, methods, instructions or products referred to in the content.

