
Determination of the Main Production Factors and Production Predictions of Test Wells in the Offshore Tight Oil Reservoirs in the L Formation of the Beibu Basin Using Multivariate Statistical Methods


Abstract
1. Introduction
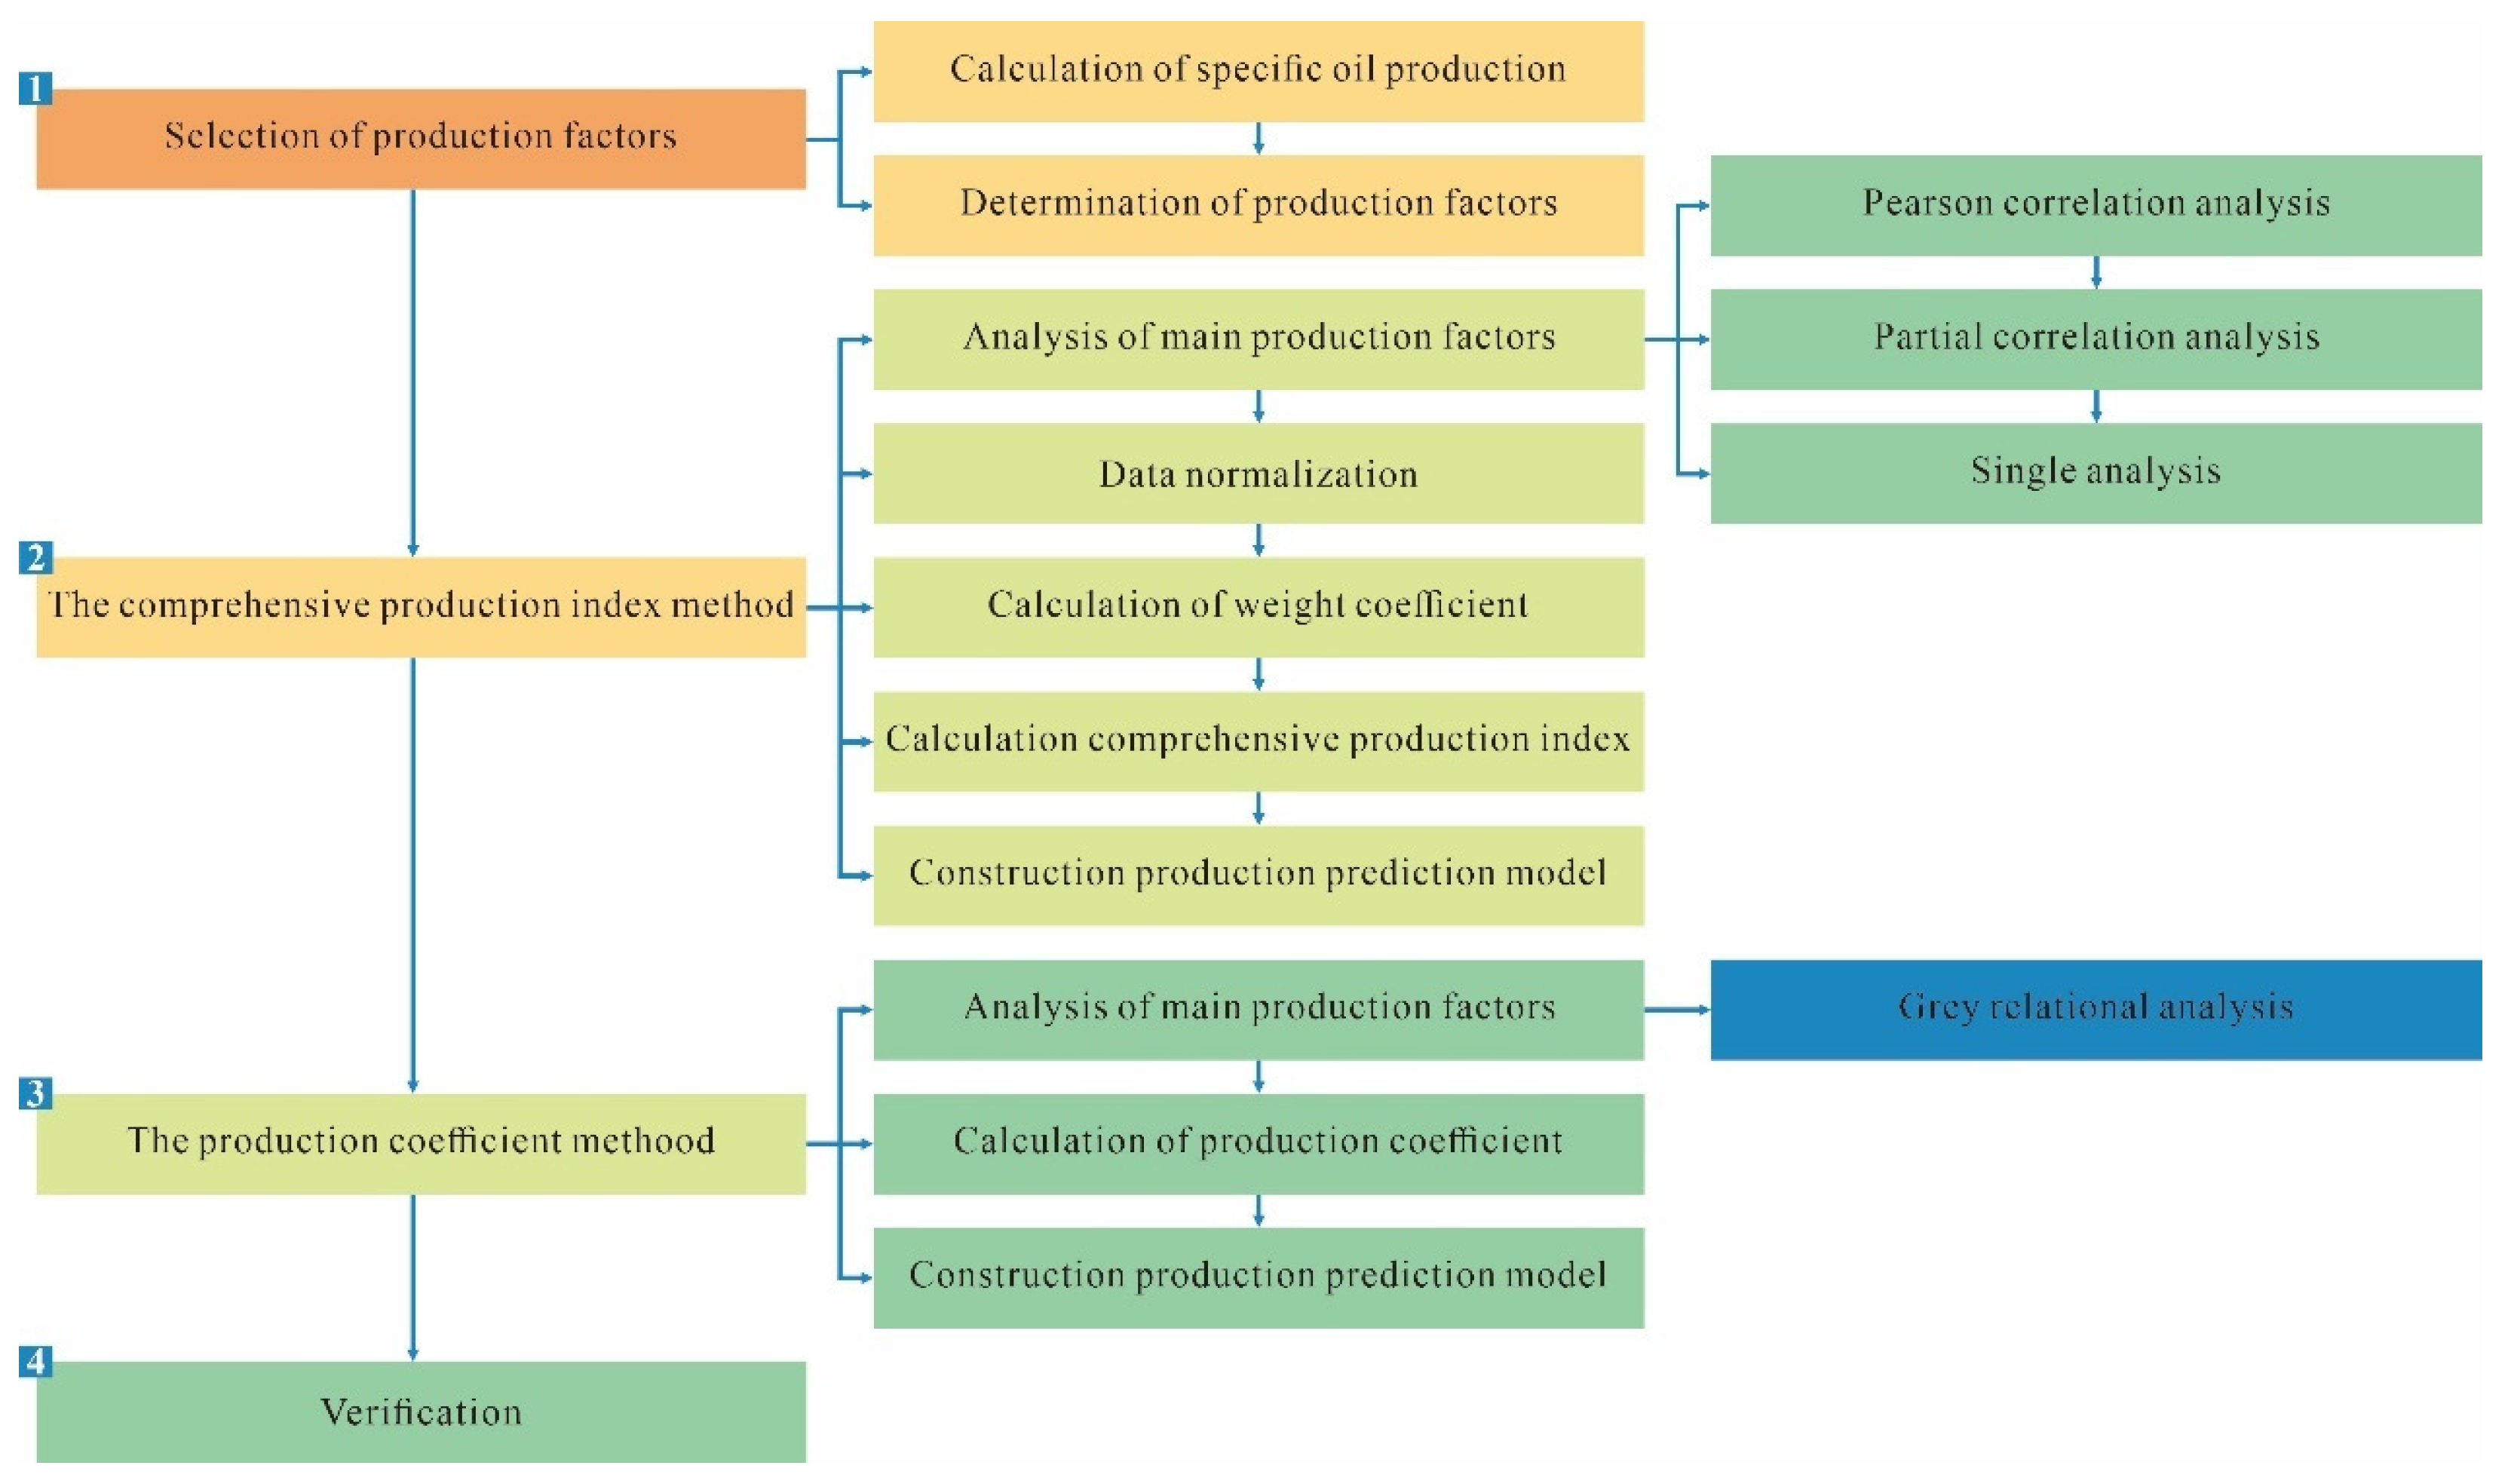
2. Selection of Production Factors
2.1. Calculation of Specific Oil Production
2.2. Determination of Production Factors
3. Construction of Comprehensive Production Index Model
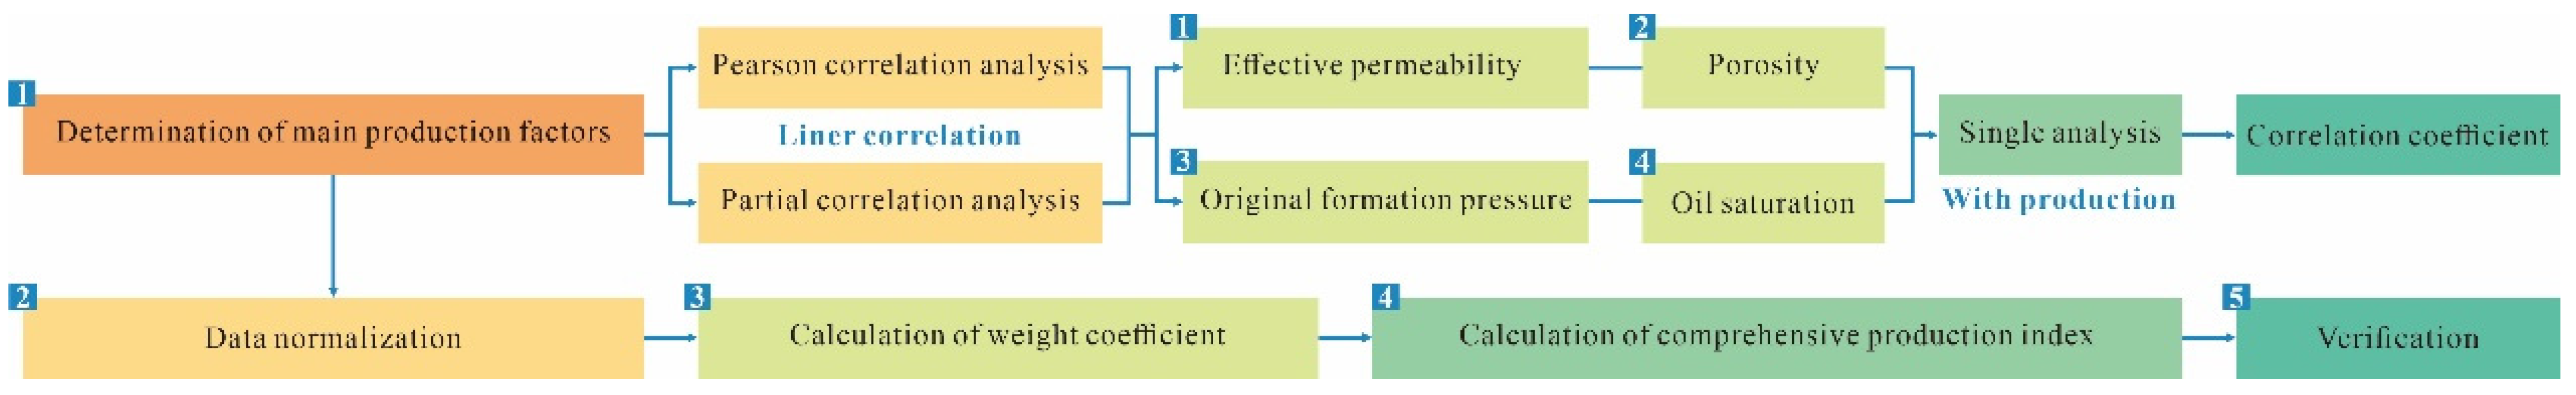
3.1. Analysis of Main Production Factors
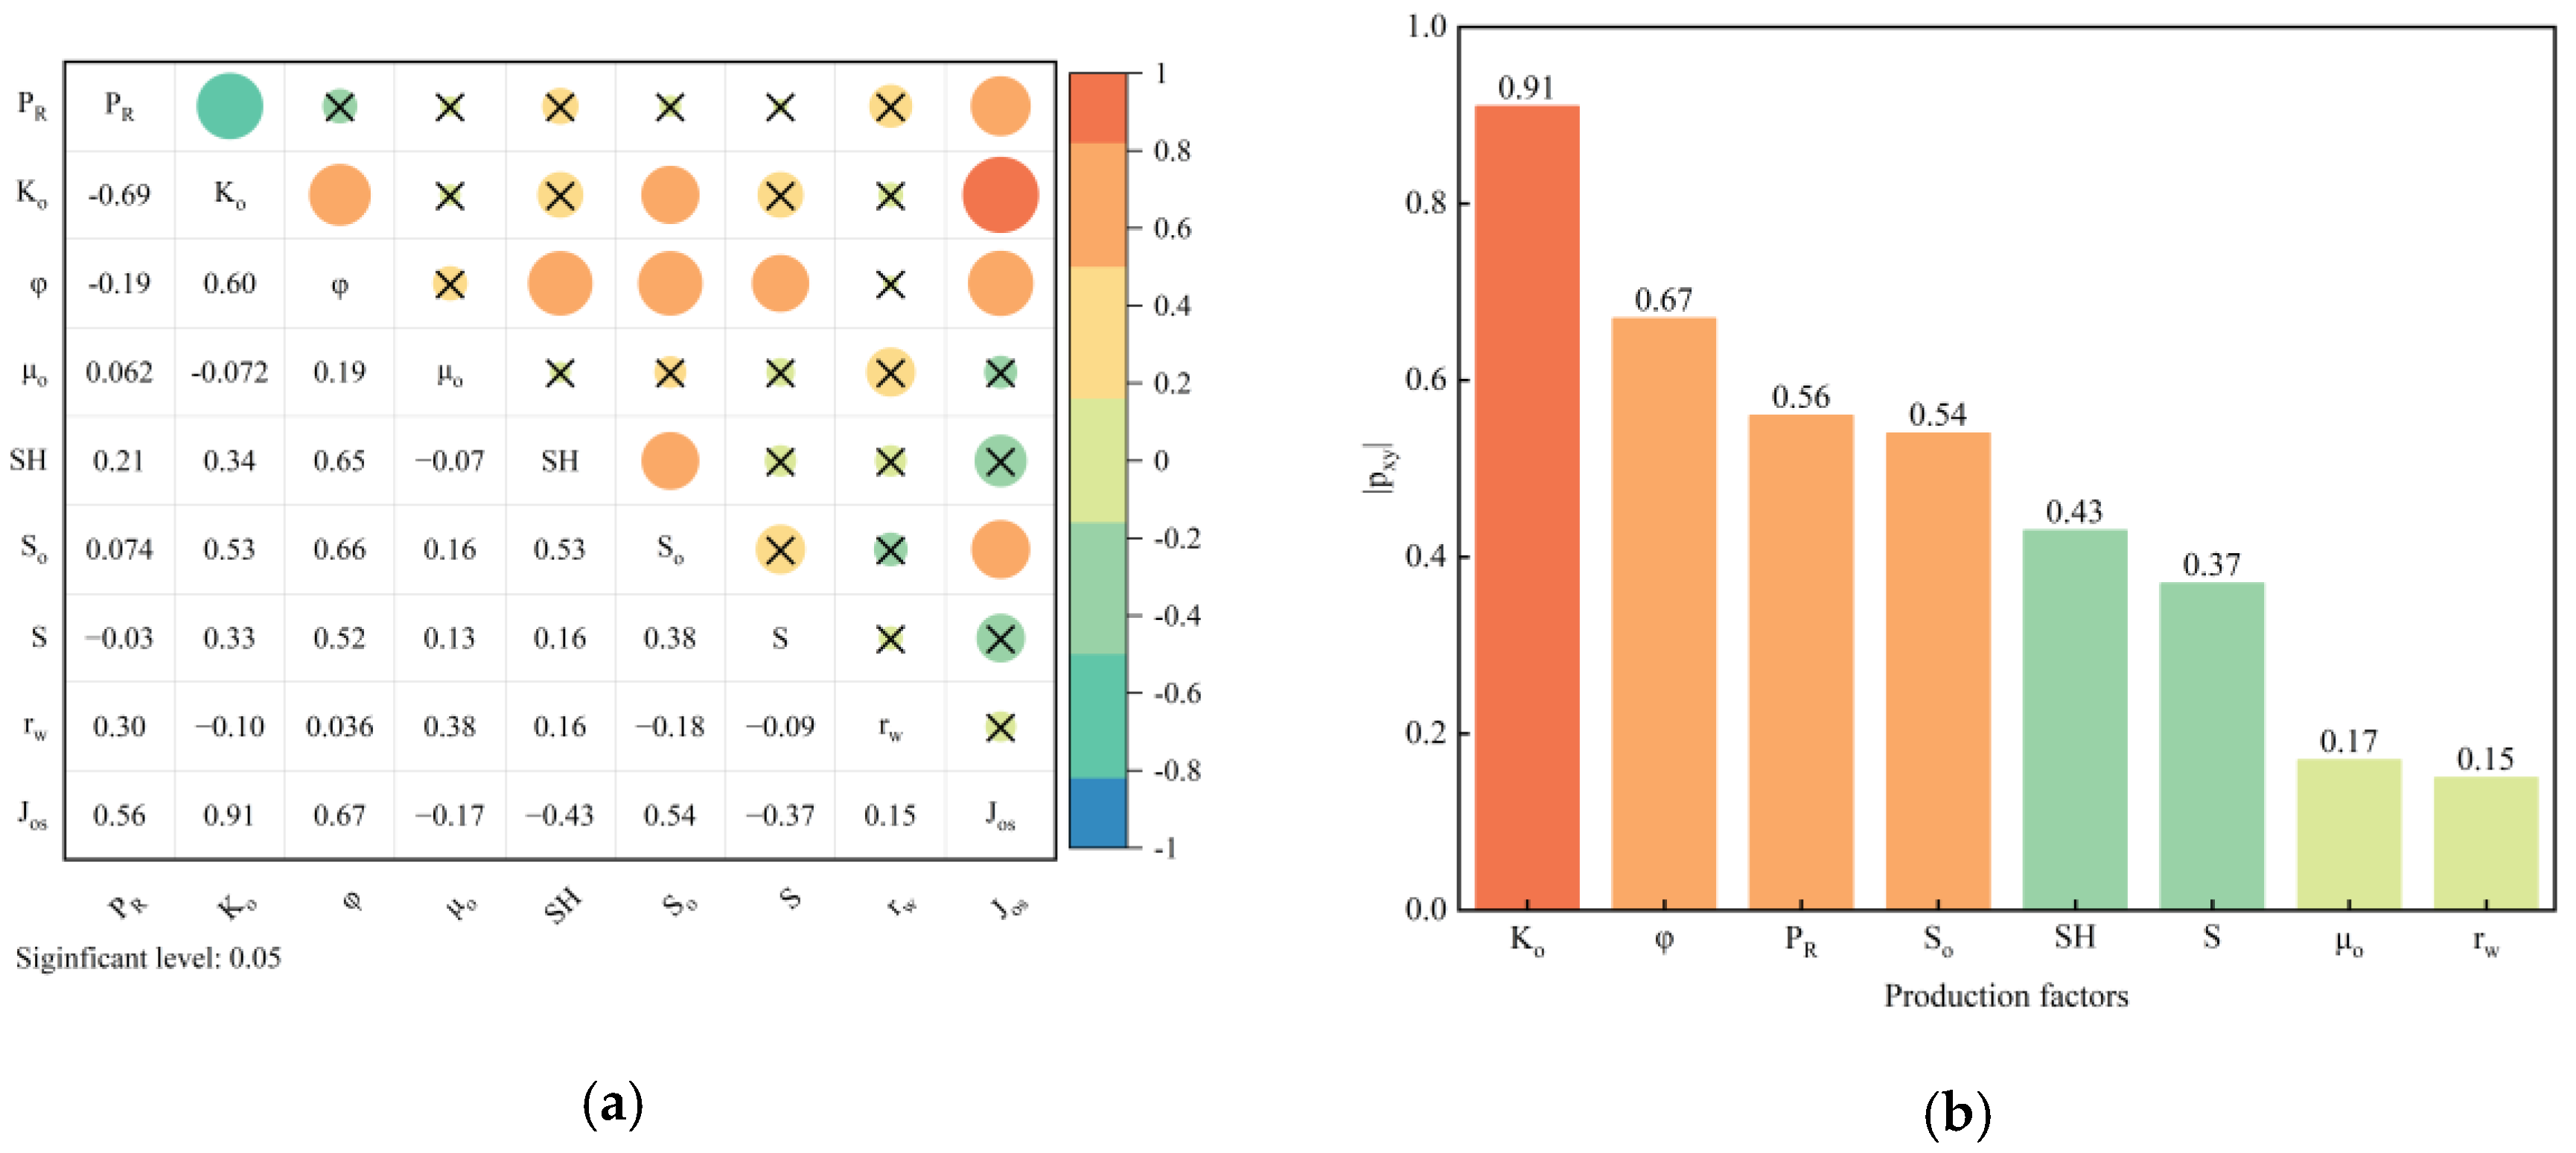
3.1.1. Pearson Correlation Analysis
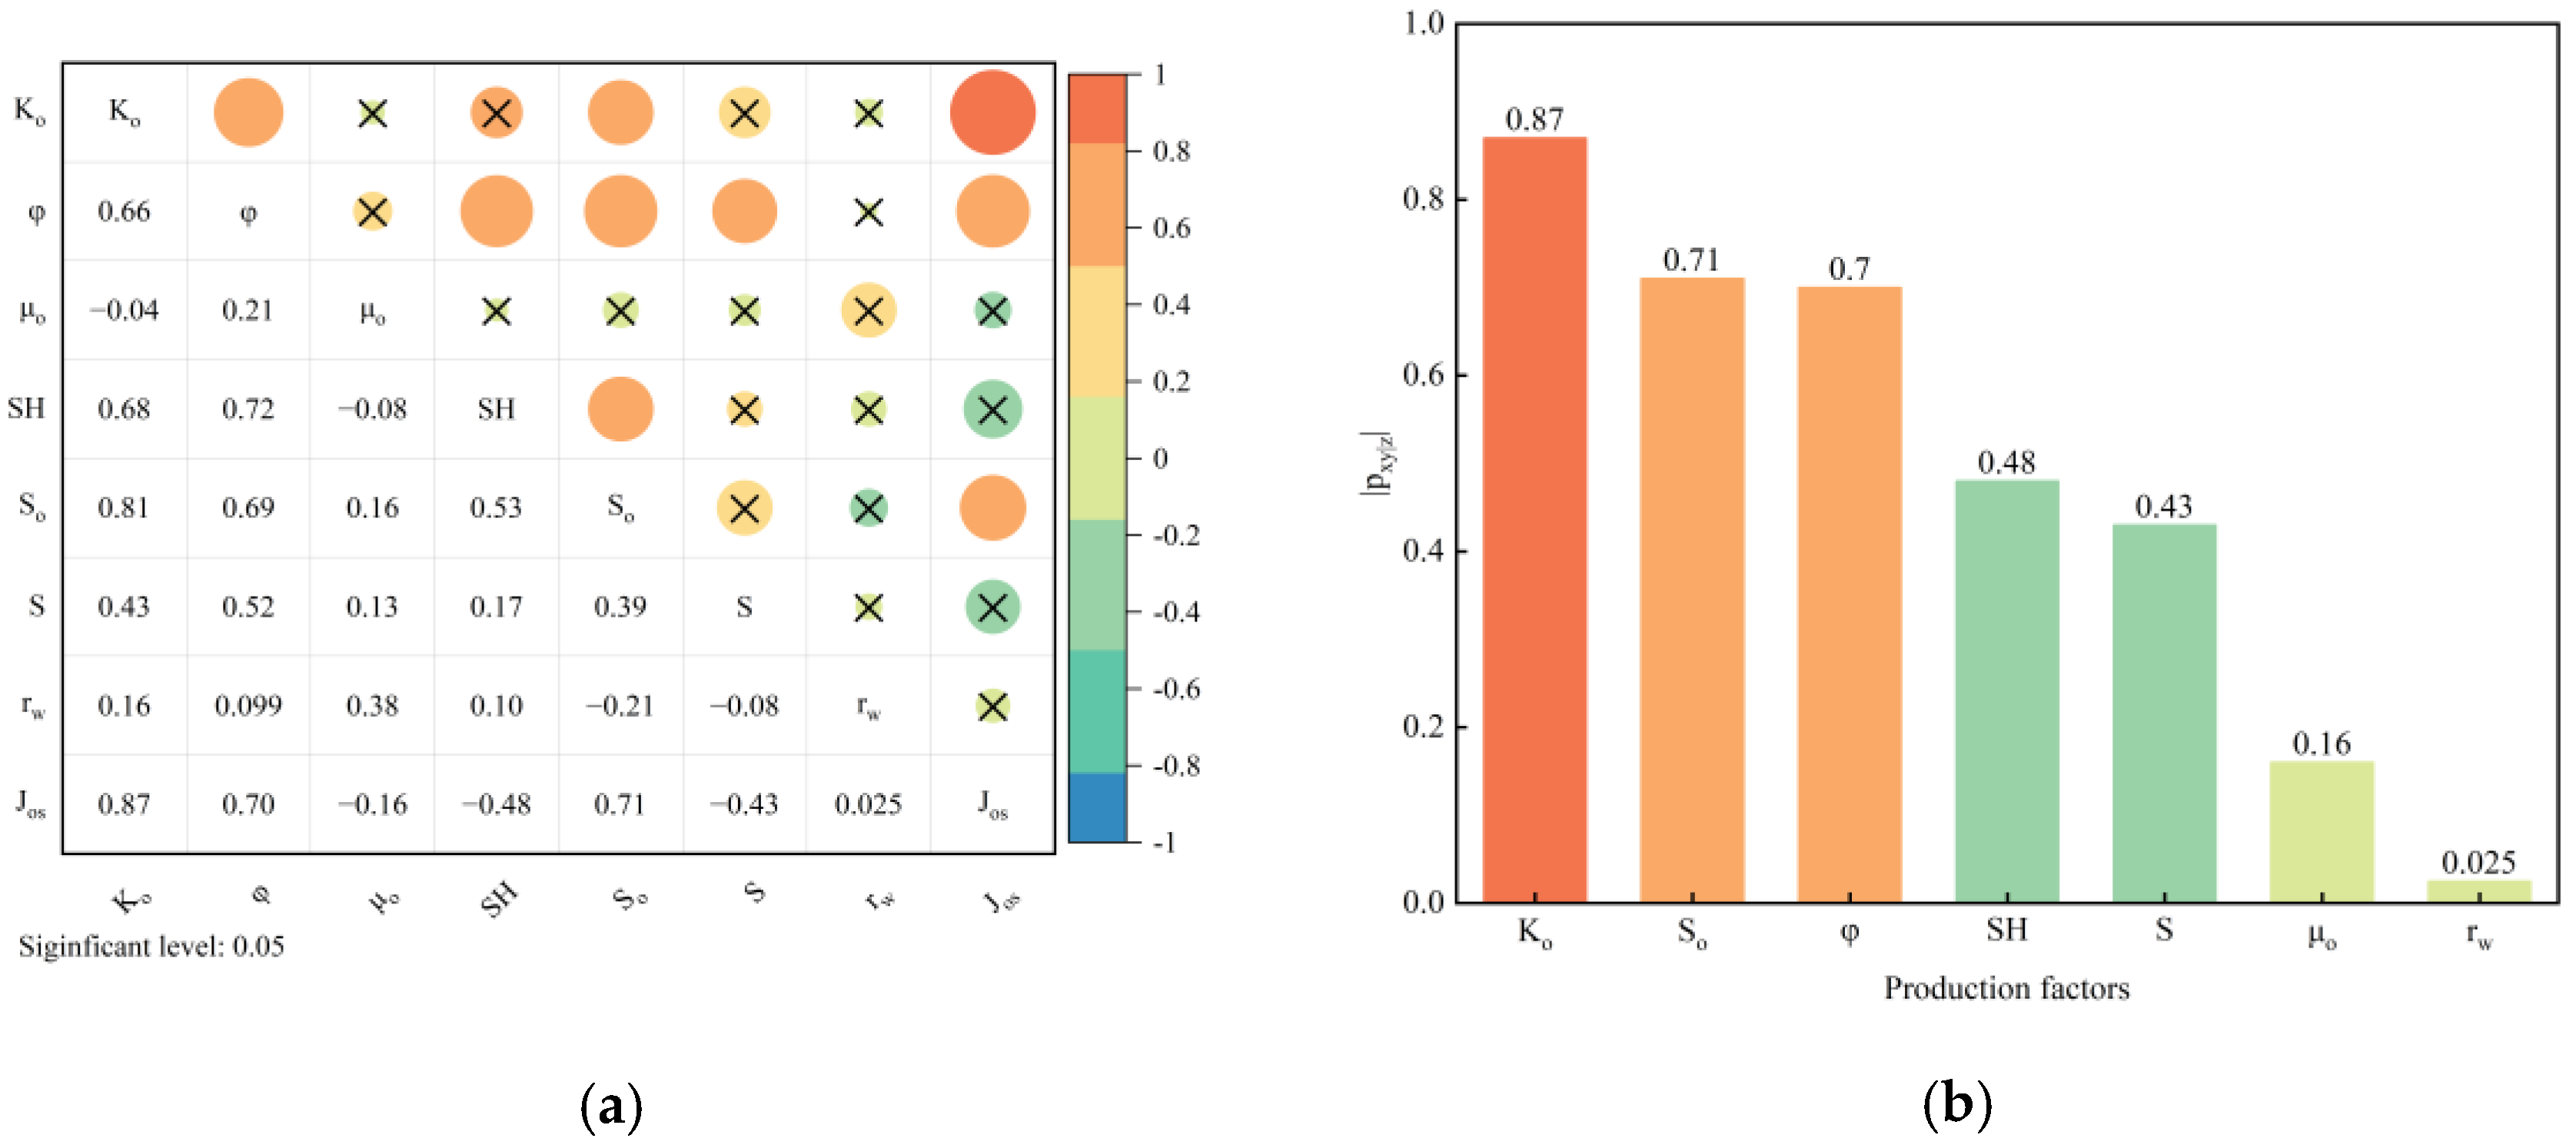
3.1.2. Partial Correlation Analysis
3.1.3. Analysis of Single-Production Factor
- (I)
- Analysis of effective permeability and production
- (II)
- Analysis of porosity and production
- (III)
- Analysis of oil saturation and production
3.2. Data Normalization
3.3. Calculation of Weight Coefficient
3.4. Calculation of Comprehensive Production Index
4. Construction Production Coefficient Model
4.1. Grey Relational Analysis of Main Production Factors
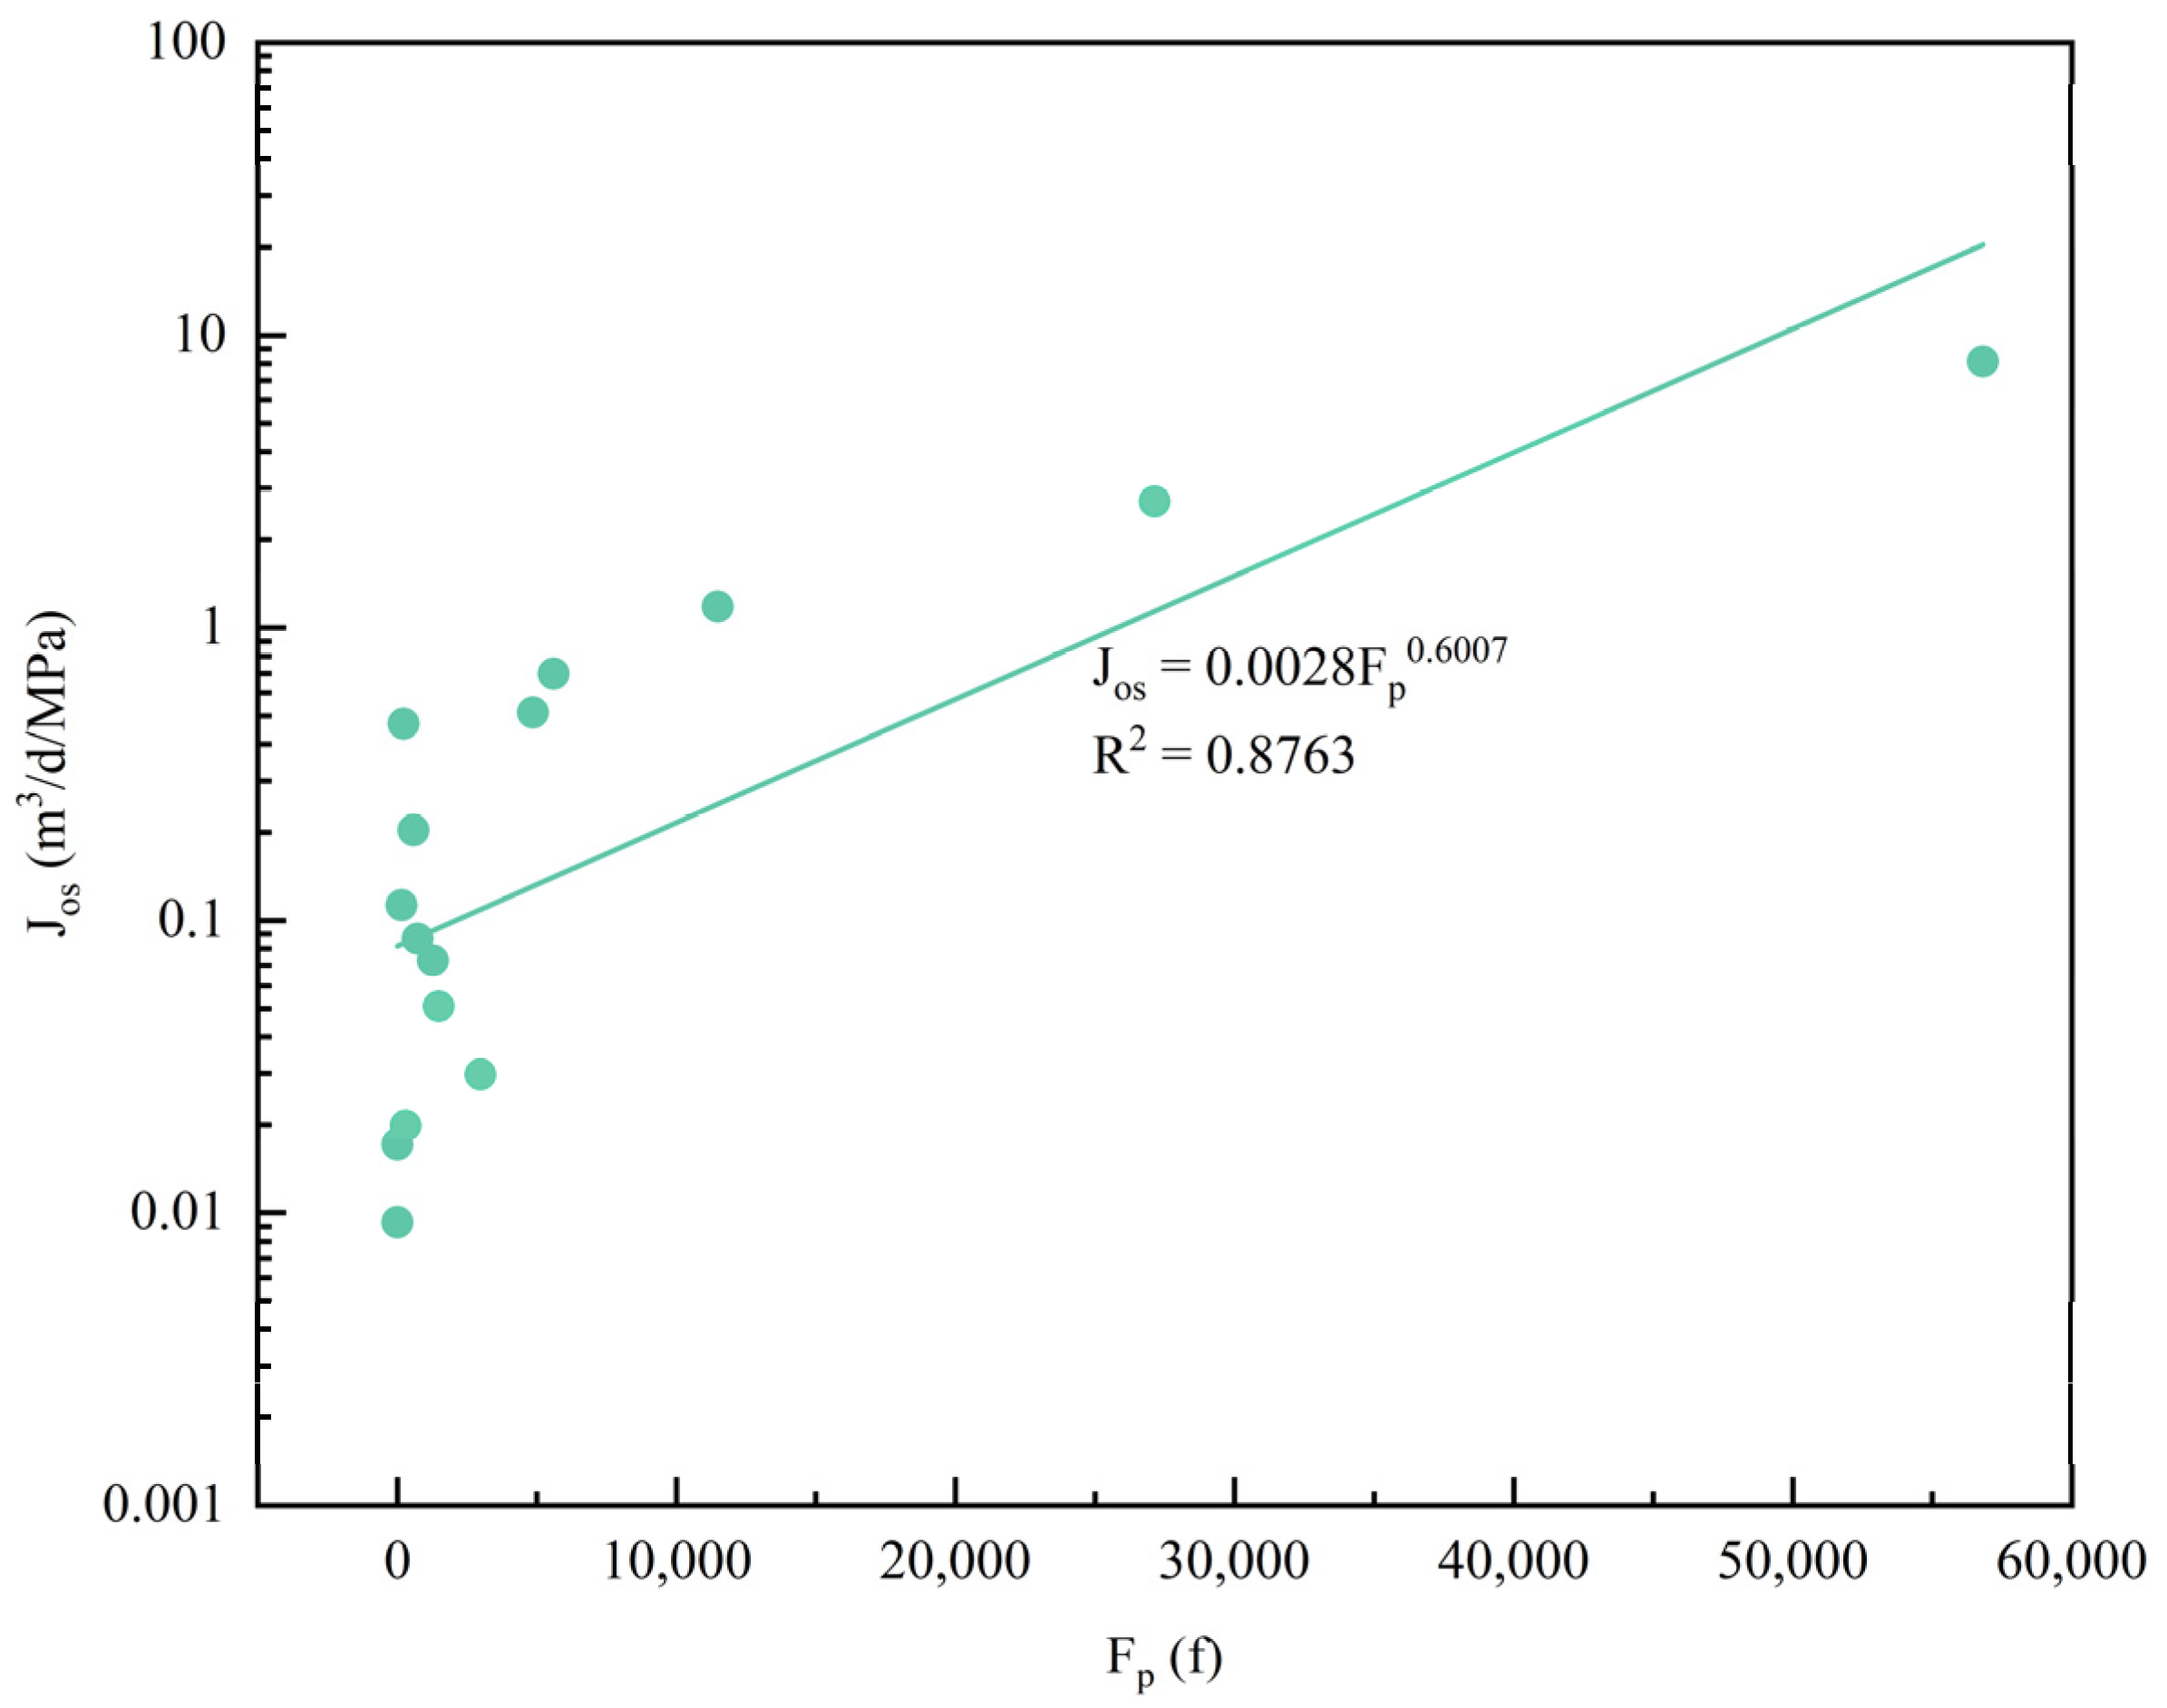
4.2. Calculation of Production Coefficient
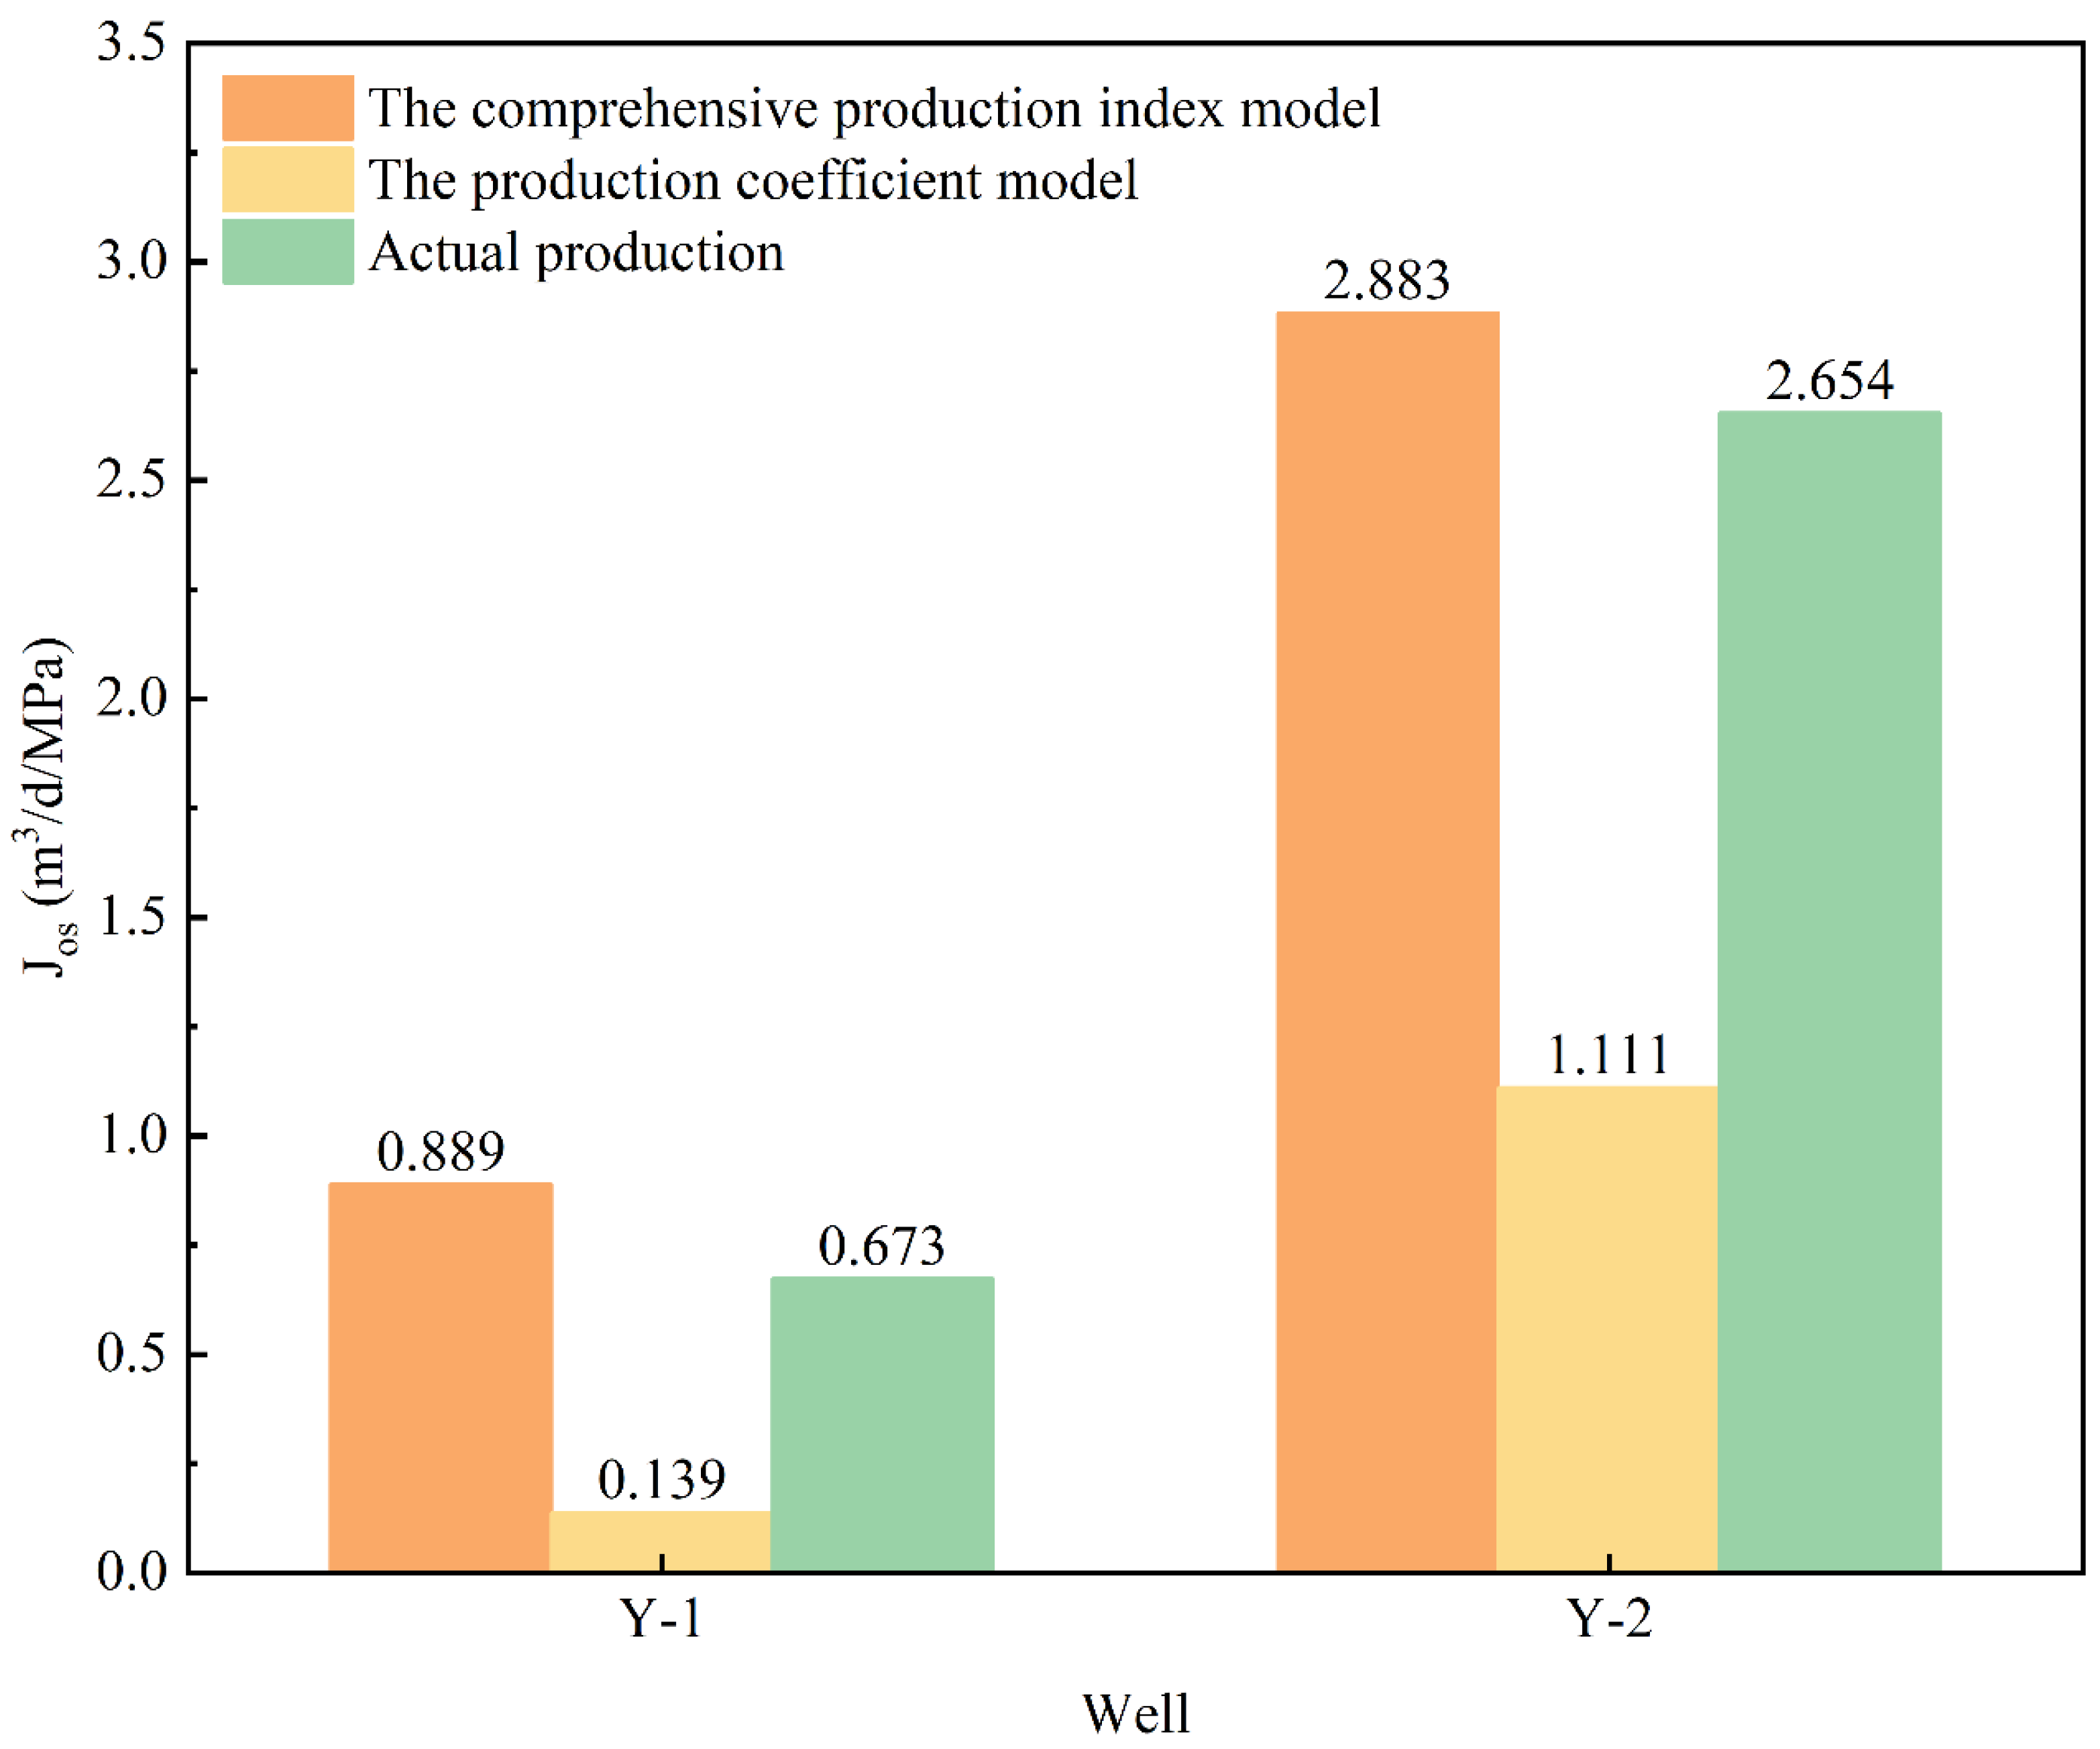
5. Verification
6. Conclusions
- (1)
- According to the results of the Pearson correlation analysis, partial correlation analysis, and grey relational analysis, the main production factors involved in the test well in the research area are effective permeability, porosity, oil saturation, and shale content. Effective permeability is the most critical main production factor, and effective permeability has a great influence on production in the L Formation of the Beibu Basin.
- (2)
- According to the verification results achieved using the comprehensive production index method, the average error between the actual and predicted production values is 20.40%. The predicted production under this model is higher than the actual production. The model has shown a strong performance in applications within the L Formation of the Beibu Basin, providing more accurate production predictions.
- (3)
- According to the verification results achieved using the production coefficient method, the average error between the actual and predicted production values is 68.78%. The predicted production under this model is lower than the actual production. The model has been poorly applied to the L Formation of the Beibu Basin.
- (4)
- This method can be employed to rapidly predict the production of test wells and offer valuable insights for their further development.
Author Contributions
Funding
Data Availability Statement
Acknowledgments
Conflicts of Interest
Nomenclature
| a | the weight coefficients |
| the average of xi | |
| Bo | the oil volume factor, m3/m3 |
| cov (x, y) | the covariance of x and y |
| the covariance of and | |
| C | the unit conversion coefficient, constant |
| Fo | the comprehensive production index |
| Fp | the production coefficient |
| h | the effective thickness, m |
| i | the production factor index, i = 1, 2, 3, ……, m |
| Jo | the production index, m3/d/MPa |
| Jos | the specific oil production index, m3/d/Mpa |
| k | the number of samples |
| Ko | the effective permeability, mD |
| the normalization of effective permeability | |
| m | the total number of production factors index |
| maxi | the maximum value of i |
| maxk | the maximum value of k |
| mini | the minimum value of i |
| mink | the minimum value of k |
| n | the total number of samples |
| pR | the original formation pressure, MPa |
| pwf | the well bottom pressure, Mpa |
| pxy | the Pearson correlation coefficient, pxy ∈ [−1, 1] |
| pxy|z | the partial correlation coefficient, pxy|z ∈ [−1, 1] |
| qo | the oil production rate, m3/d |
| re | the supply oil radius, m |
| ri | the grey correlation degree |
| rw | the well radius, m |
| R2 | the correlation coefficient |
| S | the skin coefficient, dimensionless |
| SH | the shale content, % |
| So | the oil saturation, % |
| the normalization of oil saturation | |
| var (x) | the variance of x |
| var (y) | the variance of y |
| the variance of | |
| the variance of | |
| x | the production factors |
| the normalization of production factors, dimensionless | |
| x0 | the reference sequence |
| xi | the comparison sequence |
| the maximum value of x | |
| the minimum value of x | |
| the difference sequences, and | |
| Δp | the pressure differential, MPa |
| the grey incidence coefficient | |
| μo | the viscosity, MPa/s |
| ρ | the resolution coefficient, ρ = 0.5 |
| φ | the porosity, % |
| the Normalization of porosity |
References
- Sun, L.D.; Zou, C.N.; Zhu, R.K.; Zhang, Y.H.; Zhang, S.C.; Zhang, B.M.; Zhu, G.Y.; Gao, Z.Y. Formation, distribution and potential of deep hydrocarbon resources in China. Pet. Explor. Dev. 2013, 40, 687–695. [Google Scholar] [CrossRef]
- Wang, M.; Guo, Z.Q.; Jiao, C.X.; Lu, S.F.; Li, J.B.; Xue, H.T.; Li, J.J.; Li, J.Q.; Chen, G.H. Exploration progress and geochemical features of lacustrine shale oils in China. Pet. Explor. Dev. 2019, 178, 975–986. [Google Scholar] [CrossRef]
- Dou, L.R.; Wen, Z.X.; Wang, J.J.; Wang, Z.M.; He, Z.J.; Liu, X.B.; Zhang, N.N. Analysis of the world oil and gas exploration situation in 2021. Pet. Explor. Dev. 2022, 49, 1195–1209. [Google Scholar] [CrossRef]
- Wen, Z.X.; Wang, J.J.; Wang, Z.M.; He, Z.J.; Song, C.P.; Liu, X.B.; Zhang, N.N.; Ji, T.Y. Analysis of the world deepwater oil and gas exploration situation. Pet. Explor. Dev. 2023, 50, 1060–1076. [Google Scholar] [CrossRef]
- Diwu, P.X.; Liu, T.J.; You, Z.J.; Jiang, B.Y.; Zhou, J. Effect of low velocity non-Darcy flow on pressure response in shale and tight oil reservoirs. Fuel 2018, 216, 398–406. [Google Scholar] [CrossRef]
- Sun, L.D.; Fang, C.L.; Li, F.; Zhu, R.K.; He, D.B. Petroleum exploration and development practices of sedimentary basins in China and research progress of sedimentology. Pet. Explor. Dev. 2010, 37, 385–396. [Google Scholar] [CrossRef]
- Zhu, G.Y.; Jiang, H.; Huang, S.P.; Ma, D.B.; Zhang, M.; Chen, W.Y.; Guan, S.W.; Fan, J.J.; Zeng, F.Y. New progress of marine hydrocarbon accumulation theory and prediction of super large oil and gas areas in China. Acta Petrolei Sin. 2023, 1–25. Available online: http://kns.cnki.net/kcms/detail/11.2128.TE.20230625.1736.002.html (accessed on 18 July 2024).
- Ding, X.; Zhang, F.; Zhang, G.Q. Modelling of time-dependent proppant embedment and its influence on tight gas production. J. Nat. Gas Sci. Eng. 2020, 82, 103519. [Google Scholar] [CrossRef]
- Jia, C.Z.; Zheng, M.; Zhang, Y.F. Unconventional hydrocarbon resources in China and the prospect of exploration and development. Pet. Explor. Dev. 2012, 39, 139–146. [Google Scholar] [CrossRef]
- Liu, Z.P.; Qin, M.; Zhang, J.G.; Li, Z.; Song, P. Mechanism and Adaptability Evaluation of Well Soaking in Tight Reservoir. Chem. Technol. Fuels Oils 2022, 58, 181–184. [Google Scholar] [CrossRef]
- Ma, X.; Liu, Z. Predicting the oil production using the novel multivariate nonlinear model based on Arps decline model and kernel method. Neural Comput. Appl. 2018, 29, 579–591. [Google Scholar] [CrossRef]
- Zhao, Z.F.; Tang, M.R.; Du, X.F.; An, J.; Cai, M.Y.; Su, Y.L.; Wang, W.D. Factors affecting rate transient of fractured horizontal well in tight oil reservoir-Erdos Basin Changqing tight oil. J. Shenzhen Univ. (Sci. Eng.) 2017, 34, 647–654. [Google Scholar] [CrossRef]
- Hu, X.L.; Wang, J.; Pan, L. Influencing factors and prediction methods for production of tight oil reservoir in Pingbei Oilfield. Xinjiang Pet. Geol. 2022, 43, 346–353. [Google Scholar]
- Wang, X.H.; Gao, Y.W.; Li, G.L.; Yang, L.; Wu, W.; Zhang, W.; Zhou, J.F. Main controlling factors and productivity prediction of dual-porosity medium reservoirs in Dongdaohaizi Sag. Sci. Technol. Eng. 2023, 23, 14174–14182. [Google Scholar]
- Hu, J.H.; Zhang, C.; Rui, Z.H.; Yu, Y.L.; Chen, Z.X. Fractured horizontal well productivity prediction in tight oil reservoirs. J. Pet. Sci. Eng. 2017, 151, 159–168. [Google Scholar] [CrossRef]
- Wu, L.H.; Guo, X.Z.; Luo, W.; Zhang, Z.M.; Zhang, W.C. Influence factors controlling the productivity of horizontal well by volume fracturing in tight oil reservoirs-a case of dense oil horizontal well in Damintun, Liaohe Oilfield. Unconv. Oil Gas 2018, 5, 56–62. [Google Scholar]
- Zhu, W.Y.; Liu, Y.F.; Li, Z.X.; Yue, M.; Kong, D.B. Mathematical model of multi-scale flow in tight oil reservoirs and analysis of influential factors. J. Cent. South Univ. (Sci. Technol.) 2022, 53, 2347–2360. [Google Scholar]
- Li, J.T.; Zhou, X.F.; Gayubov, A.; Shamil, S. Study on production performance characteristics of horizontal wells in low permeability and tight oil reservoirs. Energy 2023, 284, 129286. [Google Scholar] [CrossRef]
- Xu, C.Y.; Yang, X.L.; Liu, C.; Kang, Y.L.; Bai, Y.R.; You, Z.J. Dynamic fracture width prediction for lost circulation control and formation damage prevention in ultra-deep fractured tight reservoir. Fuel 2022, 307, 121770. [Google Scholar] [CrossRef]
- Xu, C.Y.; Liu, L.; Yang, Y.; Kang, Y.L.; You, Z.J. An innovative fracture plugging evaluation method for drill-in fluid loss control and formation damage prevention in deep fractured tight reservoirs. Fuel 2024, 358, 130123. [Google Scholar] [CrossRef]
- Panja, P.; Milind, D. Factors that control condensate production from shales: Surrogate reservoir models and uncertainty analysis. SPE Res. Eval. Eng. 2016, 19, 130–141. [Google Scholar] [CrossRef]
- Hu, B.; Pu, J.; Li, C. Experimental investigation on the influence factors of primary production performance of tight oil. Pet. Sci. Technol. 2022, 40, 2179–2192. [Google Scholar] [CrossRef]
- Li, Y.M.; Huang, Y.T.; Ma, H.W.; Chang, C.; Xie, W.Y. Study on the development options of tight sandstone oil reservoirs and their influencing factors. Front. Energy Res. 2022, 10, 1007224. [Google Scholar] [CrossRef]
- Hu, T.H.; Wang, C.J.; Chen, L.Y.; Zheng, S.Y.; Lian, Z.X.; Wang, M.Y. Research and application of fitting model of specific productivity index in heavy oil reservoir. Pet. Reserv. Eval. Dev. 2017, 7, 50–54. [Google Scholar]
- Li, N.; Wang, K.W.; Zhang, G.; Wu, H.L.; Zhao, L.Z.; Wu, L.H.; Feng, Q.F.; Feng, Z. Prediction of gas production in carbonates based on CT analysis and nuclear magnetic resonance (NMR) logging. Pet. Explor. Dev. 2015, 42, 167–174. [Google Scholar] [CrossRef]
- Gao, Q.Y.; Shang, S.G.; Wang, J.; Gao, K.C.; Ma, J.X.; Zhang, Z.; Zhang, G.B. New method for productivity prediction of paleogene middle-deep sandstone reservoir in Bohai Sea area. Prog. Geophys. 2024, 1–13. Available online: http://kns.cnki.net/kcms/detail/11.2982.P.20240611.1309.035.html (accessed on 18 July 2024).
- Lu, C.H.; Jiang, H.Q.; Yang, J.L.; Wang, Z.Q.; Zhang, M.; Li, J.J. Shale oil production prediction and fracturing optimization based on machine learning. J. Pet. Sci. Eng. 2022, 217, 110900. [Google Scholar] [CrossRef]
- Tong, S.K.; Wang, F.Y.; Gao, H.H.; Zhu, W.Y. A machine learning-based method for analyzing factors influencing production capacity and production forecasting in fractured tight oil reservoirs. Int. J. Hydrogen Energy 2024, 70, 136–145. [Google Scholar] [CrossRef]
- Luo, W.J.; Wang, X.D.; Tang, C.F.; Feng, Y.; Shi, E.X. Productivity of multiple fractures in a closed rectangular reservoir. J. Pet. Sci. Eng. 2017, 157, 232–247. [Google Scholar] [CrossRef]
- Li, K.W.; Chen, Z.W. Computation of productivity index with capillary pressure included and its application in interpreting production data from low-permeability oil reservoirs. SPE J. 2012, 17, 1041–1046. [Google Scholar] [CrossRef]
- Luo, W.J.; Wang, X.D.; Feng, Y.; Tang, C.F.; Zhou, Y.F. Productivity analysis for a vertically fractured well under non-Darcy flow condition. J. Pet. Sci. Eng. 2016, 146, 714–725. [Google Scholar] [CrossRef]
- Aulisa, E.; Ibragimov, A.; Walton, J.R. A new method for evaluating the productivity index of nonlinear flows. SPE J. 2009, 14, 693–706. [Google Scholar] [CrossRef]
- Wang, Y.P.; Luo, T.; Gao, Y.; Yu, S.; Wang, S.B.; Zou, Y.R. Pearson correlation analysis of factors controlling the high abundance of rearranged hopanes in crude oils from the Southwest Depression of the Tarim Basin, China. Geochem. J. 2020, 54, 105–115. [Google Scholar] [CrossRef]
- Tian, F.C.; Fu, Y.Q.; Liu, X.W.; Li, D.P.; Jia, Y.P.; Shao, L.F.; Yang, L.Y.; Zhao, Y.D.; Zhao, T.; Yin, Q.W. A Comprehensive Evaluation of Shale Oil Reservoir Quality. Processes 2024, 12, 472. [Google Scholar] [CrossRef]
- Van Aert, R.C.M.; Goose, C. A critical reflection on computing the sampling variance of the partial correlation coefficient. Res. Synth. Methods 2023, 14, 520–525. [Google Scholar] [CrossRef]
- Gao, X.C.; Guo, K.L.; Chen, P.; Yang, H.R.; Zhu, G.W. A productivity prediction method for multi-fractured horizontal wells in tight oil reservoirs considering fracture closure. J. Pet. Explor. Prod. Technol. 2023, 13, 865–876. [Google Scholar] [CrossRef]
- Li, Y.M.; You, X.Y.; Zhao, J.Z.; Pu, X. Production forecast of a multistage fractured horizontal well by an analytical method in shale gas reservoir. Environ. Earth Sci. 2019, 78, 272. [Google Scholar] [CrossRef]
- Wu, C.F.; Liu, X.L.; Zhou, Q.Z.; Zhang, X.Y. Analysis of key factors and prediction of gas production pressure of coalbed methane well: Combining grey relational with principal component regression analysis. Energy Explor. Exploit. 2019, 37, 1348–1363. [Google Scholar] [CrossRef]
- Yang, Z.D.; Li, Z.J.; Liang, H.P.; Zhang, R. Preferred Seepage Channel Identification Based on Multifactorial Gray Correlation Analysis. Chem. Technol. Fuels Oils 2018, 54, 625–631. [Google Scholar] [CrossRef]


| Well | Test | Depth | Formation | Jo | Jos |
|---|---|---|---|---|---|
| No. | No. | m | m3/d/MPa | m3/d/MPa | |
| W-1 | DST 1 | 3127.0–3169.5 | L3 | 19.601 | 0.513 |
| W-2 | DST 1 | 3070.7–3094.6 | L3 | 1.109 | 0.087 |
| W-3 | DST 1 | 3181.8–3225.0 | L3 | 0.294 | 0.020 |
| W-4 | DST 1 | 3125.8–3179.7 | L3 | 4.845 | 0.697 |
| W-5 | DST 1 | 3031.0–3049.0 | L2 | 1.370 | 0.469 |
| W-6 | DST 1 | 3288.6–3354.7 | L3 | 1.238 | 0.073 |
| W-7 | DST 1 | 3104.0–3270.0 | L3 | 1.134 | 0.030 |
| W-8 | DST 1 | 2971.0–3031.0 | L3 | 0.220 | 0.009 |
| W-9 | DST 1 | 3161.0–3180.0 | L1 | 0.235 | 0.017 |
| W-10 | DST 1 | 2968.0–2980.0 | L1 | 1.309 | 0.113 |
| W-11 | DST 1 | 3111.0–3365.5 | L1 | 2.294 | 0.203 |
| W-12 | DST 1 | 2880.0–2897.0 | L1 | 16.759 | 1.180 |
| W-13 | DST 1 | 2211.0–2221.5 | L3 | 11.088 | 2.704 |
| W-14 | DST 1 | 2043.0–2064.0 | L2 | 65.781 | 8.121 |
| W-15 | DST 1 | 3314.0–3323.0 | L2 | 0.224 | 0.051 |
| Well | PR | Ko | φ | μo | SH | So | S | rw | Jos |
|---|---|---|---|---|---|---|---|---|---|
| No. | MPa | mD | % | MPa/s | % | % | f | m | m3/d/MPa |
| W-1 | 38.836 | 27.200 | 14.060 | 2.520 | 12.700 | 64.250 | 0.448 | 0.0785 | 0.513 |
| W-2 | 38.045 | 5.260 | 15.660 | 2.520 | 8.800 | 62.930 | 0.230 | 0.0785 | 0.087 |
| W-3 | 38.051 | 1.750 | 16.000 | 3.616 | 11.000 | 45.700 | 0.604 | 0.108 | 0.020 |
| W-4 | 45.025 | 14.830 | 19.000 | 1.000 | 19.900 | 56.700 | −0.970 | 0.108 | 0.697 |
| W-5 | 47.270 | 0.960 | 12.710 | 1.000 | 18.900 | 42.900 | −0.970 | 0.108 | 0.469 |
| W-6 | 33.908 | 20.900 | 12.000 | 0.300 | 5.100 | 45.000 | −0.990 | 0.0785 | 0.073 |
| W-7 | 33.224 | 18.300 | 12.000 | 0.300 | 13.600 | 45.000 | −0.990 | 0.0785 | 0.030 |
| W-8 | 32.585 | 0.047 | 12.100 | 0.301 | 6.300 | 44.150 | −0.993 | 0.0785 | 0.009 |
| W-9 | 49.210 | 0.063 | 11.380 | 0.585 | 14.200 | 61.060 | −1.990 | 0.0785 | 0.017 |
| W-10 | 28.758 | 2.360 | 12.500 | 0.828 | 5.400 | 36.400 | 3.080 | 0.0785 | 0.113 |
| W-11 | 50.930 | 4.100 | 13.270 | 1.195 | 10.700 | 55.670 | 1.580 | 0.108 | 0.203 |
| W-12 | 28.620 | 78.700 | 14.300 | 2.161 | 10.200 | 57.690 | 1.740 | 0.11025 | 1.180 |
| W-13 | 21.150 | 78.200 | 18.460 | 1.267 | 18.800 | 58.550 | 0.127 | 0.07856 | 2.704 |
| W-14 | 21.146 | 140.000 | 21.360 | 0.526 | 19.000 | 73.710 | 3.750 | 0.07856 | 8.121 |
| W-15 | 55.665 | 4.100 | 18.600 | 1.184 | 19.500 | 67.300 | 5.500 | 0.0785 | 0.051 |
| No. | Production Factor | Relationship Model | R2 |
|---|---|---|---|
| 1 | Effective permeability | Jos = 0.047Ko − 0.2917 | 0.827 |
| 2 | Porosity | Jos = 0.4504φ − 5.7557 | 0.451 |
| 3 | Oil saturation | Jos = 0.1066So − 4.8521 | 0.293 |
| No. | Well | Test | Ko’ | φ’ | So’ |
|---|---|---|---|---|---|
| No. | No. | f | f | f | |
| 1 | W-1 | DST 1 | 0.194 | 0.269 | 0.746 |
| 2 | W-2 | DST 1 | 0.037 | 0.429 | 0.711 |
| 3 | W-3 | DST 1 | 0.012 | 0.463 | 0.249 |
| 4 | W-4 | DST 1 | 0.106 | 0.764 | 0.544 |
| 5 | W-5 | DST 1 | 0.007 | 0.133 | 0.174 |
| 6 | W-6 | DST 1 | 0.149 | 0.062 | 0.231 |
| 7 | W-7 | DST 1 | 0.130 | 0.062 | 0.231 |
| 8 | W-8 | DST 1 | 0.000 | 0.072 | 0.208 |
| 9 | W-9 | DST 1 | 0.000 | 0.000 | 0.661 |
| 10 | W-10 | DST 1 | 0.017 | 0.112 | 0.000 |
| 11 | W-11 | DST 1 | 0.029 | 0.189 | 0.516 |
| 12 | W-12 | DST 1 | 0.562 | 0.293 | 0.571 |
| 13 | W-13 | DST 1 | 0.558 | 0.709 | 0.594 |
| 14 | W-14 | DST 1 | 1.000 | 1.000 | 1.000 |
| 15 | W-15 | DST 1 | 0.029 | 0.723 | 0.828 |
| No. | Production Factor | R2 | The Sum of R2 | a | The Sum of a |
|---|---|---|---|---|---|
| 1 | Effective permeability | 0.827 | 1.571 | 0.526 | 1.000 |
| 2 | Porosity | 0.451 | 0.287 | ||
| 3 | Oil saturation | 0.293 | 0.187 |
| Production Factor | Grey Correlation Degree | Rank |
|---|---|---|
| Effective permeability | 0.908 | 1 |
| Shale content | 0.815 | 2 |
| Porosity | 0.814 | 3 |
| Viscosity | 0.813 | 4 |
| Oil saturation | 0.812 | 5 |
| Well radius | 0.806 | 6 |
| Original formation pressure | 0.784 | 7 |
| Skin coefficient | 0.684 | 8 |
| Well | Test | Formation | Ko | φ | SH | Fp | Jos |
|---|---|---|---|---|---|---|---|
| No. | No. | mD | % | % | m3/d/MPa | ||
| W-1 | DST 1 | L3 | 27.200 | 14.060 | 12.700 | 4856.886 | 0.513 |
| W-2 | DST 1 | L3 | 5.260 | 15.660 | 8.800 | 724.870 | 0.087 |
| W-3 | DST 1 | L3 | 1.750 | 16.000 | 11.000 | 308.000 | 0.020 |
| W-4 | DST 1 | L3 | 14.830 | 19.000 | 19.900 | 5607.223 | 0.697 |
| W-5 | DST 1 | L2 | 0.960 | 12.710 | 18.900 | 230.610 | 0.469 |
| W-6 | DST 1 | L3 | 20.900 | 12.000 | 5.100 | 1279.080 | 0.073 |
| W-7 | DST 1 | L3 | 18.300 | 12.000 | 13.600 | 2986.560 | 0.030 |
| W-8 | DST 1 | L3 | 0.047 | 12.100 | 6.300 | 3.598 | 0.009 |
| W-9 | DST 1 | L1 | 0.063 | 11.380 | 14.200 | 10.229 | 0.017 |
| W-10 | DST 1 | L1 | 2.360 | 12.500 | 5.400 | 159.300 | 0.113 |
| W-11 | DST 1 | L1 | 4.100 | 13.270 | 10.700 | 582.155 | 0.203 |
| W-12 | DST 1 | L1 | 78.700 | 14.300 | 10.200 | 11,479.182 | 1.180 |
| W-13 | DST 1 | L3 | 78.200 | 18.460 | 18.800 | 27,139.154 | 2.704 |
| W-14 | DST 1 | L2 | 140.000 | 21.360 | 19.000 | 56,817.600 | 8.121 |
| W-15 | DST 1 | L2 | 4.100 | 18.600 | 19.500 | 1487.070 | 0.051 |
| No. | Well | Test | Formation | Ko | φ | So | SH | Jos |
|---|---|---|---|---|---|---|---|---|
| No. | No. | mD | % | % | % | m3/d/MPa | ||
| 1 | Y-1 | DST 1 | L2 | 2.160 | 16.840 | 59.782 | 18.200 | 0.673 |
| 2 | Y-2 | DST 1 | L3 | 50.04 | 20.340 | 58.270 | 20.800 | 2.654 |
| Well | Ko’ | φ’ | So’ | Fo | Prediction Jos | Actual Jos | Relative Error |
|---|---|---|---|---|---|---|---|
| No. | f | f | f | f | m3/d/MPa | m3/d/MPa | % |
| Y-1 | 0.015 | 0.547 | 0.627 | 0.282 | 0.889 | 0.673 | 32.200 |
| Y-2 | 0.357 | 0.898 | 0.586 | 0.555 | 2.883 | 2.654 | 8.600 |
| Well | Ko | φ | SH | Fp | Prediction Jos | Actual Jos | Relative Error |
|---|---|---|---|---|---|---|---|
| No. | mD | % | % | f | m3/d/MPa | m3/d/MPa | % |
| Y-1 | 2.16 | 16.84 | 18.2 | 662.014 | 0.139 | 0.673 | 79.410 |
| Y-2 | 50.04 | 20.34 | 20.8 | 21,170.523 | 1.111 | 2.654 | 58.147 |
Disclaimer/Publisher’s Note: The statements, opinions and data contained in all publications are solely those of the individual author(s) and contributor(s) and not of MDPI and/or the editor(s). MDPI and/or the editor(s) disclaim responsibility for any injury to people or property resulting from any ideas, methods, instructions or products referred to in the content. |
© 2024 by the authors. Licensee MDPI, Basel, Switzerland. This article is an open access article distributed under the terms and conditions of the Creative Commons Attribution (CC BY) license (https://creativecommons.org/licenses/by/4.0/).
Share and Cite
Gao, X.; Guo, K.; Li, Q.; Jin, Y.; Liu, J. Determination of the Main Production Factors and Production Predictions of Test Wells in the Offshore Tight Oil Reservoirs in the L Formation of the Beibu Basin Using Multivariate Statistical Methods. Processes 2024, 12, 1922. https://doi.org/10.3390/pr12091922
Gao X, Guo K, Li Q, Jin Y, Liu J. Determination of the Main Production Factors and Production Predictions of Test Wells in the Offshore Tight Oil Reservoirs in the L Formation of the Beibu Basin Using Multivariate Statistical Methods. Processes. 2024; 12(9):1922. https://doi.org/10.3390/pr12091922
Chicago/Turabian StyleGao, Xinchen, Kangliang Guo, Qiangyu Li, Yuhang Jin, and Jiakang Liu. 2024. "Determination of the Main Production Factors and Production Predictions of Test Wells in the Offshore Tight Oil Reservoirs in the L Formation of the Beibu Basin Using Multivariate Statistical Methods" Processes 12, no. 9: 1922. https://doi.org/10.3390/pr12091922
APA StyleGao, X., Guo, K., Li, Q., Jin, Y., & Liu, J. (2024). Determination of the Main Production Factors and Production Predictions of Test Wells in the Offshore Tight Oil Reservoirs in the L Formation of the Beibu Basin Using Multivariate Statistical Methods. Processes, 12(9), 1922. https://doi.org/10.3390/pr12091922