Article

Supramolecular Solvent-Based Extraction of Microgreens: Taguchi Design Coupled-ANN Multi-Objective Optimization

1
Faculty of Technology Novi Sad, University of Novi Sad, Bulevar cara Lazara 1, 21000 Novi Sad, Serbia
2
Institute of General and Physical Chemistry, Studentski trg 12–16, 11000 Belgrade, Serbia
*
Author to whom correspondence should be addressed.
Processes 2024, 12(7), 1451; https://doi.org/10.3390/pr12071451
Submission received: 5 June 2024 / Revised: 8 July 2024 / Accepted: 9 July 2024 / Published: 11 July 2024

Abstract

:
Supramolecular solvent-based extraction (SUPRAS) stands out as a promising approach, particularly due to its environmentally friendly and efficient characteristics. This research explores the optimization of SUPRAS extraction for sango radish and kale microgreens, focusing on enhancing the extraction efficiency. The Taguchi experimental design and artificial neural network (ANN) modeling were utilized to systematically optimize extraction parameters (ethanol content, SUPRAS: equilibrium ratio, centrifugation rate, centrifugation time, and solid-liquid ratio). The extraction efficiency was evaluated by measuring the antioxidant activity (DPPH assay) and contents of chlorophylls, carotenoids, phenolics, and anthocyanidins. The obtained results demonstrated variability in phytochemical contents and antioxidant activities across microgreen samples, with the possibility of achieving high extraction yields using the prediction of optimized parameters. The optimal result for sango radish can be achieved at an ethanol content of 35.7%; SUPRAS: equilibrium ratio of 1 v/v, centrifugation rate of 4020 rpm, centrifugation time of 19.84 min, and solid-liquid ratio of 30.2 mg/mL. The following parameters are predicted for maximal extraction efficiency for kale: ethanol content of 35.64%; SUPRAS: equilibrium ratio of 1 v/v; centrifugation rate of 3927 rpm; centrifugation time of 19.83 min; and solid-liquid ratio of 30.4 mg/mL. Additionally, laboratory verification of predicted SUPRAS parameters showed very low divergency degrees for both microgreens (–3.09 to 2.36% for sango radish, and −2.57 to 3.58% for kale). This potential of SUPRAS extraction, coupled with statistical and computational optimization techniques, can enhance the recovery of valuable bioactive compounds from microgreens and contribute to green extraction applications.

1. Introduction

Microgreens are young vegetable greens, typically harvested just after the cotyledon leaves have developed. They are known for their dense nutrient content and have become popular in the culinary world due to their vibrant colors and intense flavors. Scientifically, microgreens are prized for their high concentrations of vitamins, minerals, and bioactive compounds such as antioxidants, which can vary significantly depending on the plant species and growth conditions. Studies have shown that microgreens can contain higher levels of bioactive compounds compared to their mature plant counterparts, making them potent functional foods for improving dietary quality [1]. Extracting bioactive substances from microgreens is crucial due to their potential health benefits, including anti-inflammatory, antioxidant, and anti-carcinogenic properties. These compounds, such as phenolics, flavonoids, and glucosinolates, are important for human health as they can help mitigate chronic diseases such as heart disease, diabetes, and cancer. Efficient extraction techniques are essential to maximize the recovery of these compounds for use in supplements, pharmaceuticals, and functional foods, making the full benefits of microgreens accessible in concentrated forms [2]. For example, a study by Paradiso et al. [3] developed an optimized extraction method for analyzing carotenoids in microgreens, crucial for their antioxidant properties. They achieved high recovery rates and repeatability, highlighting the effectiveness of their extraction protocol, which could be applied in both research and commercial extraction processes to ensure high-quality extracts. Islam et al. [4] investigated the effect of selenium biofortification on wheat microgreens, which enhanced the levels of bioactive compounds and antioxidant activity. This study underscores the importance of extraction in determining the impact of agronomic treatments on the nutritional quality of microgreens. Komeroski et al. [5] explored how different production systems and elicitors affect the bioactive compounds in Brassicaceae microgreens. Additionally, sango radish (Raphanus sativus L.) and kale (Brassica oleracea var. sabellica) are two microgreen varieties that have garnered significant attention due to their rich nutritional profiles and potential health benefits. Sango radish microgreens are particularly notable for their high levels of glucosinolates and isothiocyanates, compounds that have been associated with anti-carcinogenic properties. Additionally, these microgreens contain significant amounts of vitamins A, C, and K, as well as essential minerals such as calcium and potassium. Kale microgreens, on the other hand, are renowned for their robust antioxidant capacity, attributed to their high content of vitamins C and E, carotenoids, and phenolic compounds. These nutrients play crucial roles in reducing oxidative stress and inflammation, thereby contributing to the prevention of chronic diseases such as cardiovascular disease and cancer [6]. Moreover, kale microgreens are rich in fiber, which is essential for digestive health and can help in maintaining a healthy weight.
Supramolecular solvent-based (SUPRAS) extraction is innovative because it leverages the specific interactions between the solvent structures and the target compounds, allowing for the precise extraction of bioactives. These solvents can be engineered to possess various functional groups, creating an ideal microenvironment for solubilizing specific bioactive compounds from complex biological matrices such as microgreens. The method is not only rapid and simple but also reduces the use of toxic organic solvents, aligning with green chemistry principles. Some crucial advantages of SUPRAS extraction can be summarized through enhanced extraction efficiency and selectivity, environmental sustainability, operational simplicity, cost-effectiveness, and thermal and chemical stability. Solvents are highly effective in extracting bioactive compounds due to their tailored molecular recognition sites that interact specifically with target molecules, leading to high extraction yields and purity [7]. Furthermore, this method significantly reduces the environmental footprint by minimizing the use of volatile organic compounds and promoting safer waste management practices [8]. The extraction process is straightforward, requiring less technical equipment and shorter extraction times, which decreases operational costs and complexity [3]. Additionally, these solvents provide stable environments for sensitive compounds that might degrade under harsh conditions, thus preserving the integrity and activity of the extracted bioactives [9].
The importance of employing experimental designs in extraction procedures lies in their ability to efficiently optimize processes, saving time and resources. These methods enhance the precision and repeatability of experiments, which are crucial in settings where extracting bioactive compounds or other chemicals is often complex and sensitive to operational conditions. By systematically studying the influence of various parameters and their interactions, researchers can achieve maximum yield, purity, or other desired outcomes from the extraction process [10]. Furthermore, the mathematical modeling associated with these designs helps in predicting and improving extraction outcomes under different conditions. One of them is Taguchi’s experimental design. Taguchi methods are statistical techniques aimed at improving product quality by minimizing the variation in design and processes through robust design experiments. These methods are widely used in experimental settings to identify key factors that influence process performance and to determine optimal conditions for various processes, including the extraction of compounds from different materials. For example, Ravanfar et al. [11] employed the Taguchi L9 orthogonal design to optimize various parameters such as output power, time, temperature, and pulse mode for ultrasound-assisted extraction of anthocyanins from red cabbage. They concluded that the key factors influencing extraction efficiency were time, temperature, and power, with the optimal conditions resulting in a significant yield of anthocyanins. Furthermore, Taguchi’s approach is highly valued because it simplifies the design of experiments (DOE) and effectively handles interactions among multiple factors with a reduced number of experiments compared to traditional full factorial designs [12]. Although Taguchi methods are broadly used across various fields for optimizing process parameters in extraction procedures, it seems there is no direct documentation or study specifically about their use in microgreens extraction or related processes in actual research articles. On the other hand, the mentioned example of Taguchi’s design in the extraction procedure demonstrates the application of Taguchi’s design in optimizing extraction parameters, which could potentially be adapted to SUPRAS extractions.
Despite the recognized benefits of microgreens, there is a significant gap in research regarding the optimization of extraction methods for these bioactive compounds. Current extraction techniques often rely on the use of organic solvents, which can be inefficient, environmentally harmful, and potentially detrimental to the stability of sensitive bioactive compounds. Supramolecular solvent-based (SUPRAS) extraction offers a promising alternative, utilizing self-assembled structures of amphiphilic compounds in water to create a less toxic and environmentally friendly solvent system [6]. However, the application of SUPRAS extraction specifically for microgreens has not been extensively studied, and there is limited information on the optimization of this method to maximize the yield and stability of extracted bioactive compounds. Furthermore, while the Taguchi experimental design and artificial neural network (ANN) modeling have been used separately to optimize various processes, their combined application for optimizing SUPRAS extraction parameters remains unexplored. To address this gap, the actual study aims to optimize the SUPRAS extraction process for microgreens using a combined approach of Taguchi design and ANN modeling. This research focuses on sango radish and kale microgreens, evaluating the effects of ethanol content, SUPRAS: equilibrium ratio, centrifugation rate, centrifugation time, and solid-liquid ratio on the extraction efficiency of chlorophylls, carotenoids, phenolics, and anthocyanidins. By filling this gap, we aim to provide a robust, environmentally friendly extraction method that can be scaled up for industrial applications, enhancing the practical use of microgreens in supplements, pharmaceuticals, and functional foods.

2. Materials and Methods

2.1. Microgreens Samples

Microgreens were sourced from agricultural producer “Mikro Salaš” located in Novi Sad, Serbia (45.27012540760317, 19.840375083327682) to ensure fresh and controlled quality. Two microgreen samples selected for this study included sango radish (Raphanus sativus) and kale (Brassica oleracea convar. acephala var. sabellica) (Figure 1). Samples were harvested at the cotyledon stage, 8 days after sowing, using sterile scissors to minimize contamination. Upon collection, the microgreens were immediately cooled to 4 °C to preserve their biochemical properties and transported to the laboratory within 2 h of harvest.
Samples were washed with a sterile saline solution (0.85% NaCl) to remove soil and potential microbial contaminants. Excess moisture was removed by gentle patting with paper towels, followed by air drying in a laminar flow hood for 30 min. For short-term experiments, microgreens were stored at 4 °C in plastic containers to prevent additional photosynthesis and degradation of sensitive compounds. For long-term analysis, samples were stored at −80 °C. The storage duration did not exceed two weeks to prevent any significant loss of nutritional and phytochemical quality. Fresh microgreen samples were freeze-dried for 48 h at 0.01 bars and −40 °C using a Martin Crist Alpha 2–4 freeze–dryer. Dried samples (no more than 1% residual moisture) were homogenized in the form of powder (used No. 85 sieve) and stored for further analysis.

2.2. Supramolecular Solvent-Based Extraction

Supramolecular solvents (SUPRAS) were prepared using ethanol, octanoic acid, and distilled acid water as recommended in several studies [13,14]. All used chemicals were sourced from HiMedia (Mumbai, India). The ethanol concentration was varied among batches to determine its effect on the extraction efficiency. The ethanol concentrations were 16 or 36%, depending on the experimental protocol. Octanoic acid was used as a 5% total solution in water. The obtained SUPRAS solvent contained the SUPRAS phase (upper) and equilibrium phase (lower), which were separated and stored at 4 °C until use. Microgreen samples were prepared by weighing a specific amount of plant sample material and dispersing it into the respective SUPRAS: equilibrium ratio (1:2, 1:1, or 2:1). The solid-liquid ratios investigated ranged from 10 to 50 mg/mL, adjusted to evaluate the impact on extraction outcomes. SUPRAS extraction included the following protocol: mixing for 1 min at vortex (Heldolph, Schwabach, Germany), ultrasound treatment for 15 min in an ultrasound bath (Elmasonic, Singen, Germany), and stirring for 15 min at 300 rpm with a laboratory shaker (Heidolph Unimax 1010, Schwabach, Germany) at room temperature. The mixtures were then subjected to centrifugation (Gramma Libero LACE 24, Belgrade, Serbia) to separate the extract from the residual solid material. Centrifugation was performed at various rates from 3000 to 4000 rpm and at different time intervals ranging from 10 to 30 min to optimize phase separation [3]. Specifically, 4000 rpm is equivalent to 2470× g based on the specifications of the used centrifuge.

2.3. Bioactive Compound Contents and Antioxidant Activity

The efficiency of the extraction process was evaluated by measuring bioactive compound contents and antioxidant activity. A total of five outputs are determined: antioxidant activity (as determined by the DPPH assay), chlorophylls, carotenoids, phenolics, and anthocyanidin contents. The antioxidant activity was measured using the DPPH radical scavenging assay as described by Aćimović et al. [15]. An aliquot of 10 µL was mixed with 250 µL of a DPPH solution in ethanol. The mixture was incubated in the dark for 50 min, and the decrease in absorbance was measured at 515 nm. Antioxidant activity was expressed as µM Trolox equivalents (TE) per 100 g of a sample. For the determination of total chlorophylls and carotenoids, extracts were diluted in methanol. The absorbances (A) were measured at 663 and 645 nm for total chlorophylls and 453, 505, 645, and 663 nm for total carotenoids using a MULTISCAN GO spectrophotometer (Thermo Fisher Scientific Inc., Waltham, MA, USA) [16]. The calculations were completed using Equations (1) and (2) for chlorophylls and carotenoids, respectively.
Chlorophyll yield = 20.20A645 + 8.02A663
Carotenoid yield = 0.216A663 − 1.22A654 − 0.304A505 + 0.452A453
The concentrations of chlorophylls and carotenoids were expressed as mg per 100 g of sample.
Total phenolic content was determined using the Folin-Ciocalteu method. Briefly, 15 µL of samples were added to a microtiter plate, mixed with 170 distilled water, 12 µL of Folin-Ciocalteu solution, and 30 µL of sodium carbonate solution, and kept in the dark for 1 h at room temperature [17]. Absorbance was measured at 750 nm using a spectrophotometer. Results were expressed as mg of gallic acid equivalents per 100 g of sample.Anthocyanidins were quantified using a single pH method by Tumbas Šaponiac et al. [18]. Each sample was diluted as needed, and the absorbance was measured at 510 nm and 700 nm for interferences using different volumes of pH 1 buffer and calculating the dilution factor. The total anthocyanidin content was expressed as mg per 100 g of sample. All determinations were completed in triplicate, and the obtained values are presented as the mean and standard deviation. All used chemicals were sourced from HiMedia (Mumbai, India).

2.4. Taguchi Experimental Design

The influence of SUPRAS extraction parameters as operational conditions on targeted outputs was studied using the design of experiments (DOE). Namely, biological activity and bioactive concentration were defined using an experimental Taguchi L18 method involving 5 variables (one variable at 2-level variation and 4 variables at 3-level variations). The mentioned variables (Xi) were: Ethanol (X1), SUPRAS: equilibrium ratio (X2), centrifugation rate (X3), centrifugation time (X4), and solid-liquid ratio (X5). The coded levels were 1 for low level, 2 for medium level (if it exists), and 3 for high level, respectively. The response parameters or dependent variables (Yi) set up were: DPPH (Y1), chlorophylls (Y2), carotenoids (Y3), phenolics (Y4), and anthocyanidins (Y5). The dependent variables in coded form, together with the corresponding constraints imposed by obtaining certain characteristics of Y1–Y5, are given in Table 1.

2.5. Mathematical Analysis

The Taguchi experimental design enabled the calculation of the signal/noise performance indicator, which was applied during the optimization process to establish the combinations of the influencing factors that upgrade extract quality and process robustness. For signal-to-noise calculation, a value of 0.000000001 was involved for each run with unsuccessful phase separation or no defined value since the “larger is better” function does not accept zero values. The validation of the regression models was carried out by ANOVA analysis through the creation of normal probability plots. Tukey’s HSD post hoc test for comparison of the sample means was used to explore the variations in observed parameters. The ranking of 18 samples of sango radish and 18 samples of kale was performed by comparing their raw data to extreme values, following the method established by Brlek et al. [19]. The ranking criteria included parameters such as DPPH value and the content of chlorophylls, carotenoids, phenolics, and anthocyanidins, with higher values being more favorable. Principal Component Analysis (PCA) was utilized to elucidate and identify patterns within the collected data. The data for artificial neural network (ANN) modeling, consists of 18 extract samples of sango radish and 18 extract samples of kale mentioned previously. All data were used for the training (100%) set. To enhance accuracy, input and output standardization was applied using min-max normalization. The proposed multilayer perceptron (MLP) model featured a three-layer feedforward architecture with backpropagation training [16,17]. The hidden layer comprised 5 to 10 neurons, and various activation functions (tangent, sigmoidal, exponential, identity) were tested. The BFGS algorithm was employed to construct the ANN model, iteratively adjusting weights and biases across 100,000 configurations. The goal was to minimize the square error until both the learning and cross-validation curves approached zero. All samples were assessed for variance equality using Levene’s test and for normal distribution using the Shapiro-Wilk test. The statistical analysis was conducted using the TIBCO Statistica® 14.0.0.15 software package (STATISTICA (Data Analysis Software System) V14.0.0.15; TIBCO Stat-Soft Inc.: Tulsa, OK, USA, 2020). Yoon’s interpretation method was employed to assess the impact of EtOH, EqS, CRPM, Ctime, and SLR on DPPH value, and the content of chlorophylls, carotenoids, phenolics, and anthocyanidins during supramolecular solvent-based extraction of sango radish and kale Microgreens. This assessment utilized weight coefficients derived from the constructed ANN model (Equation (3)), where w represents the weight coefficient in the ANN model, i is the input variable, j is the output variable, k is a hidden neuron, n is a number of hidden neurons, and m is a number of inputs.
R I i j ( % ) = k = 0 n ( w i k w k j ) i = 0 m k = 0 n ( w i k w k j ) 100 %
The developed artificial neural network (ANN) models for supramolecular solvent-based extraction of sango radish and kale microgreens were employed for multi-objective optimization (MOO) to identify that maximize DPPH value, and the content of chlorophylls, carotenoids, phenolics, and anthocyanidins. The solution to the MOO problem was represented by a Pareto front, which indicates solutions where improving one objective does not worsen the others [20]. A genetic algorithm (GA) was utilized to solve the MOO problem through a stochastic process inspired by natural evolution, involving mutation, selection, inheritance, and crossover [21,22]. The MOO calculations were executed in Matlab software (version R2024a) using the gamultiobj function. The initial population was randomly generated and then presented as a set of points in the design space. Subsequent generations were calculated based on distance measures and the non-dominated ranking of individual points in the current generation [23,24].

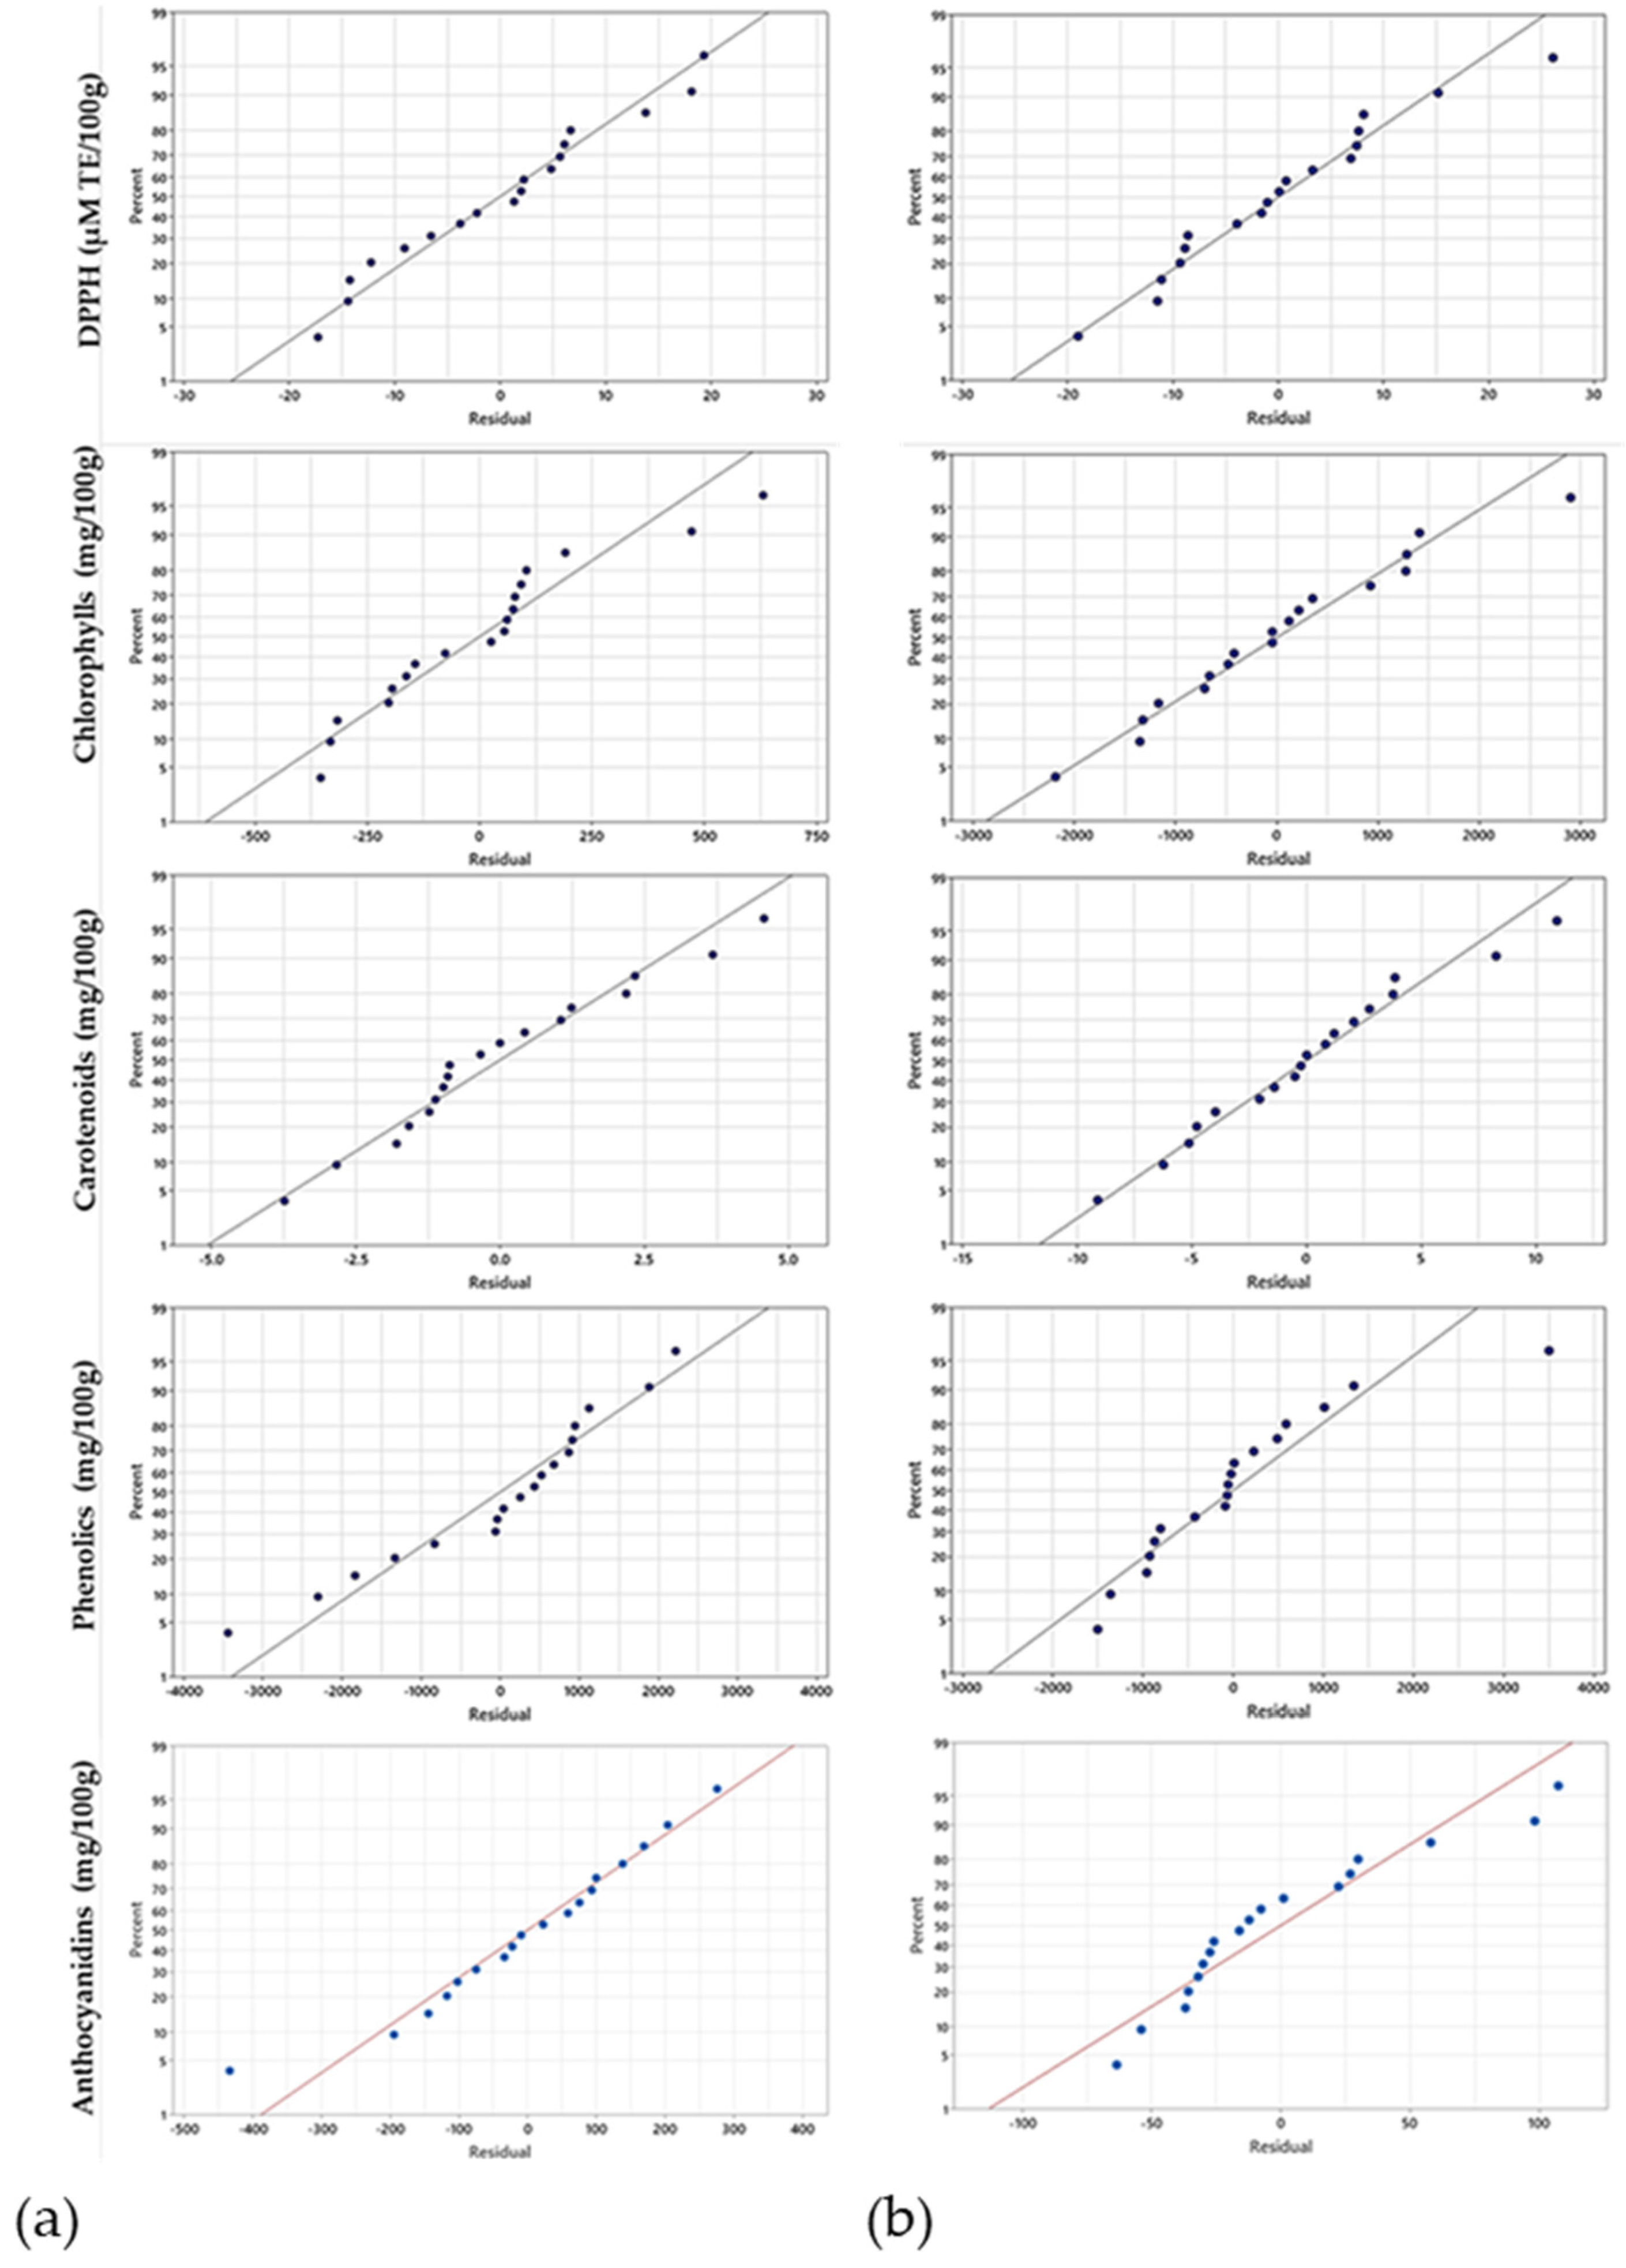
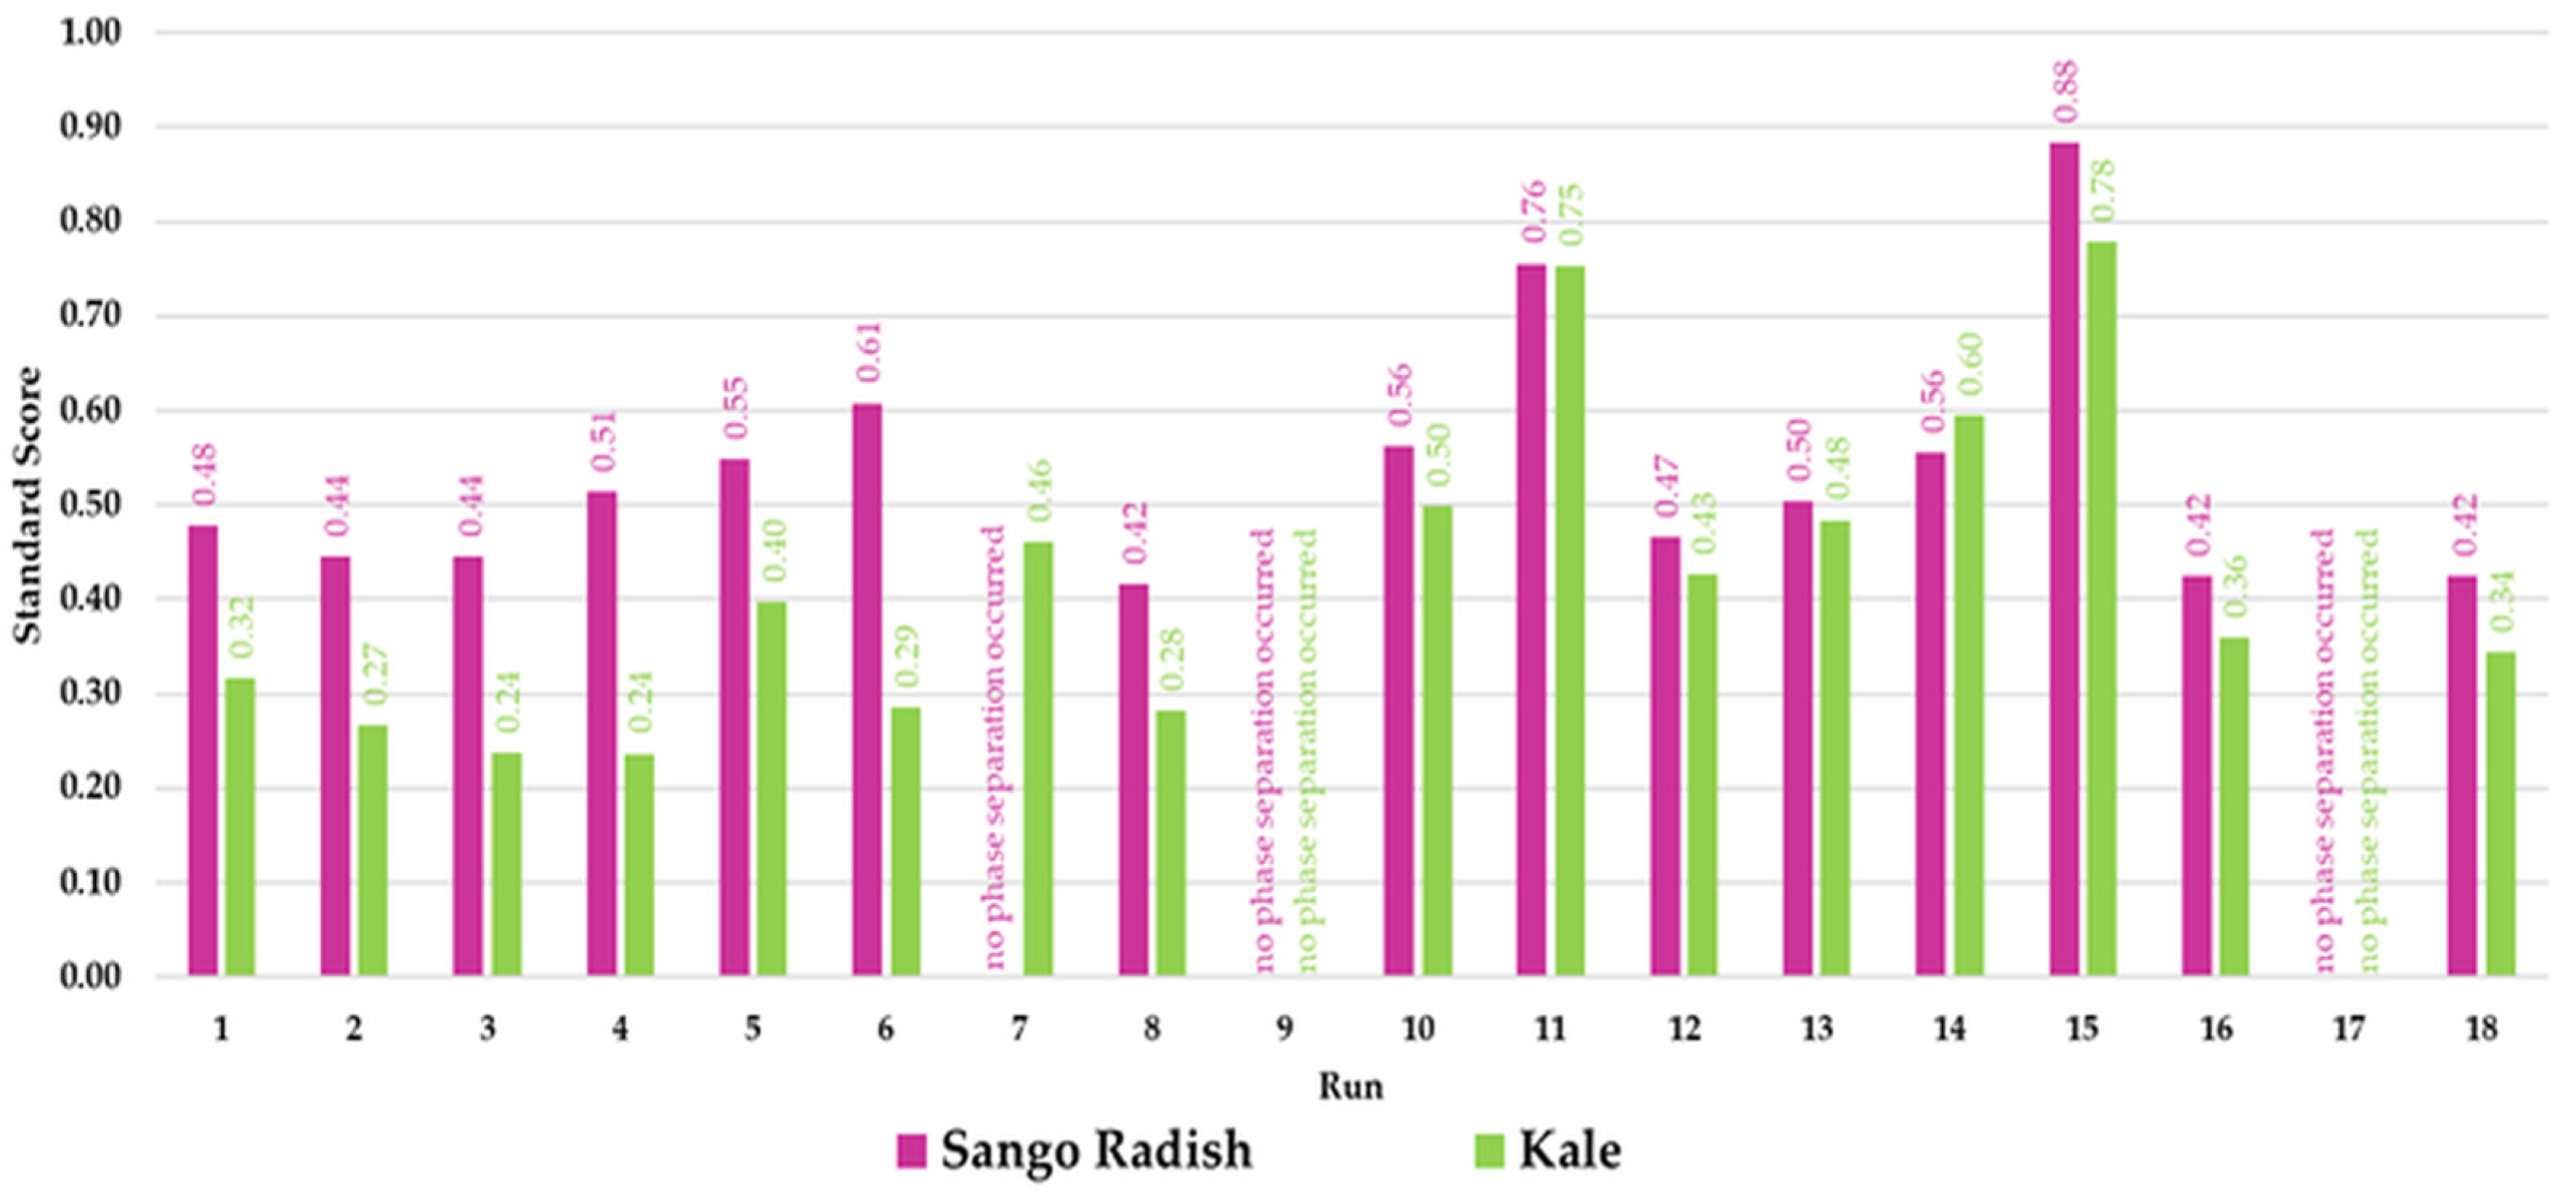
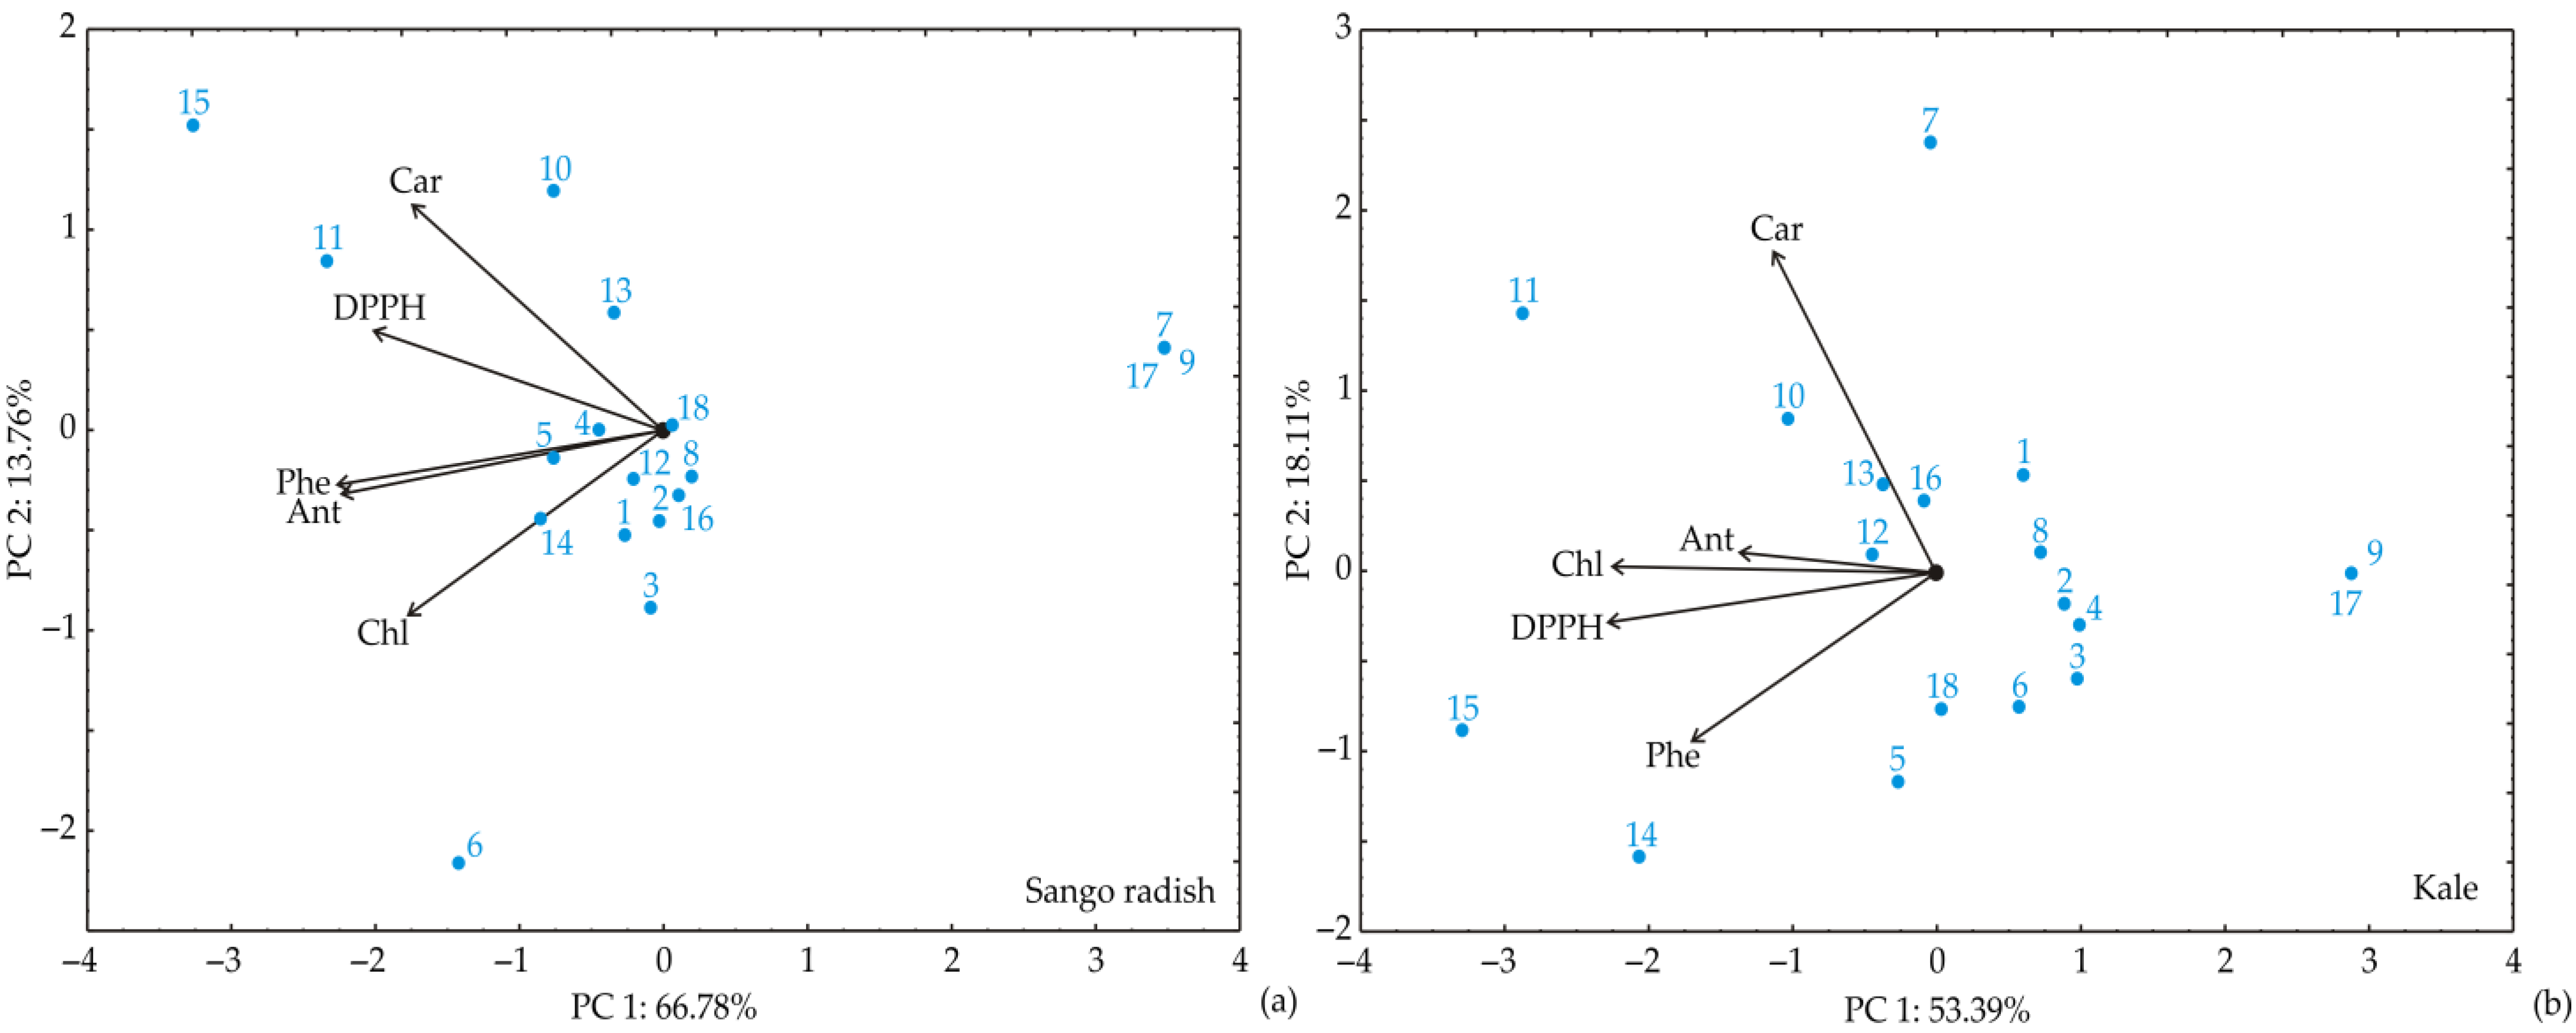
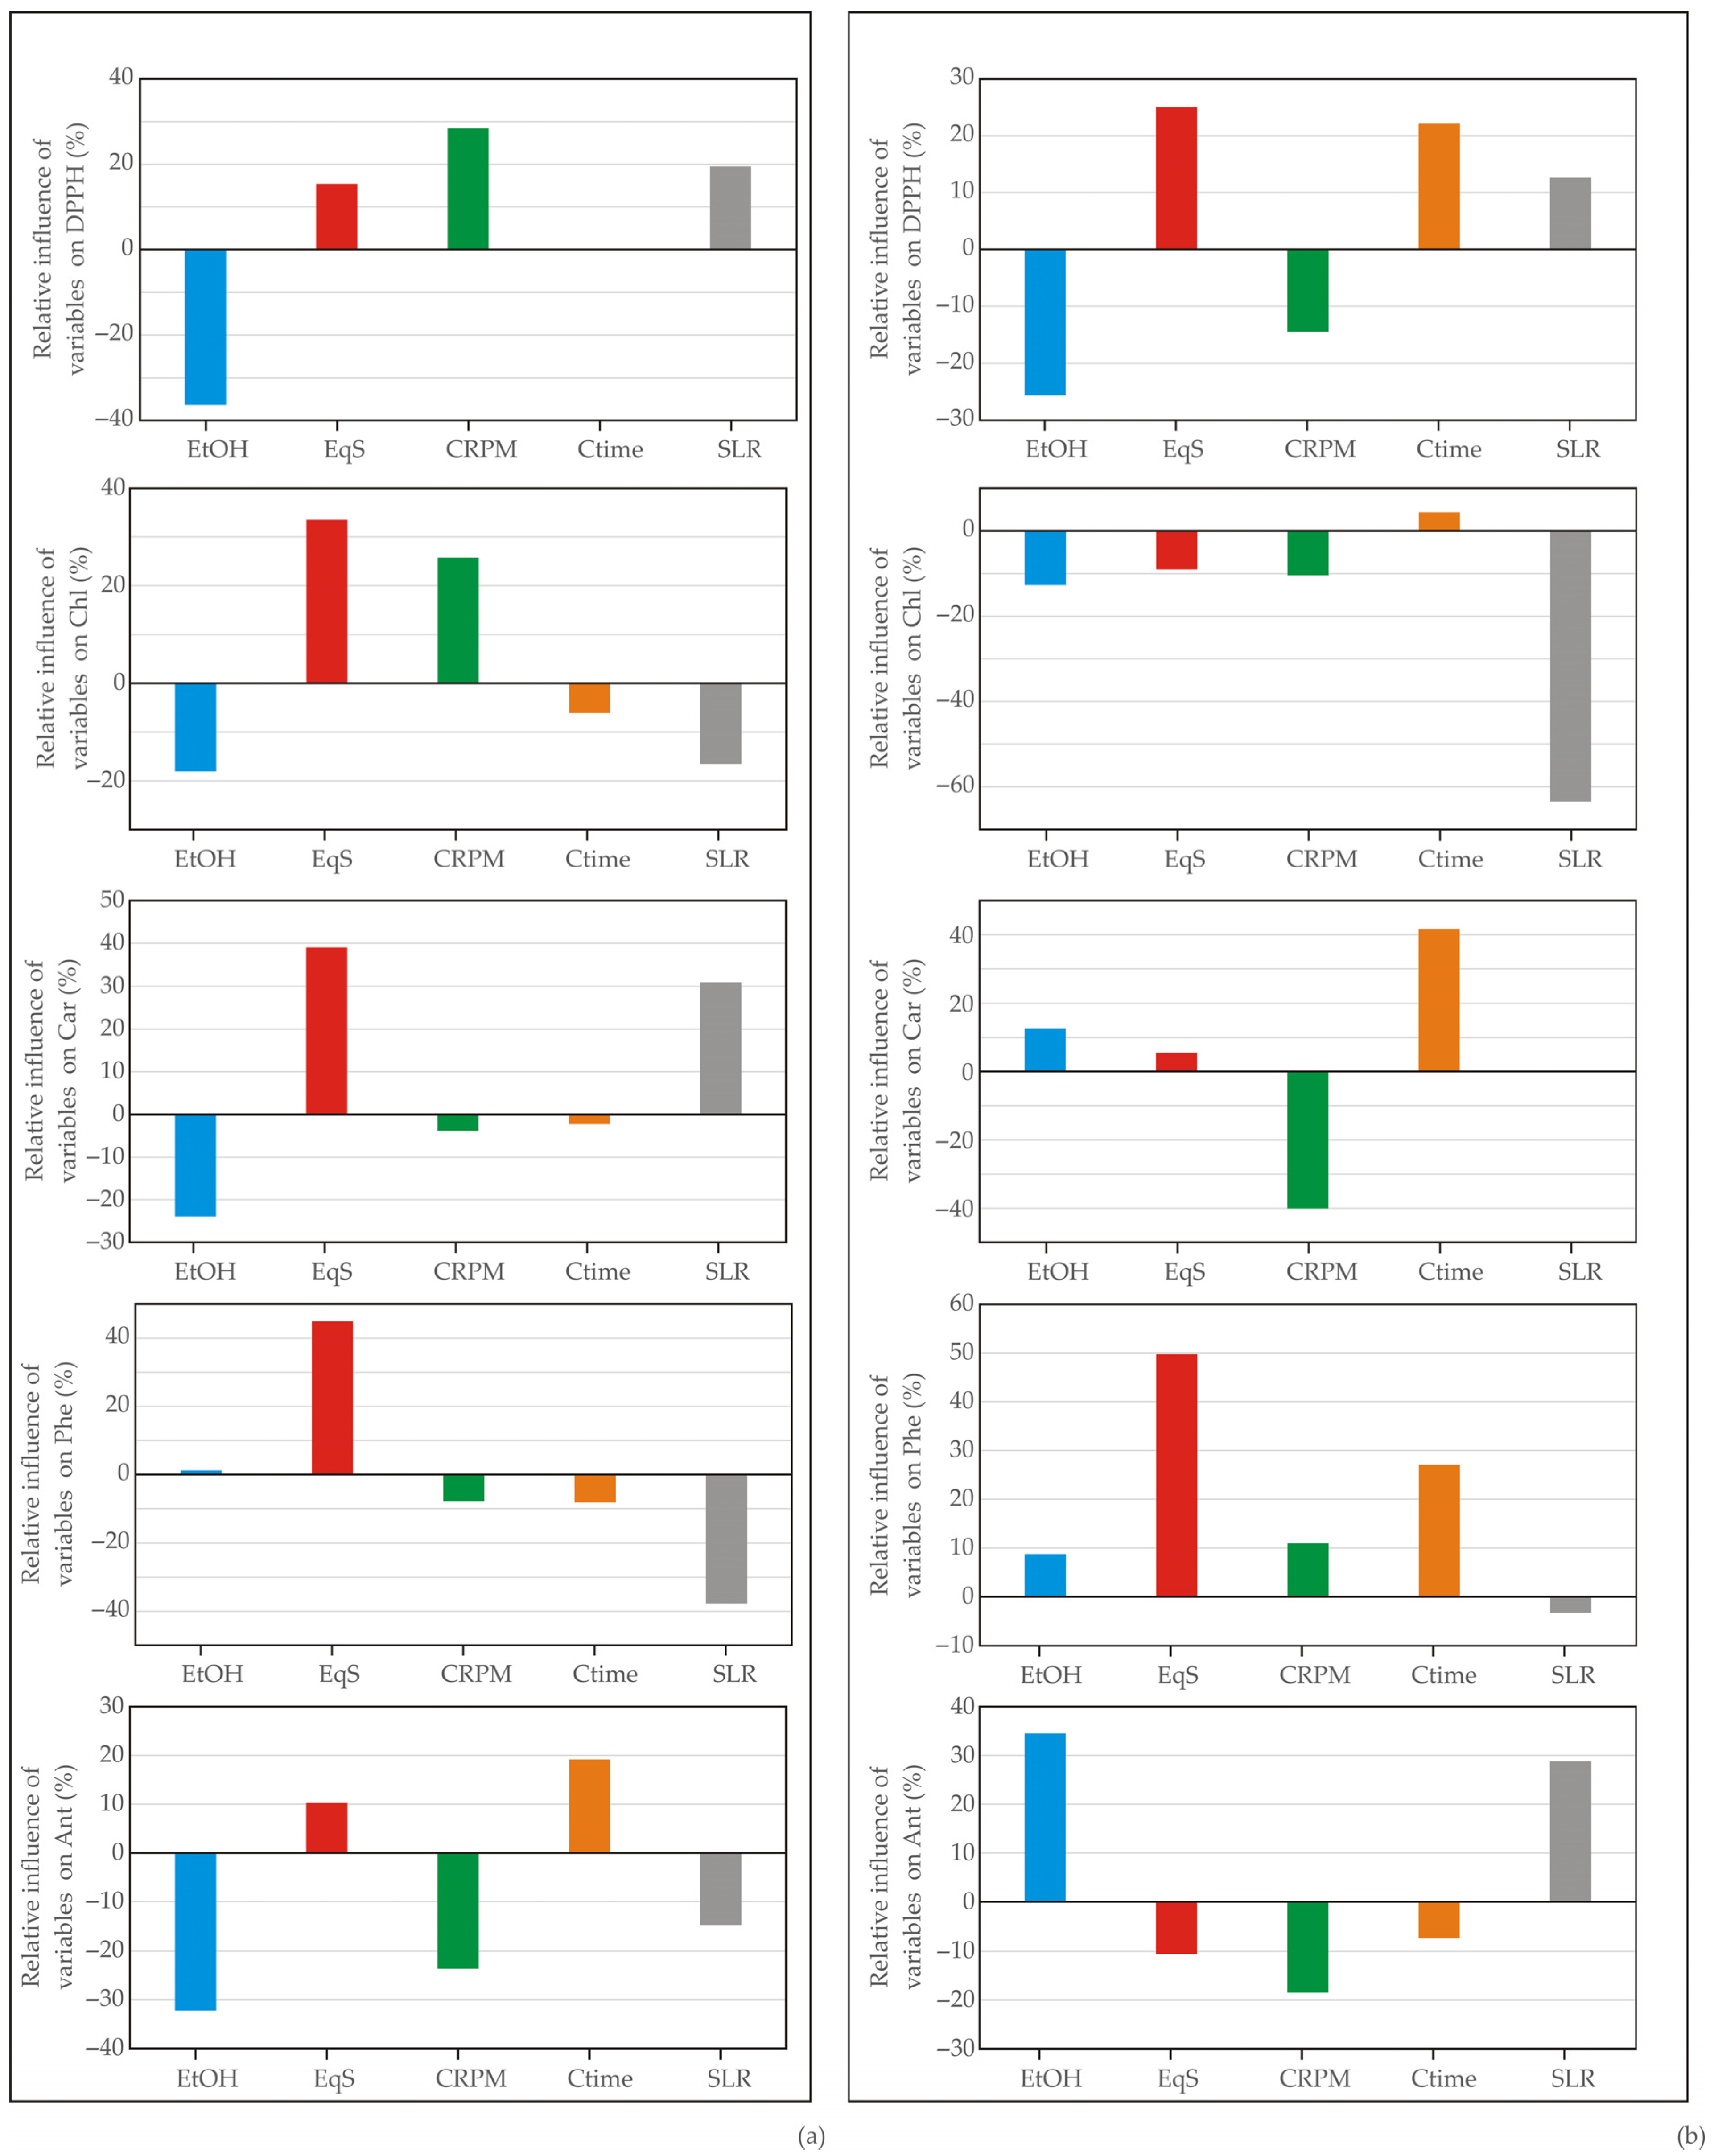
3. Results and Discussion

The experimental data obtained after applying the Taguchi experimental design are shown in Table 2 and Table 3 for sango radish and kale microgreens, respectively. This table involves all 18 combinations required with the Taguchi method and all five outputs: DPPH, phenols, chlorophylls, carotenoids, phenols, and anthocyanidins. The Taguchi method reduces the complexity of experimental design and analysis by using orthogonal arrays, which streamline the process of examining multiple variables and their interactions [12].
The evaluation of sango radish microgreen extracts (Table 2) discovered varied phytochemical contents and antioxidant capacities across different experiments. Antioxidant activity, measured by DPPH scavenging ability, showed a broad range from as low as 1011 µM Trolox equivalents (TE)/100 g to a high of 5646.51 µM TE/100 g. Notably, the highest antioxidant activity can be correlated with substantial levels of phenolics (6435.87 mg/100 g) and anthocyanidins (798.48 mg/100 g). Chlorophyll content varied significantly, with the lowest recorded at 416.48 mg/100 g and the highest at 1996.87 mg/100 g. Carotenoids also showed variability, up to 12.00 mg/100 g. On the other hand., phenolic content was notably high, reaching 6566.06 mg/100 g, which correlates with a high DPPH result (4589.02 µM TE/100 g) in the same experiment. This trend can be paralleled in the anthocyanidin content, where the extract contained the highest concentration (798.48 mg/100 g).
The analysis of kale microgreens (Table 3) across various runs also demonstrated significant variability in phytochemical contents and antioxidant activities. The DPPH scavenging activity ranged from a low of 916.32 µM TE/100 g to a high of 5214.96 µM TE/100 g. Specifically, chlorophyll content was notably high in some experiments, up to 6645.59 mg/100 g. The carotenoid content varied, with the highest value being 23.74 mg/100 g and the lowest being 2.30 mg/100 g). Phenolics reached 5503.60 mg/100 g, while the highest anthocyanidin content was 153.2 mg/100 g.
The experimental data suggests significant variation in antioxidant capacity among different sango radish extracts, but also among microgreens. This can have implications for their potential health benefits, as higher DPPH values indicate greater antioxidant activity, which could be desirable for functional foods or nutraceutical applications. Additionally, the wide range of chlorophyll concentrations implies differences in the nutritional profiles of the extracts. Higher levels of these compounds, such as those present in the kale microgreens sample, are generally associated with increased nutritional value. This suggests that some extracts may offer enhanced health benefits or flavor profiles compared to others. Phenolics and anthocyanidins are known for their antioxidant and anti-inflammatory properties (Szymanowska et al., [25]). The obtained extracts with higher concentrations of these compounds may have greater potential for use in functional foods, dietary supplements, or natural food colorants. Dudnik et al. [26] have shown that sango radish microgreens are rich in bioactive compounds, including phenolics and carotenoids, contributing to their potential health benefits and antioxidant properties [27,28]. The data gained supports these findings, showing variability in phenolic and carotenoid content among different extracts. Furthermore, other studies also highlight the importance of anthocyanidins as natural colorants and antioxidants in plant-based products. Patra et al. [29]. The variation in anthocyanidin content observed in this study emphasizes the potential of sango radish extracts as natural colorants with antioxidant properties. The significant differences in antioxidant capacity (DPPH) among sango radish and kale extracts can be compared with findings in the literature [30,31,32] but also direct future studies on the effect of extraction methods that can influence the antioxidant activity of microgreen extracts.
Several studies have investigated the efficiency and functionality of supramolecular solvent-based (SUPRAS) extraction for various applications, but not on microgreens until this research work. For instance, Torres-Valenzuela et al. [6] demonstrated the effectiveness of SUPRAS extraction for recovering bioactive compounds from coffee cherry pulp. Their findings indicated superior extraction yields compared to traditional organic solvents, highlighting the advantages of SUPRAS in terms of environmental friendliness and efficiency. Similarly, Li et al. [33] employed SUPRAS for the extraction of caffeoylquinic acids from Artemisia anomala flowers, achieving rapid and efficient extraction with a simple protocol involving vortex shaking and centrifugation. In comparison, the presented study on the SUPRAS extraction of bioactive compounds from microgreens (sango radish and kale) further demonstrates the versatility and robustness of SUPRAS as a green extraction technology. By utilizing the Taguchi experimental design, the research approach took a step forward to optimize the extraction parameters, achieving high recovery rates of chlorophylls, carotenoids, phenolics, and anthocyanidins. These results align with the efficiency observed in previous studies with different plant materials and reinforce the potential of SUPRAS extraction in various applications.
Figure 2 displays the primary effects plot for the signal-to-noise (S/N) ratio of SUPRAS extraction efficiency. Each mean value within a given factor is connected by solid lines, and a dashed line indicates the overall average. The primary effect of a single variable is determined by comparing the solid line to the dashed reference line. The tested parameters have different impacts on the extraction efficiency, as indicated by their markedly steeper slopes relative to other factors. For sango radish microgreens (Figure 2a), the factors that show a marked influence on the extraction efficiency are primarily the ethanol content and the SUPRAS: Equilibrium ratio. A steep decline in the S/N ratio is observed as the ethanol concentration increases from 16% to 36%, indicating a negative impact on extraction efficiency with higher ethanol levels. Similarly, the SUPRAS equilibrium ratio shows a significant drop when moving from a ratio of 0.5 to 2.0, further suggesting optimal conditions involve lower ethanol concentrations and lower equilibrium ratios. The centrifugation rate and centrifugation time also affect the efficiency, with the plot showing less steep but noticeable declines. The solid-liquid ratio displays a gradual decline in S/N ratios as the ratio increases, indicating better efficiency at lower ratios. Figure 2b indicates that the trends for the kale microgreens slightly differ. The most significant impact is observed with the centrifugation time, where the S/N ratio peaks sharply at 10 min before declining, with a potential optimal value of centrifugation time at this midpoint. Ethanol content and SUPRAS: Equilibrium ratio also play crucial roles, but with less steep slopes compared to the sango radish sample. Increasing the ethanol content from 16% to 36% and the SUPRAS ratio from 0.5 to 1.0 initially benefits the extraction efficiency, but any further increase diminishes the efficiency. In contrast to the sango radish, the kale samples show a less pronounced decline in efficiency with changes in the centrifugation rate and solid-liquid ratio, indicating that these factors are less critical for kale compared to the radish samples.
Figure 3 illustrates the normal probability plots of the residuals for various phytochemicals extracted from sango radish (Figure 3a) and kale microgreens (Figure 3b) using SUPRAS extraction. These plots are a critical part of the analysis of variance, helping to assess the normality of the residuals, which is a fundamental assumption in many statistical tests. Points that closely follow the diagonal line suggest that the residuals are normally distributed, supporting the validity of the ANOVA results. Deviations from this line indicate potential issues with the normality assumption [34,35,36,37,38].
In the case of sango radish, the obtained plot for the DPPH assay is normally distributed, while the plot that describes chlorophylls has a slight deviation from normality as indicated by the curvature in the plot, especially for larger residuals. The data points for carotenoids closely align with the diagonal, indicating good normality. The phenolics plot also demonstrates an excellent alignment with the diagonal, indicating a normal distribution of residuals. Although the points largely follow the line, there are minor deviations noticeable at the extremes for anthocyanidins. On the other hand, the residuals for DPPH antioxidant capacity in kale microgreens align well with the diagonal, indicating a normal distribution. The plot for chlorophylls shows some skewness, particularly with larger residuals deviating from the line. The data points exhibit a good fit for carotenoids to the diagonal line, while residuals appear to be normally distributed for phenolics as the points closely follow the diagonal. Similar to the phenolics, the residuals for anthocyanidins display good normality.
The normal probability plots indicate that the residuals for most of the measured parameters in both sango radish and kale microgreens generally adhere to a normal distribution, thus satisfying one of the key assumptions of ANOVA. This supports the reliability of the statistical analyses performed on the data. Any deviations observed, particularly in the chlorophyll measurements for both types of microgreens, might require further investigation or data transformation to meet the normality criteria more strictly.
The multi-objective optimization aimed at identifying the optimal combination using the Taguchi experimental design approach could be performed after mathematical model development, as detailed in the methodology in the open literature [36,38,39,40].
A simpler and much faster approach, such as standard score (SS) analysis, was performed for the evaluation of the optimal combination of the Taguchi experimental design. Figure 4 is a visualization of the obtained scores. The graph shows the total standard scores across 18 experimental runs for both microgreens, illustrating how each sample type responded to various experimental conditions or treatments.
The standard scores for sango radish exhibited the peak in Run 15, which involved the following values of extraction parameters: 36% Ethanol, SUPRAS: Equilibrium ratio 1 mL/mL, centrifugation rate and time of 4000 rpm and 20 min, as well as solid: liquid ratio 30 mg/mL. The score value for sample 15 of sango radish was 0.88, whereas the score value for kale was 0.78. The scores gained for kale were characterized by greater variability with significant peaks in Runs 10 and 15. The experimental setup for run 10 involved the same values for ethanol content as well as centrifugation time, but the lowest tested values for SUPRAS: equilibrium ratio, centrifugation rate, and solid-liquid ratio.
Cluster analysis (Figure 5), illustrated in the dendrograms, was conducted using complete linkage clustering with city-block (Manhattan) distances. This method was chosen to ascertain the similarities and dissimilarities among the experimental runs based on multiple response variables. The comparison between the two dendrograms indicates that kale microgreens exhibit a higher degree of variability in experimental response than sango radish. The dendrogram for sango radish microgreens (Figure 5a) reveals a varied clustering pattern with the formation of several distinct groups, indicating variability in the response across different runs. Notably, runs 1, 5, 10, and 18 form individual clusters at higher linkage distances, suggesting unique characteristics compared to other runs. A major cluster that includes runs 12, 13, and 14 suggests that these runs are similar in terms of the conditions and outcomes measured, showcasing lower distances between them. The linkage distances span from approximately 0 to over 8000, with significant clusters forming between 2000 and 6000. This broad range in distances indicates a high degree of heterogeneity among the runs, suggesting that different experimental conditions have varied impacts on the phytochemical composition and other measured responses in sango radish microgreens. The dendrogram for kale microgreens (lower panel) also displays a clear clustering pattern but with larger linkage distances compared to sango radish, peaking at around 12,000. This suggests that the variability among kale runs is even more pronounced. Specific runs such as 1, 8, and 16 form distinct clusters at very high linkage distances, which highlights their outlier characteristics in response to the experimental conditions. Similar to sango radish, several runs (e.g., 12, 13, and 18) are clustered closely together, indicating similarity in their responses.
The principal component analysis (PCA) was performed to assess the variation in antioxidant activity and bioactive contents of sango radish and kale microgreens across multiple experimental runs (Figure 6). The points displayed in the PCA graphs that are close to one another geometrically suggest similar patterns among those points. The direction of the vector representing a variable in the factor space indicates an increasing trend for that variable, while the vector’s length is proportional to the square of the correlation values between the fitted value and the variable itself. The angles between the vectors of corresponding variables reflect the degree of their correlations, with smaller angles indicating higher correlations. The PCA plots for both sango radish and kale are depicted with the first two principal components (PC1 and PC2) explaining a significant proportion of the variance.
For sango radish, PC1 accounts for 66.78% of the variance, and PC2 accounts for 22.37%, summing up to a total of 89.15% of the total variance explained. This high percentage indicates that these two components effectively capture most of the variability in the data. The vectors (Car, DPPH, Phe, Ant, Chl) represent carotenoids, DPPH radical scavenging activity, phenolics, anthocyanidins, and chlorophylls, respectively. The closeness of the DPPH, Phe, and Ant vectors suggests a strong correlation among these variables. Conversely, Car and Chl appear somewhat orthogonal to these variables, indicating a lesser degree of correlation with the antioxidant properties measured by DPPG. Runs 15 and 11 appear further along the PC1 axis and show higher concentrations of the measured bioactives. Conversely, Run 6, which is located further down the negative end of PC2, might be characterized by lower levels of tested parameters.
In the case of kale, PC1 explains 53.39% of the variance, and PC2 explains 28.18%, totaling 81.57% of the explained variance. Similar to sango radish, the vectors represent the same phytochemical measurements. The arrangement of vectors shows that Car, Ant, and Chl are somewhat aligned, and some correlation among these variables in kale can be defined. DPPH and Phe appear less associated with these three, which can be explained by different dynamics of antioxidant activity and phenolic contents related to other tested bioactives in kale. Run 7 is distinctively positioned on the positive end of the PC2 axis, possibly indicating unique phytochemical characteristics not as pronounced in other runs. Runs closely clustered around the origin, such as Runs 12 and 13, propose average levels of bioactives in kale microgreens.
Specific ANN models were built for the prediction of DPPH value and the content of chlorophylls, carotenoids, phenolics, and anthocyanidins, during supramolecular solvent-based extraction of sango radish and kale microgreens to obtain results closest to the experimentally obtained values. The optimized neural network models demonstrated strong generalization capabilities for the experimental data, accurately predicting outputs based on input parameters. The ANN models, configured with 4–11 neurons, achieved high r2 values of 1.000 for the training cycle. The neural network models exhibited high accuracy in predicting experimental variables across a diverse range of process conditions. The model fit was further evaluated and summarized in Table 4. The results indicated a minimal lack of fit, suggesting that the models satisfactorily predicted the analyzed parameters.
The relative influence of extraction variables on SUPRAS extraction efficiency highlights the importance of optimizing conditions to maximize the nutritional and antioxidant properties of sango radish and kale extracts. Therefore, a sensitivity analysis is conducted (Figure 7). The DPPH value for sango radish was most negatively affected by ethanol content, with a relative influence of −36.43%, while the most positive influence was observed for centrifugation rate, with a relative influence of +28.46%. The chlorophyll concentration was most negatively affected by ethanol content, with a relative influence of −18.05%, while the most positive influence was from SUPRAS: equilibrium rate, with a relative influence of +33.52%. The carotenoid concentration was most negatively affected by ethanol content, with a relative influence of −23.90%, while the most positive influence was from SUPRAS: equilibrium rate, with a relative influence of +39.01%. The phenol concentration was most negatively affected by the solid-liquid ratio, with a relative influence of −37.75%, while the most positive influence was from the SUPRAS: equilibrium rate, with a relative influence of +49.05%. The anthocyanidins concentration was most negatively affected by ethanol content, with a relative influence of −32.21%, while the most positive influence was from centrifugation time, with a relative influence of +19.25%.
The DPPH value for kale was most negatively affected by ethanol content, with a relative influence of −25.64%, while the most positive influence came from SUPRAS: equilibrium ratio, with a relative influence of +25.06%. The chlorophylls in kale were most negatively affected by the solid-liquid ratio, with a relative influence of −63.46%, while the most positive influence came from centrifugation time, with a relative influence of +4.34%. The carotenoid concentration was most negatively affected by the centrifugation rate, with a relative influence of −40.04%, while the most positive influence came from centrifugation time, with a relative influence of +41.69%. The phenols were most negatively affected by the solid-liquid ratio, with a relative influence of −3.28%, while the most positive influence came from the SUPRAS: equilibrium ratio, with a relative influence of +49.81%. The anthocyanidins concentration was most negatively affected by the centrifugation rate, with a relative influence of −18.47%, while the most positive influence came from the ethanol content, with a relative influence of +34.61%.
This analysis of the relative influences on SUPRAS extraction efficiency allows for optimization of the extraction process. For instance, increasing the SUPRAS: equilibrium ratio can enhance phenolic and carotenoid extraction, while managing ethanol content is crucial for antioxidant capacity and chlorophyll extraction. The data suggest that specific adjustments to SUPRAS: equilibrium ratio and centrifugation parameters can maximize the nutritional content of extracts, particularly for phenolics and chlorophylls, which are important for their health benefits. By further improving the extraction conditions (such as reducing ethanol content and optimizing SUPRAS: equilibrium ratio), it is possible to customize extracts for specific applications, such as high-antioxidant supplements or nutrient-rich food additives. Studies confirm that optimizing solvent ratios and centrifugation parameters can significantly impact the antioxidant capacity of plant extracts [41]. The actual literature supports that chlorophyll and carotenoid stability can be affected by extraction solvents and conditions, aligning with the observed data where ethanol negatively influenced chlorophyll extraction [42]. The strong influence of SUPRAS: Equilibrium ratio on phenolic content is consistent with research indicating that equilibrium conditions and solvent choice are critical for phenolic extraction [43,44,45]. The findings are in correlation with scientific literature and practically highlight the control of solvent ratios and centrifugation parameters to achieve the desired extract qualities.
The main goal of this investigation was to optimize the DPPH value and the content of chlorophylls, carotenoids, phenolics, and anthocyanidins during SUPRAS extraction of sango radish and kale microgreens, simultaneously using the ANN models, by changing the input variables. These numerical tasks were solved separately for ANN models for sango radish and kale microgreens using the MOO calculation in Matlab. Constraints used in the optimization procedure were applied within the experimental range of parameters. The number of generations reached 723 for ANN models for sango radish and 244 for Microgreens models, while the size of the population was set to 100 for each input variable for both models. The number of points on the Pareto front was 38 and 29 for the sango radish and kale microgreens models, respectively. The calculated maximums of DPPH value, and the content of chlorophylls, carotenoids, phenolics, and anthocyanidins during supramolecular solvent-based extraction of sango radish, were: 5734 µM TE/100 g; 876.441 mg/100 g; 12.214 mg/100 g; 6378.843 mg/100 g and 803.268 mg/100 g, respectively. The optimal result was achieved at an ethanol content of 35.695%; SUPRAS: equilibrium ratio = 1.008 v/v, centrifugation rate of 4019.012 rpm, centrifugation time of 19.842 min, and solid-liquid ratio of 30.146 mg/mL. According to standard score analysis, the obtained value was equal to a score of 0.89, which is higher than the score obtained using experimental results. The calculated maximum values during SUPRAS of kale were as follows: DPPH value at 5242 µM TE/100 g, chlorophyll content at 6624.310 mg/100 g, carotenoid content at 5.642 mg/100 g, phenolic content at 4013.083 mg/100 g, and anthocyanidin content at 152.659 mg/100 g. The optimal conditions for these results were achieved with 35.644% ethanol, 0.995 v/v SUPRAS: equilibrium ratio, centrifugation at 3927.159 rpm, a centrifugation time of 19.829 min, and a solid-liquid ratio of 30.375 mg/mL. According to the standard score analysis, the obtained score was 0.78, which is equal to the score obtained from the experimental result.
Verification of multi-objective optimized SUPRAS parameters
To validate the multi-objective optimized SUPRAS parameters, a comparison between the predicted and experimentally obtained results was conducted (Table 5). The degree of divergence between these values is also presented to assess the accuracy of the predictions. The degree of divergence is calculated to quantify the difference between the predicted and experimental results, providing insight into the reliability and precision of the optimization process.
The verification of the SUPRAS parameters demonstrates a high level of accuracy between the predicted and experimentally obtained values for both sango radish and kale microgreens. The degree of divergence is generally low, indicating that the optimization process is robust. Briefly, both microgreens showed a slight underestimation in the predicted values for DPPH compared to the experimental results, with divergence values of −3.09% for sango radish and −2.57% for kale. The experimental values for chlorophylls were slightly higher than the predicted values, with divergences of +2.36% for sango radish and +3.58% for kale. The predictions for carotenoids were very close to the experimental results, with minor divergences of −0.82% for sango radish and −0.01% for kale. The phenolics predicted values were slightly lower for both microgreens, with divergences of +1.81% for sango radish and +1.20% for kale, while the divergence values for anthocyanidins were minimal, showing −0.43% for sango radish and −1.02% for kale.
The results of the verification of multi-objective optimized SUPRAS parameters for sango radish and kale microgreens indicate the high accuracy and reliability of the optimization process. The use of SUPRAS-based methods for nutrient and compound extraction has been validated and optimized in various studies, showing similar reliability and efficiency. De Oliveira et al. [46] developed a SUPRAS-based method for determining methyl parathion in water samples, achieving high precision and low detection limits. Validation of a SUPRAS-LPME method for nitrite determination in meat demonstrates robust linearity and precision [47], while the use of a SUPRAS-DLLME method for chromium determination in beverages and vegetables confirmed its accuracy with certified reference materials [48]. Kashanaki et al. [49] utilized SUPRAS for arsenic speciation in environmental samples, highlighting the method’s specificity and enrichment factors.
These studies are in correlation with the findings of the current research, demonstrating that optimized SUPRAS-based extraction methods are reliable, precise, and applicable to various compounds and matrices. The low degree of divergence observed in this study aligns with these findings, confirming the robustness of SUPRAS techniques. Although there is no scientific literature on the specific topic in the field of microgreen extraction optimization, some universal implications can be seen. Reliable predictions in the SUPRAS extraction process reduce the need for extensive experimental trials, saving time and costs associated with additional analysis. This can enhance the profitability of microgreen farming by streamlining production processes and minimizing waste. Additionally, high levels of beneficial compounds in microgreens can enhance their health benefits, promoting their consumption as functional foods. This can contribute to better public health outcomes through improved dietary nutrition.
This study, while significant, has several limitations. One major limitation is the variability in phytochemical contents observed across different microgreen species. This variability poses a challenge to the consistency and generalizability of the extraction outcomes, making it difficult to apply the findings universally across all microgreens. Furthermore, the optimization parameters determined in this study, specifically tailored for sango radish and kale microgreens, may not be directly applicable to other plant matrices. Additionally, the experiments were conducted on a laboratory scale. Although promising, the findings may not directly translate to industrial-scale applications without further validation. The scalability of the SUPRAS extraction method has to be tested to ensure its practicality for commercial production. The study also did not address the long-term stability and bioavailability of the extracted compounds. These factors are crucial for the practical application of the extracts in supplements, pharmaceuticals, and functional foods. Future studies should aim to address these limitations. One direction for future research is to explore the SUPRAS extraction method for a broader range of microgreen species and other plant matrices. This would help evaluate the universality of the method and identify species-specific optimization parameters. Expanding the range of experimental conditions, such as varying ethanol content, SUPRAS equilibrium ratio, centrifugation rate, centrifugation time, and solid-liquid ratio beyond the ranges used in this study, could lead to more refined optimization. Conducting experiments on a larger, industrial scale would also be beneficial. This would help understand the practicality and efficiency of the SUPRAS extraction method for commercial production, addressing potential challenges in scaling up the process. Integrating SUPRAS extraction with continuous optimization techniques using advanced computational models can further enhance its efficiency and sustainability. This approach could lead to more consistent and high-quality extraction outcomes. An environmental impact assessment comparing the SUPRAS extraction method with traditional extraction techniques would provide a comprehensive understanding of its benefits in terms of sustainability and adherence to green chemistry principles.

4. Conclusions

The outcomes of this study highlight the significant potential of optimizing supramolecular solvent-based (SUPRAS) extraction for recovering bioactive compounds from microgreens. This research is novel in its comprehensive approach, combining the Taguchi design with artificial neural network (ANN) modeling and multi-objective optimization to enhance extraction efficiency. The innovative application of SUPRAS extraction in this context is particularly noteworthy, as it provides an environmentally friendly and efficient alternative to traditional extraction methods. This approach not only maximizes the yield of valuable bioactive compounds such as chlorophylls, carotenoids, phenolics, and anthocyanins but also aligns with green chemistry principles by minimizing the use of toxic organic solvents and promoting sustainable practices. The study’s implications extend beyond the laboratory scale, offering a scalable and sustainable method that could be adapted for industrial applications. By providing detailed optimization parameters for SUPRAS extraction, this research sets the groundwork for developing high-efficiency, low-impact extraction processes suitable for high-value agricultural products namely microgreens. The integration of computational models with experimental design further enhances the robustness and precision of the extraction process, ensuring consistent and high-quality outcomes. Moreover, this study addresses the critical need for efficient extraction techniques that preserve the integrity and activity of bioactive compounds, which are essential for their use in supplements, pharmaceuticals, and functional foods. The optimized SUPRAS extraction method demonstrated in this research has the potential to significantly impact the production of nutrient-rich extracts, thereby contributing to better dietary nutrition and public health outcomes. In conclusion, the novel application of SUPRAS extraction, combined with advanced optimization techniques, represents a significant advancement in the field of green extraction technologies. Future research should focus on scaling up this process for industrial use, exploring its efficacy on a broader range of microgreen species, and investigating the long-term stability and bioavailability of the extracted compounds. By addressing these areas, the practical applications of this innovative extraction method can be further established, enhancing the sustainability and efficiency of bioactive compound recovery from plant sources.

Author Contributions

Conceptualization, A.V., V.T. and O.Š.; methodology, A.V. and J.V.; software, L.P.; formal analysis, A.V.; investigation, A.V. and O.Š.; resources, A.V. and O.Š.; data curation, A.V., J.V. and L.P.; writing—original draft preparation, A.V., L.P. and O.Š.; writing—review and editing, A.V., L.P. and O.Š.; visualization, L.P. and O.Š.; supervision, O.Š., G.Ć. and J.Č.-B. All authors have read and agreed to the published version of the manuscript.

Funding

This research was funded by the Ministry of Science, Technological Development, and Innovation of the Republic of Serbia, grant numbers 451-03-66/2024-03/200134, 451-03-65/2024-03/200134, and 451-03-66/2024-03/200051.

Data Availability Statement

All the data is contained within the article.

Conflicts of Interest

The authors declare no conflicts of interest.

References

  1. Mir, S.; Shah, M.; Mir, M.M. Microgreens: Production, shelf life, and bioactive components. Crit. Rev. Food Sci. Nutr. 2017, 57, 2730–2736. [Google Scholar] [CrossRef] [PubMed]
  2. Bhaswant, M.; Shanmugam, D.K.; Miyazawa, T.; Abe, C.; Miyazawa, T. Microgreens—A Comprehensive Review of Bioactive Molecules and Health Benefits. Molecules 2023, 28, 867. [Google Scholar] [CrossRef] [PubMed]
  3. Paradiso, V.M.; Castellino, M.; Renna, M.; Santamaria, P.; Caponio, F. Setup of an Extraction Method for the Analysis of Carotenoids in Microgreens. Foods 2020, 9, 459. [Google Scholar] [CrossRef] [PubMed]
  4. Islam, M.Z.; Park, B.-J.; Kang, H.M.; Lee, Y.-T. Influence of selenium biofortification on the bioactive compounds and antioxidant activity of wheat microgreen extract. Food Chem. 2019, 309, 125763. [Google Scholar] [CrossRef] [PubMed]
  5. Komeroski, M.; Rios, A.; Flôres, S.H.; Klug, T. Overview on bioactive compounds’ profile of Brassicaceae microgreens: An approach on different production systems and the use of elicitors. Acta Bot. Bras. 2023, 37, e20230113. [Google Scholar] [CrossRef]
  6. Xiao, Z.; Lester, G.E.; Luo, Y.; Xie, Z.; Yu, L.; Wang, Q. Assessment of Vitamin and Carotenoid Concentrations of Emerging Food Products: Edible Microgreens. J. Agric. Food Chem. 2012, 60, 7644–7651. [Google Scholar] [CrossRef]
  7. Torres-Valenzuela, L.S.; Ballesteros-Gómez, A.; Rubio, S. Supramolecular solvent extraction of bioactives from coffee cherry pulp. J. Food Eng. 2020, 278, 109933. [Google Scholar] [CrossRef]
  8. Moral, A.; Caballo, C.; Sicilia, M.D. Highly efficient microextraction of chlorophenoxy acid herbicides in natural waters using a decanoic acid-based nanostructured solvent prior to their quantitation by liquid chromatography-mass spectrometry. Anal. Chim. Acta 2012, 709, 59–65. [Google Scholar] [CrossRef]
  9. Ballesteros-Gómez, A.; Sicilia, M.D.; Rubio, S. Supramolecular solvents in the extraction of organic compounds. A review. Anal. Chim. Acta 2010, 677, 108–130. [Google Scholar] [CrossRef]
  10. Bitwell, C.; Indra, S.S.; Luke, C.; Kakoma, M.K. A review of modern and conventional extraction techniques and their applications for extracting phytochemicals from plants. Sci. Afr. 2023, 19, e01585. [Google Scholar] [CrossRef]
  11. Ravanfar, R.; Tamadon, A.M.; Niakousari, M. Optimization of ultrasound-assisted extraction of anthocyanins from red cabbage using Taguchi design method. J. Food Sci. Technol. 2015, 52, 8140–8147. [Google Scholar] [CrossRef] [PubMed]
  12. Dmitrović, S.; Pajčin, I.; Lukić, N.; Vlajkov, V.; Grahovac, M.; Grahovac, J.; Jokić, A. Taguchi Grey Relational Analysis for Multi-Response Optimization of Bacillus Bacteria Flocculation Recovery from Fermented Broth by Chitosan to Enhance Biocontrol Efficiency. Polymers 2022, 14, 3282. [Google Scholar] [CrossRef] [PubMed]
  13. Jagirani, M.S.; Soylak, M. Supramolecular solvents: A review of a modern innovation in liquid-phase microextraction technique. Turk. J. Chem. 2021, 45, 1651–1677. [Google Scholar] [PubMed]
  14. Cardeñosa, V.; Lunar, M.L.; Rubio, S. Generalized and rapid supramolecular solvent-based sample treatment for the determination of annatto in food. J. Chromatogr. A 2011, 1218, 8996–9002. [Google Scholar] [CrossRef] [PubMed]
  15. Aćimović, M.; Šeregelj, V.; Šovljanski, O.; Tumbas Šaponjac, V.; Švarc Gajić, J.; Brezo-Borjan, T.M.; Pezo, L. In vitro antioxidant, antihyperglycemic, anti-inflammatory, and antimicrobial activity of Satureja kitaibelii Wierzb. ex Heuff. subcritical water extract. Ind. Crops Prod. 2021, 169, 113672. [Google Scholar] [CrossRef]
  16. Šovljanski, O.; Lončar, B.; Pezo, L.; Saveljić, A.; Tomić, A.; Brunet, S.; Filipović, V.; Filipović, J.; Čanadanović-Brunet, J.; Ćetković, G.; et al. Unlocking the Potential of the ANN Optimization in Sweet Potato Varieties Drying Processes. Foods 2023, 29, 134. [Google Scholar] [CrossRef] [PubMed]
  17. Šovljanski, O.; Šeregelj, V.; Pezo, L.; Tumbas Šaponjac, V.; Vulić, J.; Cvanić, T.; Markov, S.; Ćetković, G.; Čanadanović-Brunet, J. Horned Melon Pulp, Peel, and Seed: New Insight into Phytochemical and Biological Properties. Antioxidants 2022, 11, 825. [Google Scholar] [CrossRef] [PubMed]
  18. Tumbas Šaponjac, V.; Gironés-Vilaplana, A.; Djilas, S.; Mena, P.; Ćetković, G.; Moreno, D.A.; Krunić, M. Anthocyanin profiles and biological properties of caneberry (Rubus spp.) press residues. J. Sci. Food Agric. 2014, 94, 2393–2400. [Google Scholar] [CrossRef] [PubMed]
  19. Brlek, T.; Pezo, L.; Voća, N.; Krička, T.; Vukmirović, Đ.; Čolović, R.; Bodroža-Solarov, M. Chemometric approach for assessing the quality of olive cake pellets. Fuel Proc. Technol. 2013, 116, 250–256. [Google Scholar] [CrossRef]
  20. Šovljanski, O.; Pezo, L.; Grahovac, J.; Tomić, A.; Ranitović, A.; Cvetković, D.; Markov, S. Best-performing Bacillus strains for microbiologically induced CaCO3 precipitation: Screening of relative influence of operational and environmental factors. J. Biotechnol. 2022, 350, 31–41. [Google Scholar] [CrossRef]
  21. Šovljanski, O.; Saveljić, A.; Tomić, A.; Šeregelj, V.; Lončar, B.; Cvetković, D.; Ranitović, A.; Pezo, L.; Ćetković, G.; Markov, S.; et al. Carotenoid-Producing Yeasts: Selection of the Best-Performing Strain and the Total Carotenoid Extraction Procedure. Processes 2022, 10, 1699. [Google Scholar] [CrossRef]
  22. Goldberg, D.E. Genetic Algorithms in Search, Optimization and Machine Learning, 1st ed.; Addison-Wesley Longman Publishing Co., Inc.: Boston, MA, USA, 1989. [Google Scholar]
  23. Silitonga, A.S.; Masjuki, H.H.; Ong, H.C.; Sebayang, A.H.; Dharma, S.; Kusumo, F.; Siswantoro, J.; Milano, J.; Daud, K.; Mahlia, T.M.I.; et al. Evaluation of the engine performance and exhaust emissions of biodiesel-bioethanol-diesel blends using kernel-based extreme learning machine. Energies 2019, 159, 1075–1087. [Google Scholar] [CrossRef]
  24. Silitonga, A.S.; Mahlia, T.M.I.; Shamsuddin, A.H.; Ong, H.C.; Milano, J.; Kusumo, F.; Sebayang, A.H.; Dharma, S.; Ibrahim, H.; Husin, H.; et al. Optimization of Cerbera manghas biodiesel production using artificial neural networks integrated with ant colony optimization. Energies 2019, 12, 3811. [Google Scholar] [CrossRef]
  25. Szymanowska, U.; Baraniak, B.; Bogucka-Kocka, A. Antioxidant, anti-inflammatory, and postulated cytotoxic activity of phenolic and anthocyanin-rich fractions from polana raspberry (Rubus idaeus L.) fruit and juice—In Vitro study. Molecules 2018, 23, 1812. [Google Scholar] [CrossRef] [PubMed]
  26. Dudnik, A.; Gaspar, P.; Neves, A.R.; Forster, J. Engineering of microbial cell factories for the production of plant polyphenols with health-beneficial properties. Curr. Pharm. Des. 2018, 24, 2208–2225. [Google Scholar] [CrossRef] [PubMed]
  27. Gunjal, M.; Singh, J.; Kaur, J.; Kaur, S.; Nanda, V.; Mehta, C.M.; Bhadariya, V.; Rasane, P. Comparative analysis of morphological, nutritional, and bioactive properties of selected microgreens in alternative growing medium. S. Afr. J. Bot. 2024, 165, 188–201. [Google Scholar] [CrossRef]
  28. Toro, M.T.; Fustos-Toribio, R.; Ortiz, J.; Becerra, J.; Zapata, N.; López-Belchí, M.D. Antioxidant Responses and Phytochemical Accumulation in Raphanus Species Sprouts through Elicitors and Predictive Models under High-Temperature Stress. Antioxidants 2024, 13, 333. [Google Scholar] [CrossRef] [PubMed]
  29. Patra, S.; Makhal, P.; Jaryal, S.; More, N.; Kaki, V.R. Anthocyanins: Plant-based flavonoid pigments with diverse biological activities. Int. J. Plant Based Pharm. 2020, 2, 118–127. [Google Scholar] [CrossRef]
  30. de la Fuente, B.; López-García, G.; Máñez, V.; Alegría, A.; Barberá, R.; Cilla, A. Evaluation of the bioaccessibility of antioxidant bioactive compounds and minerals of four genotypes of Brassicaceae microgreens. Foods 2019, 8, 250. [Google Scholar] [CrossRef]
  31. Alloggia, F.P.; Bafumo, R.F.; Ramirez, D.A.; Maza, M.A.; Camargo, A.B. Brassicaceae microgreens: A novel and promissory source of sustainable bioactive compounds. Cur. Res. Food Sci. 2023, 100480. [Google Scholar] [CrossRef]
  32. Xiao, Z.; Rausch, S.R.; Luo, Y.; Sun, J.; Yu, L.; Wang, Q.; Chen, P.; Yu, L.; Stommel, J.R. Microgreens of Brassicaceae: Genetic diversity of phytochemical concentrations and antioxidant capacity. LWT 2019, 101, 731–737. [Google Scholar] [CrossRef]
  33. Li, Q.; Zhao, B.; Shi, J.; Chu, J.; Zhang, X.; Shi, Q. Efficient preparation of caffeoylquinic acids from the flowers of Artemisia anomala by supramolecular solvent/equilibrium solution extraction followed by re-extraction. Sep. Purif. Technol. 2021, 265, 118478. [Google Scholar] [CrossRef]
  34. Akpabli-Tsigbe, N.D.K.; Osabutey, J.; Mintah, B.K.; Tano-Debrah, K.; Ma, Y. Cleavage of macromolecule (protein/polysaccharide)-phenolic bond in soybean cell wall through Lactobacillus casei and Lactobacillus helviticus mixed culture solid-state fermentation for chlorogenic acid extraction. Food Biosci. 2023, 55, 102903. [Google Scholar] [CrossRef]
  35. Boateng, I.D.; Kumar, R.; Daubert, C.R.; Flint-Garcia, S.; Mustapha, A.; Kuehnel, L.; Agliata, J.; Li, Q.; Wan, C.; Somavat, P. Sonoprocessing improves phenolics profile, antioxidant capacity, structure, and product qualities of purple corn pericarp extract. Ultrason. Sonochem. 2023, 95, 106418. [Google Scholar] [CrossRef] [PubMed]
  36. Fakayode, O.A.; Aboagarib, E.A.A.; Yan, D.; Li, M.; Wahia, H.; Mustapha, A.T.; Zhou, C.; Ma, H. Novel two-pot approach ultrasonication and deep eutectic solvent pretreatments for watermelon rind delignification: Parametric screening and optimization via response surface methodology. Energy 2020, 203, 117872. [Google Scholar] [CrossRef]
  37. Bezerra, M.A.; Ferreira, S.L.C.; Novaes, C.G.; Dos Santos, A.M.P.; Valasques, G.S.; da Mata Cerqueira, U.M.F.; dos Santos Alves, J.P. Simultaneous optimization of multiple responses and its application in Analytical Chemistry–A review. Talanta 2019, 194, 941–959. [Google Scholar] [CrossRef] [PubMed]
  38. Boateng, I.D. Application of graphical optimization, desirability, and multiple response functions in the extraction of food bioactive compounds. Food Eng. Rev. 2023, 15, 309–328. [Google Scholar] [CrossRef]
  39. Akpabli-Tsigbe, N.D.K.; Ma, Y.; Ekumah, J.N.; Osabutey, J.; Hu, J.; Xu, M.; Johnson, N.A.N. Novel solid-state fermentation extraction of 5-O-caffeoylquinic acid from heilong48 soybean using Lactobacillus helviticus: Parametric screening and optimization. LWT-Food Sci. Technol. 2021, 149, 111809. [Google Scholar] [CrossRef]
  40. Zhou, G.; Ma, J.; Tang, Y.; Wang, X.; Zhang, J.; Yao, X.; Jiang, W.; Duan, J.A. Optimization of Ultrasound-Assisted Extraction Followed by Macroporous Resin Purification for Maximal Recovery of Functional Components and Removal of Toxic Components from Ginkgo biloba Leaves. BioMed Res. Int. 2018, 2018, 4598067. [Google Scholar] [CrossRef]
  41. Koraqi, H.; Petkoska, A.T.; Khalid, W.; Sehrish, A.; Ambreen, S.; Lorenzo, J.M. Optimization of the Extraction Conditions of Antioxidant Phenolic Compounds from Strawberry Fruits (Fragaria × ananassa Duch.) Using Response Surface Methodology. Food Anal. Methods 2023, 29, 1–13. [Google Scholar] [CrossRef]
  42. Sarkar, S.; Manna, M.S.; Bhowmick, T.K.; Gayen, K. Extraction of chlorophylls and carotenoids from dry and wet biomass of isolated Chlorella thermophila: Optimization of process parameters and modelling by artificial neural network. Proc. Biochem. 2020, 96, 58–72. [Google Scholar] [CrossRef]
  43. Pompeu, D.R.; Silva, E.M.; Rogez, J. Optimisation of the solvent extraction of phenolic antioxidants from fruits of Euterpe oleracea using Response Surface Methodology. Bioresour. Technol. 2009, 100, 6076–6082. [Google Scholar] [CrossRef] [PubMed]
  44. Santos-Buelga, C.; Gonzalez-Manzano, S.; Dueñas, M.; Gonzalez-Paramas, A.M. Extraction and Isolation of Phenolic Compounds. Nat. Prod. Isol. 2012, 427–464. [Google Scholar]
  45. Shi, L.; Zhao, W.; Yang, Z.; Subbiah, V.; Suleria, H.A.R. Extraction and characterization of phenolic compounds and their potential antioxidant activities. Environ. Sci. Pollut. Res. Int. 2022, 29, 81112–81129. [Google Scholar] [CrossRef] [PubMed]
  46. De Oliveira, L.L.G.; Kudo, M.; Lopes, C.T.; Tarley, C. Development and multivariate optimization of nanostructured supramolecular liquid-liquid microextraction validated method for highly sensitive determination of methyl parathion in water samples. J. Molec. Liq. 2020, 308, 113026. [Google Scholar] [CrossRef]
  47. Altunay, N.; Elik, A. A green and efficient vortex-assisted liquid-phase microextraction based on supramolecular solvent for UV-VIS determination of nitrite in processed meat and chicken products. Food Chem. 2020, 332, 127395. [Google Scholar] [CrossRef] [PubMed]
  48. Tuzen, M.; Elik, A.; Altunay, N. Ultrasound-assisted supramolecular solvent dispersive liquid-liquid microextraction for preconcentration and determination of Cr(VI) in waters and total chromium in beverages and vegetables. J. Mol. Liq. 2021, 329, 115556. [Google Scholar] [CrossRef]
  49. Kashanaki, R.; Ebrahimzadeh, H.; Moradi, M. Ultrasound-assisted supramolecular solvent microextraction coupled with graphite furnace atomic absorption spectrometry for speciation analysis of inorganic arsenic. Anal. Met. 2017, 9, 3121–3127. [Google Scholar] [CrossRef]
Figure 1. Sango radish (left) and kale (right) microgreens samples.
Processes 12 01451 g001
Figure 2. The main effects plot for the S/N analysis of the SUPRAS extraction efficiency: (a) Sango Radish; (b) Kale microgreens.
Processes 12 01451 g002
Figure 3. Normal probability plots: (a) Sango Radish; (b) Kale microgreens.
Processes 12 01451 g003
Figure 4. Standard score (SS) analysis of the Taguchi experimental data using positive polarity and the same significance coefficient (0.2) for all tested parameters.
Processes 12 01451 g004
Figure 5. Cluster analysis: (a) Sango Radish; (b) Kale microgreens.
Processes 12 01451 g005
Figure 6. PCA analysis: (a) Sango Radish; (b) Kale microgreens.
Processes 12 01451 g006
Figure 7. Relative influences of variables on SUPRAS extraction outputs. (EtOH—ethanol content; EqS—SUPRAS: Equilibrium ratio; CRPM—centrifugation rate; Ctime—centrifugation time; SLR—solid: liquid ratio): (a) Sango radish; (b) Kale.
Processes 12 01451 g007
Table 1. Taguchi experimental design for SUPRAS extraction.
Independent VariablesCoded SymbolLevels of Variation in the Coded and Examined Form
1 (Low)2 (Middle)3 (High)
Ethanol (%)X116/36
SUPRAS: Equilibrium ratio (mL/mL)X20.512
Centrifugation rate (rpm)X3300035004000
Centrifugation time (min)X4102030
Solid-liquid ratio (mg/mL)X5103050
Dependent variablesCoded SymbolConstraints
DPPH (µM TE/100 g)Y1“Larger is better”
(Maximize value)
Chlorophylls (mg/100 g)Y2
Carotenoids (mg/100 g)Y3
Phenolics (mg/100 g)Y4
Anthocyanidins (mg/100 g)Y5
Experimental design
RunX1X2X3X4X5
1160.530001010
2160.535002030
3160.540003050
416130001030
516135002050
616140003010
716230002050
816235003010
916240001030
10360.530002010
11360.535003030
12360.540001050
1336130003050
1436135001010
1536140002030
1636230002030
1736235001050
1836240002010
Table 2. Taguchi experimental design-related outputs for sango radish extracts.
RunSango Radish Microgreen Sample
DPPH
(µM TE/100 g)
Chlorophylls
(mg/100 g)
Carotenoids
(mg/100 g)
Phenolics
(mg/100 g)
Anthocyanidins
(mg/100 g)
11771.51 ± 15.03 d956.47 ± 7.97 f3.57 ± 0.07 e4728.83 ± 5.59 de466.14 ± 21.84 ab
21386.13 ± 42.74 c625.30 ± 8.97 d2.68 ± 0.44 de4615.69 ± 129.52 cd591.00 ± 4.08 ef
31147.01 ± 40.42 b417.08 ± 2.31 a0.33 ± 0.03 a6027.29 ± 48.34 h693.54 ± 1.67 hi
41011.41 ± 35.22 b1017.31 ± 43.79 fg7.52 ± 0.16 h3318.34 ± 165.86 a599.64 ± 7.21 f
52368.71 ± 19.63 f1051.44 ± 31.78 g5.66 ± 0.07 g4386.59 ± 136.30 c522.52 ± 6.14 d
62688.31 ± 29.63 g1996.87 ± 48.85 h1.16 ± 0.01 ab4989.46 ± 61.40 efg564.37 ± 3.65 e
7No phase separation occurred
81802.21 ± 13.86 d471.46 ± 5.20 abc2.19 ± 0.07 cd3303.62 ± 94.36 a672.40 ± 14.77 gh
9No phase separation occurred
102841.43 ± 33.85 h681.33 ± 20.63 d9.43 ± 0.29 i3845.89 ± 98.44 b477.19 ± 7.37 bc
114589.02 ± 94.08 j859.81 ± 13.26 e8.79 ± 0.55 i6566.06 ± 130.77 i640.29 ± 15.45 g
122156.02 ± 16.96 e479.59 ± 2.67 abc2.25 ± 0.34 cd5209.94 ± 18.66 fg581.74 ± 13.70 ef
131148.13 ± 8.73 b501.39 ± 2.86 bc7.58 ± 0.45 h5260.59 ± 63.43 fg507.63 ± 11.48 cd
141503.62 ± 51.63 c821.00 ± 6.53 e4.72 ± 0.02 f5276.66 ± 14.18 g722.42 ± 1.33 i
15646.51 ± 46.37 a876.63 ± 17.12 e12.00 ± 0.62 j6435.87 ± 212.98 i798.48 ± 13.78 j
162070.31 ± 85.01 e520.17 ± 5.44 c1.62 ± 0.03 bc4952.91 ± 7.72 ef485.27 ± 7.44 bc
17No phase separation occurred
184158.21 ± 53.96 i416.48 ± 6.90 abnd4203.46 ± 15.90 bc427.71 ± 13.86 a
nd—not detected; a–j Different letters (in columns) indicate statistically significant differences in means, according to post hoc Tukey’s HSD test (p < 0.05).
Table 3. Taguchi experimental design-related outputs for kale extracts.
RunKale Microgreen Sample
DPPH
(µM TE/100 g)
Chlorophylls
(mg/100 g)
Carotenoids
(mg/100 g)
Phenolics
(mg/100 g)
Anthocyanidins
(mg/100 g)
1916.32 ± 24.09 b1542.96 ± 77.76 e13.54 ± 0.41 fg3329.57 ± 68.37 end
21647.12 ± 47.96 ef472.75 ± 23.19 a5.94 ± 0.19 c2481.27 ± 79.96 bc41.41 ± 1.40 c
31918.31 ± 61.57 h370.66 ± 20.21 a3.53 ± 0.21 ab2695.28 ± 23.97 cd21.22 ± 1.02 b
41869.18 ± 32.75 gh621.37 ± 29.84 b5.48 ± 0.28 c2500.84 ± 43.30 bc8.4 ± 0.86 a
52417.03 ± 19.57 j811.23 ± 17.40 c6.53 ± 0.08 c5503.6 ± 62.05 i21.12 ± 1.02 b
61249.52 ± 11.38 c1905.27 ± 65.93 g4.83 ± 0.04 bc3867.91 ± 93.84 fgnd
71735.22 ± 46.22 fg954.06 ± 13.79 d23.64 ± 1.64 h1594.79 ± 39.29 a89.99 ± 4.63 e
81344.74 ± 60.72 cd1660.28 ± 11.93 f9.19 ± 0.77 d2869.26 ± 61.99 dnd
9No phase separation occurred
103121.22 ± 72.34 k4760.08 ± 37.68 k15.71 ± 0.26 g2643.03 ± 110.73 cd7.03 ± 0.87 a
114338.04 ± 44.83 m6554.13 ± 46.26 l23.74 ± 0.21 h3759.08 ± 55.38 f43.28 ± 2.17 c
122166.11 ± 24.14 i3332.03 ± 20.78 j12.06 ± 0.52 ef3811.05 ± 138.03 fg3.04 ± 0.41 a
131543.31 ± 35.06 de1956.51 ± 35.51 g9.64 ± 0.49 d2355.59 ± 109.76 b165.4 ± 4.31 h
144398.01 ± 102.53 m4708.27 ± 51.63 k2.3 ± 0.14 a4824.13 ± 119.84 h75.2 ± 2.08 d
155214.96 ± 94.46 n6645.59 ± 18.71 l5.7 ± 0.24 c4015.22 ± 74.45 g153.2 ± 4.17 g
163645.44 ± 46.33 l2515.11 ± 14.99 h10.09 ± 0.74 de1637.42 ± 53.03 and
17No phase separation occurred
18222.53 ± 8.42 a2893.33 ± 37.28 i3.78 ± 0.09 ab3260.83 ± 21.38 e19.2 ± 1.06 b
nd—not detected; a–n Different letters (in columns) indicate statistically significant differences in means, according to post hoc Tukey’s HSD test (p < 0.05).
Table 4. ANN calculation for SUPRAS extraction models.
ANN
Characteristics
Network NameTraining
Performance
Training ErrorTraining
Algorithm
Error FunctionHidden
Activation
Output
Activation
Sango radish
DPPHMLP 5-8-11.000.00BFGS 870SOSLogisticTanh
ChlorophyllsMLP 5-9-11.000.00BFGS 86SOSTanhIdentity
CarotenoidsMLP 5-9-11.000.00BFGS 75SOSTanhIdentity
PhenolicsMLP 5-9-11.000.00BFGS 82SOSExponentialIdentity
AnthocyanidinsMLP 5-6-11.000.00BFGS 93SOSExponentialIdentity
Kale
DPPHMLP 5-8-11.000.00BFGS 4989SOSExponentialLogistic
ChlorophyllsMLP 5-11-11.000.00BFGS 75SOSLogisticIdentity
CarotenoidsMLP 5-4-11.000.00BFGS 106SOSTanhIdentity
PhenolicsMLP 5-8-11.000.00BFGS 76SOSLogisticIdentity
AnthocyanidinsMLP 5-5-11.000.00BFGS 56SOSTanhIdentity
Table 5. Verification of predicted SUPRAS output values using optimized parameters in laboratory conditions.
SUPRAS Outputs for Optimized ExtractPredicted ValuesExperimentally Obtained ValuesDivergence Degree (%)
Sango radish microgreen
DPPH (µM TE/100 g)57345557−3.09
Chlorophylls (mg/100 g)876.44897.13+2.36
Carotenoids (mg/100 g)12.2112.11−0.82
Phenolics (mg/100 g)6378.846494.15+1.81
Anthocyanidins (mg/100 g)803.27799.85−0.43
Kale microgreen
DPPH (µM TE/100 g)52425107−2.57
Chlorophylls (mg/100 g)6624.316861.47+3.58
Carotenoids (mg/100 g)152.66152.64−0.01
Phenolics (mg/100 g)4013.084061.34+1.2
Anthocyanidins (mg/100 g)152.66151.1−1.02
Disclaimer/Publisher’s Note: The statements, opinions and data contained in all publications are solely those of the individual author(s) and contributor(s) and not of MDPI and/or the editor(s). MDPI and/or the editor(s) disclaim responsibility for any injury to people or property resulting from any ideas, methods, instructions or products referred to in the content.

