Article

A Comparison of the Carbon Footprints of Different Digested Sludge Post-Treatment Routes: A Case Study in China

1
Shanghai Investigation, Design & Research Institute Co., Ltd., Shanghai 200434, China
2
National Engineering Research Center of Eco-Environment Protection for Yangtze River Economic Belt, China Three Gorges Corporation, Beijing 100000, China
*
Author to whom correspondence should be addressed.
Processes 2024, 12(7), 1444; https://doi.org/10.3390/pr12071444
Submission received: 12 June 2024 / Revised: 2 July 2024 / Accepted: 7 July 2024 / Published: 10 July 2024
(This article belongs to the Special Issue Sustainable Management of Wastewater and Sludge)

Abstract

:
As the “carbon peaking and carbon neutrality” strategy advances, carbon emissions have gradually become a significant indicator in selecting and evaluating sewage and sludge treatment solutions. This study compared the carbon footprints of different digested sludge post-treatment routes, taking the Lu’an project in China as an example. Considering anaerobic digestion and digested sludge post-treatment options, the carbon footprints are as follows: 347.7 kg CO2 (land application) < 459.7 kg CO2 (composting-involved land application) < 858.4 kg CO2 (brickmaking). In general, land application was superior to brickmaking from the perspective of carbon footprints. The power consumption incurred by aerating and turning and the direct N2O and CH4 emissions during composting increase the composting-involved land application carbon footprint. However, digested sludge that is not subject to high-temperature sterilization and compost is phytotoxic and can be fetid, which is a limitation of its applicability. And the composted sludge has a lower N ratio and water content, so the same N input means more sludge usage, which is conducive to solving the disposal problem of large amounts of sludge. Thus, if possible, composting-involved land application should be a preference, and improvements to the technique are required to minimize energy consumption and direct N2O and CH4 emissions.

1. Introduction

The “carbon peaking and carbon neutrality” strategy has rendered carbon emissions one of the foundational indicators for sewage sludge treatment solutions and their evaluation. The greenhouse gas (GHG) emissions from sewage treatment, which is an energy-intensive industry, account for 1–2% of the total amount [1], and sludge treatment and disposal from wastewater treatment plants (WWTPs) could account for this emission level by 40% [2], which is considered an essential priority for carbon emission reductions in the water system. The amount of sludge in China has exceeded 65 million tons per year (calculated at 80% moisture content) and is expected to exceed 90 million tons by 2025 [3]. The increase in sludge amount is bound to lead to an increase in GHG emissions. Therefore, the low-carbon management of sludge is of great significance.
Common sludge treatment processes include incineration, anaerobic digestion, composting, pyrolysis, etc. [4]. Anaerobic digestion (AD) was identified as a favorable low-carbon sludge treatment alternative for its energy recycling potential [5,6,7]. The proportion of AD plants in sludge treatment projects in China is 15.5% [8]. Existing studies have evaluated the carbon footprint of AD plants with negative carbon emissions (Table 1) [6,7,9,10,11]. However, the post-treatment method of digested sludge in the above studies involves land application. Actually, the post-treatment options of digested sludge include producing building material, land application, or incineration [12], which has a great impact on the carbon footprint of AD plants [13].
There are few studies on the carbon footprint of digested sludge reuse in producing building materials, such as bricks [14]. As for application, direct use of digested sludge is not permitted in some countries [6]. It needs to be composted and sterilized to improve its agronomic performance [15]. In terms of GHG emissions, despite existing research showing that composted solid digestate has lower carbon emissions than non-composted solid digestate, land application [16,17], energy consumption, and direct GHG emissions in the composting process cannot be ignored [18]. IPCC emission factors are used in most studies to calculate the GHG emissions during composting [11,19,20]. But there is a relative uncertainty in the direct GHG emissions, which has been proven to be related to the material characteristics and composting parameters [21,22,23]. The studies using emission factors collected directly from field measurements are limited. Therefore, it is necessary to evaluate the carbon footprint of AD and different digested sludge post-treatment routes so as to provide low-carbon suggestions for AD plants. In addition, in view of the uncertainty of direct GHG emissions in the composting process, field monitoring is used to provide more reliable emission data.
This study compared different digested sludge post-treatment routes’ carbon footprints, taking the actual engineering project in Lu’an City as an example. Our aim is to provide a decision-making reference for the city’s sludge treatment and disposal from the “carbon emission management” perspective.

2. Materials and Methods

2.1. Sludge Testing

Collected from the Lu’an City Sludge Disposal Plant in 2023, the sludge samples were grouped into “untreated sludge”, “digested sludge”, and “composted sludge”. The sealed samples were sent back to the laboratory and stored at 4 °C prior to testing. According to the standard method [24,25], the samples were tested for organic content, moisture content, total nitrogen, total phosphorus, and total potassium. To evaluate the phytotoxicity of digested and composted sludge, the seed germination index (GI) was tested by using Ronga’s method [26].

2.2. Carbon Footprint Boundary

The accounting scope of sludge carbon footprint includes indirect emission and direct emission of CH4 and N2O. Because sludge is a biosolid, its CO2 emissions are considered neutral carbon [27]. The carbon footprint boundary shown in Figure 1 indicates the scope from initial sludge transportation to digested sludge post-treatment, centering on the Lu’an Sludge Disposal Project (Phase I). As shown, the residue sludge generated by WWTPs is pumped to the AD plant, where it is gravity-concentrated to 92% moisture content. It is then blended and heated in conditioning tank. Once conditioned and preheated, the sludge is pumped into anaerobic digestion reactor, and the reaction temperature is 35 ± 1 °C. The main source of carbon emissions from the above steps is the electricity consumed by transportation, heating, and mixing. Since the reactor is fully enclosed and works well, the escape of CH4 is not considered here [28]. Digested sludge is mechanically dewatered by a centrifuge after adding polyacrylamide (PAM). The dewatered sludge is mechanically turned and dried in the solar-heat drying shed. The carbon emission source in the process of dewatering and drying is the indirect emission produced by electricity and PAM consumption. Biogas is collected and purified, then burned in a boiler, which is used to provide heat for the conditioning tank and the AD reactor. The combustion efficiency is set at 96%, and 4% of the CH4 is actually released into the atmosphere [29]. The digested effluent from concentrate and dewatering system is drained to nearby WWTP, and GHG emissions during effluent treatment are also included in the boundary.
There are three routes of post-treatment of digested sludge: brickmaking, land application, and composting or land application. The composting equipment is in the AD plant. So, it is composted in the plant and then transported out.
Digested sludge is transported by road for brickmaking. The bricks are made by sintering a mixture of sludge, coal gangue, and clay at 1100 °C, similar to incineration. In this process, the grinding, mixing, pressing, and conveying of materials will consume electricity. Meanwhile, the waste gas produced by high-temperature sintering needs to be treated with lime and caustic soda. These are the main indirect emissions.
Digested sludge is transported by road to nearby greenbelt for artificial land application. In order to avoid the risk of environmental pollution from excessive application, the nitrogen input should be controlled within 100–300 kg N·ha−1 according to the agricultural fertilization process [30]. The specific application amount is calculated according to the nitrogen content in the sludge. On account of the high nitrogen content in sludge, soil microbial activities and plant activities can contribute to N2O production through the utilization and transformation of nitrogen. Soils were generally sinks of CH4 [31], and studies have indicated that the application of digestate did not impact the soil CH4 emission [32]. Therefore, direct CH4 emissions were not taken into consideration in this study.
As for composting, several 220 L composting buckets are used in Lu’an AD plants. The compression fans are used to blow air into the buckets, and the electric stirring paddles are installed to stir regularly to ensure that the material is mixed and exposed to air. Stirring and ventilation consume electricity and produce indirect emissions. Moreover, the composting process also produces direct emissions of N2O and CH4. Composted sludge is transported by road to nearby greenbelt for artificial land application similar to digested sludge with N2O emissions.

2.3. Accounting Method of Indirect Emissions

The IPCC emission factor approach was used for indirect emissions. The equation is as follows:
C = E F × A D
where EF is the emission factor (Table 2), and AD is the activity data (Table 3). The whole-year operating data of the Lu’an Sludge AD Plant, the operating data of the brickmaking factory (160,000 bricks; d−1), and the operating data of the composting equipment were taken as the activity data shown in Table 3. N2O and CH4 are converted to CO2 equivalent by global warming potential (GWP). The GWP of N2O is 298, and that of CH4 is 21.

2.4. Monitoring Method for Direct N2O and CH4 Emissions

2.4.1. N2O and CH4 Monitoring While Composting Digested Sludge

This research was based on a practical project to monitor N2O and CH4 emissions during the process of digested sludge composting, which was subject to forced ventilation, with straw being the assistant material at a proportion of 10%. The N2O and CH4 emission fluxes were monitored using the portable soil–atmosphere interface carbon–water and nitrogen–water flux measurement system (the LI-7810 CH4/CO2/H2O Trace Gas Analyzer and the LI-7820 N2O/H2O Trace Gas Analyzer, LI-COR Biosciences, Lincoln, NE, USA) supported by the smart gas flux survey chamber (the 8200-01S Smart Chamber, LI-COR Biosciences, Lincoln, NE, USA). The monitoring time was January, April, and June 2023.
Specific monitoring steps are as follows: (1) Fix the PVC soil measuring ring in the piles of compost, and the top of ring is about 5 cm above the piles. (2) Place the chamber on the ring and initially open the equipped vent to harmonize the internal pressure of the chamber with the external atmospheric pressure for about 45 s, then close the vents and prepare for monitoring. (3) The period from the closure of the chamber vents until its reopening marks the monitoring length. To minimize the effect of the presence of the chamber on gas gradients within the piles of compost, the monitoring length was set to 120 s [39]. Gas increase rates, dX/dt (nmol·m−2·s−1), are automatically calculated using SoilFluxPro software 5.0. Gas fluxes are calculated according to the size of the soil measuring ring S (m2).
F X = 1 S d X d t
The monitoring period of the compost is 11 days, based on the temperature of the compost. Gas fluxes were measured between 9:00 and 11:00 a.m. every day during the period.
The long-term sampling analysis helped achieve long time-series gas fluxes under different conditions. Specifically, the accumulation of time spans allowed for the calculation of the emission of gas X within a long time series.
q X = M X 0 T F X d t
where qX is the emission of gas X within time T from the pile (g), MX is the molar mass of gas X (g·mol−1), and FX is the soil emission flux of gas X (nmol·s−1). In this case, the 11-day composting cycle was considered the monitoring span. With the qX value obtained and the mass of the sludge dry basis considered together, the GHG emission per unit of dry basis (i.e., the emission factor; kg·tDS−1) can be calculated.

2.4.2. N2O Emissions from the Application of Digested and Composted Sludge on Land

Digested sludge and composted sludge are high in nitrogen and may cause an increase in soil N2O emissions when applied on land. It has been proved that N2O emissions in soil are related to N input [40,41]. Using the monitoring method described in Section 2.4.1, our team [27] conducted long-term monitoring of N2O emission fluxes in the case of applying digested sludge and composted sludge as soil amendments in landscaping. By monitoring the N2O emission fluxes of control groups with different N inputs, a mathematical relationship between N input and N2O emissions was established. The logarithmic model of N input and N2O emissions presented a higher coefficient of determination (R2) than linear and quadratic models due to the special characteristics of sludge [27,40]. Specifically, the models for digested sludge and composted sludge are, respectively, y = 3.84ln (x + 371.9) − 22.73 and y = 4.49ln (x + 875.9) − 30.51 [27]. In the previous formula, x refers to the amount of nitrogen (kg N) input, and y refers to the N2O emission (kg N2O-N). Therefore, in the context of the application of sludge on land, the carbon emissions can be calculated based on the actual nitrogen inputs.

2.5. Accounting of Carbon Emission Reduction

Sludge as organic fertilizer could be an ideal alternative to some chemical fertilizers for its richness in nitrogen (N), phosphorus (P), and potassium (K), which is beneficial to improving soil fertility and promoting plant growth. But excessive application of organic fertilizers will also increase the risk of nitrogen loss. In this research, it is assumed that the chemical fertilizer replacement rate of sludge organic fertilizer (N, P, and K) is 70% [42,43]. The carbon emission reduction upon replacing chemical fertilizers with sludge can be calculated according to the carbon emissions from fertilizer production, which are drawn from the existing literature (Table 4).
E N = A N E F N
E P = A P 142 62 E F P
E K = A K 94 78 E F K
The sludge-based carbon substitution in land application refers to Equations (4)–(6), where EN, EP, and EK are the carbon emission reductions after replacing N, P, and K fertilizers with sludge; AN, AP, and AK are the contents of N, P, and K in sludge; and EFN, EFP, and EFK are the general emission factors of N, P, and K fertilizers.

3. Results and Discussion

3.1. Sludge Characteristics

Sludge characteristics are shown in Table 5. Organic matter, total nitrogen, total phosphorus, and total potassium are all percentages based on a dry basis. The raw sludge was pumped to the AD plant. After concentration, the sludge had a moisture content of 92.0%, an organic content of 42%, and a C/N ratio of 10. After digestion and dewatering, the digested sludge had a moisture content of approximately 67.1%, with a decreased organic content and total organic carbon content since a part of the organic substances was degraded and converted to methane, and the C/N ratio fell to 8.7. In the composting procedure, straw (10%) was input as the assistant material to increase the C/N ratio, and the moisture content further decreased to 45.6% because of biological drying.

3.2. Carbon Emission Analysis of Anaerobic Digestion

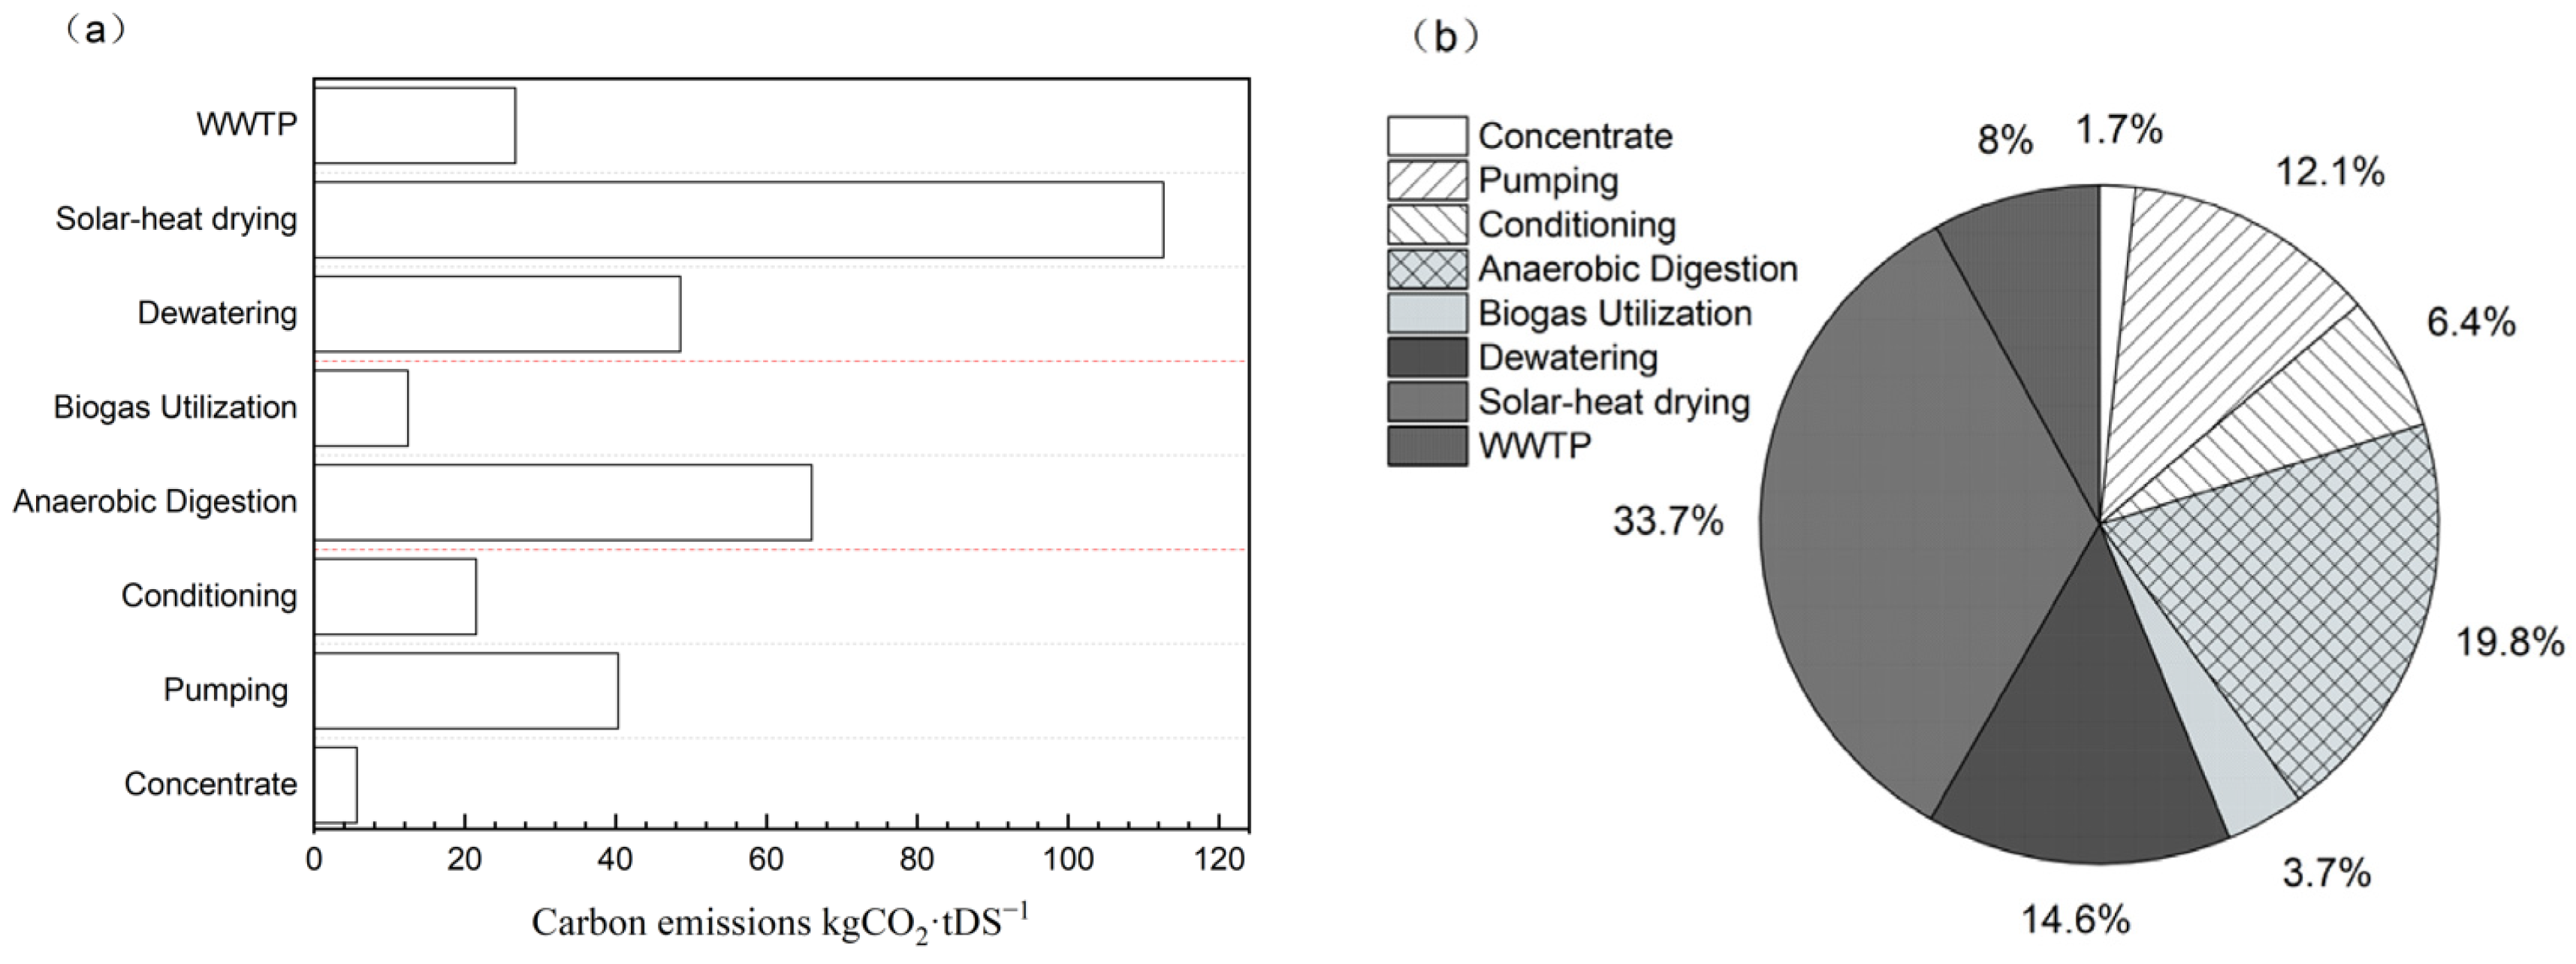
The scale of the AD plant in Lu’an City is 140 t·d−1 (80% moisture content). Within the study timeframe, it operated at almost full capacity. The residual sludge from the WWTPs was pumped to the AD plant through pipelines, where it underwent concentration and conditioning to enter the AD reactors. The hydraulic retention time is 28 days. After centrifugal dewatering, the digested sludge went into the solar-heat drying shed; meanwhile, the digested effluent flowed back to the WWTP. At the same time, the biogas burned in the biogas boilers to provide heat to maintain the temperature inside the AD reactors. The carbon emissions are provided in Figure 2.
According to the statistics, from sludge pumping to AD and solar-heat drying, the total carbon emission was 9351.48 kg CO2·d−1, equivalent to 333.98 kg CO2·tDS−1 on a dry basis. Specifically, the solar-heat drying procedure had the highest carbon emissions and involved sludge turning and air blowing, which can consume massive amounts of electricity. Compared with other studies, in which carbon emissions of AD are negative [9,11], there is no carbon reduction in this study. There is no cogeneration because of the direct combustion of biogas.

3.3. Carbon Emission Analysis of Digested Sludge Disposal

3.3.1. Brickmaking

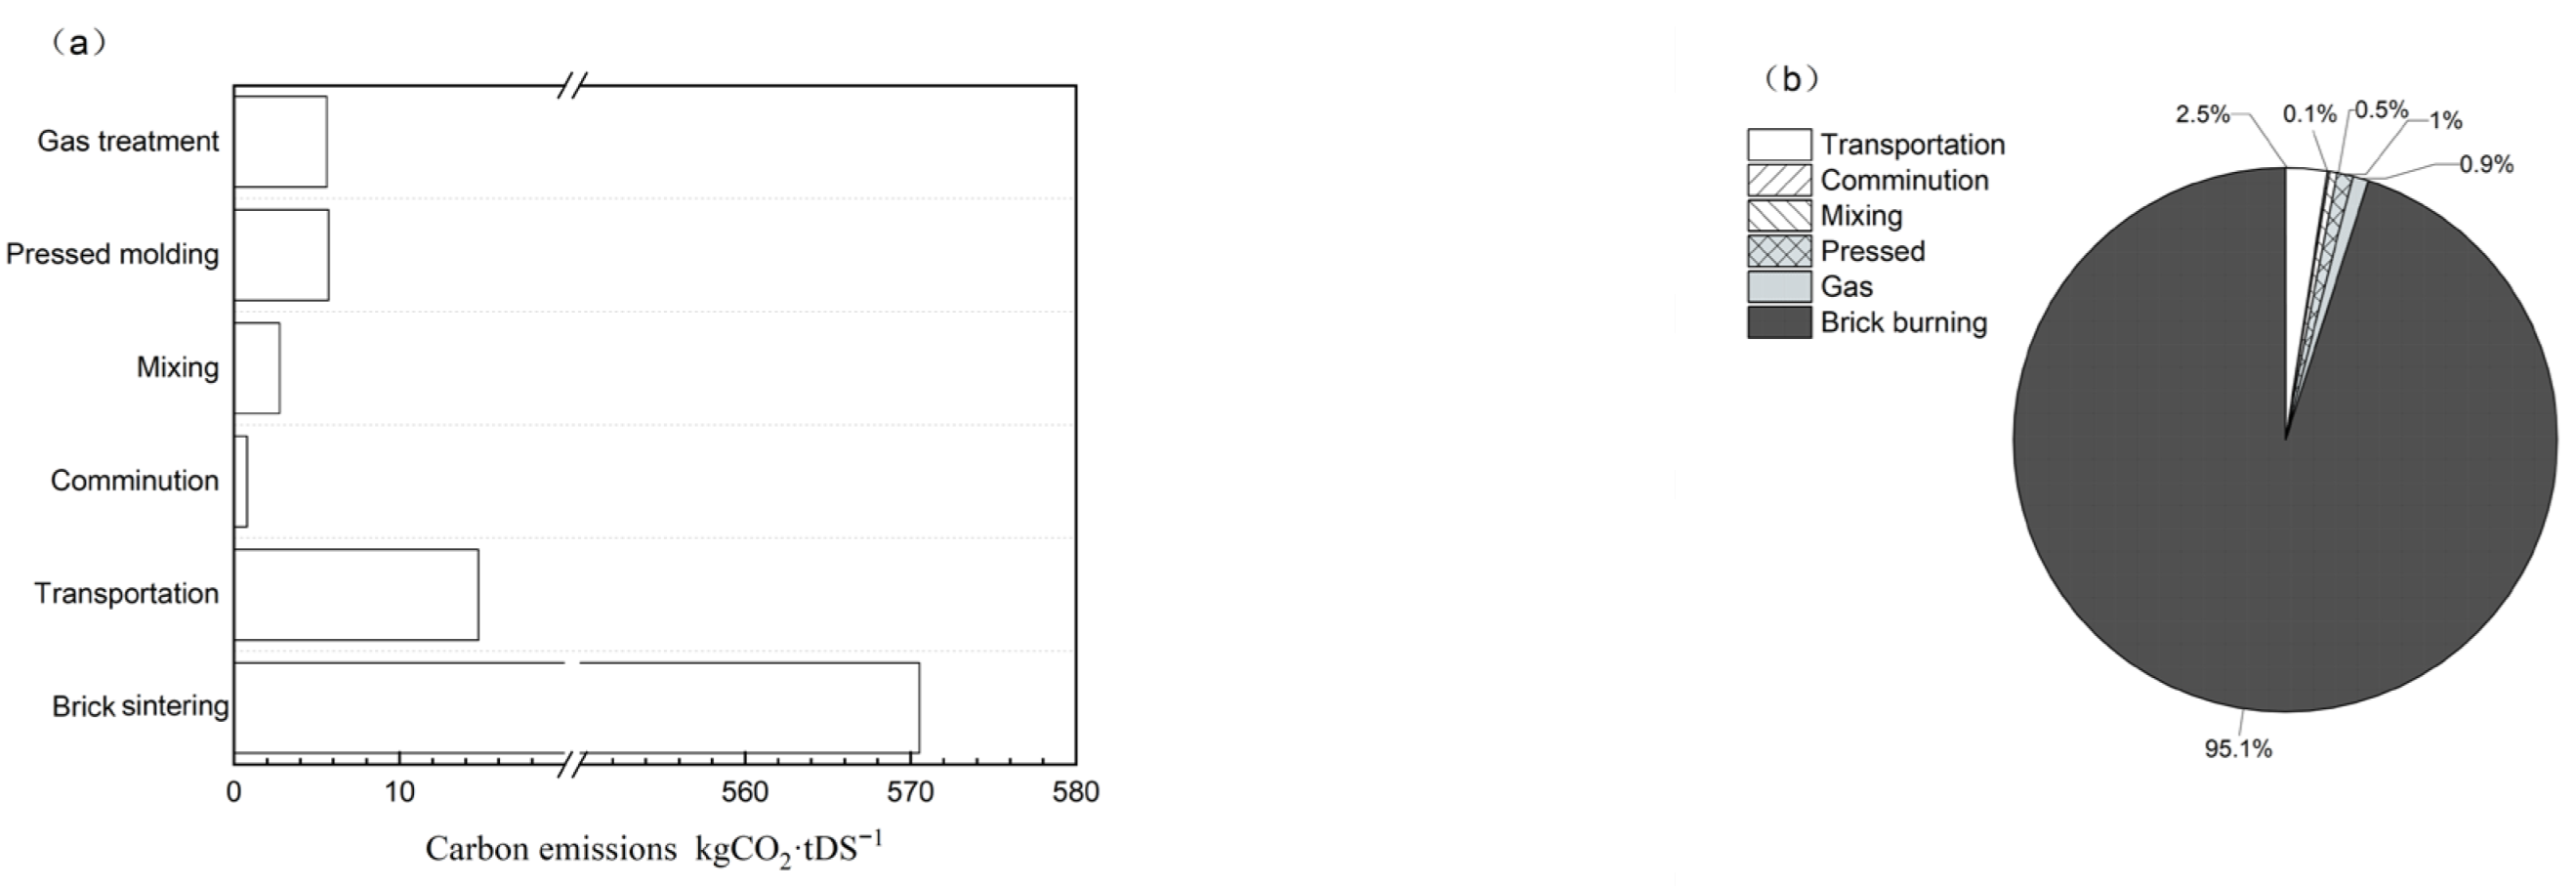
Digested sludge that has been through solar drying is sent by road to brick factories for brickmaking and is mixed with coal gangue and clay. In scenarios where sludge is not considered, coal gangue and clay, the two raw materials in sintered bricks, are mixed at a ratio of 1:4. However, due to the requirements in terms of heat value and ignition loss, the additive amount of sludge for each brick should not exceed 4%. Also, digested sludge has a limited contribution to the heat value because of its low organic content, but it necessitates more coal gangue due to the extra moisture from sludge. In this case, the heat value of coal gangue is 8380 kJ·kg−1, and each kilogram of water needs 2260 kJ to evaporate, which means that an additional 0.6 t of coal gangue is required per 1 tDS of sludge added. The additional consumption of coal gangue should be regarded as the carbon emissions resulting from sludge-involved brickmaking. Other emissions can be calculated based on the factory’s indirect carbon emissions per unit of raw material consumed. Carbon emissions from different procedures in digested sludge-involved brickmaking are shown in Figure 3. Thus, the total carbon emissions from digested sludge-involved brickmaking reach 600 kgCO2·tDS−1, of which 95% is incurred by the necessary increase in coal gangue.

3.3.2. Land Application

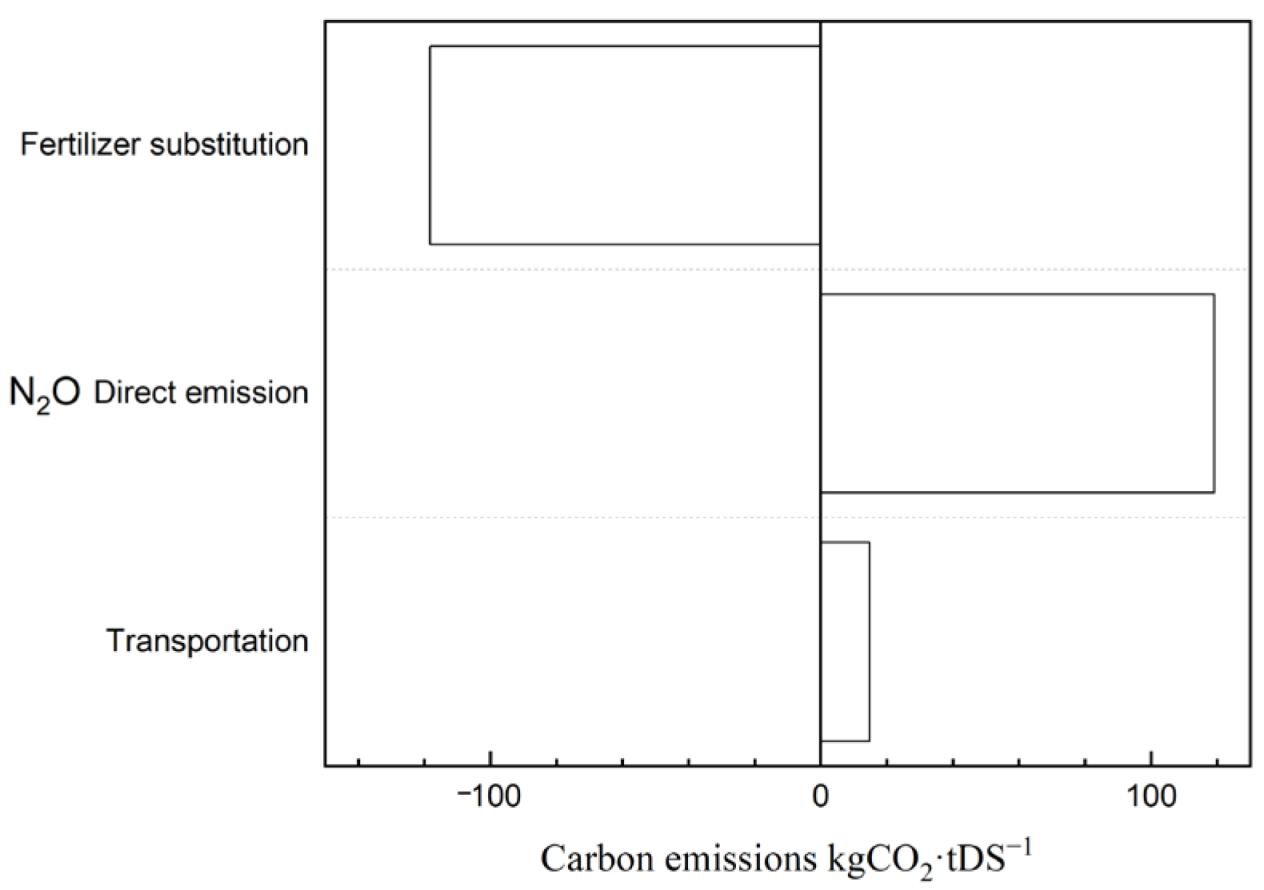
Digested sludge can be used as a soil amendment in landscaping after solar drying and natural aging. The main sources of carbon emissions from digested sludge-involved land application are fuel consumption and direct N2O emissions from soil; the latter is proven to be correlated with water management, crop type, soil property, and nitrogen input, among others [46]. The application amount of digested sludge is 2.94 t~8.82 tDS·ha−1 according to the nitrogen input within 100–300 kgN·ha−1, as described in Section 2.2. The range of the nitrogen emission factor is 0.6–1%, which was obtained from the references, as described in Section 2.4.2 [27], whereas the 2019 IPCC Guidelines for National Greenhouse Gas Inventories—Volume 4: Agriculture, Forestry and Other Land Use suggests that the default value of the direct nitrogen emission factor should be 1%, slightly greater than the measured values.
Based on the total nitrogen content in digested sludge, the direct N2O emission from land application is 0.32~0.53 kg N2O·tDS−1, equivalent to 95.53~159.22 kg CO2·tDS−1 in CO2 equivalence. With a nitrogen application level of 200 kgN·ha−1 considered, the average carbon emission resulting from direct N2O emissions is 0.40 kg N2O·tDS−1, equivalent to 119.2 kg CO2·tDS−1 in CO2 equivalence.
In addition, digested sludge is an ideal alternative to some chemical fertilizers since it is high in N, P, and K, for which the carbon emission reduction should be 118.29 kg CO2·tDS−1. The carbon emissions from land application are shown in Figure 4.

3.3.3. Composting

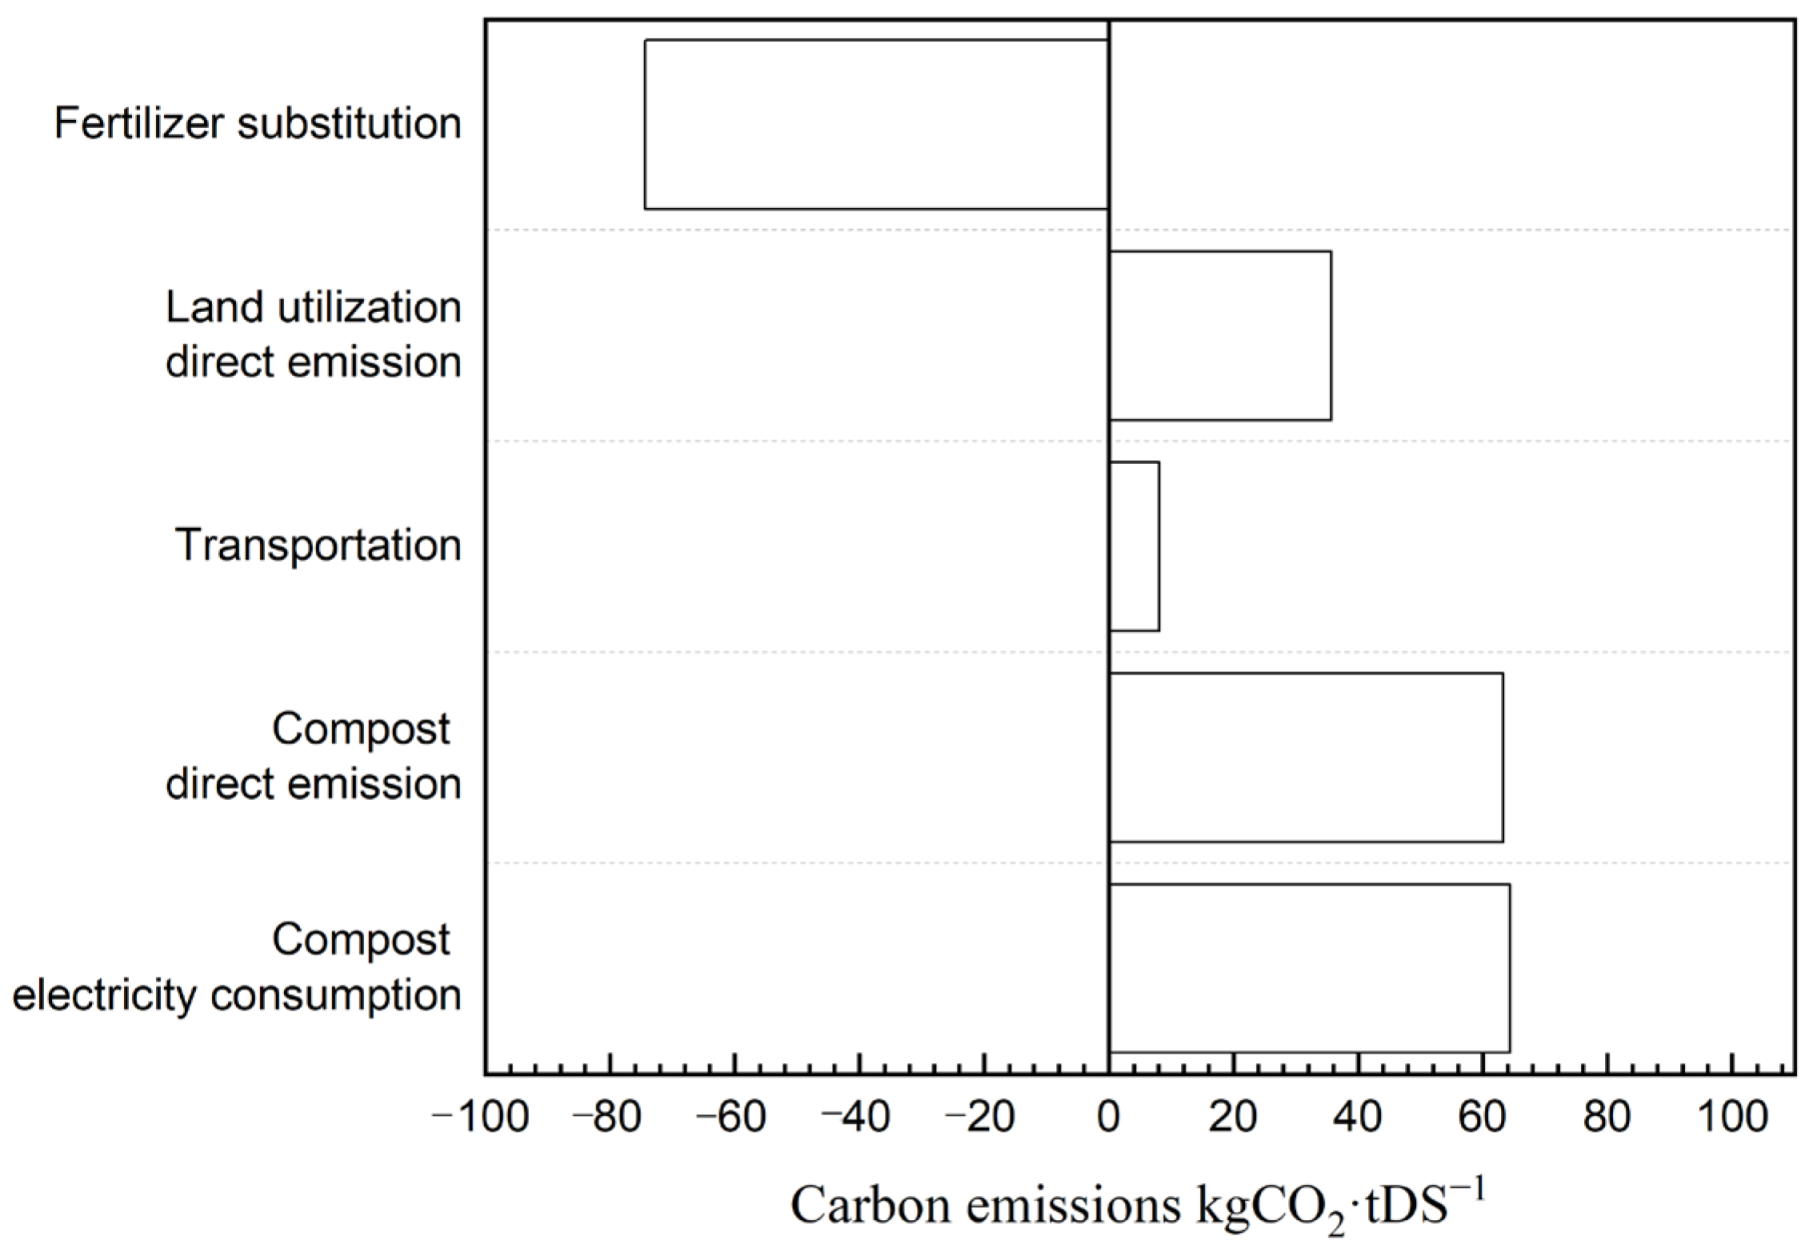
Straw can be mixed with digested sludge as an assistant material for composting, where the indirect carbon emission source is the power consumption of spreaders and centrifugal blowers. The direct emissions from composting and its products can be obtained by virtue of GHG fluxes. In the 11-day composting cycle, we monitored the cumulative N2O and CH4 emissions under different ventilation volumes and calculated the emission factors. The monitoring results are summarized in Figure 5.
In the composting cycle, the cumulative emissions of N2O and CH4 are 1.52~1.93 g and 5.23~5.84 g, respectively. Taking the treatment capacity and the global warming potential into consideration, the emission factors (dry basis) are 1.58~2.01 kg CO2·tDS−1 and 57.72–64.46 kg CO2·tDS−1, respectively. Increasing ventilation can reduce CH4 emissions to a certain extent but has little effect on N2O emissions. The digested sludge itself contains CH4 [47]. Composting is strictly an aerobic process; however, it is unavoidable that anaerobic conditions prevail in a few zones of the compost piles. These zones lead to the formation of CH4 due to the insufficient diffusion of oxygen [48]. Therefore, improved ventilation can reduce methane emissions. As for N2O, nitrification and denitrification take place simultaneously and produce N2O, which is a complicated process [49]. It may also be related to temperature microbial activity rather than just ventilation.
The 2019 IPCC Guidelines for National Greenhouse Gas Inventories—Volume 5: Waste suggests that the N2O and CH4 emission factors of composting are 59.6~476.8 kg CO2·tDS−1 and 1.68~420 kg CO2·tDS−1, respectively. The IPCC emission factors are derived from different solid compost data from around the world, which may give a relatively broad range of results. Therefore, monitoring data based on actual projects is more accurate. In this study, the direct emission from composting is 59.3~66.47 kg CO2·tDS−1. With a ventilation volume of 10 L·(h·kg)−1 considered, the average direct emission of N2O and CH4 is equivalent to 63.28 kg CO2·tDS−1.
The N2O emissions from composting-involved land application are shown in Figure 6, which is lower compared with the direct use of digested sludge, and a possibility is that composted sludge tends to have a lower moisture content and a higher C/N ratio. Similarly, the nitrogen input should be controlled within 100~300 kg N·ha−1, and the corresponding compost sludge application amount is 4.61~14.2 t·ha−1. The range of the nitrogen emission factor is 0.25~0.5% [27]. According to the total nitrogen content in composted sludge, the direct N2O emission in land application is 0.0825~0.165 kg N2O·tDS−1, equivalent to 24.59~49.17 kg CO2·tDS−1. With a nitrogen application level of 200 kg N·ha−1 considered, the average carbon emission resulting from direct N2O emissions is 0.12 kg N2O·tDS−1, equivalent to 35.76 kg CO2·tDS−1.

3.3.4. Comparison of Different Digested Sludge Post-Treatment Routes

Different disposal solutions for digested sludge may have significantly different influences on Lu’an City’s carbon footprint. After AD, the organic content can decrease to approximately 30% due to degradation. Figure 7 illustrates the carbon footprint of 1 tDS of sludge (dry matter excluded). The brickmaking solution can result in a carbon footprint of 858.4 kgCO2, the land application solution has a carbon footprint of 347.7 kgCO2, and the composting-involved land application solution is subject to 459.7 kgCO2.
Here, the carbon emissions of brickmaking solutions are highest. But, in a past study, the carbon emissions of brickmaking by sludge were 36.5 kgCO2·t−1 [50], much lower than this study. That is because, in Chen’s study, only carbon emissions from electricity were calculated. However, in this study, the addition of digested sludge is equivalent to increasing the water content of the brick. In order to evaporate the water, more coal gangue is consumed, thus releasing fossil carbon, which is the main source of carbon emissions. Studies have shown that, similar to incineration, the carbon emissions of brickmaking are higher, mainly because of higher sludge drying requirements [3]. But brickmaking offers an alternative to the disposal of digested sludge in landfills and avoids the generation of incineration ash. So, it remains a sustainable way of sludge management [20].
Overall, land application is superior to brickmaking in terms of carbon emission reductions, whether composted or not. Land application of composted sludge has a lower carbon emission than the direct use of digested sludge. However, the power consumption of aerating and turning, as well as the direct N2O and CH4 emissions in composting, increases its carbon emission reduction, making it higher than that of the direct use of digested sludge. In practice, nevertheless, digested sludge that is not subject to high-temperature sterilization and fermentation is phytotoxic and can be fetid [51], which limits its universality. The GI represented phytotoxic is shown in Table 6. Composting can effectively improve the GI of digested sludge. In addition, due to the higher C/N ratio of composted sludge (Table 5), the usage of composted sludge is about 1.6 times that of digested sludge for the same N input, which is conducive to solving the disposal problem of large amounts of sludge. Therefore, if possible, composting-involved land application should be a preference; yet, technique improvements are required to minimize energy consumption and direct N2O and CH4 emissions.
In this study, we monitored the cumulative GHG emissions in only the first composting cycle (11 days) since the sludge subject was applied on land immediately after the 11-day composting process. In practice, most composting projects involve both primary fermentation and secondary fermentation, plus the possible GHG emissions during natural aging, which this research did not cover. Moreover, composting parameters also influence GHG emissions, which provides an opportunity for future research to reduce energy consumption and minimize GHG emissions by optimizing or adjusting these parameters.

4. Conclusions

This study compared the carbon footprints of different digested sludge post-treatment routes, taking Lu’an City in China as an example, and the results showed the following: (1) solar drying was the highest carbon emissions procedure in AD plant; (2) the carbon footprint of digested sludge-involved brickmaking was 858.4 kgCO2·tDS−1; (3) the carbon footprint of digested sludge-involved land application was 347.7 kgCO2·tDS−1; and (4) the carbon footprint of composted sludge-involved land application was 459.7 kgCO2·tDS−1. In general, land application was superior to brickmaking from the perspective of carbon footprint. As for land application, specifically, the composting-involved land application should be superior to the direct use of digested sludge on land (i.e., digested sludge-involved land application). However, the power consumption incurred by aerating and turning and the direct N2O and CH4 emissions during composting increase the former’s overall carbon footprint, which exceeds that of the latter. However, digested sludge that is not subject to high-temperature sterilization and fermentation is phytotoxic and can be fetid, which is a limitation of its applicability. Since the composted sludge has a lower N ratio and water content, the same N input means more sludge usage, which is conducive to solving the disposal problem of large amounts of sludge. Thus, if possible, composting-involved land application should be a preference, and improvements to the technique are required to minimize energy consumption and direct N2O and CH4 emissions.

Author Contributions

Conceptualization, H.C. and N.F.; methodology H.Y.; formal analysis, H.C. and N.F.; data curation, H.C.; investigation H.Y. and H.C.; writing—original draft, H.C.; funding acquisition, Y.G.; writing—review and editing, Y.G., X.M. and X.Z.; resources X.M.; visualization, X.Z. All authors have read and agreed to the published version of the manuscript.

Funding

This research was supported by the National Key Research and Development Program of China (2020YFC1908700), China Three Gorges Corporation (NBWL202300013), and Shanghai Investigation, Design & Research Institute (2023HJ(83)-012).

Data Availability Statement

Data are available upon request from the authors.

Conflicts of Interest

The authors declare no conflicts of interest. The authors declare that this study received funding from the National Key Research and Development Program of China (2020YFC1908700), China Three Gorges Corporation (NBWL202300013), and Shanghai Investigation, Design & Research Institute (2023HJ(83)-012). The funders were not involved in the study design; collection, analysis, or interpretation of data; the writing of this article; or the decision to submit it for publication.

References

  1. Ritchie, H.R.P.; Roser, M. Breakdown of carbon dioxide, methane and nitrous oxide emissions by sector. Our World Data 2020. Available online: https://ourworldindata.org/emissions-by-sector (accessed on 2 July 2024).
  2. Zhao, G.; Liu, W.; Xu, J.; Huang, X.; Lin, X.; Huang, J.; Li, G. Greenhouse Gas Emission Mitigation of Large-Scale Wastewater Treatment Plants (WWTPs): Optimization of Sludge Treatment and Disposal. Pol. J. Environ. Stud. 2020, 30, 955–964. [Google Scholar] [CrossRef] [PubMed]
  3. Chu, X.; Fei, Z.; Chu, Z.; Huang, W.-C. Decarbonizing the sludge treatment industry: Assessing the feasibility of achieving carbon reduction from carbon peaking to carbon neutrality. J. Clean. Prod. 2024, 434, 140023. [Google Scholar] [CrossRef]
  4. Wei, L.; Zhu, F.; Li, Q.; Xue, C.; Xia, X.; Yu, H.; Zhao, Q.; Jiang, J.; Bai, S. Development, current state and future trends of sludge management in China: Based on exploratory data and CO2-equivaient emissions analysis. Environ. Int. 2020, 144, 106093. [Google Scholar] [CrossRef] [PubMed]
  5. Karki, R.; Chuenchart, W.; Surendra, K.C.; Shrestha, S.; Raskin, L.; Sung, S.; Hashimoto, A.; Khanal, S.K. Anaerobic co-digestion: Current status and perspectives. Bioresour. Technol. 2021, 330, 125001. [Google Scholar] [CrossRef] [PubMed]
  6. Van Fan, Y.; Klemeš, J.J.; Lee, C.T.; Perry, S. Anaerobic digestion of municipal solid waste: Energy and carbon emission footprint. J. Environ. Manag. 2018, 223, 888–897. [Google Scholar] [CrossRef]
  7. Lijó, L.; González-García, S.; Bacenetti, J.; Fiala, M.; Feijoo, G.; Lema, J.M.; Moreira, M.T. Life Cycle Assessment of electricity production in Italy from anaerobic co-digestion of pig slurry and energy crops. Renew. Energy 2014, 68, 625–635. [Google Scholar] [CrossRef]
  8. Chai, B.-H.; Li, W.-T.; Qi, W.; Ran, L.-F.; Wang, Q.; Wang, M.-J.; Lu, Y. Status of municipal sludge treatment and disposal in China. Adv. New Renew. Energy 2023, 11, 38–44. [Google Scholar] [CrossRef]
  9. Cartes, J.; Neumann, P.; Hospido, A.; Vidal, G. Life cycle assessment of management alternatives for sludge from sewage treatment plants in Chile: Does advanced anaerobic digestion improve environmental performance compared to current practices? J. Mater. Cycles Waste Manag. 2018, 20, 1530–1540. [Google Scholar] [CrossRef]
  10. Yang, H.; Guo, Y.; Fang, N.; Dong, B. Life cycle assessment of sludge anaerobic digestion combined with land application treatment route: Greenhouse gas emission and reduction potential. J. Environ. Chem. Eng. 2023, 11, 111255. [Google Scholar] [CrossRef]
  11. Zhou, H.; Wang, Z.; Liu, B.; He, H.; Peng, S.; Zhang, Y.; Li, L.; Ai, J.; Yu, J.; Zhang, W. Regional heterogeneity of sustainable wastewater sludge management in China. Resour. Conserv. Recycl. 2024, 209, 107755. [Google Scholar] [CrossRef]
  12. Chojnacka, K.; Moustakas, K. Anaerobic digestate management for carbon neutrality and fertilizer use: A review of current practices and future opportunities. Biomass Bioenergy 2024, 180, 106991. [Google Scholar] [CrossRef]
  13. Zeng, Q.; Zhen, S.; Liu, J.; Ni, Z.; Chen, J.; Liu, Z.; Qi, C. Impact of solid digestate processing on carbon emission of an industrial-scale food waste co-digestion plant. Bioresour. Technol. 2022, 360, 127639. [Google Scholar] [CrossRef]
  14. Guo, D.; Li, B.; Yu, W.; Baroutian, S.; Young, B.R. A system engineering perspective for net zero carbon emission in wastewater and sludge treatment industry: A review. Sustain. Prod. Consum. 2024, 46, 369–381. [Google Scholar] [CrossRef]
  15. Czekała, W.; Nowak, M.; Piechota, G. Sustainable management and recycling of anaerobic digestate solid fraction by composting: A review. Bioresour. Technol. 2023, 375, 128813. [Google Scholar] [CrossRef]
  16. Hobson, A.M.; Frederickson, J.; Dise, N.B. CH4 and N2O from mechanically turned windrow and vermicomposting systems following in-vessel pre-treatment. Waste Manag. 2005, 25, 345–352. [Google Scholar] [CrossRef]
  17. Gurmessa, B.; Cocco, S.; Ashworth, A.J.; Udawatta, R.P.; Cardelli, V.; Ilari, A.; Serrani, D.; Fornasier, F.; Del Gatto, A.; Pedretti, E.F.; et al. Short term effects of digestate and composted digestate on soil health and crop yield: Implications for sustainable biowaste management in the bioenergy sector. Sci. Total Environ. 2024, 906, 167208. [Google Scholar] [CrossRef]
  18. Awasthi, M.K.; Wang, M.; Chen, H.; Wang, Q.; Zhao, J.; Ren, X.; Li, D.-S.; Awasthi, S.K.; Shen, F.; Li, R.; et al. Heterogeneity of biochar amendment to improve the carbon and nitrogen sequestration through reduce the greenhouse gases emissions during sewage sludge composting. Bioresour. Technol. 2017, 224, 428–438. [Google Scholar] [CrossRef]
  19. Piippo, S.; Lauronen, M.; Postila, H. Greenhouse gas emissions from different sewage sludge treatment methods in north. J. Clean. Prod. 2018, 177, 483–492. [Google Scholar] [CrossRef]
  20. Liu, B.; Wei, Q.; Zhang, B.; Bi, J. Life cycle GHG emissions of sewage sludge treatment and disposal options in Tai Lake Watershed, China. Sci. Total Environ. 2013, 447, 361–369. [Google Scholar] [CrossRef]
  21. Zhu-Barker, X.; Bailey, S.K.; Paw U, K.T.; Burger, M.; Horwath, W.R. Greenhouse gas emissions from green waste composting windrow. Waste Manag. 2017, 59, 70–79. [Google Scholar] [CrossRef]
  22. González, D.; Guerra, N.; Colón, J.; Gabriel, D.; Ponsá, S.; Sánchez, A. Characterization of the Gaseous and Odour Emissions from the Composting of Conventional Sewage Sludge. Atmosphere 2020, 11, 211. [Google Scholar] [CrossRef]
  23. He, Y.; Inamori, Y.; Mizuochi, M.; Kong, H.; Iwami, N.; Sun, T. Nitrous Oxide Emissions from Aerated Composting of Organic Waste. Environ. Sci. Technol. 2001, 35, 2347–2351. [Google Scholar] [CrossRef] [PubMed]
  24. GB 4284; Control Standards of Pollution in Sludge for Agricultural Use. Ministry of Ecology and Evironment: Beijing, China, 1985. (In Chinese)
  25. GBT 23486; The Disposal of Sludge from Municipal Wastewater Treatment Plant—The Quality of Sludge Used in Gardens or Parks. National Standards of People’s Republic of China: Beijing, China, 2009. (In Chinese)
  26. Ronga, D.; Setti, L.; Salvarani, C.; De Leo, R.; Bedin, E.; Pulvirenti, A.; Milc, J.; Pecchioni, N.; Francia, E. Effects of solid and liquid digestate for hydroponic baby leaf lettuce (Lactuca sativa L.) cultivation. Sci. Hortic. 2019, 244, 172–181. [Google Scholar] [CrossRef]
  27. Yang, H.; Guo, Y.; Fang, N.; Dong, B.; Wu, X. Greenhouse gas emissions of sewage sludge land application in urban green space: A field experiment in a Bermuda grassland. Sci. Total Environ. 2024, 926, 172106. [Google Scholar] [CrossRef] [PubMed]
  28. Guo, Q.; Dai, X. Analysis on carbon dioxide emission reduction during the anaerobic synergetic digestion technology of sludge and kitchen waste: Taking kitchen waste synergetic digestion project in Zhenjiang as an example. Waste Manag. 2017, 69, 360–364. [Google Scholar] [CrossRef] [PubMed]
  29. Malet, N.; Pellerin, S.; Girault, R.; Nesme, T. Does anaerobic digestion really help to reduce greenhouse gas emissions? A nuanced case study based on 30 cogeneration plants in France. J. Clean. Prod. 2023, 384, 135578. [Google Scholar] [CrossRef]
  30. Ju, X.T.; Zhang, C. The Principles and Indicators of Rational N Fertilization. Acta Pedol. Sin. 2021, 58, 1–13. [Google Scholar]
  31. Díaz, M.A.; Bown, H.E.; Fuentes, J.P.; Martínez, A.M. Soils act as sinks or sources of CH4 depending on air-filled porosity in sclerophyllous ecosystems in semiarid central Chile. Appl. Soil Ecol. 2018, 130, 13–20. [Google Scholar] [CrossRef]
  32. Pampillón-González, L.; Luna-Guido, M.; Ruíz-Valdiviezo, V.M.; Franco-Hernández, O.; Fernández-Luqueño, F.; Paredes-López, O.; Hernández, G.; Dendooven, L. Greenhouse Gas Emissions and Growth of Wheat Cultivated in Soil Amended with Digestate from Biogas Production. Pedosphere 2017, 27, 318–327. [Google Scholar] [CrossRef]
  33. Parravicini, V.; Svardal, K.; Krampe, J. Greenhouse Gas Emissions from Wastewater Treatment Plants. Energy Procedia 2016, 97, 246–253. [Google Scholar] [CrossRef]
  34. Li, Y.; Lv, C.; Yang, N.; Liu, H.; Liu, Z. A study of high temporal-spatial resolution greenhouse gas emissions inventory for on-road vehicles based on traffic speed-flow model: A case of Beijing. J. Clean. Prod. 2020, 277, 122419. [Google Scholar] [CrossRef]
  35. Guidelines for Carbon Emission Accounting and Reporting of Industrial Enterprises in Chongqing (Trial). (In Chinese). Available online: http://fzggw.cq.gov.cn/zwxx/tzgg/202002/t20200212_5169344.html (accessed on 7 June 2024).
  36. Cai, B.F.; Cao, D.; Liu, L.C.; Zhang, Z.S. Analysis of lime production and energy consumption in china. Environ. Eng. 2012, 30, 124–127. [Google Scholar]
  37. The Norm of Carbon Emissions Caps per Unit Product of Caustic Soda. (In Chinese). Available online: https://www.1clicktong.com/LawWeb/attached_prod/file/20190510/20190510222530_112.pdf (accessed on 2 July 2024).
  38. Zhang, C. Study on Carbon Emission of Urban Wastewater Treatment System in Chongqing. Ph.D. Thesis, Chongqing University, Chongqing, China, 2011. [Google Scholar]
  39. Chong, Y.; Li, H.; Pan, T.; You, L.; Du, H.; Yu, B.; Chen, J.; Ren, N.; Lu, L. More applicable quantification of non-CO2 greenhouse gas emissions from wastewater treatment plants by on-site plant-integrated measurements. Sci. Total Environ. 2024, 929, 172598. [Google Scholar] [CrossRef] [PubMed]
  40. Shcherbak, I.; Millar, N.; Robertson, G.P. Global metaanalysis of the nonlinear response of soil Nitrous oxide (N2O) emissions to fertilizer nitrogen. Proc. Natl. Acad. Sci. USA 2014, 111, 9199–9204. [Google Scholar] [CrossRef] [PubMed]
  41. Millar, N.; Urrea, A.; Kahmark, K.; Shcherbak, I.; Robertson, G.P.; Ortiz-Monasterio, I. Nitrous oxide (N2O) flux responds exponentially to nitrogen fertilizer in irrigated wheat in the Yaqui Valley, Mexico. Agric. Ecosyst. Environ. 2018, 261, 125–132. [Google Scholar] [CrossRef]
  42. Miao, Y.L.; Liang, F.; Xie, J.; Zhang, Q.; Liu, Y.R.; Zhao, X.M. Effects of Long-term Organic Fertilizer Instead of Chemical Fertilizer on Organic Carbon Stability of Paddy Soil. Acta Pedol. Sin. 2023, 60, 512–522. [Google Scholar]
  43. Hou, H.Q.; Ji, J.H.; Liu, X.; Lv, Z.; Lan, X.J.; Liu, Y.R. Effect of Long-Term Combined Application of Organic and Inorganic Fertilizers on Rice Yield, Nitrogen Uptake and Utilization in Red Soil Area of China. Soils 2020, 52, 758–765. [Google Scholar]
  44. Gao, Y.; Serrenho, A.C. Greenhouse gas emissions from nitrogen fertilizers could be reduced by up to one-fifth of current levels by 2050 with combined interventions. Nat. Food 2023, 4, 170–178. [Google Scholar] [CrossRef]
  45. Chen, S.; Lu, F.; Wang, X. Estimation of greenhouse gases emission factors for China’s nitrogen, phosphate, and potash fertilizers. Acta Ecol. Sin. 2015, 35, 6371–6383. [Google Scholar] [CrossRef]
  46. Cayuela, M.L.; Aguilera, E.; Sanz-Cobena, A.; Adams, D.C.; Abalos, D.; Barton, L.; Ryals, R.; Silver, W.L.; Alfaro, M.A.; Pappa, V.A.; et al. Direct nitrous oxide emissions in Mediterranean climate cropping systems: Emission factors based on a meta-analysis of available measurement data. Agric. Ecosyst. Environ. 2017, 238, 25–35. [Google Scholar] [CrossRef]
  47. Dietrich, M.; Fongen, M.; Foereid, B. Anaerobic digestion affecting nitrous oxide and methane emissions from the composting process. Bioresour. Technol. Rep. 2021, 15, 100752. [Google Scholar] [CrossRef]
  48. Font, X.; Artola, A.; Sánchez, A. Detection, Composition and Treatment of Volatile Organic Compounds from Waste Treatment Plants. Sensors 2011, 11, 4043–4059. [Google Scholar] [CrossRef] [PubMed]
  49. Nag, M.; Shimaoka, T.; Komiya, T. Nitrous oxide production during nitrification from organic solid waste under temperature and oxygen conditions. Environ. Technol. 2016, 37, 2890–2897. [Google Scholar] [CrossRef] [PubMed]
  50. Chen, Y.-C.; Kuo, J. Potential of greenhouse gas emissions from sewage sludge management: A case study of Taiwan. J. Clean. Prod. 2016, 129, 196–201. [Google Scholar] [CrossRef]
  51. Guan, D.; Zhao, J.; Wang, Y.; Fu, Z.; Zhang, D.; Zhang, H.; Xie, J.; Sun, Y.; Zhu, J.; Wang, D. A critical review on sustainable management and resource utilization of digestate. Process Saf. Environ. Prot. 2024, 183, 339–354. [Google Scholar] [CrossRef]
Figure 1. Carbon footprint boundary.
Processes 12 01444 g001
Figure 2. (a) Carbon emissions from different procedures in anaerobic digestion. (b) Carbon emission proportions from different procedures in anaerobic digestion.
Processes 12 01444 g002
Figure 3. (a) Carbon emissions from different procedures in digested sludge-involved brickmaking. (b) Proportions of carbon emissions from different procedures in digested sludge-involved brickmaking.
Processes 12 01444 g003
Figure 4. Carbon emissions from digested sludge-involved land application.
Processes 12 01444 g004
Figure 5. (a) Cumulative N2O and CH4 emissions under different ventilation volumes. (b) CO2 equivalences of direct N2O and CH4 emissions under different ventilation volumes. The data shown in the graph are means and standard deviations.
Processes 12 01444 g005
Figure 6. Carbon emissions from composting-involved land application.
Processes 12 01444 g006
Figure 7. Sludge carbon footprint in Lu’an city.
Processes 12 01444 g007
Table 1. GHG emission of AD process.
Process DescriptionGHG Emissions
(kgCO2/t Dry Solid (DS))
References
Thickening→AD→dewatering→land application−5.36[9]
Thickening→AD→dewatering→land application−26.33[10]
Thickening→AD→dewatering→land application−178~106[11]
Thermal hydrolysis→AD→dewatering→land application−627~−202[11]
Table 2. Carbon emission factors.
Emission Factor
PAM2.62 kg CO2·kg−1 [33]
Electricity0.5703 kg CO2·kg−1
Diesel Fuel1.45 kg·kg−1 Standard coal
Coal Transportation0.665 kg CO2/km [34]
Coal Gangue0.807 kgCO2/kg [35]
Limestone0.43 kgCO2/kg [36]
Caustic Soda1.912 kgCO2/kg [37]
Wastewater Treatment3.3 kgCO2/t [38]
Table 3. Activity data from operational data in the actual project.
Activity Data
Anaerobic DigestionPower Consumption—Thickening10 kWh·tDS−1
Power Consumption—Pumping70.71 kWh·tDS−1
Power Consumption—Conditioning37.71 kWh·tDS−1
Power Consumption—Anaerobic Digestion106.29 kWh·tDS−1
Power Consumption—Centrifugal Dewatering77.14 kWh·tDS−1
PAM Consumption—Centrifugal Dewatering2 kg·tDS−1
Power Consumption—Solar Drying49.37·tDS−1
Biogas Slurry Treatment Capacity226.8 t·d−1
Power Consumption—Biogas Boilers21.85 kWh·tDS−1
Direction Emissions—Biogas Production1200 m3·d−1
Direction Emissions—Methane Ratio60%
Amount of Digested Effluent Produced8.10 t water·tDS−1
BrickmakingPower Consumption—Material Grinding and Transport233.31 kWh·d−1
Power Consumption—Material Mixing and Transport837 kWh·d−1
Power Consumption—Compression Molding1756.8 kWh·d−1
Power Consumption—Baking Bricks2320 kWh·d−1
Limestone Consumption—Waste Gas Treatment119.53 kg·d−1
Caustic Soda Consumption—Waste Gas Treatment24.15 kg·d−1
CompostingPower Consumption—Compost112.8 kWh·tDS−1
Transport Distance50 km
Table 4. Emission factors of chemical fertilizers.
Emission Factor
Synthetic Nitrogen Fertilizer4.42 kg CO2·kg N−1 [44]
Phosphorus Fertilizer0.636 kg CO2·kg P2O5−1 [45]
Potassium Fertilizer0.180 kg CO2·kg K2O−1 [45]
Table 5. Sludge characteristics.
Organic
Matter
Moisture Total Organic CarbonTotal NitrogenTotal PhosphorusTotal Potassium
Raw Sludge42.0%92.0%32.5%3.2%1.9%0.5%
Digested Sludge30.6%67.1%29.8%3.4%2.8%0.5%
Composted Sludge38.3%45.6%22.2%2.1%2.1%0.06%
Table 6. Comparison of GI and sludge usage.
GISludge Usage (Dry Basis)
200 kg N ha−1 Input
Sludge Usage (80% Moisture Content)
200 kg N ha−1 Input
Digested Sludge42~53%5.88 t·ha−129.40 t·ha−1
Composted Sludge81~92%9.52 t·ha−147.60 t·ha−1
Disclaimer/Publisher’s Note: The statements, opinions and data contained in all publications are solely those of the individual author(s) and contributor(s) and not of MDPI and/or the editor(s). MDPI and/or the editor(s) disclaim responsibility for any injury to people or property resulting from any ideas, methods, instructions or products referred to in the content.