
Sustainable Napier Grass (Pennisetum purpureum) Biochar for the Sorptive Removal of Acid Orange 7 (AO7) from Water

 , ,
, ,
Abstract

1. Introduction
2. Materials and Methods
2.1. Reagents and Apparatus
2.2. Development of NGBC700
2.3. Characterization of NGBC700
2.4. Batch Sorption Studies
2.5. NGBC700 Regeneration
2.6. Column Study
2.6.1. Thomas Model
2.6.2. Yoon–Nelson Model
2.7. NGBC700 Preparation Cost
2.8. NGBC700 Application in Actual Dye Wastewater Treatment
3. Results and Discussion
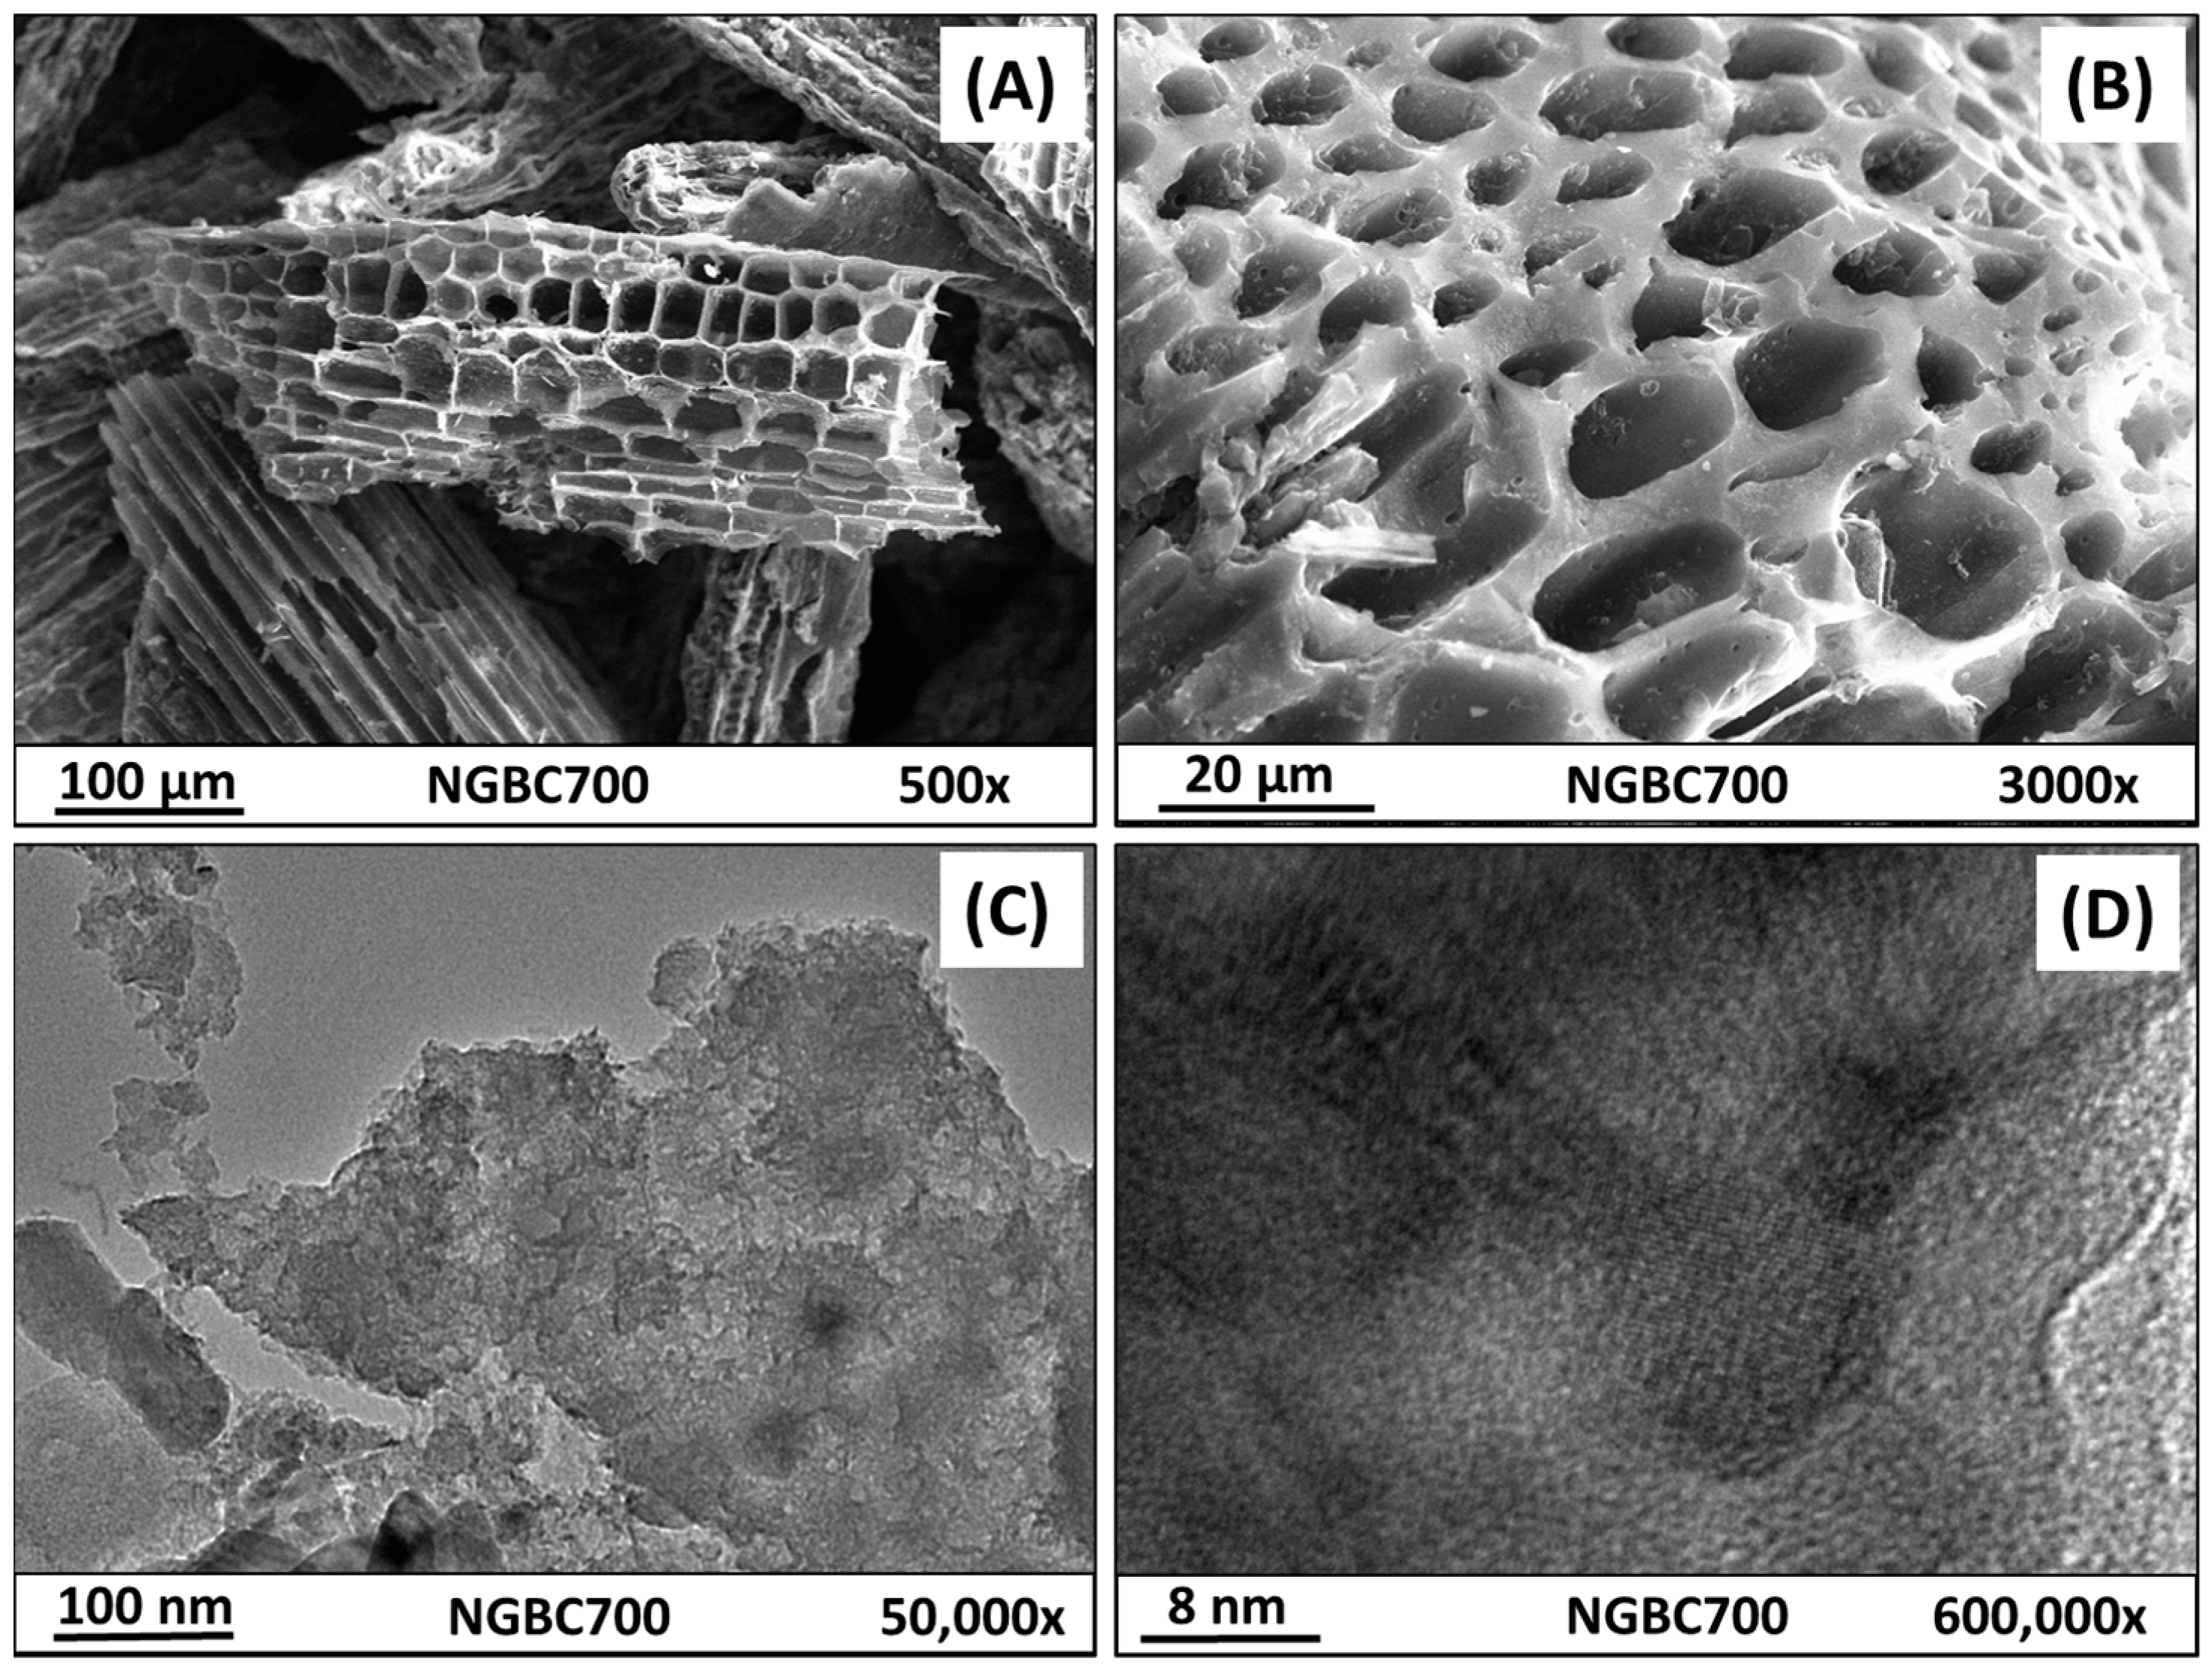
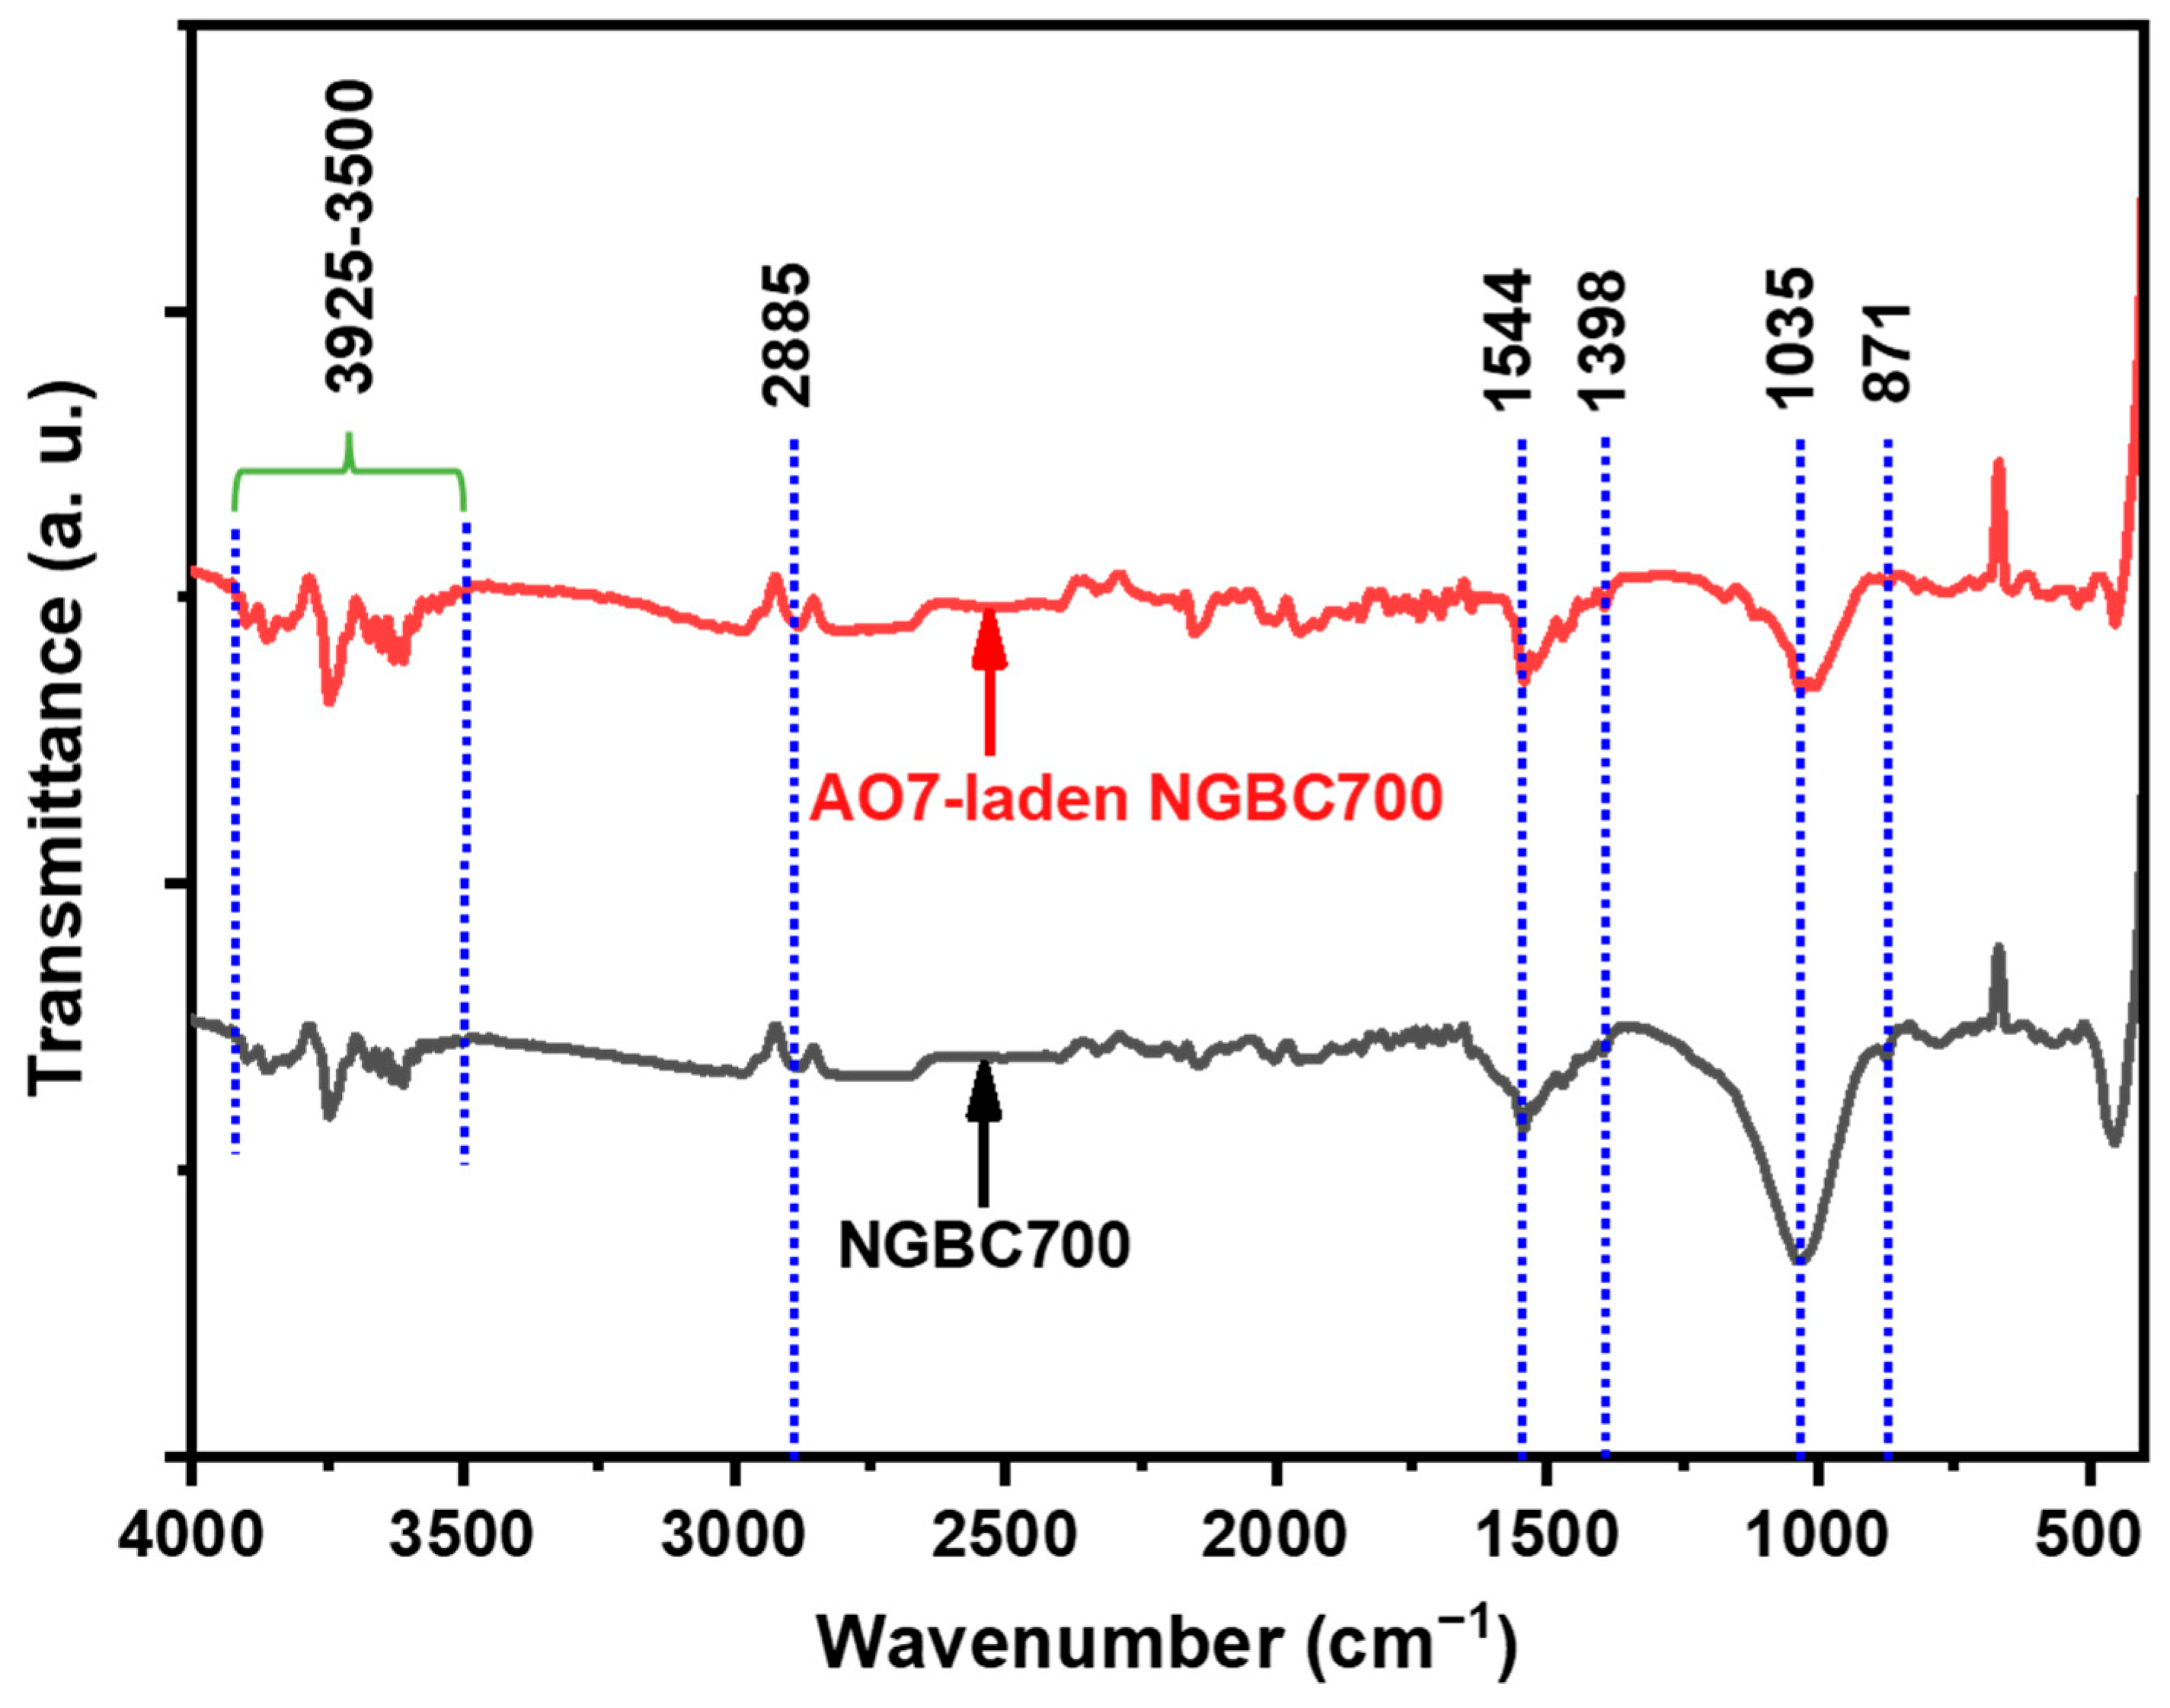
3.1. NGBC700 Characterization
3.2. Batch Study
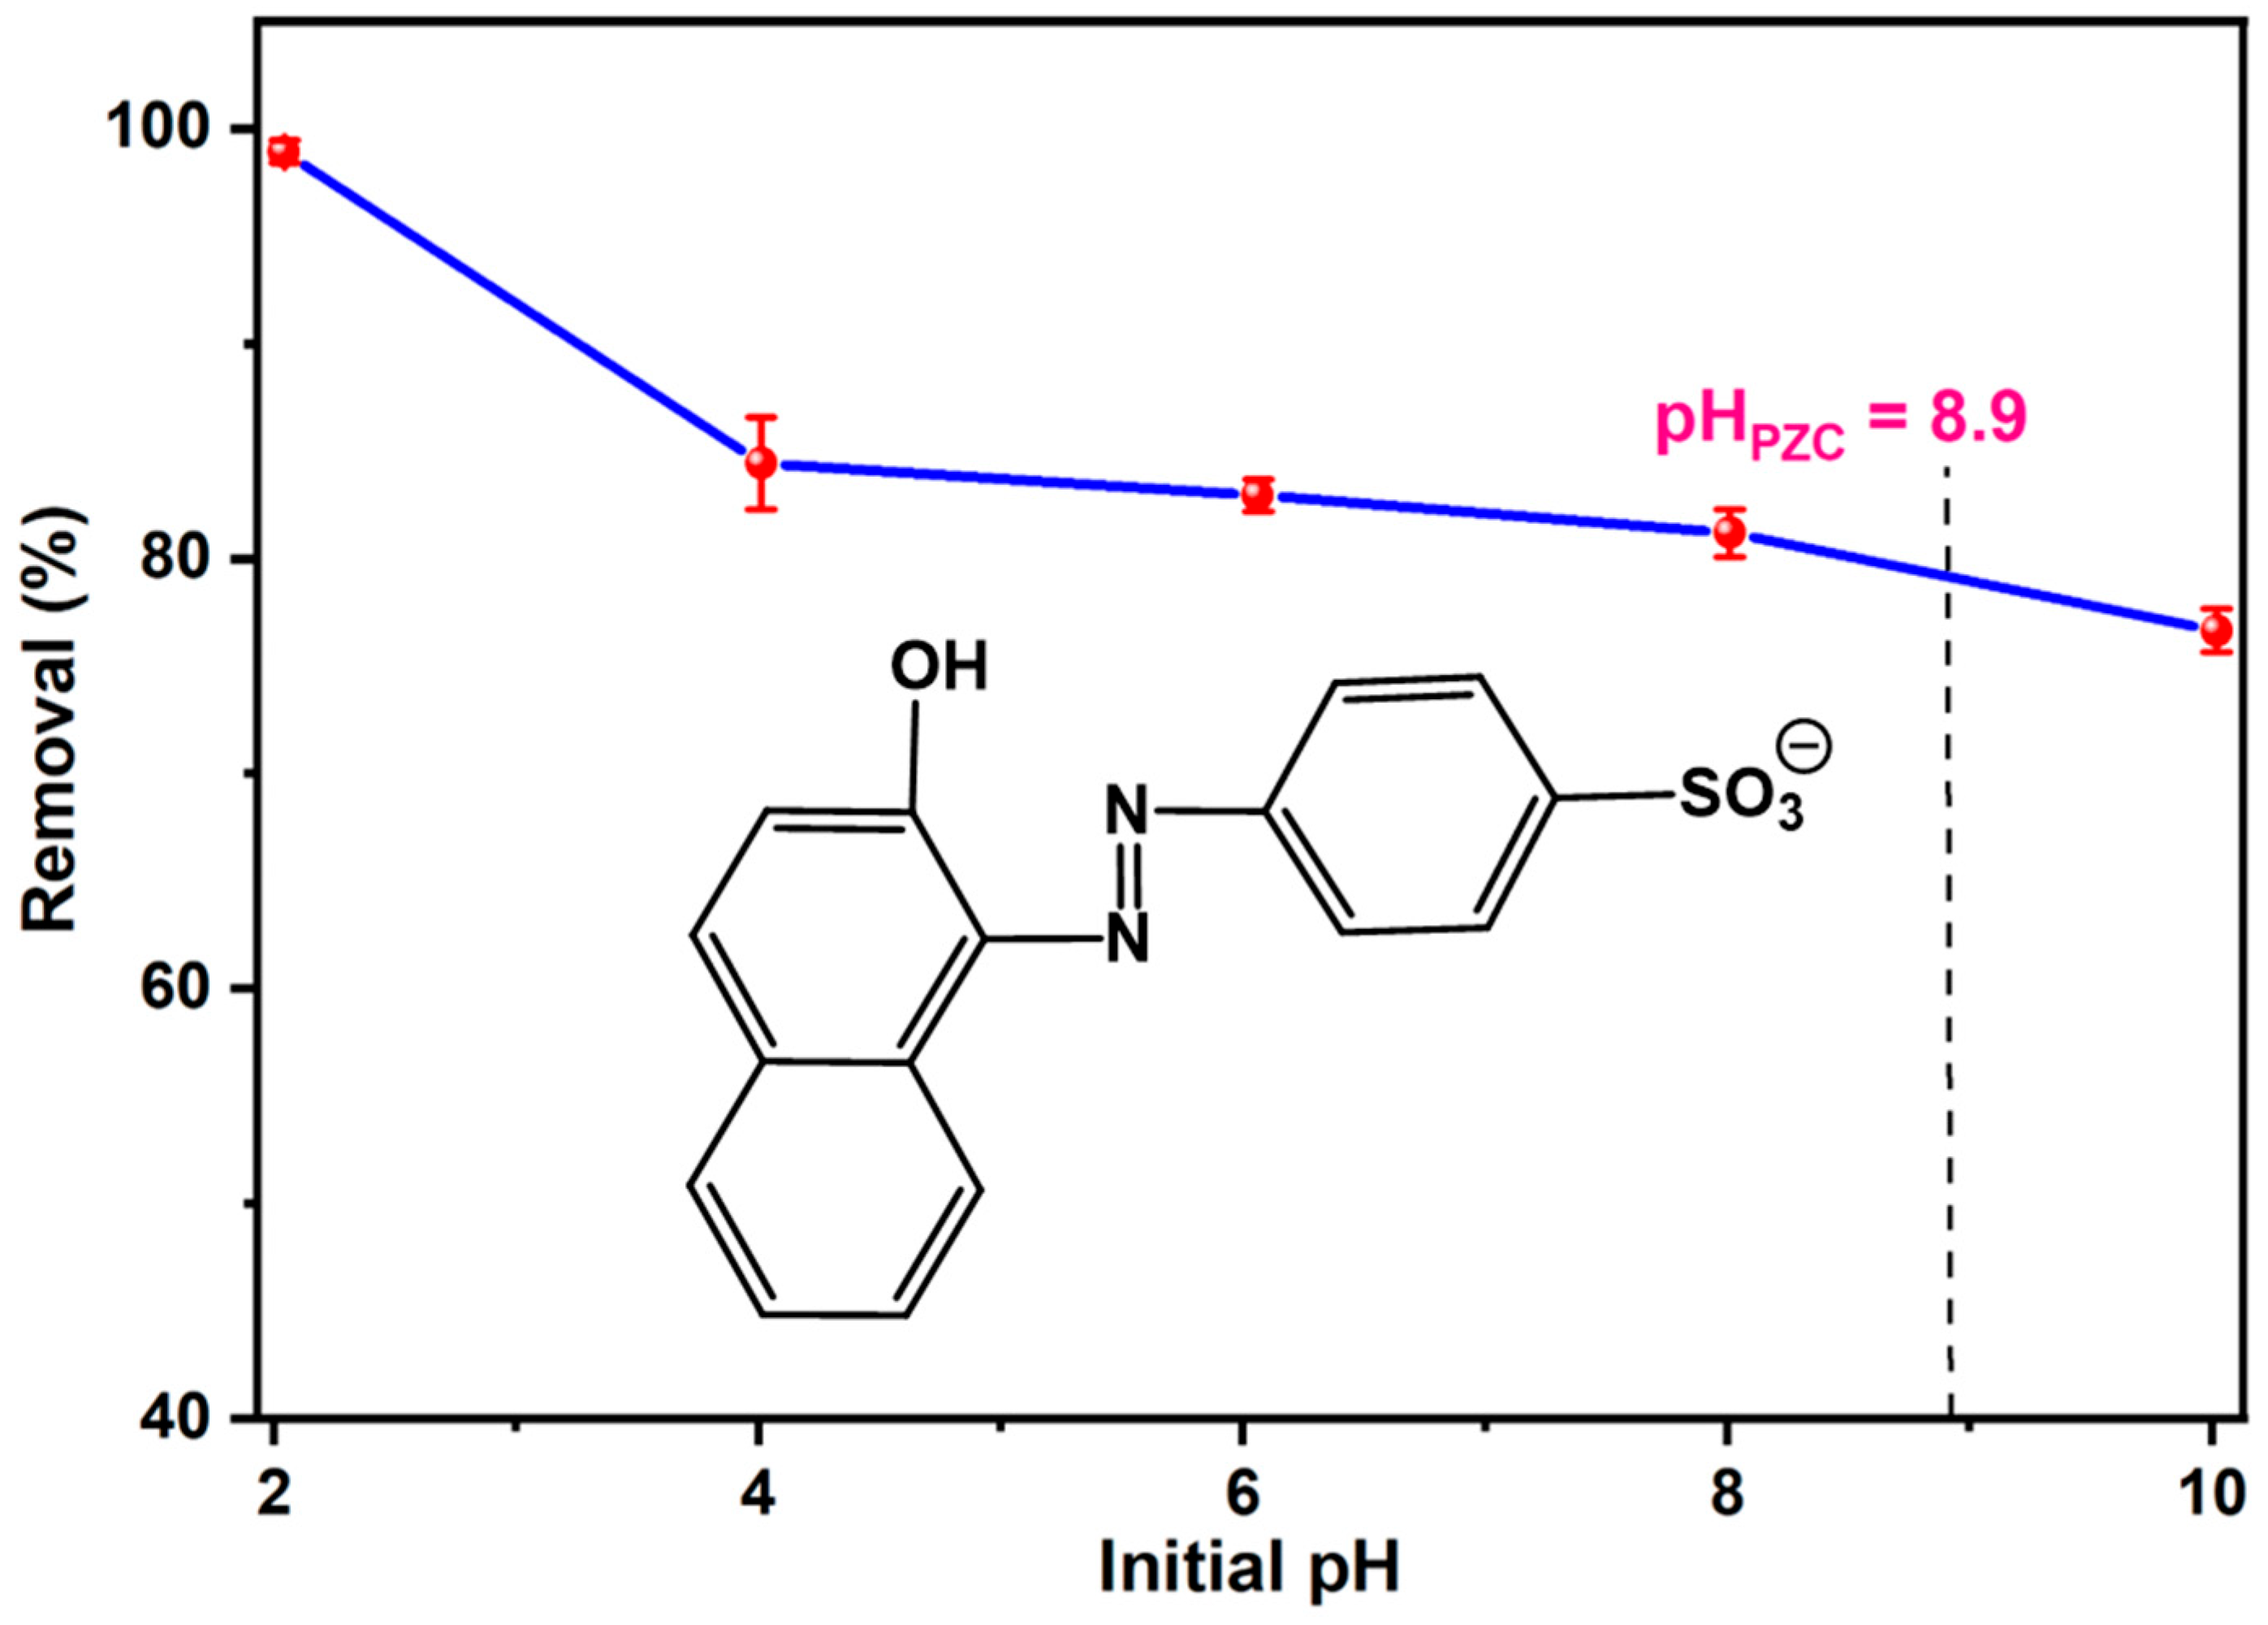
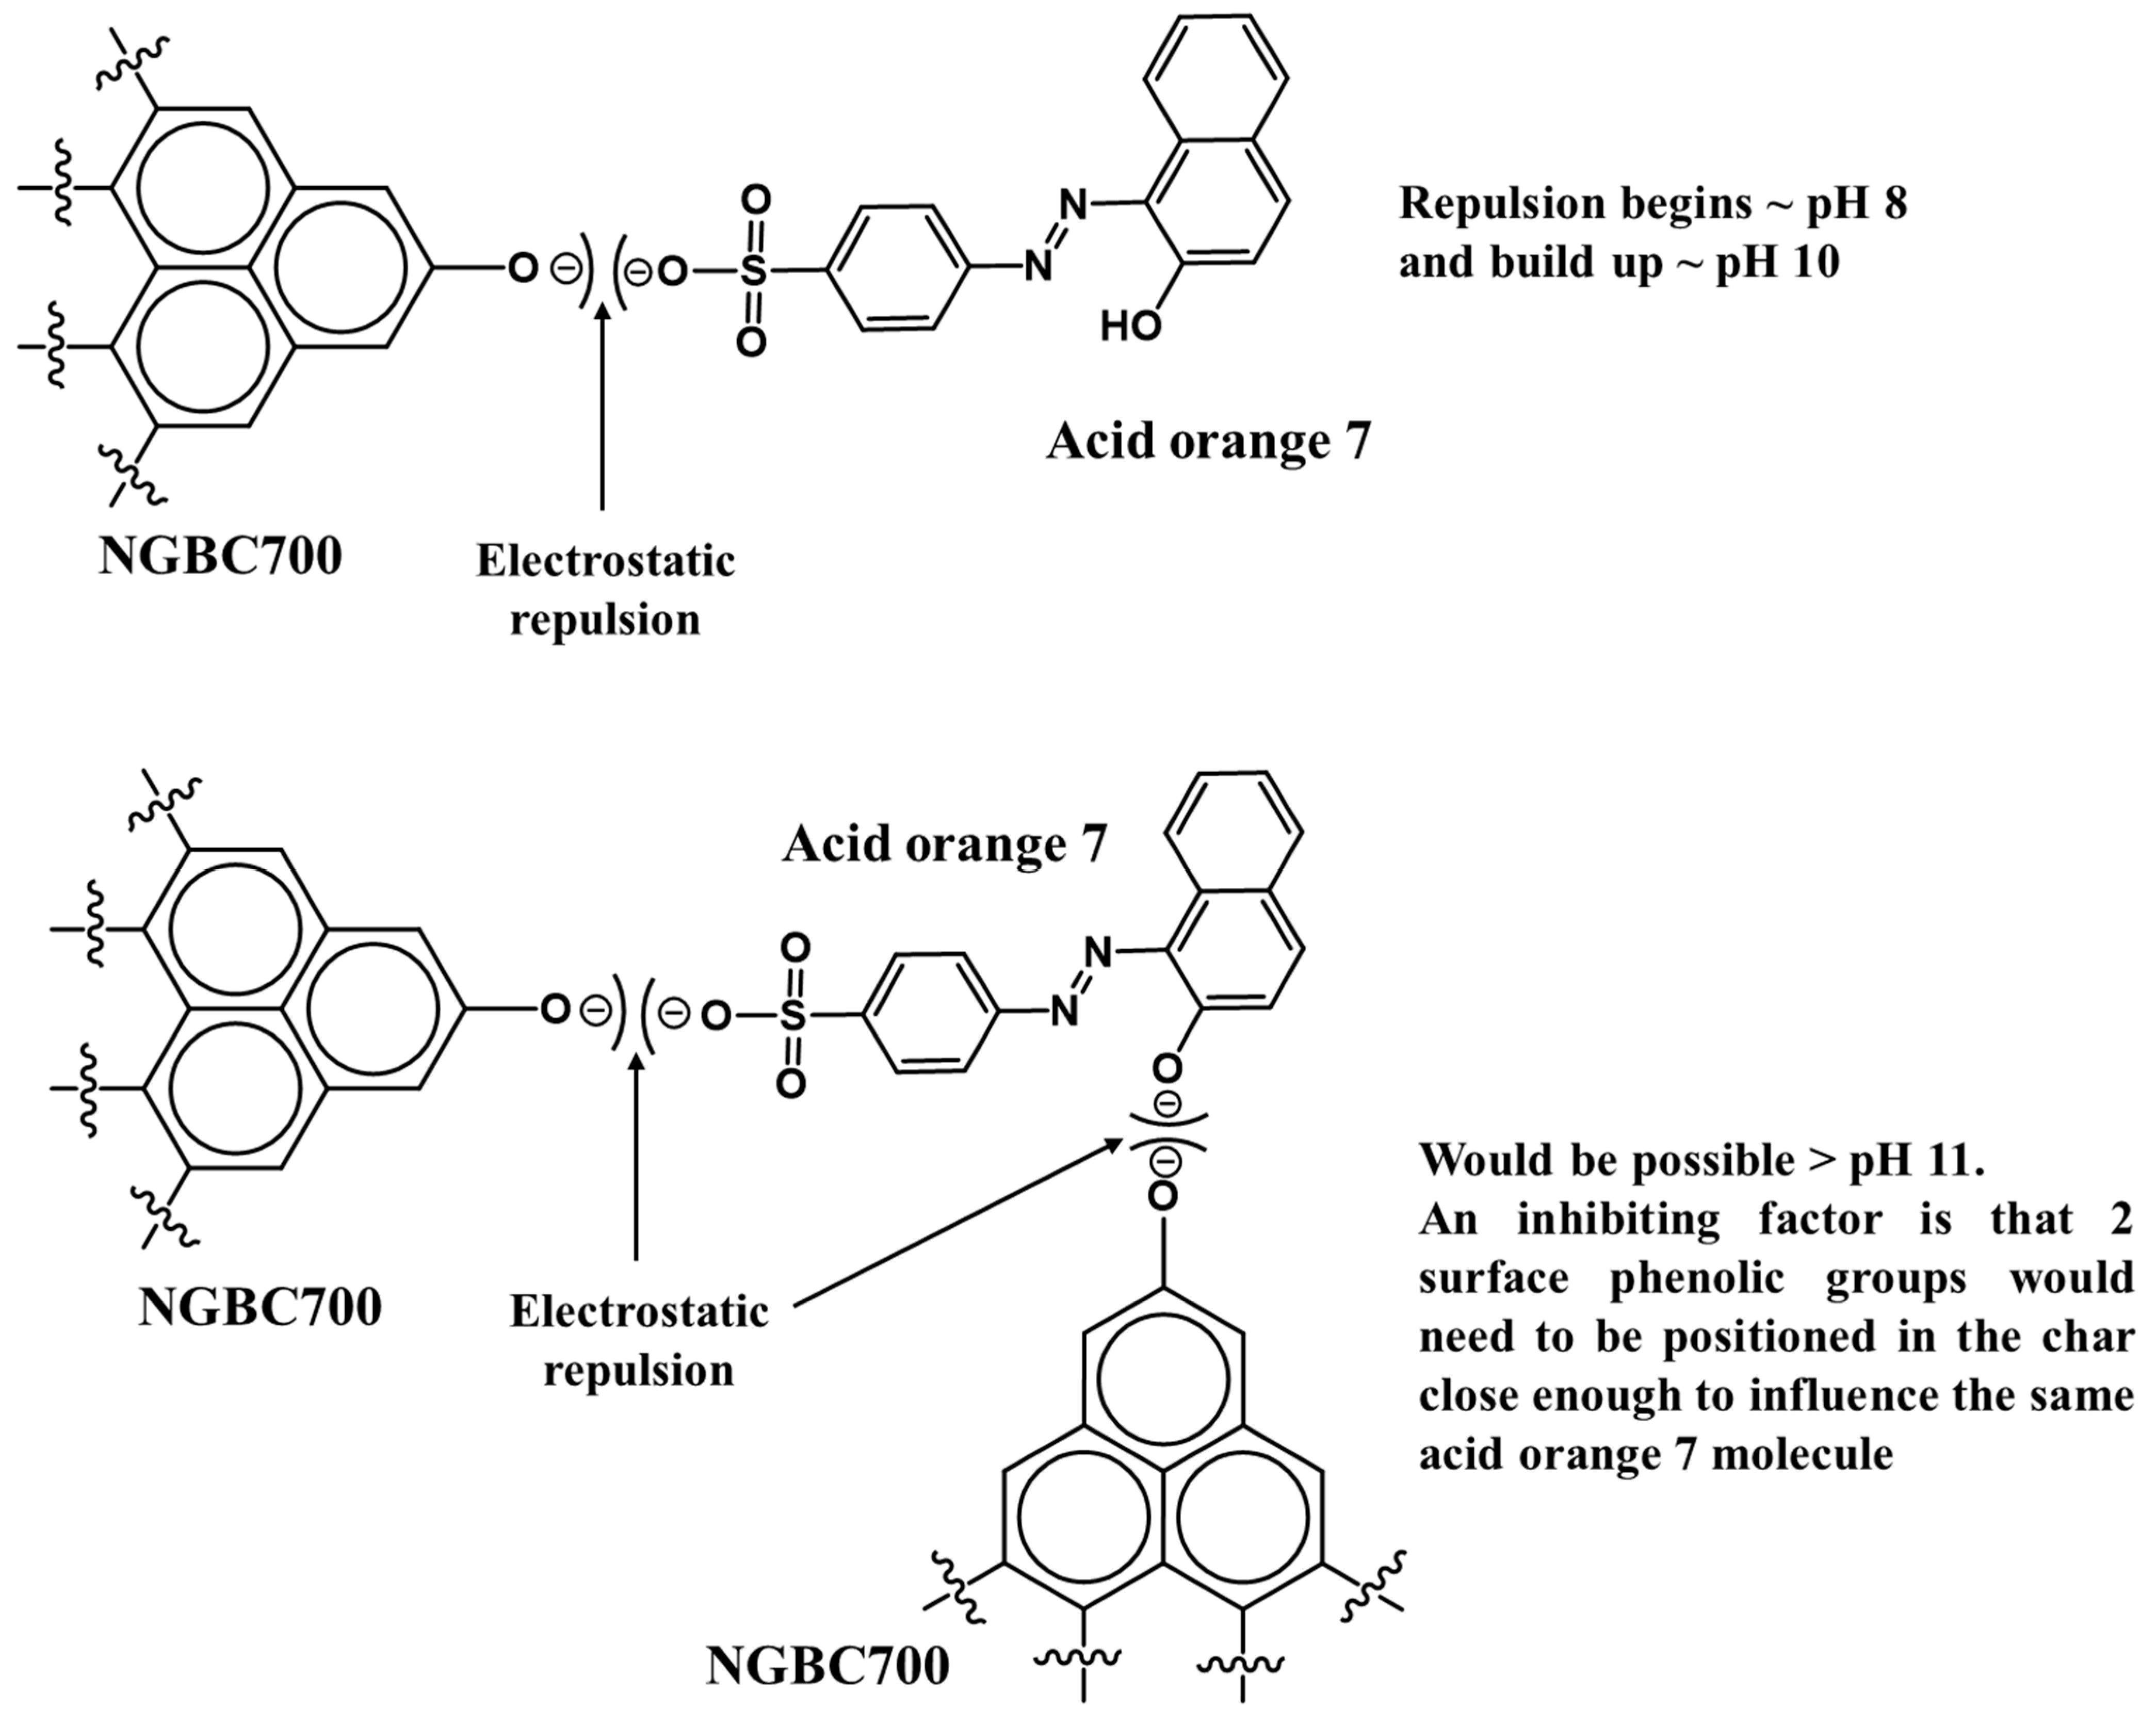
3.2.1. Effect of Solution pH
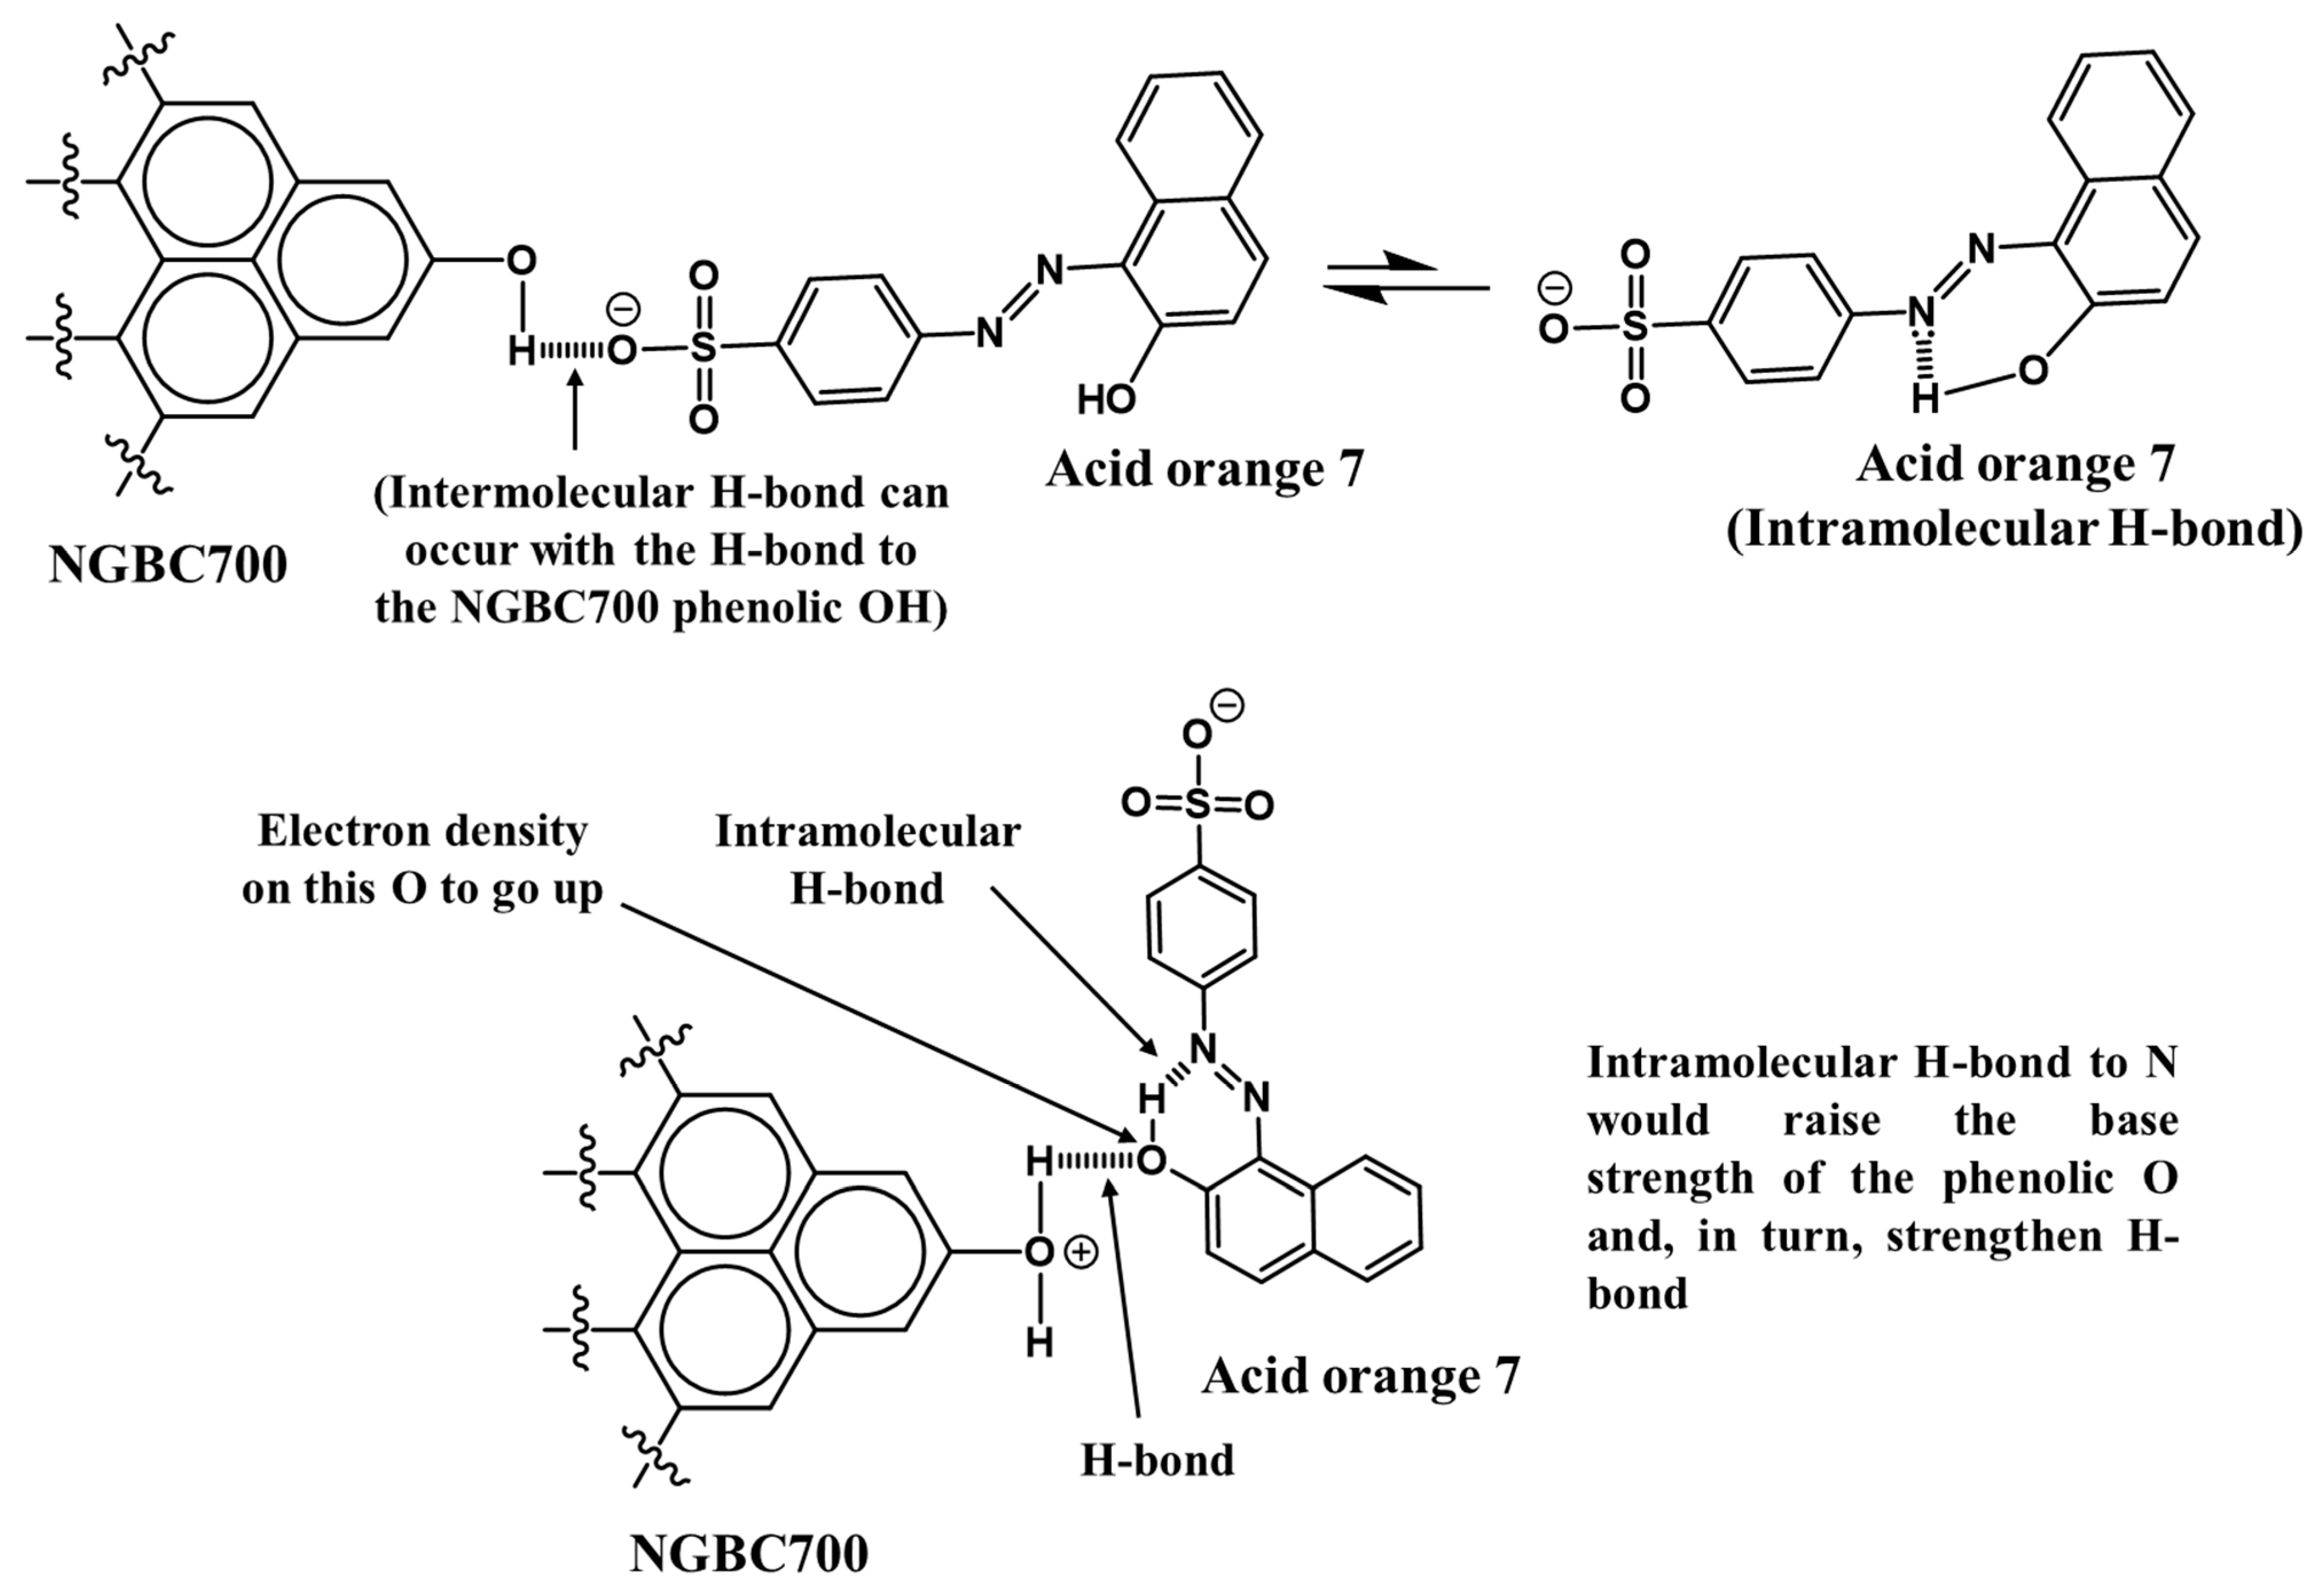
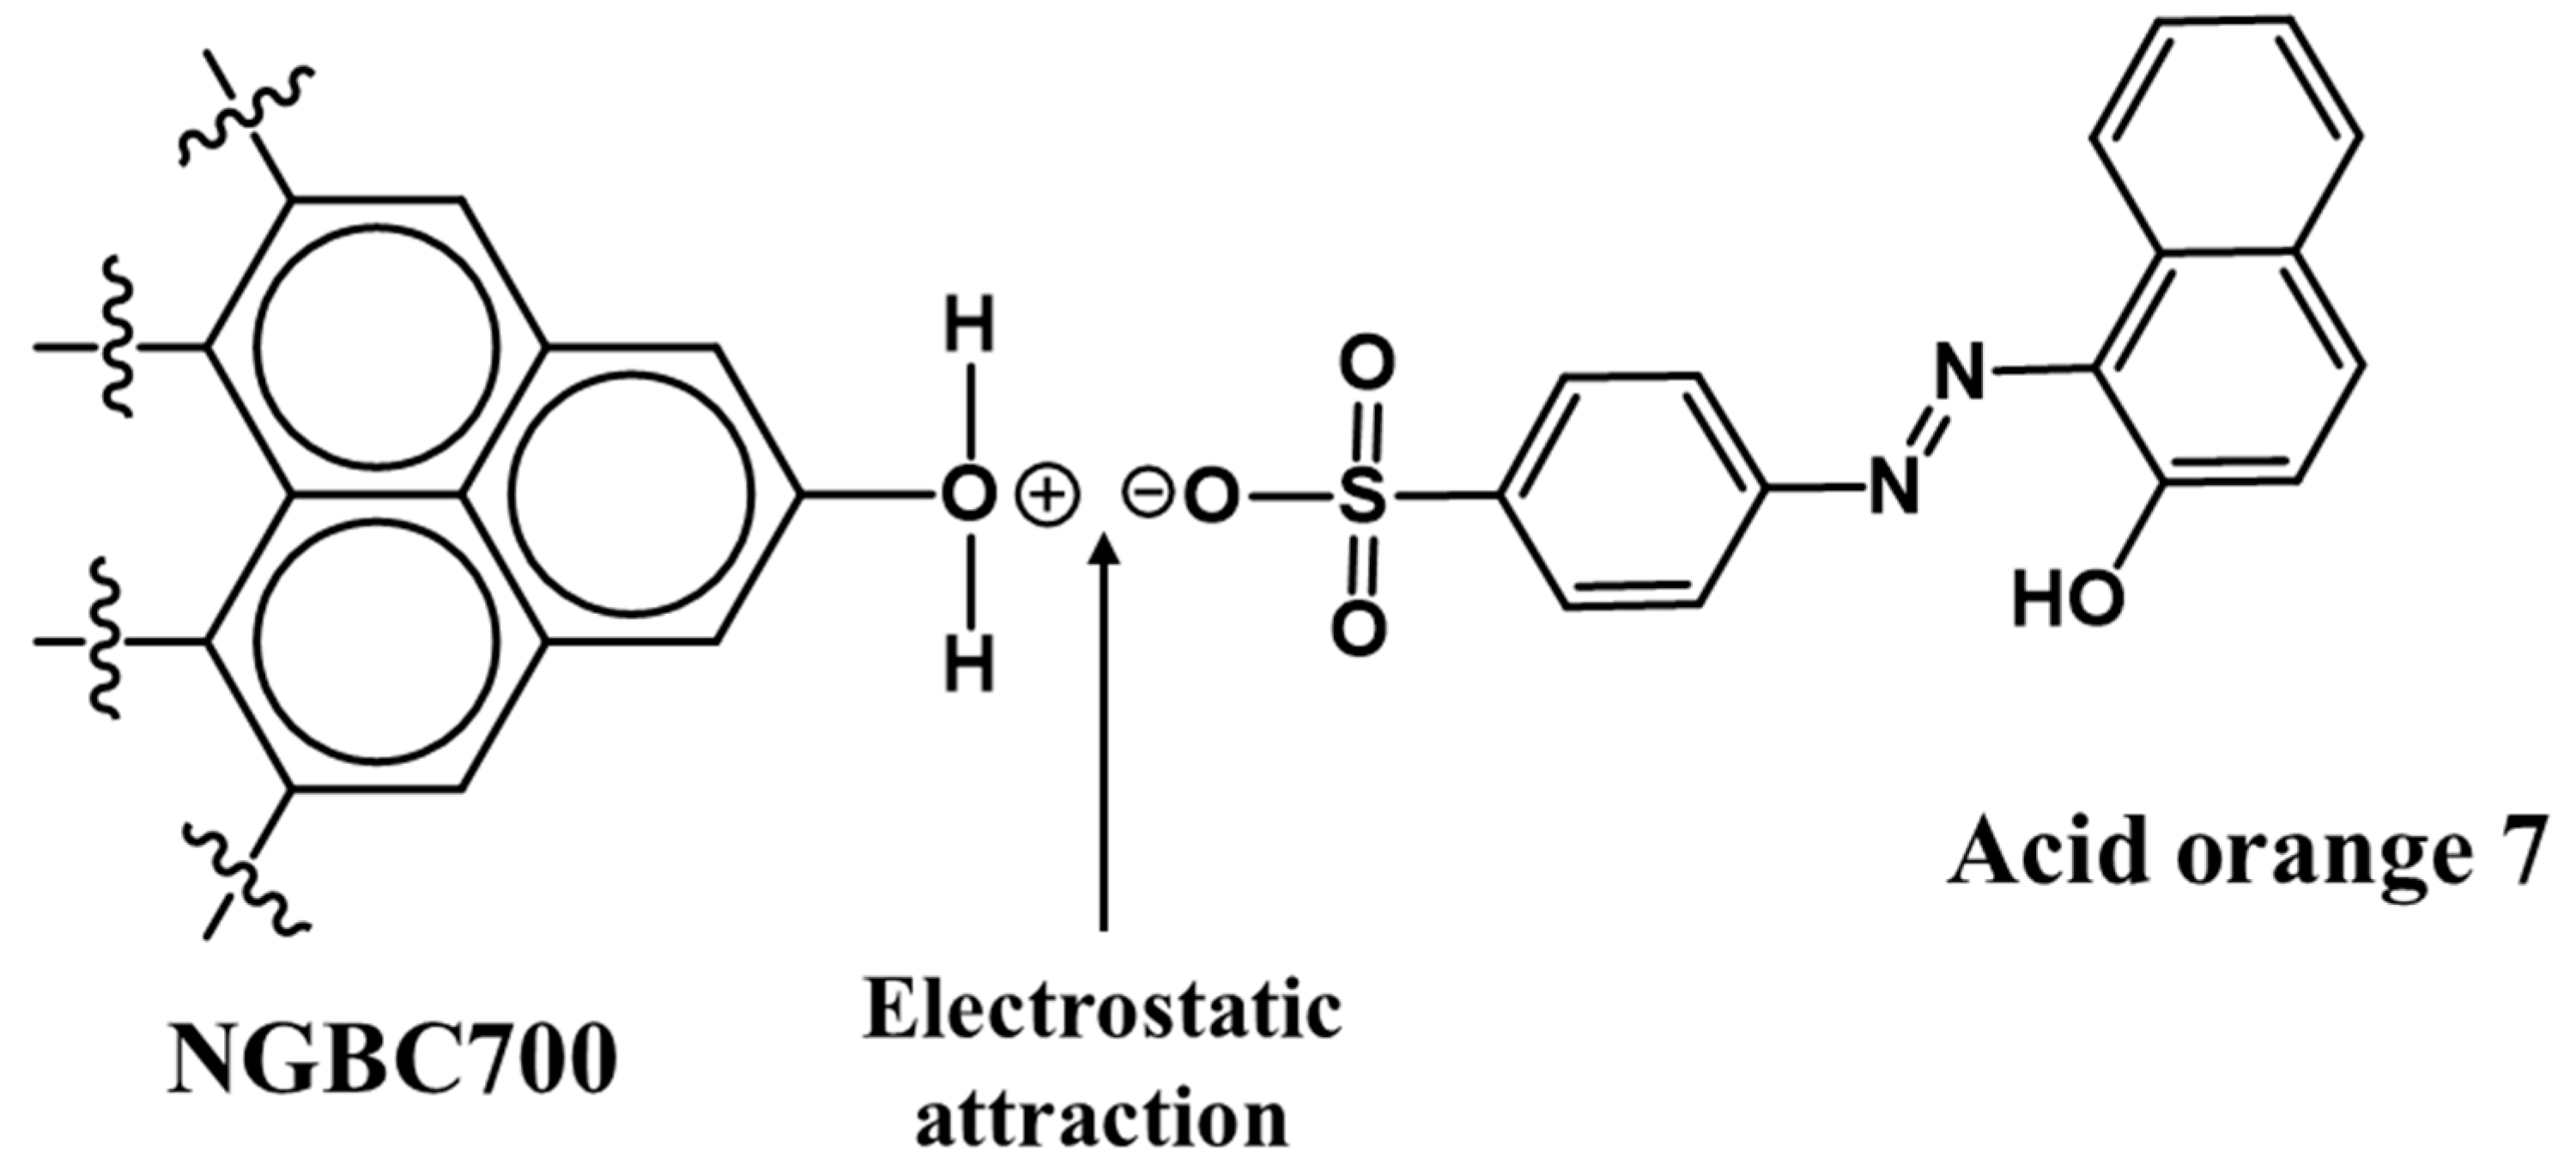
3.2.2. AO7 Sorption Interactions
 salts
can form and be part of what is adsorbed. CaSO4 and MgSO4
are soluble, but when a larger organic group is present, it lowers the
solubility of these salts. Such salts can form on the surfaces of the CaCO3
and MgO in the NGBC700. This is true over most of the pH range, but as the pH increases,
the following reaction may take place.
salts
can form and be part of what is adsorbed. CaSO4 and MgSO4
are soluble, but when a larger organic group is present, it lowers the
solubility of these salts. Such salts can form on the surfaces of the CaCO3
and MgO in the NGBC700. This is true over most of the pH range, but as the pH increases,
the following reaction may take place.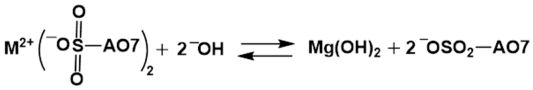


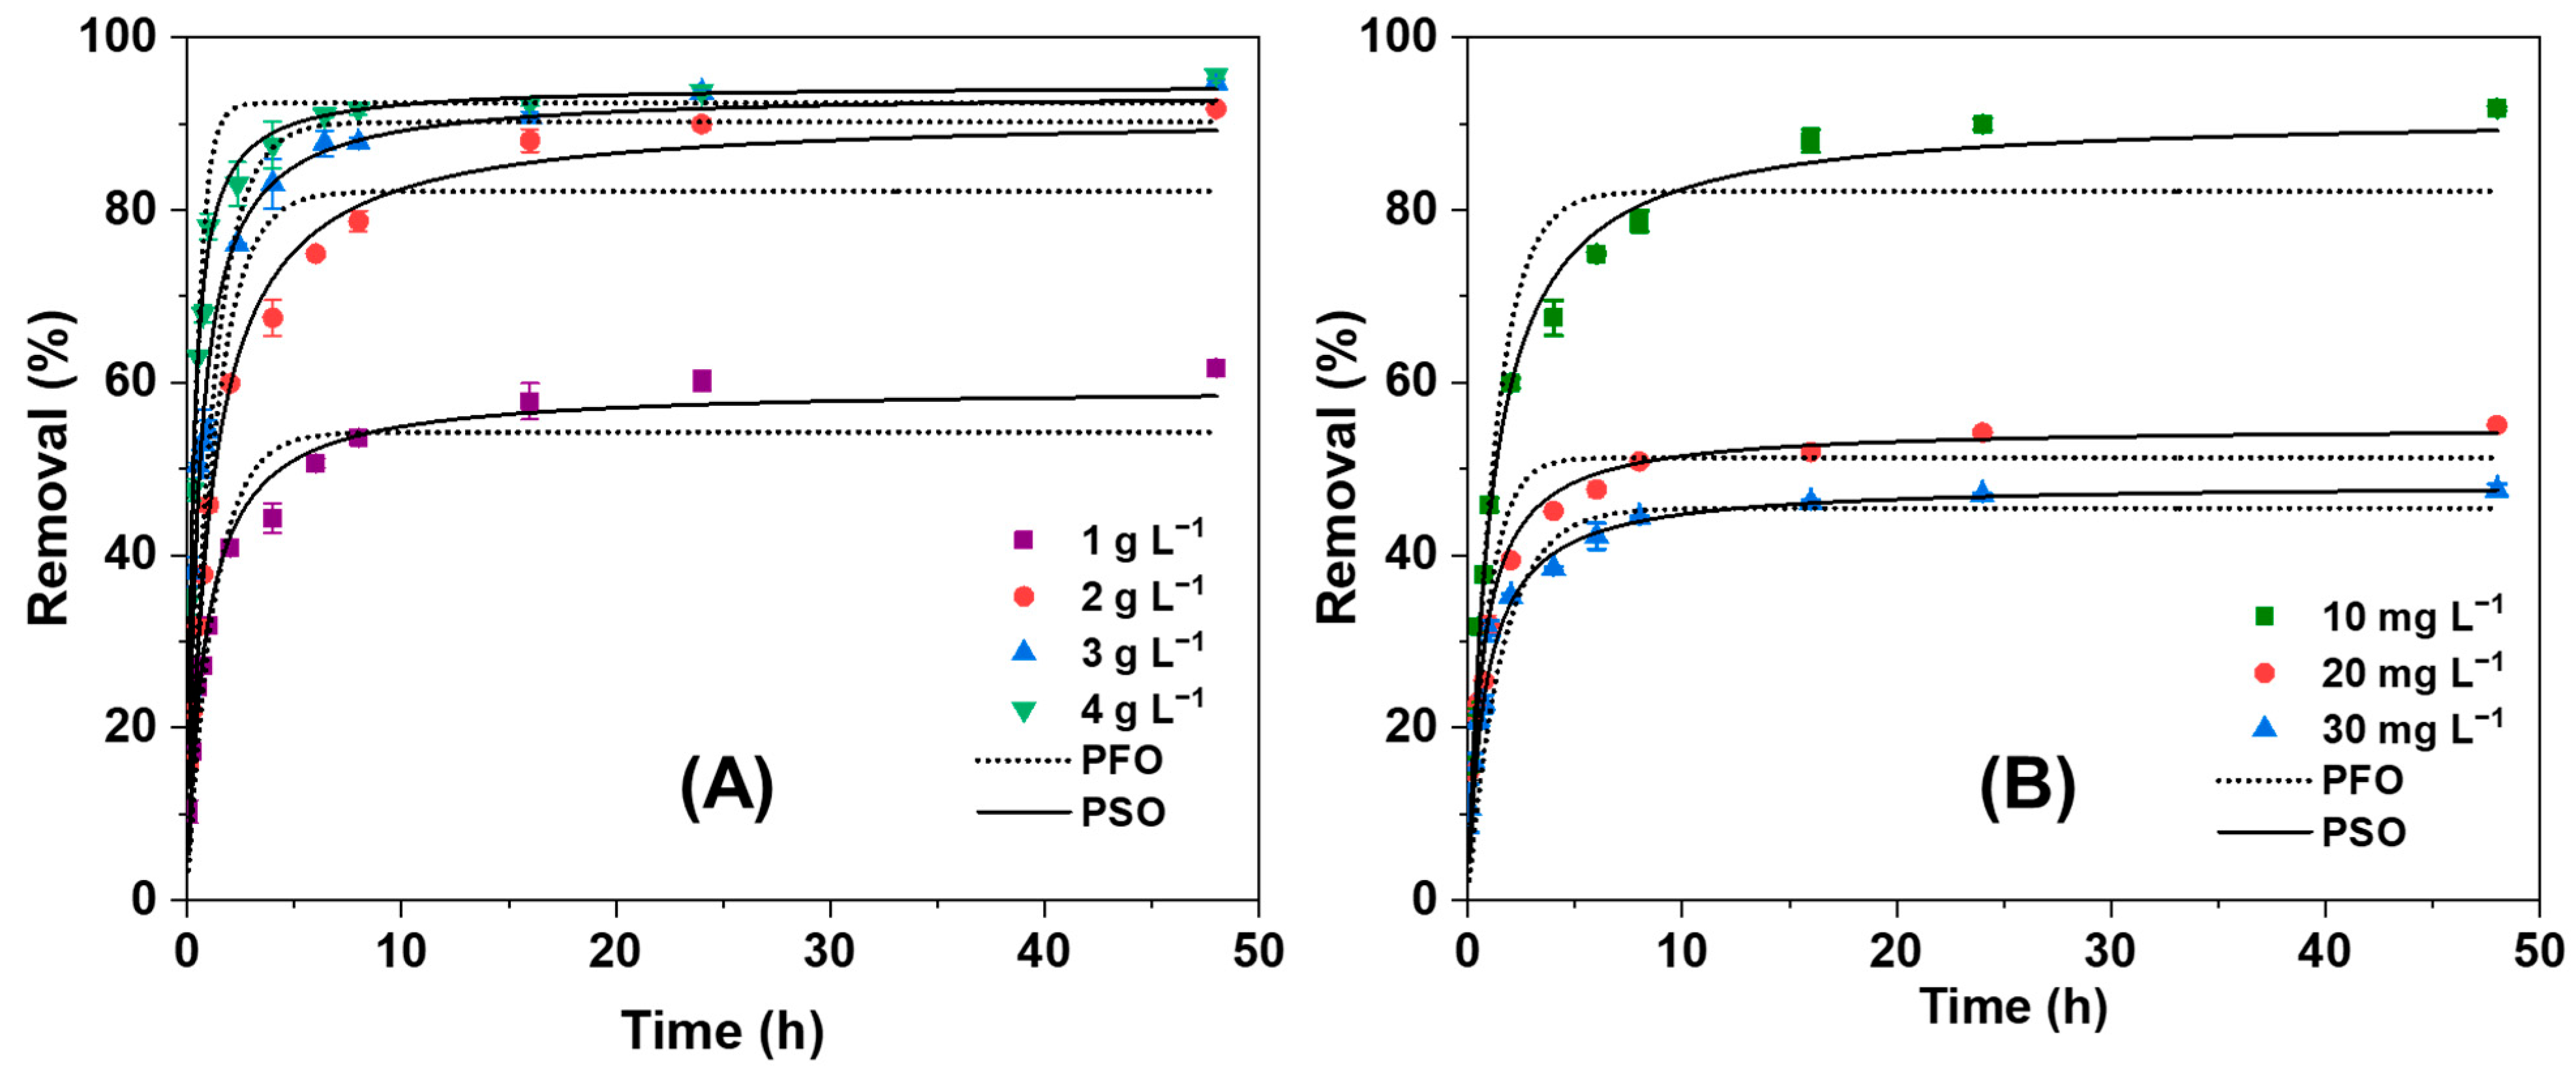
3.2.3. Effect of NGBC700 Doses on AO7 Sorption Kinetics
3.2.4. Effect of Initial Dye Concentration on Sorption Kinetics
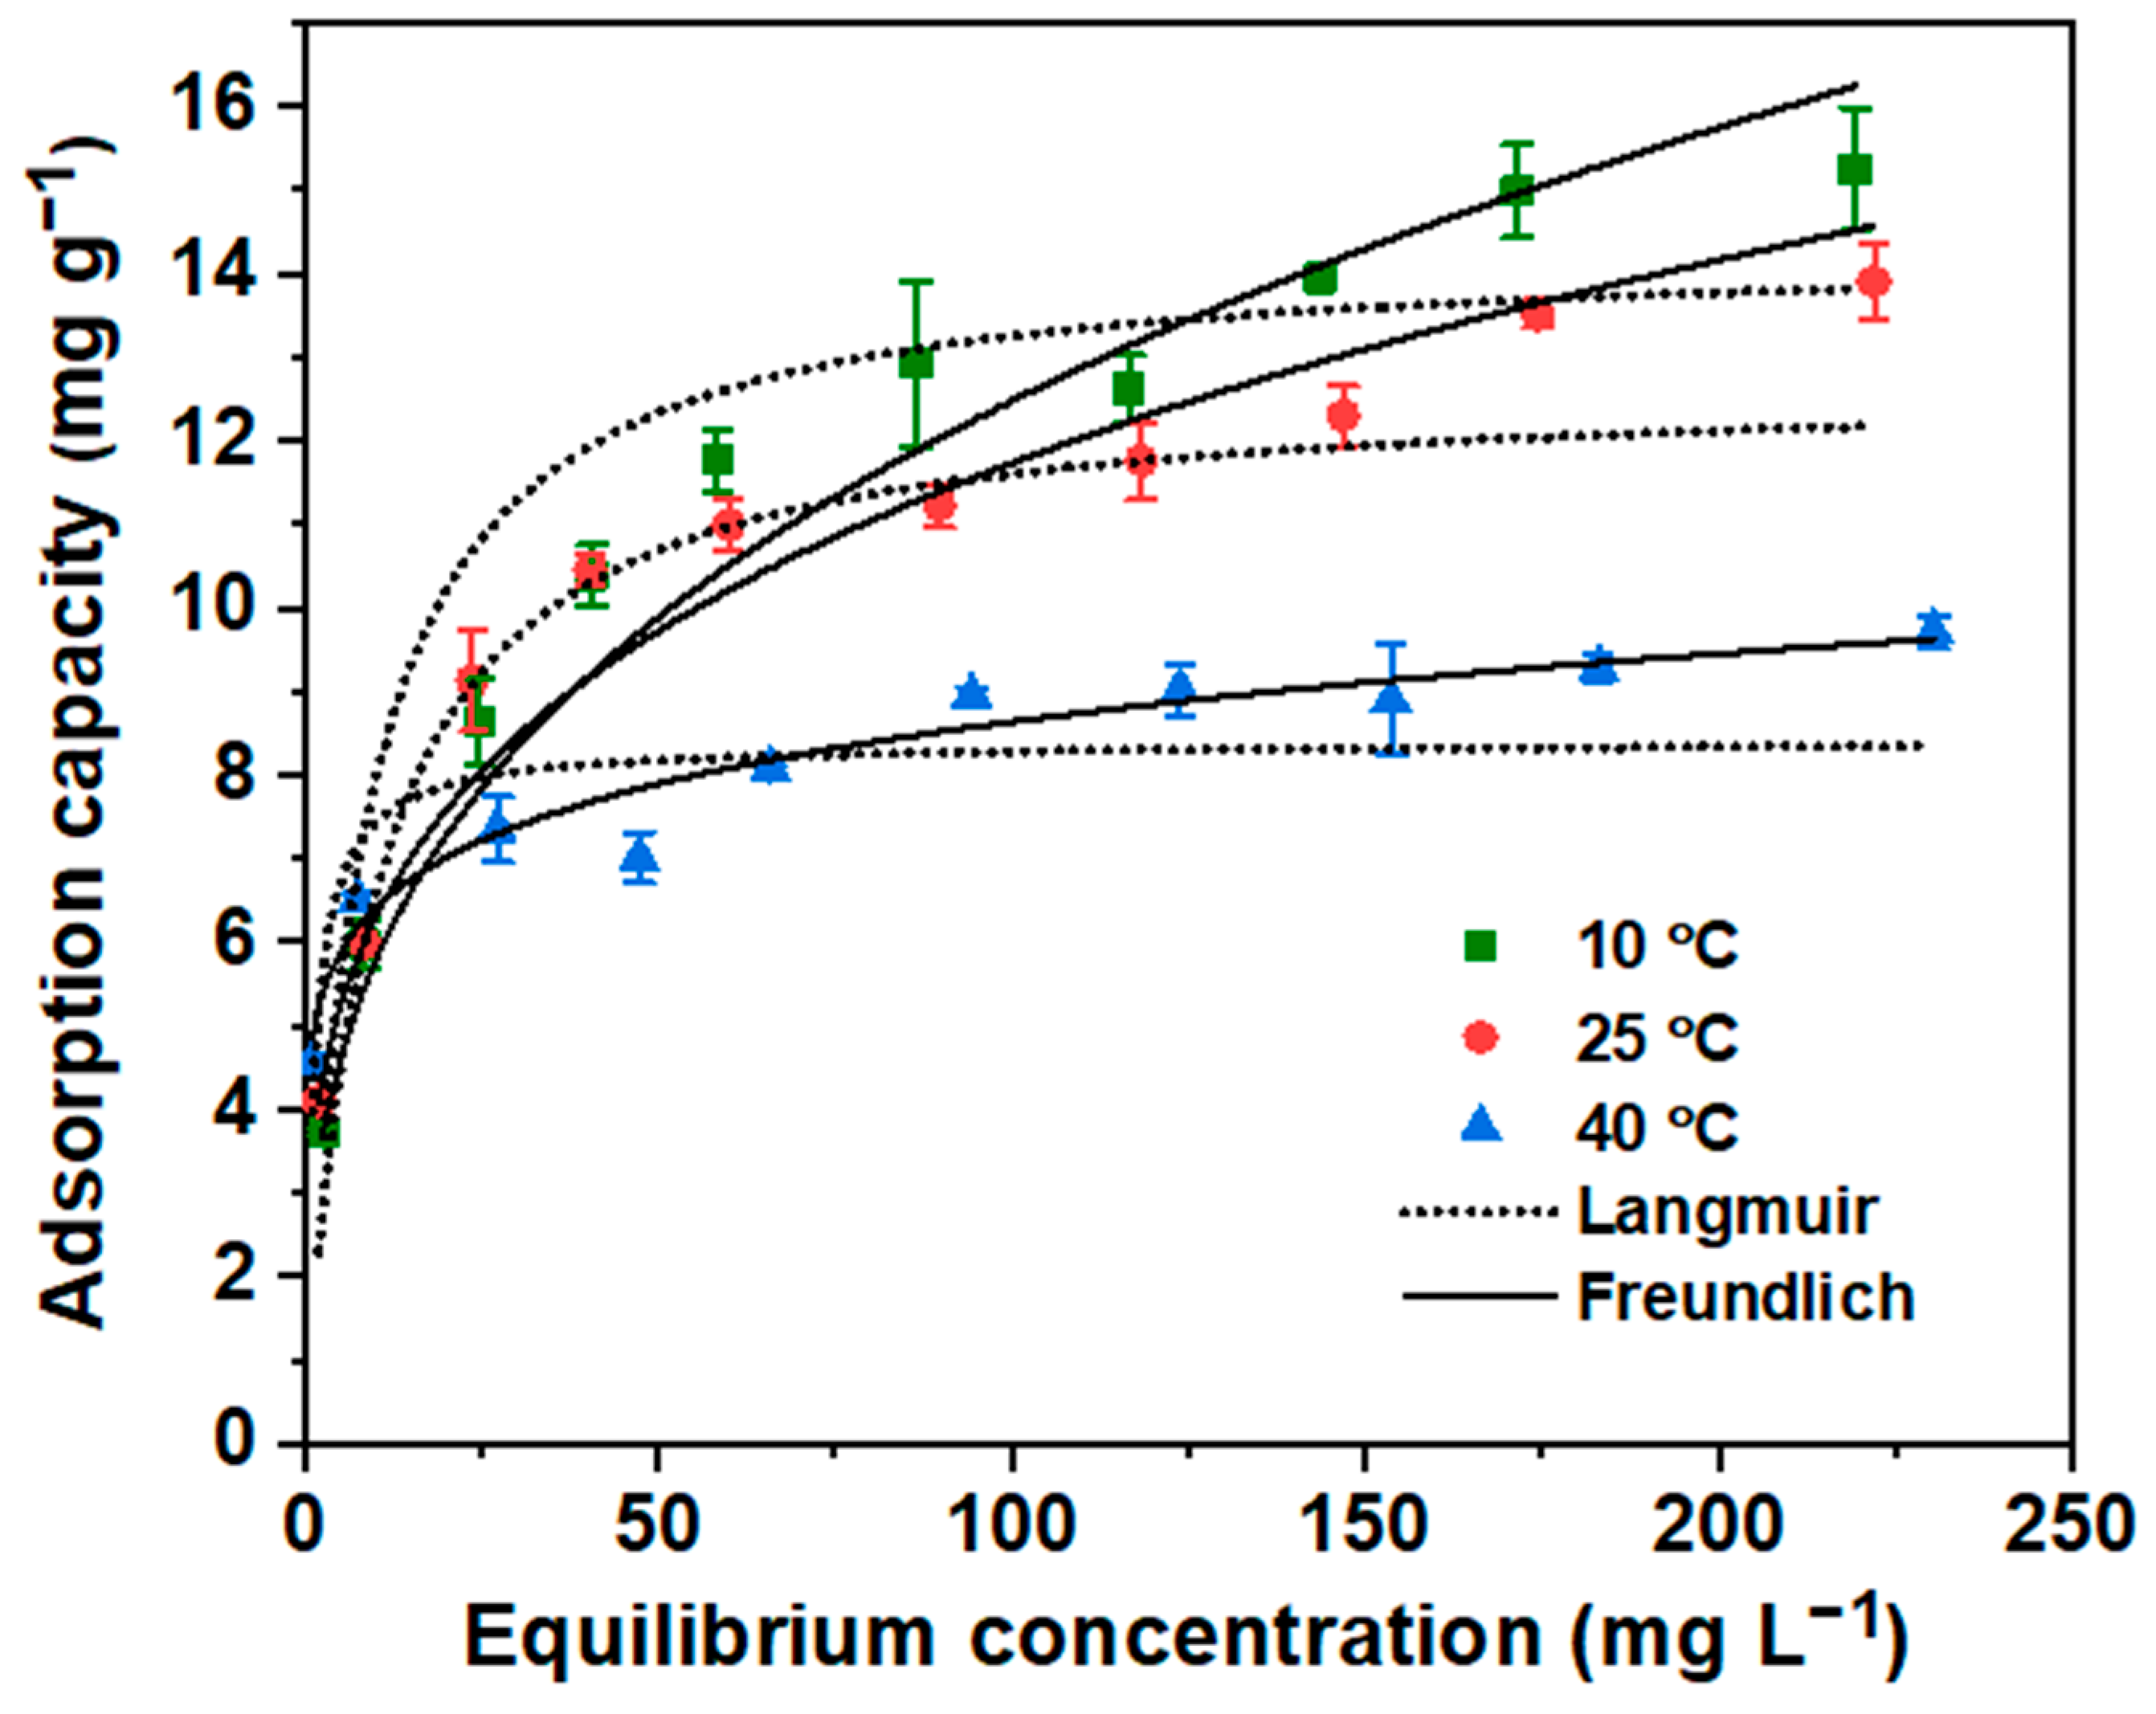
3.2.5. Sorption Isotherm Study
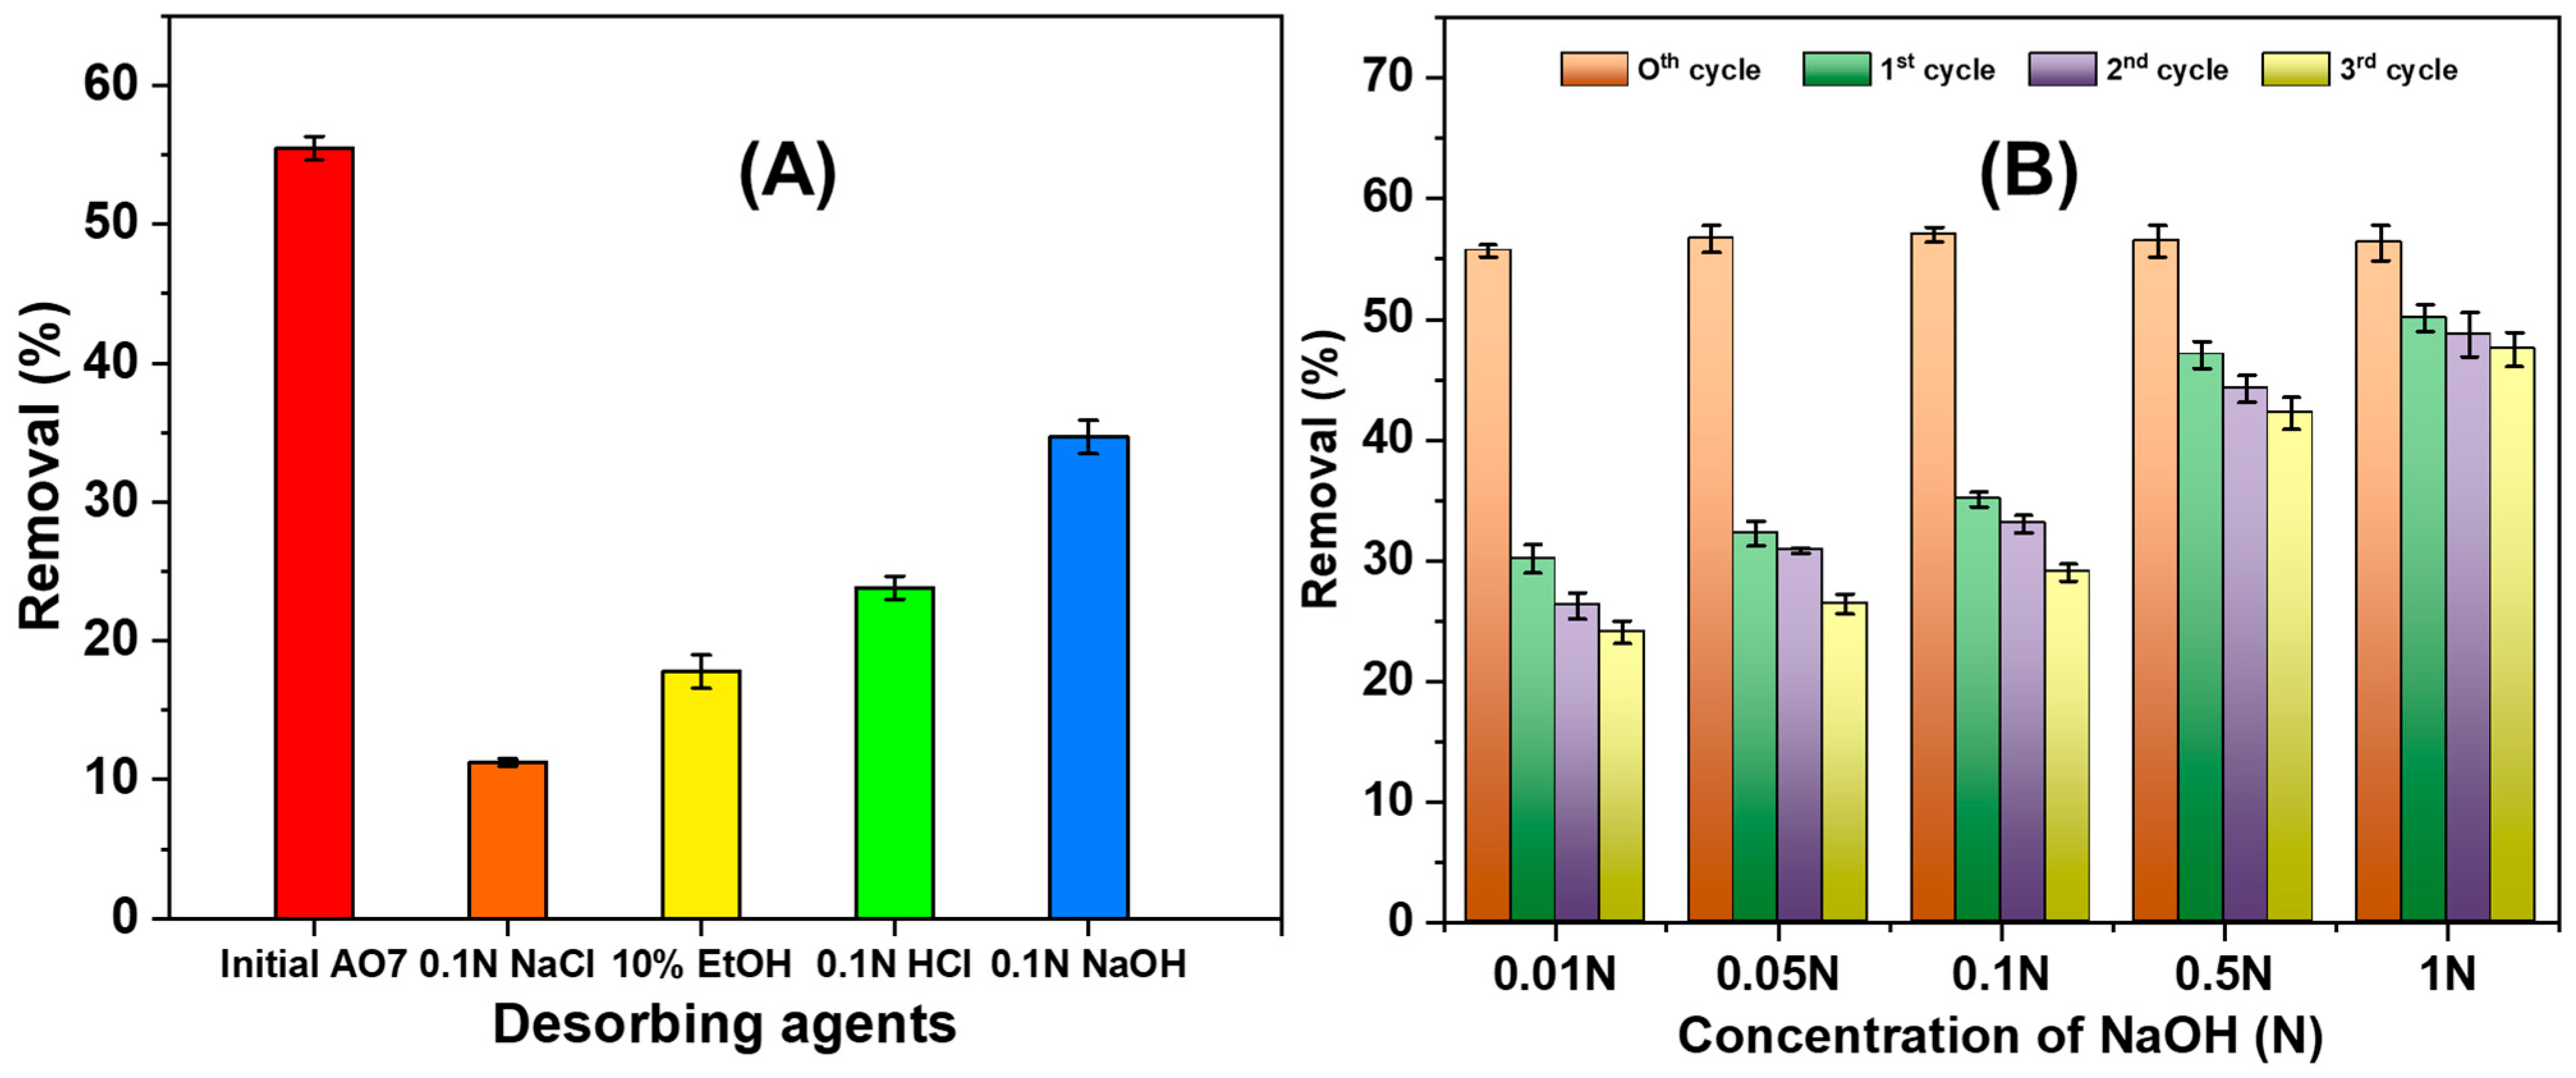
3.2.6. NGBC700 Regeneration/AO7 Desorption
3.2.7. Acid Orange 7 Sorption Capacities on NGBC700 vis-à-vis Other Adsorbents
3.3. Column Study
3.4. Actual Dye Wastewater Treatment
4. NGBC700 Preparation Cost
- COSTP = Biomass collection cost (US$ 0.9; the biochar collection cost was calculated based on an unskilled labor cost of ~600 IN₹ or US$ 7.21 for 8 h) + transportation cost (US$ 0.72) = US$ 1.62 kg−1
- COSTPro = Precursor size reduction cost (US$ 0.9, calculated based on an unskilled labor charge of ~600 IN₹ or US$ 7.21 for 8 h) + drying cost (US$ 0 as it was sun-dried) = US$ 0.9 kg−1
- COSTA/M = US$ 0 kg−1 (as there was no activation/modification step)
- COSTPy = Pyrolysis cost (total furnace running time × power consumption per hour × tariff rate) (US$ 0.92) + biochar size reduction cost (based on an unskilled labor cost of ~600 IN₹ or US$ 7.21 for 8 h (US$ 0.9) + washing cost (US$ 0.36, based on the consumption of water and the electricity tariff) + drying cost (US$ 0.77, based on electricity consumption and the tariff) = US$ 2.95 kg−1
- COSTOTHER = 10% offset (including any mass lost during the entire process and waste disposal) = US$ 0.55 kg−1
5. Conclusions
Supplementary Materials
Author Contributions
Funding
Data Availability Statement
Acknowledgments
Conflicts of Interest
References
- Khan, W.U.; Ahmed, S.; Dhoble, Y.; Madhav, S. A critical review of hazardous waste generation from textile industries and associated ecological impacts. J. Indian Chem. Soc. 2023, 100, 100829. [Google Scholar] [CrossRef]
- Al-Tohamy, R.; Ali, S.S.; Li, F.; Okasha, K.M.; Mahmoud, Y.A.; Elsamahy, T.; Jiao, H.; Fu, Y.; Sun, J. A critical review on the treatment of dye-containing wastewater: Ecotoxicological and health concerns of textile dyes and possible remediation approaches for environmental safety. Ecotoxicol. Environ. Saf. 2022, 231, 113160. [Google Scholar] [CrossRef] [PubMed]
- Kaur, A.; Taylor, K.E.; Biswas, N. Soybean peroxidase-catalyzed degradation of a sulfonated dye and its azo-cleavage product. J. Chem. Technol. Biotechnol. 2021, 96, 423–430. [Google Scholar] [CrossRef]
- Lellis, B.; Fávaro-Polonio, C.Z.; Pamphile, J.A.; Polonio, J.C. Effects of textile dyes on health and the environment and bioremediation potential of living organisms. Biotechnol. Res. Innov. 2019, 3, 275–290. [Google Scholar] [CrossRef]
- Alsukaibi, A.K.D. Various Approaches for the Detoxification of Toxic Dyes in Wastewater. Processes 2022, 10, 1968. [Google Scholar] [CrossRef]
- Adegoke, K.A.; Bello, O.S. Dye sequestration using agricultural wastes as adsorbents. Water Resour. Ind. 2015, 12, 8–24. [Google Scholar] [CrossRef]
- Esmaeili, S.; Ashrafi-Kooshk, M.R.; Khaledian, K.; Adibi, H.; Rouhani, S.; Khodarahmi, R. Degradation products of the artificial azo dye, Allura red, inhibit esterase activity of carbonic anhydrase II: A basic in vitro study on the food safety of the colorant in terms of enzyme inhibition. Food Chem. 2016, 213, 494–504. [Google Scholar] [CrossRef] [PubMed]
- Samsami, S.; Mohamadi, M.; Sarrafzadeh, M.H.; Rene, E.R.; Firoozbahr, M. Recent advances in the treatment of dye-containing wastewater from textile industries: Overview and perspectives. Process Saf. Environ. Prot. 2020, 143, 138–163. [Google Scholar] [CrossRef]
- Yaseen, D.A.; Scholz, M. Textile dye wastewater characteristics and constituents of synthetic effluents: A critical review. Int. J. Environ. Sci. Technol. 2018, 16, 1193–1226. [Google Scholar] [CrossRef]
- Jegatheesan, V.; Pramanik, B.K.; Chen, J.; Navaratna, D.; Chang, C.Y.; Shu, L. Treatment of textile wastewater with membrane bioreactor: A critical review. Bioresour. Technol. 2016, 204, 202–212. [Google Scholar] [CrossRef]
- Ahmadian, M.; Derakhshankhah, H.; Jaymand, M. Biosorptive removal of organic dyes using natural gums-based materials: A comprehensive review. J. Ind. Eng. Chem. 2023, 124, 102–131. [Google Scholar] [CrossRef]
- Srivastava, P.; Al-Obaidi, S.A.; Webster, G.; Weightman, A.J.; Sapsford, D.J. Towards passive bioremediation of dye-bearing effluents using hydrous ferric oxide wastes: Mechanisms, products and microbiology. J. Environ. Manag. 2022, 317, 115332. [Google Scholar] [CrossRef] [PubMed]
- Benkhaya, S.; Mrabet, S.; El Harfi, A. A review on classifications, recent synthesis and applications of textile dyes. Inorg. Chem. Commun. 2020, 115, 107891. [Google Scholar] [CrossRef]
- Chequer, F.D.; De Oliveira, G.R.; Ferraz, E.A.; Cardoso, J.C.; Zanoni, M.B.; de Oliveira, D.P. Textile Dyes: Dyeing Process and Environmental Impact. In Eco-Friendly Textile Dyeing and Finishing; Günay, M., Ed.; IntechOpen: Rijeka, Croatia, 2013; pp. 151–176. [Google Scholar]
- Eleryan, A.; Hassaan, M.A.; Aigbe, U.O.; Ukhurebor, K.E.; Onyancha, R.B.; El-Nemr, M.A.; Ragab, S.; Hossain, I.; El Nemr, A. Kinetic and isotherm studies of Acid Orange 7 dye absorption using sulphonated mandarin biochar treated with TETA. Biomass Convers. Biorefinery 2023, 14, 10599–10610. [Google Scholar] [CrossRef]
- Sabnis, R.W. Handbook of Biological Dyes and Stains: Synthesis and Industrial Applications; John Wiley & Sons: Hoboken, NJ, USA, 2010; p. 521. [Google Scholar]
- Perera, H.J. Removal of Acid Orange 7 Dye from Wastewater: Review. Int. J. Waste Resour. 2019, 9, 1–4. [Google Scholar] [CrossRef]
- Gupta, V.K.; Mittal, A.; Gajbe, V.; Mittal, J. Removal and Recovery of the Hazardous Azo Dye Acid Orange 7 through Adsorption over Waste Materials: Bottom Ash and De-Oiled Soya. Ind. Eng. Chem. Res. 2006, 45, 1446–1453. [Google Scholar] [CrossRef]
- Nunes, M.J.; Lopes, A.; Pacheco, M.J.; Ciríaco, L. Visible-Light-Driven AO7 Photocatalytic Degradation and Toxicity Removal at Bi-Doped SrTiO(3). Materials 2022, 15, 2465. [Google Scholar] [CrossRef]
- Tong, W.S.; Oo, C.W.; Sudesh, K.; Ng, S.L. Decolorization of acid orange 7 in moving bed biofilm reactor packed with polyhydroxyalkanoate/activated carbon. J. Water Process Eng. 2024, 58, 104750. [Google Scholar] [CrossRef]
- Gasmi, I.; Kerboua, K.; Haddour, N.; Hamdaoui, O.; Alghyamah, A.; Buret, F. The Galvano-Fenton process: Experimental insights and numerical mechanistic investigation applied to the degradation of acid orange 7. Electrochim. Acta 2021, 373, 137897. [Google Scholar] [CrossRef]
- Mancuso, A.; Sacco, O.; Sannino, D.; Pragliola, S.; Vaiano, V. Enhanced visible-light-driven photodegradation of Acid Orange 7 azo dye in aqueous solution using Fe-N co-doped TiO2. Arab. J. Chem. 2020, 13, 8347–8360. [Google Scholar] [CrossRef]
- Han, F.; Kambala, V.S.R.; Dharmarajan, R.; Liu, Y.; Naidu, R. Photocatalytic degradation of azo dye acid orange 7 using different light sources over Fe3+-doped TiO2 nanocatalysts. Environ. Technol. Innov. 2018, 12, 27–42. [Google Scholar] [CrossRef]
- Xia, Y.; Wang, G.; Guo, L.; Dai, Q.; Ma, X. Electrochemical oxidation of Acid Orange 7 azo dye using a PbO2 electrode: Parameter optimization, reaction mechanism and toxicity evaluation. Chemosphere 2020, 241, 125010. [Google Scholar] [CrossRef] [PubMed]
- Qiao, Q.; Singh, S.; Lo, S.-L.; Li, Y.; Jin, J.; Wang, L. Electrochemical oxidation of acid orange 7 dye with Ce, Nd, and Co-modified PbO2 electrodes: Preparation, characterization, optimization, and mineralization. J. Taiwan Inst. Chem. Eng. 2018, 84, 110–122. [Google Scholar] [CrossRef]
- Cojocaru, C.; Clima, L. Polymer assisted ultrafiltration of AO7 anionic dye from aqueous solutions: Experimental design, multivariate optimization, and molecular docking insights. J. Membr. Sci. 2020, 604, 118054. [Google Scholar] [CrossRef]
- Xu, Y.; Lebrun, R.E.; Gallo, P.-J.; Blond, P. Treatment of Textile Dye Plant Effluent by Nanofiltration Membrane. Sep. Sci. Technol. 1999, 34, 2501–2519. [Google Scholar] [CrossRef]
- Lau, Y.Y.; Wong, Y.S.; Teng, T.T.; Morad, N.; Rafatullah, M.; Ong, S.A. Coagulation-flocculation of azo dye acid orange 7 with green refined laterite soil. Chem. Eng. J. 2014, 246, 383–390. [Google Scholar] [CrossRef]
- Sharma, M.; Sharma, S.; Akhtar, M.S.; Kumar, R.; Umar, A.; Alkhanjaf, A.A.M.; Baskoutas, S. Microorganisms-assisted degradation of Acid Orange 7 dye: A review. Int. J. Environ. Sci. Technol. 2024, 21, 6133–6166. [Google Scholar] [CrossRef]
- Cojocaru, C.; Samoila, P.; Pascariu, P. Chitosan-based magnetic adsorbent for removal of water-soluble anionic dye: Artificial neural network modeling and molecular docking insights. Int. J. Biol. Macromol. 2019, 123, 587–599. [Google Scholar] [CrossRef]
- Yardımcı, B.; Kanmaz, N.; Buğdaycı, M.; Demircivi, P. Synthesis of CuBDC metal-organic framework supported zinc oxide via ball-milling technique for enhanced adsorption of Orange-II. Surf. Interfaces 2024, 46, 104122. [Google Scholar] [CrossRef]
- Lei, Y.; Zhao, J.; Song, H.; Yang, F.; Shen, L.; Zhu, L.; Zeng, Z.; Li, X.; Wang, G. Enhanced adsorption of dyes by functionalized UiO-66 nanoparticles: Adsorption properties and mechanisms. J. Mol. Struct. 2023, 1292, 136111. [Google Scholar] [CrossRef]
- Mohan, D.; Chaubey, A.K.; Patel, M.; Navarathna, C.; Mlsna, T.E.; Pittman, C.U., Jr. Biochar adsorption system designs. In Sustainable Biochar for Water and Wastewater Treatment; Mohan, D., Pittman, C.U., Jr., Mlsna, T.E., Eds.; Elsevier: Amsterdam, The Netherlands, 2022; pp. 153–203. [Google Scholar]
- Khalil, A.; Mangwandi, C.; Salem, M.A.; Ragab, S.; El Nemr, A. Orange peel magnetic activated carbon for removal of acid orange 7 dye from water. Sci. Rep. 2024, 14, 119. [Google Scholar] [CrossRef] [PubMed]
- Li, J.; Lin, H.; Zhu, K.; Zhang, H. Degradation of Acid Orange 7 using peroxymonosulfate catalyzed by granulated activated carbon and enhanced by electrolysis. Chemosphere 2017, 188, 139–147. [Google Scholar] [CrossRef] [PubMed]
- Bourahla, S.; Nemchi, F.; Belayachi, H.; Belayachi, A.; Harrats, C.; Belhakem, M. Removal of the AO7 dye by adsorption on activated carbon based on grape marc: Equilibrium, regeneration, and FTIR spectroscopy. J. Iran. Chem. Soc. 2023, 20, 669–681. [Google Scholar] [CrossRef]
- Yoon, S.; Calvo, J.J.; So, M.C. Removal of Acid Orange 7 from Aqueous Solution by Metal-Organic Frameworks. Crystals 2019, 9, 17. [Google Scholar] [CrossRef]
- Hajjaji, W.; Pullar, R.C.; Labrincha, J.A.; Rocha, F. Aqueous Acid Orange 7 dye removal by clay and red mud mixes. Appl. Clay Sci. 2016, 126, 197–206. [Google Scholar] [CrossRef]
- Naraghi, B.; Zabihi, F.; Narooie, M.R.; Saeidi, M.; Biglari, H. Removal of Acid Orange 7 dye from aqueous solutions by adsorption onto Kenya tea pulps; granulated shape. Electron. Physician 2017, 9, 4312–4321. [Google Scholar] [CrossRef] [PubMed]
- Gogoi, N.; Samanta, P.; Dahutia, P. Agro-Wastes as Low-Cost Biosorbent for Dyes Removal from Wastewater. In Agriculture Waste Management and Bioresource; John Wiley & Sons: Hoboken, NJ, USA, 2023; pp. 149–172. [Google Scholar]
- Deokar, S.; Patel, H.; Thakare, P.; Bhagat, S.; Gedam, V.; Pathak, P. Adsorptive column studies for removal of acid orange 7 dye using bagasse fly ash. Indian J. Chem. Technol. 2021, 28, 319–327. [Google Scholar]
- Khosla, E.; Kaur, S.; Dave, P.N. Mechanistic Study of Adsorption of Acid Orange-7 over Aluminum Oxide Nanoparticles. J. Eng. 2013, 2013, 593534. [Google Scholar] [CrossRef]
- Yen Doan, T.H.; Van Dang, L.; Trang Truong, T.T.; Vu, T.N.; Le, T.S.; Thu Nguyen, T.M.; Nguyen, M.N.; Pham, T.T.; Yusa, S.-i.; Pham, T.D. Removal of Acid Orange G Azo Dye by Polycation-Modified Alpha Alumina Nanoparticles. Chem. Asian J. 2023, 18, e202300404. [Google Scholar] [CrossRef] [PubMed]
- Perez-Calderon, J.; Marin-Silva, D.A.; Zaritzky, N.; Pinotti, A. Eco-friendly PVA-chitosan adsorbent films for the removal of azo dye Acid Orange 7: Physical cross-linking, adsorption process, and reuse of the material. Adv. Ind. Eng. Polym. Res. 2023, 6, 239–254. [Google Scholar] [CrossRef]
- Marovska, G.; Dushkova, M.; Angelova, G.; Brazkova, M.; Brink, H.; Haneklaus, N.; Menkov, N.; Slavov, A. Rose and lavender industrial by-products application for adsorption of Acid Orange 7 from aqueous solution. Biomass Convers. Biorefinery 2023, 1–14. [Google Scholar] [CrossRef]
- Dong, S.; Zheng, Q.; Huang, G.; Wang, X.; Huang, T. The Coordination Polymer [Cu(bipy)(SO4)]n and Its Functionalization for Selective Removal of Two Types of Organic Pollutants. Ind. Eng. Chem. Res. 2019, 58, 15416–15424. [Google Scholar] [CrossRef]
- Ahmadian, A.; Goharrizi, B.A.; Shahriari, T.; Ahmadi, S. Adsorption of chromium (VI) and Acid Orange 7 on lemon peel biochar: A response surface methodology approach. Int. J. Environ. Sci. Technol. 2023, 20, 2939–2958. [Google Scholar] [CrossRef]
- Zhang, M.; Lin, K.; Zhong, Y.; Zhang, D.; Ahmad, M.; Yu, J.; Fu, H.; Xu, L.; Wu, S.; Huang, L. Functionalizing biochar by Co-pyrolysis shaddock peel with red mud for removing acid orange 7 from water. Environ. Pollut. 2022, 299, 118893. [Google Scholar] [CrossRef] [PubMed]
- Kapoor, R.T.; Sivamani, S. Biosorption behavior of acid orange 7 dye onto Cucumis sativus peel biochar and its effect on growth of Triticum aestivum. Environ. Prog. Sustain. Energy 2023, 42, e14106. [Google Scholar] [CrossRef]
- Patel, M.; Kumar, R.; Pittman, C.U., Jr.; Mohan, D. Ciprofloxacin and acetaminophen sorption onto banana peel biochars: Environmental and process parameter influences. Environ. Res. 2021, 201, 111218. [Google Scholar] [CrossRef] [PubMed]
- Mohan, D.; Sarswat, A.; Ok, Y.S.; Pittman, C.U., Jr. Organic and inorganic contaminants removal from water with biochar, a renewable, low cost and sustainable adsorbent—A critical review. Bioresour. Technol. 2014, 160, 191–202. [Google Scholar] [CrossRef] [PubMed]
- Patel, M.; Kumar, R.; Kishor, K.; Mlsna, T.; Pittman, C.U., Jr.; Mohan, D. Pharmaceuticals of Emerging Concern in Aquatic Systems: Chemistry, Occurrence, Effects, and Removal Methods. Chem. Rev. 2019, 119, 3510–3673. [Google Scholar] [CrossRef] [PubMed]
- Amalina, F.; Razak, A.S.A.; Krishnan, S.; Zularisam, A.W.; Nasrullah, M. A comprehensive assessment of the method for producing biochar, its characterization, stability, and potential applications in regenerative economic sustainability—A review. Clean. Mater. 2022, 3, 100045. [Google Scholar] [CrossRef]
- Dissanayake, P.D.; Choi, S.W.; Igalavithana, A.D.; Yang, X.; Tsang, D.C.W.; Wang, C.-H.; Kua, H.W.; Lee, K.B.; Ok, Y.S. Sustainable gasification biochar as a high efficiency adsorbent for CO2 capture: A facile method to designer biochar fabrication. Renew. Sustain. Energy Rev. 2020, 124, 109785. [Google Scholar] [CrossRef]
- Tongpoothorn, W.; Somboon, T.; Sriuttha, M. The Utilization of Napier Grass Stems for Cd(II) Ions Removal from Aqueous Solution: Process Optimization Studies Using Response Surface Methodology. Naresuan Univ. J. Sci. Technol. 2020, 28, 46–62. [Google Scholar]
- Reza, M.S.; Afroze, S.; Bakar, M.S.A.; Saidur, R.; Aslfattahi, N.; Taweekun, J.; Azad, A.K. Biochar characterization of invasive Pennisetum purpureum grass: Effect of pyrolysis temperature. Biochar 2020, 2, 239–251. [Google Scholar] [CrossRef]
- Mustapha, O.R.; Osobamiro, T.M.; Sanyaolu, N.O.; Alabi, O.M. Adsorption study of Methylene blue dye: An effluents from local textile industry using Pennisteum pupureum (elephant grass). Int. J. Phytorem. 2023, 25, 1348–1358. [Google Scholar] [CrossRef] [PubMed]
- Grey, T.L.; Webster, T.M.; Li, X.; Anderson, W.; Cutts, G.S. Evaluation of Control of Napiergrass (Pennisetum purpureum) with Tillage and Herbicides. Invasive Plant Sci. Manag. 2015, 8, 393–400, 398. [Google Scholar] [CrossRef]
- Ferreira, S.D.; Lazzarotto, I.P.; Junges, J.; Manera, C.; Godinho, M.; Osório, E. Steam gasification of biochar derived from elephant grass pyrolysis in a screw reactor. Energy Convers. Manag. 2017, 153, 163–174. [Google Scholar] [CrossRef]
- Essandoh, M.; Kunwar, B.; Pittman, C.U., Jr.; Mohan, D.; Mlsna, T. Sorptive removal of salicylic acid and ibuprofen from aqueous solutions using pine wood fast pyrolysis biochar. Chem. Eng. J. 2015, 265, 219–227. [Google Scholar] [CrossRef]
- D1762-84; Standard Test Method for Chemical Analysis of Wood Charcoal. ASTM: West Conshohocken, PA, USA, 2021.
- Lagergren, S. Zur theorie der sogenannten adsorption geloster stoffe. K. Sven. Vetenskapsakademiens. Handl. 1898, 24, 1–39. [Google Scholar]
- Ho, Y.S.; McKay, G. Pseudo-second order model for sorption processes. Process Biochem. 1999, 34, 451–465. [Google Scholar] [CrossRef]
- Langmuir, I. The adsorption of gases on plane surfaces of glass, mica and platinum. J. Am. Chem. Soc. 1918, 40, 1361–1403. [Google Scholar] [CrossRef]
- Freundlich, H. Over the adsorption in solution. J. Phys. Chem. 1906, 57, 1100–1107. [Google Scholar]
- Choudhary, V.; Patel, M.; Pittman, C.U., Jr.; Mohan, D. Batch and Continuous Fixed-Bed Lead Removal Using Himalayan Pine Needle Biochar: Isotherm and Kinetic Studies. ACS Omega 2020, 5, 16366–16378. [Google Scholar] [CrossRef] [PubMed]
- Chaubey, A.K.; Patel, M.; Pittman, C.U., Jr.; Mohan, D. Acetaminophen and trimethoprim batch and fixed-bed sorption on MgO/Al2O3-modified rice husk biochar. Colloids Surf. A Physicochem. Eng. Asp. 2023, 677, 132263. [Google Scholar] [CrossRef]
- Patel, M.; Chaubey, A.K.; Pittman, C.U., Jr.; Mohan, D. Aqueous ibuprofen sorption by using activated walnut shell biochar: Process optimization and cost estimation. Environ. Sci. Adv. 2022, 1, 530–545. [Google Scholar] [CrossRef]
- Manjunath, S.V.; Kumar, M. Simultaneous removal of antibiotic and nutrients via Prosopis juliflora activated carbon column: Performance evaluation, effect of operational parameters and breakthrough modeling. Chemosphere 2021, 262, 127820. [Google Scholar] [CrossRef]
- Chatterjee, A.; Schiewer, S. Biosorption of Cadmium(II) Ions by Citrus Peels in a Packed Bed Column: Effect of Process Parameters and Comparison of Different Breakthrough Curve Models. CLEAN Soil Air Water 2011, 39, 874–881. [Google Scholar] [CrossRef]
- Tran, T.C.P.; Nguyen, T.P.; Nguyen, X.C.; Nguyen, X.H.; Nguyen, T.A.H.; Nguyen, T.T.N.; Vo, T.Y.B.; Nguyen, T.H.G.; Nguyen, T.T.H.; Vo, T.D.H.; et al. Adsorptive removal of phosphate from aqueous solutions using low-cost modified biochar-packed column: Effect of operational parameters and kinetic study. Chemosphere 2022, 309, 136628. [Google Scholar] [CrossRef] [PubMed]
- Thomas, H.C. Heterogeneous ion exchange in a flowing system. J. Am. Chem. Soc. 1944, 66, 1664–1666. [Google Scholar] [CrossRef]
- Chu, K.H. Fixed bed sorption: Setting the record straight on the Bohart–Adams and Thomas models. J. Hazard. Mater. 2010, 177, 1006–1012. [Google Scholar] [CrossRef] [PubMed]
- Yoon, Y.H.; Nelson, J.H. Application of Gas Adsorption Kinetics I. A Theoretical Model for Respirator Cartridge Service Life. Am. Ind. Hyg. Assoc. J. 1984, 45, 509–516. [Google Scholar] [CrossRef] [PubMed]
- Chakraborty, P.; Banerjee, S.; Kumar, S.; Sadhukhan, S.; Halder, G. Elucidation of ibuprofen uptake capability of raw and steam activated biochar of Aegle marmelos shell: Isotherm, kinetics, thermodynamics and cost estimation. Process Saf. Environ. Prot. 2018, 118, 10–23. [Google Scholar] [CrossRef]
- Chakraborty, P.; Show, S.; Banerjee, S.; Halder, G. Mechanistic insight into sorptive elimination of ibuprofen employing bi-directional activated biochar from sugarcane bagasse: Performance evaluation and cost estimation. J. Environ. Chem. Eng. 2018, 6, 5287–5300. [Google Scholar] [CrossRef]
- Claoston, N.; Samsuri, A.W.; Ahmad Husni, M.H.; Mohd Amran, M.S. Effects of pyrolysis temperature on the physicochemical properties of empty fruit bunch and rice husk biochars. Waste Manag. Res. 2014, 32, 331–339. [Google Scholar] [CrossRef] [PubMed]
- Johnston, C.T. Biochar analysis by Fourier-transform infra-red spectroscopy. In Biochar: A Guide to Analytical Methods; Balwant Singh, M.C.-A., Lehmann, J., Eds.; CSIRO Publishing: Clayton, Australia, 2017; pp. 199–213. [Google Scholar]
- Lafuente, B.; Downs, R.T.; Yang, H.; Stone, N. The power of databases: The RRUFF project. In Highlights in Mineralogical Crystallography; Armbruster, T., Danisi, R.M., Eds.; De Gruyter (O): Berlin, Germany, 2016; pp. 1–30. [Google Scholar]
- Zhao, H.; Lang, Y. Adsorption behaviors and mechanisms of florfenicol by magnetic functionalized biochar and reed biochar. J. Taiwan Inst. Chem. Eng. 2018, 88, 152–160. [Google Scholar] [CrossRef]
- Stuart, B.H. Infrared Spectroscopy: Fundamentals and Applications; John Wiley & Sons Ltd.: Chichester, UK, 2004; p. 248. [Google Scholar]
- Lyu, H.; Gao, B.; He, F.; Zimmerman, A.R.; Ding, C.; Huang, H.; Tang, J. Effects of ball milling on the physicochemical and sorptive properties of biochar: Experimental observations and governing mechanisms. Environ. Pollut. 2018, 233, 54–63. [Google Scholar] [CrossRef] [PubMed]
- Mohan, D.; Singh, P.; Sarswat, A.; Steele, P.H.; Pittman, C.U., Jr. Lead sorptive removal using magnetic and nonmagnetic fast pyrolysis energy cane biochars. J. Colloid Interface Sci. 2015, 448, 238–250. [Google Scholar] [CrossRef] [PubMed]
- Vimal, V.; Patel, M.; Mohan, D. Aqueous carbofuran removal using slow pyrolyzed sugarcane bagasse biochar: Equilibrium and fixed-bed studies. RSC Adv. 2019, 9, 26338–26350. [Google Scholar] [CrossRef] [PubMed]
- Mohan, D.; Abhishek, K.; Sarswat, A.; Patel, M.; Singh, P.; Pittman, C.U., Jr. Biochar production and applications in soil fertility and carbon sequestration—A sustainable solution to crop-residue burning in India. RSC Adv. 2018, 8, 508–520. [Google Scholar] [CrossRef]
- Chia, C.H.; Gong, B.; Joseph, S.D.; Marjo, C.E.; Munroe, P.; Rich, A.M. Imaging of mineral-enriched biochar by FTIR, Raman and SEM–EDX. Vib. Spectrosc. 2012, 62, 248–257. [Google Scholar] [CrossRef]
- Singh, B.; Raven, M.D. X-ray diffraction analysis of biochar. In Biochar: A Guide to Analytical Methods; Singh, B., Camps-Arbestain, M., Lehmann, J., Eds.; CSIRO Publishing: Clayton, Australia, 2017; pp. 245–252. [Google Scholar]
- Downs, R.T.; Hall-Wallace, M. The American Mineralogist crystal structure database. Am. Mineral. 2003, 88, 247–250. [Google Scholar]
- Peng, H.; Li, K.; Wang, T.; Wang, J.; Wang, J.; Zhu, R.; Sun, D.; Wang, S. Preparation of hierarchical mesoporous CaCO3 by a facile binary solvent approach as anticancer drug carrier for etoposide. Nanoscale Res. Lett. 2013, 8, 321. [Google Scholar] [CrossRef]
- Wang, J.; Liao, Z.; Ifthikar, J.; Shi, L.; Chen, Z.; Chen, Z. One-step preparation and application of magnetic sludge-derived biochar on acid orange 7 removal via both adsorption and persulfate based oxidation. RSC Adv. 2017, 7, 18696–18706. [Google Scholar] [CrossRef]
- Stoyanova, M.; Slavova, I.; Christoskova, S.; Ivanova, V. Catalytic performance of supported nanosized cobalt and iron–cobalt mixed oxides on MgO in oxidative degradation of Acid Orange 7 azo dye with peroxymonosulfate. Appl. Catal. A Gen. 2014, 476, 121–132. [Google Scholar] [CrossRef]
- El-Nemr, M.; Abdelmonem, N.; Ismail, I.; Ragab, S.; El Nemr, A. The efficient removal of the hazardous azo dye Acid Orange 7 from water using modified biochar from Pea-peels. Desalination Water Treat. 2020, 203, 327–355. [Google Scholar] [CrossRef]
- Ghaly, A.; Ananthashankar, R.; Alhattab, M.; Ramakrishnan, V.V. Production, characterization and treatment of textile effluents: A critical review. J. Chem. Eng. Process. Technol. 2014, 5, 1–19. [Google Scholar]
- Rauf, M.A.; Ashraf, S.S. Fundamental principles and application of heterogeneous photocatalytic degradation of dyes in solution. Chem. Eng. J. 2009, 151, 10–18. [Google Scholar] [CrossRef]
- Stylidi, M.; Kondarides, D.I.; Verykios, X.E. Pathways of solar light-induced photocatalytic degradation of azo dyes in aqueous TiO2 suspensions. Appl. Catal. B Environ. 2003, 40, 271–286. [Google Scholar] [CrossRef]
- Lin, R.; Liang, Z.; Yang, C.; Zhao, Z.; Cui, F. Selective adsorption of organic pigments on inorganically modified mesoporous biochar and its mechanism based on molecular structure. J. Colloid Interface Sci. 2020, 573, 21–30. [Google Scholar] [CrossRef] [PubMed]
- Jung, K.-W.; Choi, B.H.; Hwang, M.-J.; Jeong, T.-U.; Ahn, K.-H. Fabrication of granular activated carbons derived from spent coffee grounds by entrapment in calcium alginate beads for adsorption of acid orange 7 and methylene blue. Bioresour. Technol. 2016, 219, 185–195. [Google Scholar] [CrossRef] [PubMed]
- Qiu, Y.; Xu, X.; Xu, Z.; Liang, J.; Yu, Y.; Cao, X. Contribution of different iron species in the iron-biochar composites to sorption and degradation of two dyes with varying properties. Chem. Eng. J. 2020, 389, 124471. [Google Scholar] [CrossRef]
- Sahoo, T.R.; Prelot, B. Adsorption processes for the removal of contaminants from wastewater: The perspective role of nanomaterials and nanotechnology. In Nanomaterials for the Detection and Removal of Wastewater Pollutants; Bonelli, B., Freyria, F.S., Rossetti, I., Sethi, R., Eds.; Elsevier: Amsterdam, The Netherlands, 2020; pp. 161–222. [Google Scholar]
- Lian, F.; Cui, G.; Liu, Z.; Duo, L.; Zhang, G.; Xing, B. One-step synthesis of a novel N-doped microporous biochar derived from crop straws with high dye adsorption capacity. J. Environ. Manag. 2016, 176, 61–68. [Google Scholar] [CrossRef] [PubMed]
- Foo, K.Y.; Hameed, B.H. Insights into the modeling of adsorption isotherm systems. Chem. Eng. J. 2010, 156, 2–10. [Google Scholar] [CrossRef]
- Mu, Y.; Ma, H. NaOH-modified mesoporous biochar derived from tea residue for methylene Blue and Orange II removal. Chem. Eng. Res. Des. 2021, 167, 129–140. [Google Scholar] [CrossRef]
- Thirunavukkarasu, A.; Nithya, R. Adsorption of acid orange 7 using green synthesized CaO/CeO2 composite: An insight into kinetics, equilibrium, thermodynamics, mass transfer and statistical models. J. Taiwan Inst. Chem. Eng. 2020, 111, 44–62. [Google Scholar] [CrossRef]
- Chen, S.; Qin, C.; Wang, T.; Chen, F.; Li, X.; Hou, H.; Zhou, M. Study on the adsorption of dyestuffs with different properties by sludge-rice husk biochar: Adsorption capacity, isotherm, kinetic, thermodynamics and mechanism. J. Mol. Liq. 2019, 285, 62–74. [Google Scholar] [CrossRef]
- Ghasemi, A.; Shams, M.; Qasemi, M.; Afsharnia, M. Data on efficient removal of acid orange 7 by zeolitic imidazolate framework-8. Data Brief 2019, 23, 103783. [Google Scholar] [CrossRef] [PubMed]
- Noorimotlagh, Z.; Darvishi Cheshmeh Soltani, R.; Khataee, A.R.; Shahriyar, S.; Nourmoradi, H. Adsorption of a textile dye in aqueous phase using mesoporous activated carbon prepared from Iranian milk vetch. J. Taiwan Inst. Chem. Eng. 2014, 45, 1783–1791. [Google Scholar] [CrossRef]
- Hsiu-Mei, C.; Ting-Chien, C.; San-De, P.; Chiang, H.-L. Adsorption characteristics of Orange II and Chrysophenine on sludge adsorbent and activated carbon fibers. J. Hazard. Mater. 2009, 161, 1384–1390. [Google Scholar] [CrossRef] [PubMed]
- Jia, L.; Liu, W.; Cao, J.; Wu, Z.; Yang, C. Modified multi-walled carbon nanotubes assisted foam fractionation for effective removal of acid orange 7 from the dyestuff wastewater. J. Environ. Manag. 2020, 262, 110260. [Google Scholar] [CrossRef] [PubMed]
- Li, J.; Du, Y.; Deng, B.; Zhu, K.; Zhang, H. Activated carbon adsorptive removal of azo dye and peroxydisulfate regeneration: From a batch study to continuous column operation. Environ. Sci. Pollut. Res. 2017, 24, 4932–4941. [Google Scholar] [CrossRef] [PubMed]
- Yang, Z.; Zhu, L.; Chen, L. Selective adsorption and separation of dyes from aqueous solution by core-shell structured NH2-functionalized UiO-66 magnetic composites. J. Colloid Interface Sci. 2019, 539, 76–86. [Google Scholar] [CrossRef] [PubMed]
- Santhosh, C.; Daneshvar, E.; Tripathi, K.M.; Baltrėnas, P.; Kim, T.; Baltrėnaitė, E.; Bhatnagar, A. Synthesis and characterization of magnetic biochar adsorbents for the removal of Cr(VI) and Acid orange 7 dye from aqueous solution. Environ. Sci. Pollut. Res. 2020, 27, 32874–32887. [Google Scholar] [CrossRef] [PubMed]
- Rajeshkanna, P.; Nagarajan, N.; Meenakshi, S. Rhodamine B and acid orange 7 adsorption onto activated carbon from deinked pulp waste sludge: Adsorption and kinetics studies. Environ. Sci. 2018, 14, 169. [Google Scholar]
- Wathukarage, A.; Herath, I.; Iqbal, M.C.M.; Vithanage, M. Mechanistic understanding of crystal violet dye sorption by woody biochar: Implications for wastewater treatment. Environ. Geochem. Health 2019, 41, 1647–1661. [Google Scholar] [CrossRef] [PubMed]


| Properties | Acid Orange 7 (AO7) |
|---|---|
| Chemical structure | 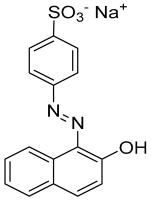 |
| Empirical formula | C16H11N2NaO4S |
| Solubility (in water) | 116 g L−1 at 30 °C |
| IUPAC name | Sodium 4-[(2E)-2-(2-oxonaphthalen-1-ylidene)hydrazinyl]benzenesulfonate |
| Molar mass | 350.32 |
| CAS No. | 633-96-5 |
| Generic name | Acid orange 7 (C. I. 15510) |
| Class | Azo dye (anionic) |
| Property/Element | Values |
|---|---|
| Yield (%) | ~31 |
| Ash (%) | ~21 |
| Moisture (%) | ~6 |
| Surface Area (SBET, m2 g−1) | 108 |
| Total pore volume (cm3 g−1) | 0.16 |
| Pore radius (Å) | 19.13 |
| Carbon (%) | 62.8 |
| Hydrogen (%) | 1.94 |
| Nitrogen (%) | 4.20 |
| Sulfur (%) | 0.51 |
| Oxygen (%) | 30.5 |
| MgO (mg g−1) | 16.97 |
| CaO (mg g−1) | 46.25 |
| K2O (mg g−1) | 15.43 |
| Al2O3 (mg g−1) | 1.18 |
| Fe2O3 (mg g−1) | 1.17 |
| MnO2 (mg g−1) | 0.22 |
| Biochar Dose (g L−1) | Calculated qe (%) | PFO | PSO | ||||
|---|---|---|---|---|---|---|---|
| qe (%) | k1 (h−1) | R2 | qe (%) | k2 (g mg−1 h−1) | R2 | ||
| 1 | 61.7 | 54.2 | 0.80 | 0.918 | 59.4 | 0.20 | 0.983 |
| 2 | 91.8 | 82.1 | 0.82 | 0.964 | 91.2 | 0.21 | 0.994 |
| 3 | 94.8 | 90.2 | 0.86 | 0.789 | 93.7 | 0.63 | 0.969 |
| 4 | 95.6 | 92.4 | 2.29 | 0.988 | 94.5 | 1.7 | 0.997 |
| Dye conc. (mg L−1) | |||||||
| 10 | 91.7 | 82.2 | 0.82 | 0.964 | 91.2 | 0.21 | 0.994 |
| 20 | 55.1 | 51.3 | 1.11 | 0.915 | 54.9 | 0.27 | 0.968 |
| 30 | 47.6 | 45.4 | 0.63 | 0.806 | 48.3 | 0.17 | 0.964 |
| Isotherm Model | Parameters | Temperature | ||
|---|---|---|---|---|
| 10 °C | 25 °C | 40 °C | ||
| Langmuir | Q° (mg g−1) | 14.3 | 12.7 | 8.4 |
| b (L mg−1) | 0.12 | 0.11 | 0.77 | |
| R2 | 0.987 | 0.788 | 0.831 | |
| Reduced χ2 | 10 | 139 | 32 | |
| Freundlich | KF (mg g−1) | 2.65 | 3.36 | 4.75 |
| n | 2.98 | 3.68 | 7.69 | |
| R2 | 0.994 | 0.987 | 0.965 | |
| Reduced χ2 | 4.4 | 8 | 6.7 | |
| Adsorbents | Surface Area (m2 g−1) | pH | Temp. (°C) | Maximum Adsorption Capacity (mg g−1) | Adsorption Capacity per Unit Surface Area (mg m−2) | Reference |
|---|---|---|---|---|---|---|
| Napier grass biochar (NGBC700) | 108 | 6.5 | 10 | 14.3 | 0.13 | This study |
| 25 | 12.7 | 0.12 | ||||
| 40 | 8.4 | 0.08 | ||||
| NaOH-modified tea residue biochar | 178 | 2 | 25 | 96.71 | 0.54 | [102] |
| Fe–sorghum straw biochar | 216.6 | 6 | 5 | 25.15 | 0.11 | |
| 15 | 28.91 | 0.13 | [96] | |||
| 25 | 59.34 | 0.27 | ||||
| CaO/CeO2 composite | 32.3 | 2 | 28 | 27.78 | 0.86 | [103] |
| Sludge–rice husk biochar | 29.18 | 6–7 | 25 | 42.12 | 1.45 | [104] |
| Zeolitic imidazolate framework-8 | 978 | 6 | 25 | 80.47 | 0.08 | [105] |
| Milk-vetch shrub activated carbon | 565 | 7 | 25 | 99 | 0.18 | [106] |
| Activated carbon fiber | 842 | - | 30 | 230 | 0.27 | [107] |
| Lemon peel biochar | 194.7 | 2 | - | 225 | 1.15 | [47] |
| Modified multi walled carbon nanotubes | 1800 | 7 | 25 | 59.52 | 0.03 | [108] |
| Cucumis sativa peel biochar | NA | 2 | 25 | 11.21 | NA | [49] |
| Granular activated carbon | 704.23 | 3 | 30 | 665.9 | 0.94 | [97] |
| Co-pyrolyzed shaddock peel and red mud | 93.51 | 2.2 | 25 | 32 | 0.34 | [48] |
| Activated carbon | 878 | 6 | 25 | 109.05 | 0.12 | [109] |
| Triethylenetatramine (TETA)-treated sulfonated mandarin biochar | 5.98 | 2 | 25 | 312.5 | 52.25 | [15] |
| Core–shell-structured NH2 functionalized UiO-66 magnetic composites | 722.6 | NA | 25 | 48.12 | 0.06 | [110] |
| Fe3O4-modified sewage sludge biochar prepared at 450 °C | 127.98 | 2 | 25 | 110.27 | 0.86 | [111] |
| Fe3O4-modified sewage sludge biochar prepared at 700 °C | 99.83 | 64.40 | 0.64 | |||
| De-inked Pulp Waste Sludge Activated Carbon (DIPSAC) | 1523.7 | 2 | 30 | 12.88 | 0.008 | [112] |
| 40 | 12.33 | 0.008 | ||||
| 50 | 12.23 | 0.008 |
| Column Parameters | Values |
|---|---|
| Weight of NGBC700 (g) | 4 |
| Bed volume (cm3) | 34.54 |
| EBCT (Empty bed contact time) (min) | 7.85 |
| NGBC700 usage rate (g L−1) | 8.7 |
| Column capacity (mg g−1) | 4.4 |
| Initial concentration (mg L−1) | 20 |
| Concentration at exhaustion point (Cx) (mg L−1) | 18 |
| Concentration at breakthrough point (Cb) (mg L−1) | 2 |
| Exhaustion volume (Vx) (mL) | 1665 |
| Breakthrough volume (Vb) (mL) | 460 |
| Total time to reach exhaustion point (tx) (min) | 367 |
| Total time to reach breakthrough (tb) (min) | 89 |
| Percent saturation (%) | 73.5 |
| Fractional capacity (f) | 0.65 |
| Primary adsorption zone (cm) | 8.33 |
| Thomas Model | Yoon–Nelson Model | Experimental Data | |||||
|---|---|---|---|---|---|---|---|
| KTH (mL/min.mg) | qmax (mg g-1) | R2 | KYN (min−1) | T0.5 (min) | R2 | qe-exp (mg g-1) | T0.5–exp (min) |
| 1.09 | 5.2 | 0.76 | 0.0216 | 239 | 0.76 | 4.4 | 215 |
Disclaimer/Publisher’s Note: The statements, opinions and data contained in all publications are solely those of the individual author(s) and contributor(s) and not of MDPI and/or the editor(s). MDPI and/or the editor(s) disclaim responsibility for any injury to people or property resulting from any ideas, methods, instructions or products referred to in the content. |
© 2024 by the authors. Licensee MDPI, Basel, Switzerland. This article is an open access article distributed under the terms and conditions of the Creative Commons Attribution (CC BY) license (https://creativecommons.org/licenses/by/4.0/).
Share and Cite
Yadav, A.K.; Chaubey, A.K.; Kapoor, S.; Pratap, T.; Preetiva, B.; Vimal, V.; Mohan, D. Sustainable Napier Grass (Pennisetum purpureum) Biochar for the Sorptive Removal of Acid Orange 7 (AO7) from Water. Processes 2024, 12, 1115. https://doi.org/10.3390/pr12061115
Yadav AK, Chaubey AK, Kapoor S, Pratap T, Preetiva B, Vimal V, Mohan D. Sustainable Napier Grass (Pennisetum purpureum) Biochar for the Sorptive Removal of Acid Orange 7 (AO7) from Water. Processes. 2024; 12(6):1115. https://doi.org/10.3390/pr12061115
Chicago/Turabian StyleYadav, Anand Kumar, Abhishek Kumar Chaubey, Shivang Kapoor, Tej Pratap, Brahmacharimayum Preetiva, Vineet Vimal, and Dinesh Mohan. 2024. "Sustainable Napier Grass (Pennisetum purpureum) Biochar for the Sorptive Removal of Acid Orange 7 (AO7) from Water" Processes 12, no. 6: 1115. https://doi.org/10.3390/pr12061115
APA StyleYadav, A. K., Chaubey, A. K., Kapoor, S., Pratap, T., Preetiva, B., Vimal, V., & Mohan, D. (2024). Sustainable Napier Grass (Pennisetum purpureum) Biochar for the Sorptive Removal of Acid Orange 7 (AO7) from Water. Processes, 12(6), 1115. https://doi.org/10.3390/pr12061115