Article

Three-Dimensional VOF-DEM Simulation Study of Particle Fluidization Induced by Bubbling Flow

College of Chemical Engineering, Nanjing Tech University, Nanjing 211816, China
*
Author to whom correspondence should be addressed.
Processes 2024, 12(6), 1053; https://doi.org/10.3390/pr12061053
Submission received: 14 April 2024 / Revised: 16 May 2024 / Accepted: 17 May 2024 / Published: 21 May 2024

Abstract

:
The bubbling flow plays a key role in gas–liquid–solid fluidized beds. To understand the intrinsic fluidization behaviors at the discrete bubble and particle scale, coupled simulations with the volume of fluid model and the discrete element method are performed to investigate the effects of the gas inlet velocity, particle properties and two-orifice bubbling flow on particle fluidization. Three-dimensional simulations are carried out to accurately capture the dynamic changes in the bubble shape and trajectory. A bubbling flow with a closely packed bed is simulated to study the onset of particle fluidization. The obvious phenomena of particle fluidization are presented by both the experiment and simulation. Although an increasing gas inlet velocity promotes particle fluidization, the good fluidization of particles cannot be achieved solely by increasing the gas inlet velocity. When the channel is packed with more particles, the bubbles take a longer time to pass through the higher particle bed, and the bubbles grow larger in the bed. The increase in particle density also extends the time needed for the bubbles to escape from the bed, and it is more difficult to fluidize the particles with a larger density. Even if more particles are added into the channel, the percentage of suspended particles is not significantly changed. The percentage of suspended particles is not increased with a decrease in the particle diameter. The particle suspension is not significantly improved by the bubbling flow with two orifices, while the particle velocity is increased due to the more frequent bubble–particle collisions. The findings from this study will be beneficial in guiding the enhancement of particle fluidization in multiphase reactors.

1. Introduction

Gas–liquid–solid fluidized beds have found wide application over the years for many industrial reactions. They provide excellent heat and mass transfer performance owing to the bubble and particle dynamics. It has been recognized that the bubble dynamics plays a key role in the transport phenomena and fluidization behaviors [1,2,3,4]. Although an overwhelming amount of research has been dedicated to describing the complexity of the gas–liquid–solid hydrodynamics during the past few decades, the challenges in real industries call for new first-principles-based alternative solutions to more deeply understand the intrinsic fluidization behaviors. Due to the limited freedom in experimental measurements, computational fluid dynamics (CFD) has proven to be useful in describing the hydrodynamics in gas–liquid–solid fluidized beds [5].
Significant effort has been made to carry out CFD simulation studies of gas–liquid–solid fluidized beds. For engineering purposes, the Eulerian multi-fluid models are very popular due to the low computational effort required [6,7,8,9,10]. However, these models fall short of providing bubble-scale or particle-scale information. Alternatively, the discrete particle method (DPM) with the volume of fluid (VOF) model has been developed to resolve gas–liquid–solid flows. Fan’s group has conducted pioneering research on gas–liquid–solid fluidization systems. A combined CFD-VOF-DPM method was developed to simulate single bubble or bubble wake behaviors [11,12,13,14]. The topological change in the bubble surface was directly calculated with the VOF model, while the motion of particles was described by the DPM. Their simulations focused on bubble or bubble wake behaviors in suspended particle systems, while particle fluidization was not thoroughly discussed. Liu and Luo [15] used a combined CFD–VOF–DPM method to simulate the bubble rising and coalescence phenomenon in low-hold-up particle suspension systems. The gas and particle phases were simulated by the VOF and DPM methods, respectively. Only a few particles were distributed in the two-dimensional simulation domain. Particle entrainment by a single bubble or two bubbles was investigated in particle suspension systems. However, the bubble formation process was simplified by only patching a circular region in the simulation domain. Chen’s group also used the combined CFD–VOF–DPM method to investigate the wake structure and particle entrainment behavior of a single bubble in gas–liquid–solid systems [16,17]. Due to the very low solid hold-up, the particle–particle interactions were ignored in their studies. A small number of particles were sparsely distributed in the simulation domain, while the particles were closely packed in the experiment. This discrepancy can result in the inappropriate prediction of particle fluidization. Bo et al. [18] simulated the particle motion and entrainment process under the action of single and double bubbles using the computational fluid dynamics–deterministic particle track model–volume of fluid (CFD–DPTM–VOF) method. The influence of bubble motion on particle entrainment was described qualitatively and quantitatively. The particle–particle collisions were calculated with the direct Monte Carlo method. However, the particle collision model still needs to be verified in three-dimensional simulations. Although the success of the previous models was achieved with good agreement between the simulations and experiments, these two-dimensional simulations were still oversimplified for real multiphase flows with a three-dimensional nature. Furthermore, the sparse distribution of particles is not truly representative of the industrial situation in gas–liquid–solid fluidized beds. Liao et al. [19] coupled the volume of fluid (VOF) method with the multiphase particle in cell (MP-PIC) method to simulate bubble pair coalescence in a slurry. However, the particle’s penetration into the gas bubble was represented by the VOF method, which is not physically reasonable. Van Sint Annaland et al. [20] presented a hybrid model for the simulation of three-dimensional gas–liquid–solid flows using a combined front tracking (FT) and discrete particle (DP) approach. The hard sphere DP model was extended for the particles, and the FT model was combined for complex free surface flows. Although three-dimensional computational results were provided, revealing the particle entrainment behaviors, the coupled FT–DP simulations were mainly used for demonstration purposes and a qualitative discussion was given to illustrate the bubble-induced particle fluidization.
Compared with the CFD–VOF–DPM method, the VOF model coupled with the discrete element method (DEM) is more sophisticated and can reveal the flows in three-phase fluidized beds. The particle–particle collisions are described using the soft sphere model in DEM. Sun and Sakai [21] proposed a VOF–DEM coupled model to simulate gas–liquid–solid flows. This model was validated by the simple examples of water entry, a dam break, and a rotating tank. Pozzetti and Peters [22] developed a multiscale VOF–DEM model with a dual-grid approach to resolve the bulk scale from the fine fluid scale. Wu et al. [23] used a VOF–DEM model to study the turbulent free surface flow in a stirred mixing system. In the above VOF–DEM simulations, no bubble–particle interaction was taken into account, and only the free surface flow was simulated with particle physics. Ge et al. [24] investigated the fluid flow and particle dynamics in a Taylor flow microreactor, and the VOF–DEM model predicted the dilute particle flow well. Li et al. [25] simulated a single bubble’s behavior with a focus on bubble formation and the bubble rise velocity in gas–liquid–solid mini-fluidized beds through the VOF–DEM method. Moreover, the VOF–DEM method was used again to study the influence of the gas velocity and initial solid hold-up on the mini-fluidized beds with a bubbling flow [26]. In these mini-fluidized beds, small spherical bubbles rose along a rectilinear path in a very small channel, and the particle fluidization phenomenon was not obviously observed because of the small bubble rise velocity. Since bubble-induced particle fluidization has not been clearly elucidated, three-dimensional simulation studies are required to fully understand the underlying interaction between the particle fluidization and bubbling flow.
To reveal the influence of the bubble dynamics on particle fluidization, a continuous bubbling flow with particle motion is investigated with the three-dimensional VOF–DEM method, rather than the simple two-dimensional one. Instead of the sparsely distributed particles used in previous research, a closely packed particle bed is initially simulated to capture the onset of particle fluidization. To ensure consistency with the experiment, the dynamic process of bubble formation is also simulated. To evaluate the applicability of the VOF–DEM simulation method, an experiment is carried out to observe the bubble motion and particle fluidization. Deformed bubbles are generated with a single orifice or double orifices, and their motion trajectories in the channel are recorded by a high-speed camera. The effects of the gas inlet velocity and particle properties are numerically investigated with a focus on particle fluidization. The simulation also reveals the particle fluidization by the bubbling flow generated by two orifices.

2. Experimental Section

In order to directly observe the bubble and particle dynamics in a three-phase fluidized bed, an experimental facility is established, as shown in Figure 1. The experimental container is composed of a transparent acrylic channel with a cross-section of 8 mm × 8 mm and a height of 100 mm. The bubbles are generated by an orifice of 2.3 mm i.d. located at the bottom of the container. A gas flow is continuously supplied by a syringe pump, while liquid is added into the container at one time. By adjusting the motor speed of the pump, three gas flow rates of Q = 20, 40, and 80 mL/min are tested in the experiment. Initially, the height of the static liquid is maintained at 40 mm in each experiment. The motion of bubbles and particles is photographed and recorded via a high-speed camera (Revealer 5F04M, HF Agile Device Co., Ltd., Hefei, China) at a maximum frame rate of 1000 fps. An LED light source is used as the backlight. From the video, the average bubble rise velocity Ububble is calculated by the bubble displacement at different time intervals:
U b u b b l e = z 2 z 1 t 2 t 1
where z is the position of the bubble center, and t is the time. The experimental error of the average bubble rise velocity is determined from the deviation from the mean of the five repetitions.
The particles are composed of polymethyl methacrylate. The particle density is 1200 kg/m3, and the particle diameter is almost uniform (dp = 0.5 mm). Before the experiment, about 2500 particles are added to the channel and closely packed, corresponding to a bed height of 5 mm. After adding the particles and water in the channel, the experiment is started by supplying air through the orifice. Air (ρg = 1.2 kg/m3, μg = 1.8 × 10⁻⁵ Pa·s) and purified water (ρl = 1000 kg/m3, μL = 1 × 10⁻³ Pa·s, σ = 0.072 N/m) are used as the gas phase and liquid phase, respectively.

3. Mathematical Models

3.1. Volume of Fluid Model

The interface of the bubbles is captured based on the volume of fluid (VOF) method, which simulates a two-phase immiscible fluid by solving a set of continuity and momentum equations. Since the particles are initially closely packed, the effect of solid volume fraction αp should not be ignored in the model. The continuity equation and momentum equation are given as follows:
t α f ρ f + α f ρ f u f = 0
t α f ρ f u f + α f ρ f u f u f = α f p + α f τ + α f σ κ α f + α f ρ f g
where ρf is the fluid density, kg/m3; uf is the fluid velocity, m/s; p is the pressure, Pa; τ is the stress tensor, Pa; σ is the surface tension coefficient, N/m; κ is the mean curvature of the free interface, 1/m; αf is the volume fraction of the fluid (gas or liquid), αf = 1 − αp. In the experiment, the bubbling flow is assumed to be a laminar flow due to the small gas inlet velocity, and τ is modeled by Newton’s law of viscosity:
τ = μ f u f + u f T 2 3 μ f u f I
where µf is the molecular viscosity, Pa·s; I is the unit tensor. In the continuum surface model [27], κ is calculated by the following equation:
κ = α f α f
In the VOF model, different fluids are marked by the volume fraction, and the tracking of the phase interface is achieved by solving the continuous equation of each phase’s volume fraction in each computing unit:
α f t + α f u f = 0
where the value of αf represents the fluid state in the computing unit:
α f = 1 0 < α f < 1 0
The liquid is in the cells where αf = 1, while the gas corresponds to αf = 0. The interface is smeared over the cells where 0 < αf < 1. The properties of the fluid, such as density ρf and viscosity µf, are calculated with the weighted average value of the volume fraction of two-phase fluids:
ρ f = α f ρ l + 1 α f ρ g
μ f = α f μ l + 1 α f μ g
where l represents the liquid phase and g represents the gas phase.

3.2. Discrete Element Model

The translational and rotational motion of each individual particle are calculated with Newton’s second law [28]:
m p d u i d t = m p g + j F c , i j + F p f
I p d ω i d t = j T c , i j
where mp is the particle mass; Ip is the rotational inertia; ui is the translational velocity of the i-th particle; ωi is the angular velocity; Tc;ij is the torque that is caused by the particle collision force; Fc,ij is the particle–particle or particle–wall contact forces, which are determined by the soft sphere model [29]; Fpf is the force generated by the fluid–particle interactions, which will be explained in the following section.

3.3. Fluid–Particle Interaction

In this study, the drag force, viscous force, pressure gradient force, and bubble interface force are taken into account in the fluid–particle interactions. Fpf is expressed as follows:
F p f = F d + F p + F · τ + F i n t e r f a c e
The equation of drag force Fd is given by
F d = 1 8 π ρ f d p 2 C d u p u f u p u f
where the drag coefficient Cd is calculated with the correlation proposed by Schiller and Naumann [30]:
C d = 24 Re p 1 + 0.15 Re p 0.687 Re p < 1000 0.44 Re p 1000
Re p = ρ f u f u p d p μ f
The forces from the pressure gradient and viscous stress are calculated as
F p = V p p
F τ = V p · τ
where Vp is the particle volume.
The bubble surface region is marked with the local volume fraction αf in a computational cell. To prevent particles from penetrating into the bubble, the bubble interface is modeled according to Sun and Sakai [21]:
F i n t e r f a c e = C m p α f
where C is an empirical coefficient and it is set as 0.1 in this work.

4. Simulation Details

4.1. Geometry and Mesh

According to the geometry of the experimental container, the inside region of the channel is selected as the computational domain. Figure 2a shows the computational domain with a single orifice as a gas inlet. The cross-section of the domain with a single orifice is an 8 mm × 8 mm square. The diameter of the gas circular inlet is the same (2.3 mm i.d.) as that of the orifice in the experiment. Figure 2b shows the computational domain with two circular inlets, which is not experimentally used but is created for the simulation to investigate the effect of bubble formation from two orifices on particle fluidization. The unstructured meshes of these domains are generated with the blockMesh, surfaceFeatureExtract, and snappyHexMesh tools in OpenFOAM-5.x. First, a background mesh of hexahedral cells is created by the blockMesh tool. Second, the feature edges are extracted by the surfaceFeatureExtract tool for local mesh refinement. Finally, snappyHexMesh is executed to perform cell removal, cell splitting, and surface snapping. To sufficiently resolve the bubble surface boundary, the ratio of the bubble size to the mesh cell size is about 20. Figure 3 shows the meshes of the two computational domains, and the cell number is 245,760 and 491,583, respectively. The mesh size of the bottom surface is 0.125 mm, and the mesh inside the channel has a size of 0.25 mm.

4.2. Numerical Settings

The simulations in this study are carried out based on the VOF–DEM solver developed by Ge et al. [24] within the CFDEMcoupling framework [31], which combines the volume of fluid method of OpenFOAM with the discrete element method of LIGGGHTS. The interFoam solver in the open-source software OpenFOAM-5.x [32] is used to solve the governing equations of the gas–liquid flow, and the phase volume fraction transport equation is solved by the Multidimensional Universal Limiter with Explicit Solution (MULES) scheme. The temporal terms are discretized with the first-order Euler scheme. The convective term of the phase velocity is discretized with a second-order upwind scheme with limited gradients (linearUpwind) for numerical stability, while the convection term of the phase volume is discretized with the vanLeer scheme. The detailed numerical schemes are summarized in Table 1.
When the VOF solution is converged, the fluid–particle interactions are calculated and the open-source DEM solver LIGGGHTS [31] performs the computation of the particle motion with particle–particle or particle–wall collisions. For each VOF solution step, information exchange after 100 steps of DEM calculation is executed. The detailed settings of the VOF–DEM simulation are given in Table 2.
At the walls, the no-slip boundary condition is used for the fluid velocity. At the inlet, the fixed value boundary condition is specified for the gas inlet velocity. The other variables at the walls and inlet are specified with the zero gradient boundary condition.

5. Results and Discussion

5.1. Effect of Gas Inlet Velocity

Figure 4a presents the experimental and simulated bubble rising velocities at different gas inlet velocities (Ug = 0.08 m/s, 0.16 m/s, and 0.32 m/s). The error of the experimental results is about 5%. Compared with the experimental data, the simulated results of the bubble rising velocity are acceptable. As the gas inlet velocity increases from 0.08 m/s to 0.32 m/s, the bubble rising velocity also increases. The increase in bubble rising velocity is not particularly large. The rising bubble collides with the wall of the channel, which will reduce the rising velocity of the large bubbles at a high gas inlet velocity. For different gas inlet velocities, all bubbles rise in a zigzag trajectory, as shown in Figure 4b. During the rising process of the bubble, the bubble size also increases with the increase in the gas velocity, which can be seen from Table 3. At the same time, the number of bubbles in the channel increases with the gas inlet velocity, which is due to the larger frequency of bubble formation at a higher gas inlet velocity. The number of bubbles is also influenced by the gas inlet velocity. When the gas inlet velocity is 0.08 m/s, three bubbles exist in the channel, while a gas inlet velocity of 0.32 m/s results in six bubbles. Moreover, at a large gas inlet velocity, the simulation reveals that bubble coalescence is pronounced, as shown in Figure 5. Based on the averaged bubble rising velocity and bubble diameter, the Re number of the bubbles is determined as 600, 750, and 878, and the Eo number is 1.7, 2.6, and 3.5, respectively, for the gas inlet velocities of 0.08 m/s, 0.16 m/s, and 0.32 m/s. It is clear that the bubbles near the orifice are ellipsoidal, and wobbling bubbles are also found due to the bubble–wall collisions. In the two-dimensional bubble simulations reported in the literature [12,16], it was found that the shapes of the bubbles were symmetrical, while asymmetrical shapes were found for the bubbles in the three-dimensional simulations of this study. Compared with the particles in the mini-fluidized beds studied by Li et al. [25], in this study, both the simulation and experiment showed the obvious fluidization of the particles caused by the bubbling flow.
In Figure 6a, it is obvious that an increasing gas inlet velocity will promote the fluidization of the particles. The particles near the orifice are mainly lifted by the elastic bubble surface. In the upper region of the channel, the bubble wake plays a role, as shown in Figure 7. Compared with the wake following a single bubble reported in the literature [16], the continuous bubbling flow generates significantly more wakes in the channel. For a larger gas inlet velocity, the bubble wake becomes stronger to entrain more particles with the bubbles. Although an increasing gas inlet velocity is conducive to particle fluidization, most of the particles still stay below 0.03 m, indicating that these particles are not sufficiently fluidized, as shown in Figure 5. The maximum fluidization height is about 30 mm. The particles that are not fluidized account for 83%, 81%, and 76%, respectively, for the gas inlet velocities of 0.08 m/s, 0.16 m/s, and 0.32 m/s. Figure 6b shows the distribution of the particle velocities influenced by the gas inlet velocity. Clearly, a larger gas inlet velocity causes more particles to be fluidized.

5.2. Effect of Particle Properties

The effect of the particle number on particle fluidization is investigated, as shown in Figure 8. For different particle numbers, the bubbles still rise in a zigzag trajectory, and the bubble size does not significantly change with the particle number. Table 4 illustrates the effect of the particle number on the bubble number and bubble diameter. When the particle number is increased to 3000, the number of bubbles existing in the channel is reduced, and the bubble size becomes slightly larger. This can be explained by the bed height of the particles that are not fluidized. As shown in Figure 9, as the number of particles is increased, the particle bed is thickened, which will result in a longer time required for the bubbles to pass through the particle bed. This equivalently extends the time for bubble formation. As a result, the bubbles should become much larger to escape from the particle bed.
Figure 10 shows the distributions of the particle positions and velocities for different numbers of particles. When more particles are added into the channel, the number of suspended particles is increased. Moreover, when the particle number is increased to 3500, the percentage of unsuspended particles is obviously reduced. This is attributed to the large bubbles in the particle bed. It is seen from Figure 10b that there is no significant difference in the particle velocity for different particle numbers. This can be explained by the more frequent collisions of suspended particles.
Figure 11 shows the distributions of the particle positions and velocities for different particle densities. When the particle density is larger, it is more difficult to fluidize the heavy particles. As can be seen from Table 5, with the increase in the particle density, the size of the bubble does not change significantly. As the particle density increases, the mass of a single particle increases, and the resistance force acting on the bubble also becomes stronger. Therefore, as shown in Figure 12, for the bed with particles having a large density, the bubbles experience a stronger resistance force from the particles and they take a longer time to pass through the particle bed. Similarly, the frequency of bubble formation becomes smaller, and therefore the number of bubbles existing in the channel is smaller. As a result, the bubble size becomes larger due to the extended time of bubble formation in the bed.
The distributions of the particle positions and velocities influenced by different particle densities are presented in Figure 13. As the particle density is increased, the percentage of suspended particles is decreased. Moreover, the particles are fluidized to reach a maximum height of about 30 mm. In Figure 13b, it is interestingly shown that when the particle density is increased, more particles have large velocities. The heavy particles can exert stronger gravitational forces on the elastic bubble surface. The stronger elastic deformation of the bubbles will result in a larger velocity in the particles.
Figure 14 shows the effects of different particle sizes (dp = 0.3 mm, 0.5 mm, and 0.7 mm) on the bubble behavior and particle suspension. To keep the height of particle bed at about 5 mm, the number of particles in the beds is 13,888, 2500, and 1000, respectively, when adding the particles with the three diameters (dp = 0.3 mm, 0.5 mm, and 0.7 mm). It is seen that the small particle of dp = 0.3 mm can be easily fluidized by the bubbling flow. The fine particles are more susceptible to the action of bubbles or bubble wakes and are more likely to be suspended than the large particles. This finding is consistent with that in the study of Bo et al. [18]. However, there are still a large number of particles packed at the bed bottom. The percentage of suspended particles is not increased, which is also shown in Figure 15. It is found from Table 6 and Figure 14 that when the particle diameter is increased to 0.7 mm, there are very large bubbles in the channel. The large bubbles are formed due to the bubbles’ coalescence, which is indicated in Figure 16.

5.3. Bubbling Flow Generated by Two Orifices

As discussed above, the fluidization of particles is strongly dependent on the bubbling flow. Therefore, the bubbling flow generated by two orifices is simulated for a comparison with that generated by a single orifice. The cross-sectional area of the computational domain is two times larger than that with a single orifice, as shown in Figure 2. The particle beds have the same height as the beds in the above simulations. Figure 17 presents the comparison of these two scenarios for three different gas inlet velocities. From Figure 17, it is difficult to qualitatively judge the differences in particle fluidization. For the two-orifice bubbling flow, there are still many particles packed at the bottom. For the large channel, the increase in the bubble number does not significantly improve the particle fluidization. The quantitative results of the particle positions and velocities are provided in Figure 18. Although the improvement in particle fluidization is not significant, the use of two orifices indeed can move slightly more particles upward in the channel. At the gas inlet velocities of 0.16 m/s and 0.32 m/s, the percentage of particles with a large velocity is increased. This is because the increased bubble number results in a greater possibility of bubble–particle collision.

6. Conclusions

This study focuses on the three-dimensional simulation of particle fluidization induced by a continuous bubbling flow in a gas–liquid–solid fluidized bed. The simulations of the three-phase flow are carried out using the VOF–DEM coupling method. Instead of studying the bubble wakes, the bubble-induced particle fluidization is thoroughly discussed. By using the three-dimensional model, the dynamic changes in the bubble shape and trajectory are well captured. The bubbling flow with a closely packed particle bed is simulated to capture the onset of particle fluidization. By experimental validation, it is found that the three-dimensional VOF–DEM model can reliably simulate gas–liquid–solid flows. The effects of the gas inlet velocity, particle properties, and two-orifice bubbling flow on the bubble behavior and particle fluidization are investigated. The current study will be helpful to guide the process intensification of gas–liquid–solid fluidized bed reactors. The main conclusions are given as follows.
(1) The gas inlet velocity plays a role in controlling bubble formation and particle fluidization. By increasing the gas inlet velocity, the fluidization of the particles can be enhanced by the bubble–particle interaction and bubble wake. The continuous bubbling flow generates considerably more wakes in the channel. However, the method of solely increasing the gas inlet velocity cannot effectively realize the excellent fluidization of the particles.
(2) When more particles are added into the channel, the higher bed will result in a longer time required for the bubbles to pass through the bed. The increase in the particle density also extends the time required for the bubbles to leave the bed. It is more difficult to fluidize particles with a larger density. When adding more particles into the channel, the percentage of suspended particles is not significantly changed. For finer particles, the percentage of suspended particles is not increased.
(3) If the same channel region is used for fluidization, the bubbling flow generated by two orifices only causes slightly more particles to be suspended. There are still many particles packed at the bottom. The frequent bubble–particle collisions can contribute to the increase in particle velocity.
In a future study, the bubble–particle interaction should be further investigated with more sophisticated models to capture the attachment and detachment of the particles on the bubble surface. For example, the attachment of particles to bubbles plays a key role in mineral flotation processes.

Author Contributions

Conceptualization, Y.L.; methodology, L.L.; validation, M.Z.; investigation, L.L. and R.W.; writing—original draft preparation, L.L. and M.Z.; writing—review and editing, Y.L.; supervision, Y.L.; project administration, Y.L.; funding acquisition, Y.L. All authors have read and agreed to the published version of the manuscript.

Funding

This research was funded by the National Natural Science Foundation of China, grant number 22278212.

Data Availability Statement

The data supporting the findings of this study are available within the article.

Conflicts of Interest

The authors declare no conflicts of interest.

Nomenclature

CModel coefficient (−-)
CdDrag coefficient (−)
dbubbleBubble diameter (mm)
dpParticle diameter (mm)
FpPressure gradient force (N)
F∇·τViscous stress force (N)
FinterfaceBubble interface force (N)
Fc,ijParticle–particle or particle–wall contact forces (N)
FdDrag force (N)
gGravitational acceleration (m/s2)
IUnit tensor (−)
IpRotational inertia (kg·m2)
mpParticle mass (kg)
NpParticle number (−)
NbubbleBubble number (−)
pPressure (Pa)
Tc,ijTorque (N·m)
tTime (s)
UgGas inlet velocity (m/s)
UbubbleAverage bubble rise velocity (m/s)
ufFluid velocity (m/s)
VpParticle volume (m3)
zPosition in z-direction (m)
Greek letters
ρDensity (kg/m3)
μViscosity (Pa·s)
σSurface tension coefficient (N/m)
αpSolid volume fraction (−)
τStress tensor (Pa)
κMean curvature of free interface (1/m)
uiTranslational velocity of i-th particle (m/s)
ωiAngular velocity (rad/s)
Subscripts
fFluid
gGas phase
lLiquid phase
pParticle

References

  1. Dayan, A.; Zalmanovich, S. Axial dispersion and entrainment of particles in wakes of bubbles. Chem. Eng. Sci. 1982, 37, 1253–1257. [Google Scholar] [CrossRef]
  2. Miyahara, T.; Tsuchiya, K.; Fan, L.S. Mechanism of Particle Entrainment in a Gas-Liquid-Solid Fluidized-Bed. AIChE J. 1989, 35, 1195–1198. [Google Scholar] [CrossRef]
  3. Yang, G.Q.; Du, B.; Fan, L.S. Bubble formation and dynamics in gas-liquid-solid fluidization—A review. Chem. Eng. Sci. 2007, 62, 2–27. [Google Scholar] [CrossRef]
  4. Li, Y.J.; Liu, M.Y.; Li, X.N. Single bubble behavior in gas-liquid-solid mini-fluidized beds. Chem. Eng. J. 2016, 286, 497–507. [Google Scholar] [CrossRef]
  5. Pan, H.; Chen, X.Z.; Liang, X.F.; Zhu, L.T.; Luo, Z.H. CFD simulations of gas-liquid-solid flow in fluidized bed reactors—A review. Powder Technol. 2016, 299, 235–258. [Google Scholar] [CrossRef]
  6. Panneerselvam, R.; Savithri, S.; Surender, G.D. CFD simulation of hydrodynamics of gas-liquid-solid fluidised bed reactor. Chem. Eng. Sci. 2009, 64, 1119–1135. [Google Scholar] [CrossRef]
  7. Hamidipour, M.; Chen, J.W.; Larachi, F. CFD study on hydrodynamics in three-phase fluidized beds-Application of turbulence models and experimental validation. Chem. Eng. Sci. 2012, 78, 167–180. [Google Scholar] [CrossRef]
  8. Liu, Y.J.; Guo, S.B.; Zhu, J.X. Euler multiphase-CFD simulation on a bubble-driven gas-liquid-solid fluidized bed. Can. J. Chem. Eng. 2023, 101, 4255–4269. [Google Scholar] [CrossRef]
  9. Zhu, L.; Song, Y.F.; Chen, H.W.; Hu, X.X.; Zhao, C.; Ai, T.C.; Liu, Z.; Wei, X. Hydrodynamic characteristics of central pulse gas-liquid-solid circulating fluidized bed: Effect of gas and solid parameters. Powder Technol. 2023, 429, 118922. [Google Scholar] [CrossRef]
  10. Zhu, L.; Chen, H.W.; Song, Y.F.; Shi, R.P.; Liu, Z.; Wei, X.; Zhao, C.; Ai, T.C. Study on flow characteristics of gas-liquid-solid circulating fluidized bed with central sinusoidal pulsating flow. Powder Technol. 2023, 421, 118415. [Google Scholar] [CrossRef]
  11. Li, Y.; Zhang, J.; Fan, L. Numerical simulation of gas-liquid-solid fluidization systems using a combined CFD-VOF-DPM method: Bubble wake behavior. Chem. Eng. Sci. 1999, 54, 5101–5107. [Google Scholar] [CrossRef]
  12. Zhang, J.; Li, Y.; Fan, L.S. Discrete phase simulation of gas-liquid-solid fluidization systems: Single bubble rising behavior. Powder Technol. 2000, 113, 310–326. [Google Scholar] [CrossRef]
  13. Zhang, J.; Li, Y.; Fan, L.S. Numerical studies of bubble and particle dynamics in a three-phase fluidized bed at elevated pressures. Powder Technol. 2000, 112, 46–56. [Google Scholar] [CrossRef]
  14. Li, Y.; Yang, G.Q.; Zhang, J.P.; Fan, L.S. Numerical studies of bubble formation dynamics in gas-liquid-solid fluidization at high pressures. Powder Technol. 2001, 116, 246–260. [Google Scholar] [CrossRef]
  15. Liu, Q.; Luo, Z. CFD-VOF-DPM simulations of bubble rising and coalescence in low hold-up particle-liquid suspension systems. Powder Technol. 2018, 339, 459–469. [Google Scholar] [CrossRef]
  16. Zhang, W.; Chen, X.L.; Pan, W.T.; Xu, J.L. Numerical simulation of wake structure and particle entrainment behavior during a single bubble ascent in liquid-solid system. Chem. Eng. Sci. 2022, 253, 117573. [Google Scholar] [CrossRef]
  17. Zhang, W.; Wang, T.; Zhou, S.Y.; Tang, L.F.; Chen, X.L.; Xu, J.L. Numerical study of bubble breakup behavior enhancement and influence on particle entrainment by wake. Chem. Eng. Sci. 2022, 261, 117966. [Google Scholar] [CrossRef]
  18. Bo, Y.X.; Wu, X.; Zhou, Y.H.; Wei, N.; Liu, P. CFD-DPTM-VOF numerical simulation of particle motion and entrainment under the action of single and double bubbles. Flow Meas. Instrum. 2022, 85, 102156. [Google Scholar] [CrossRef]
  19. Liao, Y.; Wang, Q.; Caliskan, U.; Miskovic, S. Investigation of particle effects on bubble coalescence in slurry with a chimera MP-PIC and VOF coupled method. Chem. Eng. Sci. 2023, 265, 118174. [Google Scholar] [CrossRef]
  20. van Sint Annaland, M.S.; Deen, N.G.; Kuipers, J.A.M. Numerical simulation of gas-liquid-solid flows using a combined front tracking and discrete particle method. Chem. Eng. Sci. 2005, 60, 6188–6198. [Google Scholar] [CrossRef]
  21. Sun, X.; Sakai, M. Three-dimensional simulation of gas–solid–liquid flows using the DEM–VOF method. Chem. Eng. Sci. 2015, 134, 531–548. [Google Scholar] [CrossRef]
  22. Pozzetti, G.; Peters, B. A multiscale DEM-VOF method for the simulation of three-phase flows. Int. J. Multiph. Flow 2018, 99, 186–204. [Google Scholar] [CrossRef]
  23. Wu, L.; Gong, M.; Wang, J. Development of a DEM-VOF model for the turbulent free-surface flows with particles and its application to stirred mixing system. Ind. Eng. Chem. Res. 2018, 57, 1714–1725. [Google Scholar] [CrossRef]
  24. Ge, L.; Peng, Z.; Moreno-Atanasio, R.; Doroodchi, E.; Evans, G.M. Three-dimensional VOF-DEM model for simulating particle dynamics in the liquid slugs of a vertical gas-liquid-solid Taylor flow microreactor. Ind. Eng. Chem. Res. 2020, 59, 7965–7981. [Google Scholar] [CrossRef]
  25. Li, X.N.; Liu, M.Y.; Dong, T.T.; Yao, D.; Ma, Y.L. VOF-DEM simulation of single bubble behavior in gas-liquid-solid mini-fluidized bed. Chem. Eng. Res. Des. 2020, 155, 108–122. [Google Scholar] [CrossRef]
  26. Li, X.N.; Hao, Y.; Zhao, P.; Fan, M.F.; Song, S.L. Simulation study on the phase holdup characteristics of the gas-liquid-solid mini-fluidized beds with bubbling flow. Chem. Eng. J. 2022, 427, 131488. [Google Scholar] [CrossRef]
  27. Brackbill, J.U.; Kothe, D.B.; Zemach, C. A continuum method for modeling surface tension. J. Comput. Phys. 1992, 100, 335–354. [Google Scholar] [CrossRef]
  28. Zhu, H.P.; Zhou, Z.Y.; Yang, R.Y.; Yu, A.B. Discrete particle simulation of particulate systems: A review of major applications and findings. Chem. Eng. Sci. 2008, 63, 5728–5770. [Google Scholar] [CrossRef]
  29. Cundall, P.A.; Strack, O.D.L. A discrete numerical model for granular assemblies. Geotechnique 1980, 30, 335–336. [Google Scholar] [CrossRef]
  30. Schiller, L.; Naumann, Z. Über die grundlegenden Berechnungen bei der Schwerkraftaufbereitung. Z. Ver. Deutsch. Ing. 1935, 77, 318–320. [Google Scholar]
  31. Kloss, C.; Goniva, C.; Hager, A.; Amberger, S.; Pirker, S. Models, algorithms and validation for opensource DEM and CFD-DEM. Prog. Comput. Fluid Dyn. Int. J. 2012, 12, 140–152. [Google Scholar] [CrossRef]
  32. Weller, H.G.; Tabor, G.; Jasak, H.; Fureby, C. A tensorial approach to computational continuum mechanics using object-oriented techniques. Comput. Phys. 1998, 12, 620–631. [Google Scholar] [CrossRef]
Figure 1. Schematic of the experimental setup.
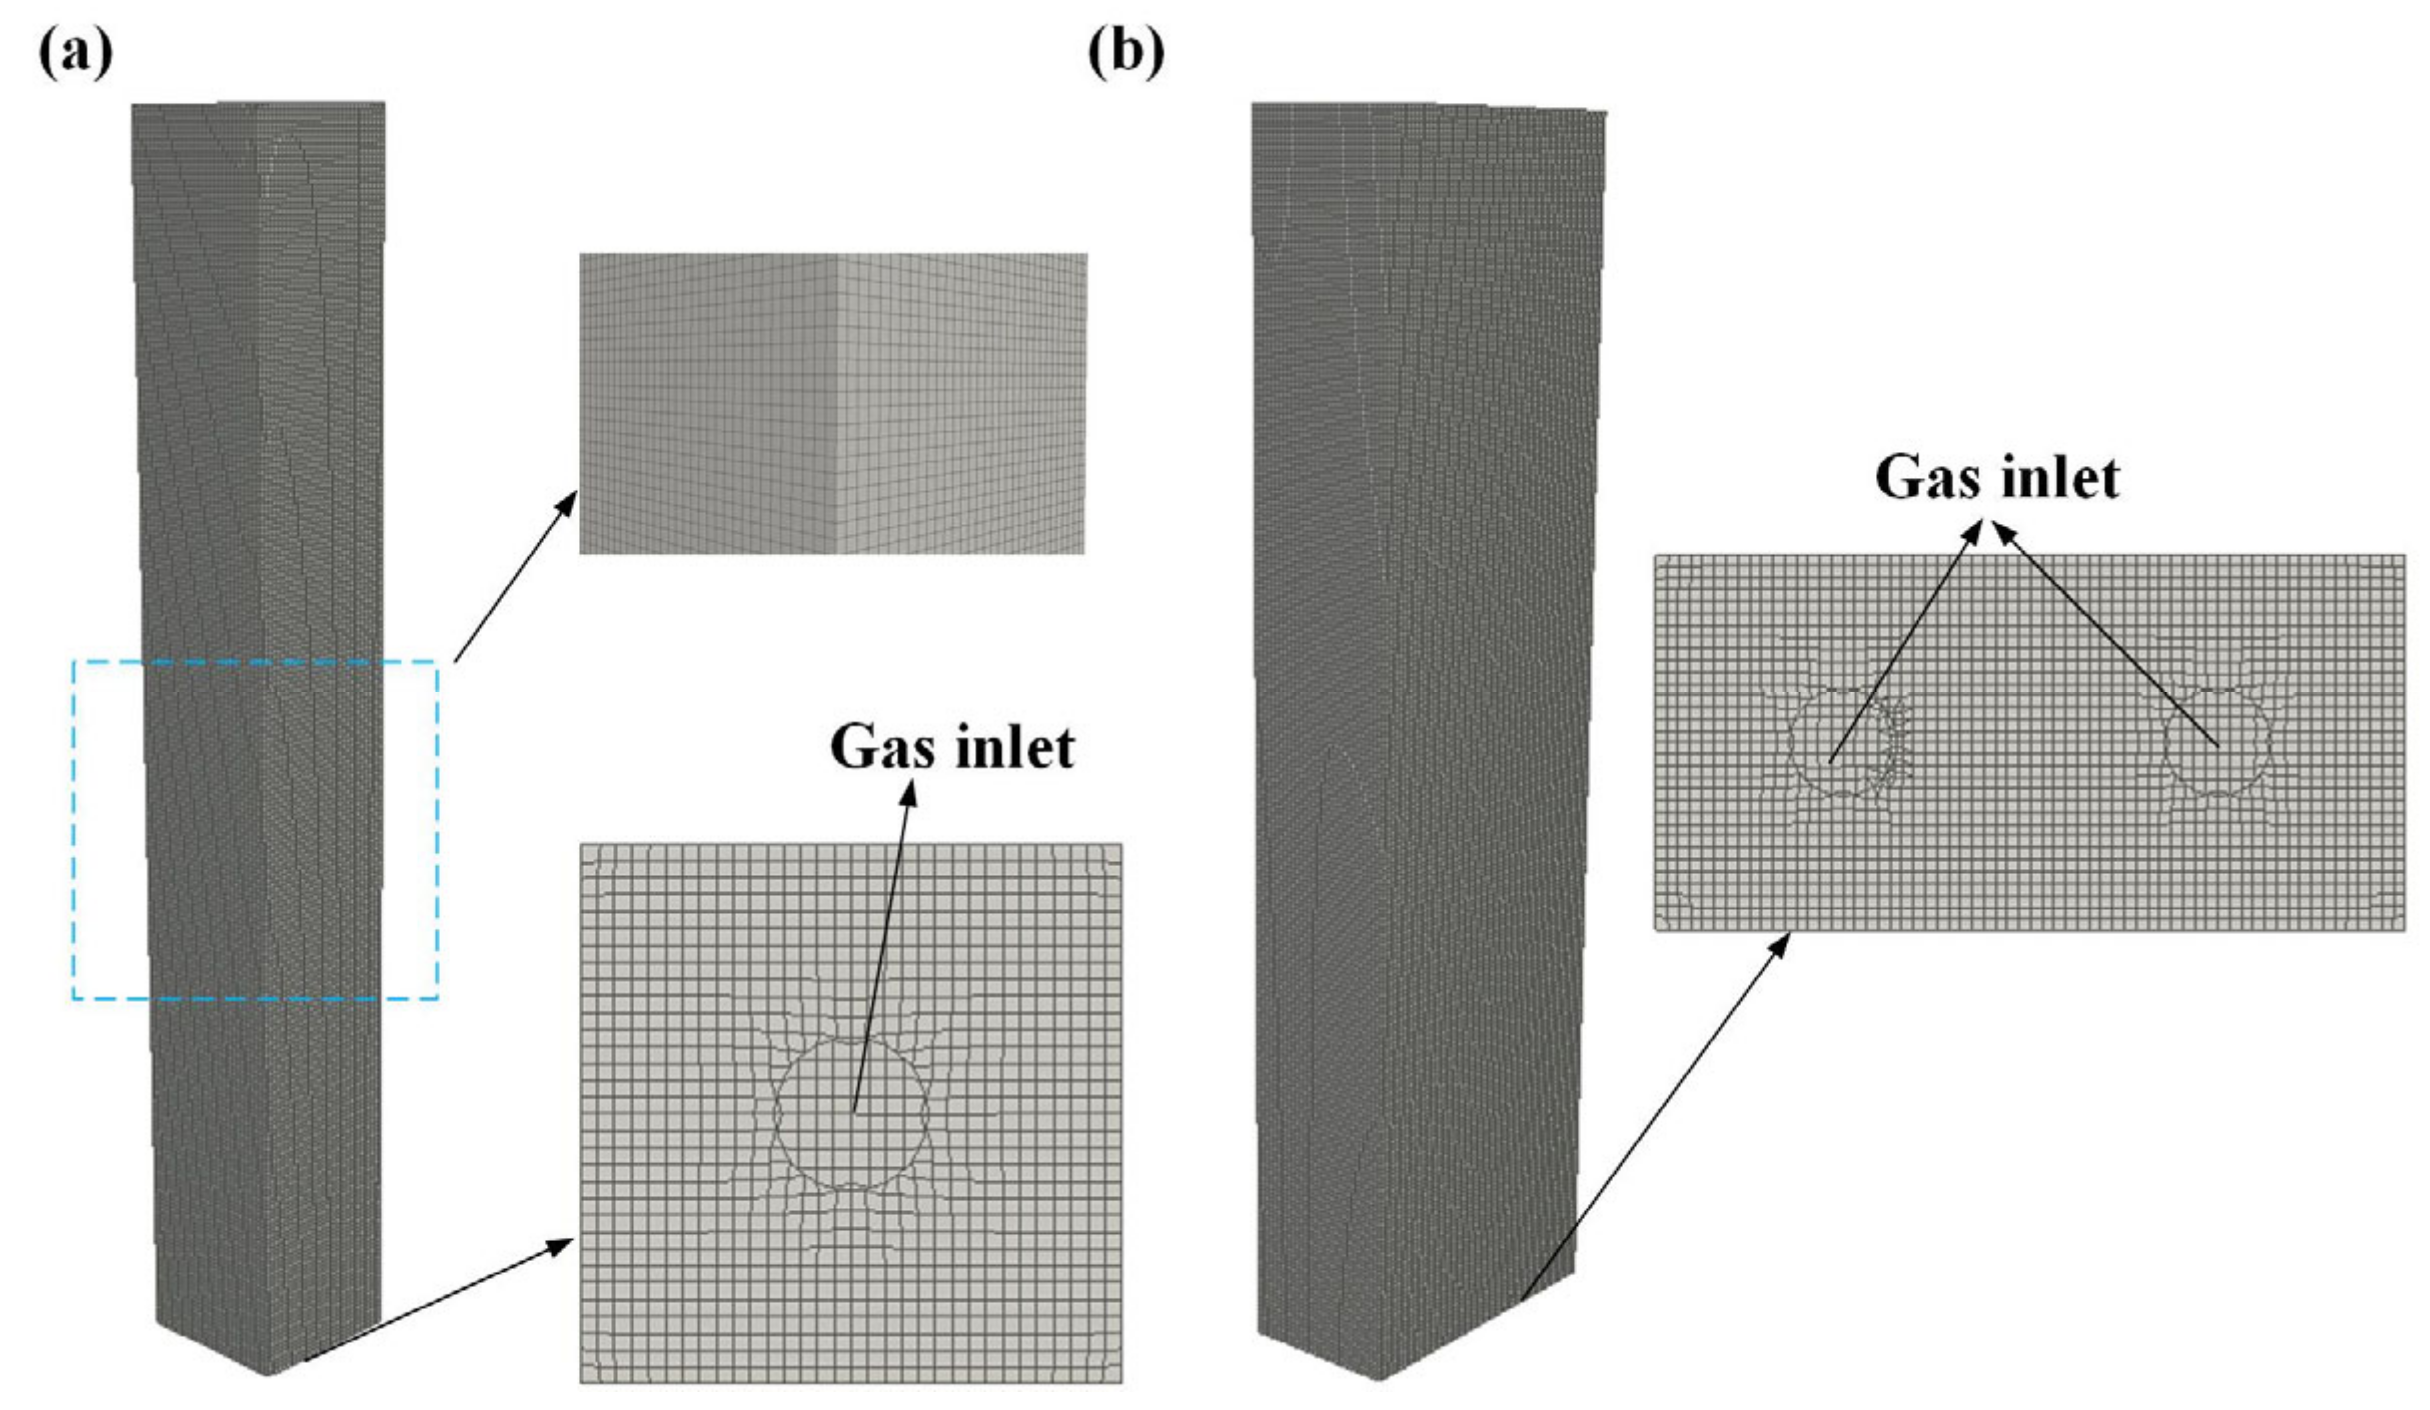
Processes 12 01053 g001
Figure 2. The computational domains. (a) The domain with a single orifice, (b) The domain with two orifices.
Processes 12 01053 g002
Figure 3. The computational meshes. (a) The mesh of the domain with a single orifice, (b) The mesh of the domain with two orifices.
Processes 12 01053 g003
Figure 4. (a) Comparison of experimental and simulated bubble rising velocity at different gas inlet velocities; (b) simulated and experimental snapshots of bubbles and particles (ρp = 1200 kg/m3, Np = 2500, dp = 0.5 mm).
Processes 12 01053 g004
Figure 5. Snapshots of the bubbles and particles at the gas inlet velocity of 0.32 m/s at different times (ρp = 1200 kg/m3, Np = 2500, dp = 0.5 mm).
Processes 12 01053 g005
Figure 6. The histograms of the (a) particle positions and (b) particle velocities (ρp = 1200 kg/m3, Np = 2500, dp = 0.5 mm).
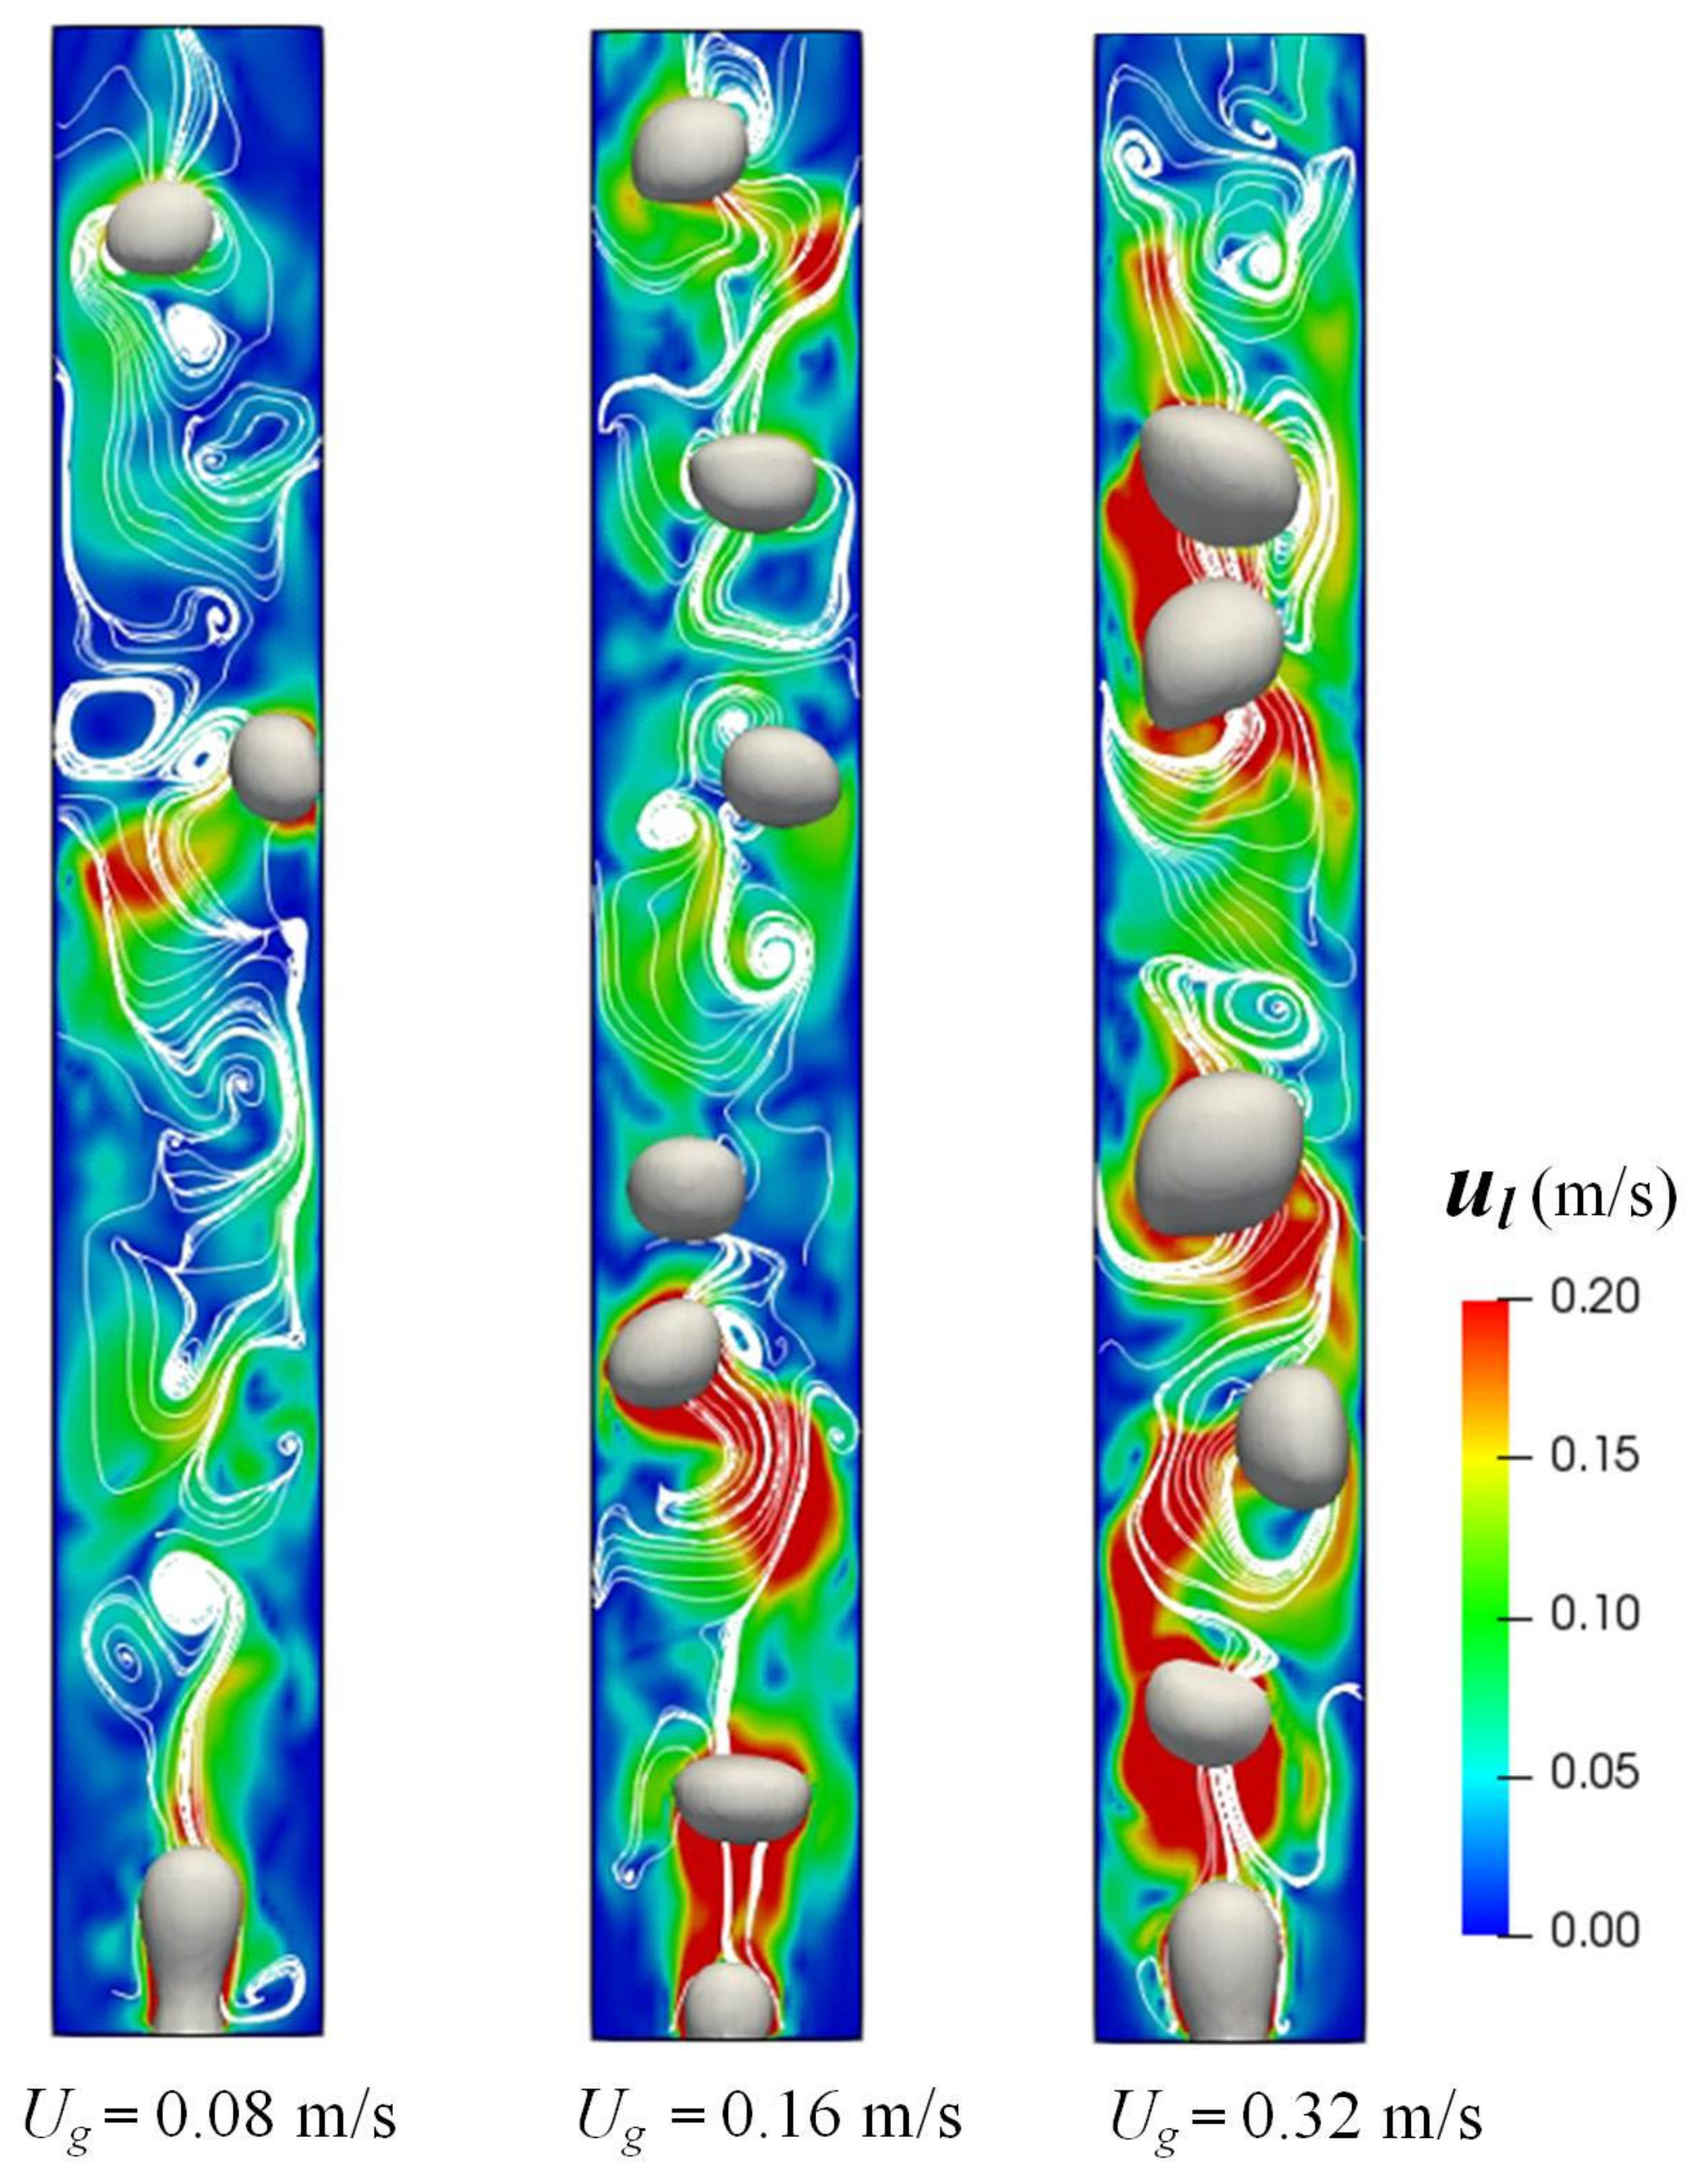
Processes 12 01053 g006
Figure 7. The liquid streamlines and liquid velocity fields at t = 1 s.
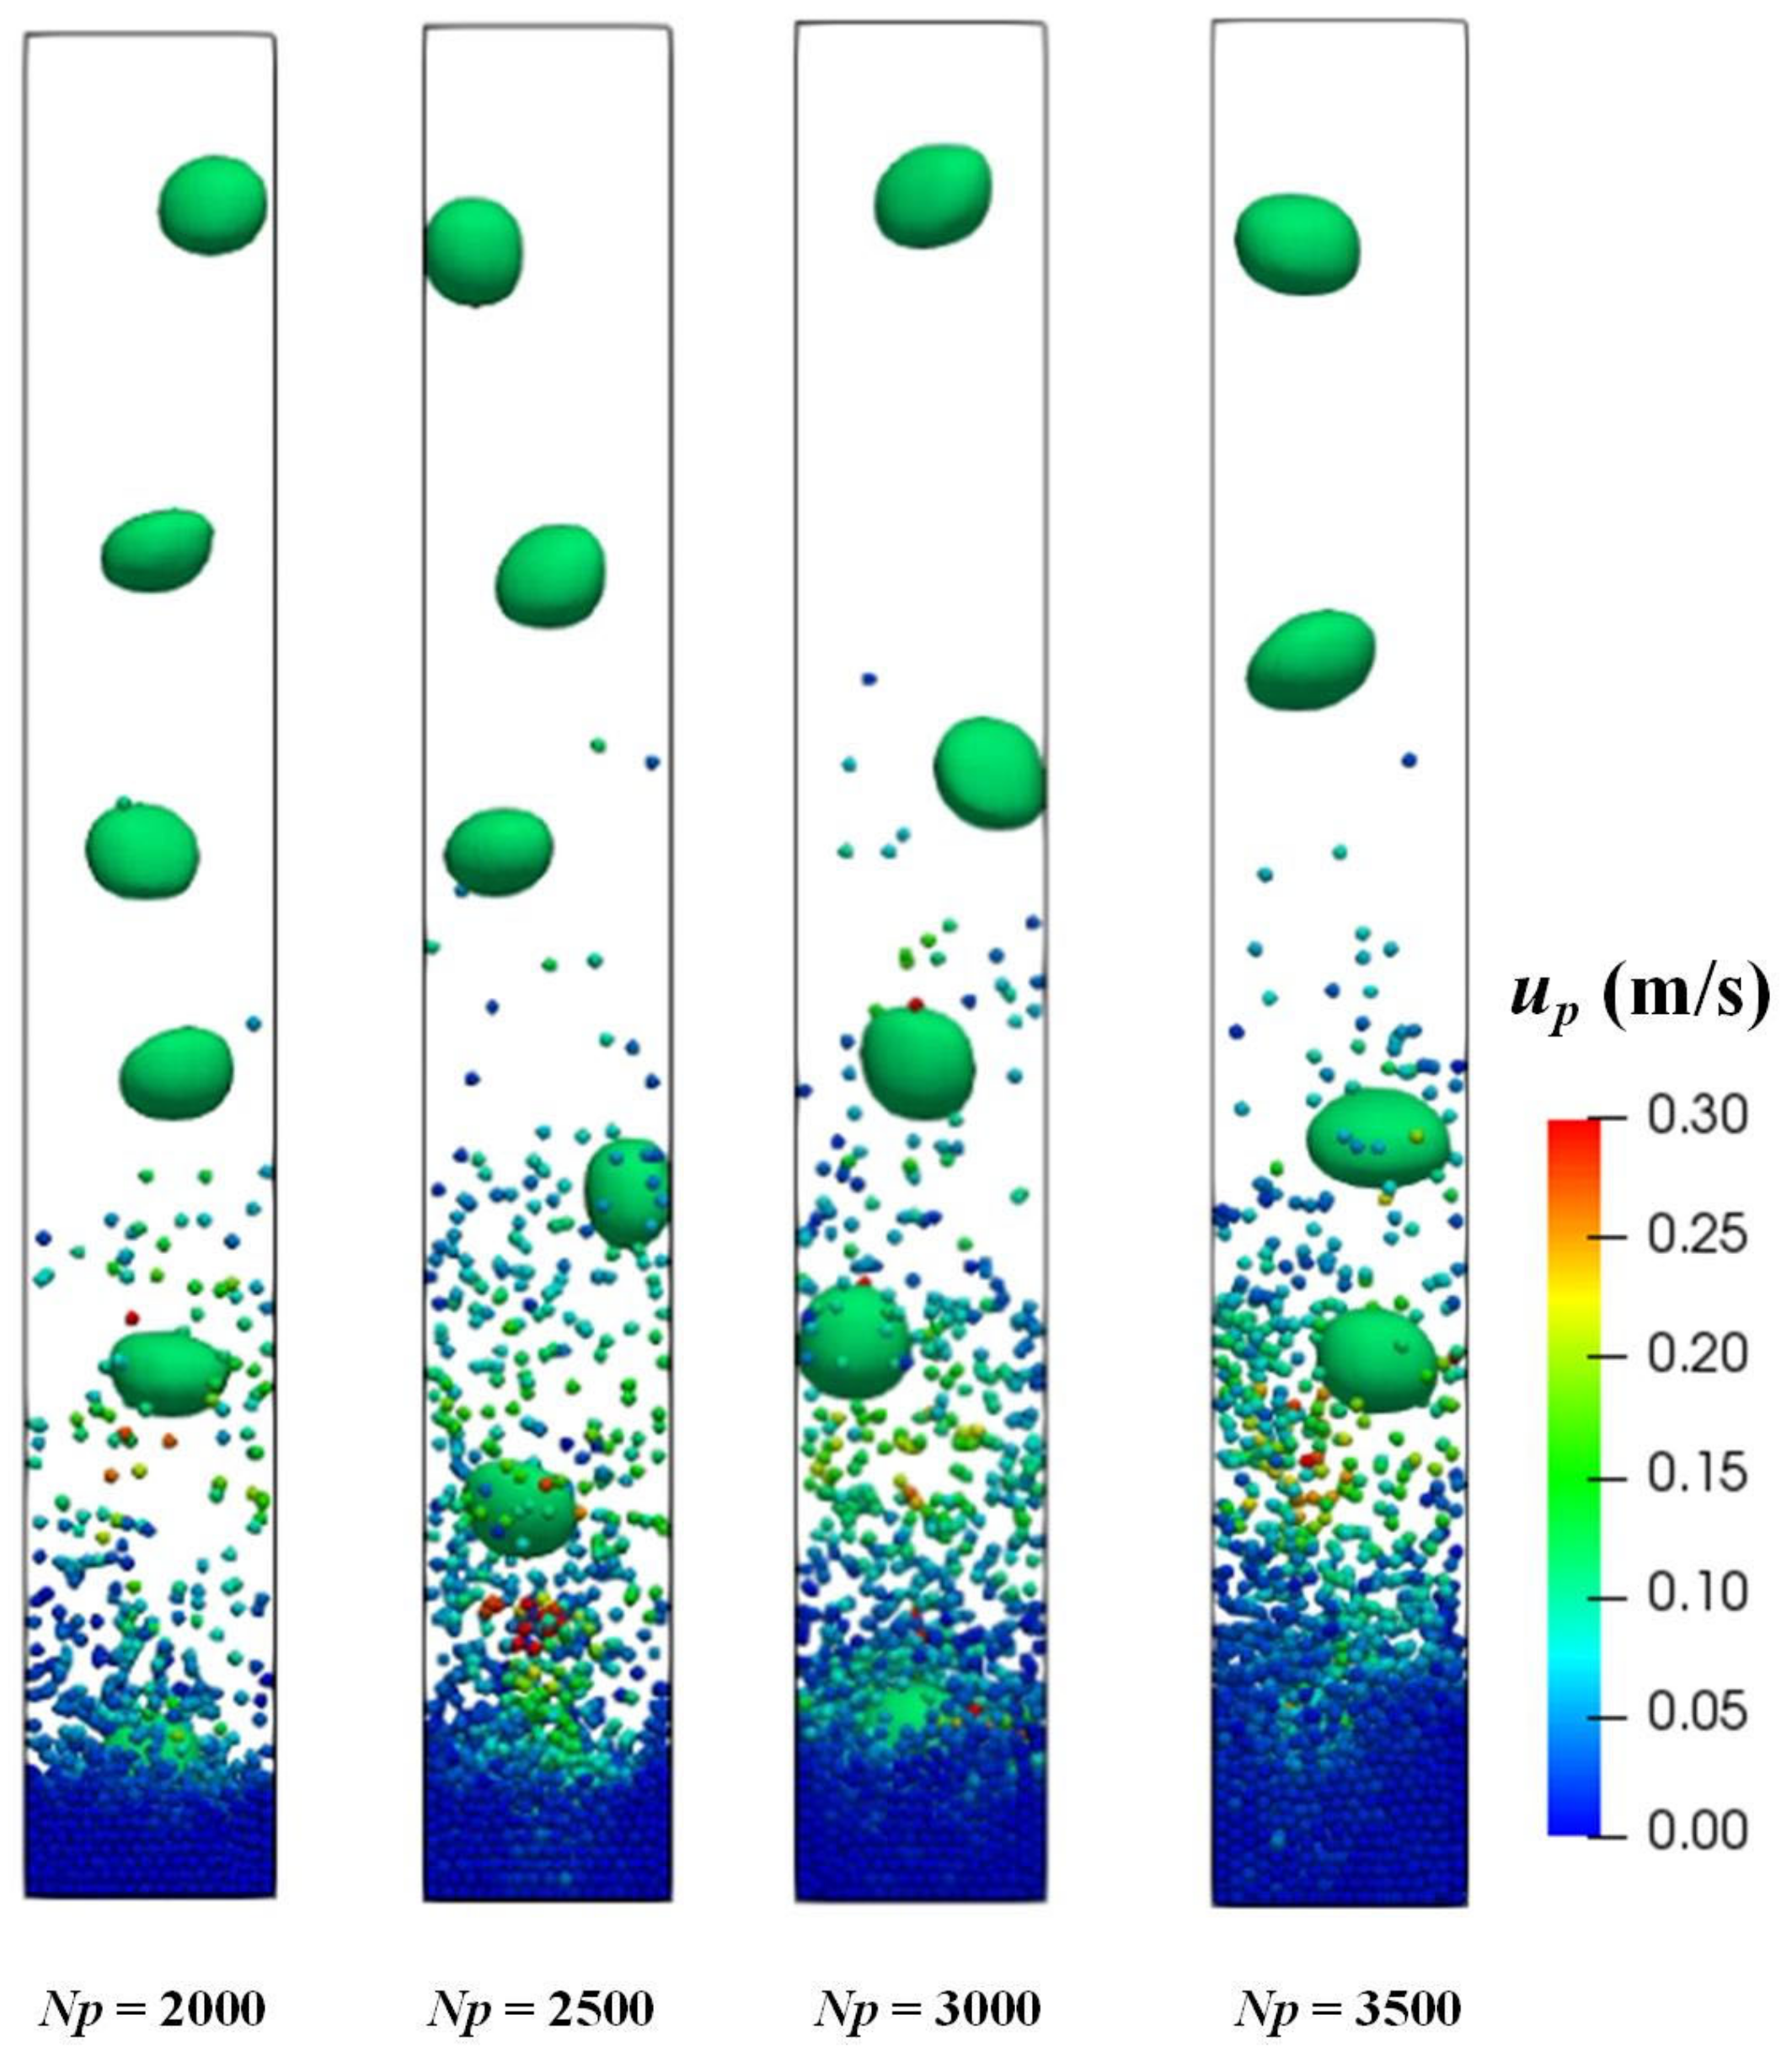
Processes 12 01053 g007
Figure 8. Snapshots of bubbles and particles in beds with different particle numbers (ρp = 1200 kg/m3, Ug = 0.16 m/s, dp = 0.5 mm).
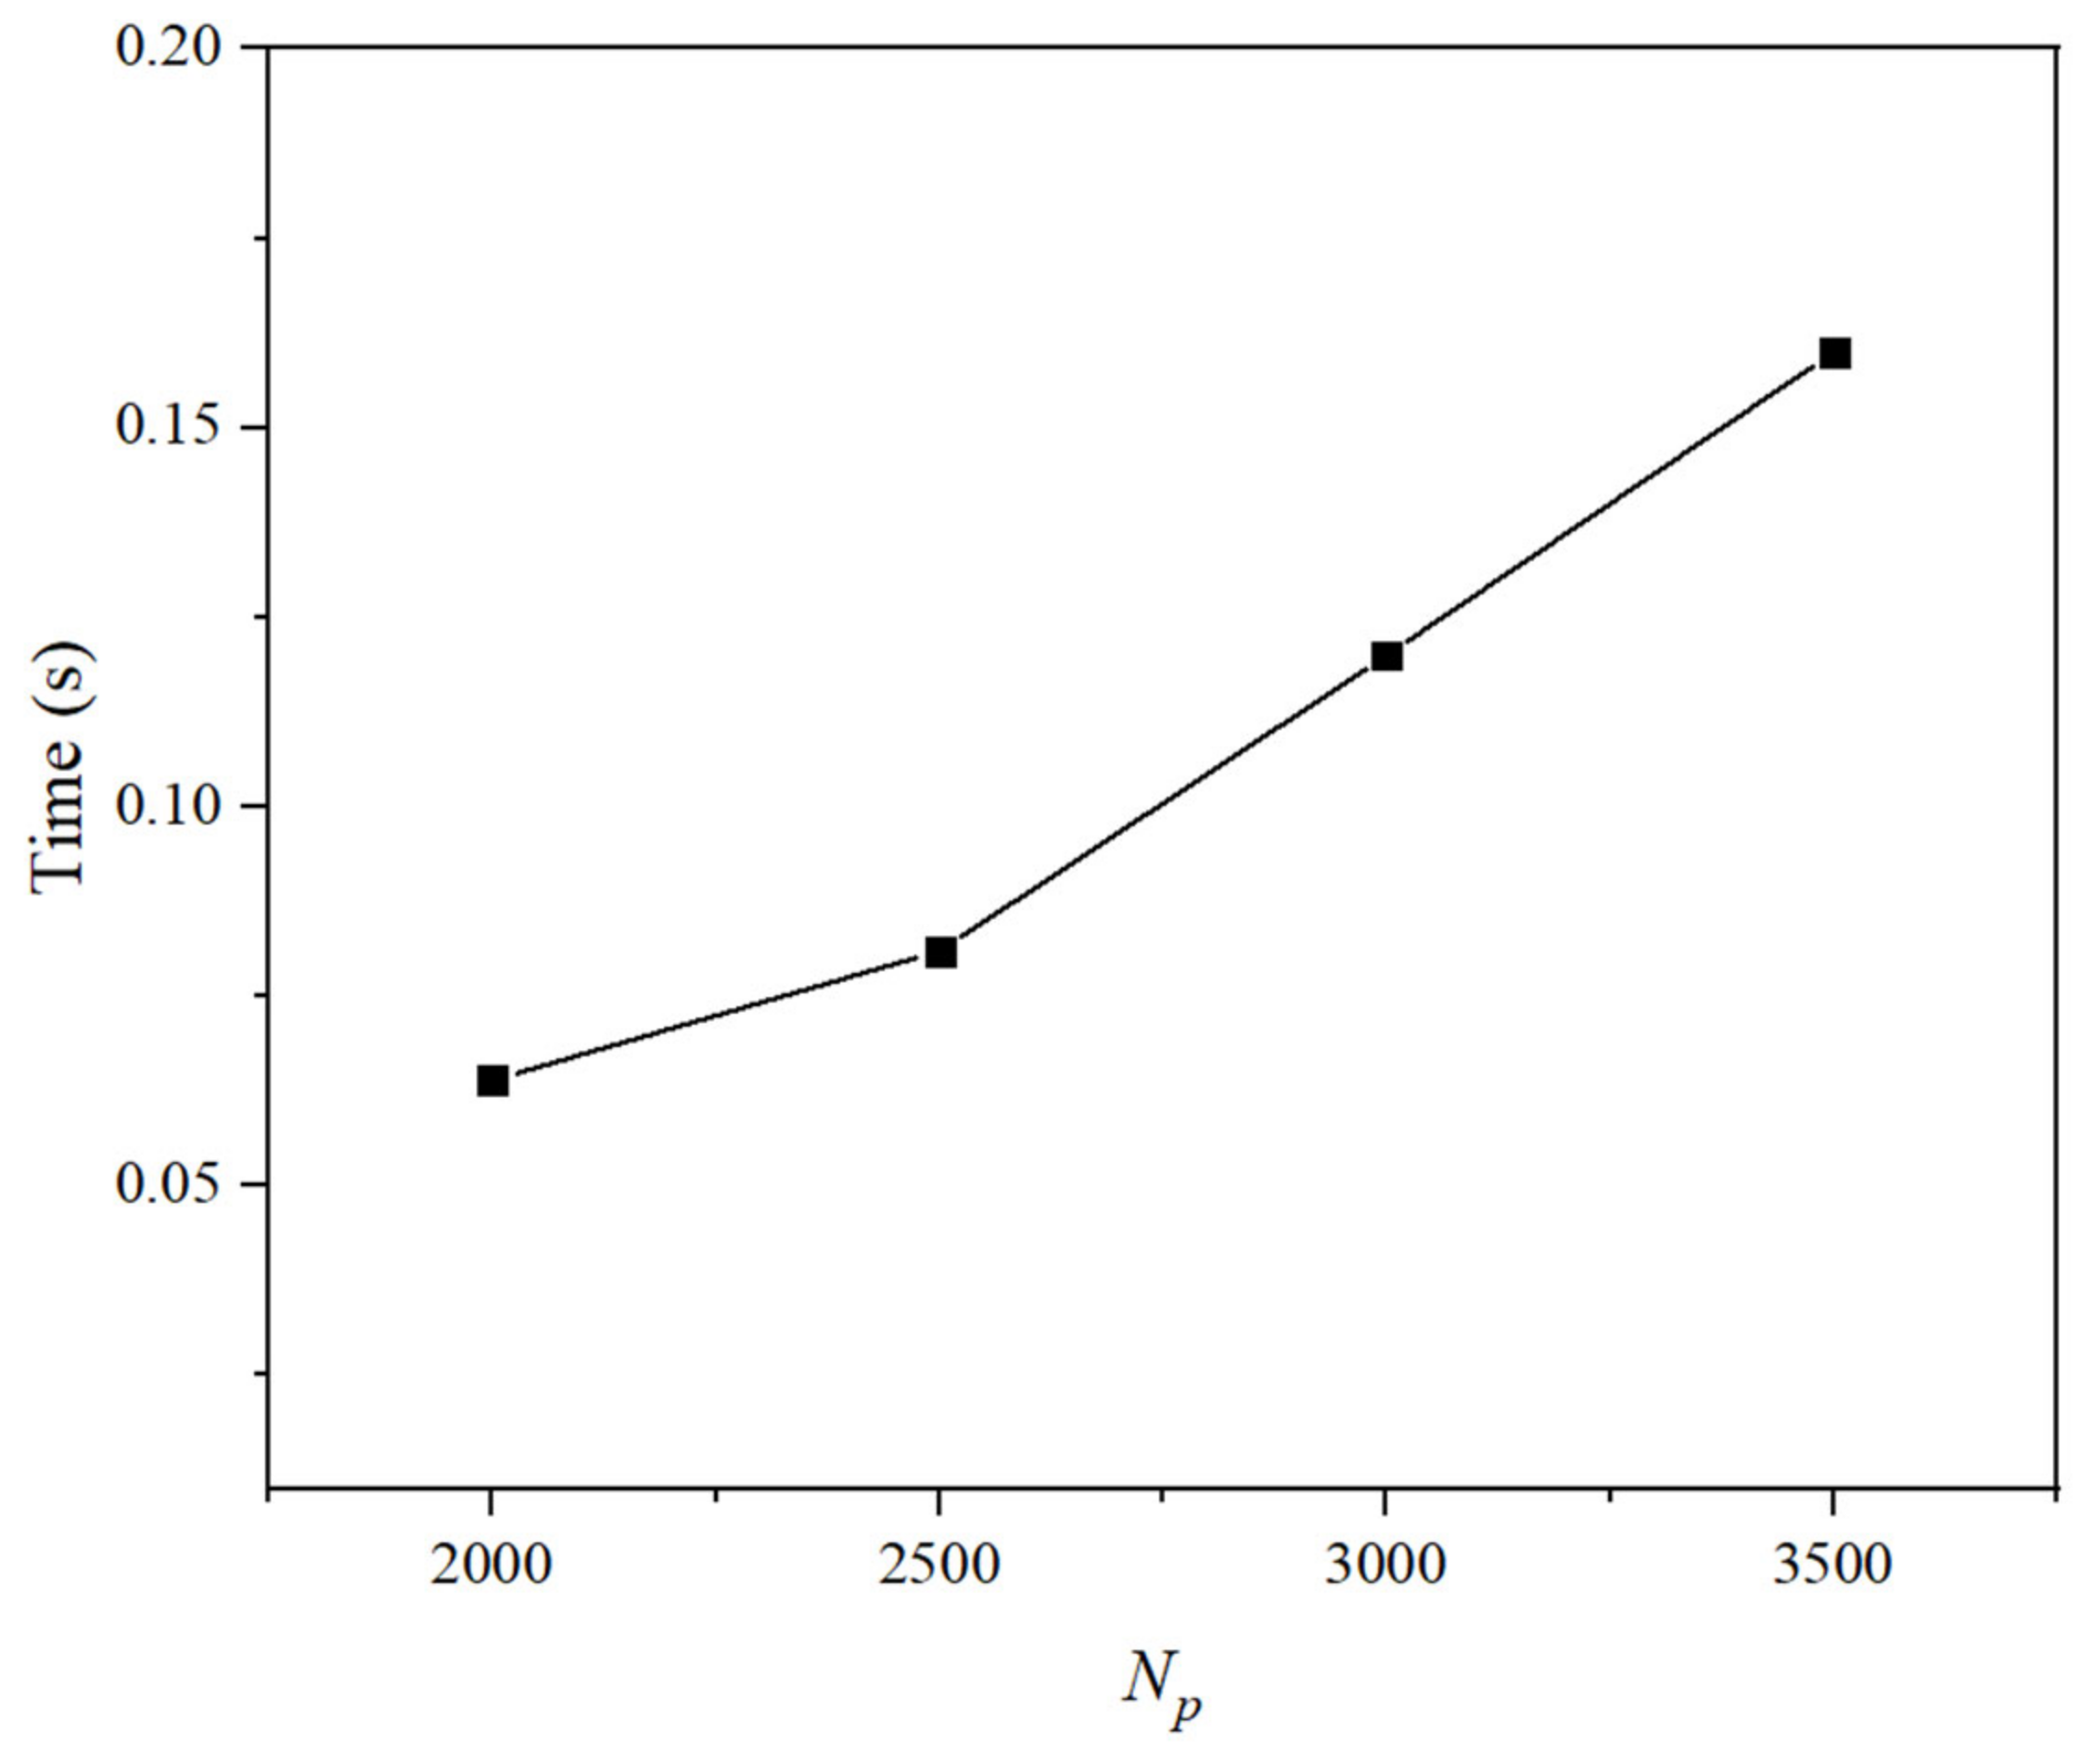
Processes 12 01053 g008
Figure 9. Time required for bubbles to pass through particle beds with different particle numbers.
Processes 12 01053 g009
Figure 10. The histograms of the (a) particle positions and (b) particle velocities (ρp = 1200 kg/m3, Ug = 0.16 m/s, dp = 0.5 mm).
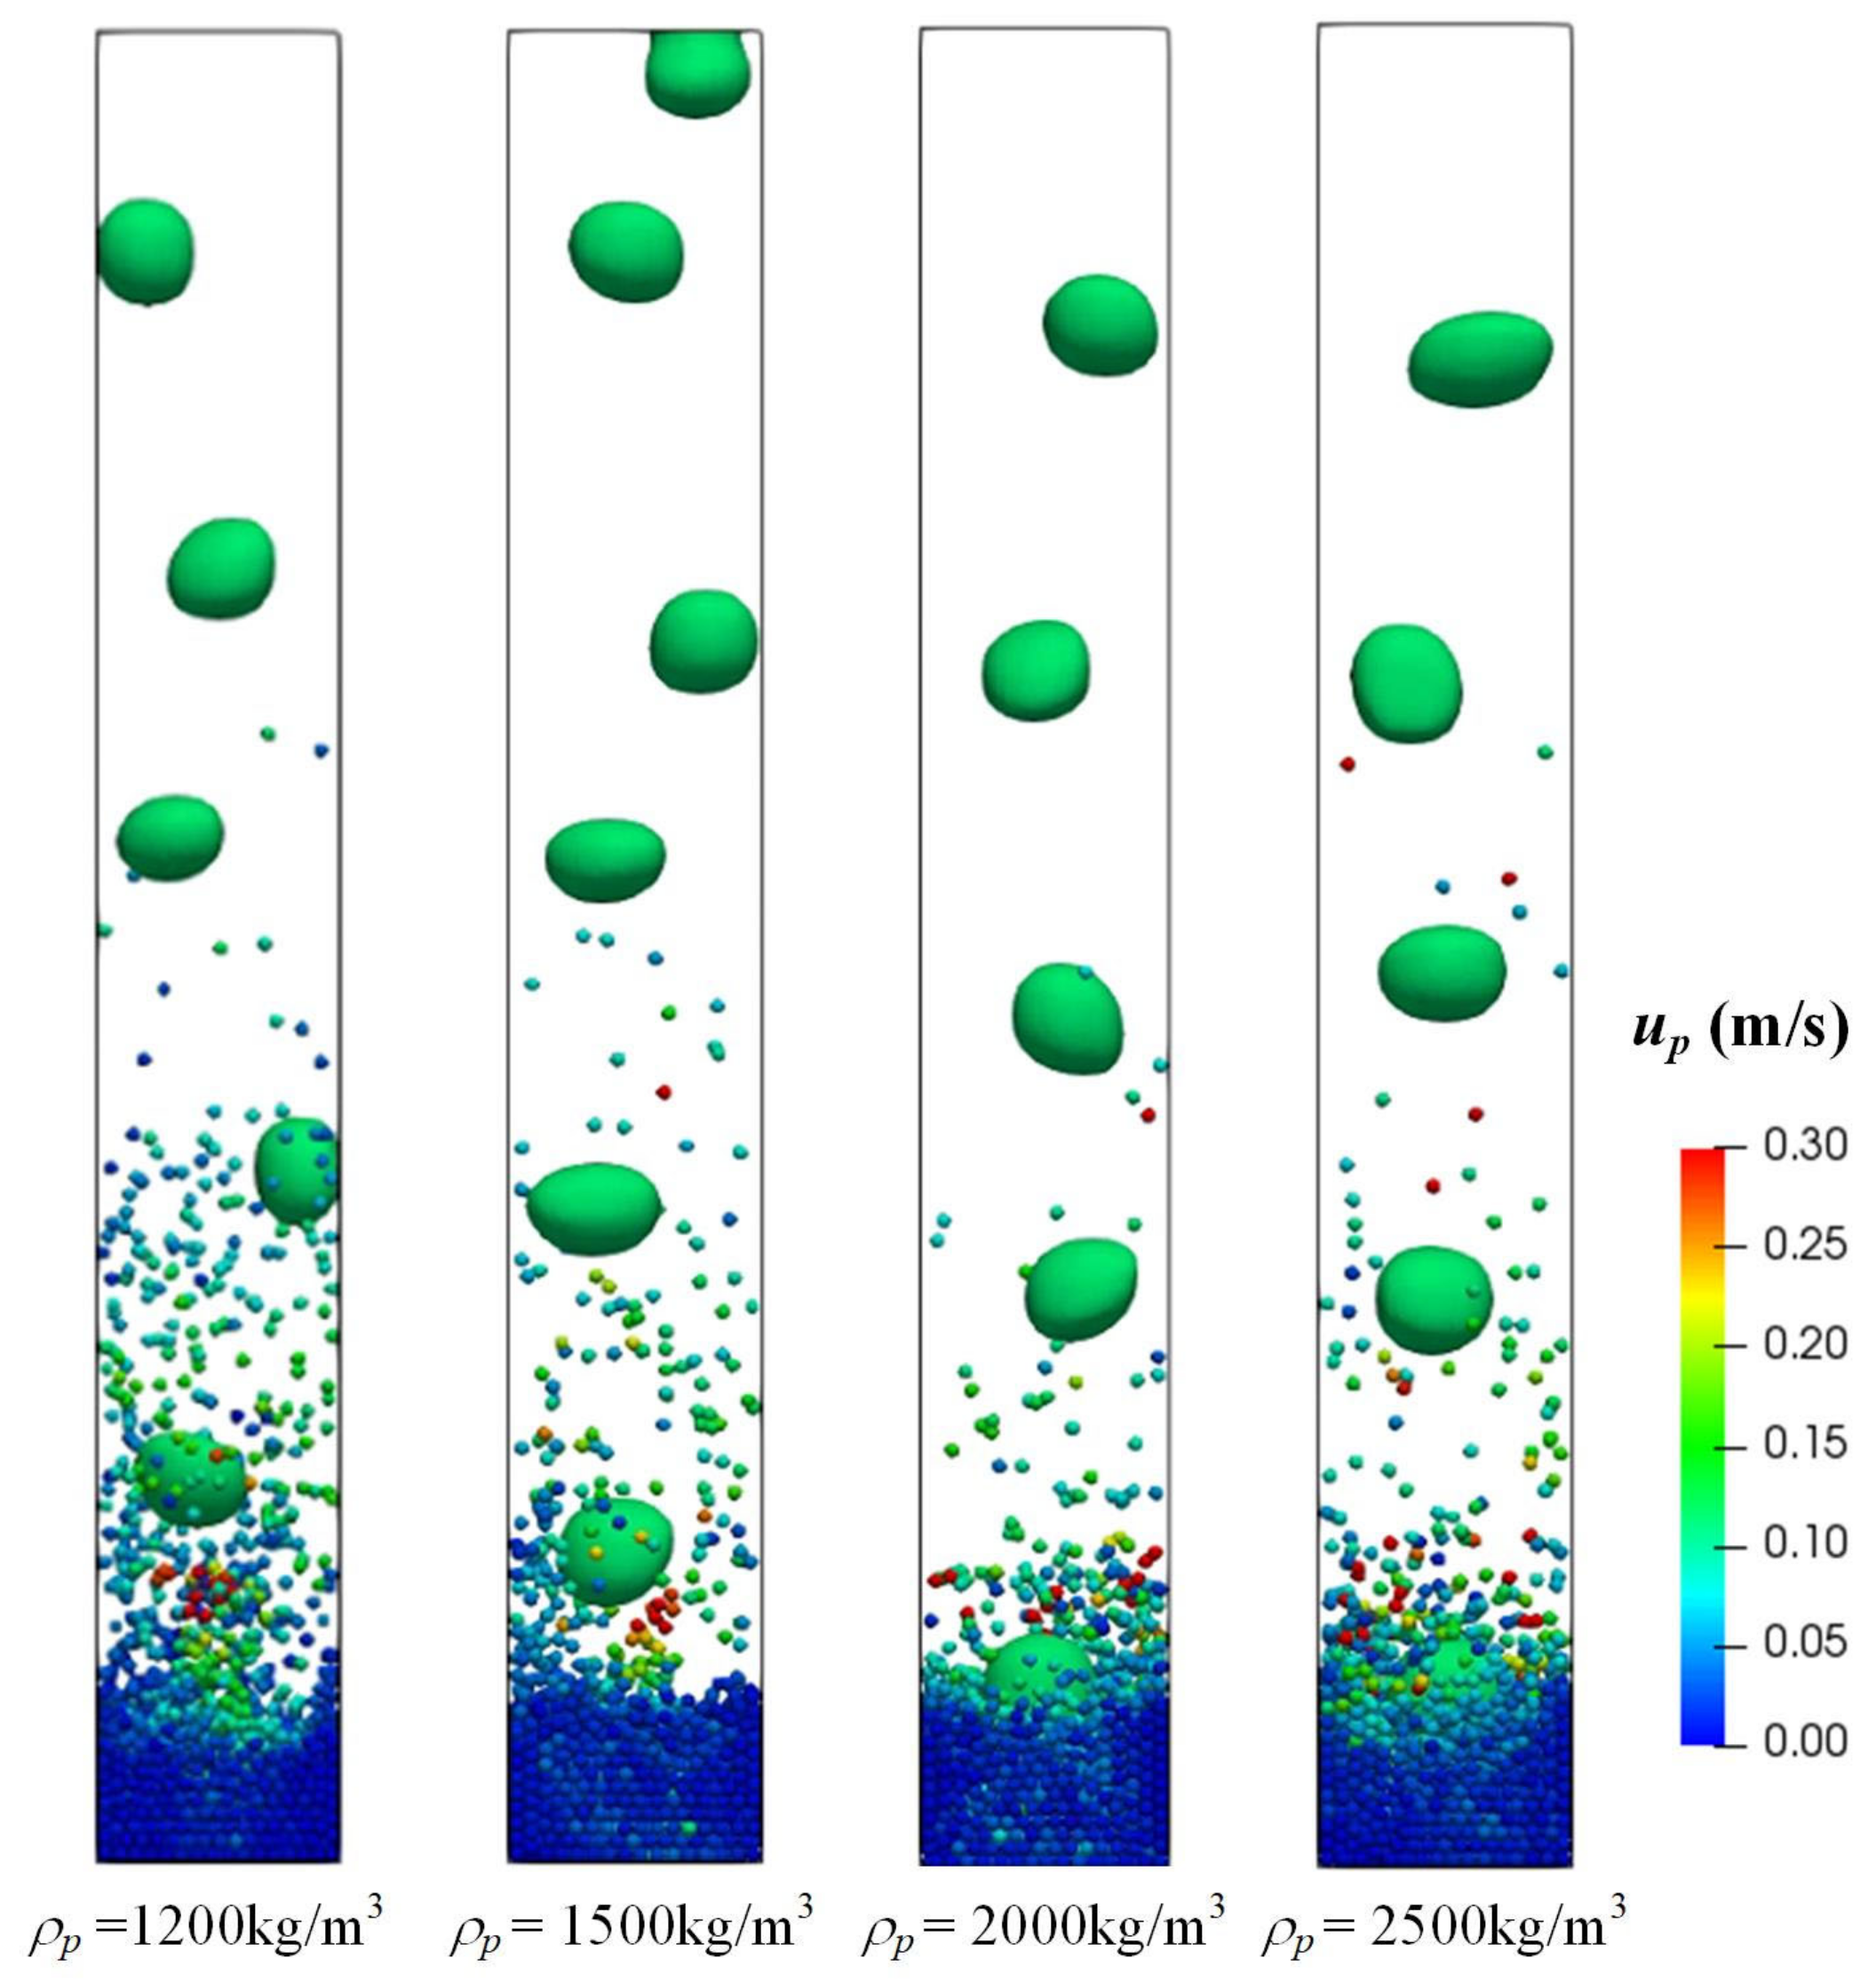
Processes 12 01053 g010
Figure 11. Snapshots of bubbles and particles influenced by different particle densities (Np = 2500, Ug = 0.16 m/s, dp = 0.5 mm).
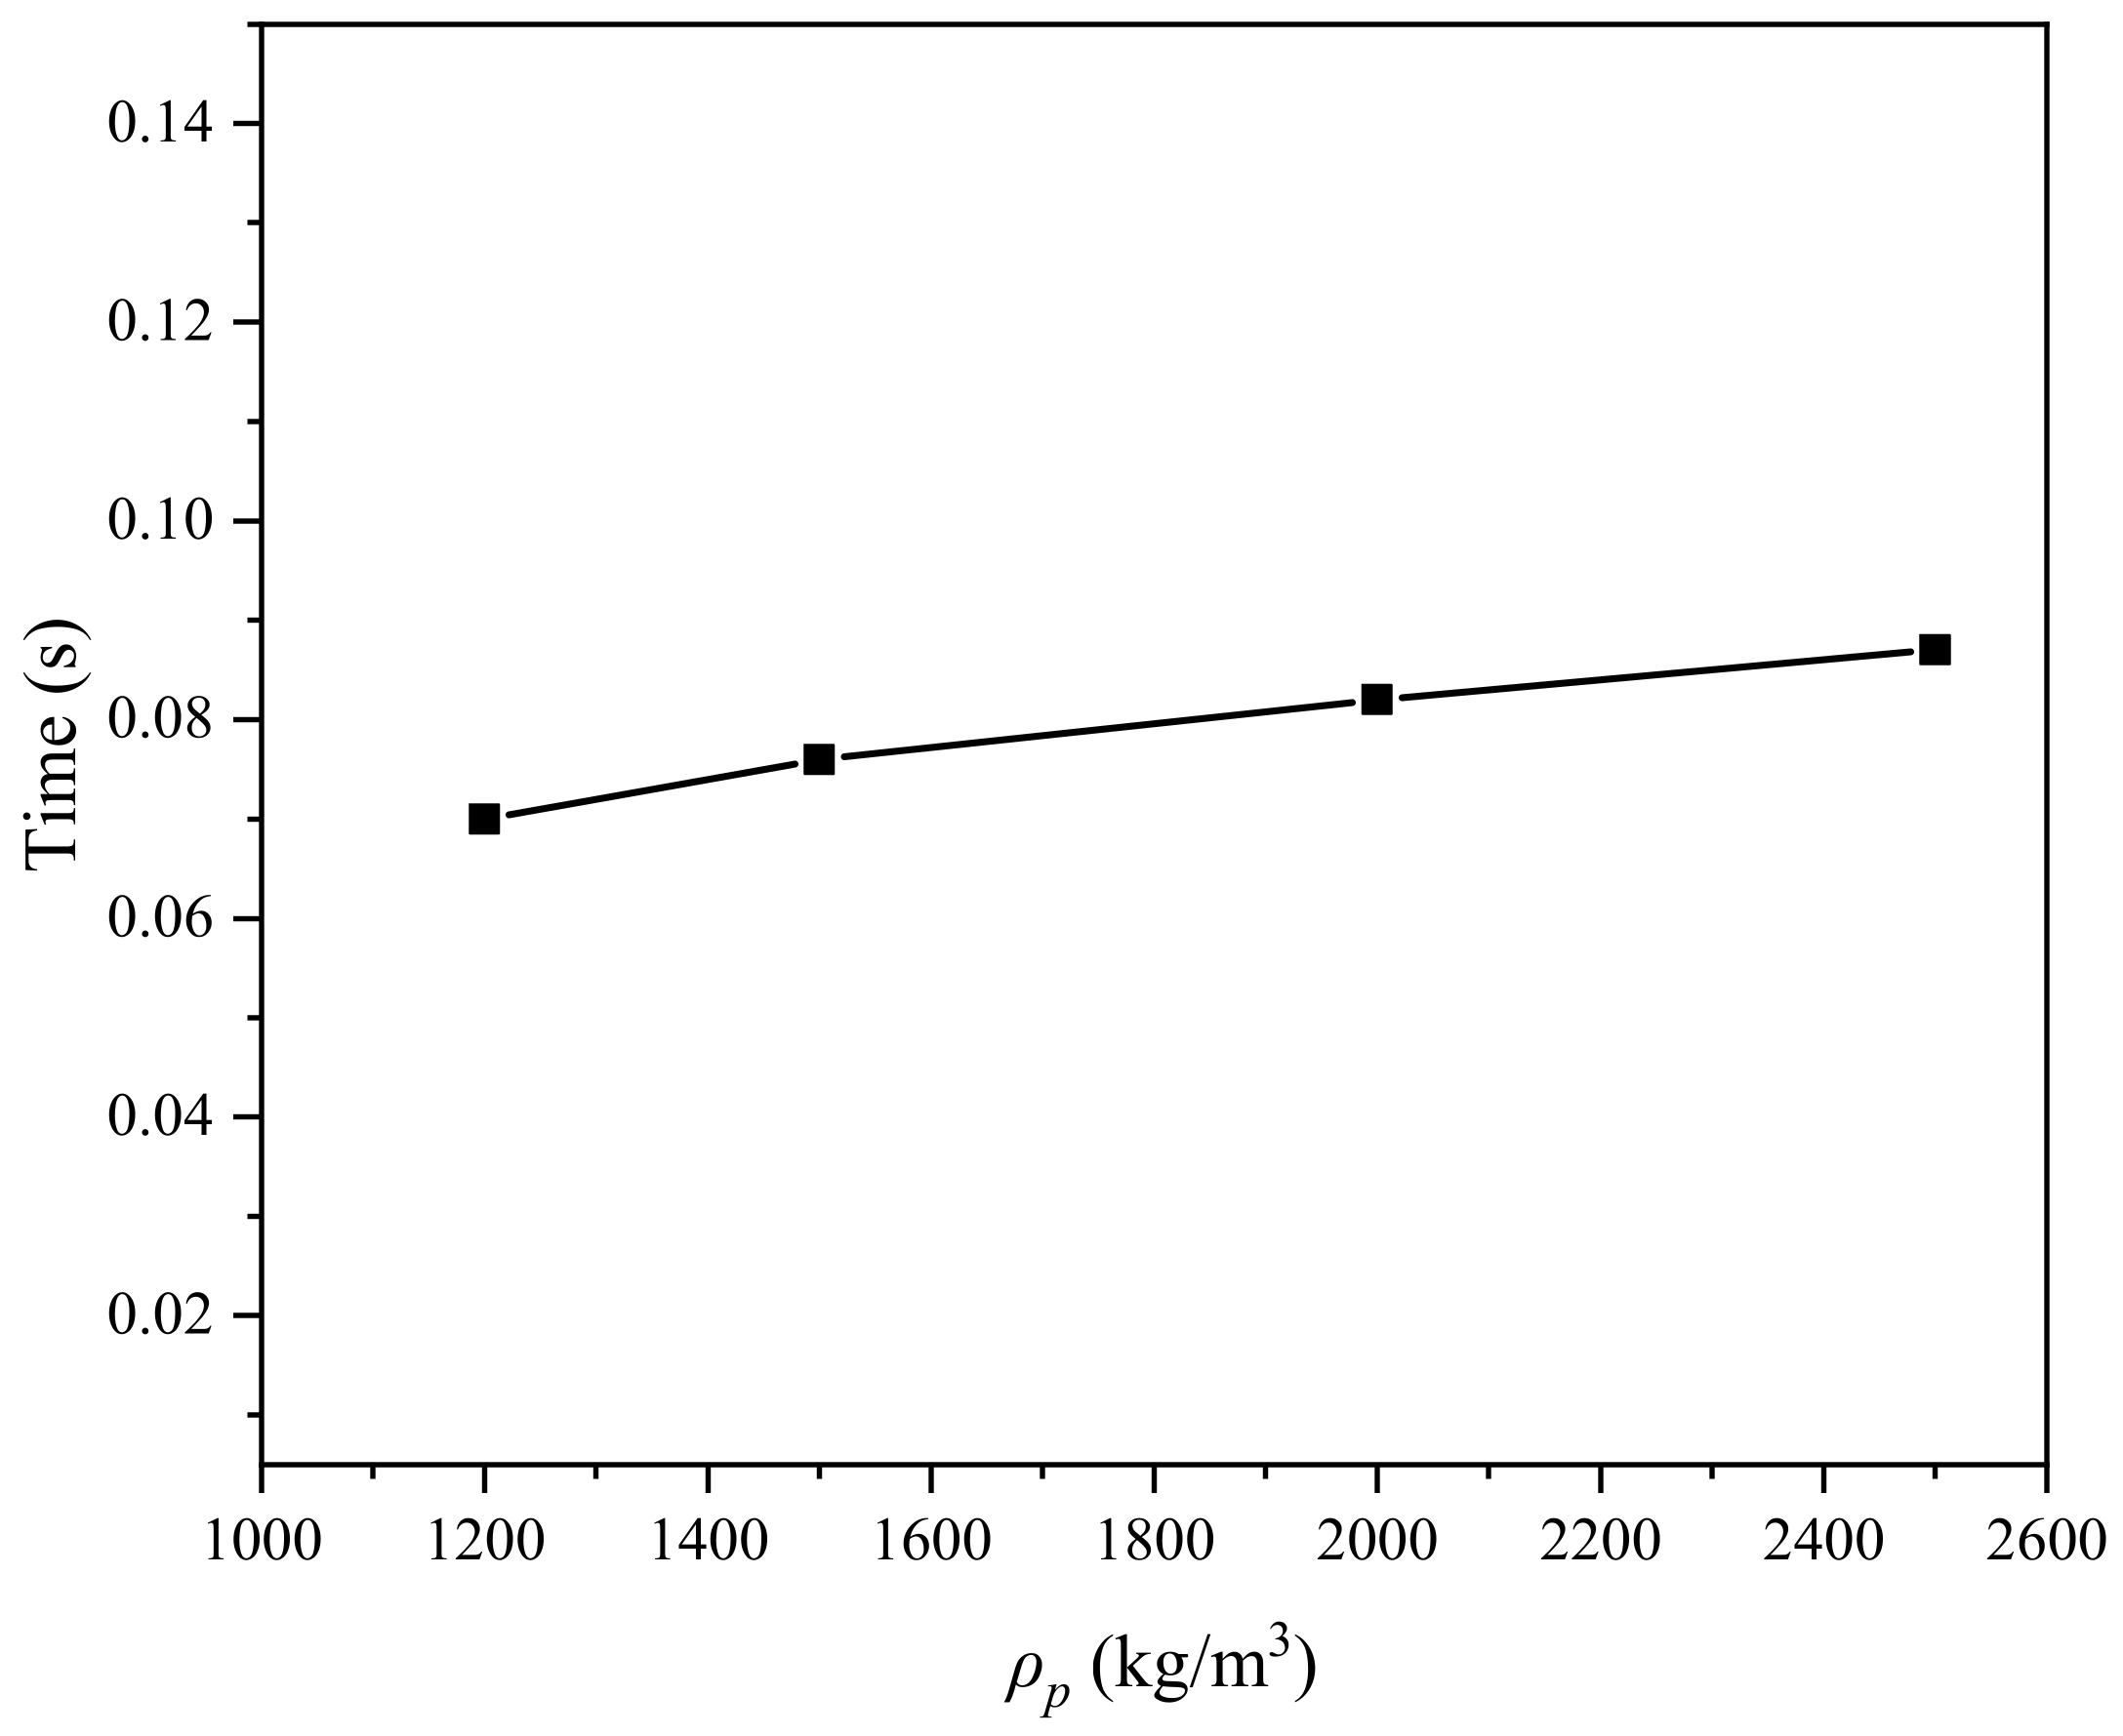
Processes 12 01053 g011
Figure 12. Time required for bubbles to pass through particle beds with different particle densities.
Processes 12 01053 g012
Figure 13. The histograms of the (a) particle positions and (b) particle velocities (Np = 2500, Ug = 0.16 m/s, dp = 0.5 mm).
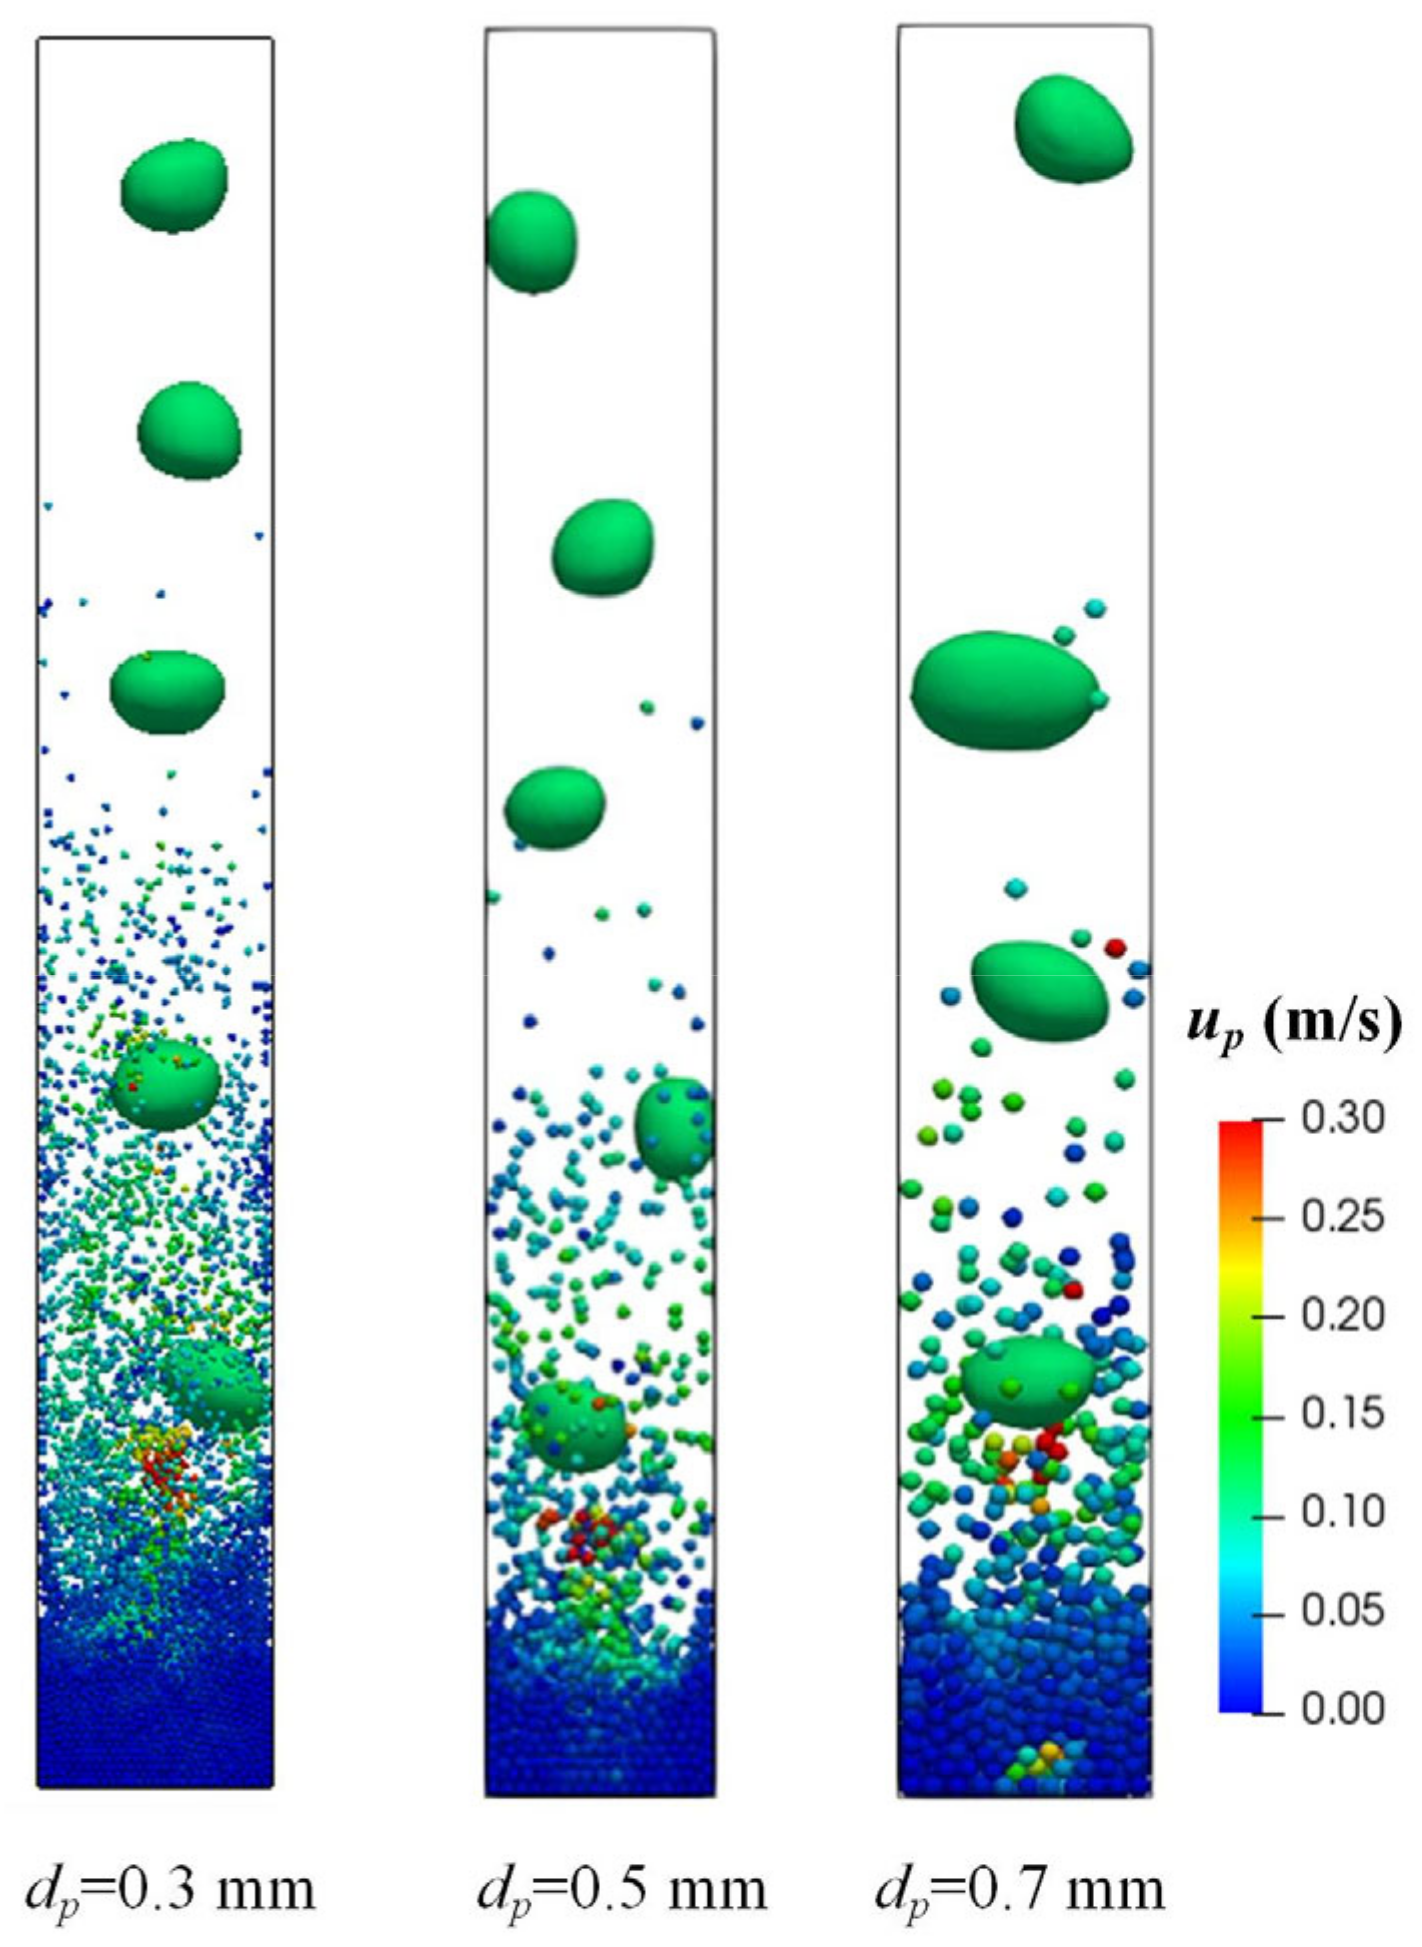
Processes 12 01053 g013
Figure 14. Snapshots of bubbles and particles influenced by different particle sizes (ρp = 1200 kg/m3, Ug = 0.16 m/s).
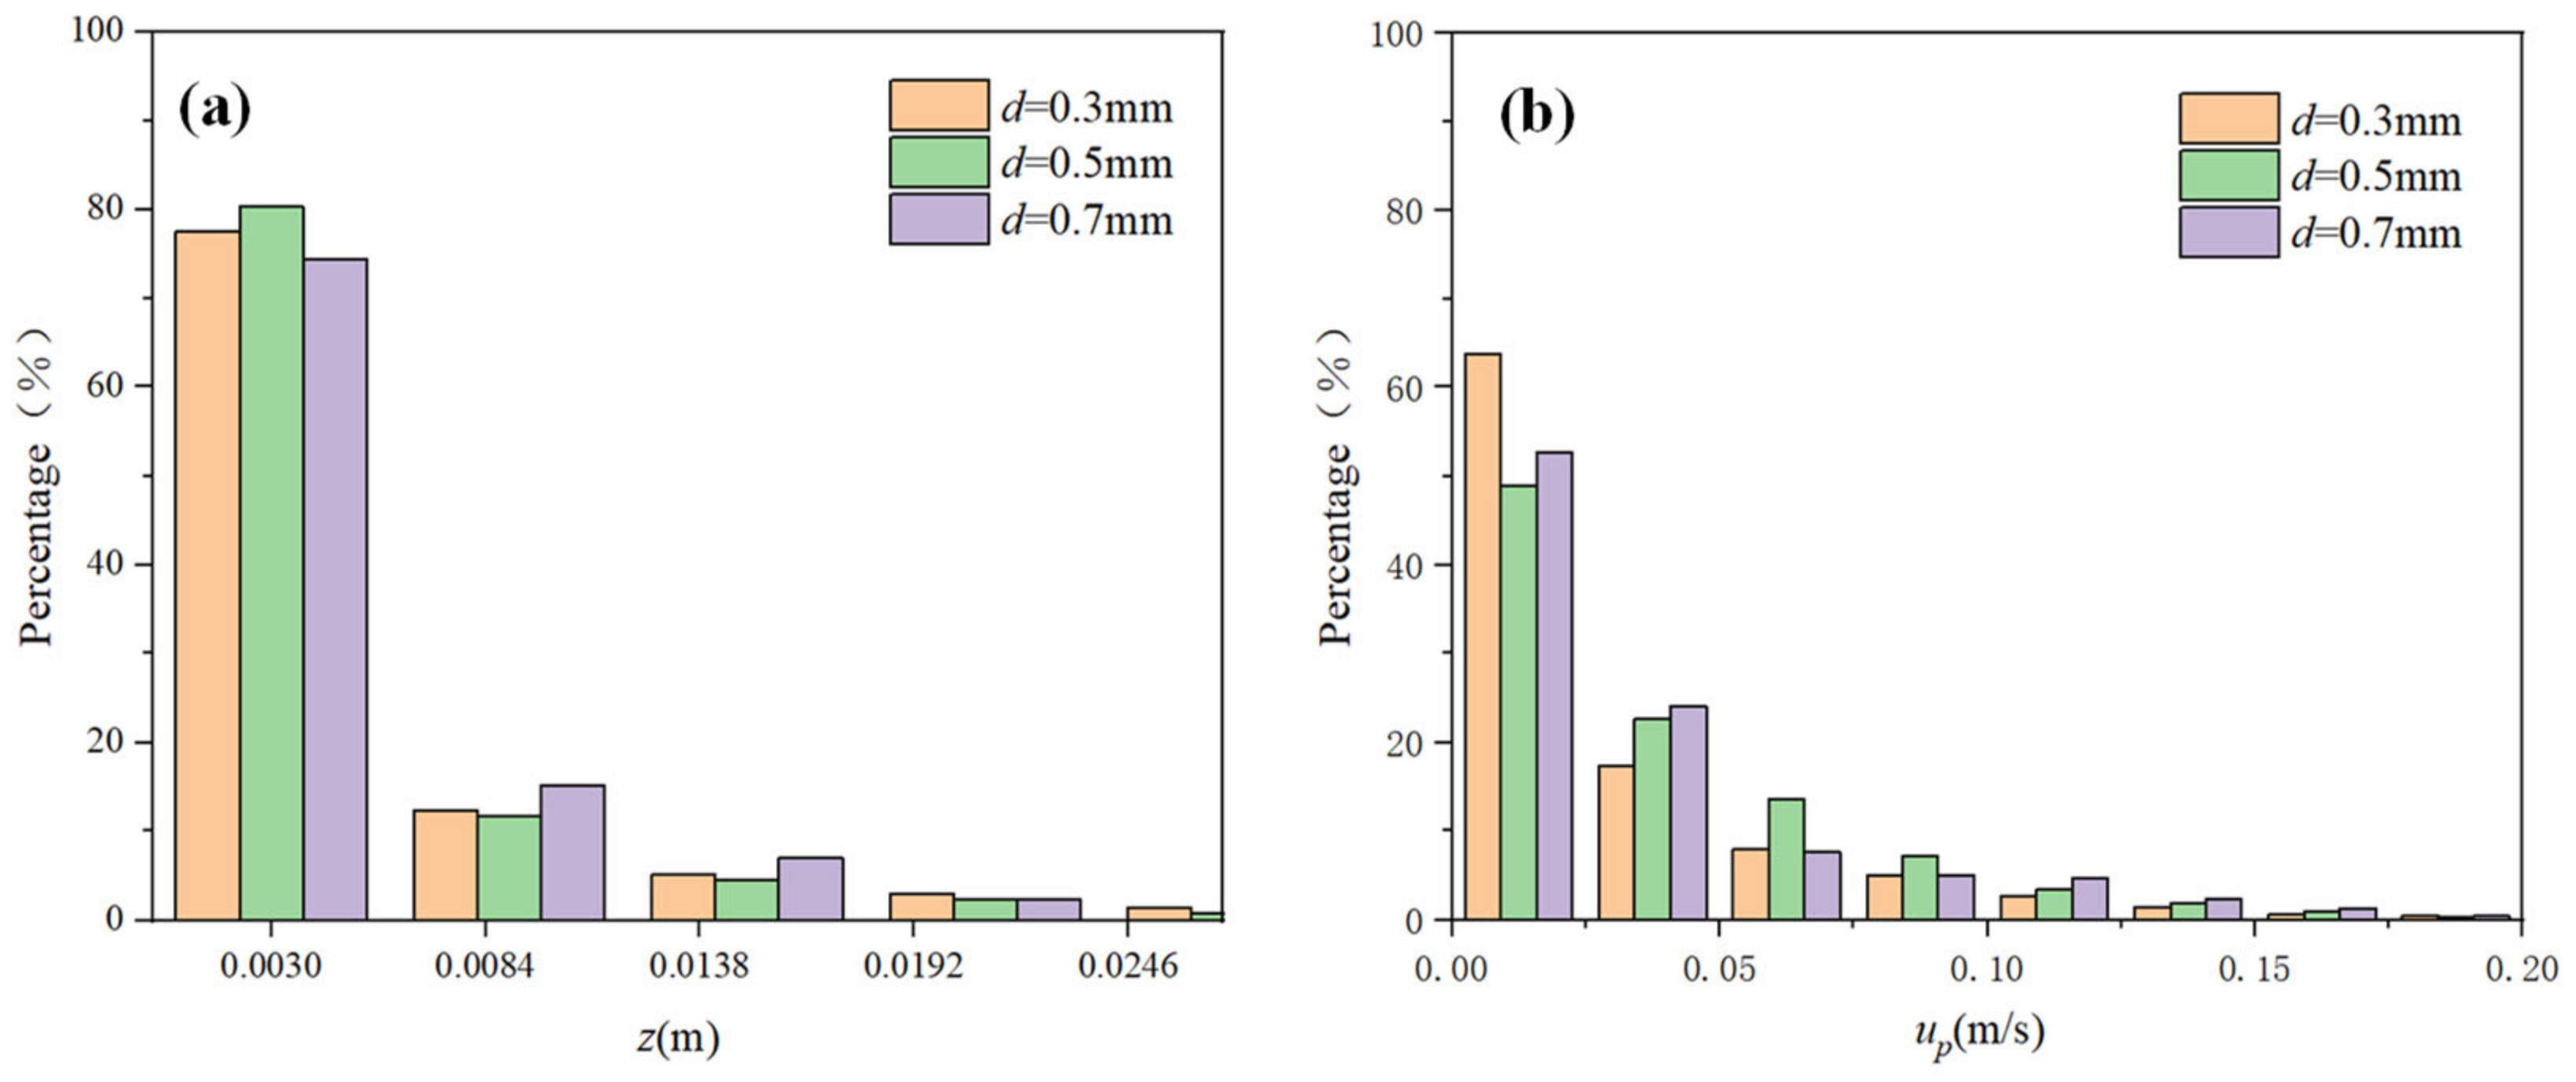
Processes 12 01053 g014
Figure 15. The histograms of the (a) particle positions and (b) particle velocities.
Processes 12 01053 g015
Figure 16. Snapshots of bubbles and particles in beds with different particle diameters at different times.
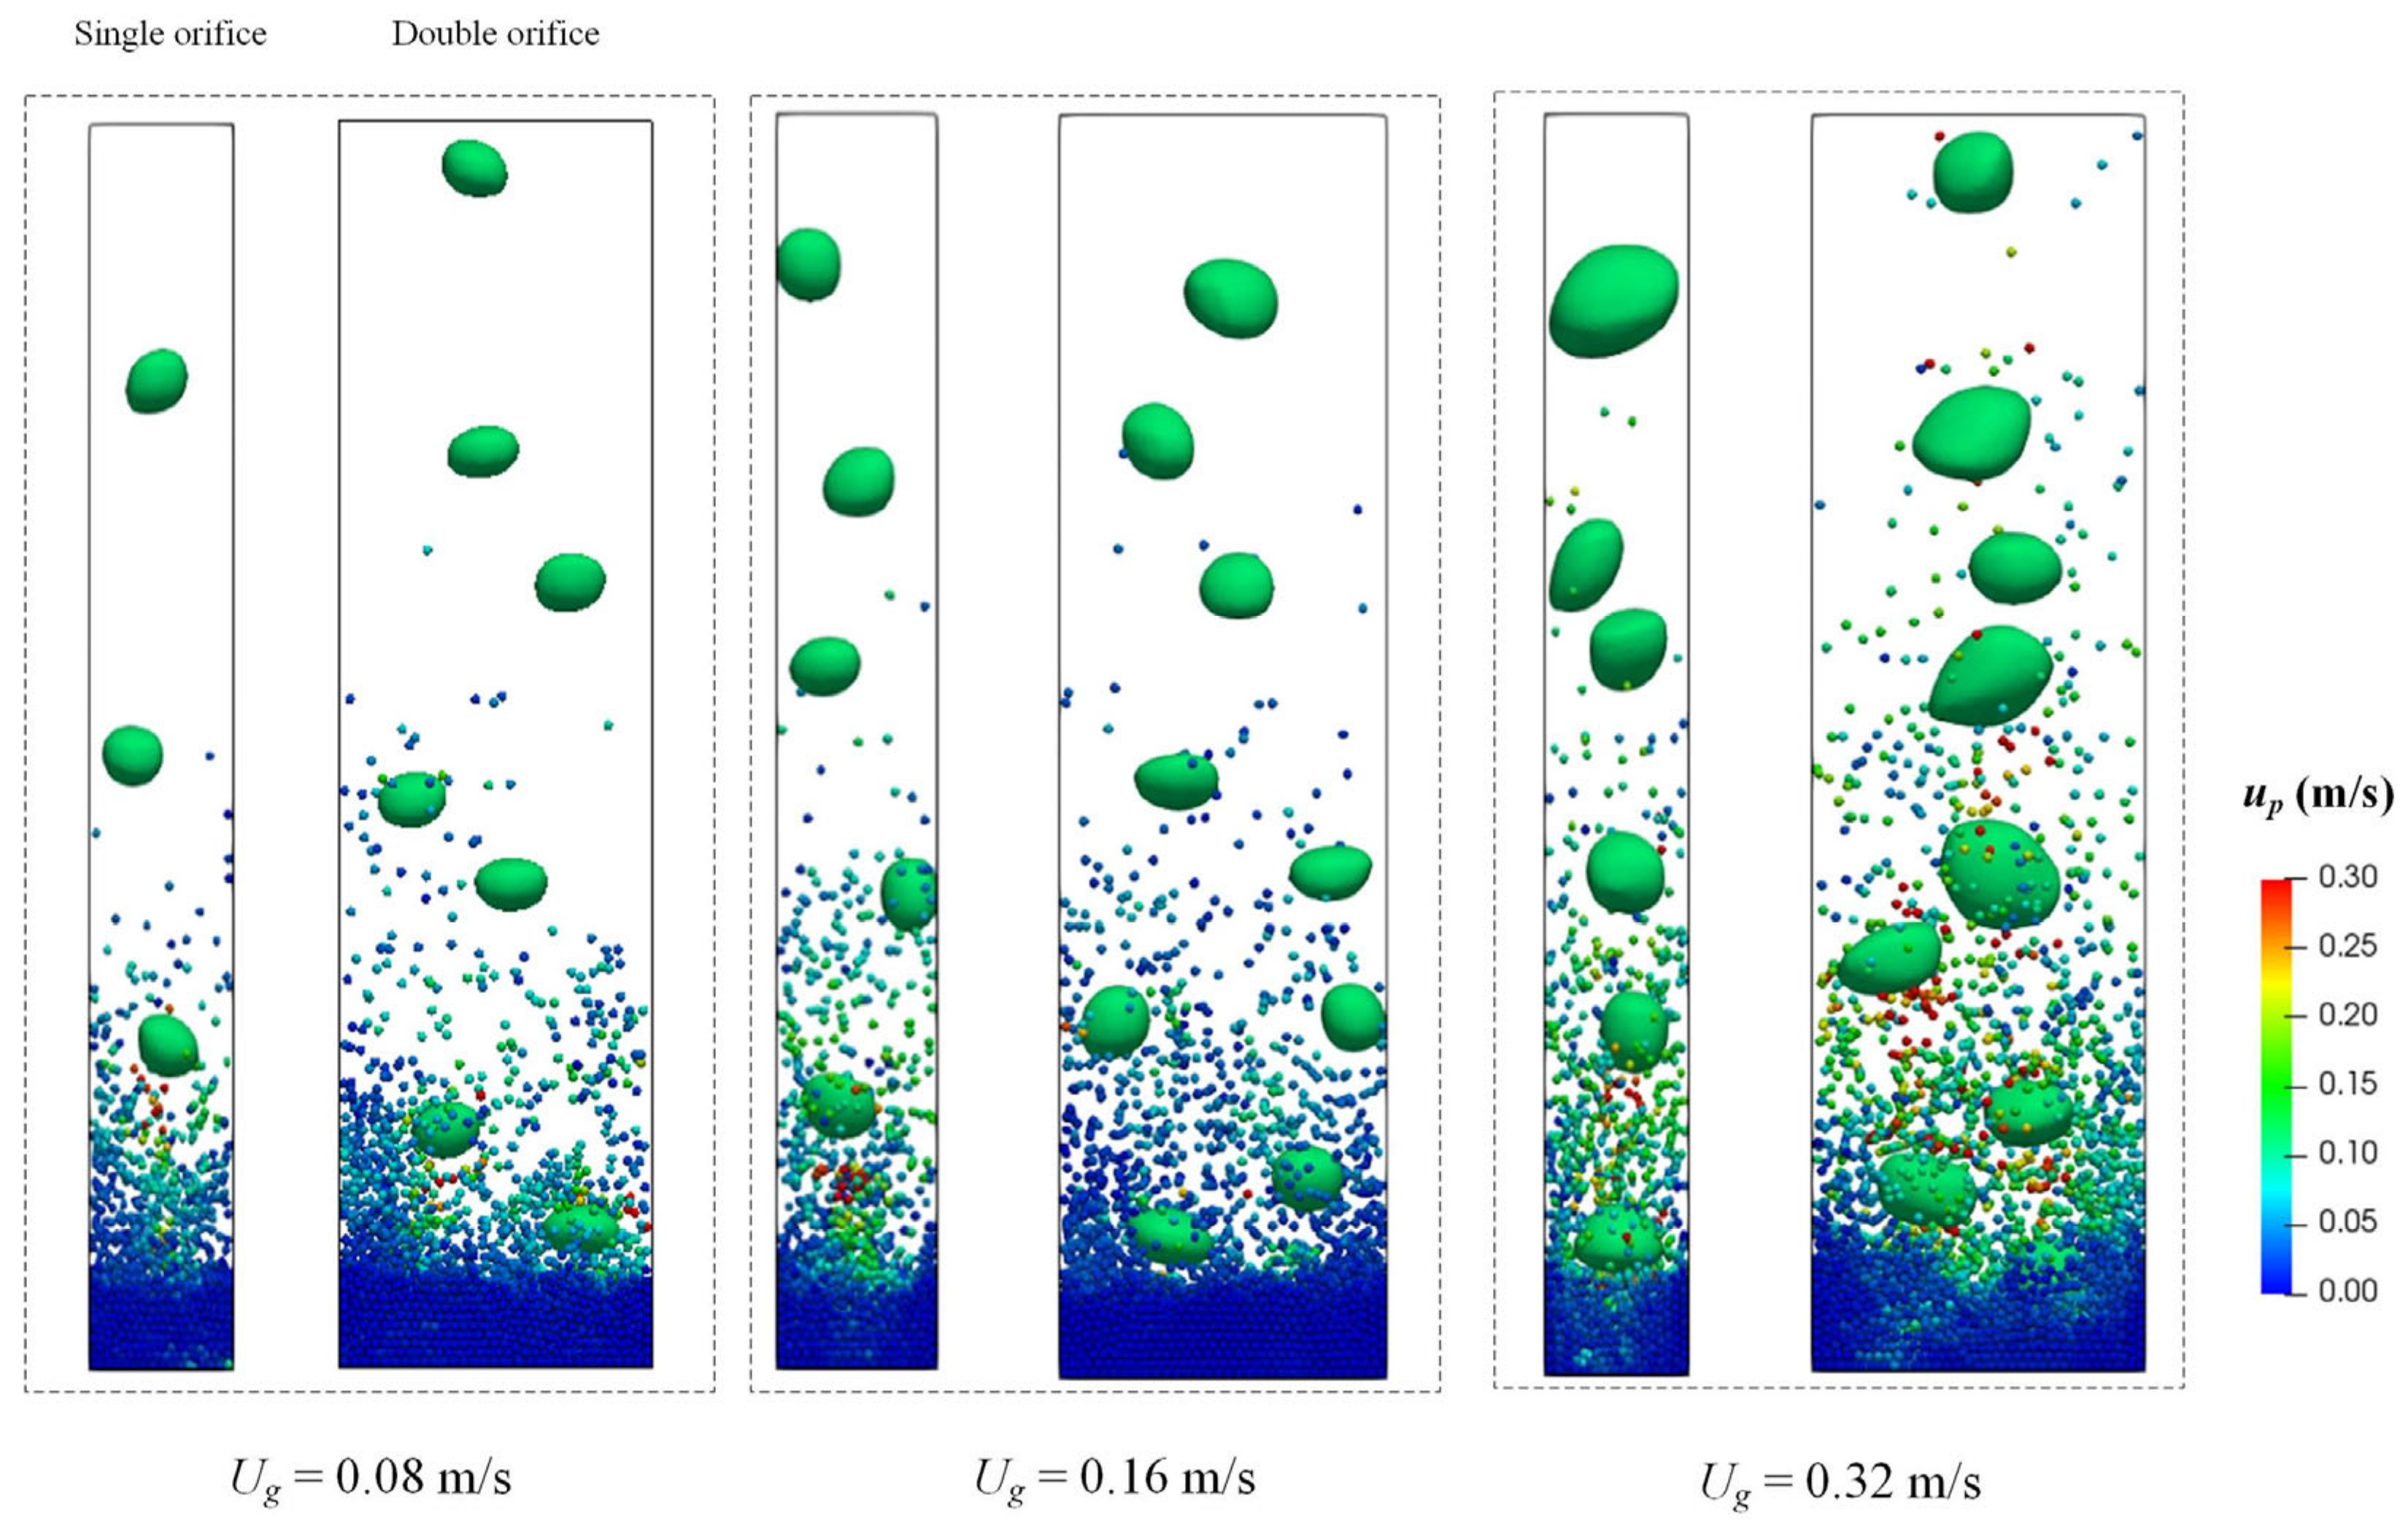
Processes 12 01053 g016
Figure 17. Snapshots of bubbles and particles in beds with single and two orifices for generation of bubbles.
Processes 12 01053 g017
Figure 18. The histograms of the particle positions and particle velocities in beds with a single and two orifices for the generation of bubbles.
Processes 12 01053 g018
Table 1. The numerical schemes used in the simulations.
TermNumerical Scheme
φ t Euler
φ Gauss linear
α f ρ f u f u f Gauss linear Upwind grad (U)
α f u f Gauss vanLeer
τ Gauss linear
2 φ Gauss linear corrected
Note: φ is a variable; ∇2 is the Laplacian term.
Table 2. The simulation parameters.
ParameterValue
Particle diameter (mm)0.3, 0.5, 0.7
Particle density (kg/m3)1200, 1500, 2000, 2500
Particle number2000, 2500, 3000, 3500
Particle–particle normal stiffness (N/m)100
Particle–particle tangential stiffness (N/m)100
Restitution coefficient0.9
Friction coefficient0.3
DEM time step (s)1 × 10⁻⁶
CFD time step (s)5 × 10⁻⁵
Coupling interval100
Table 3. The simulated and experimental results of the bubble number and bubble diameter.
Ug (m/s)Nbubble (exp.)dbubble (exp.)Nbubble (sim.)dbubble (sim.)
0.0834.19 mm33.56 mm
0.1654.95 mm64.44 mm
0.3265.71 mm65.12 mm
Table 4. The effect of the particle number on the bubble number and diameter.
Particle NumberNbubbledbubble
200064.15
250064.12
300054.54
350054.51
Table 5. The effect of the particle density on the bubble number and diameter.
Particle Density (kg/m3)Nbubbledbubble
120063.52
150063.48
200053.55
250053.61
Table 6. The effect of the particle diameter on the bubble number and diameter.
Particle Diameter (mm)Nbubbledbubble
0.364.05
0.564.10
0.745.30
Disclaimer/Publisher’s Note: The statements, opinions and data contained in all publications are solely those of the individual author(s) and contributor(s) and not of MDPI and/or the editor(s). MDPI and/or the editor(s) disclaim responsibility for any injury to people or property resulting from any ideas, methods, instructions or products referred to in the content.

