Article

Numerical Investigation of Confining Pressure Effects on Microscopic Structure and Hydraulic Conductivity of Geosynthetic Clay Liners

1
School of Mechanics and Engineering Science, Shanghai University, Shanghai 200444, China
2
School of Civil Engineering, Qinghai University, Xining 810016, China
3
School of Engineering, University of Virginia, Charlottesville, VA 22904, USA
*
Author to whom correspondence should be addressed.
Processes 2024, 12(5), 980; https://doi.org/10.3390/pr12050980
Submission received: 4 April 2024 / Revised: 3 May 2024 / Accepted: 9 May 2024 / Published: 12 May 2024

Abstract

:
A series of COMSOL numerical models were developed to explore how confining pressure impacts the microscopic structure and hydraulic conductivity of Geosynthetic Clay Liners (GCLs), taking into account the bentonite swelling ratio, mobile porosity, pore size, and tortuosity of the main flow path. The study reveals that the mobile porosity and pore size are critical factors affecting GCL hydraulic conductivity. As confining pressure increases, the transition of mobile water to immobile water occurs, resulting in a reduction in mobile water volume, the narrowing of pore channels, decreased flow velocity, and diminished hydraulic conductivity within the GCL. Mobile porosity undergoes a slight decrease from 0.273 to 0.104, while the ratio of mobile porosity to total porosity in the swelling process decreases significantly from 0.672 to 0.256 across the confining pressure range from 50 kPa to 500 kPa, which indicates a transition of mobile water toward immobile water. The tortuosity of the main flow path shows a slight increase, fluctuating within the range of 1.30 to 1.36, and maintains a value of around 1.34 as the confining pressure rises from 50 kPa to 500 kPa. At 50 kPa confining pressure, the minimum pore width measures 5.2 × 10⁻⁵ mm, with a corresponding hydraulic conductivity of 6.2 × 10⁻¹¹ m/s. With an increase in confining pressure to 300 kPa, this compression leads to a narrower minimum pore width of 1.81 × 10⁻⁵ mm and a decrease in hydraulic conductivity to 5.11 × 10⁻¹² m/s. The six-fold increase in confining pressure reduces hydraulic conductivity by one order of magnitude. A theoretical equation was derived to compute the hydraulic conductivity of GCLs under diverse confining pressure conditions, indicating a linear correlation between the logarithm of hydraulic conductivity and confining pressure, and exhibiting favorable agreement with experimental findings.

1. Introduction

A Geosynthetic Clay Liner (GCL) is a composite impermeable material created by sandwiching bentonite between upper and lower layers of geotextiles using needle punching or chemical bonding techniques [1]. The GCL serves as the primary liner barrier in landfills. As waste is deposited, the confining pressure exerted on GCL gradually increases, causing changes in its hydraulic properties [2,3,4]. Li et al. [5] examined the changes in the hydraulic conductivity of GCL under various confining pressure conditions and observed that the hydraulic conductivity decreased as the vertical confining pressure increased. Weerasinghe et al. [4] studied the variation in GCL under confining pressures ranging from 13 to 80 kPa and observed a linear relationship between hydraulic conductivity and confining pressure on double logarithmic coordinates. Petrov and Rowe [6] conducted permeation tests on GCLs and found that the decrease in the porosity ratio under confining pressure conditions is the main reason for the reduction in hydraulic conductivity of GCL. Ahn and Jo [3] investigated the permeation of sodium bentonite under deionized water (DIW) at confining pressures ranging from 15 to 140 kPa and found that both the sample volume and hydraulic conductivity decreased to one-third of their original values. Wang et al. [7] conducted permeation tests on GCLs under confining pressure and proposed a linear relationship between the confining pressure and porosity ratio. However, these studies primarily conducted qualitative analyses of experiments. The specific mechanism by which confining pressure affects the hydraulic conductivity of GCLs, as well as quantitative investigations into the influence of confining pressure on mobile porosity, pore size, and the tortuosity of flow paths, and how these factors collectively impact hydraulic conductivity, remains unclear.
The finite element software COMSOL Multiphysics 5.4 provides a convenient tool for simulating and analyzing the permeation process of GCLs [8,9]. Zhang et al. [10] investigated a three-field coupled model using COMSOL Multiphysics software, showing that confining pressure significantly influenced the deformation of GCL. Idiart et al. [11] established a bentonite expansion model under the interaction of the seepage field, pressure field, and chemical field and analyzed the changes in bentonite saturation and confining pressure under long-term action. Hou et al. [12] simulated the flow in an idealized GCL using COMSOL, comprising equally sized and spaced square bentonite granules vertically stacked in a rectangular grid and separated by intergranular pores. Hou et al. [13] further established a series of COMSOL numerical models to study the chemical compatibility of GCLs.
This paper develops a series of COMSOL numerical models to simulate the permeation processes of GCL under varying confining pressure conditions, aiming to understand the underlying reasons for the confining pressure impact on hydraulic conductivity. Quantitative investigations explored the relationships between changes in mobile porosity, pore size, tortuosity of the main flow paths, and their combined effect on hydraulic conductivity. The results of this investigation offer significant insights with broad implications for various applications. These insights encompass optimizing GCL design, enhancing predictive capabilities regarding GCL performance across different confining pressure scenarios, contributing to environmental protection endeavors, and stimulating further innovation in impermeable barrier materials.

2. Hydraulic Model of GCLs

Figure 1 shows a two-dimensional hydraulic model created using COMSOL Multiphysics 5.4, aligning with experimental data concerning the hydraulic characteristics of GCLs [3,7,14,15,16,17]. The permeation test setup consists of an inlet situated at the base of the cell and an outlet positioned at its apex. To closely replicate the experimental conditions, we utilized a square domain measuring 0.8 mm × 0.8 mm. Following this, the domain’s height was reduced to one-tenth of its original dimension, corresponding to 8 mm, in the experimental setup [9,18]. Within this domain, impermeable granules, depicted as grey circles, were evenly dispersed, with each granule possessing a defined circular shape and diameter (d0 = 0.1 mm) [9]. The initial porosity (n0), set at 0.5, was demarcated within a light blue region, dividing the total domain [18]. The flow direction was assumed upward, with a constant head boundary condition imposed on the lower horizontal surface (inlet pressure = 1 Pa) and the upper horizontal surface (outlet pressure = 0 Pa). The vertical surfaces on the left and right were treated as no flow boundaries. Permeation within GCLs primarily occurs in the intergranular spaces [19]. It is noteworthy that while diffuse double layers (DDLs) may influence clay swelling, the hydraulic conductivity of GCLs is chiefly determined by alterations in mobile porosity and the tortuosity of flow pathways, as elucidated in both previous studies [12,20]. Consequently, this study is centered on the examination of mobile porosity, which serves as the conduit for fluid flow within the GCL. Accordingly, the numerical model in this study focuses solely on mobile porosity [21,22], which facilitates the flow of free water between the granules [23]. Furthermore, due to the Reynolds number (Re) being notably below 1 in the GCL [24,25,26], creeping flow was selected as the fluid flow model for all simulations. Table 1 presents a summary of the parameter assignments in the model.
A finite-element mesh, as shown in Figure 2, specifically a physics-controlled triangular extremely fine mesh, was utilized for accurate results while minimizing memory usage and computational time. The simulation parameters comprised a maximum of 100 iterations and a velocity tolerance of less than 0.001 m/s. The resulting solution provided the steady-state distribution of fluid pressure and velocity across the domain.
According to the investigation conducted by Xu [30], there is a correlation between the swelling size of bentonite samples and their initial size following hydraulic swelling.
A s = ( ε max + 1 ) A i ,
where εmax is the maximum strain of the bentonite following hydraulic swelling, Ai is the initial size of the bentonite sample (mm2), and As is the bentonite sample size after hydraulic swelling (mm2).
According to the investigation conducted by some scholars [31,32], the maximum strain of the bentonite following hydraulic swelling can be calculated using the following equation.
ε max = ( C m ε sv + 1 G s ρ d 1 ) × 100 % ,
where Cm is the montmorillonite content in bentonite, Gs is the specific gravity of soil granules, ρd is the dry density of bentonite (g/cm3), and εsv is the swelling strain of bentonite.
According to the investigation conducted by Xu [33], under a certain confining pressure, the swelling strain of bentonite after hydraulic swelling (εsv) can be calculated using the following equation based on a fractal model [33].
ε sv = K p e D s 3 ,
where K is the swelling coefficient, Ds is the surface fractal dimension of bentonite, and pe is the confining pressure on the bentonite sample.
By substituting Equation (3) into Equation (2) and subsequently into Equation (1), As can be expressed as
A s = ( C m K p e D s 3 + 1 G s ρ d A i ) × 100 %
Therefore, for the square domain, the length of the domain after swelling (Ls) can be expressed as follows.
L s = A s
Substituting Equation (4) into Equation (5), the relationship between Ls and pe can be obtained as follows.
L s = ( C m K p e D s 3 + 1 G s ρ d A i ) × 100 %
Therefore, for the square domain measuring 0.8 mm × 0.8 mm, the value of Ls under a specific pe can be computed and is summarized in Table 2.
Figure 3 depicts a schematic diagram of the COMSOL numerical calculation model of GCLs under various confining pressures. The grey circles represent bentonite granules, while the light blue indicates the initial liquid flow region (Figure 3a). Based on the numerical model as shown in Figure 3a, a numerical model with dimensions of 1.165 mm × 1.165 mm was initially developed (Figure 3b) utilizing geometric scaling commands in COMSOL, where Ls corresponds to pe = 50 kPa, as indicated in Table 2. As the confining pressure increases, the granules gradually aggregate. For instance, this includes maintaining the granular sizes while reducing the domain size to 0.935 mm × 0.935 mm (Ls corresponding to pe = 300 kPa, Figure 3c, see Table 2) and reducing the domain size to 0.885 mm × 0.885 mm (Ls corresponding to pe = 500 kPa, Figure 3d, see Table 2) as the confining pressure increases from 50 kPa to 500 kPa. Following the same procedure, ten COMSOL models for GCL permeation under different confining pressures ranging from 50 kPa to 500 kPa were developed accordingly, as summarized in Table 2.
Figure 4 presents the concept of initial porosity (n0), mobile porosity (nm), total porosity in the swelling process (n) and tortuosity of the main flow paths (τ), as discussed in the subsequent sections of the study [34]. Initial porosity is defined as the portion of pore water in the domain before swelling, as indicated by the light blue color in Figure 4a.
The calculation formula for initial porosity is as follows.
n 0 = L 0 2 A 0 L 0 2 ,
where n0 is the initial porosity, L0 is the initial length of the side of the simulated domain area (mm), and A0 is the initial total granule area (mm2), which can be calculated as
A 0 = π d 0 2 4 N ,
where N is the number of granules.
The mobile porosity nm, as shown in the light blue region in Figure 4b, is calculated as follows.
n m = A m L s 2 ,
where nm is the mobile porosity, Am is the area of the pore space where water can flow (mm2) and Ls is the length of the side of the simulated domain area (mm).
The total porosity in the swelling process n, as shown in the light blue and dark blue region in Figure 4b, is calculated as follows.
n = A L s 2 ,
where A is the area of the pore space (mm2).
The granule swelling rate Sr is calculated as follows.
S r = d s 2 d 0 2 d 0 2 ,
where Sr is the granule swelling, d0 is the initial size of a granule (mm) and ds is the granule size after swelling (mm).
The calculation of the tortuous main flow path τ is based on the work of Ahmadi [35] and is depicted by the red line in Figure 4b.
τ = L t L s ,
where Ls is the length of the domain under confining pressure (mm), the linear distance from the inlet to the outlet direction, and Lt is the actual length of the main flow path under confining pressure (mm).
The determination of hydraulic conductivity utilizes a technique known as line averaging. This approach entails choosing the outlet boundary and calculating the average velocity in the up–down direction to ascertain the outlet flow velocity (v). Subsequently, hydraulic conductivity (k) is calculated using Equations (13)–(15).
h = p 0 ρ w g ,
i h = h L ,
k = v i h ,
where ih is the hydraulic gradient, h is the height of the water head (mm), Ls is the height of the sample (mm), p0 is the water gradient pressure (kPa), ρw is the density of water (kg/m3), and g is the acceleration of gravity (m/s2).

3. Results and Discussion

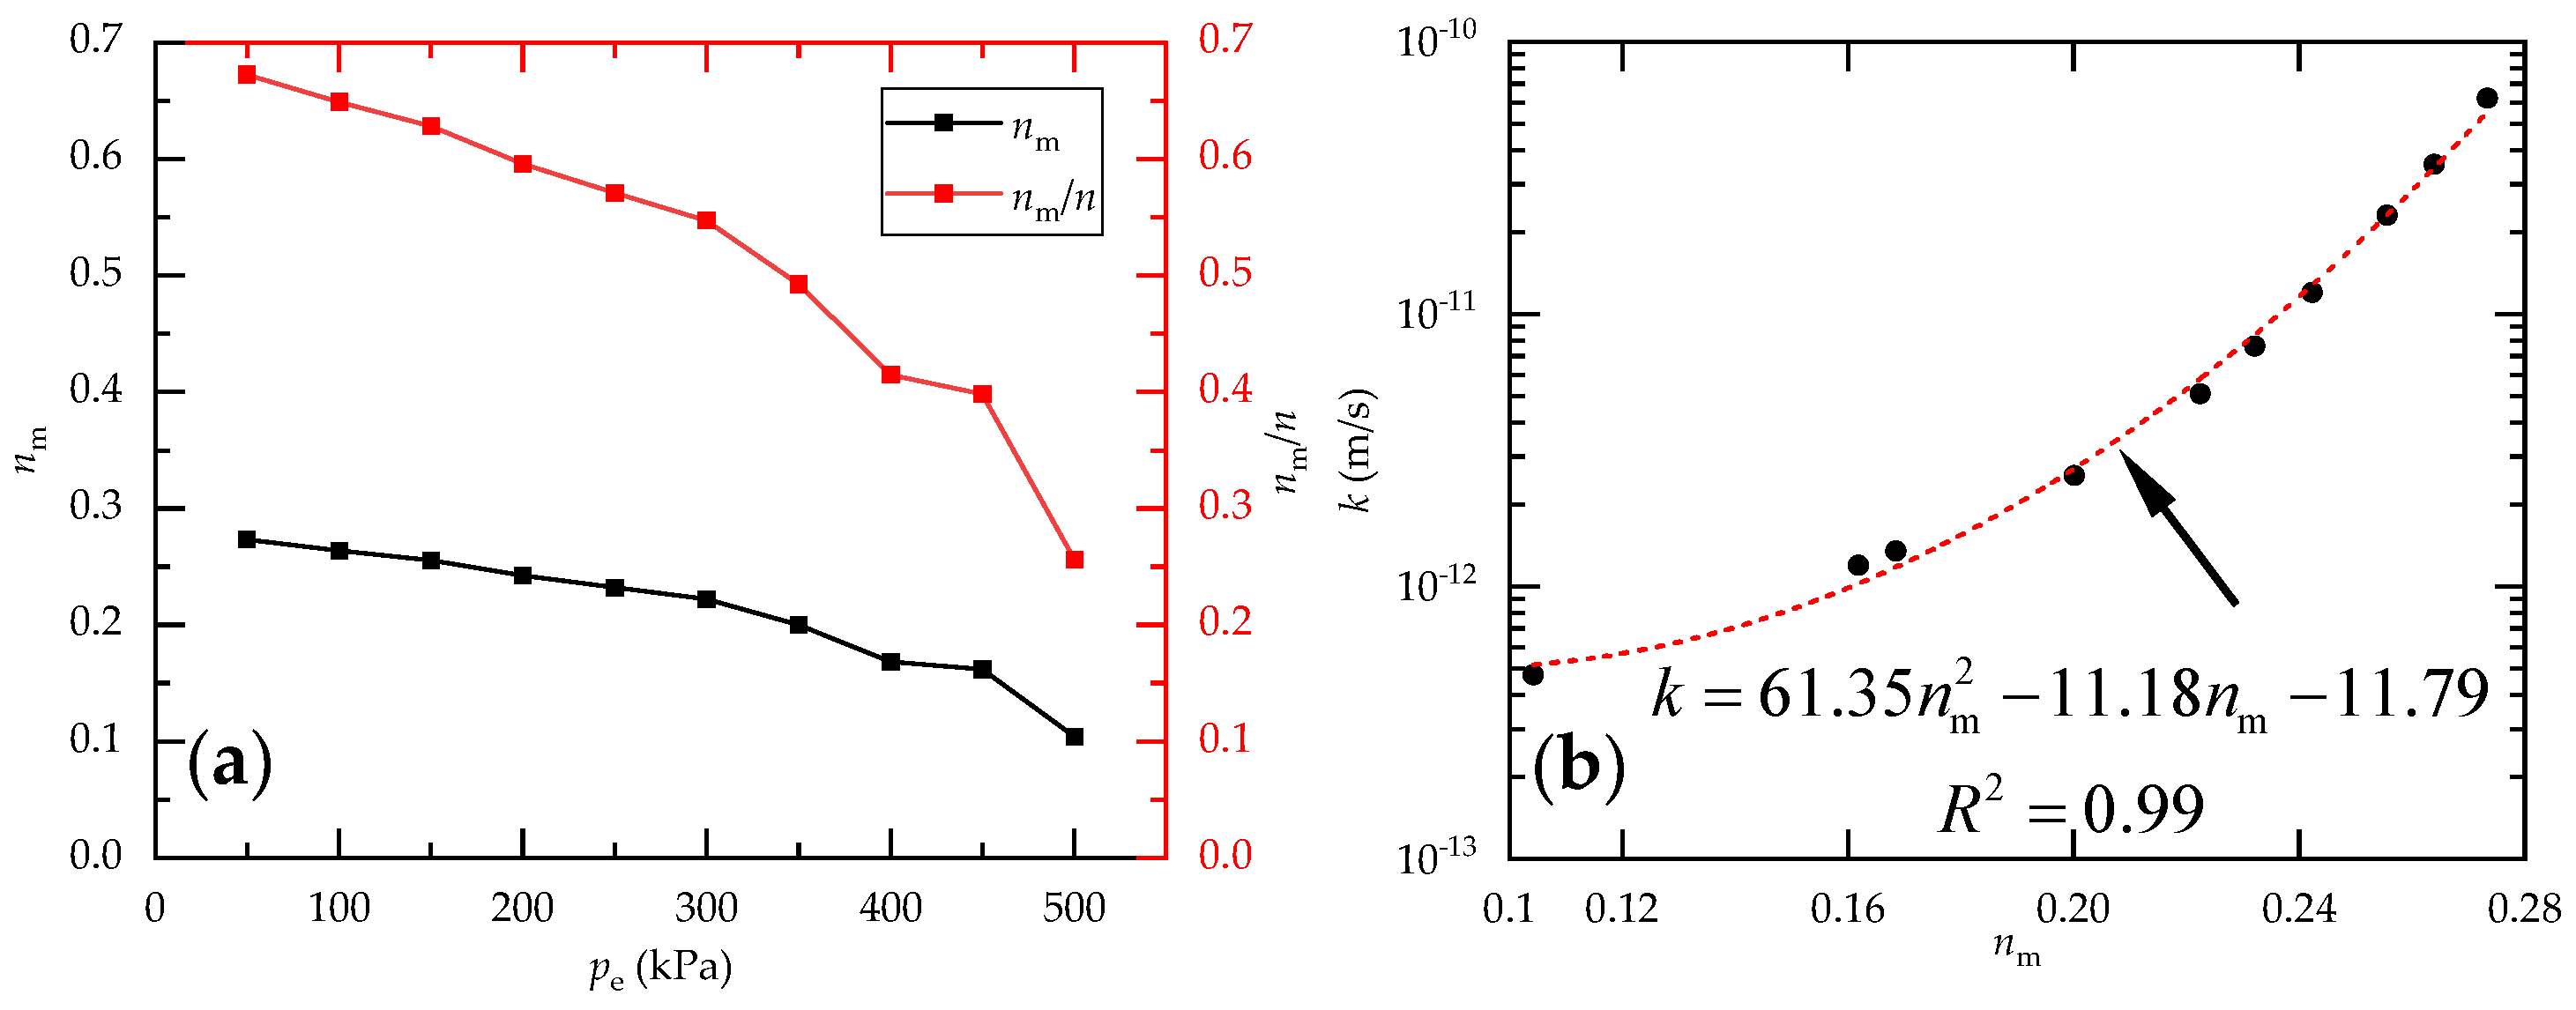
3.1. Effect of Confining Pressure on Mobile Porosity and Pore Structure

Figure 5 illustrates how confining pressure affects mobile porosity. At 50 kPa, mobile porosity (nm) measures 0.273, characterized by numerous flowable channels in the red region and primary flow paths highlighted within the orange box in Figure 5a. These paths determine the flow velocity and hydraulic conductivity at the outlet. However, with increased the confining pressure to 300 kPa, the mobile porosity decreases to 0.222. This decline primarily results from pores occupied by the interface between mobile and immobile water at 50 kPa, indicating changes occurring at this interface with increasing confining pressure (compare green dashed boxes in Figure 5a,b), which suggests situations where mobile water transitions to immobile water as the confining pressure rises. Meanwhile, due to a reduced pore channel volume, these channels can only accommodate less water passing through the primary flow paths over time, leading to decreased flow velocity within the GCL (compare red boxes at the white point in Figure 5a,b).
For instance, the flow velocity decreases from 1.32 × 10⁻¹¹ m/s at 50 kPa confining pressure to 1.37 × 10⁻¹² m/s at 300 kPa, and the width narrows from 0.027 mm from 0.022 mm at the white point (see the zoomed in red boxes in Figure 5a,b). Consequently, mobile water slows down, eventually transitioning to an immobile state with increasing confining pressure. However, it is crucial to note that the reasons for immobile water with confining pressure increase differ from those related to occluded pore spaces. These unconnected pores can transform into mobile water under various environmental conditions, such as chemical solutions inhibiting bentonite swelling or erosion by acidic or basic solutions, which affect mobile porosity and contribute to variations in hydraulic conductivity. Conversely, occluded pore spaces not connected to other pore channels always exist but occupy the total porosity in swelling process. Therefore, the results indicate that the reduction in hydraulic conductivity is associated with decreased connected pore channels, which are related to mobile porosity (nm).
Figure 6a depicts the impact of confining pressure on mobile porosity (nm) and the ratio of mobile porosity to total porosity in the swelling process (nm/n). With an increase in confining pressure, there is a very slight decrease in total porosity in the swelling process (n), accompanied by a gradual reduction in the volume of mobile water. This decrease results in a contraction of the pores it occupies, leading to a simultaneous decline in both mobile and total porosity in the swelling process. However, the decline in mobile porosity follows a decreasing trend, unlike the rapid decreases observed in the ratio of mobile porosity to total porosity in the swelling process (nm/n). For instance, the mobile porosity (nm) experiences a gradual decrease from 0.273 to 0.104, whereas the ratio of mobile porosity to total porosity in the swelling process (nm/n) significantly decreases from 0.672 to 0.256 across the confining pressure range from 50 kPa to 500 kPa. The rapid decrease in the ratio of mobile porosity to total porosity in the swelling process compared to the decline in mobile porosity with increasing confining pressure indicates a transition of mobile water towards immobile water. This trend difference can be attributed to several factors. As confining pressure increases, the granules compact, which affects both mobile and immobile porosity. However, the rate of decrease in total porosity in the swelling process might be slower compared to that of mobile porosity due to the confining presence of immobile water occupying some pores, as corroborated in Figure 5. Furthermore, escalating confining pressure can constrict pore channels within the granules, particularly affecting the movement of mobile water, which leads to a swifter reduction in the ratio of mobile porosity to total porosity in the swelling process. Moreover, changes in confining pressure levels influence water flow dynamics within the granules, leading to a decrease in the water flow velocity and percolation rate per unit of time, especially within the pore channels occupied by mobile water. The deceleration in flow dynamics contributes to the observed variations in decline rates between mobile porosity and the ratio of mobile porosity to total porosity in the swelling process, indicating a transition of mobile water towards immobile water. Therefore, as the proportion of mobile porosity diminishes, the volume of pore channels occupied by mobile water also decreases, resulting in lower internal flow velocity within the GCL, a reduced percolation rate per unit time, lower hydraulic conductivity, and ultimately, an improved impermeability performance of the GCL. In Figure 6b, it is observed that as the mobile porosity increases, there is a decrease in hydraulic conductivity. The relationship between nm and k follows a nonlinear pattern, as indicated by the arrow in Figure 6b and depicted by Equation (16).
k = 61.35 n m 2 11.18 n m 11.79

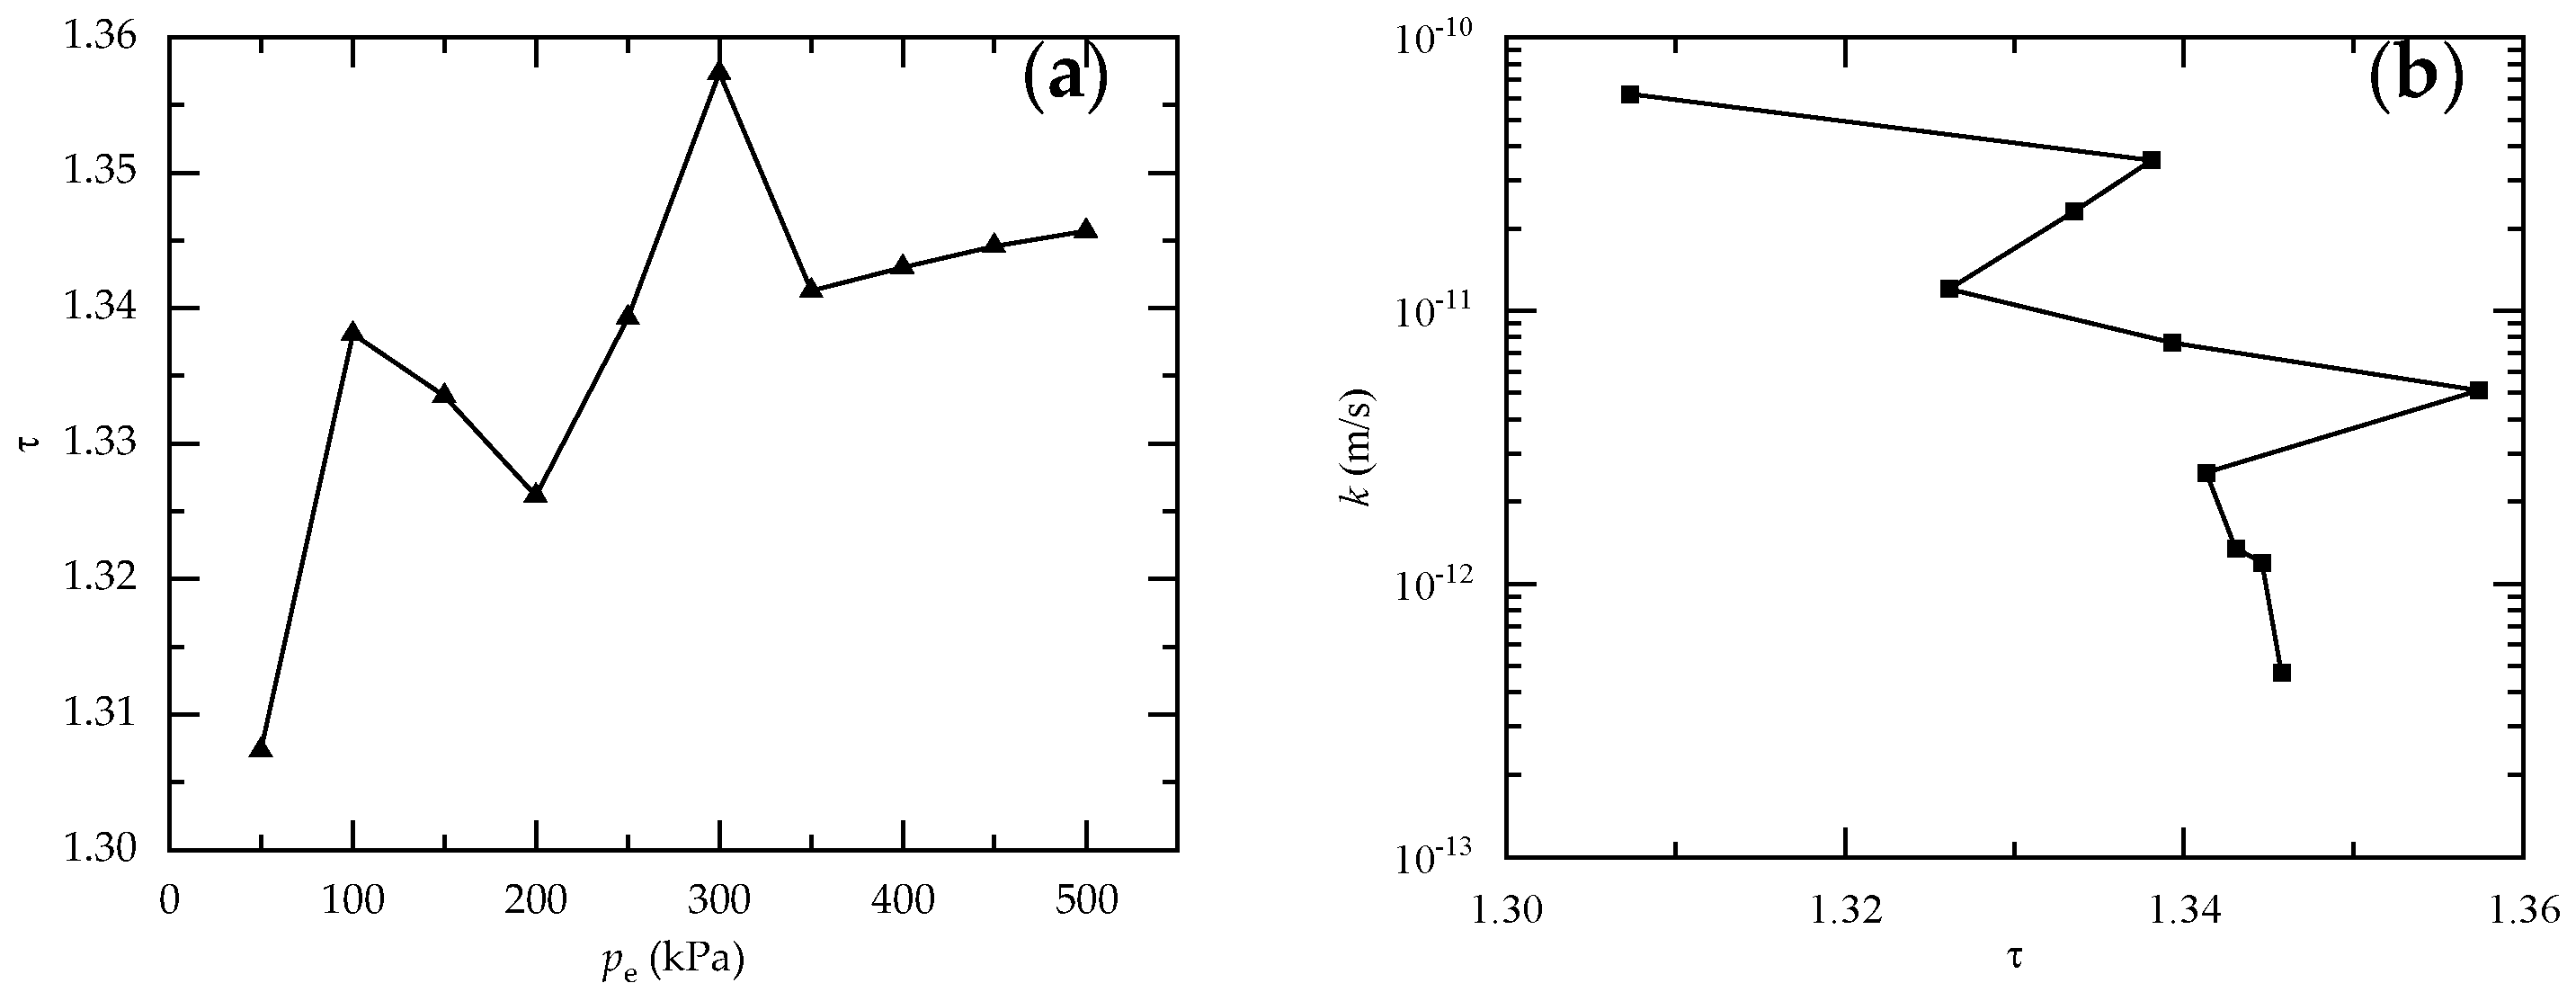
3.2. Effect of Confining Pressure on the Tortuosity of Flow Paths

Figure 7a depicts the relationship between the confining pressure and the tortuosity of the main flow paths within the GCL. The tortuosity of the main flow path shows a slight increase, fluctuating within the range of 1.30 to 1.36, and maintains a value of around 1.34 as the confining pressure rises from 50 kPa to 500 kPa. These fluctuations can be ascribed to several factors, encompassing inherent granule heterogeneity, such as localized structural modifications like compaction and rearrangement of granules, potential anisotropic behavior, and interactions with neighboring granules. These complexities underscore the multifaceted nature of the GCL response to confining pressure, contributing to the observed fluctuations in tortuosity as confining pressure levels vary. In Figure 7b, it is evident that as τ increases, there is a decreasing trend in k. However, k exhibits fluctuations without a clear overall trend.
Figure 8 further provides a detailed depiction of tortuosity under confining pressure conditions of 50, 100, 200, and 300 kPa.
The length of the sample decreases gradually at these confining pressures, measuring 1.165, 1.065, 0.979, and 0.935 mm, respectively. Correspondingly, the lengths of the flow path also decrease gradually to 1.523, 1.425, 1.298, and 1.269 mm, respectively. As a result, tortuosity, defined as the ratio of the flow path length to sample length, increases slightly with rising confining pressure. Therefore, the calculated tortuosity values at these confining pressures are 1.307, 1.338, 1.326, and 1.357, respectively. These findings confirmed a subtle rise in tortuosity with increasing confining pressure levels. As confining pressure rises, the specimen undergoes volume reduction. Additionally, with increasing confining pressure, bentonite granules within the GCL tend to move closer together, gradually converging towards the center. This convergence reduces pore volume and narrows pore channels. However, the relatively unchanged lengths of flow paths offset this narrowing, resulting in only a slight increase in tortuosity.

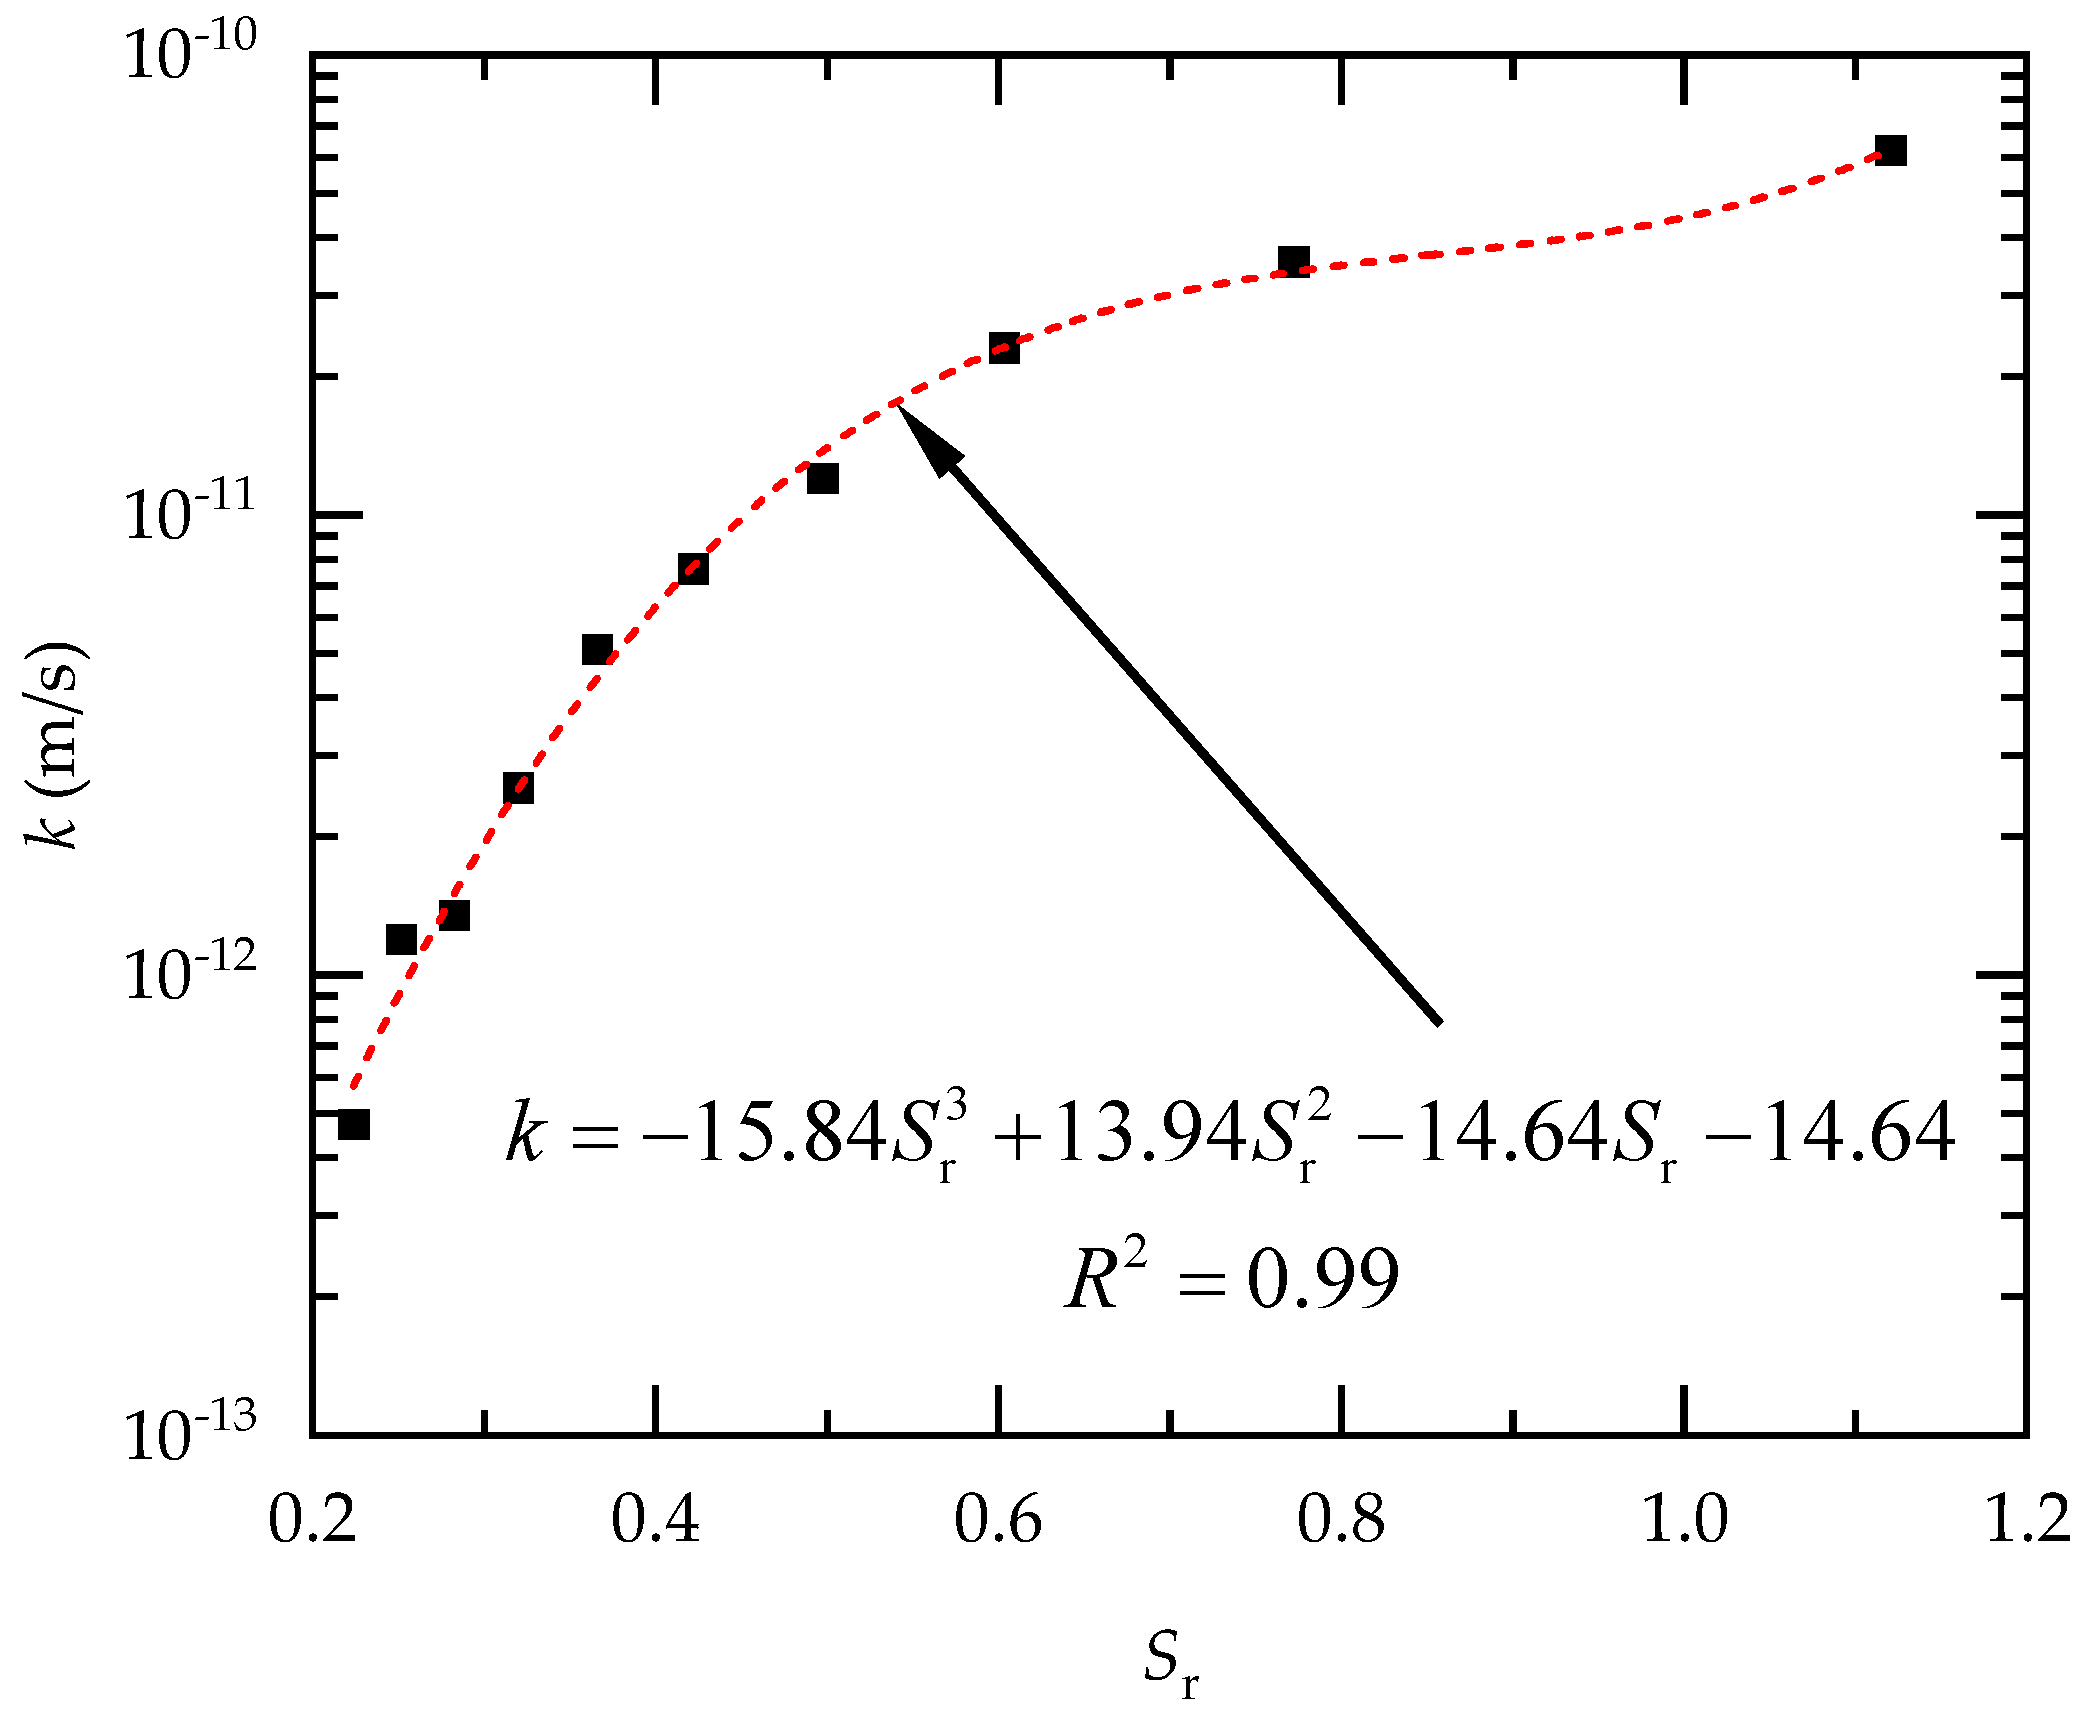
3.3. Effect of Confining Pressure on the Hydraulic Conductivity

Figure 9 illustrates the correlation between hydraulic conductivity (k) and swelling ratio (Sr). The fitted relationship between the hydraulic conductivity calculated numerically using COMSOL and granule swelling rate is expressed as follows.
k = 15.84 S r 3 + 13.94 S r 2 14.64 S r 14.64 ,
where k is the hydraulic conductivity (m/s), and pe is the confining pressure (kPa). The R2 is 0.99. Fitting curves reveal nonlinear behaviors in the relationship.
Figure 10 presents COMSOL-calculated data under confining pressure alongside permeation test data from published papers. It is evident that the simulated values closely align with the experimental data, falling within an order of magnitude and meeting the requirement specified in the standard of 5 × 10⁻¹¹ m/s [36]. Additionally, there is an apparent decrease in hydraulic conductivity as confining pressure increases, showing a linear relationship between confining pressure (pe) and the logarithm of hydraulic conductivity (lgk). This relationship parallels findings from previous studies by Wang et al. [7], which examined the relationship between confining pressure and porosity ratio and the relationship between the porosity ratio and hydraulic conductivity under confining pressure. The permeation model of GCLs under confining pressure effectively predicts hydraulic conductivity. The COMSOL numerical calculations and experimental values exhibit linear variations, also suggesting that the established confining pressure model accurately reflects the actual experimental conditions of GCL. Therefore, these simulation results effectively elucidate microscopic mechanisms such as velocity distribution, pore distribution, and variations within the GCL under confining pressure.
The fitted relationship between the hydraulic conductivity calculated numerically using COMSOL and confining pressure is expressed as follows.
lg k = 10 4.6 × 10 3 p e
where k is the hydraulic conductivity (m/s), and pe is the confining pressure (kPa).
The apparent decrease in hydraulic conductivity with increasing confining pressure can be attributed to several factors. As confining pressure mounts, the bentonite granules within the GCL become more densely packed, leading to a reduction in porosity. This reduction in pore space restricts the movement of water through the GCL, thereby diminishing hydraulic conductivity. Additionally, the increase in confining pressure can cause the granules to settle and compact further, further impeding the flow of water.
The implications of this trend for the design and operation of GCL systems are significant. Firstly, designers must account for the anticipated confining pressure buildup within landfills over time due to waste accumulation. This necessitates the selection of GCL materials and configurations that can withstand and effectively mitigate the effects of increased confining pressure while maintaining satisfactory hydraulic conductivity. Moreover, operational considerations, such as monitoring and managing confining pressure levels within landfill sites, become imperative to ensure the long-term effectiveness of GCL systems in preventing pollution and groundwater contamination.
Figure 11 further depicts the velocity distribution within the specimen under confining pressure conditions of pe = 50 and 300 kPa. At the pe = 50 kPa level, the main flow path, indicated by green solid arrows in Figure 11a, exhibits a minimum width of 5.22 × 10⁻⁵ mm with a corresponding maximum velocity of 1.79 × 10⁻⁷ m/s. The hydraulic conductivity within the GCL is measured at 6.20 × 10⁻¹¹ m/s. However, at the pe = 300 kPa level, the GCL experiences compression with increasing confining pressure, resulting in a reduced domain and an elevated granule density per unit area. This compression leads to a noticeable narrowing of the flow path minimum width to 1.81 × 10⁻⁵ mm, and a decrease in maximum velocity to 4.24 × 10⁻⁸ m/s as indicated by the green dash arrows in Figure 11b. The hydraulic conductivity within the GCL diminishes significantly to 5.11 × 10⁻¹² m/s. Under confining pressure, the velocity distribution within the GCL becomes non-uniform due to the effects of granule packing, tortuosity of flow paths, and variations in hydraulic conductivity. As confining pressure intensifies, the dark blue areas within the granules (see orange boxes in Figure 11a,b) indicate an accumulation of immobile water and a depletion of mobile water, suggesting that the reduced pores primarily comprise mobile porosity. Meanwhile, comparing the zoomed in red boxes in Figure 11a,b, it can be seen that the velocity decreases from 2.63 × 10⁻¹⁰ m/s to 2.25 × 10⁻¹¹ m/s and the width decreases from 0.014 mm to 0.012 mm (see arrows in Figure 11a,b), which indicates that increasing the confining pressure by six times results in one order of magnitude reduction in hydraulic conductivity. This reduction is attributed to domain compression, which reduces distances between bentonite granules, narrowing pore channels and impeding water passage. Variations within the GCL encompass heterogeneities and structural irregularities present within the material. Under confining pressure, these variations may become more pronounced, affecting the overall hydraulic conductivity and mechanical behavior of the GCL.

4. Conclusions

The paper investigates the influence of confining pressure on the microscopic structure and hydraulic conductivity of GCLs, considering factors such as mobile porosity, pore size, and tourists of the main flow path. The main results are as follows:
(1)
The decline in hydraulic conductivity is ascribed to a decrease in interconnected pore channels, influenced by both mobile porosity and pore size, with confining pressure causing granules within GCLs to become more concentrated, thereby accentuating the reduction in pore size. The mobile porosity gradually decreases from 0.273 to 0.104, while the ratio of mobile porosity to total porosity in the swelling process significantly decreases from 0.672 to 0.256 across the confining pressure range from 50 kPa to 500 kPa. The rapid decrease in the ratio of mobile porosity to total porosity in the swelling process compared to the decline in mobile porosity with increasing confining pressure suggests a transition of mobile water towards immobile water.
(2)
The tortuosity of the main flow path shows a slight increase, fluctuating within the range of 1.30 to 1.36, and maintains a value of around 1.34 as the confining pressure rises from 50 kPa to 500 kPa. The variability in tortuosity is due to the natural diversity among the granules, which may lead to localized structural changes, while interactions with neighboring granules further influence these fluctuations.
(3)
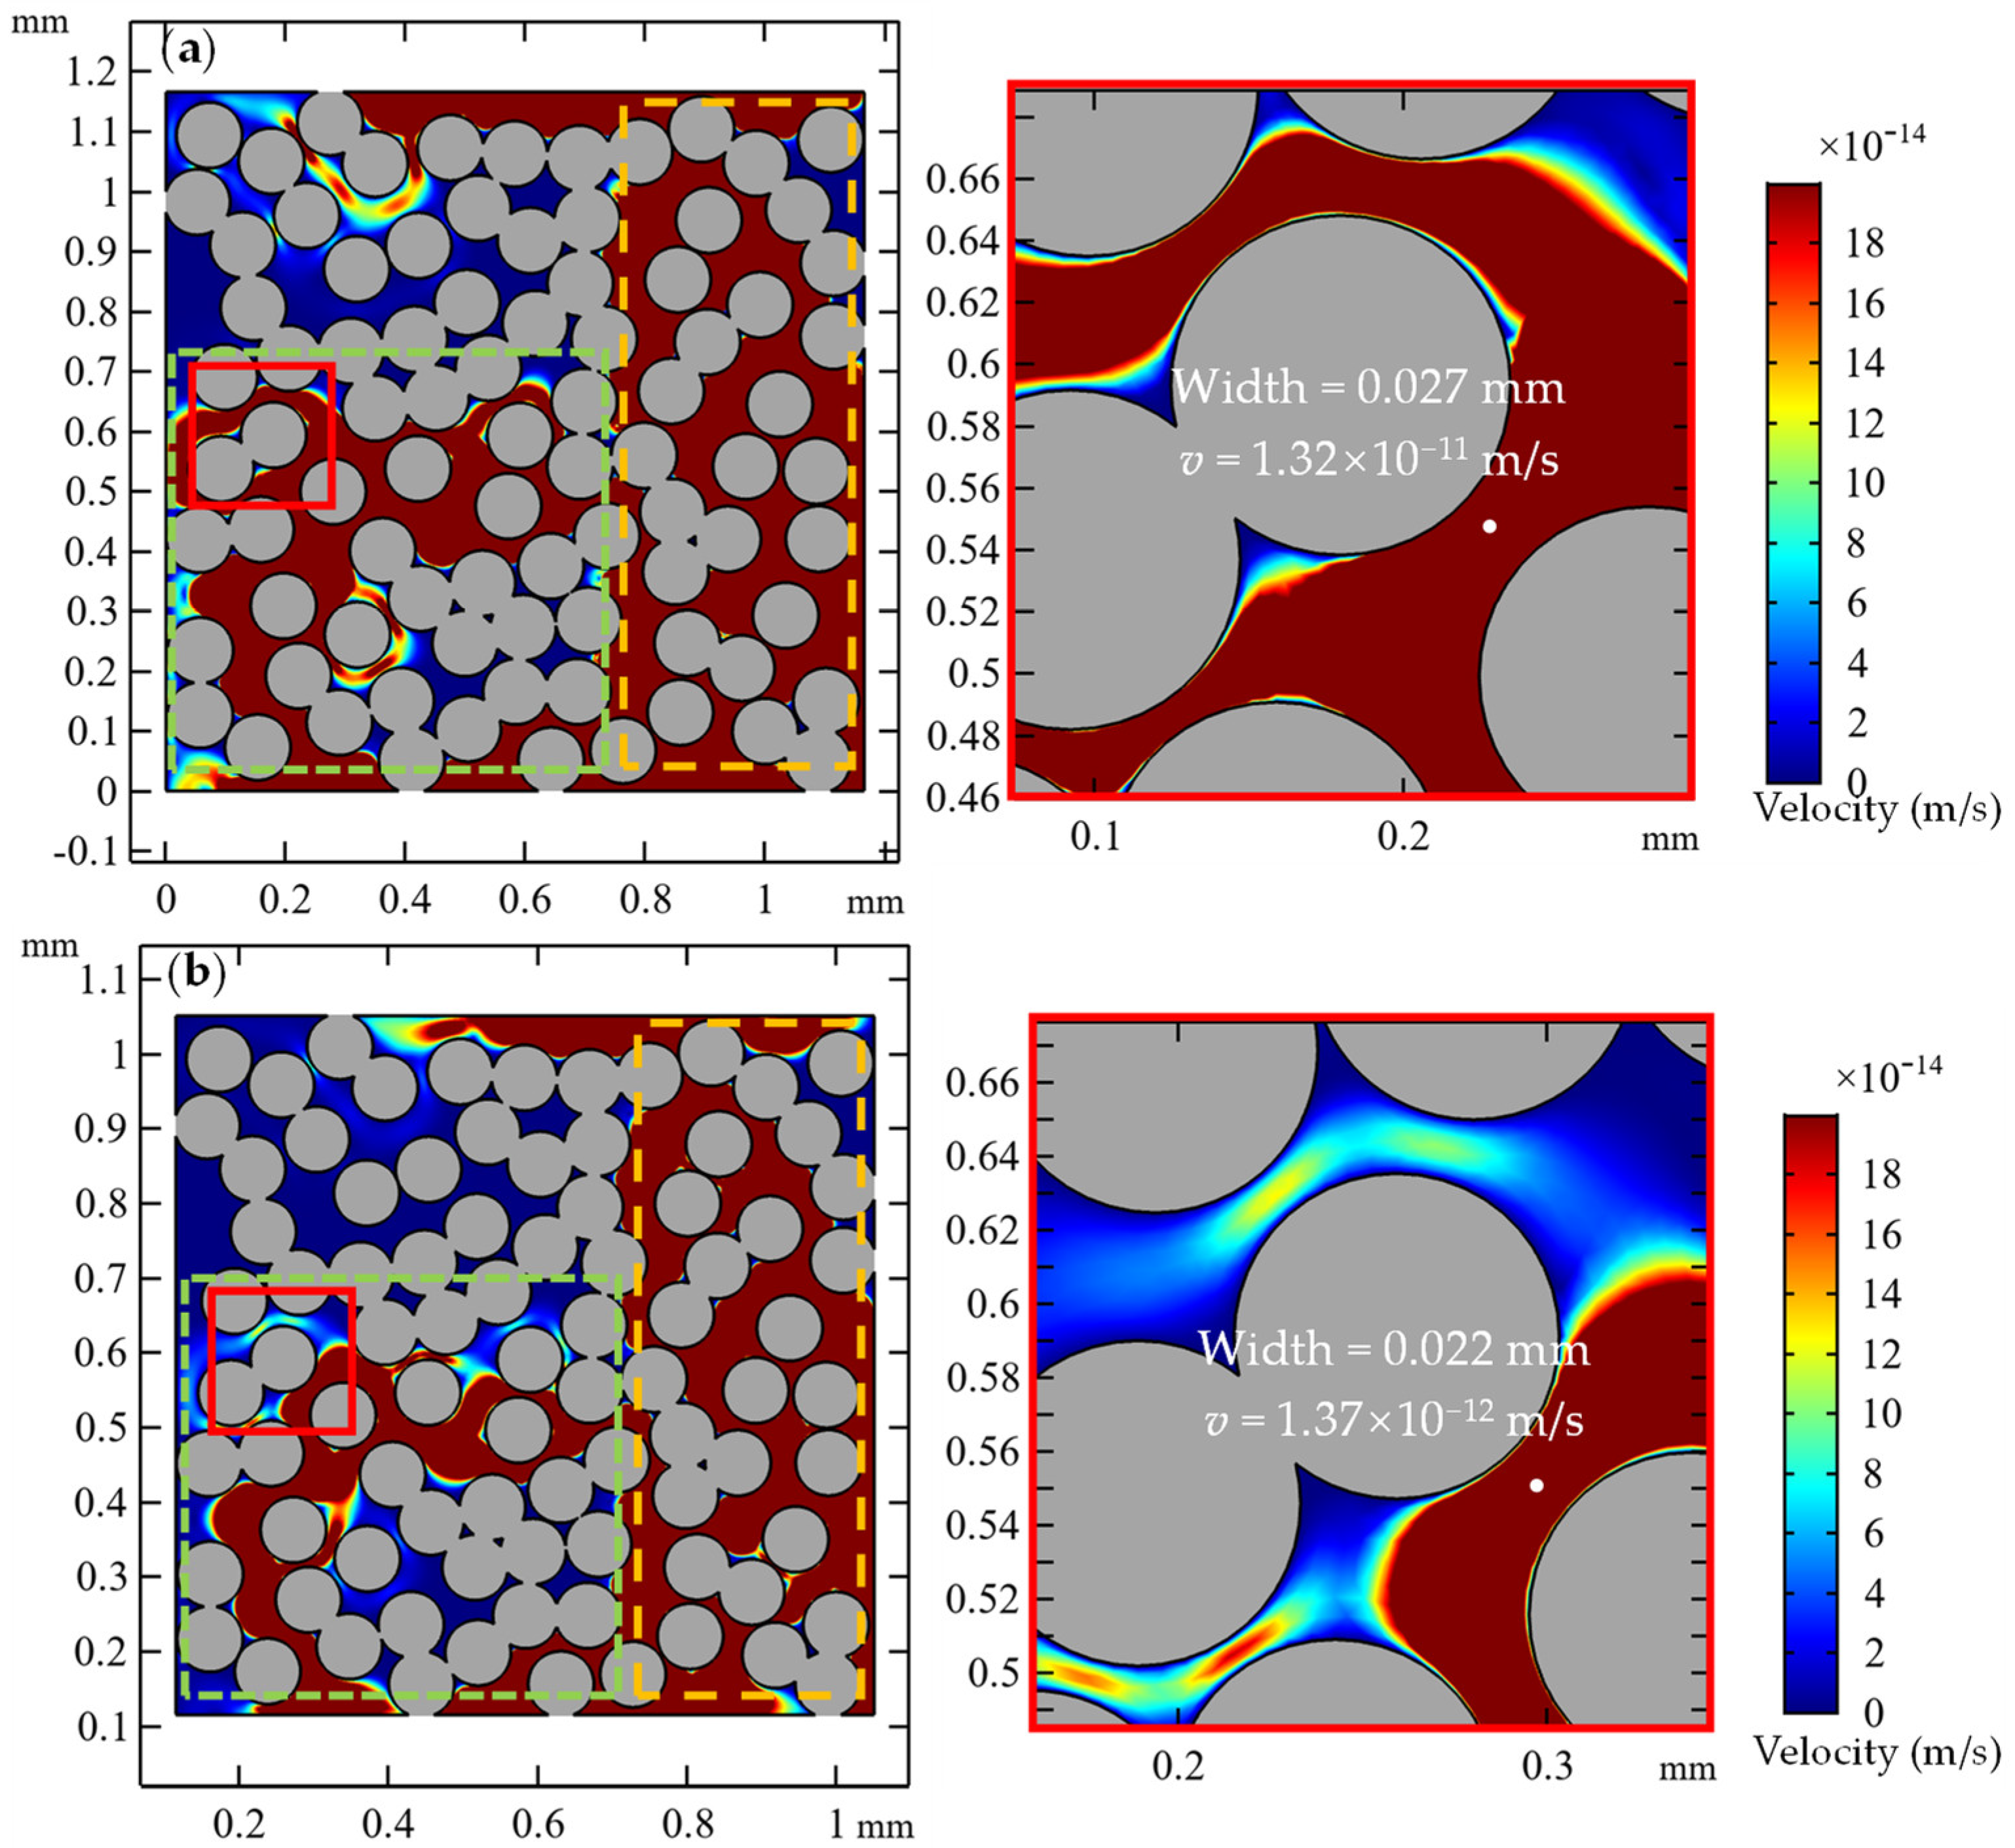
At a confining pressure of 50 kPa, the main flow path has a minimum width of 5.22 × 10⁻⁵ mm and a corresponding maximum velocity of 1.79 × 10⁻⁷ m/s, with a hydraulic conductivity of 6.20 × 10⁻¹¹ m/s. However, at a confining pressure of 300 kPa, the minimum width decreases to 1.81 × 10⁻⁵ mm, accompanied by a decrease in the maximum velocity to 4.24 × 10⁻⁸ m/s. The hydraulic conductivity within the GCL significantly diminishes to 5.11 × 10⁻¹² m/s. A theoretical equation was developed to calculate the hydraulic conductivity of GCL under varying confining pressure conditions, demonstrating a linear relationship between the logarithm of hydraulic conductivity and confining pressure and showing good agreement with the experimental results.
(4)
However, while the model effectively represents the primary mechanism of the GCL, differences in granule distribution and uniformity of the smaller model and larger experimental samples may lead to increased hydraulic conductivity and reduced flow path tortuosity in the latter.

Author Contributions

Conceptualization, J.H.; methodology, J.H. and Y.S.; software, Y.S., C.C. and R.S.; validation, J.H., Y.S., C.C. and R.S.; formal analysis, J.H. and Y.S.; investigation, J.H., Y.S. and C.C.; resources, J.H. and Y.S.; data curation, J.H., Y.S., C.C. and R.S.; writing—original draft preparation, J.H. and Y.S.; writing—review and editing, J.H.; visualization, J.H. and Y.S.; supervision, J.H.; project administration, J.H.; funding acquisition, J.H. All authors have read and agreed to the published version of the manuscript.

Funding

Financial support for Hou’s contributions to this study was provided by the National Natural Science Foundation of China (NSFC) (Nos. 51978390, 51778353), 2023 Basic Research Program of Qinghai Province (2023-ZJ-756), and the China Scholarship Council (CSC 201906895014).

Data Availability Statement

The data presented in this study are available upon request from the corresponding author.

Conflicts of Interest

The authors declare no conflicts of interest.

References

  1. Bouazza, A. Geosynthetic clay liners. Geotext. Geomembr. 2002, 20, 3–17. [Google Scholar] [CrossRef]
  2. Katsumi, T.; Fukagawa, R. Factors affecting the chemical compatibility and the barrier performance of GCLs. In Proceedings of the 16th International Conference on Soil Mechanics and Geotechnical Engineering, Osaka, Japan, 12–16 September 2005. [Google Scholar]
  3. Ahn, H.S.; Jo, H.Y. Influence of exchangeable cations on hydraulic conductivity of compacted bentonite. Appl. Clay Sci. 2009, 44, 144–150. [Google Scholar] [CrossRef]
  4. Weerasinghe, I.; Gallage, C.; Dawes, L. Effect of overburden confining stress on hydraulic performance of geosynthetic clay liners (GCLs). Heliyon 2021, 7, e05770. [Google Scholar] [CrossRef] [PubMed]
  5. Li, Z.; Xu, C. Swelling characteristics and hydraulic properties of GCLs under vertical stress. Chin. J. Geotech. Eng. 2007, 29, 1876–1880. [Google Scholar]
  6. Petrov, R.J.; Rowe, R.K. Geosynthetic clay liner (GCL)-chemical compatibility by hydraulic conductivity testing and factors impacting its performance. Can. Geotech. J. 1997, 34, 863–885. [Google Scholar] [CrossRef]
  7. Wang, B.; Dong, X. Hydraulic conductivity of mine leachate through geosynthetic clay liners under different effective stresses. Rock Soil Mech. 2017, 38, 1350–1358. [Google Scholar]
  8. Özçoban, M.Ş.; Acarer, S.; Tüfekci, N. Effect of solid waste landfill leachate contaminants on hydraulic conductivity of landfill liners. Water Sci. Technol. 2022, 85, 1581–1599. [Google Scholar] [PubMed]
  9. Jo Ho, Y.; Katsumi, T.; Benson Craig, H.; Edil Tuncer, B. Hydraulic conductivity and swelling of nonprehydrated GCLs permeated with Single-Species salt solutions. J. Geotech. Geoenviron. Eng. 2001, 127, 557–567. [Google Scholar] [CrossRef]
  10. Zhang, Z.; Shi, Y.; Zhu, M. Coupled hydro-mechanical-chemical model for clay liner. Chin. J. Geotech. Eng. 2016, 38, 1283–1290. [Google Scholar]
  11. Idiart, A.; Laviña, M.; Cochepin, B.; Pasteau, A. Hydro-chemo-mechanical modelling of long-term evolution of bentonite swelling. Appl. Clay Sci. 2020, 195, 105717. [Google Scholar] [CrossRef]
  12. Hou, J.; Sun, R.; Benson, C.H. Hydrodynamic assessment of bentonite granule size and granule swelling on hydraulic conductivity of geosynthetic clay liners. Geotext. Geomembr. 2023, 51, 93–103. [Google Scholar] [CrossRef]
  13. Hou, J.; Sun, R.; Chu, C.; Karen, M.; Nasser, M. A numerical study of chemical compatibility of GCLs. Appl. Sci. 2022, 12, 2182. [Google Scholar] [CrossRef]
  14. Chen, J.N.; Benson, C.H.; Edil, T.B. Hydraulic conductivity of geosynthetic clay liners with Sodium Bentonite to Coal Combustion Product Leachates. J. Geotech. Geoenviron. Eng. 2018, 144, 04018008. [Google Scholar] [CrossRef]
  15. Wang, B.; Xu, J.; Chen, B.; Dong, X.; Dou, T. Hydraulic conductivity of geosynthetic clay liners to inorganic waste leachate. Appl. Clay Sci. 2019, 168, 244–248. [Google Scholar] [CrossRef]
  16. Ören, A.H.; Akar, R.Ç. Swelling and hydraulic conductivity of bentonites permeated with landfill leachates. Appl. Clay Sci. 2017, 142, 81–89. [Google Scholar] [CrossRef]
  17. Wang, B.; Dong, X.; Chen, B.; Dou, T. Hydraulic conductivity of geosynthetic clay liners permeated with acid mine drainage. Mine Water Environ. 2019, 38, 658–666. [Google Scholar] [CrossRef]
  18. Ren, X.; Zhao, Y.; Deng, Q.; Kang, J.; Li, D.; Wang, D. A relation of hydraulic conductivity—Void ratio for soils based on Kozeny-Carman equation. Eng. Geol. 2016, 213, 89–97. [Google Scholar] [CrossRef]
  19. Acikel, A.S.; Bouazza, A.; Gates, W.P.; Singh, R.M.; Rowe, R.K. A novel transient gravimetric monitoring technique implemented to GCL osmotic suction control. Geotext. Geomembr. 2020, 48, 755–767. [Google Scholar] [CrossRef]
  20. Rowe, R.K. Geosynthetic clay liners: Perceptions and misconceptions. Geotext. Geomembr. 2020, 48, 137–156. [Google Scholar] [CrossRef]
  21. Der, O.; Bertola, V. An experimental investigation of oil-water flow in a serpentine channel. Int. J. Multiph. Flow 2020, 129, 103327. [Google Scholar] [CrossRef]
  22. Kovalev, A.; Yagodnitsyna, A.; Bilsky, A. Plug flow of immiscible liquids with low viscosity ratio in serpentine microchannels. Chem. Eng. J. 2021, 417, 127933. [Google Scholar] [CrossRef]
  23. Bourgès-Gastaud, S.; Stoltz, G.; Sidjui, F.; Touze-Foltz, N. Nonwoven geotextiles to filter clayey sludge: An experimental study. Geotext. Geomembr. 2014, 42, 214–223. [Google Scholar] [CrossRef]
  24. Ren, X.W.; Santamarina, J.C. The hydraulic conductivity of sediments: A pore size perspective. Eng. Geol. 2018, 233, 48–54. [Google Scholar] [CrossRef]
  25. Bian, X.; Cui, Y.; Li, X. Voids effect on the swelling behaviour of compacted bentonite. Géotechnique 2019, 69, 593–605. [Google Scholar] [CrossRef]
  26. Liu, J.; Song, S.; Cao, X.; Meng, Q.; Pu, H.; Wang, Y.; Liu, J. Determination of full-scale pore size distribution of Gaomiaozi bentonite and its permeability prediction. J. Rock Mech. Geotech. Eng. 2020, 12, 403–413. [Google Scholar] [CrossRef]
  27. Studds, P.G.; Stewart, D.I.; Cousens, T.W. The effects of salt solutions on the properties of bentonite-sand mixtures. Clay Miner. 1998, 33, 651–660. [Google Scholar] [CrossRef]
  28. Benson, C.H.; Ören, A.H.; Gates, W.P. Hydraulic conductivity of two geosynthetic clay liners permeated with a hyperalkaline solution. Geotext. Geomembr. 2010, 28, 206–218. [Google Scholar] [CrossRef]
  29. Xiang, G. Theory of Swelling Properties and Mechanism on Swell Attenuation of Bentnoite in Saline Solution. Ph.D. Thesis, Shanghai Jiao Tong University, Shanghai, China, 2015. [Google Scholar]
  30. Xu, Y. Fractals in soil mechanics. Chin. J. Geotech. Eng. 2015, 37, 16–20. [Google Scholar]
  31. Chapman, D.L. A contribution to the theory of electrocapillarity. Lond. Edinb. Dublin Philos. Mag. J. Sci. 1913, 25, 475–481. [Google Scholar] [CrossRef]
  32. Li, X.; Xu, Y. Method for calculating swelling deformation of bentonite in salt solution. Chin. J. Geotech. Eng. 2019, 41, 2353–2359. [Google Scholar]
  33. Xu, Y.F.; Matsuoka, H.; Sun, D.A. Swelling characteristics of fractal-textured bentonite and its mixtures. Appl. Clay Sci. 2003, 22, 197–209. [Google Scholar] [CrossRef]
  34. Hou, J.; Zhang, J.; Sun, Y.; Sun, R.; Liu, F. Effect of particle swelling on hydraulic performance and meso-mechanism of geosynthetic clay liners. Rock Soil Mech. 2023, 44, 8. [Google Scholar]
  35. Ahmadi, M.M.; Mohammadi, S.; Hayati, A.N. Analytical derivation of tortuosity and permeability of monosized spheres: A volume averaging approach. Phys. Rev. E 2011, 83, 026312. [Google Scholar] [CrossRef] [PubMed]
  36. MCC. Technical Code for Liner System of Municipal Solid Waste Landfill (CJJ 113-2007); China Building Press: Beijing, China, 2007. [Google Scholar]
Figure 1. COMSOL geometric model.
Processes 12 00980 g001
Figure 2. Meshing of numerical model.
Processes 12 00980 g002
Figure 3. Schematic diagram of GCL model under confining pressure: (a) pe = 0; (b) pe = 50 kPa; (c) pe = 300 kPa; (d) pe = 500 kPa.
Processes 12 00980 g003
Figure 4. Concept definition of variables: (a) initial state of granule swelling; (b) final state of granule swelling.
Processes 12 00980 g004
Figure 5. The influence of confining pressure on mobile porosity: (a) pe = 50 kPa, nm = 0.273; (b) pe = 300 kPa, nm = 0.222.
Processes 12 00980 g005
Figure 6. Influence of confining pressure on porosity and hydraulic conductivity: (a) influence of confining pressure on mobile porosity and the ratio of mobile porosity to total porosity in swelling process; (b) influence of mobile porosity on hydraulic conductivity.
Processes 12 00980 g006
Figure 7. The hydraulic conductivity influenced by changes in the tortuosity of flow paths under different confining pressures: (a) influence of confining pressure on tortuosity; (b) influence of tortuosity on hydraulic conductivity.
Processes 12 00980 g007
Figure 8. Influence of confining pressure on tortuosity: (a) pe = 50 kPa, τ = 1.307, Lt = 1.523 mm, Ls = 1.165 mm; (b) pe = 100 kPa, τ = 1.338, Lt = 1.425 mm, Ls =1.065 mm; (c) pe =200 kPa, τ = 1.326, Lt = 1.298 mm, Ls = 0.979 mm; (d) pe = 300 kPa, τ = 1.357, Lt = 1.269 mm, Ls = 0.935 mm.
Processes 12 00980 g008
Figure 9. Influences of swelling ratio on hydraulic conductivity.
Processes 12 00980 g009
Figure 10. Simulated versus experimental results under confining pressure [3,7,14,15,17].
Processes 12 00980 g010
Figure 11. The influence of confining pressure on flow velocity and hydraulic conductivity: (a) pe = 50 kPa, k = 6.20 × 10⁻¹¹ m/s; (b) pe = 300 kPa, k = 5.11 × 10⁻¹² m/s.
Processes 12 00980 g011
Table 1. The confining pressure model’s parameters.
ParametersSymbolValue
Specific gravity of granulesGs2.75 [27]
Montmorillonite contentCm (%) 72 [28]
Surface fractal dimensionDs2.65 [29]
Swelling coefficientK17.69 [29]
Initial porosityn00.5
Dry densityρd (g/cm3)1.376
Initial granule sized0 (mm) 0.1
Table 2. Sample length table under confining pressure.
pe (kPa)εsvεmax (%) Ls (mm)
504.50112.01.165
1003.5377.11.065
1503.0660.31.013
2002.7749.70.979
2502.5642.20.954
3002.4036.50.935
3502.2832.00.919
4002.1728.20.906
4502.0825.10.895
5002.0122.30.885
Disclaimer/Publisher’s Note: The statements, opinions and data contained in all publications are solely those of the individual author(s) and contributor(s) and not of MDPI and/or the editor(s). MDPI and/or the editor(s) disclaim responsibility for any injury to people or property resulting from any ideas, methods, instructions or products referred to in the content.

