Article

Modeling Internal Flow Patterns of Sessile Droplets on Horizontally Vibrating Substrates

School of Energy and Power Engineering, University of Shanghai for Science and Technology, Shanghai 200093, China
*
Author to whom correspondence should be addressed.
Processes 2024, 12(4), 667; https://doi.org/10.3390/pr12040667
Submission received: 7 March 2024 / Revised: 21 March 2024 / Accepted: 25 March 2024 / Published: 27 March 2024
(This article belongs to the Section Manufacturing Processes and Systems)

Abstract

:
A three-dimensional Navier–Stokes and continuity equation model is employed to numerically predict the resonant modes of sessile droplets on horizontally vibrating substrates. A dynamic contact angle model is implemented to simulate the contact angle variations during vibrations. The four resonant modes (n = 1, 2, 3 and 4) of a droplet under horizontal vibrations are investigated. Simulations are compared to experimental results for validation. Excellent agreement is observed between predicted results and experiments. The model is used to simulate the internal flow patterns within the droplet under resonant modes. It is found that the flow in all four resonant modes can be divided into the Stokes region, the gas–liquid interface region, and the transition region located in between. Numerical simulations show that the average velocity within the droplet increases with the increase in frequency, while the fluctuations in average velocity after reaching the steady state show different trends with the increase in frequency. It is also found that with an increase in the order of resonant modes, the contact angle difference between the two sides of the droplet increases, and the contact angle difference of the droplet is maximized when the applied frequency is the resonant frequency of the specified mode.

1. Introduction

Evaporation of sessile droplets on a solid substrate has important applications in the fields of microfluidics, coating deposition, self-assembly of microstructures, and nanofabrication [1,2,3,4]. In all of these applications, it is important to understand the evaporation and contact line dynamics, and the internal flow patterns and transport of dispersed phases within the droplet, in order to ensure that the evaporation and deposition processes are controllable. In many cases, external fields have been imposed to control the evaporation dynamics and deposition patterns [5]. Vibration is one of these methods [6,7,8], and can manipulate the internal flow and achieve possible control of spatial–temporal deposition by simply imposing mechanical vibrations on the surface.
The study of free droplet vibrations can be traced back to Rayleigh [9]. Later, Lamb [10] and Kelvin [11] ignored the viscous damping in droplets and developed a general expression for the different modes of free droplets under resonant frequencies of droplets. In recent years, studies have focused on the oscillation of droplets in partial contact with a substrate undergoing both vertical and horizontal vibrations. Strani and Sabetta [12] theoretically analyzed the droplet vibration pinned on a solid surface. They found that the shape of the first mode of the pinned droplet on the solid surface is similar to that of the second mode of the free droplet, and the dimensionless natural frequency in the nth vibrational mode can be expressed as a function of the ratio of the contact radius to the droplet radius. The study also found that the droplets attached to the solid surface have an additional low-frequency mode, which later researchers called the rocking mode. Celestini and Kofman [13] performed a quantitative analysis of this resonant mode and confirmed its existence. Noblin et al. [14,15] studied the effect of vertical vibrations on sessile droplets deposited on the substrate. By varying the frequency and amplitude of the vertical displacement, they observed two types of oscillating modes: axisymmetric modes with a pinned or moving contact line, and non-axisymmetric modes combining surface modes and contact line motion. Other researchers also observed similar results [6,7,8,16,17].
In addition to the studies of oscillating modes, efforts have been devoted to investigating the motion of droplets on vibrating substrates [18,19,20,21,22]. It was found that the effect of contact angle hysteresis was partially or completely mitigated by vibrations, and the vibrating frequency of the substrates (either asymmetric roughness or wettability gradient) must match the resonant frequency of the droplet to achieve maximum droplet motion efficiency. Vibrations also induce flow within the droplet [6,7,8,16,17,23,24,25,26]. Experimental studies are mainly carried out using particle image velocimetry (PIV) to observe the internal flow within droplets. Kim [25] and Park [26] studied the flow patterns inside vertically vibrating droplets on hydrophobic surfaces under resonant modes 2, 4, 6, and 8. The internal flow in modes 2 and 4 exhibits a Y-shape, while two large vortices are formed in modes 6 and 8. These studies provide insights into the understanding of vibration-induced internal flow within droplets. However, the refraction of the light at the curved vapor–liquid interface makes it difficult to accurately measure the flow field within the droplet using the PIV as visual method, especially for the high ratio of the refractive indices between the liquid and vapor phases. Even after applying a correction and recovery method [27,28], approximately 5–20% of the flow information was lost near the interface. In addition, the vibration introduced additional difficulties in measuring the true flow field inside an oscillating droplet.
Numerical simulations provide an alternative approach to investigating the internal flow patterns of an oscillating droplet on a vibrating substrate. The objective of this work was to use numerical simulations to reveal detailed information on the internal flow within the droplet induced by horizontal vibrations. A three-dimensional model of the vibrating droplet is solved by using the volume of fluid functions and continuous surface force (VOF-CSF) model [29,30]. A dynamic contact angle model developed by Kistler [31] is implemented in the VOF-CSF model to simulate the contact angle variations during vibrations. The four resonant modes (1, 2, 3, and 4) of the droplet under horizontal vibrations were investigated, and the internal flow patterns of the droplet were predicted.

2. Mathematical Model

2.1. Physical Description and Assumptions

Figure 1 shows the schematic diagram of an oscillating droplet on a horizontal vibrating substrate. The vibration direction is perpendicular to the direction of gravity. The initial shape of the droplet is represented by the red dash line, and the shape after vibration is represented by the black solid line. When the contact angle hysteresis is big enough, it is reasonable to assume that the three-phase contact line of the droplet remains pinned while the droplet deforms. R and θ 0   are the initial radius and initial contact angle of the droplet, respectively. To investigate the oscillating modes and internal flow within a droplet attached to a horizontal vibrating substrate, the following assumptions are made.
(1)
The flow inside the droplet is incompressible and non-axisymmetric under the horizontal vibration, and the contact line of the droplet remains pinned.
(2)
Since the oscillation period of droplets is much smaller than the evaporation time of droplets, evaporation is not considered during vibrations.
(3)
The radius of the droplet is less than the capillary length l c of the droplet ( l c = σ / ρ g , about 2.73 mm for water, where g is the acceleration of gravity, σ   is the surface tension, and ρ is the density of the liquid), the influence of gravity on the shape of the droplet is negligible compared to the surface tension, and the droplets on the substrate are assumed to be spherical caps.

2.2. VOF-CSF Model

Based on the above assumptions, the VOF-CSF model was adopted to simulate the internal flow of a horizontally vibrating droplet. In the volume of fluid (VOF) function model, the free interface is determined by solving the fluid volume function. Therefore, the variable α , which denotes the volume fraction of one of the phases, is introduced. Navier–Stokes 3D equations, a continuity equation, and VOF advection equations were solved for a domain comprising two fluids. The governing equations of the model are as follows [30].
Continuity equation:
  t α s + α s v s = 0 ,
where α s is the volume fraction of the second phase and v s is the velocity of the second phase. The sum of the volume fraction of the primary phase and the second phase is 1.
α p + α s = 1 .
Momentum equation:
ρ v t + ρ v v = p + μ v + v T + ρ g + F ,
where p is the static pressure, v = u , v , w is the velocity vector, F is the source term due to the surface tension, and ρ and μ represent the average density and the viscosity, respectively.
ρ = α s ρ s + 1 α s ρ p ,
μ = α s μ s + 1 α s μ p
The subscripts p and s in Equations (4) and (5) represent the primary phase and the second phase, respectively. The surface tension force F in the momentum equation was calculated using the continuous surface tension model (CSF) proposed by Brackbill et al. [29]. It assumes the surface tension force in the VOF calculation as a body force and adds a source term to the momentum equation. The F in the CSF model is given as follows [29].
F = σ ρ κ s α s 1 2 ρ p + ρ s ,
where σ is the surface tension of the gas–liquid interface and κ s is the curvature of the gas–liquid interface, which is calculated according to the outward unit normal vector by:
κ s = n ,
The outward unit normal vector is calculated by:
n = α s / α s
When the continuous surface tension model is used in the VOF model, the contact angle of the substrate needs to be given, which is used to adjust the normal direction of the element surface near the substrate. The normal vector of the element near the substrate is given by:
n = n w cos θ + t w sin θ ,
where n w and t w are the unit normal vector and the tangent vector of the substrate, respectively, and θ is the contact angle.

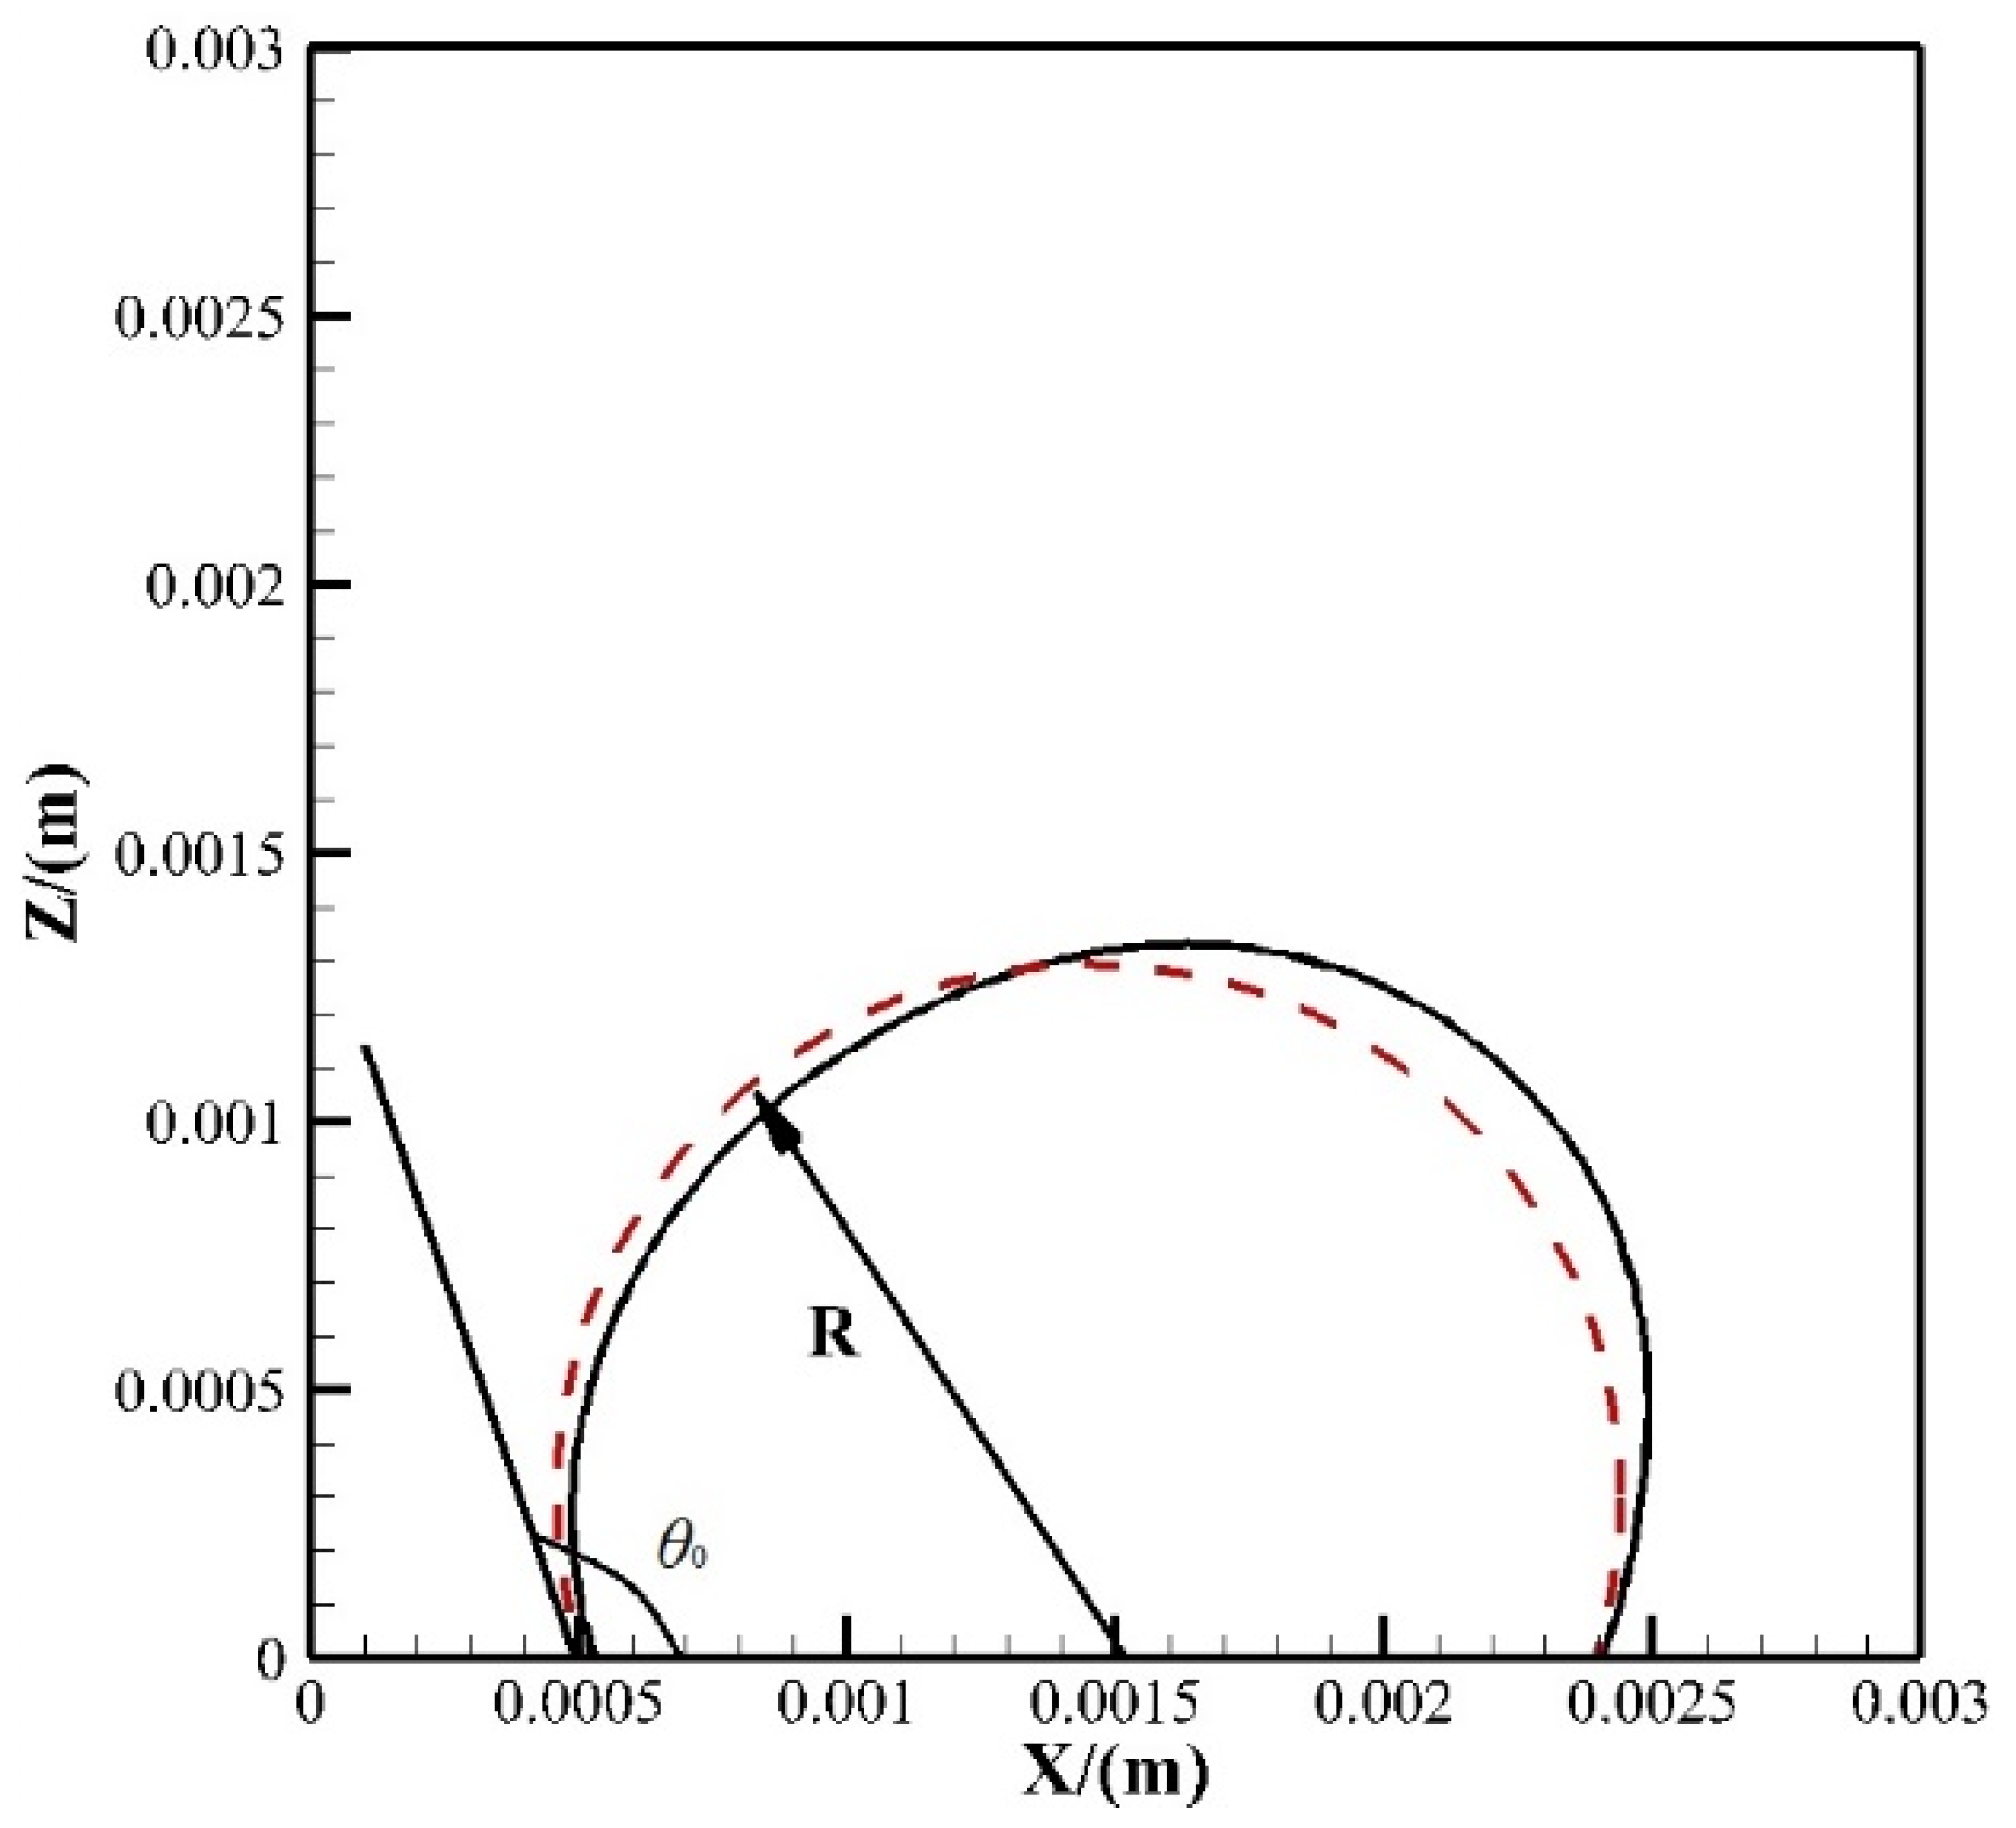
2.3. Dynamic Contact Angle Model

It is necessary to consider the dynamic change of the contact angle in order to perform a correct numerical simulation of the internal flow of the droplet [32]. Based on experimental studies, the dynamic contact angle is related to the movement of the contact line, the physical properties of the droplet, and the static contact angle. Kistler’s model [31] is used to predict the dynamic contact angle during the oscillation of the droplet:
θ D = f Hoff C a + f Hoff 1 θ 0 ,
f Hoff x = arccos 1 2 tan h 5.16 x 1 + 1.31 x 0.99 0.706 ,
C a = μ u σ ,
where f H o f f 1 is the inverse function of f H o f f , θ 0 is the initial contact angle, θ D is the dynamic contact angle, C a is the capillary number, and u is the moving speed of the contact line.

2.4. Boundary Conditions

Figure 2 shows the computational domain, which is a cube with a size of 3   m m × 3   m m × 3   m m . A 0.04 mm uniform grid was selected after the validation of the accuracy of different grid sizes. The boundary conditions on the substrate are no-slip ones:
u = U p ,   v = 0 ,   w = 0 ,
U p = 2 π f A cos ( 2 π f t ) ,
where U p is the velocity of the vibrating substrate and A and f are the amplitude and frequency of the vibration, respectively.
The resonant frequencies of free droplets, called Rayleigh resonant frequency, can be calculated as follows [9,10]:
ω = l ( l 1 ) ( l + 2 ) σ 3 π m ,
where ω represents the resonant frequency of the droplet and m and σ represent the droplet mass and surface tension, respectively, while l is an integer representing the number of modes, which is not fewer than 2.
In the simulations, PISO (pressure implicit operator segmentation algorithm) was used to couple velocity and pressure, the second-order upwind scheme was used to discrete the model equations, and the gas–liquid interface was processed by geometric reconstruction.

3. Results and Discussion

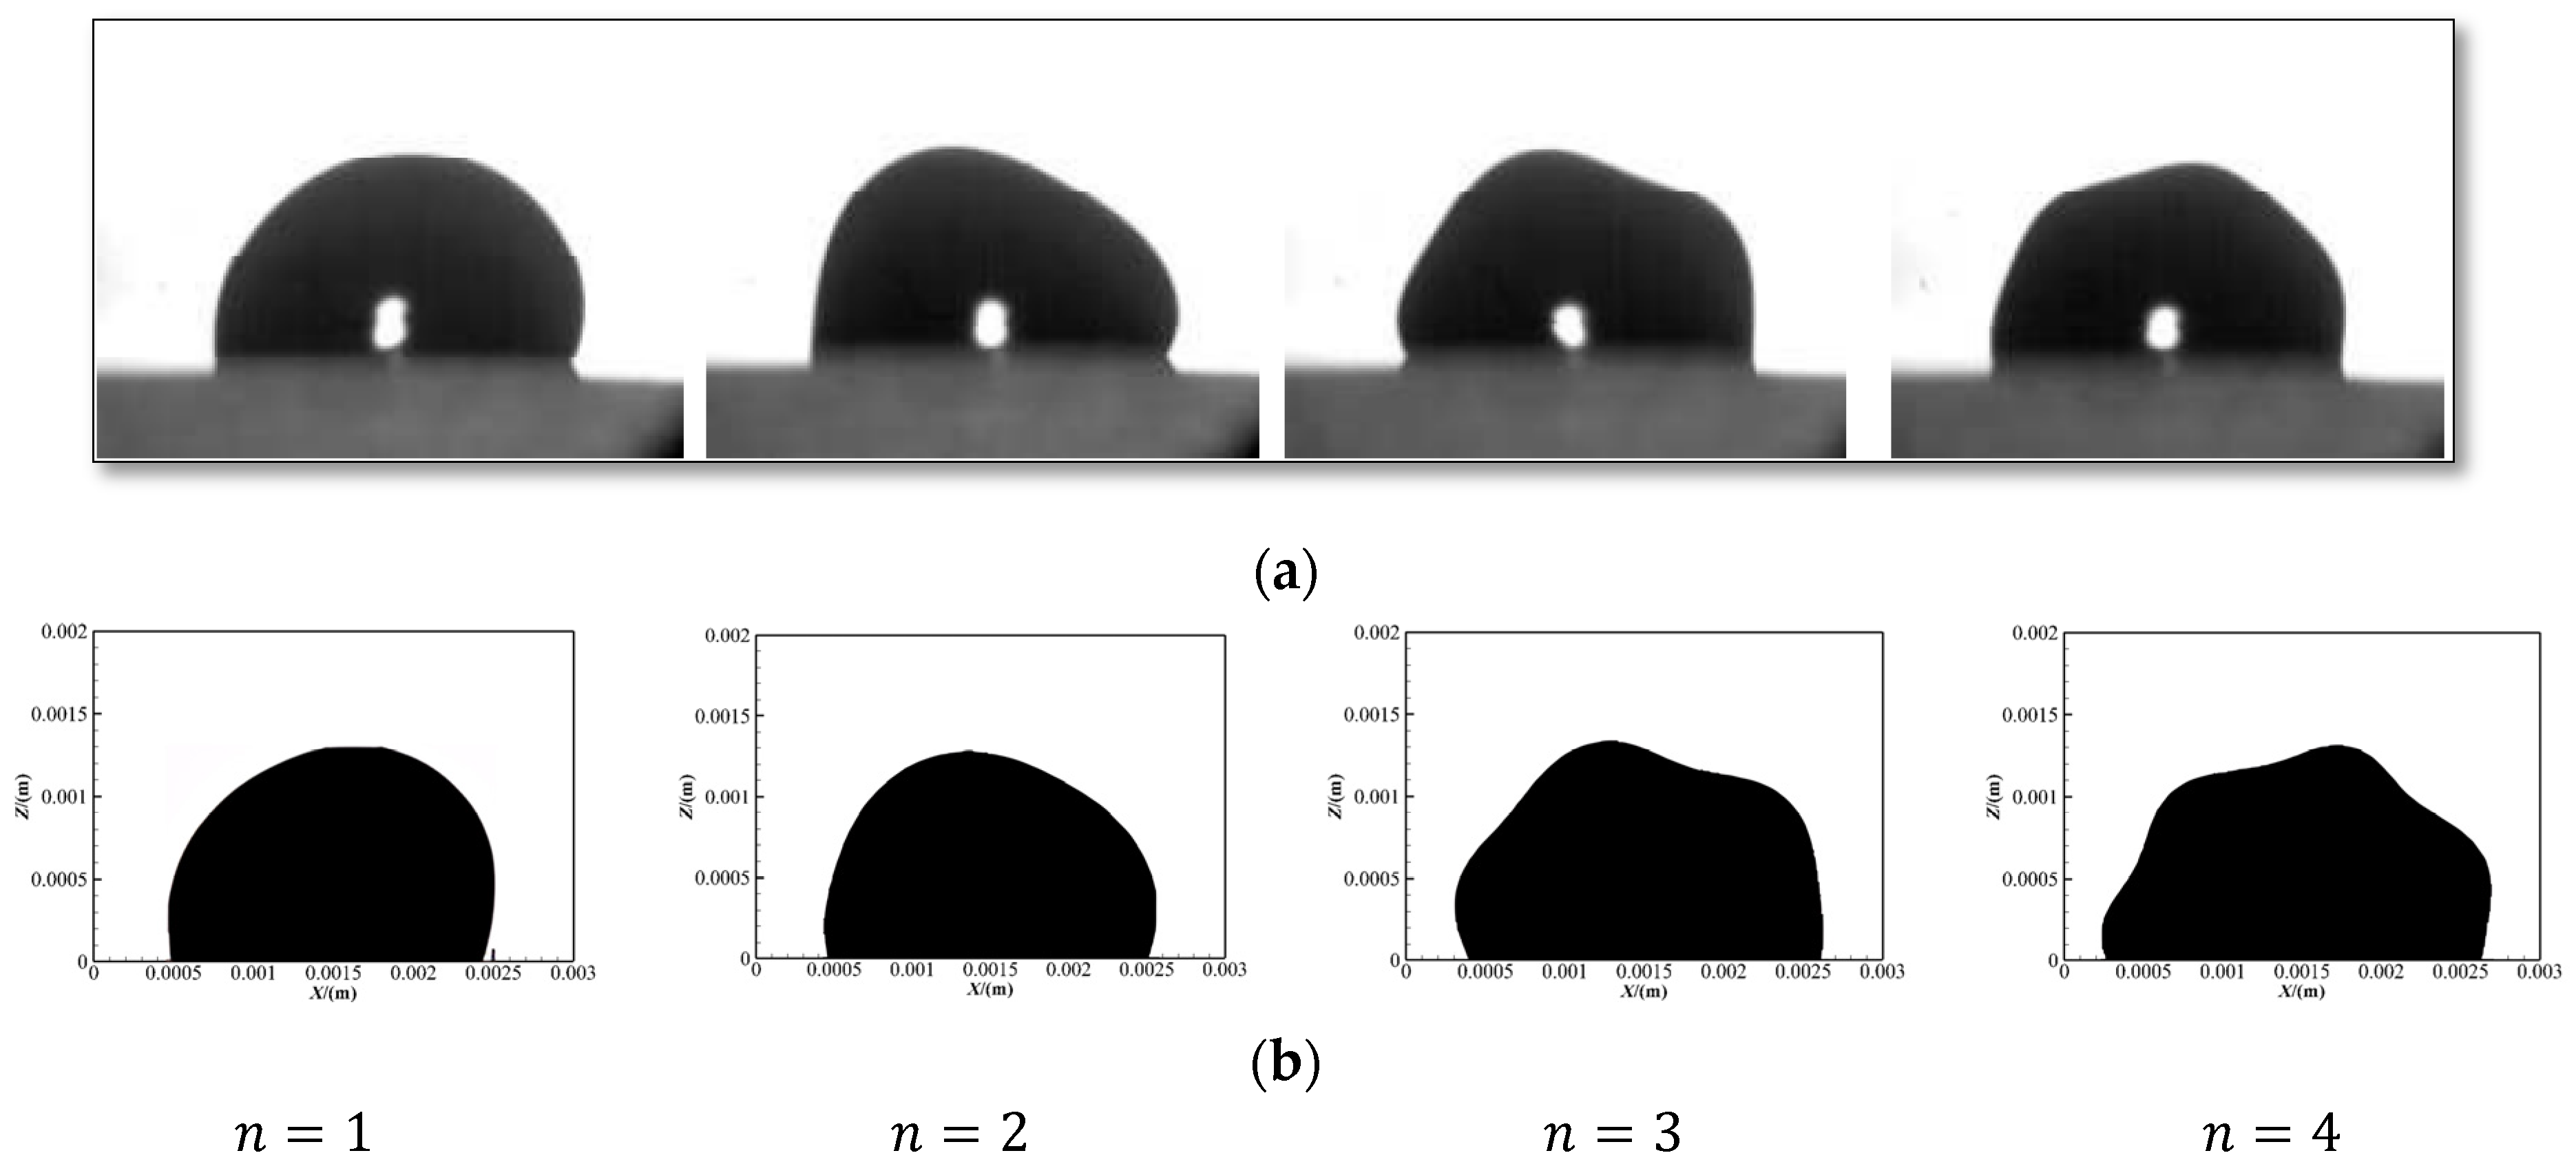
3.1. Model Validation

Figure 3 shows the comparison between the simulation results of the four resonant modes of the droplet and the experimental results [33] under the horizontal vibration. The initial contact angle of the droplet is 110°, the amplitude A is 0.5 mm, and the droplet radius is 1 mm. Figure 3a shows the experimental results of the droplet resonant modes and Figure 3b the simulation results. The first mode (n = 1) in Figure 3 corresponds to the rocking mode, and the second (n = 2), third (n = 3) and fourth (n = 4) modes correspond to Rayleigh’s first ( l = 2 ), second ( l = 3 ) and third ( l = 4 ) modes, respectively. The resonant frequencies corresponding to the four modes are 60 Hz, 130 Hz, 290 Hz and 450 Hz, respectively. It is observed that some lobes appear on the surface of the droplet under the three Rayleigh modes. This is due to the pressure difference along the interface of the droplet induced by vibration, and surface waves are formed under the pressure difference. In Rayleigh modes, the lobes along the droplet surface increase with the increase in the modal order. However, in the rocking mode, there is no obvious lobe appearing along the droplet surface, which is a result of the lower vibration frequency. It can be seen from the comparison that the simulated results are in good agreement with the experimental results, which verifies the reliability of the model.

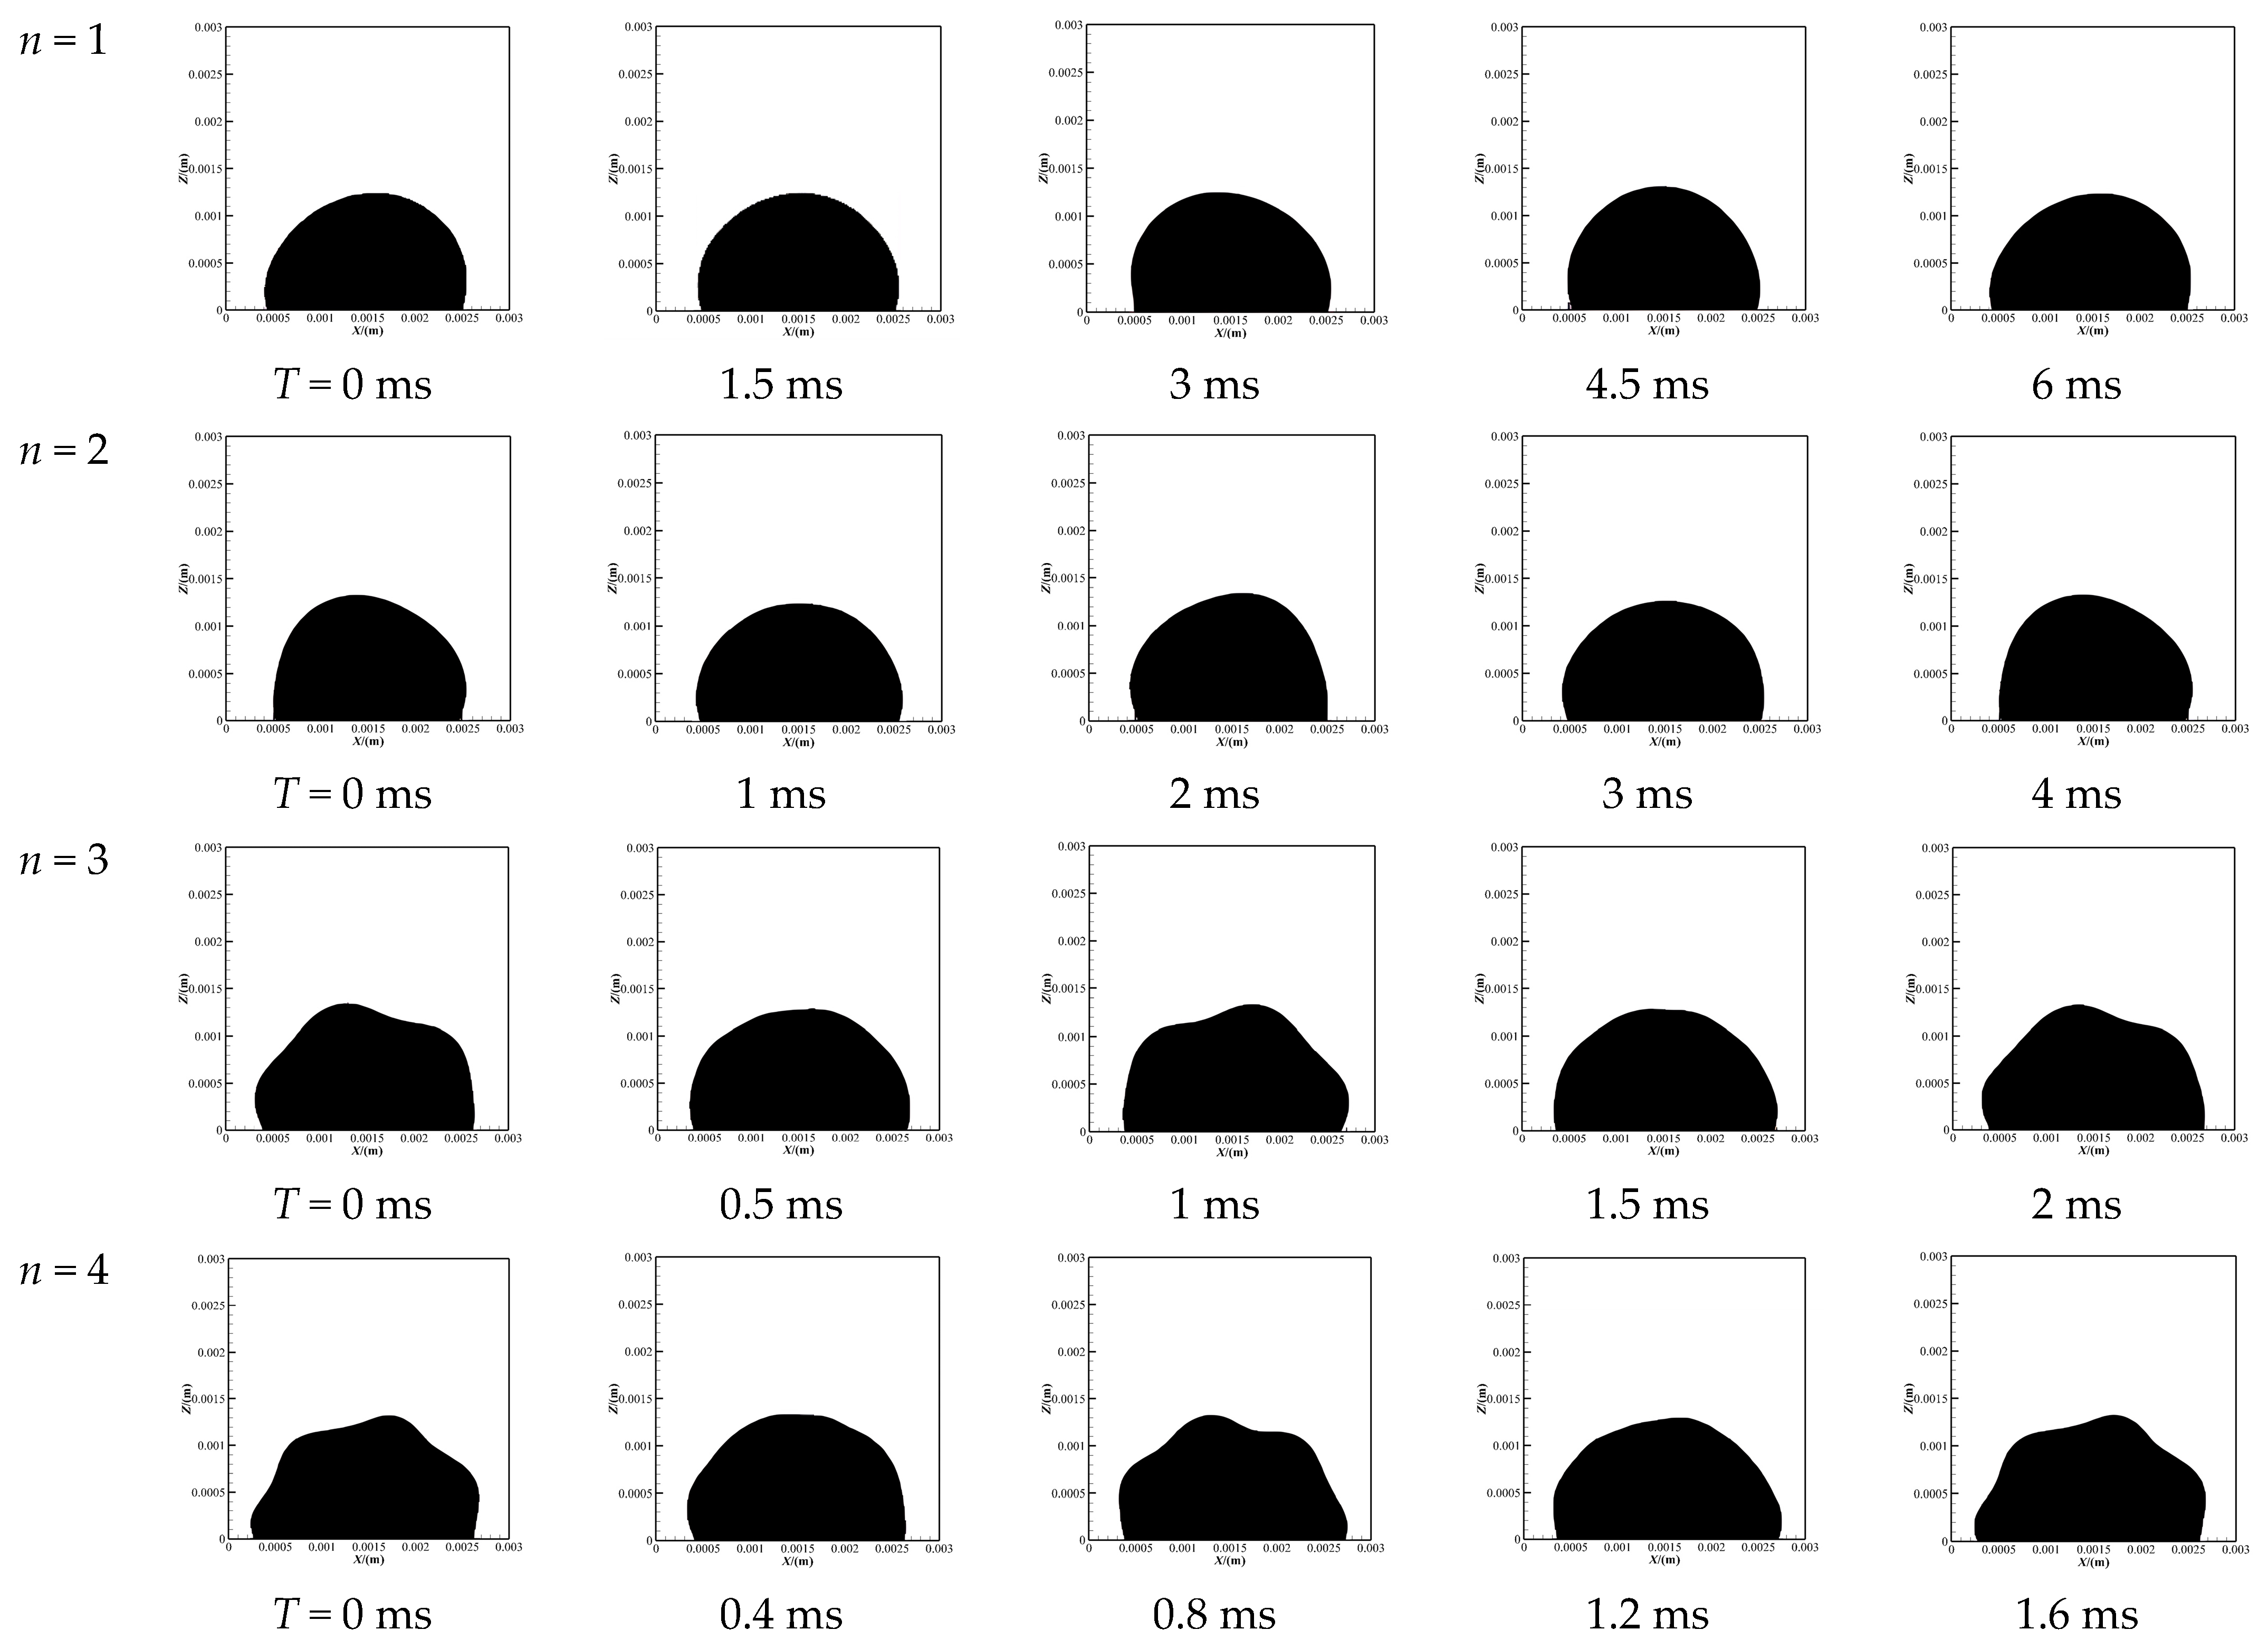
3.2. The Evolution of Droplet Oscillation Modes

Under the condition of horizontal vibrations (x direction) of the substrate, the shape of the droplet is asymmetric. When observing the shape of the droplet from the x–z and the y–z cross sections, it is found that the droplet has a change in height in the y–z cross section, but there is no obvious left or right deformation. However, it is observed from the x–z cross section that with the horizontal vibration, the left and right deformation of the droplet is obvious. Therefore, this section focuses on the analysis of the evolution process of the droplet oscillation on the x–z cross section.
Figure 4 shows the evolution of the droplet shape under four resonant modes. As the order of the resonant mode increases, the vibration period of the droplet decreases from 6 to 1.6 ms as the resonant frequency increases. The last phase of the previous cycle coincides with the first phase of the next cycle. During the vibration, the oscillation of the mass center causes differences in the contact angle on both sides of the droplet, and the droplet deforms due to the inertial force of internal flows. In addition, the droplet deformation is related to the increase in droplet surface area and the local curvature change of the droplet surface. The Laplace pressure works along the interface of the droplet, and the restoring force induced by the droplet deformation tries to reduce the surface area and restore the droplet to its original shape. The interaction of the Laplace pressure and the restoring force results in the propagation of surface waves along the droplet surface to form lobes.

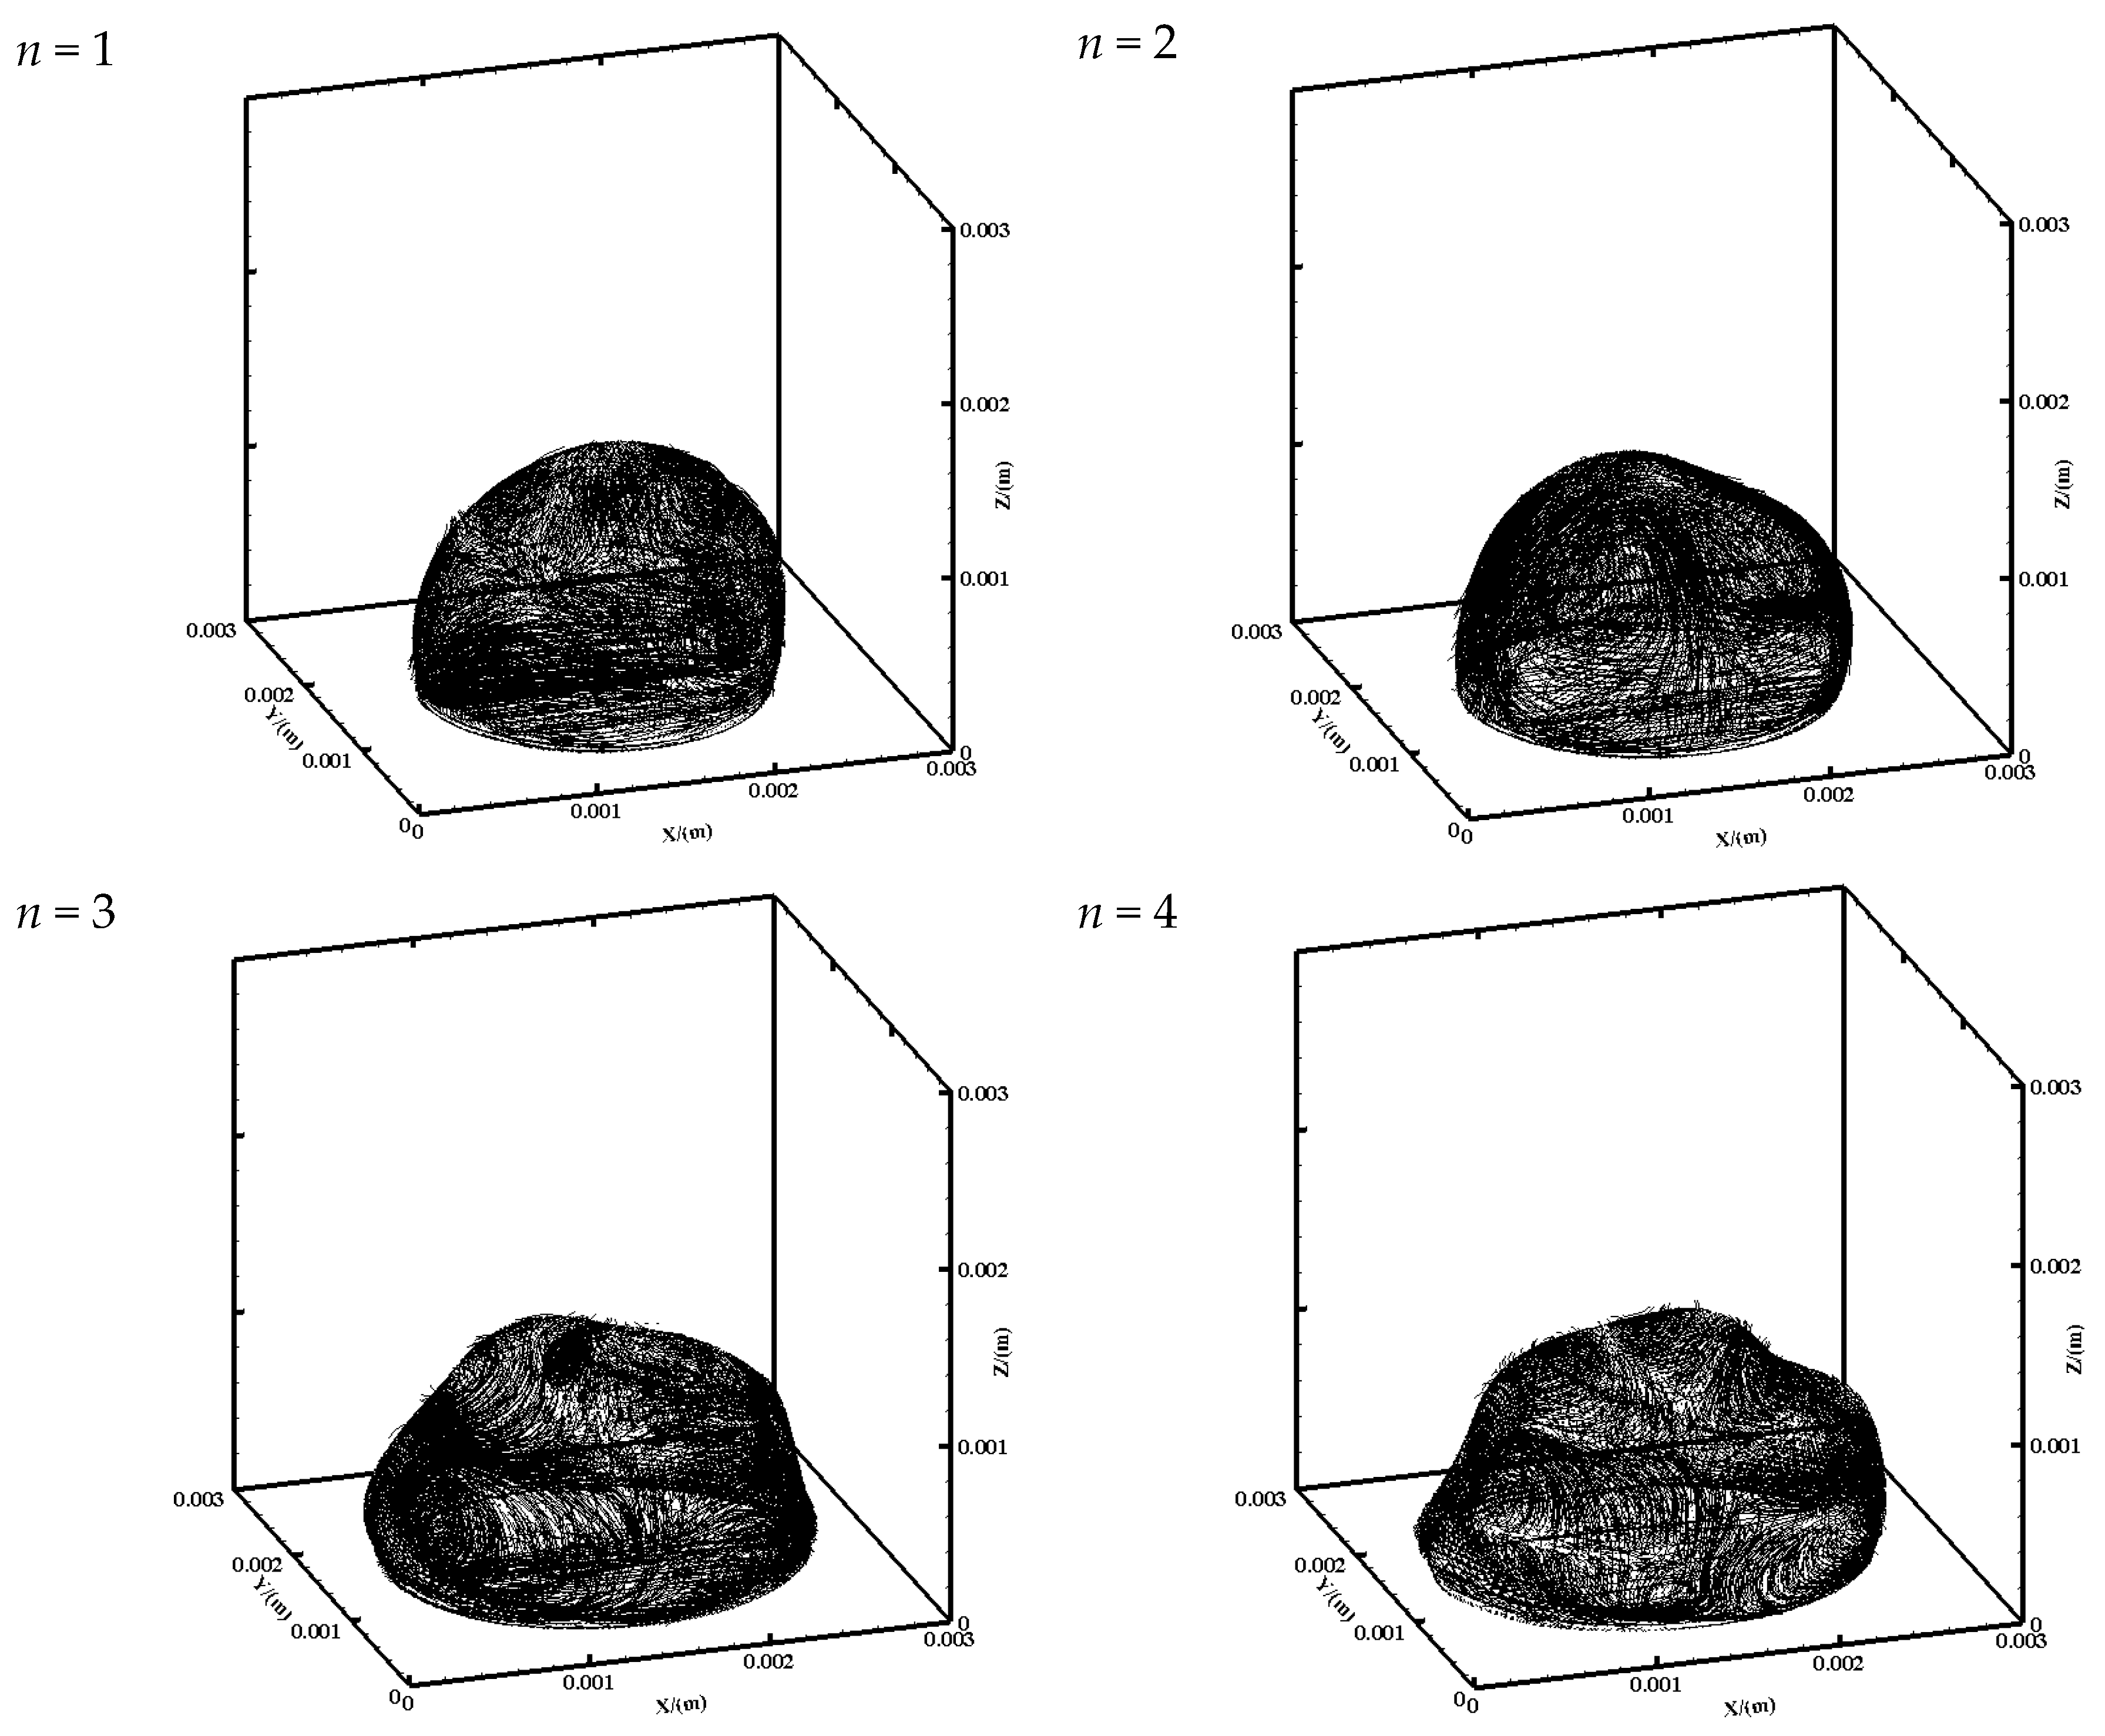
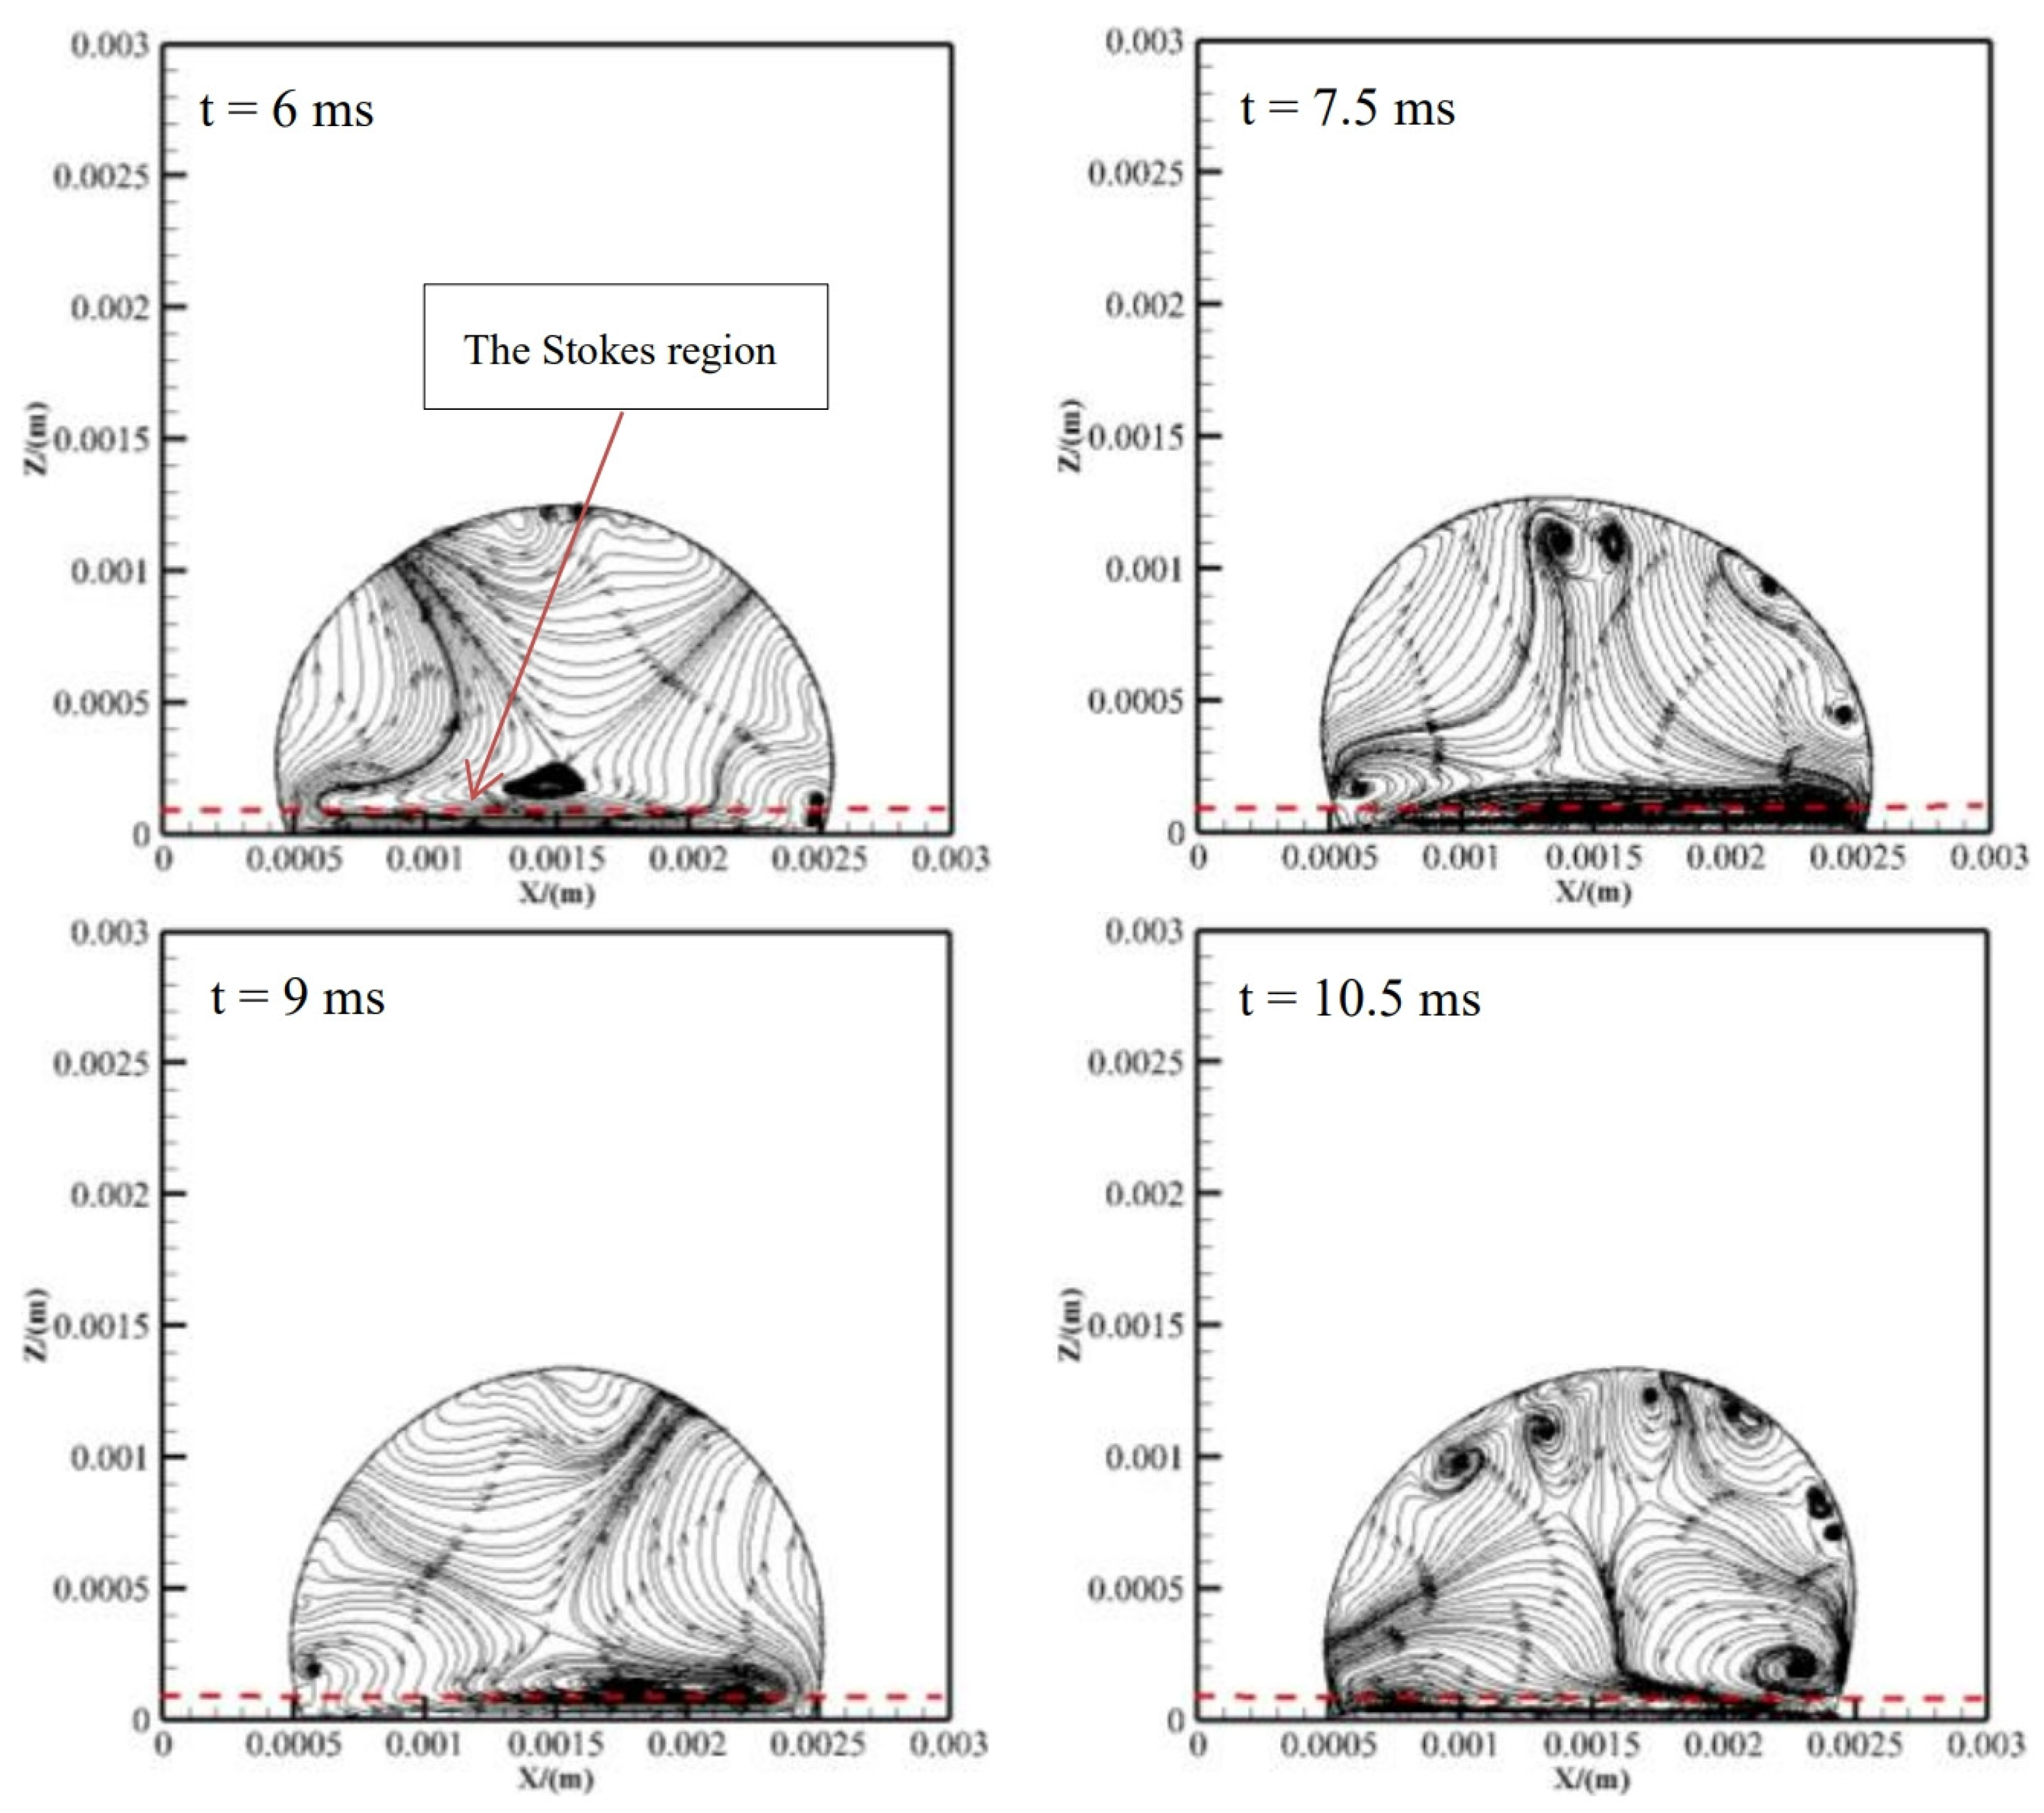
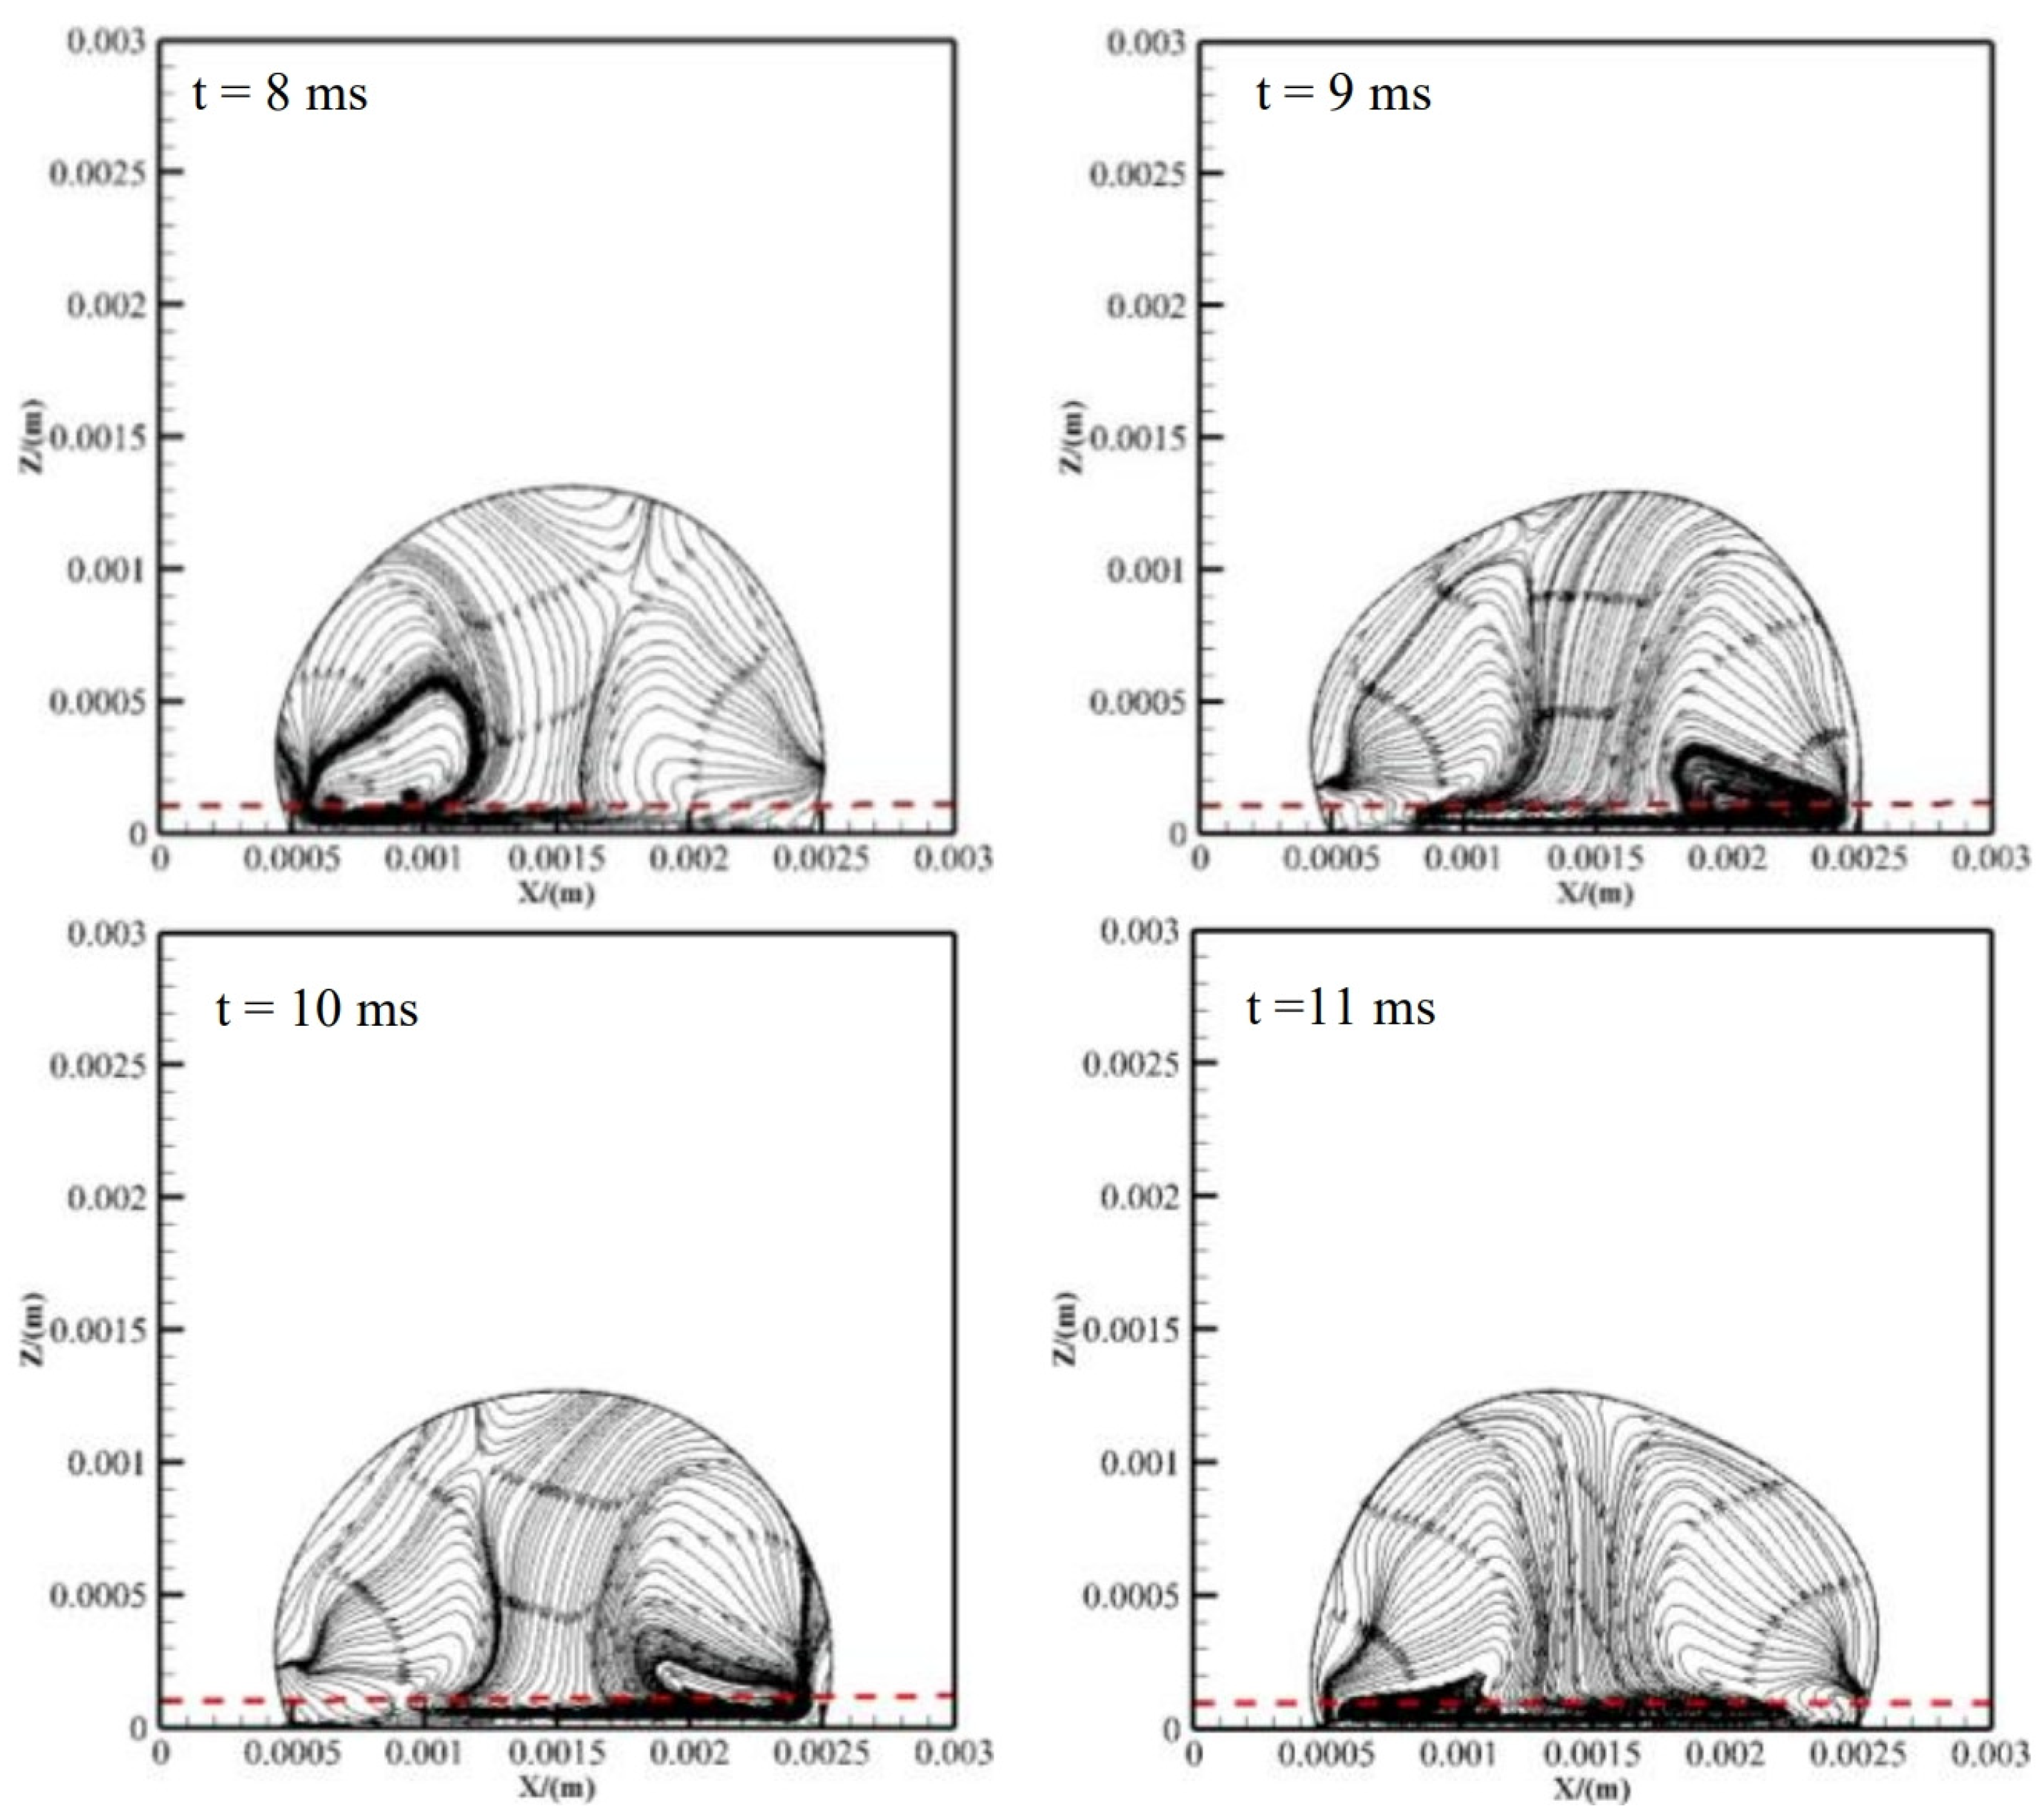
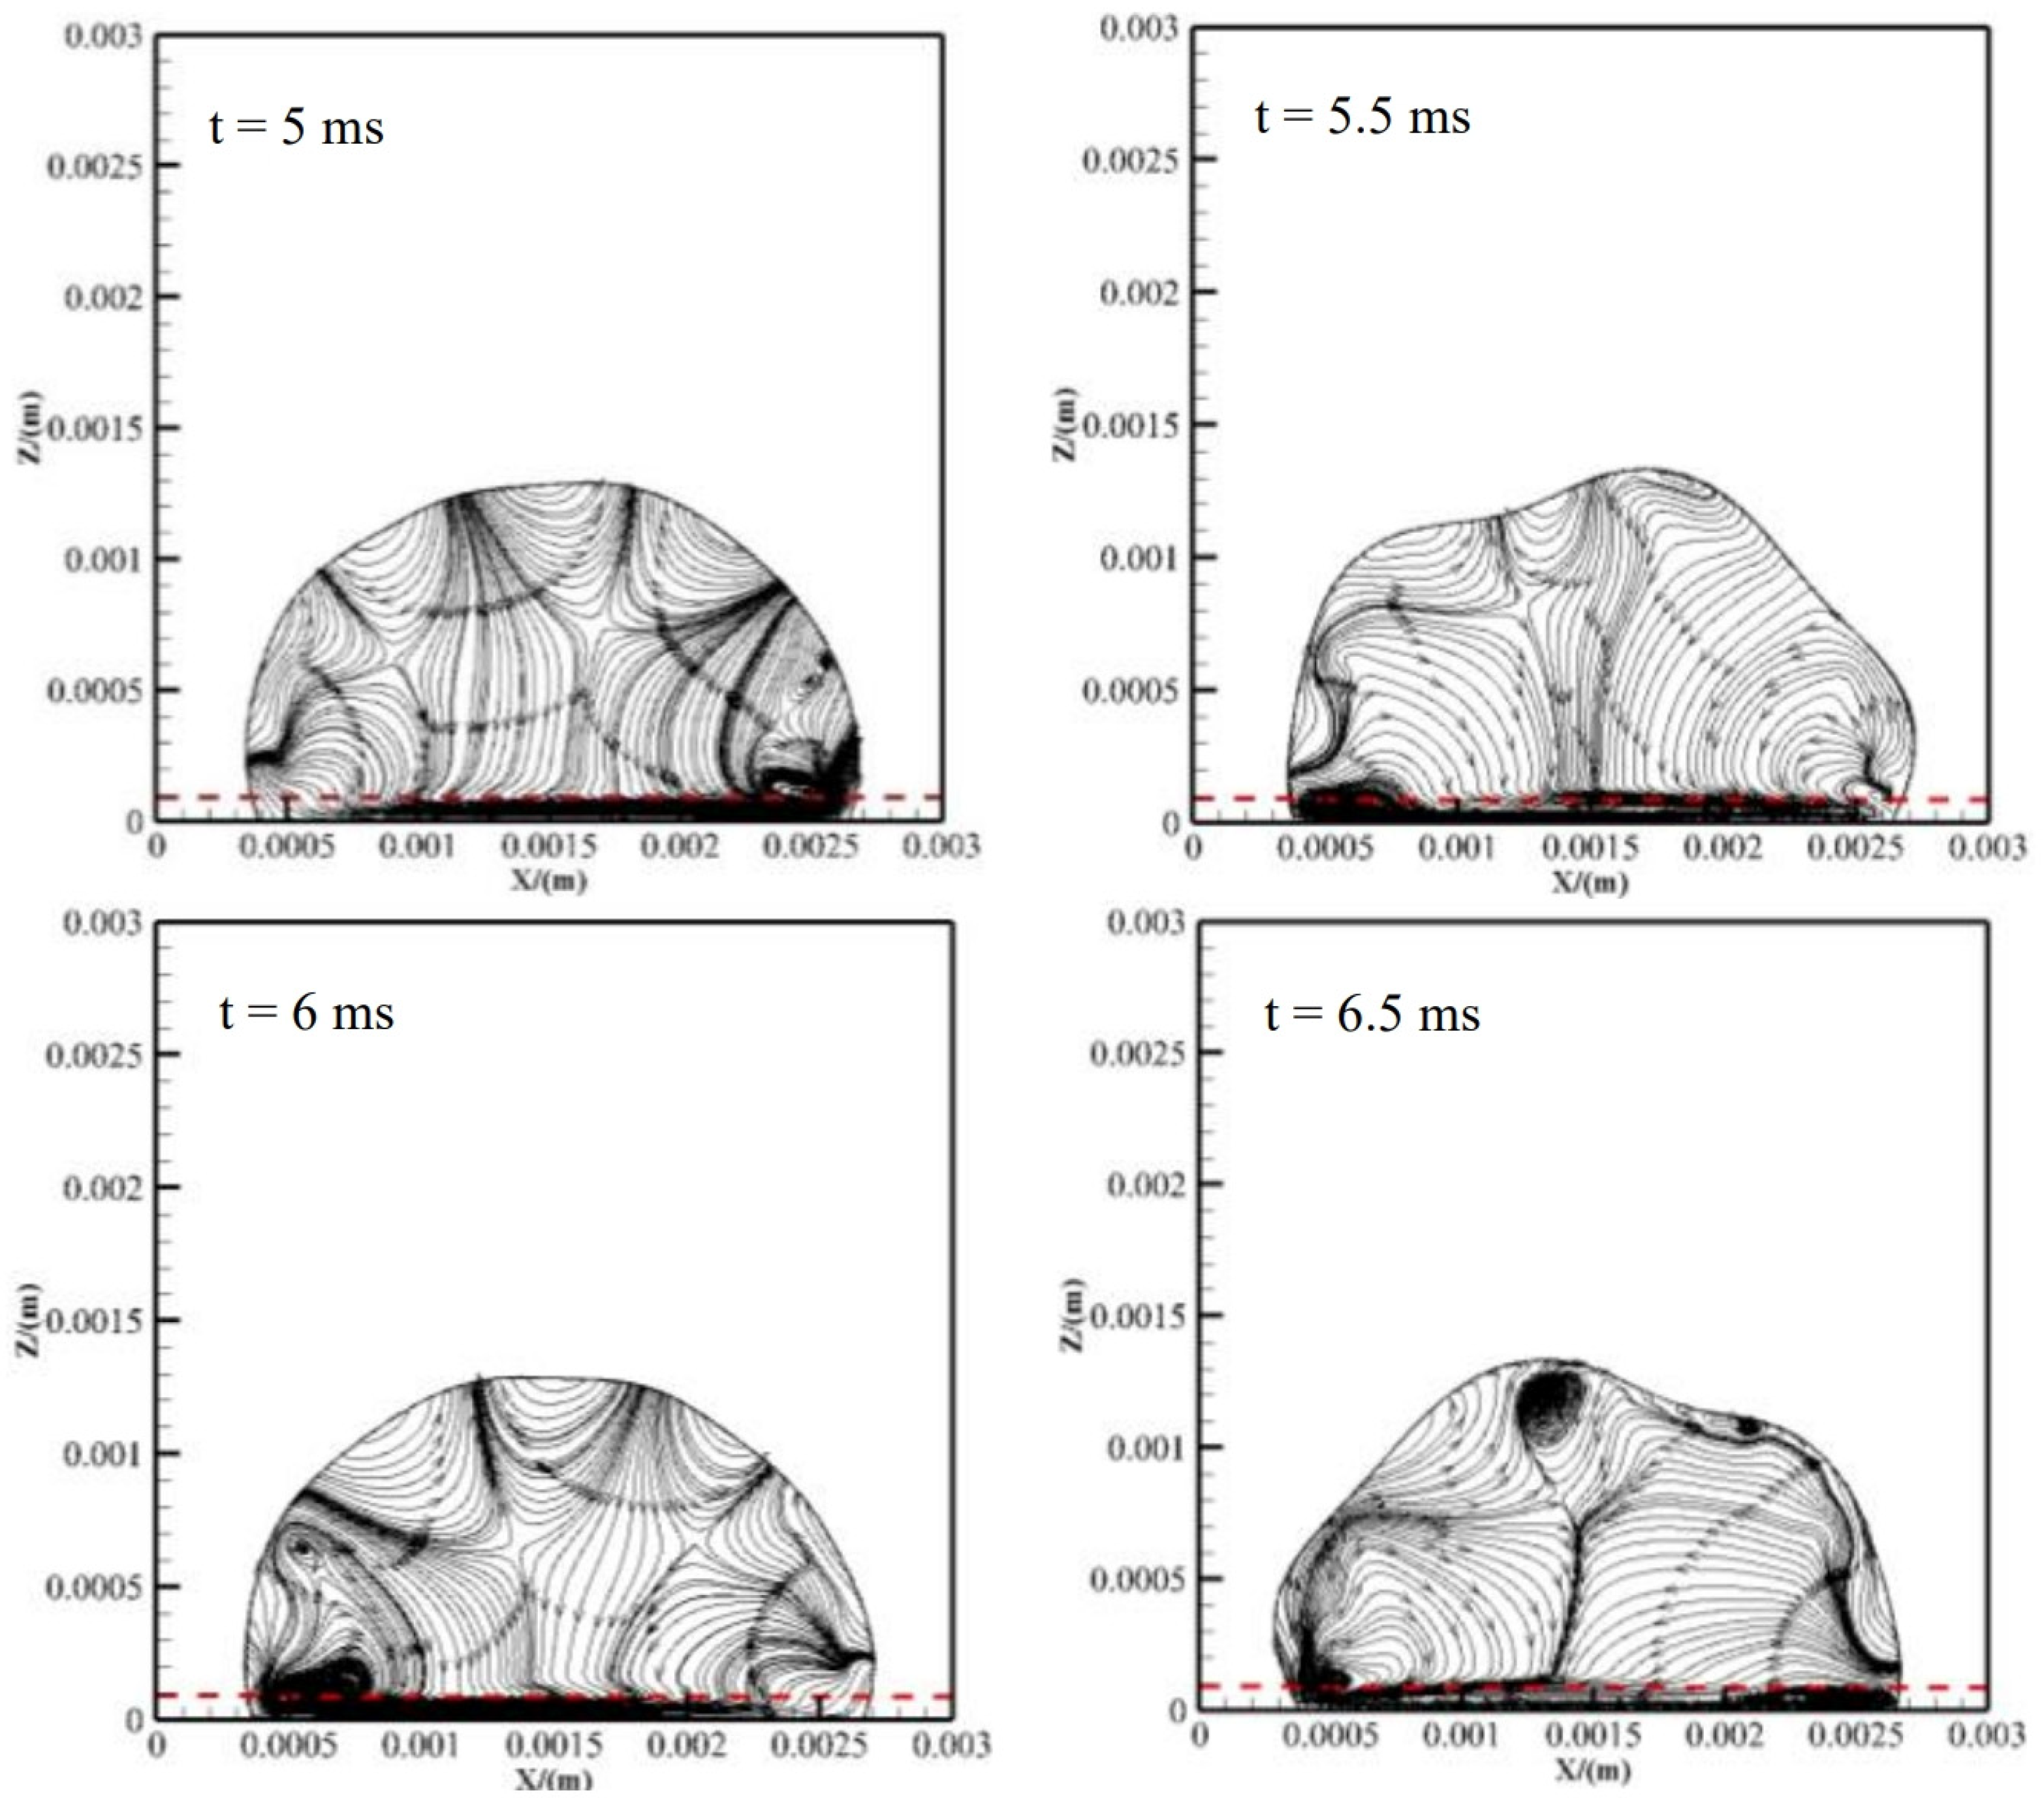
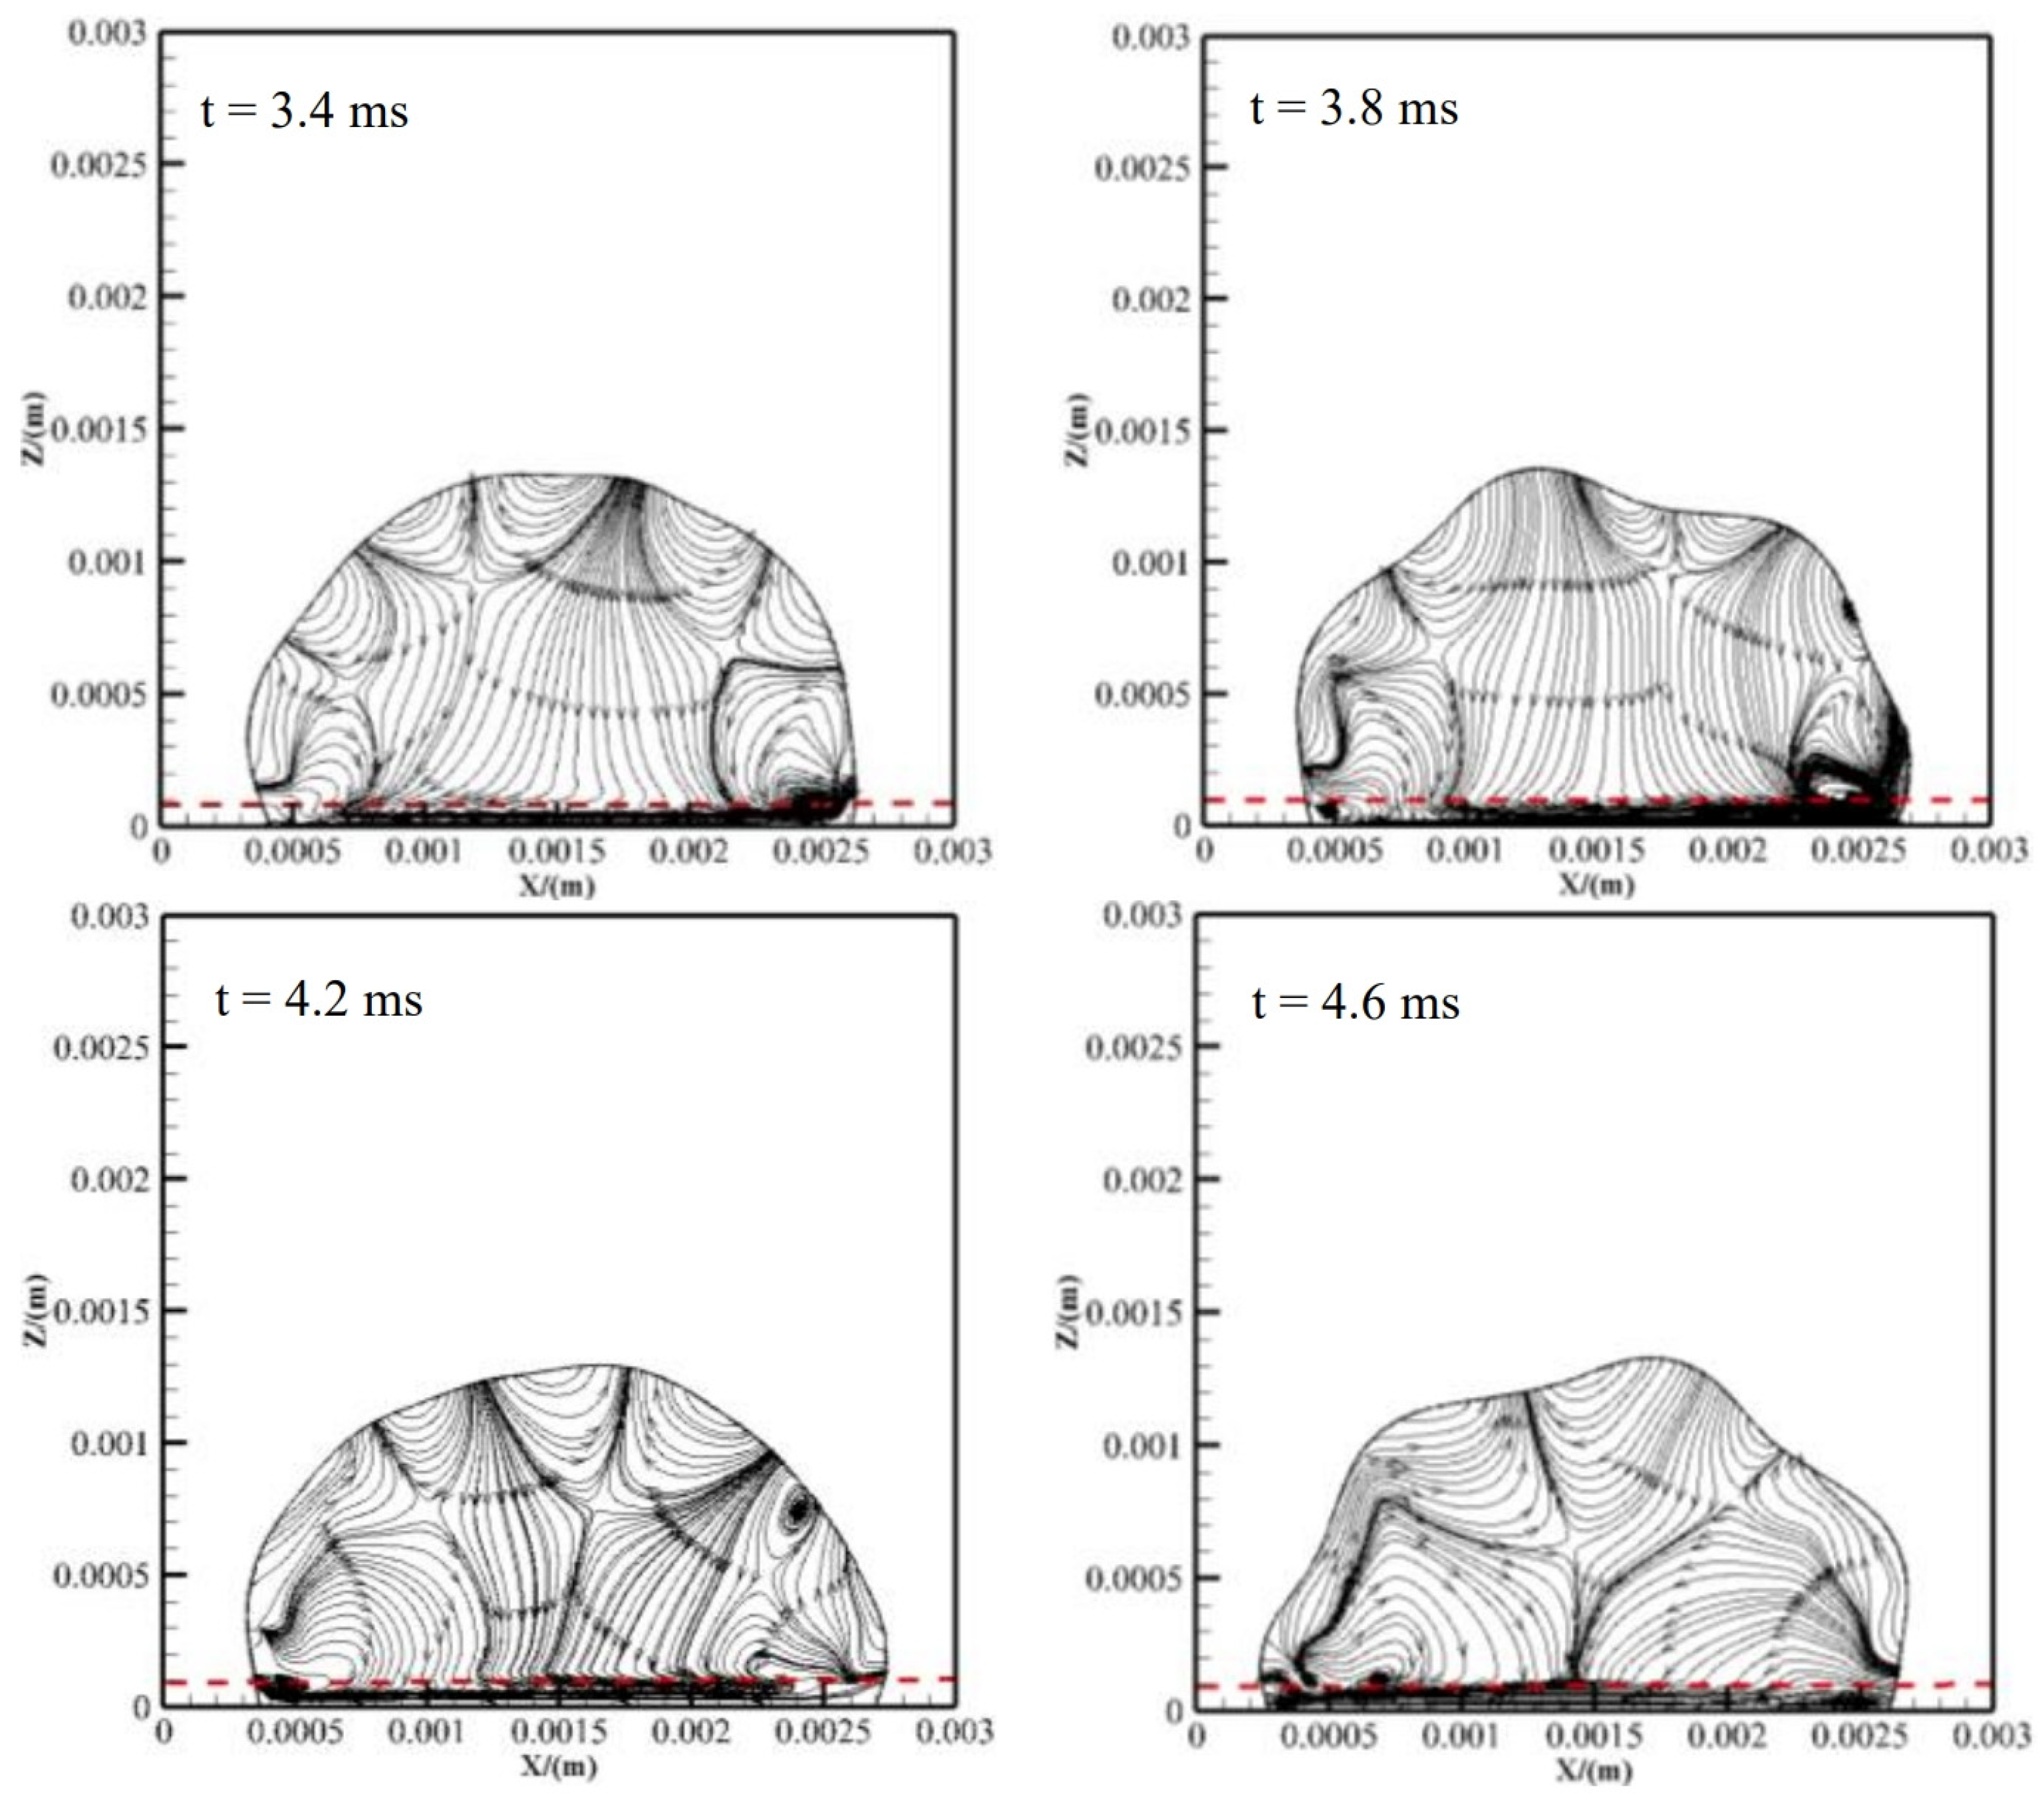
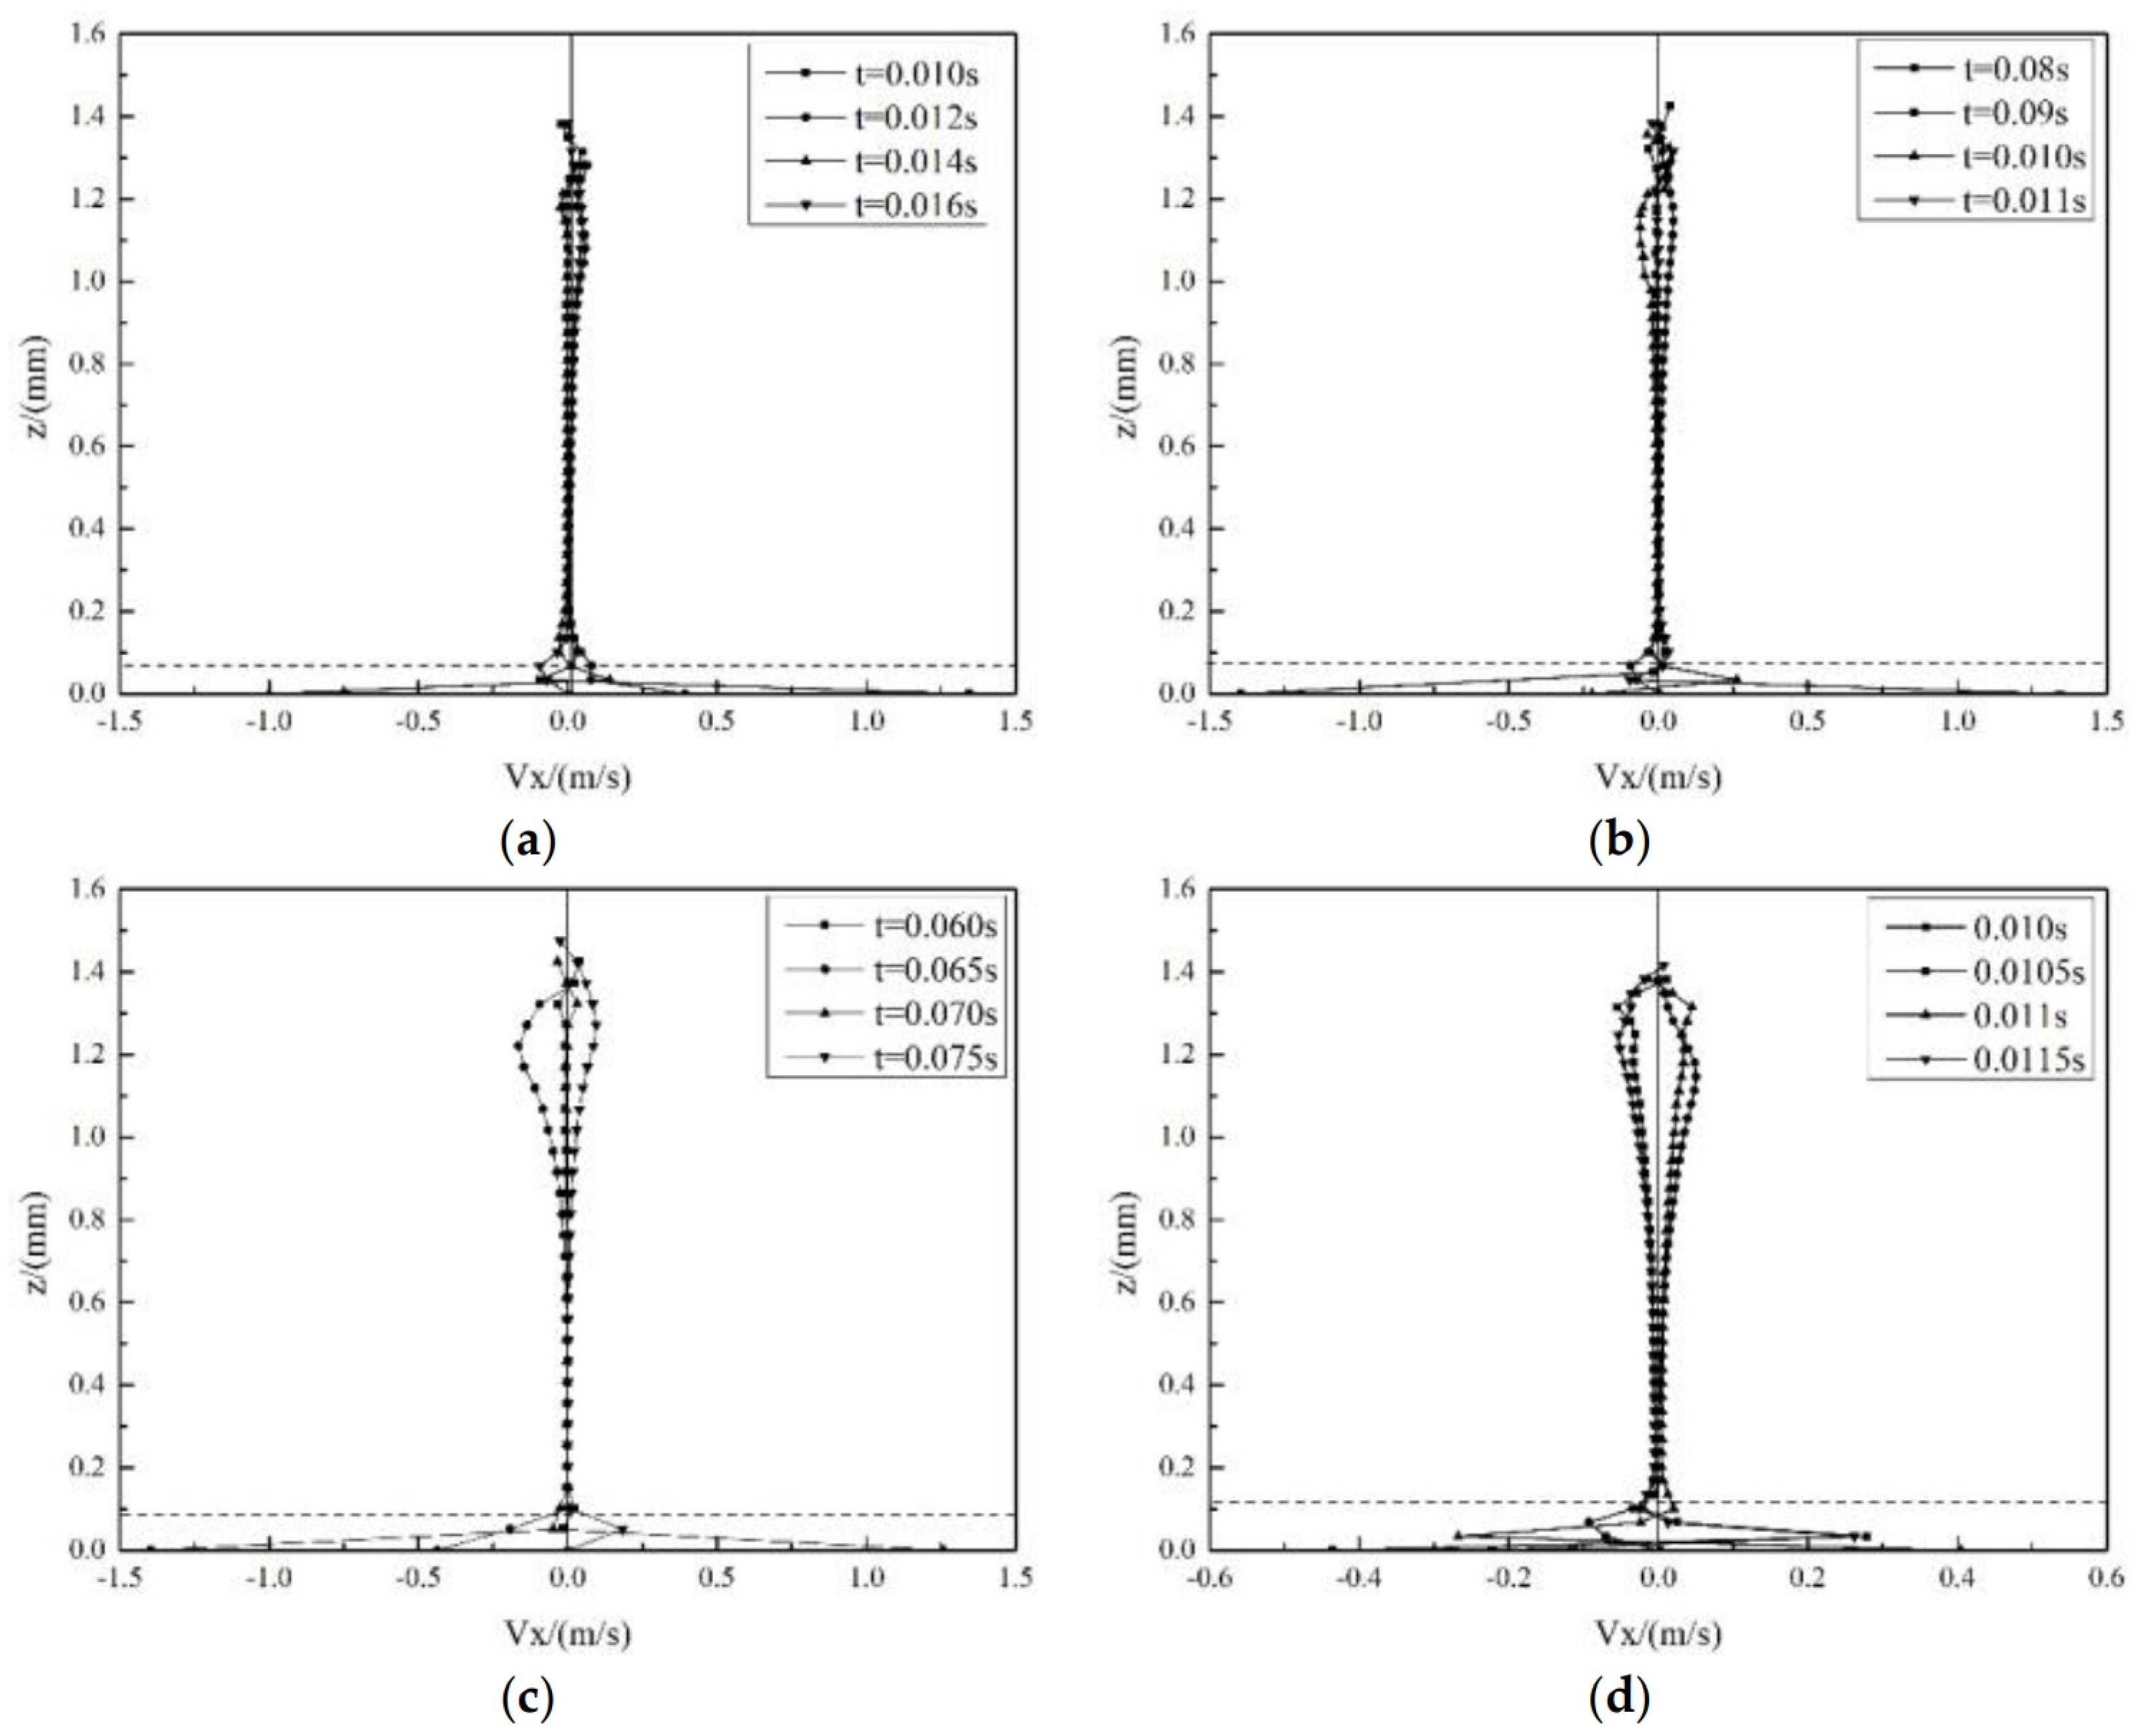
3.3. Internal Flow Patterns Inside Oscillating Droplets

When the droplet vibrates horizontally with the substrate, the internal flow is induced, the 3D flow patterns inside the droplet are predicted for the four resonant modes (Figure 5). It is observed from the results that in each mode, the microflow inside the droplet presents a non-axisymmetric flow. Under different resonant frequencies, different flow patterns are formed inside the droplet. To further understand the flow patterns inside the droplet, a two-dimensional cross section of the flow field is analyzed.
Figure 6, Figure 7, Figure 8 and Figure 9 show the internal flow pattern of a droplet in one vibrating cycle for four resonant modes. The area below the red dotted line is the Stokes region. Although the flow patterns are different in different modes, in general, the flow field in all modes can be divided into three regions, namely, the Stokes region near the substrate, the gas–liquid interface region, and the transition region located in between. In the Stokes region, the fluid has a very large velocity gradient (high-density streamlines) due to the transfer of momentum to the droplets from the vibration of the substrate. In the transition region, the fluid is subjected to inertial forces and the center of mass of the droplet oscillates, resulting in a contact angle difference between the two sides of the droplet, which leads to deformation of the droplet. The deformation of the droplet causes an increase in the surface area of the droplet. Due to the non-uniform distribution of the internal flow field, different pressure distributions will occur at the gas–liquid interface region, and different local curvatures will occur at different locations along the droplet surface during deformation. Meanwhile, a restoring force induced by the Laplace pressure acting along the drop surface attempts to decrease the surface area and restore the drop to its original shape, which causes a wave to develop in the gas–liquid interface region.
Neglecting the specific details of the flow inside the droplets under the four resonant modes, the flows in all four modes show the same characteristics. In a complete vibrating cycle, the substrate moves to the left (or right), the main fluid inside the droplet moves to the left (or right), and after the fluid reaching the left or right side of the gas–liquid interface of the droplet, it starts to move to the top of the droplet due to the restriction of the gas–liquid interface. After reaching the top of the droplet, due to the same limitation of the gas–liquid interface and the influence of the fluid flow of the other side, the fluid flows downward to the Stokes region near the substrate, where it obtains the energy transferred by the substrate and then continues to repeat the above flow and energy transfer process. Due to the phase difference between the left and right movements and the influence of droplet deformation, no symmetric vortex flow is formed inside the droplet. In general, the vibration modes increase with the vibration frequencies, and higher-order modes produce more surface lobes while the specific flow pattern in the gas–liquid interface region becomes more complex.

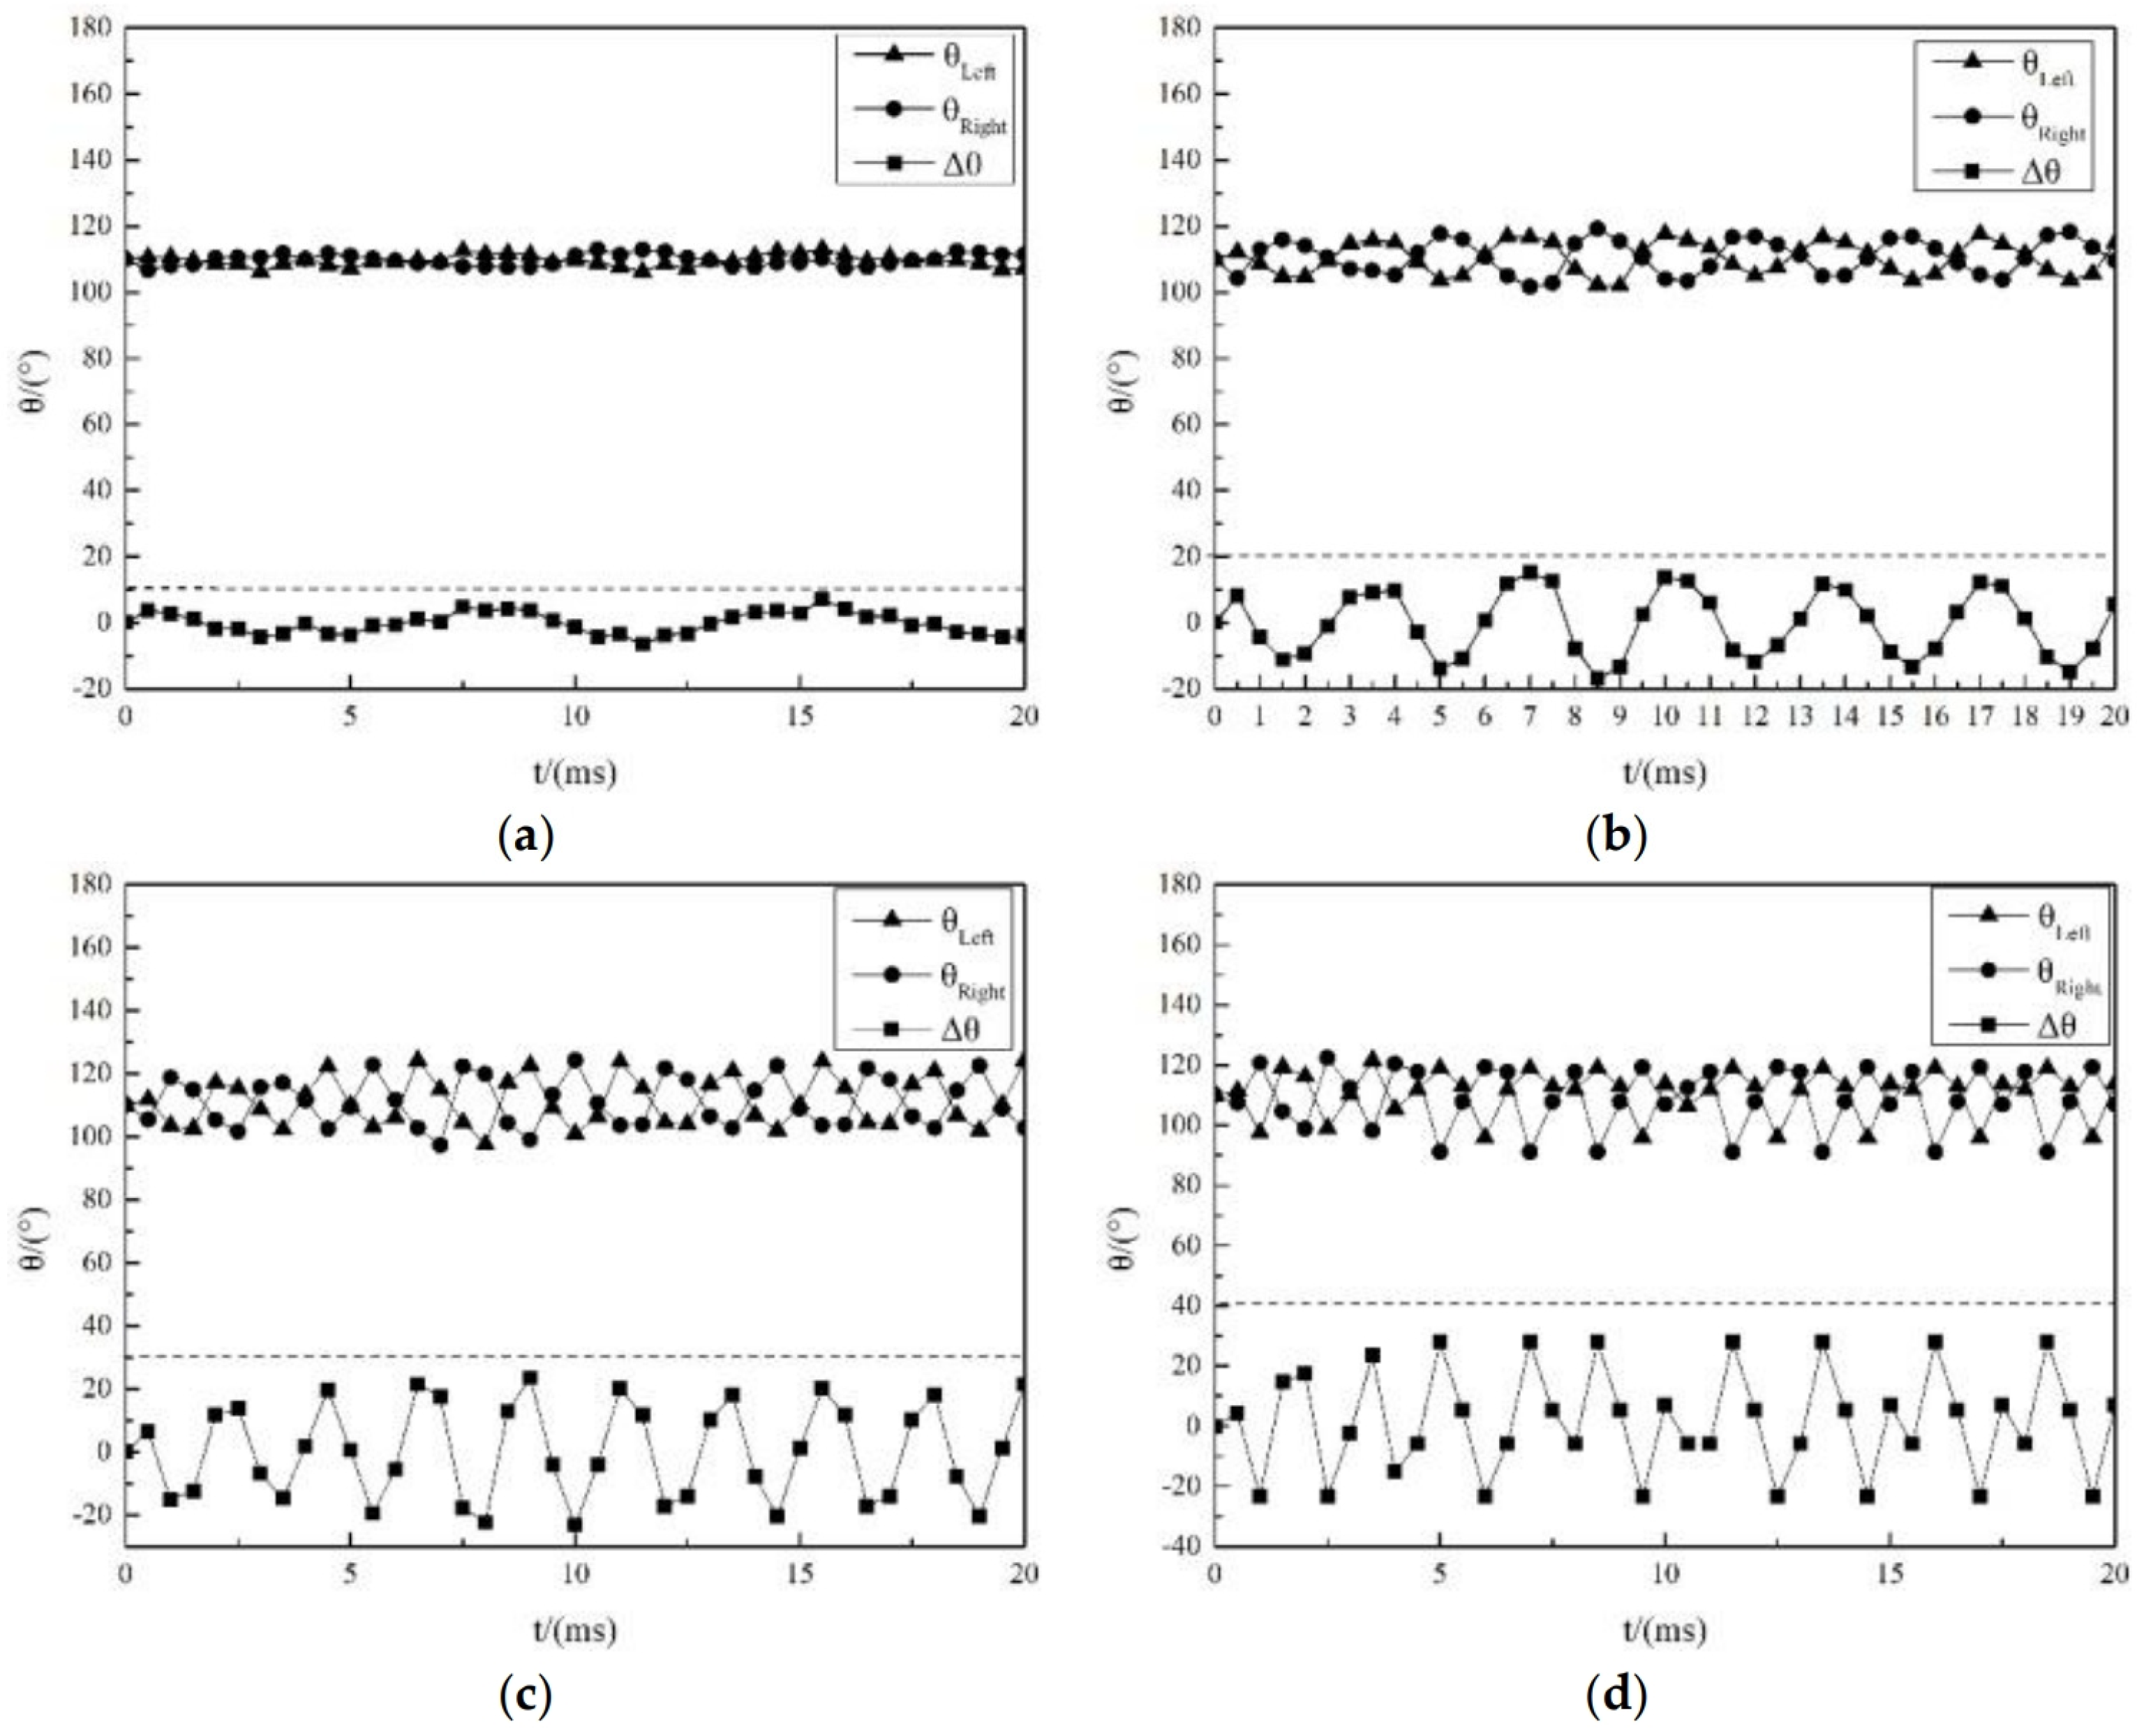
3.4. Variations in Contact Angle of the Droplet during Vibrations

Figure 10 shows the variation in contact angles on the left and right sides of the droplet with time under the four resonant modes: Δ θ is the difference between the left and right contact angles of the droplet. It can be seen that the contact angle difference of the droplet exhibits sinusoidal oscillation with time: θ Left and θ Right oscillate with a 90° phase difference. When the vibration acceleration is applied to the substrate, the momentum is transferred to the droplet. If the droplet first swings to the right, the droplet has a tendency to move to the right, the contact angle of the right side gradually increases to greater than the equilibrium contact angle, and the contact angle of the left side gradually decreases to less than the equilibrium contact angle. As the vibration continues, the droplet swings to the rightmost end, and the difference between the left and right contact angles reaches its maximum value. The droplet then swings back until the droplet reaches the leftmost end, and the difference between the left and right contact angles reaches its maximum value again (the opposite direction). The contact angles on the left and right sides of the droplet repeat the variations during the vibration. Figure 10 also shows that with the increase in order of vibration modes, the contact angle difference between the two sides gradually increases, and the contact angle difference of modes 1, 2, 3 and 4 is about ±10°, ±15°, ±20° and ±30°, respectively.
To further understand the frequency dependence of the difference between the left and right contact angles of the droplet, the contact angles of the droplet at different frequencies were calculated under specified modes. It was found that under the horizontal vibration of the substrate, the difference between the droplet’s left and right contact angles will be maximized when the applied frequency is the resonant frequency, which is in line with Celestini and Kofman’s conclusions [13].

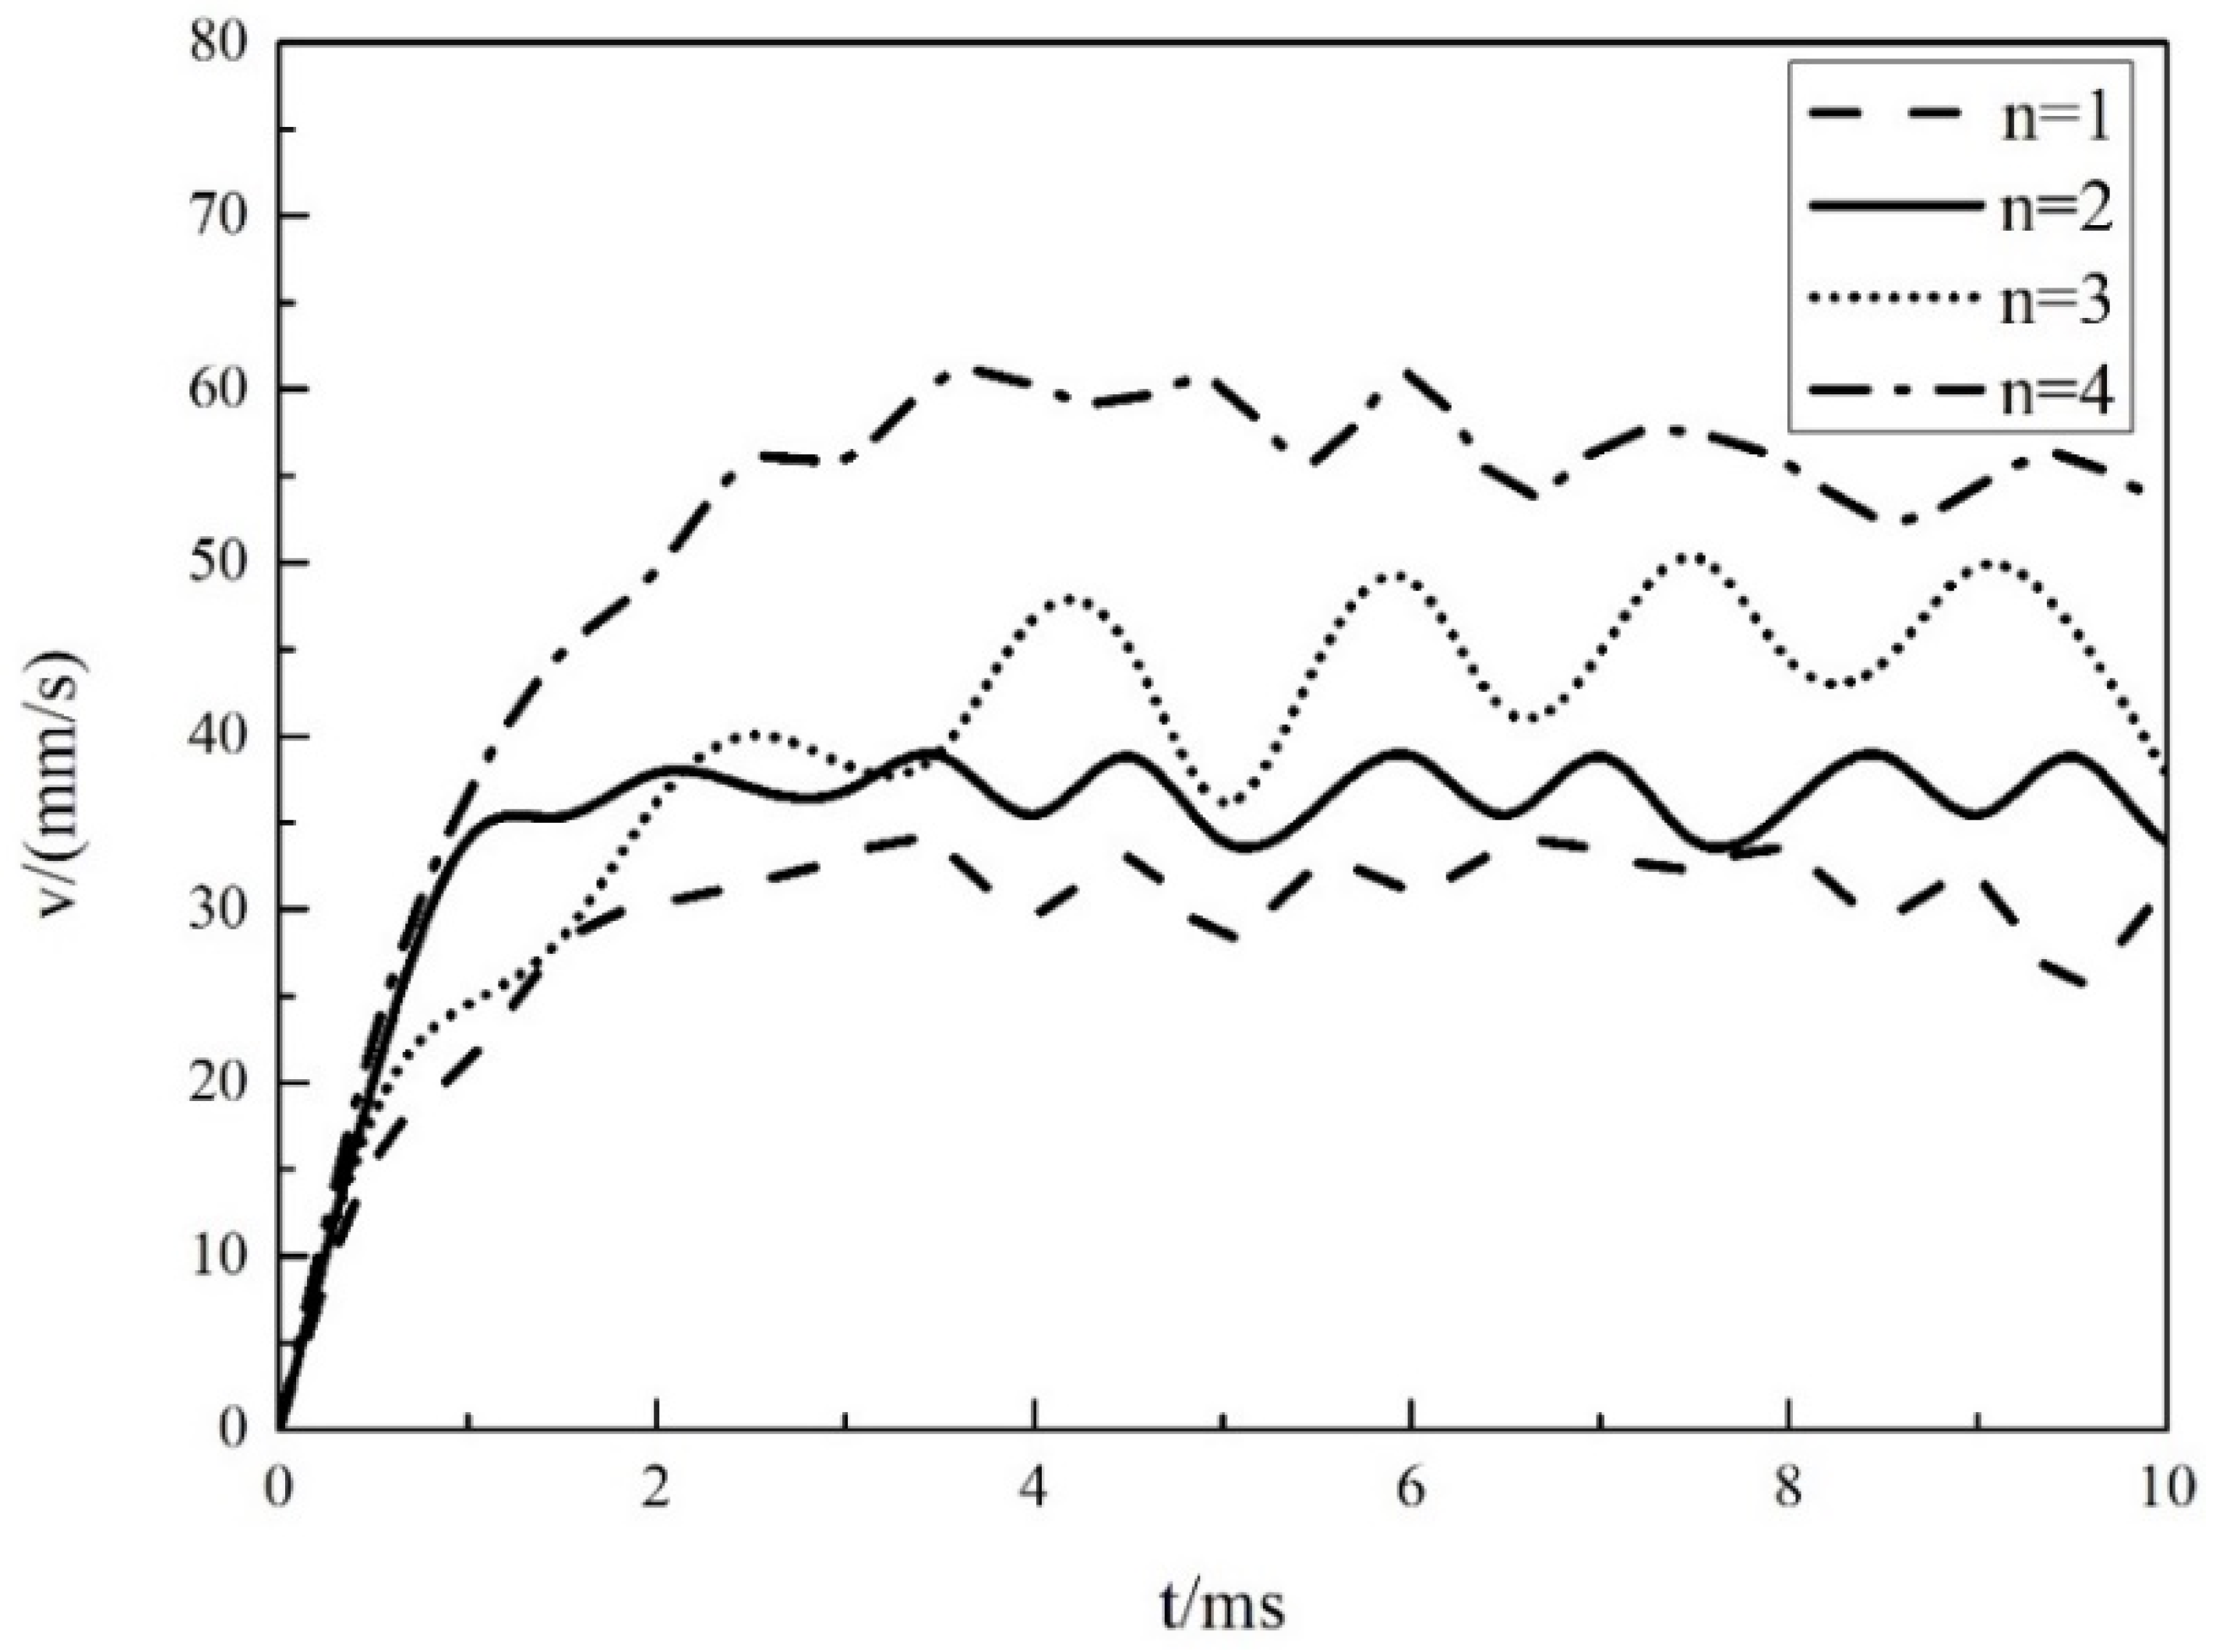
3.5. Variations in Average Velocity within the Droplet during Vibrations

Figure 11 shows the variation in the average velocity within the droplet under resonant modes 1, 2, 3 and 4 in the first 10 ms of vibrations. As expected, the average velocity increases rapidly at the initial stage of the vibration and exhibits oscillations in the steady state. Figure 11 also shows that the average velocity will increase as the frequency is increased from 60 Hz to 450 Hz (the resonant frequencies corresponding to the four modes are 60 Hz, 130 Hz, 290 Hz and 450 Hz, respectively). However, the fluctuations in the average velocity after reaching the steady state will not increase solely with the increase in frequency. In modes 1, 2 and 4, the magnitude of the fluctuations is around 5 mm/s, while in mode 3, it fluctuates up to 10 mm/s. This is likely due to the different deformation and the specific propagation of waves along the droplet interface, which change the internal flow pattern substantially. As expected, the average velocity within the droplet is less than the applied velocity of the substrate due to the influence of deformation and viscous force.
Figure 12 shows the distribution of the horizontal velocity distribution along the vertical direction of the center axis of the droplet at different times. V x and Z represent the x-direction velocity and the height along the center axis of the droplet, respectively. The differences in the height position are due to the different deformation of the droplet. As mentioned in Section 3.2 and shown in Figure 12, the fluid has large horizontal velocity gradients in the Stokes region (the area below the dotted line) due to the transfer of momentum to the droplets from the substrate. In addition, the propagation of the surface wave during the vibration causes different local curvatures along the droplet surface, and the Laplace pressure changes with the local curvature, which will cause the horizontal velocity at the top of the droplet to oscillate. Compared to the Stokes and gas–liquid interface regions, the horizontal velocity in the transition region is not particularly pronounced. This is because the main fluid along the center axis of the droplet moves mostly downward to the substrate (Figure 6, Figure 7, Figure 8 and Figure 9).

4. Conclusions

A three-dimensional volume of fluid functions and continuous surface force (VOF-CSF) model was employed to numerically predict the resonant modes of sessile droplets on horizontally vibrating substrates. The dynamic contact angle model developed by Kistler was implemented to simulate the contact angle variations during vibrations. The four resonant modes (1, 2, 3, and 4) of the droplet under horizontal vibrations were investigated. Simulations were performed for a 2.0 mm water droplet on a horizontal, hydrophobic surface and results were compared to experimental results for validation. Excellent agreement was observed between predicted results and experiments.
Subsequently, the internal flow patterns within the droplet were analyzed. Numerical results indicate that the flow in all four resonant modes can be divided into three regions, namely, the Stokes region near the substrate, the gas–liquid interface region, and the transition region located in between. It is found that the average velocity within the droplet increases with the increase in frequency, but the fluctuations of the average velocity after reaching the periodic steady state do not increase solely with the increase in frequency. In a complete cycle, the droplet gains energy in the Stokes region near the substrate, moves in the same direction with the substrate under inertial forces, then flows upwards and turns downwards near the gas–liquid interface. It then flows to the Stokes region and continues to repeat the above flow and energy transfer process.
Furthermore, the difference between the droplet’s left and right contact angles were investigated under four resonant modes. It was found that with the increase in order of resonant modes, the contact angle difference between the two sides of the droplet increases. The frequency dependence of the difference between the droplet’s left and right contact angles was also analyzed under specified resonant modes. It was observed that under the horizontal vibration, the difference between the droplet’s left and right contact angles will be maximized when the applied frequency is the resonant frequency of the specified mode.
This model is based on the assumption of Newtonian fluid and pinned contact lines. In practice, the contact line would slip on the substrate under specific conditions, which is beyond the capability of this model. Some studies are also carried out by incorporating non-Newtonian properties in the droplet, which gives rise to a wealth of non-trivial phenomena [34]. A comprehensive analysis of the problem by taking care of the slip of droplets and droplets with non-Newtonian properties would be a promising extension of this study.

Author Contributions

Y.S.: conceptualization, investigation, funding acquisition, writing—original draft, writing—review and editing. T.Y.: investigation, writing—original draft. All authors have read and agreed to the published version of the manuscript.

Funding

This work is supported by the National Natural Science Foundation of China (NSFC 52176159).

Data Availability Statement

Data are contained within the article.

Conflicts of Interest

The authors declare no conflicts of interest.

Nomenclature

A amplitude, U p substrate velocity
C a capillary number v velocity vector
f frequency V x velocity of x direction
F surface tension force α volume fraction
g acceleration of gravity θ contact angle
l c capillary length θ 0 initial contact angle
m droplet mass θ D dynamic contact angle
n order of modes Δ θ contact angles difference
n outward unit normal vector κ s curvature of interface
n w unit normal vector of the substrate μ viscosity
t time ρ density
t w tangent vector of the substrate σ surface tension
u , v , w fluid-phase velocity along the x, y, z direction ω resonant frequency of droplet

References

  1. Sefiane, K. Patterns from drying drops. Adv. Colloid Interface Sci. 2014, 206, 372–381. [Google Scholar] [CrossRef] [PubMed]
  2. Mondal, R.; Lama, H.; Sahu, K.C. Physics of drying complex fluid drop: Flow field, pattern formation, and desiccation cracks. Phys. Fluids 2023, 35, 061301. [Google Scholar] [CrossRef]
  3. Shan, Y.G.; Wang, Y.L.; Coyle, T. Analysis of deposits formation in plasma spraying with liquid precursors. Appl. Therm. Eng. 2013, 51, 690–697. [Google Scholar] [CrossRef]
  4. Sandu, I.; Dumitru, M.; Fleaca, C.T.; Dumitrache, F. Hanging colloidal drop: A new photonic crystal synthesis route. Photonics Nanostruct. 2018, 29, 42–48. [Google Scholar] [CrossRef]
  5. Zang, D.Y.; Tarafdar, S.; Tarasevich, Y.; Choudhury, M.D.; Dutta, T. Evaporation of a droplet: From physics to applications. Phys. Rep. 2019, 804, 1–56. [Google Scholar] [CrossRef]
  6. Sanyal, A.; Basu, S.; Chowdhuri, S.; Kabi, P.; Chaudhuri, S. Precision control of drying using rhythmic dancing of sessile nanoparticle laden droplets. Appl. Phys. Lett. 2014, 104, 163108. [Google Scholar] [CrossRef]
  7. Sanyal, A.; Basu, S. Evolution of internal flows in mechanically oscillating sessile droplets undergoing evaporation. Chem. Eng. Sci. 2017, 163, 179–188. [Google Scholar] [CrossRef]
  8. Kabi, P.; Razdan, V.; Roy, D.; Bansal, L.; Sahoo, S.; Mukherjee, R.; Chaudhuri, S.; Basu, S. Evaporation-induced alterations in oscillation and flow characteristics of a sessile droplet on a rose-mimetic surface. Soft Matter 2021, 17, 1487–1496. [Google Scholar] [CrossRef] [PubMed]
  9. Rayleigh, L. On the capillary phenomenon of Jets. Proc. R. Soc. Lond. 1879, 29, 71–97. [Google Scholar]
  10. Kelvin, W. Mathematical and Physical Papers; Cambridge University Press: Cambridge, UK, 1882. [Google Scholar]
  11. Lamb, H. Hydrodynamics; Cambridge University Press: Cambridge, UK, 1932. [Google Scholar]
  12. Strani, M.; Sabetta, F. Free vibrations of a drop in partial contact with a solid support. J. Fluid Mech. 1984, 141, 233–247. [Google Scholar] [CrossRef]
  13. Celestini, F.; Kofman, R. Vibration of submillimeter-size supported droplets. Phys. Rev. E 2006, 73, 041602. [Google Scholar] [CrossRef] [PubMed]
  14. Noblin, X.; Buguin, A.; Brochard-Wyart, F. Vibrated sessile drops: Transition between pinned and mobile contact line oscillations. Eur. Phys. J. E 2004, 14, 395–404. [Google Scholar] [CrossRef] [PubMed]
  15. Noblin, X.; Buguin, A.; Brochard-Wyart, F. Vibration of sessile drops. Eur. Phys. J. 2009, 166, 7–10. [Google Scholar] [CrossRef]
  16. Sanyal, A.; Basu, S.; Chaudhuri, S. Controlling particle deposit morphologies in drying nano-particle laden sessile droplets using substrate oscillations. Phys. Chem. Chem. Phys. 2016, 18, 14549–14560. [Google Scholar] [CrossRef] [PubMed]
  17. Kabi, P.; Chattopadhyay, B.; Bhattacharyya, S.; Chaudhuri, S.; Basu, S. Evaporation-oscillation driven assembly: Micro-tailoring the spatial ordering of particles in sessile droplets. Langmuir 2018, 34, 12642–12652. [Google Scholar] [CrossRef] [PubMed]
  18. Noblin, X.; Kofman, R.; Celestini, F. Ratchetlike Motion of a Shaken Drop. Phys. Rev. Lett. 2009, 102, 194504. [Google Scholar] [CrossRef] [PubMed]
  19. Sartori, P.; Quagliati, D.; Varagnolo, S.; Pierno, M.; Mistura, G.; Magaletti, F.; Casciola, C.M. Drop motion induced by vertical vibrations. New J. Phys. 2015, 17, 113017. [Google Scholar] [CrossRef]
  20. Huber, R.A.; Campbell, M.; Doughramaji, N.; Derby, M.M. Vibration-enhanced droplet motion modes: Simulations of rocking, ratcheting, ratcheting with breakup, and ejection. J. Fluids Eng. 2019, 141, 071105. [Google Scholar] [CrossRef]
  21. Mostafa, M.; Rahimian, M.H.; Chini, S.F. Numerical investigation of vibration-induced droplet shedding on smooth surfaces with large contact angles. Phys. Rev. E 2019, 100, 023105. [Google Scholar]
  22. Mostafa, M.; Rahimian, M.H.; Chini, S.F. Numerical investigation of vibration-induced droplet shedding on microstructured superhydrophobic surfaces. Phys. Rev. E 2019, 99, 063111. [Google Scholar]
  23. Dong, L.; Chaudhury, A.; Chaudhury, M.K. Lateral vibration of a water drop and its motion on a vibrating surface. Eur. Phys. J. E 2006, 21, 231–242. [Google Scholar] [CrossRef] [PubMed]
  24. Annapragada, S.R.; Murthy, J.Y.; Garimella, S.V. Prediction of droplet dynamics on an incline. Int. J. Heat Mass Tran. 2012, 55, 1466–1474. [Google Scholar] [CrossRef]
  25. Kim, H.; Lim, H.C. Mode pattern of internal flow in a water droplet on a vibrating hydrophobic surface. J. Phys. Chem. B 2015, 119, 6740–6746. [Google Scholar] [CrossRef] [PubMed]
  26. Park, C.S.; Kim, H.; Lim, H.C. Study of internal flow and evaporation characteristics inside a water droplet on a vertically vibrating hydrophobic surface. Experimental Therm. Fluid Sci. 2016, 78, 112–123. [Google Scholar] [CrossRef]
  27. Kang, K.H.; Lee, S.J.; Lee, C.M.; Kang, I.S. Quantitative visualization of flow inside an evaporating droplet using the ray tracing method. Meas. Sci. Technol. 2004, 15, 1104–1112. [Google Scholar] [CrossRef]
  28. He, B.; Duan, F. Full-field convection flow visualization in pendant droplets by tilt-angle imaging. Appl. Phys. Lett. 2013, 103, 053508. [Google Scholar] [CrossRef]
  29. Brackbill, J.U.; Kothe, D.B.; Zemach, C. A continuum method for modelling surface tension. J. Comput. Phys. 1992, 100, 335–354. [Google Scholar] [CrossRef]
  30. 30. In Ansys Fluent User’s Guide; Ansys Inc.: Canonsburg, PA, USA, 2022.
  31. Kistler, S.F. Hydrodynamics of Wetting in Wettability; Marcel Dekker: New York, NY, USA, 1993. [Google Scholar]
  32. Chernova, A.A.; Kopysov, S.P.; Tonkov, L.F. Simulation of a liquid drop on a vibrating hydrophobic surface. IOP Conf. Ser. Mater. Sci. Eng. 2016, 158, 012026. [Google Scholar] [CrossRef]
  33. Daniel, S.; Chaudhury, M.K.; Gennes, P. Vibration-actuated drop motion on surfaces for batch microfluidic processes. Langmuir 2005, 21, 4240–4248. [Google Scholar] [CrossRef]
  34. Sartori, P.; Guglielmin, E.; Ferraro, D.; Filippi, D.; Zaltron, A.; Pierno, M.; Mistura, G. Motion of Newtonian drops deposited on liquid-impregnated surfaces induced by vertical vibrations. J. Fluid Mech. 2019, 876, R4. [Google Scholar] [CrossRef]
Figure 1. Schematic diagram of an oscillating droplet on a vibrating substrate.
Processes 12 00667 g001
Figure 2. Computational domain.
Processes 12 00667 g002
Figure 3. The four resonant modes of the vibrating droplet: (a) experiment; (b) simulation.
Processes 12 00667 g003
Figure 4. Phase diagram of the droplet in one cycle under the four resonant modes (x–z cross section).
Processes 12 00667 g004
Figure 5. Three-dimensional flow pattern inside vibrating droplets for the four resonant modes.
Processes 12 00667 g005
Figure 6. Internal flow pattern of the droplet (x–z cross section, mode 1).
Processes 12 00667 g006
Figure 7. Internal flow pattern of the droplet (x–z cross section, mode 2).
Processes 12 00667 g007
Figure 8. Internal flow pattern of the droplet (x–z cross section, mode 3).
Processes 12 00667 g008
Figure 9. Internal flow pattern of the droplet (x–z cross section, mode 4).
Processes 12 00667 g009
Figure 10. Variation in left and right contact angles of droplets under four resonant modes. (a) n = 1, (b) n = 2, (c) n = 3, (d) n = 4.
Processes 12 00667 g010
Figure 11. Variation in the average velocity within the droplet under four resonant modes.
Processes 12 00667 g011
Figure 12. Horizontal velocity distribution along the vertical direction of the center axis of the droplet at different times. (a) n = 1, (b) n = 2, (c) n = 3, (d) n = 4.
Processes 12 00667 g012
Disclaimer/Publisher’s Note: The statements, opinions and data contained in all publications are solely those of the individual author(s) and contributor(s) and not of MDPI and/or the editor(s). MDPI and/or the editor(s) disclaim responsibility for any injury to people or property resulting from any ideas, methods, instructions or products referred to in the content.

