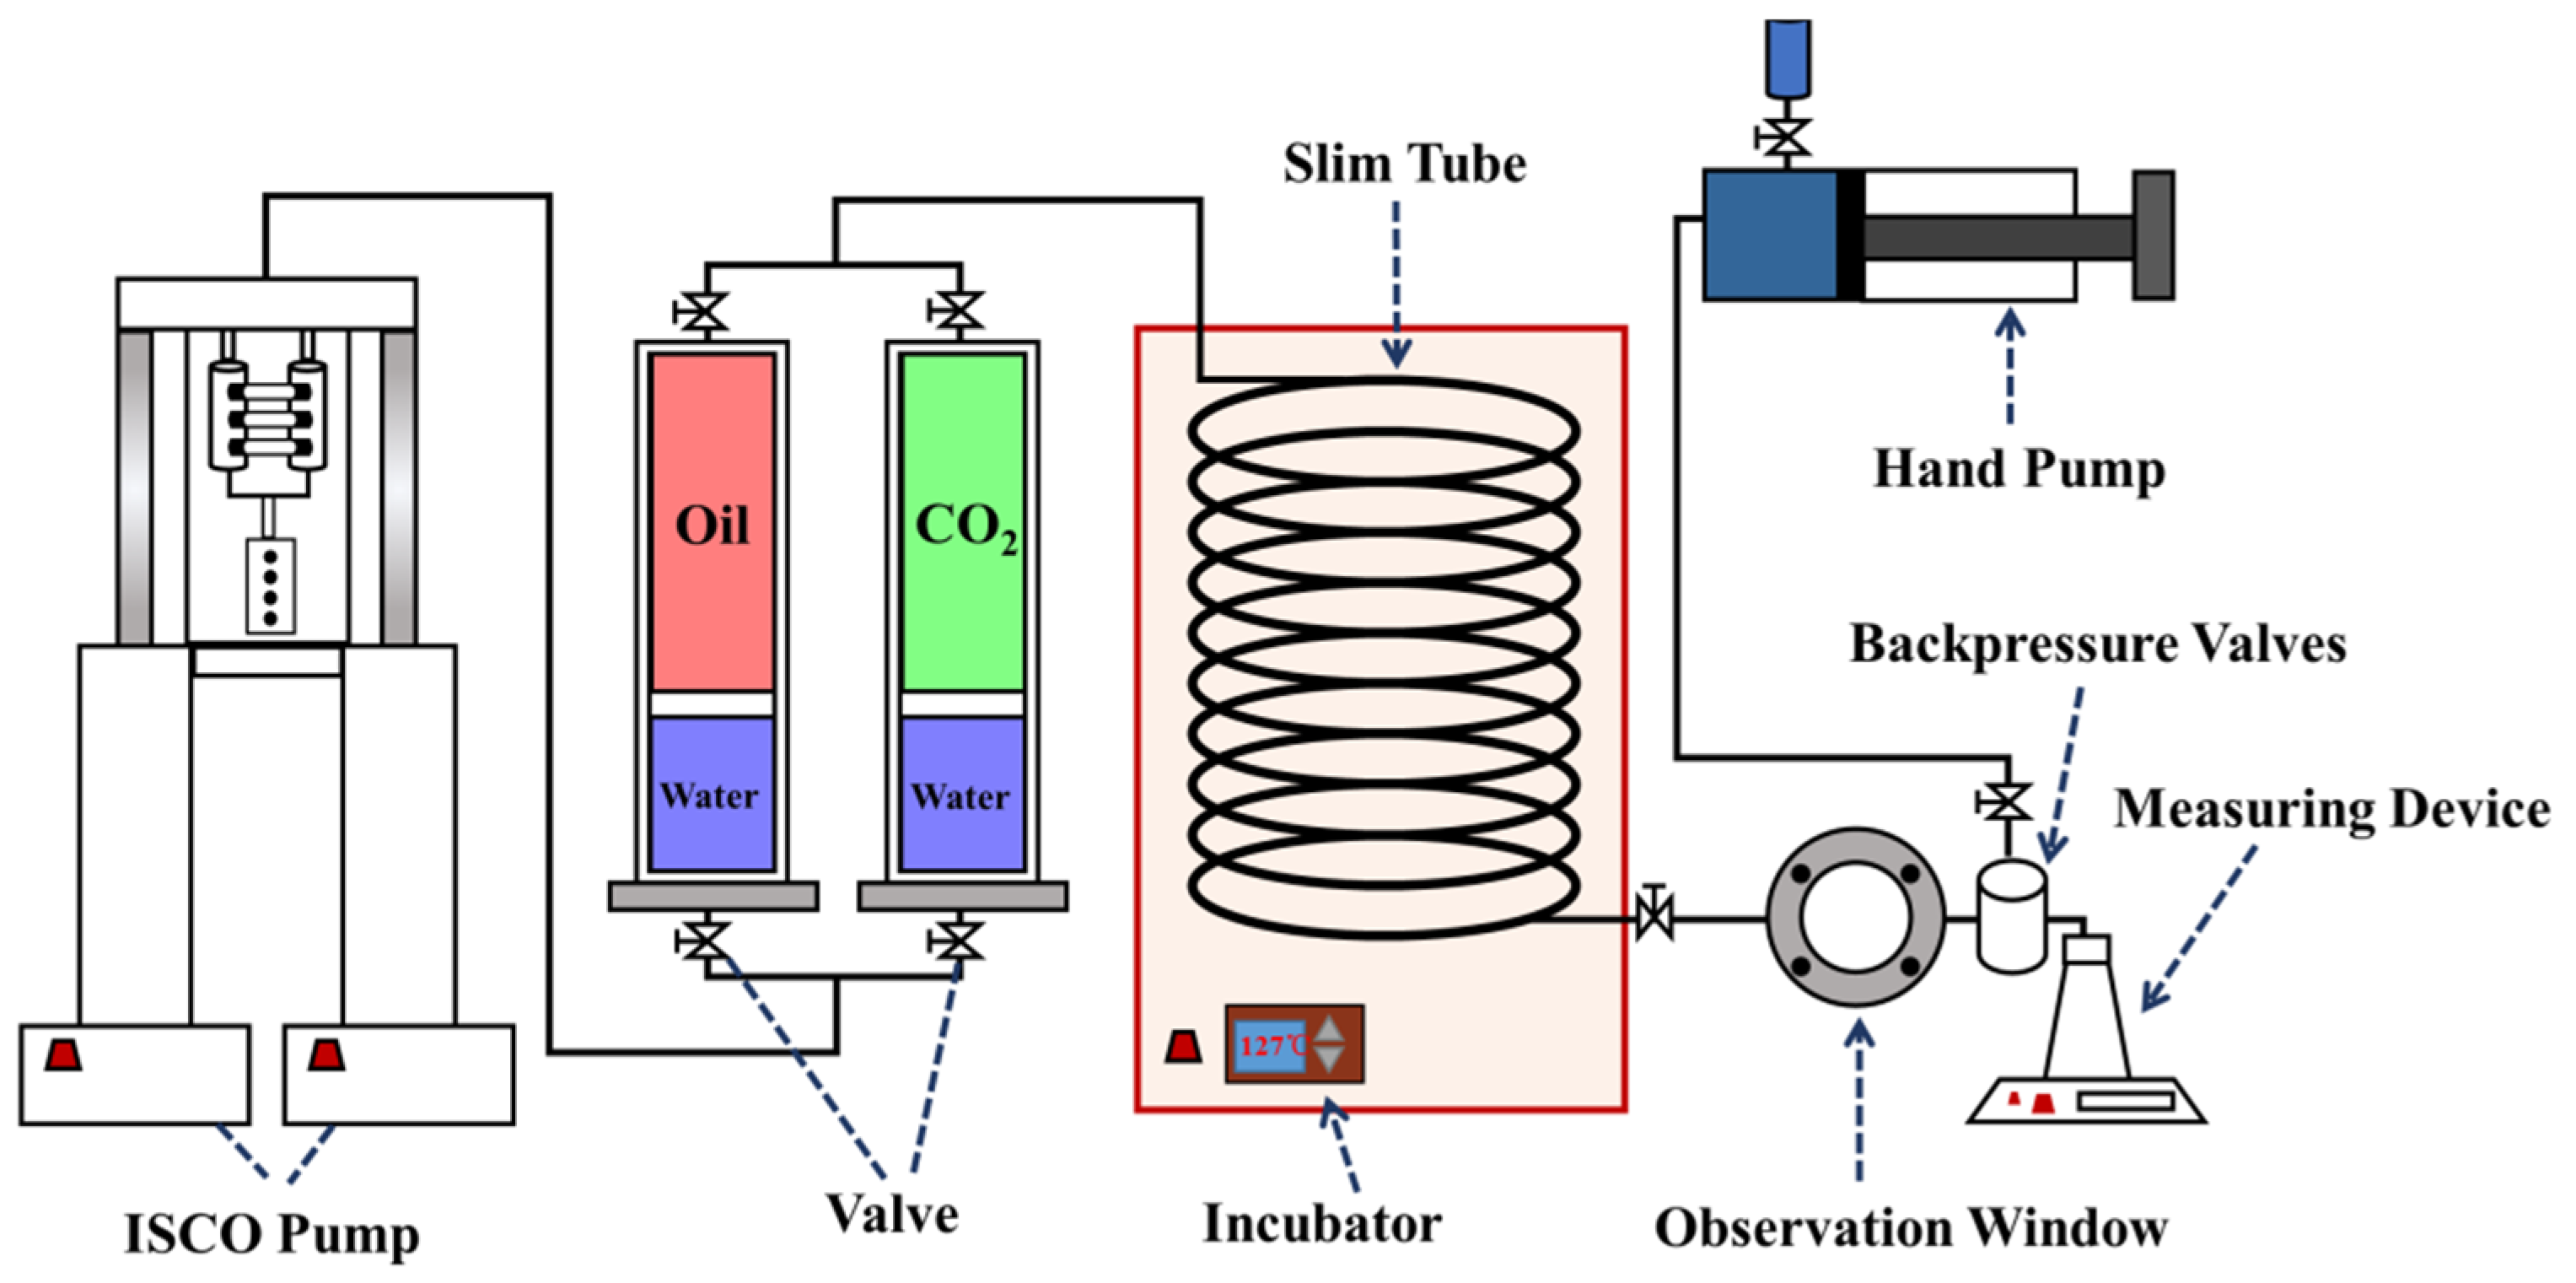
Slim tube experiments were conducted using different tube lengths (1 m, 12.5 m, 20 m, 25 m) under seven different displacement pressures, with the experimental temperature maintained at 127 °C. It is generally considered that when the final recovery rate exceeds 90%, the injected gas and crude oil reach a miscible state. The data point where the recovery rate reaches 90% is used as an inflection point for linear fitting, and the intersection of the two lines represents the MMP for the injected gas and crude oil.
3.1. Experimental Results for CO2 Flooding in 1 m Long Slim Tube
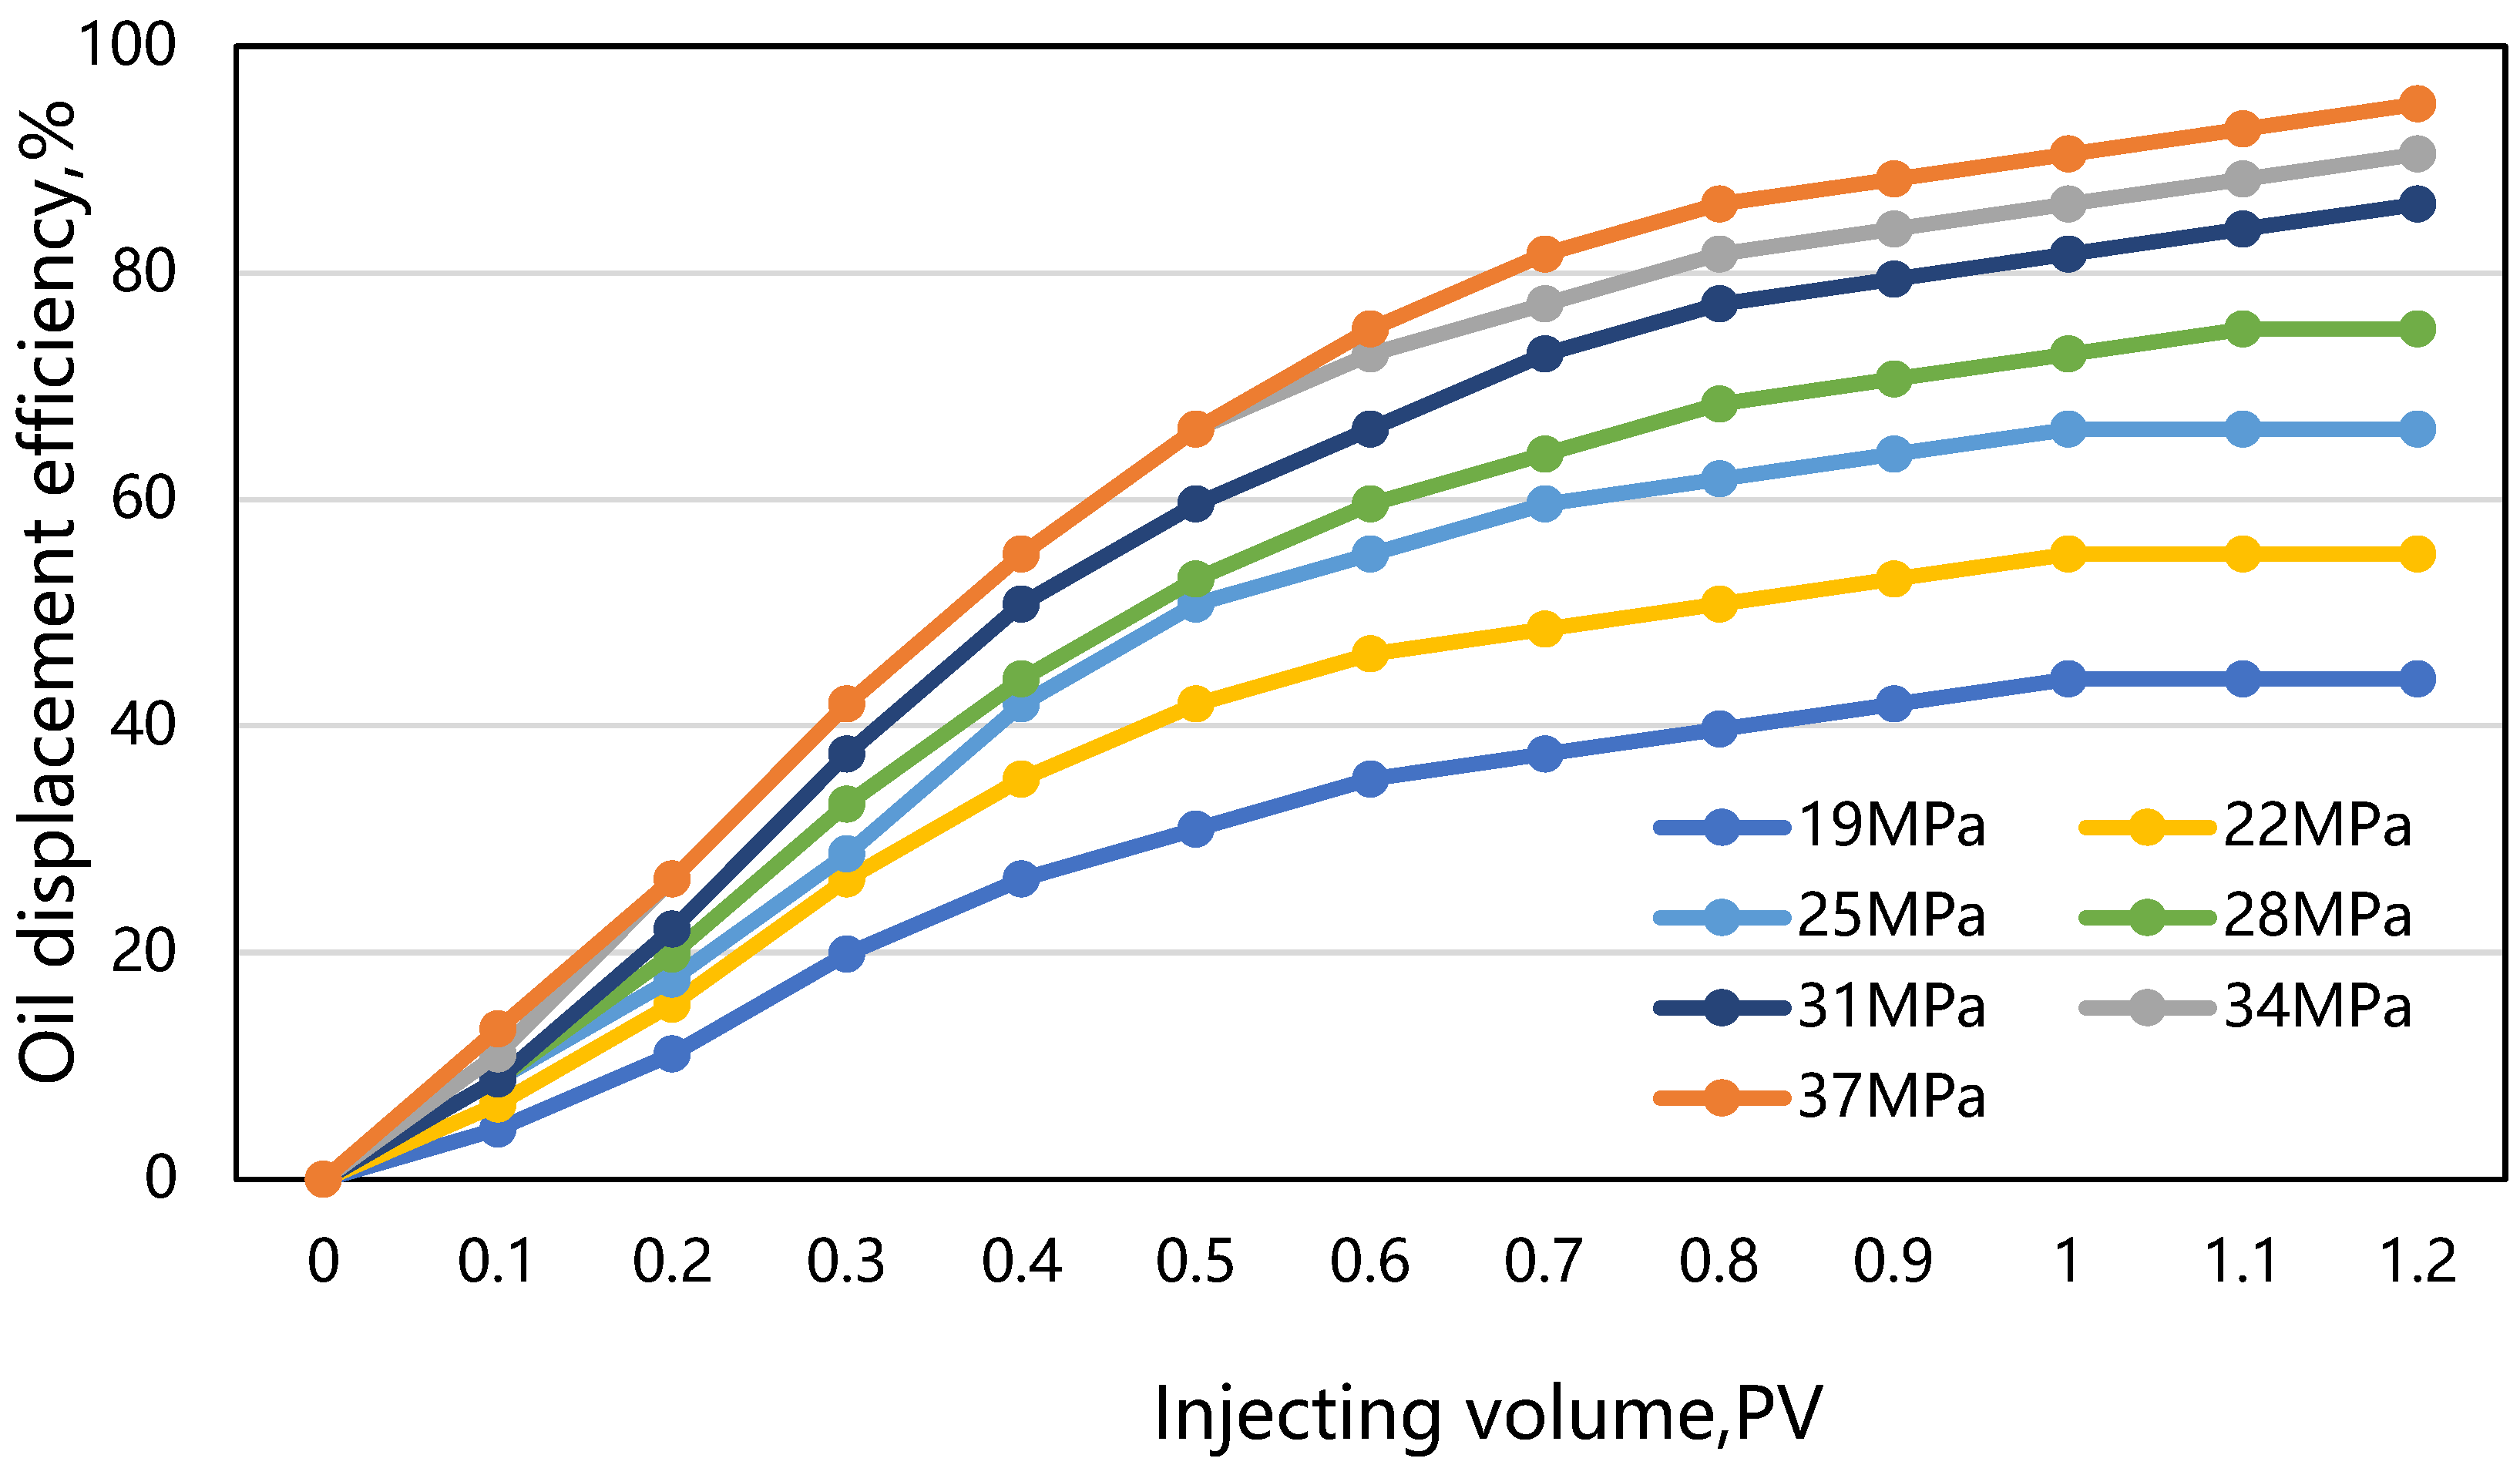
Figure 2 shows the oil recovery efficiency graph for the 1 m slim tube CO
2 displacement. As can be seen from
Figure 2, under different displacement pressures, the crude oil recovery factor gradually increases with the increase in CO
2 injection volume. An inflection point appears around 0.9 PV, and when the injection volume reaches 1.2 PV, the oil recovery efficiency does not change anymore. The final recovery rates are, respectively, 44.14%, 55.17%, 66.21%, 75.03%, 86.07%, 90.48%, and 94.90%.
This translation presents the experimental results and the analysis approach, highlighting the relationship between CO2 injection, recovery rates, and the determination of MMP in a 1 m slim tube setup.
Based on
Table 4 and
Figure 3, it is evident that the efficiency of displacement increases with rising displacement pressure. A significant inflection in the curve representing the relationship between recovery rate and displacement pressure occurs when the displacement pressure reaches 30 MPa. When the displacement pressure exceeds 34 MPa, the recovery rate is greater than 90%, indicating miscible displacement. Even if the displacement pressure continues to increase, the rate of increase in recovery is minimal, and the curve tends to flatten out. Above a displacement pressure of 31 MPa, partial miscibility occurs in the reservoir. The closer the displacement pressure is to the MMP, the higher the recovery rate.
By analyzing the slim tube experimental data and plotting the curves based on the final crude oil recovery factors at various injection pressures, as shown in
Figure 3, a linear fit is performed for the data before and after miscibility, and the intersection point of these lines represents the MMP. Therefore, the MMP for CO
2–crude oil as measured by the 1 m slim tube is determined to be 31.1 MPa.
This translation provides a detailed description of the analysis of the experimental data, emphasizing the relationship between displacement pressure, recovery rate, and the determination of MMP in the context of CO2–crude oil miscible displacement.
3.2. Experimental Results for CO2 Flooding in 12.5 m Long Slim Tube
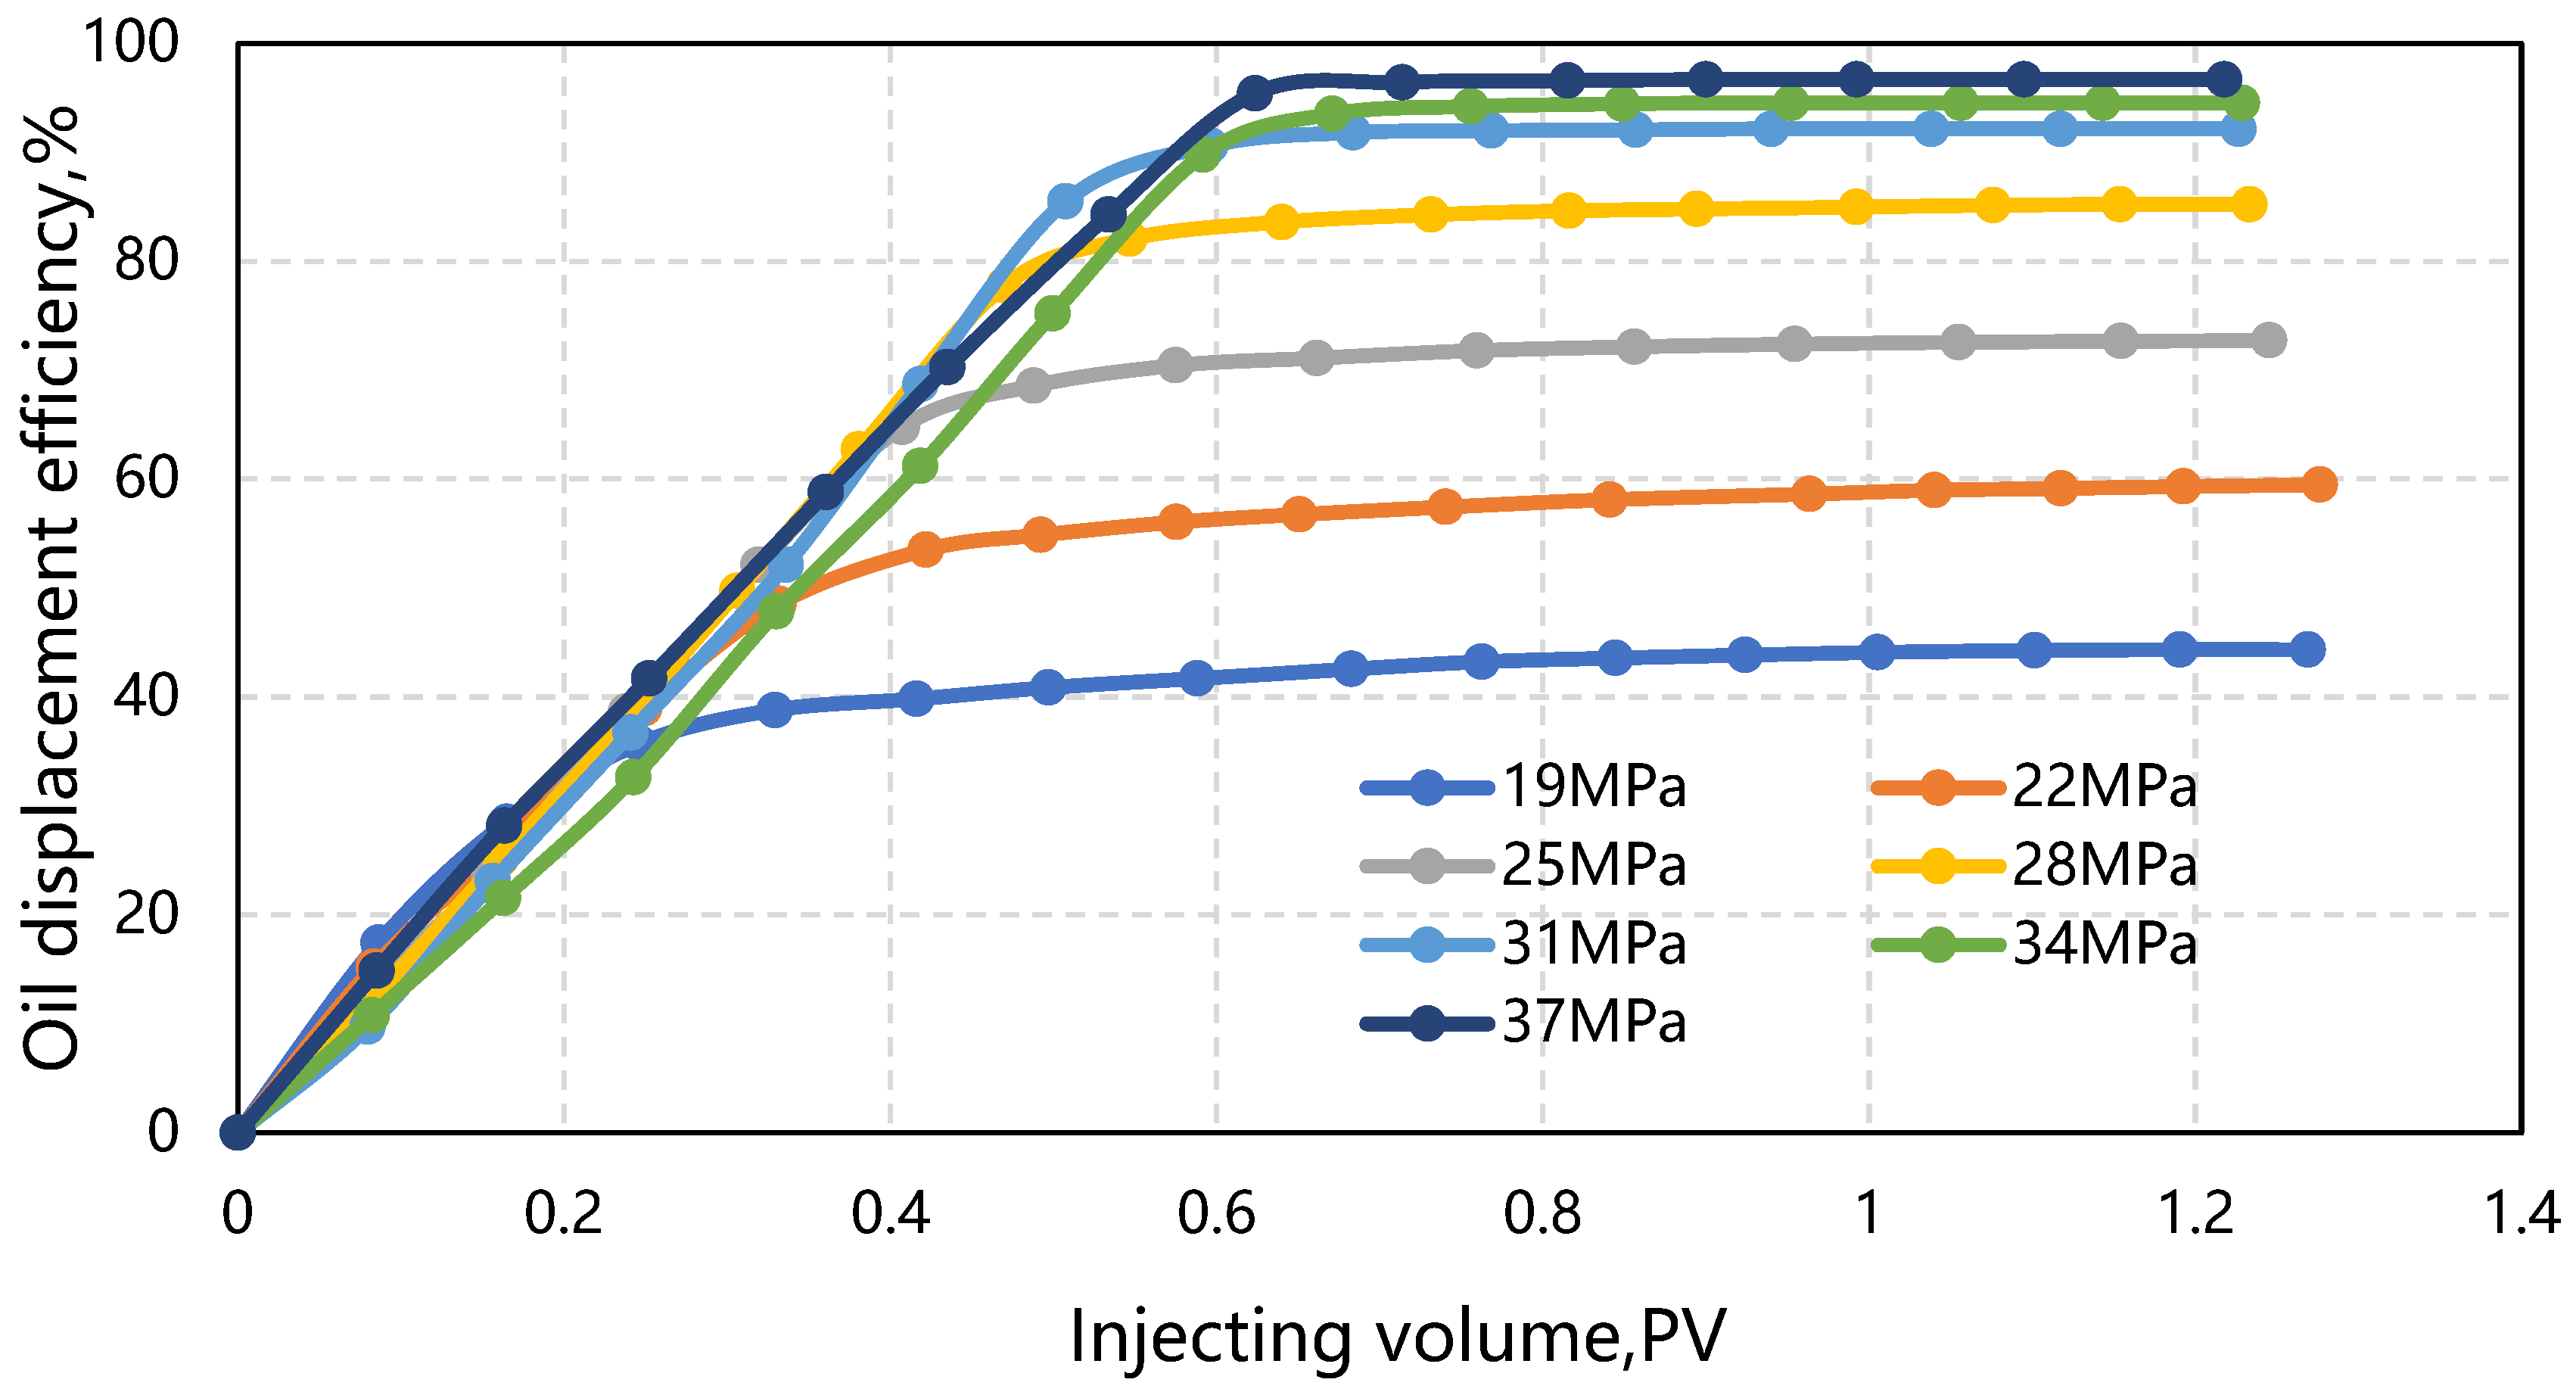
Figure 4 shows the oil recovery efficiency graph for the 12.5 m slim tube CO
2 displacement. As can be seen from
Figure 4, under different displacement pressures, the crude oil recovery factor gradually increases with the increase in CO
2 injection volume. An inflection point appears around 0.9 PV, and when the injection volume reaches 1.2 PV, the oil recovery efficiency does not change anymore. The final recovery rates are, respectively, 44.37%, 59.67%, 72.75%, 85.23%, 92.16%, 94.55%, and 96.69%.
From
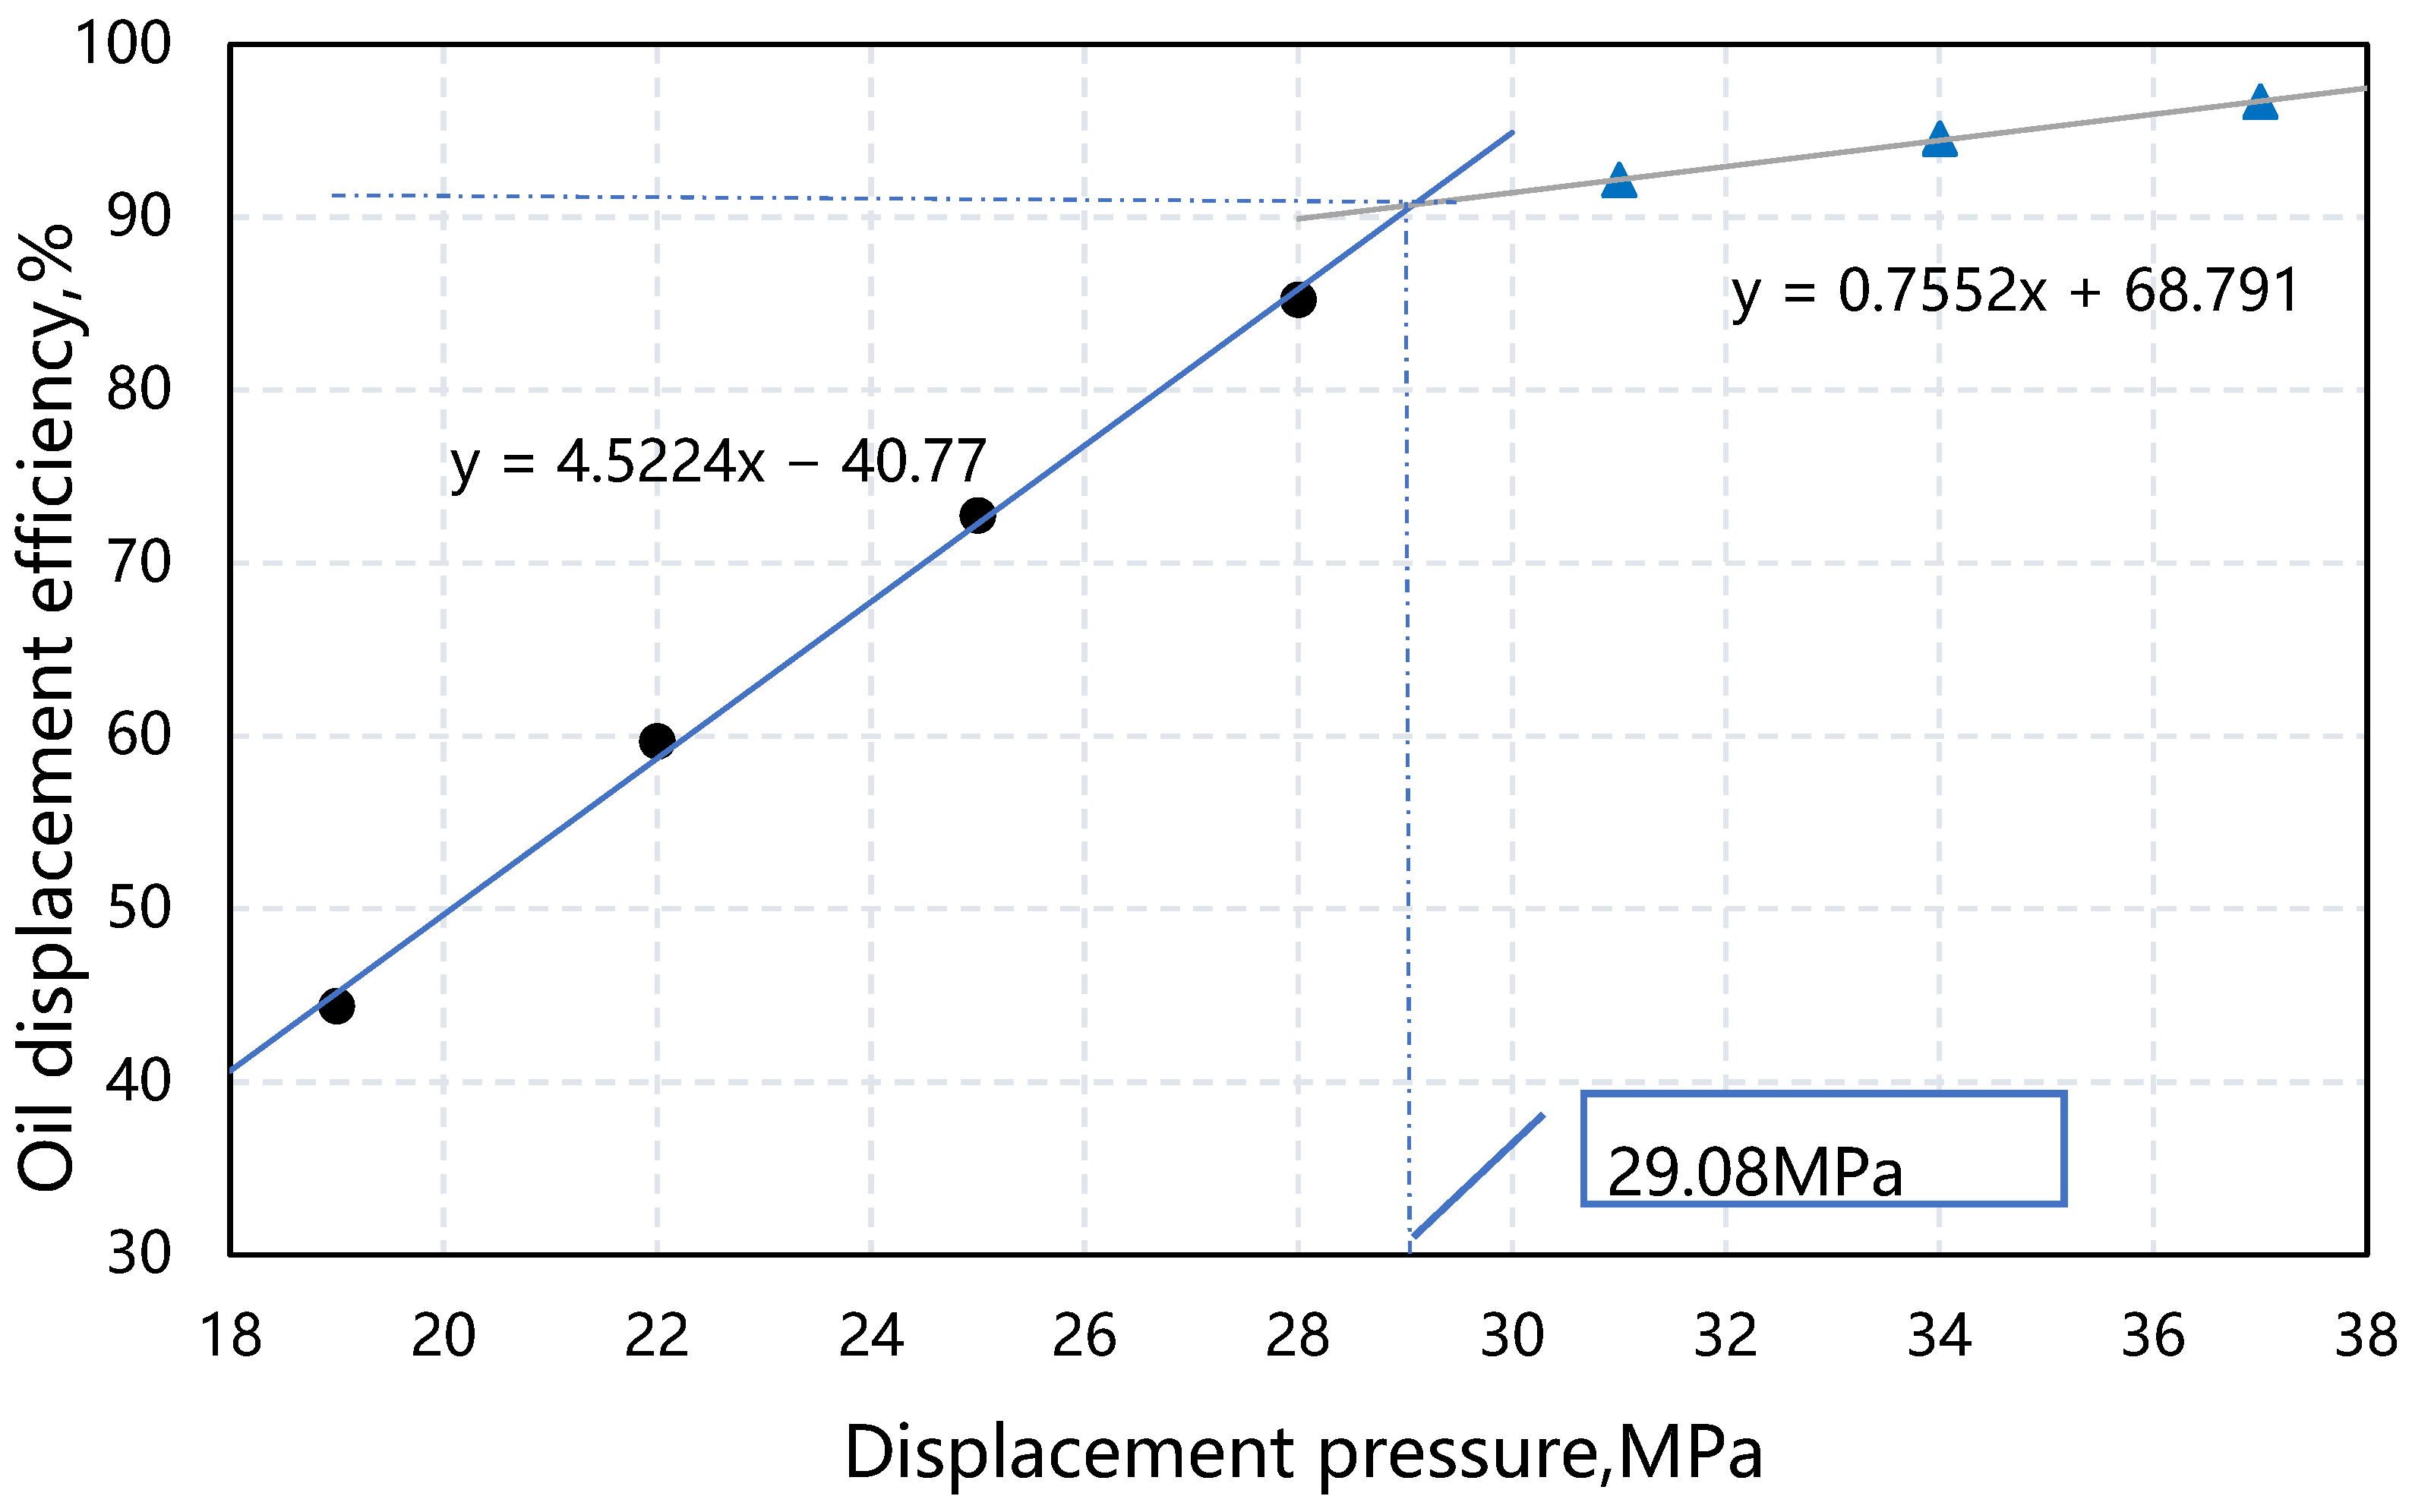
Table 5 and
Figure 5, it can be observed that the oil displacement efficiency increases with the rise in displacement pressure. A significant inflection in the curve representing the relationship between recovery rate and displacement pressure occurs when the displacement pressure equals 28 MPa. When the displacement pressure exceeds 31 MPa, the recovery rate is greater than 90%, indicating miscible displacement. Even with further increases in displacement pressure, the increment in recovery rate remains small, and the curve tends to flatten out. Above a displacement pressure of 28 MPa, partial miscibility occurs in the reservoir. The closer the displacement pressure is to the MMP, the higher the recovery rate.
By analyzing the slim tube experimental data and plotting the curves based on the final crude oil recovery factors at various injection pressures, as shown in
Figure 5, a linear fit is performed for the data before and after miscibility, and the intersection point of these lines represents the MMP. Therefore, the MMP for CO
2–crude oil as measured by the 12.5 m slim tube is determined to be 29.08 MPa, as detailed in
Table 5.
3.3. Experiment Results for CO2 Flooding in 20 m Long Slim Tube
Using the same experimental method as the 12.5 m slim tube experiments, the 20 m slim tube maintained the same experimental temperature and displacement pressures. The final recovery rates obtained are shown in
Table 6.
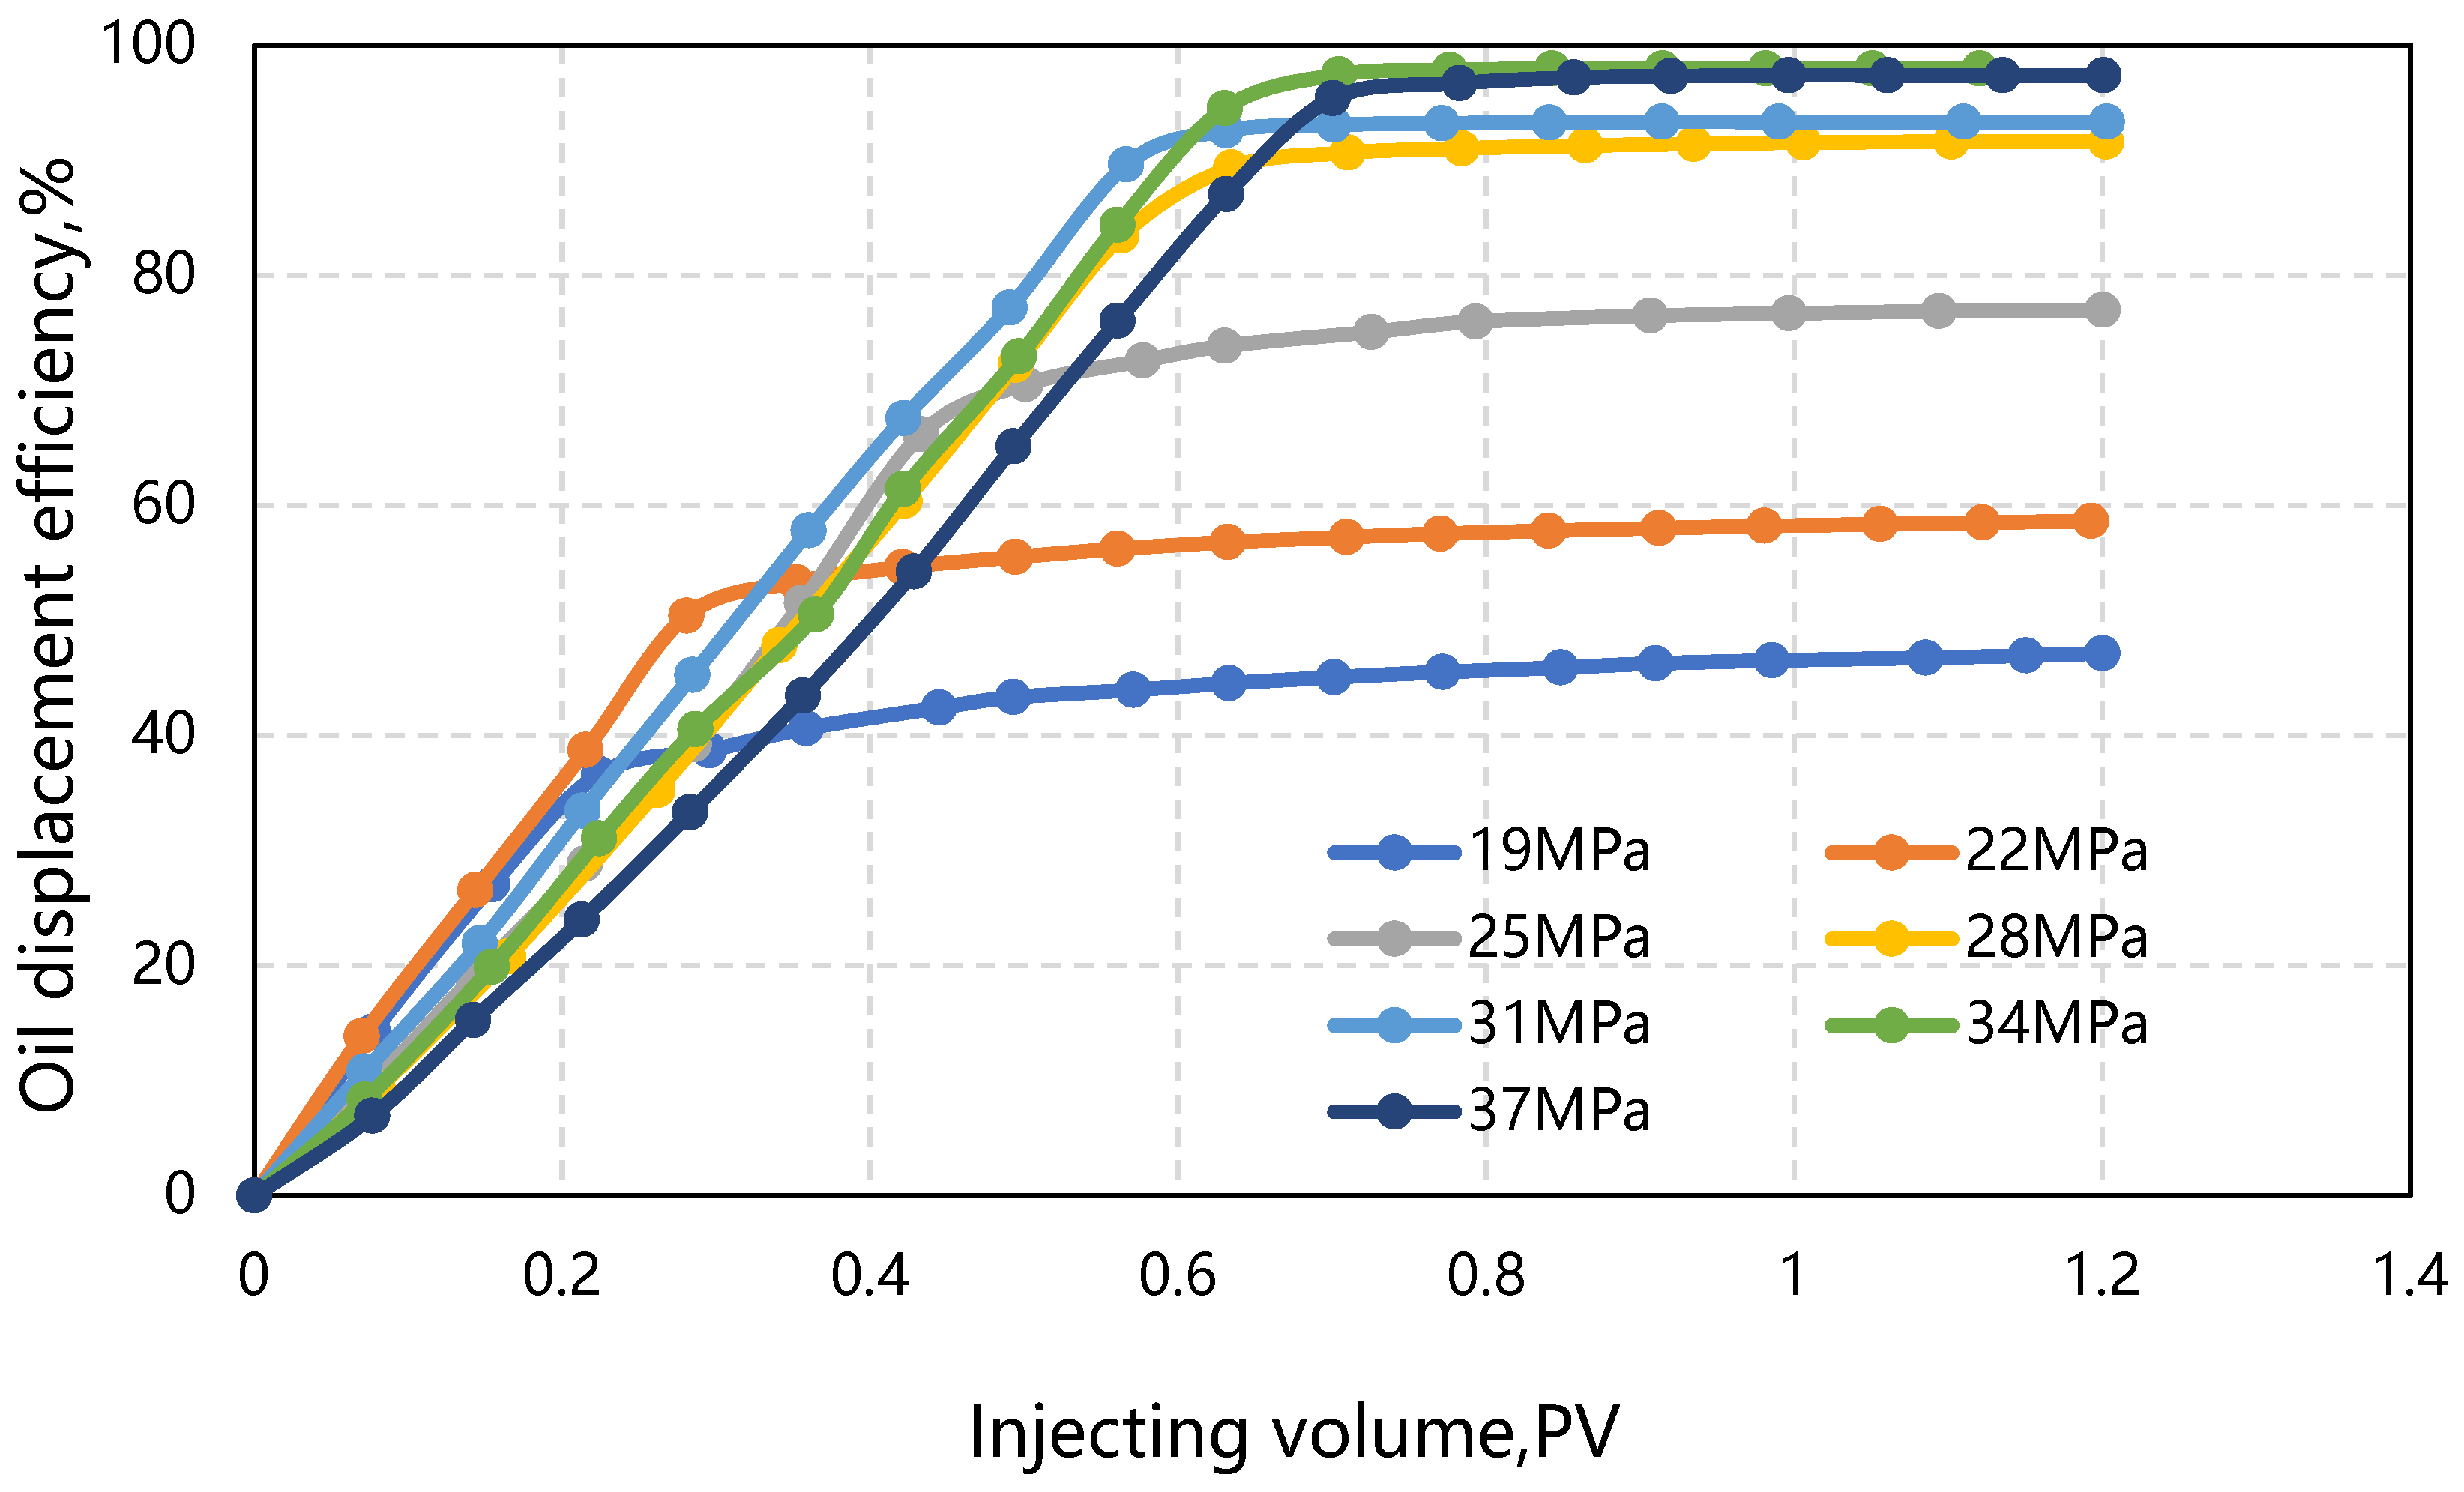
Figure 6 presents the oil recovery efficiency graph for the 20 m slim tube CO
2 displacement. As seen in
Figure 6, under different displacement pressures, the crude oil recovery factor gradually increases with the increase in CO
2 injection volume. An inflection point appears around 0.9 PV, and when the injection volume reaches 1.2 PV, the oil recovery efficiency does not change anymore. The final recovery rates are, respectively, 47.14%, 58.64%, 77.01%, 91.62%, 93.36%, 96.63%, and 97.40%.
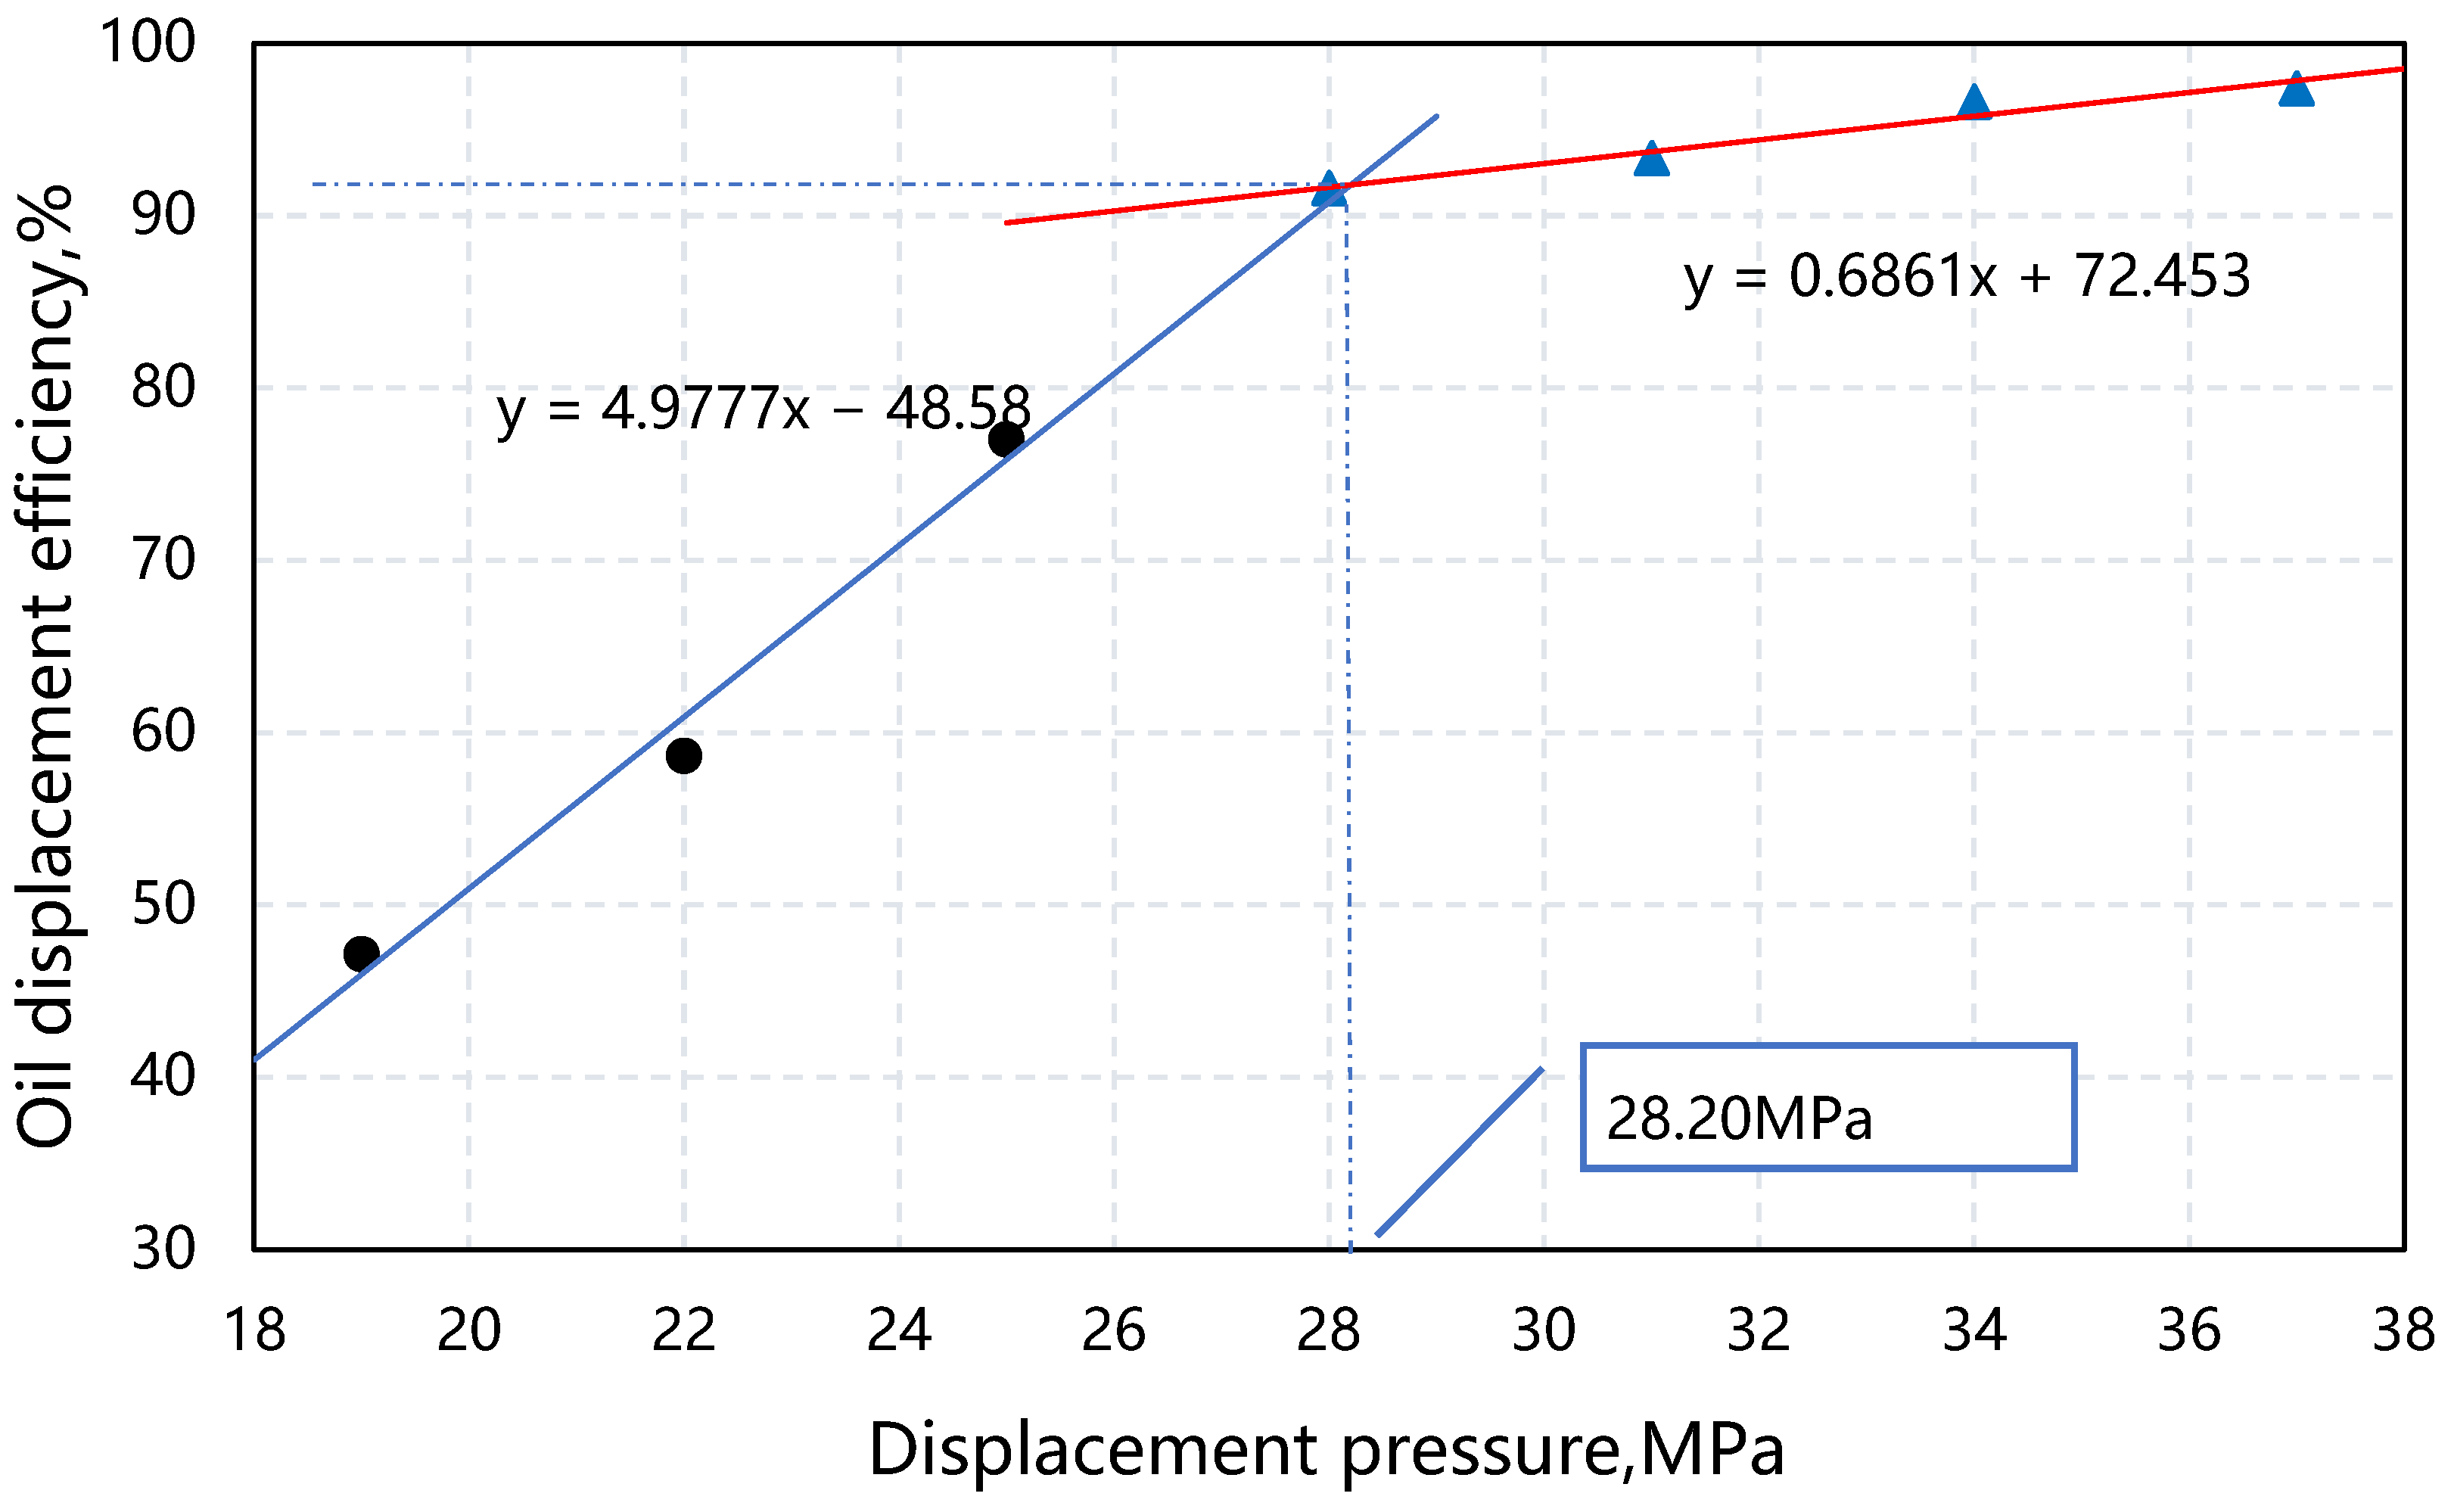
From
Table 6 and
Figure 7, it can be observed that the oil displacement efficiency increases with the rise in displacement pressure. A significant inflection in the curve representing the relationship between recovery rate and displacement pressure occurs when the displacement pressure equals 25 MPa. When the displacement pressure exceeds 28 MPa, the recovery rate is greater than 90%, indicating miscible displacement. Even with further increases in displacement pressure, the increment in recovery rate remains small, and the curve tends to flatten out. Above a displacement pressure of 25 MPa, partial miscibility occurs in the reservoir. The closer the displacement pressure is to the MMP, the higher the recovery rate, meaning that higher pressures are closer to miscibility. This pressure range can be considered as near-miscible displacement.
By analyzing the slim tube experimental data and plotting the curves based on the final crude oil recovery factors at various injection pressures, as shown in
Figure 7, a linear fit is performed for the data before and after miscibility, and the intersection point of these lines represents the MMP. Therefore, the MMP for CO
2–crude oil as measured by the 20 m slim tube is determined to be 28.2 MPa, as detailed in
Table 6.
3.4. Experiment Results for CO2 Flooding in a 25 m Long Slim Tube
Maintaining the same experimental conditions, the final recovery rates obtained for the 25 m slim tube are shown in
Table 7.
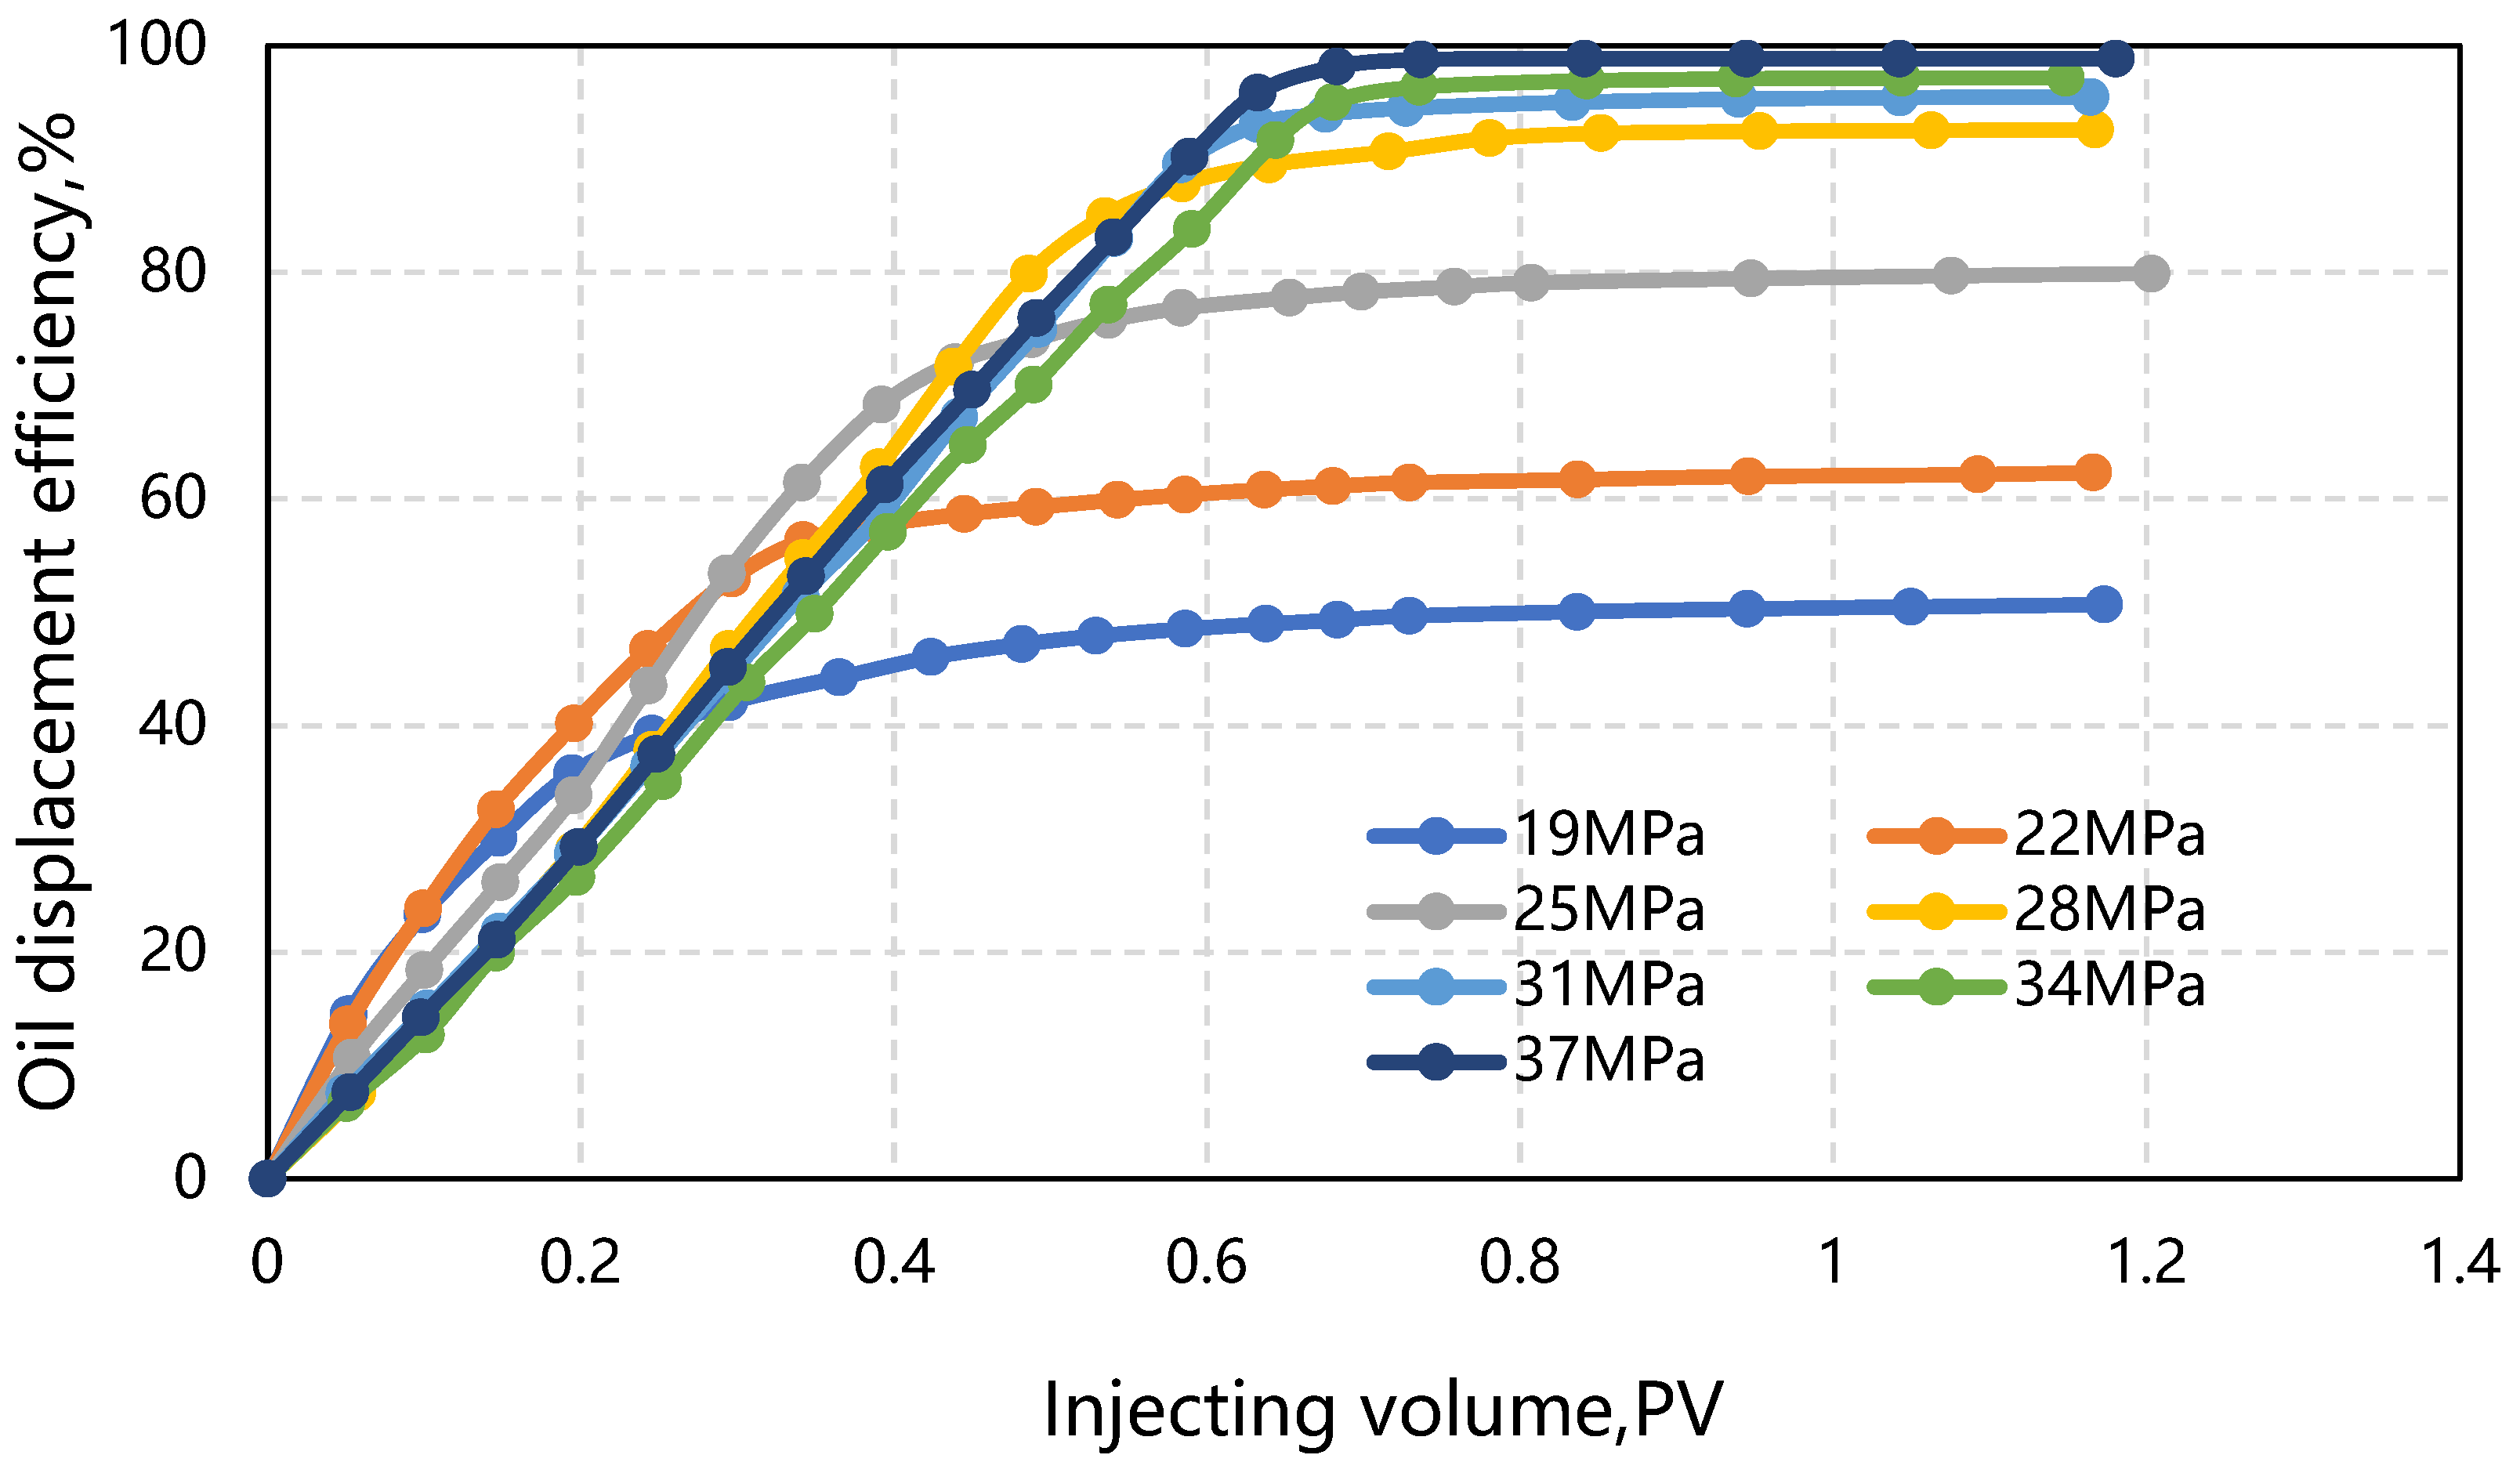
Figure 8 presents the oil recovery efficiency graph for the 25 m slim tube CO
2 displacement. As seen in
Figure 8, under different displacement pressures, the crude oil recovery factor gradually increases with the increase in CO
2 injection volume. An inflection point appears around 0.9 PV, and when the injection volume reaches 1.2 PV, the oil recovery efficiency does not change anymore. The final recovery rates are, respectively, 50.67%, 62.34%, 79.88%, 92.57%, 95.46%, 97.16%, and 98.85%.
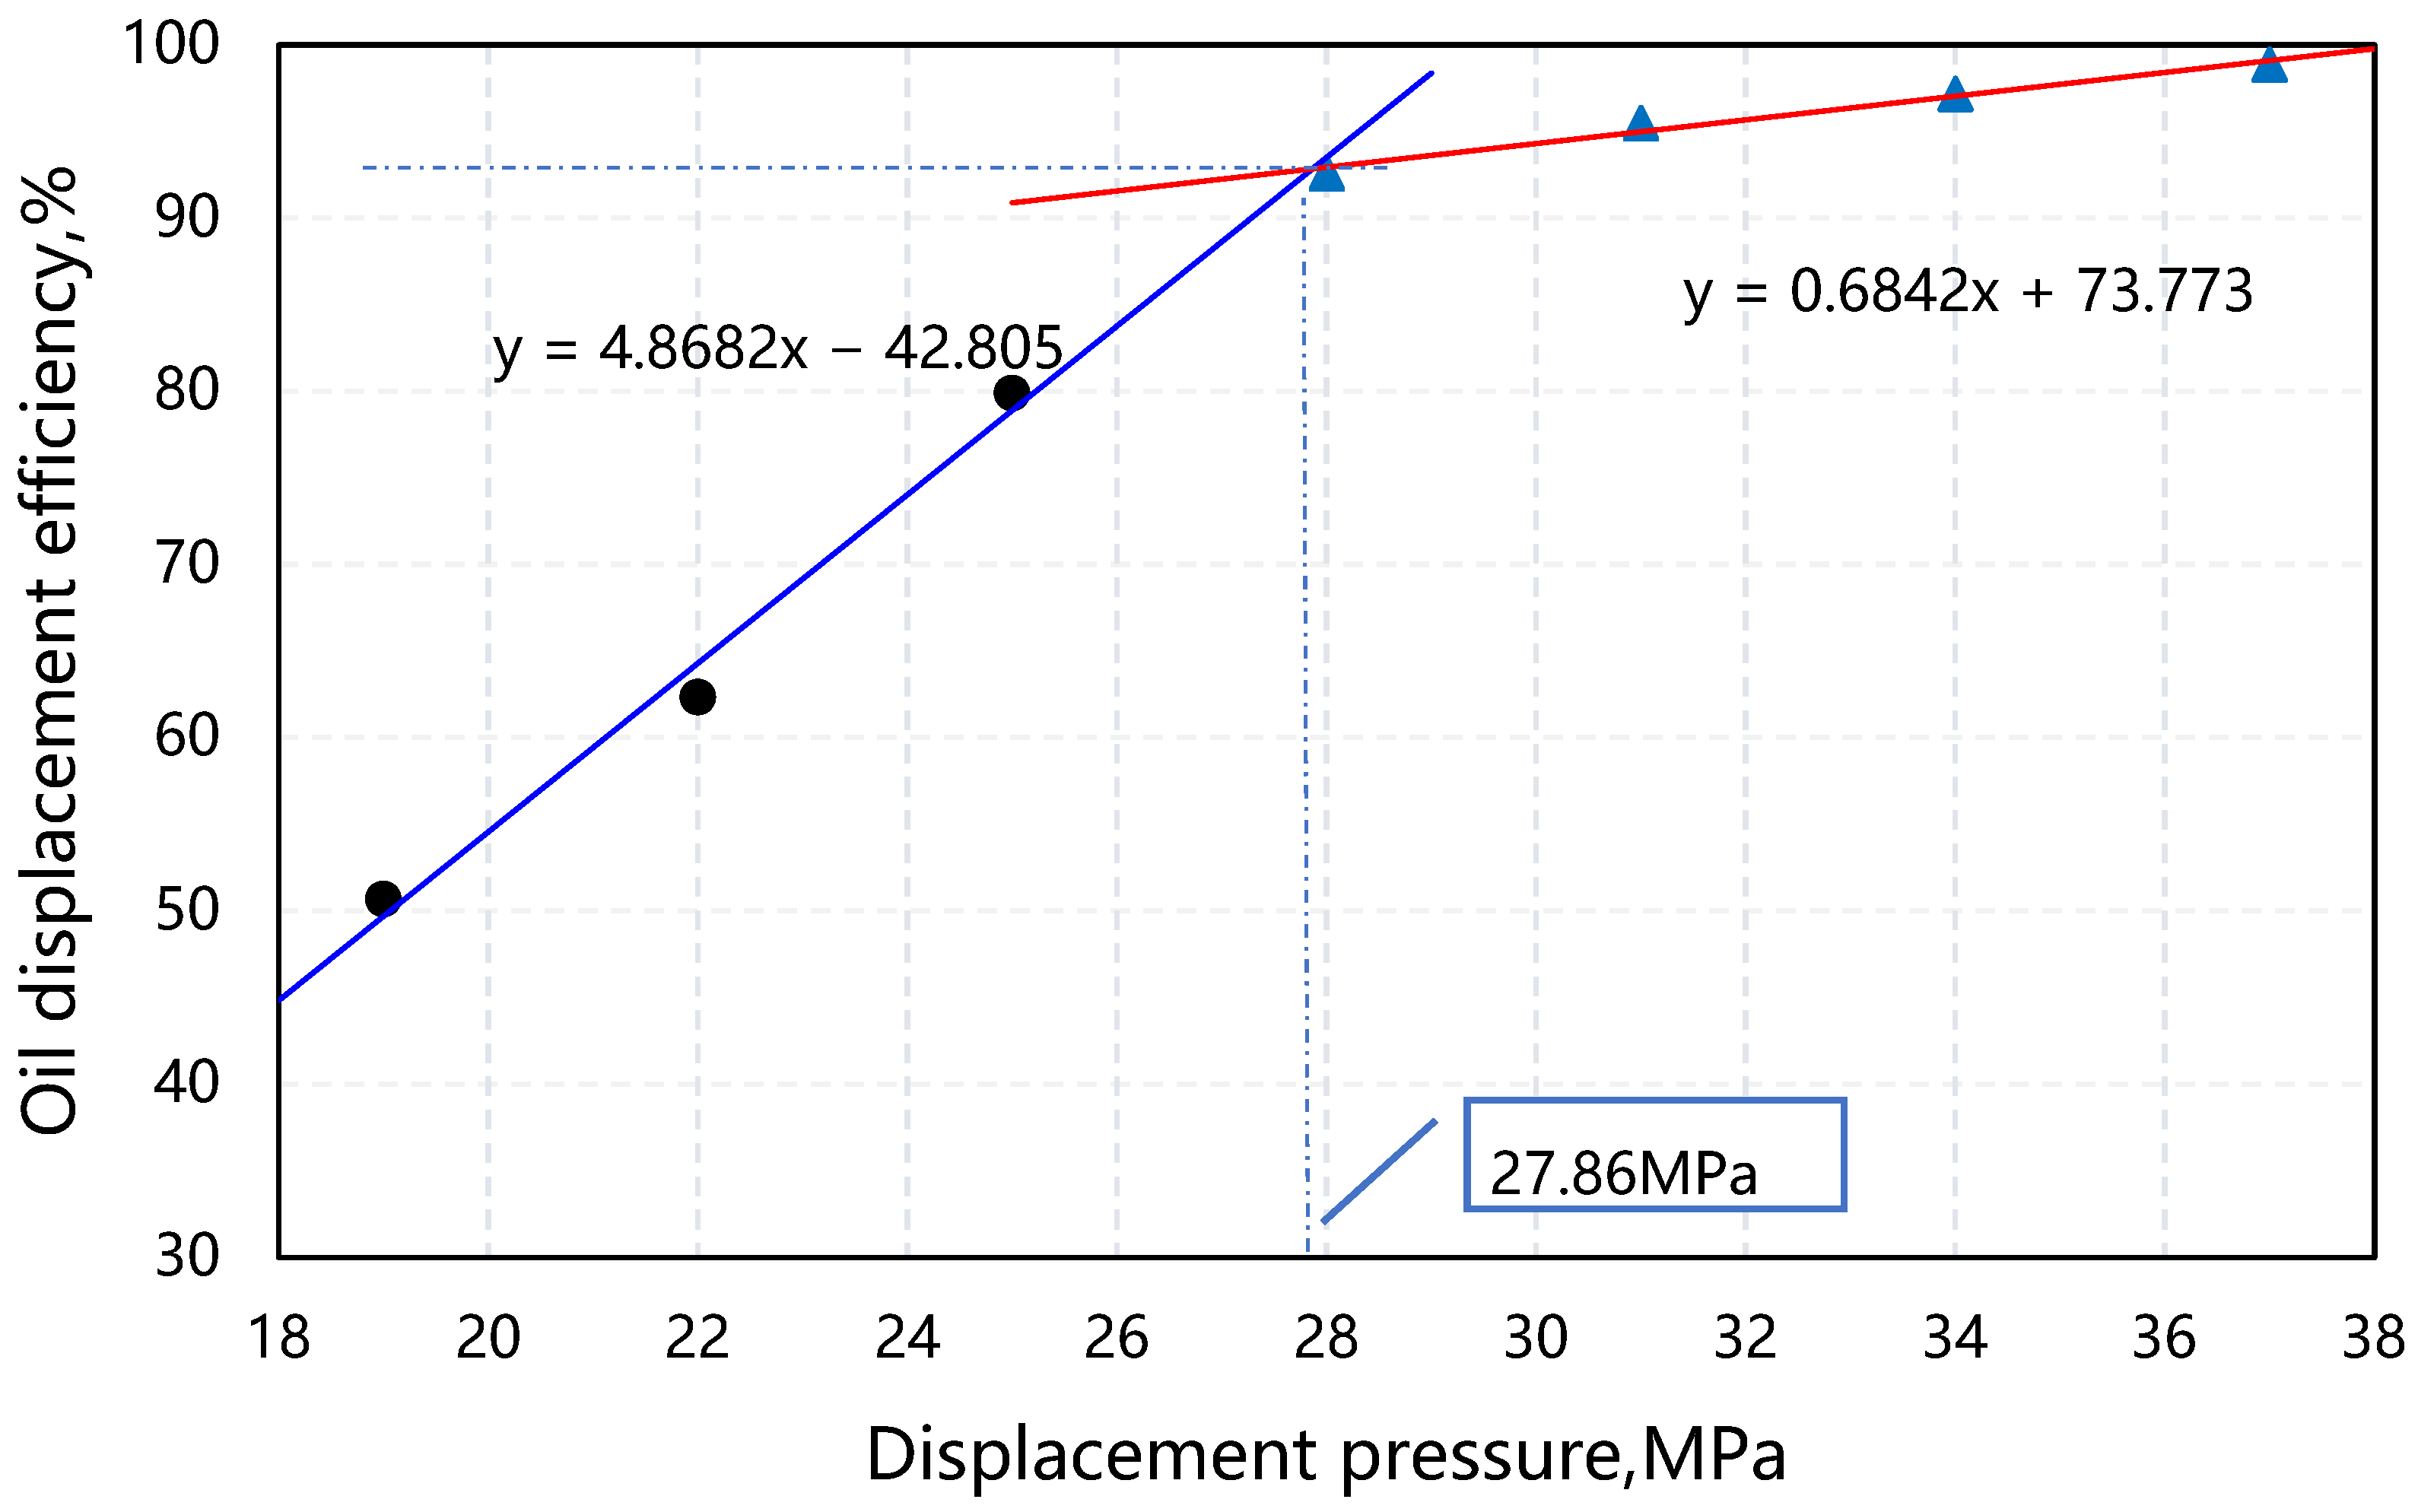
From
Table 7 and
Figure 9, it is evident that the oil displacement efficiency increases with increasing displacement pressure. A significant inflection in the curve representing the relationship between recovery rate and displacement pressure occurs when the displacement pressure equals 25 MPa. When the displacement pressure exceeds 28 MPa, the recovery rate is greater than 90%, indicating miscible displacement. Even if the displacement pressure continues to increase, the increment in recovery rate remains small, and the curve tends to flatten out. Above a displacement pressure of 25 MPa, partial miscibility occurs in the reservoir. The closer the displacement pressure is to the MMP, the higher the recovery rate, meaning that higher pressures are closer to miscibility. This pressure range can be considered as near-miscible displacement.
By analyzing the slim tube experimental data and plotting the curves based on the final crude oil recovery factors at various injection pressures, as shown in
Figure 9, a linear fit is performed for the data before and after miscibility, and the intersection point of these lines represents the MMP. Therefore, the MMP for CO
2–crude oil as measured by the 25 m slim tube is determined to be 27.86 MPa, as detailed in
Table 7.
3.5. Analysis of the Impact of Different Slim Tube Lengths on MMP and Final Recovery Rate
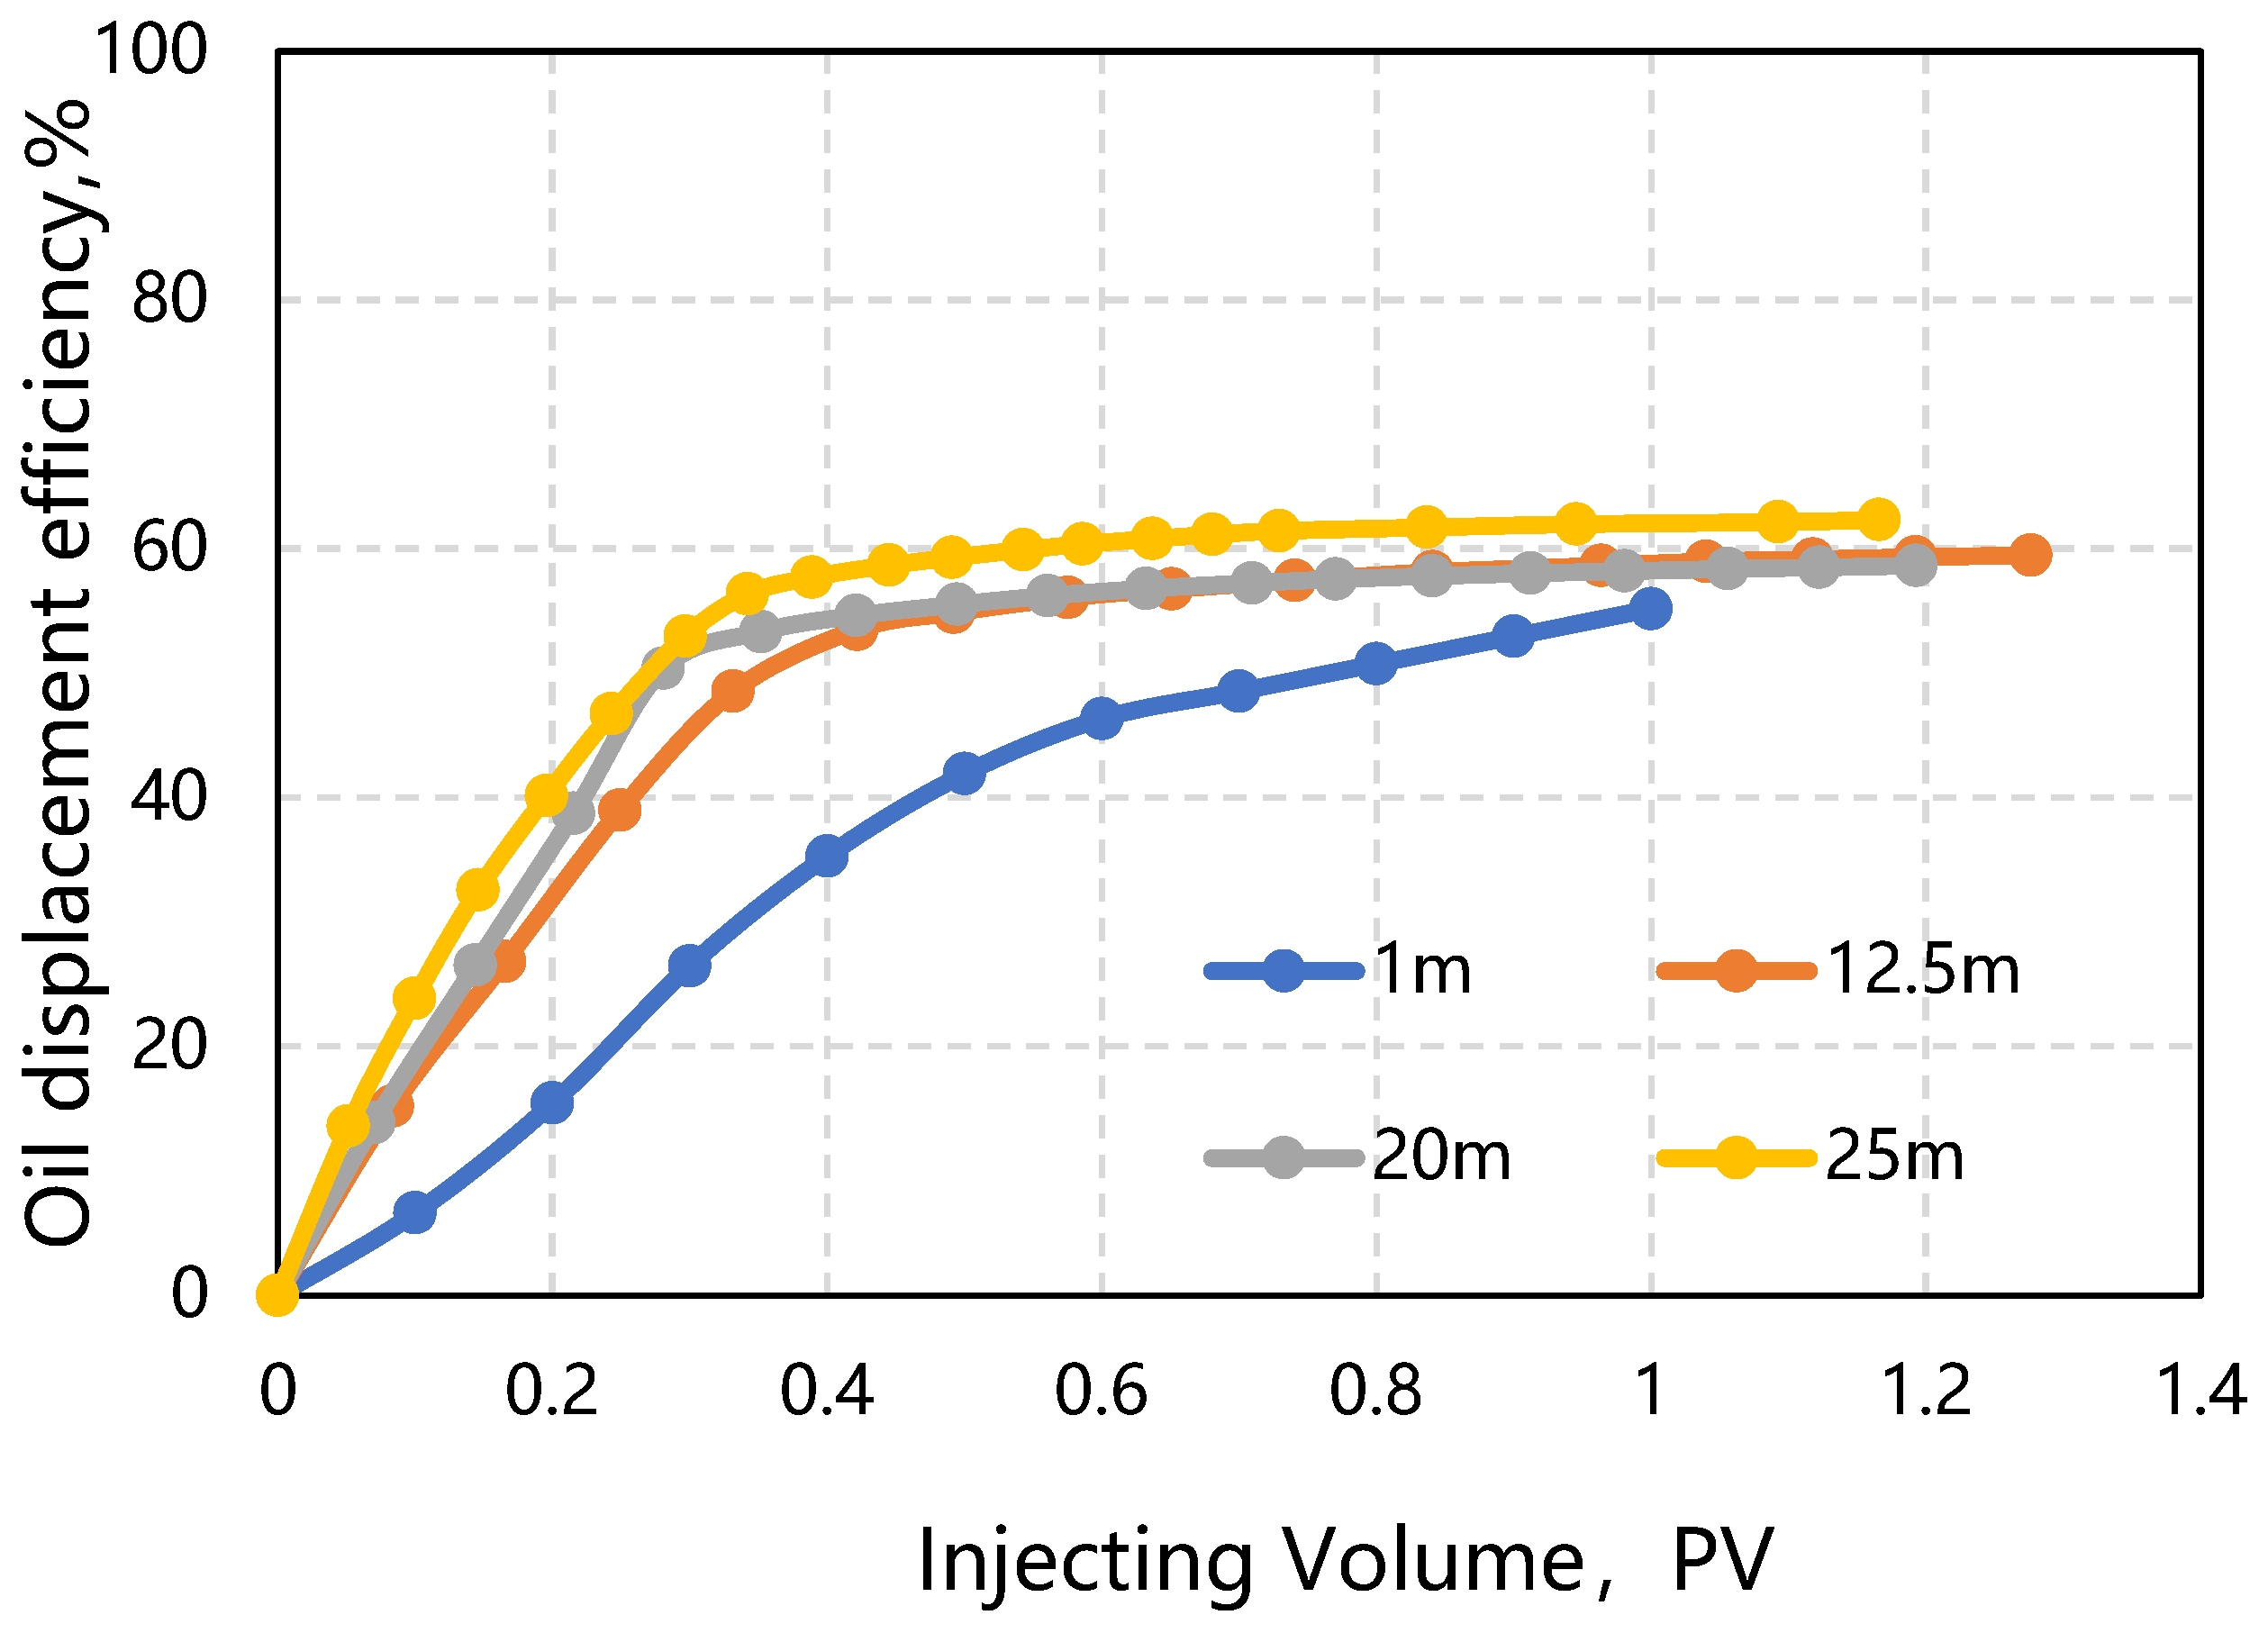
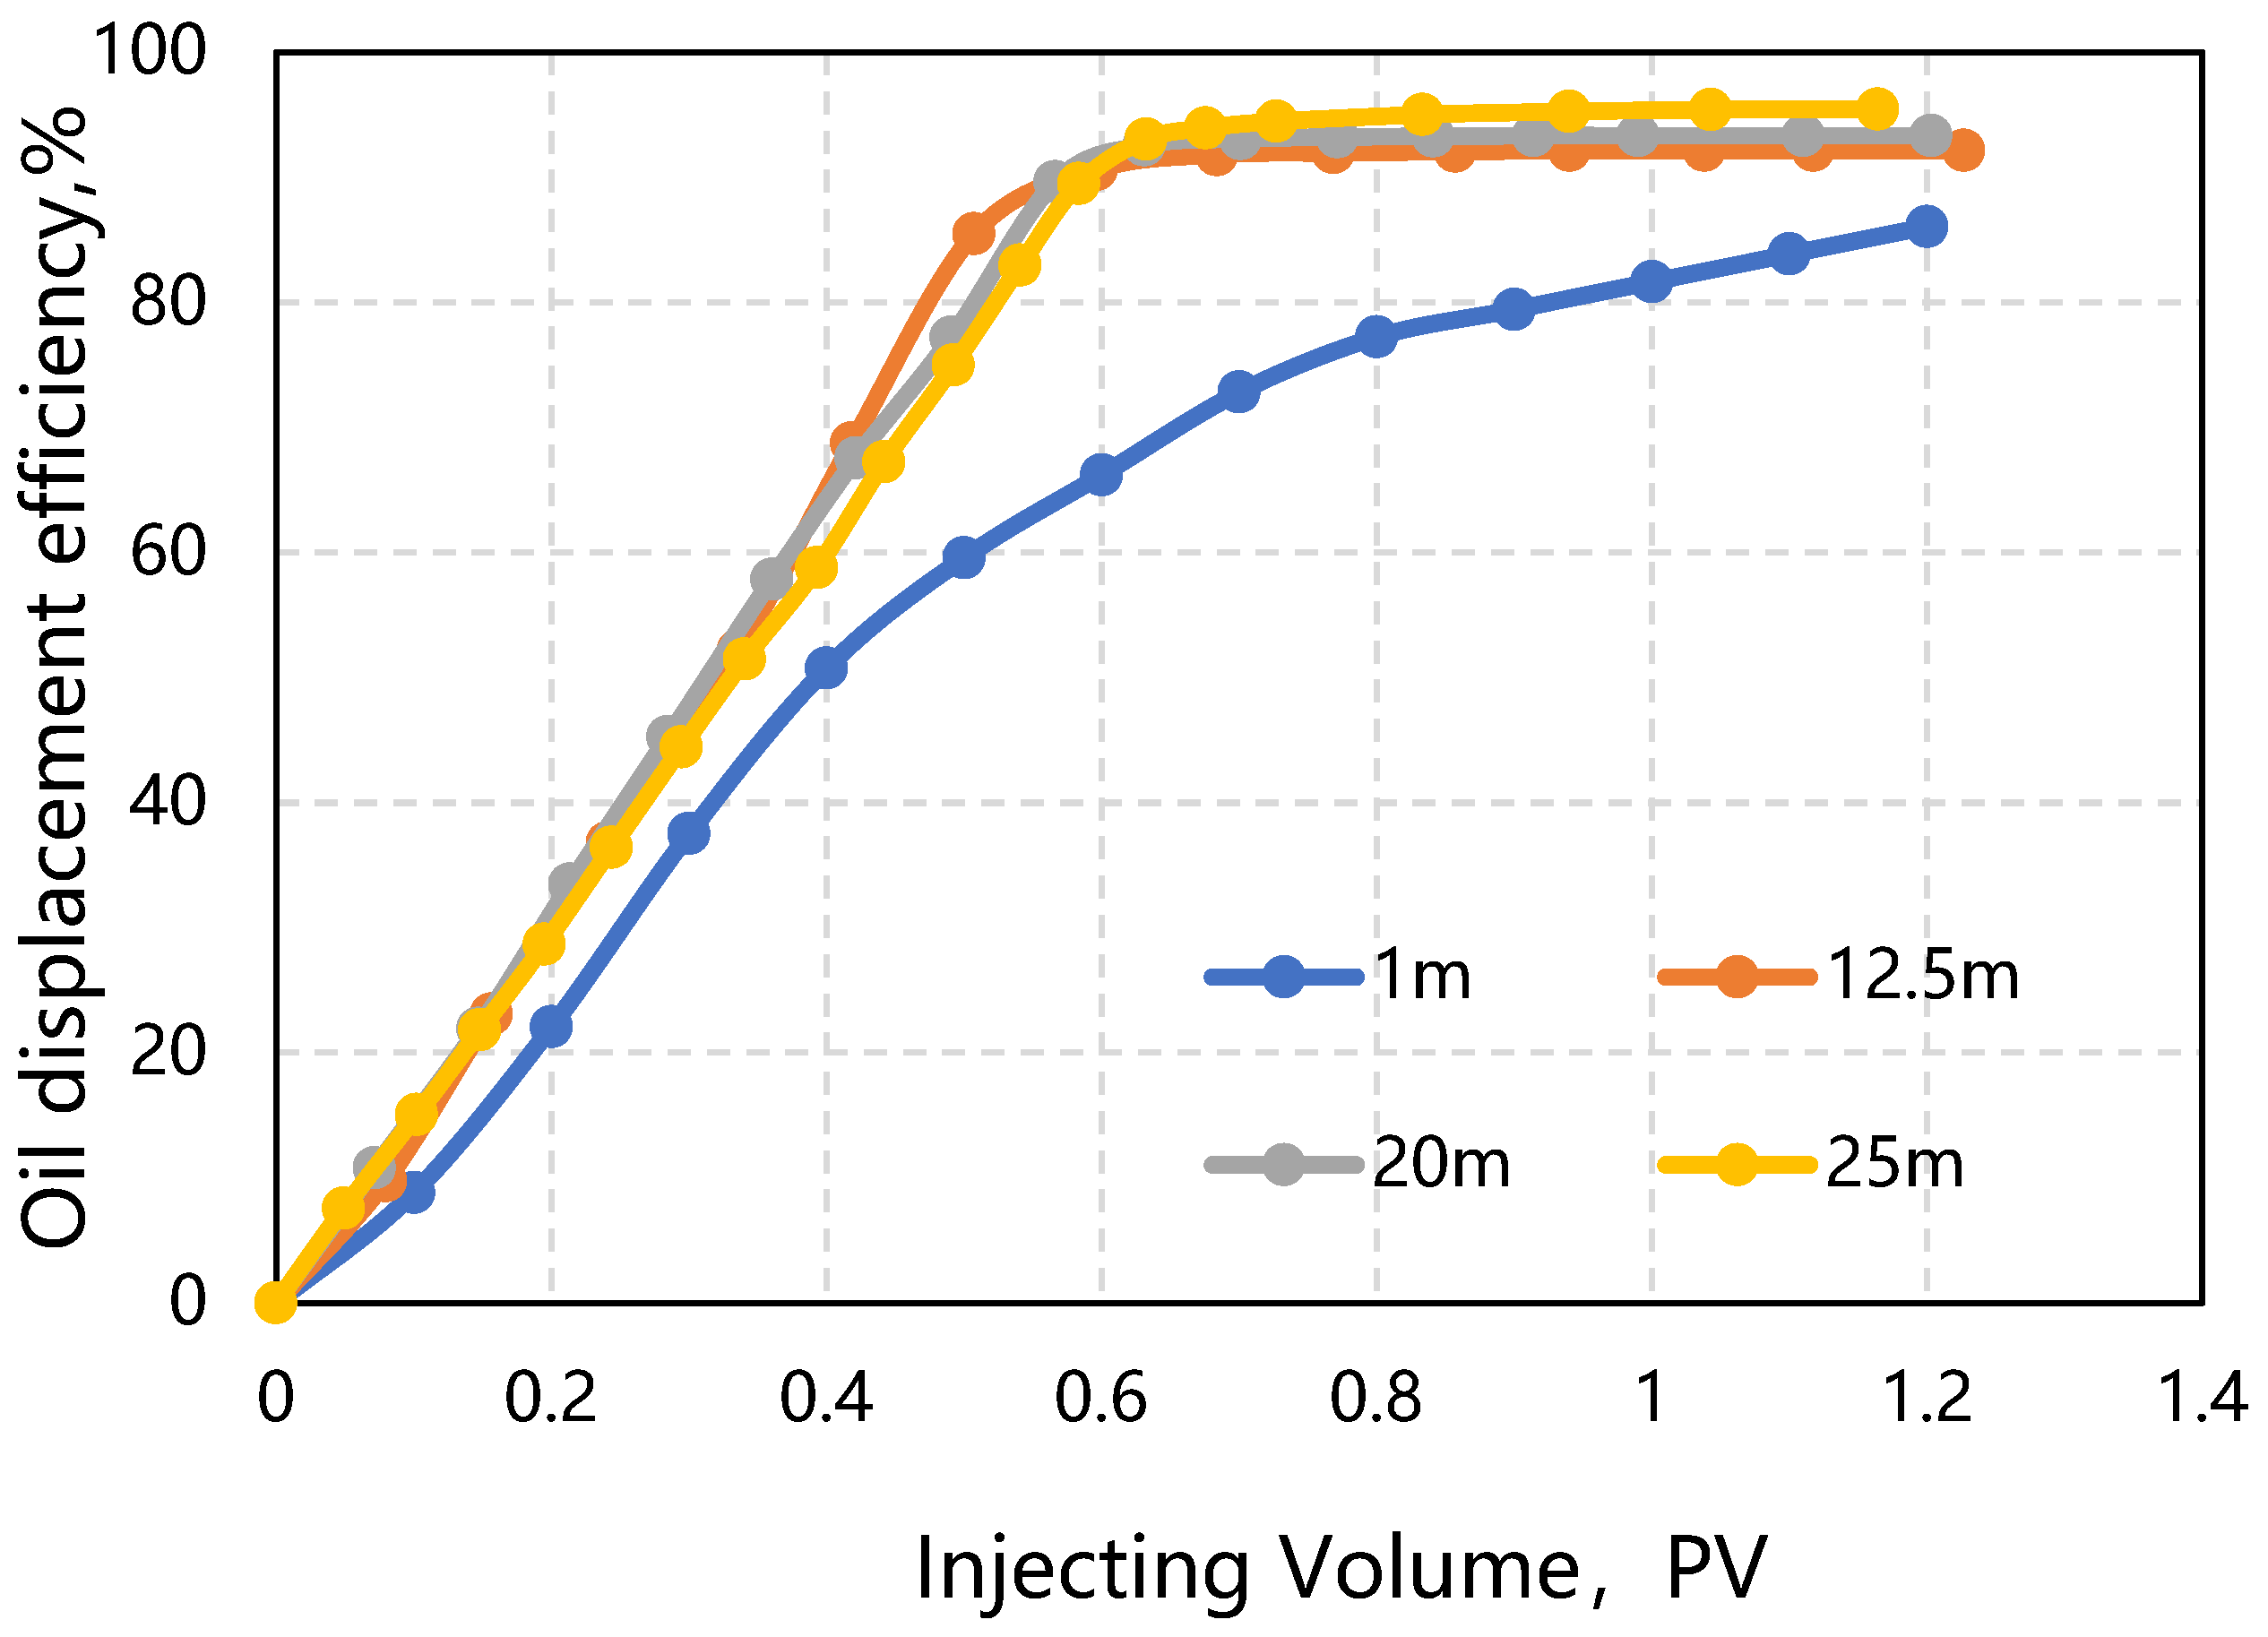
Figure 10 and
Figure 11 show the oil recovery efficiency curves for different slim tube lengths at non-miscible (22 MPa) and miscible (31 MPa) points. From
Figure 10, it is evident that before reaching miscibility, the longer the slim tube, the higher the oil recovery efficiency when the same pore volume multiple of CO
2 is injected. As shown in
Figure 11, at the point of miscibility, when the slim tube length exceeds 12.5 m, the oil recovery efficiency is similar for the same pore volume multiple of CO
2 injection, while at a slim tube length of 1 m, the efficiency is significantly different.
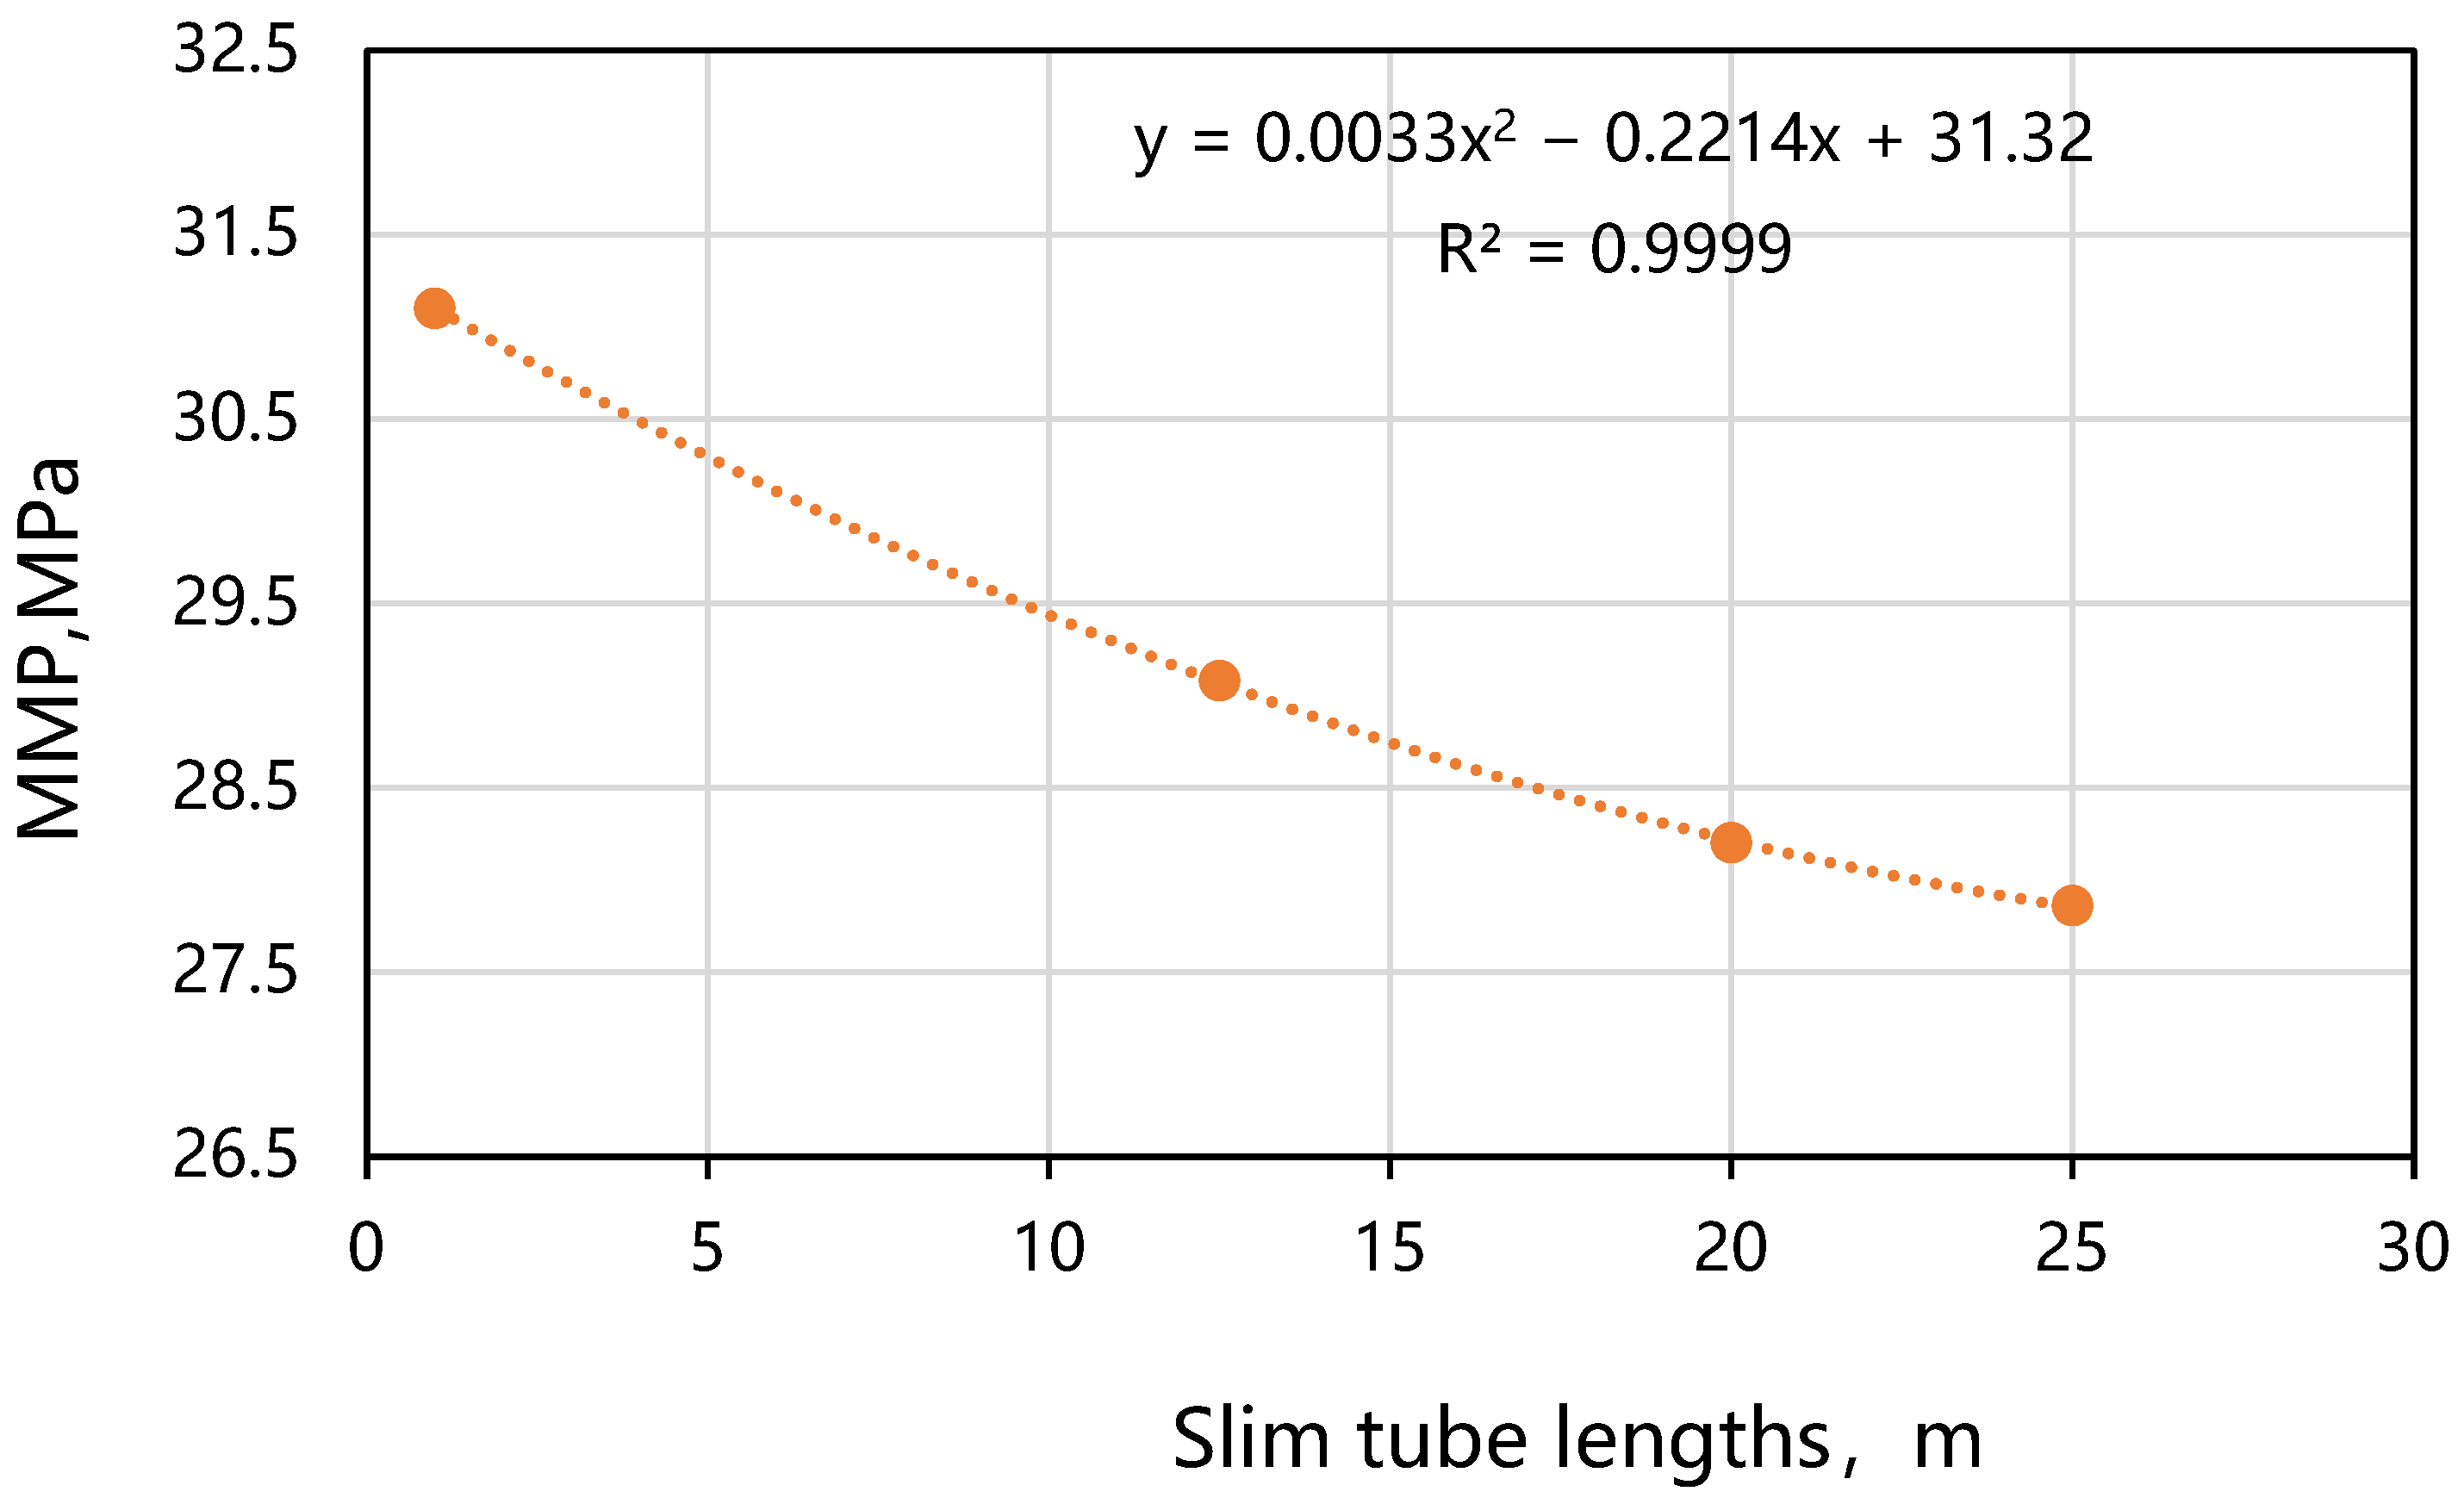
From the CO
2 displacement experiment results using slim tubes of various lengths, it is observed that the MMP for CO
2–crude oil gradually decreases with increasing slim tube length. As depicted in
Figure 12, through linear fitting of the experimental data, an empirical formula relating MMP to slim tube length is obtained: y = 0.0033x
2 − 0.2214x + 31.32, showing a high degree of correlation. This formula provides a reference for estimating the MMP in miscible CO
2 displacement experiments with different slim tube lengths. As shown in
Figure 12, the MMP decreases from 31.1 MPa to 27.86 MPa with increasing slim tube length. This decrease is attributed to the increased gas–liquid contact area with longer tubes, enhancing mass transfer between bubbles and liquid, improving solubility, and thereby reducing the MMP of CO
2-formation oil.
In summary, from the miscible gas injection experiments using slim tubes of different lengths as shown in
Figure 13 and
Table 8, it can be concluded that with a fixed slim tube length, a higher injection pressure results in a higher crude oil recovery factor and later gas breakthrough time. When changing the slim tube length, the MMP gradually decreases with an increase in tube length, and the rate of decrease slows down. Additionally, the crude oil recovery factor improves under different injection pressures. Therefore, the longer the distance between the injection and production wells, the higher the miscible gas injection rate and the greater the crude oil recovery factor. This is because CO
2 has more time to interact with the crude oil as it flows through the reservoir, thus having more opportunities to reduce the miscibility pressure and mix with the crude oil. This effect might be more pronounced in simulated slim tubes, as slim tube forces are more significant at smaller scales. This highlights the importance of fluid physicochemical properties, well spacing, and slim tube effects in enhancing crude oil recovery in reservoirs. These patterns are significant for optimizing CO
2 oil recovery strategies and improving the economic efficiency of oil fields.
3.6. The Mechanism of the Impact of Slim Tube Length on Minimum Miscibility Pressure
The mechanism by which slim tube length affects the MMP of CO2 and formation oil involves several complex factors, primarily as follows:
1. Fluid dynamic effect: The flow of fluids in the thin tube can be described by Navier–Stokes Equations, which consider the effects of friction caused by fluid viscosity on flow. In the thin tube, the fluid dynamic effect is mainly characterized by Reynolds Number. The ratio of Renault is the ratio of inertial force and viscosity, and it is used to determine the flow or turbulence. Increase in the length of the thin tube will increase the length of the fluid flow, which may increase the total friction of the fluid, leading to changes in fluid flow rate and the change of the flow mode. For example, shorter tubes may support higher flow velocity and stratum flow status, and longer thin tubes may cause flow rate reduction and flow mode turbulence, which affects the interaction efficiency between CO
2 and strata oil, then affecting MMP [
8].
2. Interfacial Tension: The changes in the interface tension can be described by the Young–Laplace Equation, which illustrates the relationship between the curved tension and pressure difference. Changes in the length of the tube may affect the interface curvature between CO
2 and stratigraphic oil, which will affect the tension of the interface. Decreasing the tension of the phase interface promotes mixing between the two phases. Therefore, if the increase in the length of the tube is reduced, the tension of the phase interface can be reduced, which may help reduce MMP. On the other hand, if the tension of the phase interface increases, this may inhibit the mixing between the two phases, resulting in the improvement of MMP [
9,
10,
11,
12].
3. Internal Microstructure of the Tube: Microstructures inside fine tubes, such as porosity and pore size distribution, are critical for fluid flow and interactions. Changes in the internal structure of a thin tube can be described by Darcy’s law and permeability concepts, which illustrate the relationship between the flow rate of fluid flow in a porous medium and the driving pressure. An increase in the length of the fine tube may lead to changes in the microstructure in the flow path: for example, an increase in path length may lead to more pore channels participating in the flow, which may improve or hinder the contact and mixing between CO2 and formation oil, which in turn affects MMP.
4. Changes in Mass Transfer Pathways: Mass transfer efficiency is critical for miscible behavior between CO2 and formation oil. An increase in the length of the tube may change the flow characteristics and thus the mass transfer path along the wall of the tube and along the center of the tube. The effect of a change in the length of a thin tube on the mass transfer efficiency can be analyzed by diffusion equations (e.g., Fick’s laws of diffusion), which describe the diffusion process of a substance driven by a concentration gradient. Increased tube length can lead to more complex mass transfer paths and increased mixing resistance, which can affect the rate of material transfer to the interface, which in turn affects MMP.
5. Increased Residence Time: The residence time of fluids in the tube increases with the length of the tube, enhancing the duration of mixing and contact, thereby influencing the MMP.
6. Properties of Formation Oil: The physical and chemical characteristics of formation oil, such as composition and viscosity, are also key factors affecting the minimum miscible pressure. The oil phase with higher viscosity may lead to the blockage of fluid flow, and different compositions may affect the solubility of and interaction with CO
2. The change in the length of the thin tube may affect the flow and distribution of formation oil in the thin tube, and thus affect the miscible pressure [
13].
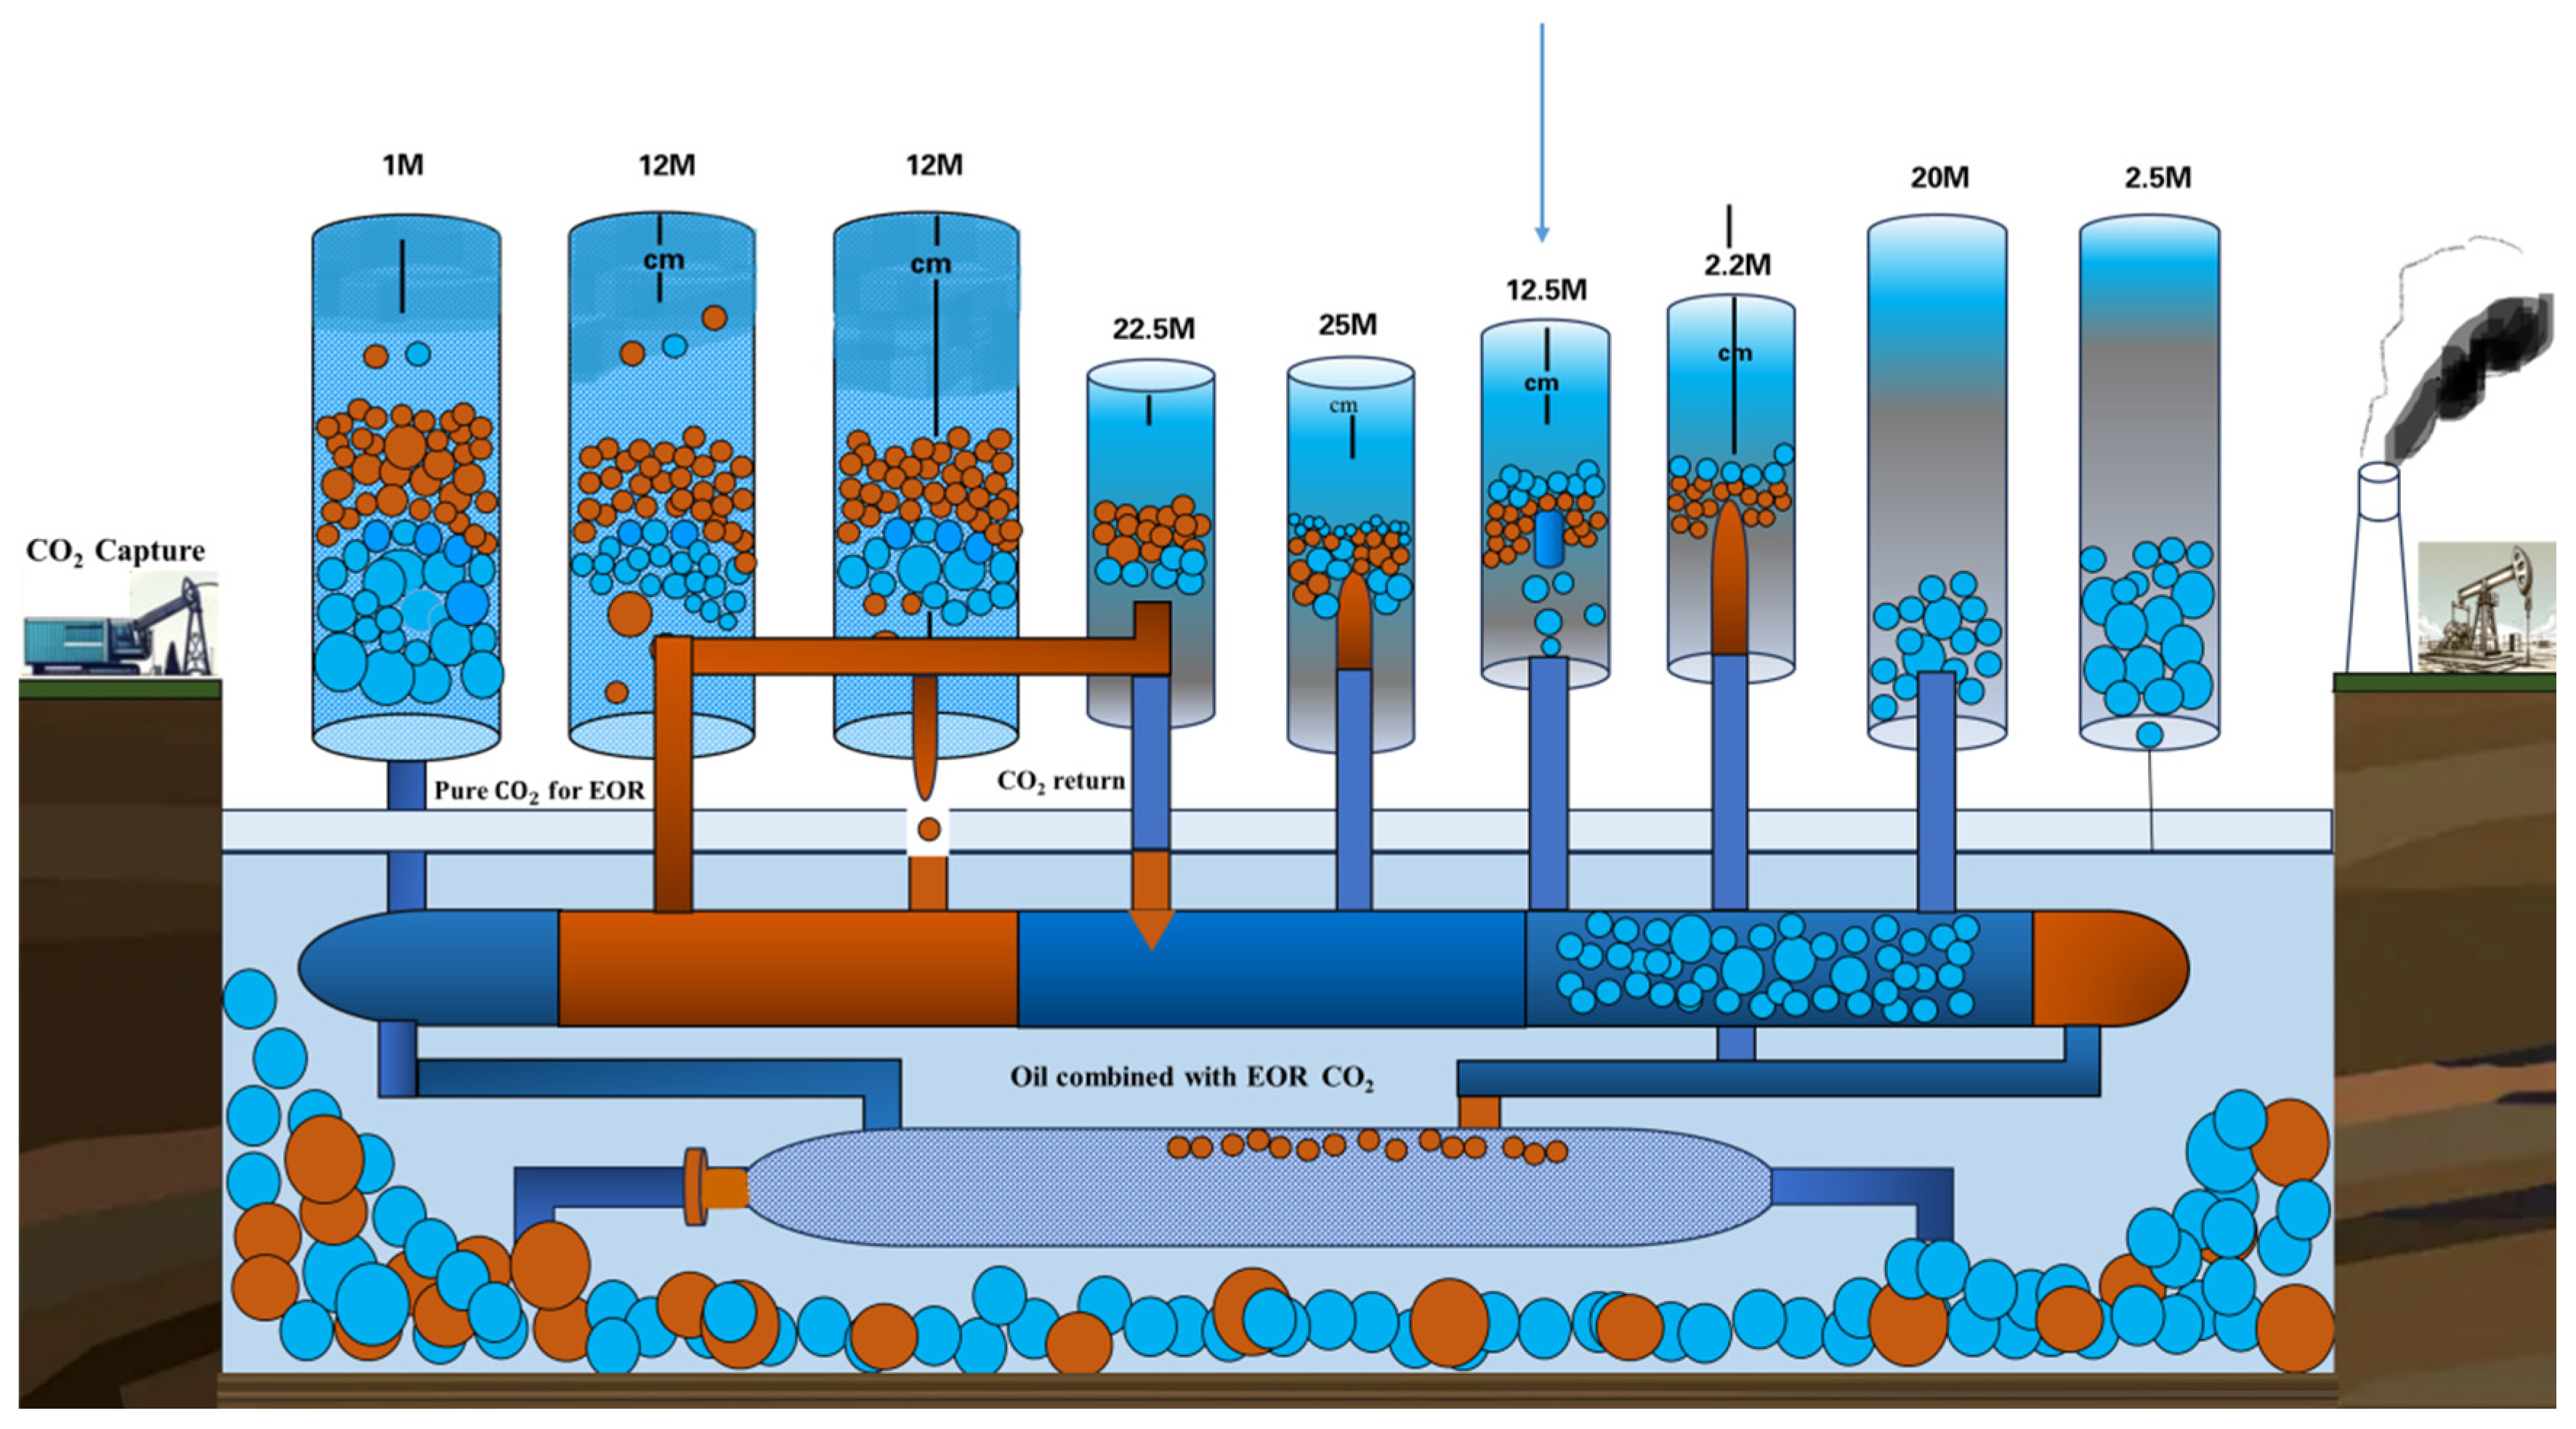
In the slim tube model, the impact of tube length on MMP can be described as follows: Shorter tubes may require higher pressure to achieve miscibility, as the time for complete mixing of CO2 solvent and oil is shorter. Longer tubes allow miscibility at lower pressures due to increased contact time, allowing more complete mixing. To illustrate this concept, two different lengths of slim tubes are depicted, with pressure gradients along each tube, indicating where miscibility is achieved in each case. The illustration shows two slim tubes of different lengths and the position within each tube where miscibility occurs.
Figure 14 illustrates the mechanism by which tube length influences the MMP in CO
2-enhanced oil recovery processes, with a focus on the formation of a miscible zone between CO
2 and crude oil. This visualization captures the evolution of the miscible zone across tubes of varying lengths (1 m, 12.5 m, 20 m, and 25 m), highlighting how CO
2 and crude oil mixing efficiency improves with increased tube length, leading to a reduction in the MMP required for effective oil recovery.
Shorter Tubes: A smaller miscible zone with denser CO2 molecules, indicating higher pressure requirements for achieving miscibility with crude oil. Longer Tubes: An expanding miscible zone where CO2 molecules are more evenly distributed and thoroughly mixed with the oil molecules, symbolizing more efficient miscibility at lower pressures.
This schematic representation serves as an insightful guide into the dynamics of CO2 injection and its interaction with crude oil within the context of underground oil reservoirs, emphasizing the critical role of the miscible zone in enhancing oil recovery efficiency.
In summary, the impact of slim tube length on the MMP is a comprehensive process involving the interaction of multiple factors. A deeper investigation into these mechanisms can provide a theoretical basis for optimizing CO2-enhanced oil recovery (EOR) techniques, as well as offer more effective operational guidance for oilfield development.


